forestcityenterprisesinc 8 copy
TRANSCRIPT

7/29/2019 ForestCityEnterprisesInc 8 Copy
http://slidepdf.com/reader/full/forestcityenterprisesinc-8-copy 1/69
Table of Contents
UNITED STATES
SECURITIES AND EXCHANGE COMMISSIONWashington, D.C. 20549
_____________________________________________________________
Form 10-Q _____________________________________________________________
(Mark One)
QUARTERLY REPORT PURSUANT TO SECTION 13 OR 15 (d) OF THE SECURITIES EXCHANGE
ACT OF 1934
For the quarterly period ended July 31, 2013
¨ TRANSITION REPORT PURSUANT TO SECTION 13 OR 15 (d) OF THE SECURITIES EXCHANGE
ACT OF 1934For the transition period from to
Commission file number 1-4372
_____________________________________________________________
FOREST CITY ENTERPRISES, INC.(Exact name of registrant as specified in its charter)
_____________________________________________________________
Ohio
(State or other jurisdiction of
incorporation or organization)
34-0863886
(I.R.S. Employer
Identification No.)
Terminal Tower
Suite 1100 50 Public Square
Cleveland, Ohio 44113
(Address of principal executive offices) (Zip Code)
216-621-6060
Registrant’s telephone number, including area code
(Former name, former address and former fiscal year, if changed since last report)
_____________________________________________________________
Indicate by check mark whether the registrant (1) has filed all reports required to be filed by Section 13 or 15(d) of the Securities Exchange Act of 1934 during the preceding 12
months (or for such shorter period that the registrant was required to file such reports), and (2) has been subject to such filing requirements for the past 90
days. Yes No ¨
Indicate by check mark whether the registrant has submitted electronically and posted on its corporate Web site, if any, every Interactive Date File required to be submitted and
posted pursuant to Rule 405 of Regulation S-T (§232.405 of this chapter) during the preceding 12 months (or for such shorter period that the registrant was required to
submit and post such files). Yes No ¨
Indicate by check mark whether the registrant is a large accelerated filer, an accelerated filer, a non-accelerated filer, or a smaller reporting company. See the definitions of “large
accelerated filer,” “accelerated filer” and “smaller reporting company” in Rule 12b-2 of the Exchange Act. (Check one):
Large accelerated filer Accelerated filer ¨
Non-accelerated filer ¨ (Do not check if a smaller reporting company) Smaller reporting company ¨
Indicate by checkmark whether the registrant is a shell company (as defined in Rule 12b-2 of the Exchange Act). Yes ¨ No
Indicate the number of shares outstanding, including unvested restricted stock, of each of the issuer’s classes of common stock, as of the latest practicable date.
Class Outstanding at August 30, 2013
Class A Common Stock, $.33 1/3 par value 179,690,820 shares
Class B Common Stock, $.33 1/3 par value 20,194,160 shares

7/29/2019 ForestCityEnterprisesInc 8 Copy
http://slidepdf.com/reader/full/forestcityenterprisesinc-8-copy 2/69
Table of Contents
Forest City Enterprises, Inc. and Subsidiaries
Table of Contents
Page
PART I. FINANCIAL INFORMATION
Item 1. Financial Statements Forest City Enterprises, Inc. and Subsidiaries
Consolidated Balance Sheets as of July 31, 2013 and January 31, 2013 2
Consolidated Statements of Operations for the Three and Six Months Ended July 31, 2013 and 2012 3
Consolidated Statements of Comprehensive Income (Loss) for the Three and Six Months Ended July 31, 2013 and 2012 4
Consolidated Statements of Equity for the Six Months Ended July 31, 2013 and Year Ended January 31, 2013 5
Consolidated Statements of Cash Flows for the Six Months Ended July 31, 2013 and 2012 6
Notes to Consolidated Financial Statements 8
Item 2. Management’s Discussion and Analysis of Financial Condition and Results of Operations 30
Item 3. Quantitative and Qualitative Disclosures about Market Risk 54
Item 4. Controls and Procedures 59
PART II. OTHER INFORMATION
Item 1. Legal Proceedings 59Item 2. Unregistered Sales of Equity Securities and Use of Proceeds 59
Item 6. Exhibits 60
Signatures 61
Certifications
i

7/29/2019 ForestCityEnterprisesInc 8 Copy
http://slidepdf.com/reader/full/forestcityenterprisesinc-8-copy 3/69
Table of Contents
PART I – FINANCIAL INFORMATION
Item 1. Financial StatementsForest City Enterprises, Inc. and Subsidiaries
Consolidated Balance Sheets
(Unaudited)
July 31, 2013
(Unaudited) January 31, 2013 (in thousands)
Assets
Real Estate
Completed rental properties $ 8,719,353 $ 8,631,542
Projects under construction and development 1,397,607 1,326,703
Land held for development and sale 62,427 65,059
Total Real Estate 10,179,387 10,023,304
Less accumulated depreciation (1,748,059) (1,654,632)
Real Estate, net – (variable interest entities $1,363.1 million and $1,416.9 million, respectively) 8,431,328 8,368,672
Cash and equivalents – (variable interest entities $26.0 million and $14.2 million, respectively) 306,943 333,220
Restricted cash and escrowed funds – (variable interest entities $155.3 million and $114.9 million, respectively) 496,968 410,414
Notes and accounts receivable, net 442,947 426,200
Investments in and advances to unconsolidated entities 425,243 456,628
Other assets – (variable interest entities $55.7 million and $92.5 million, respectively) 622,682 614,592
Land held for divestiture 1,990 2,706
Total Assets $ 10,728,101 $ 10,612,432
Liabilities and Equity
Liabilities
Mortgage debt and notes payable, nonrecourse – (variable interest entities $546.3 million and $624.1 million, respectively) $ 5,762,699 $ 5,738,960
Bank revolving credit facility — —
Senior and subordinated debt – (variable interest entities $0 and $29.0 million, respectively) 1,052,511 1,032,969
Accounts payable, accrued expenses and other liabilities – (variable interest entities $82.4 million and $76.2 million, respectively) 960,461 1,093,963
Cash distributions and losses in excess of investments in unconsolidated entities 288,386 292,727
Deferred income taxes 475,002 474,406
Mortgage debt and notes payable, nonrecourse of land held for divestiture — 1,700
Total Liabilities 8,539,059 8,634,725
Redeemable Noncontrolling Interest 231,434 239,136
Commitments and Contingencies — —
Equity
Shareholders’ Equity Preferred stock – 7.0% Series A cumulative perpetual convertible, without par value, $50 liquidation preference; 6,400,000 shares authorized; 0 and 211,038
shares issued and outstanding, respectively — 10,552
Preferred stock – without par value; 13,600,000 shares authorized; no shares issued — —
Common stock – $.33 1/3 par value
Class A, 371,000,000 shares authorized, 178,475,158 and 163,729,240 shares issued and 177,525,166 and 163,722,658 shares outstanding, respectively 59,492 54,576
Class B, convertible, 56,000,000 shares authorized, 20,194,160 and 20,235,273 shares issued and outstanding, respectively; 26,257,961 issuable 6,731 6,745
Total common stock 66,223 61,321
Additional paid-in capital 1,124,163 932,045
Retained earnings 540,451 576,285
Less treasury stock, at cost; 949,992 and 6,582 Class A shares, respectively (16,116) (108)
Shareholders’ equity before accumulated other comprehensive loss 1,714,721 1,580,095
Accumulated other comprehensive loss (86,043) (103,203)
Total Shareholders’ Equity 1,628,678 1,476,892
Noncontrolling interest 328,930 261,679
Total Equity 1,957,608 1,738,571
Total Liabilities and Equity $ 10,728,101 $ 10,612,432
The accompanying notes are an integral part of these consolidated financial statements.
2
7/29/2019 ForestCityEnterprisesInc 8 Copy
http://slidepdf.com/reader/full/forestcityenterprisesinc-8-copy 4/69
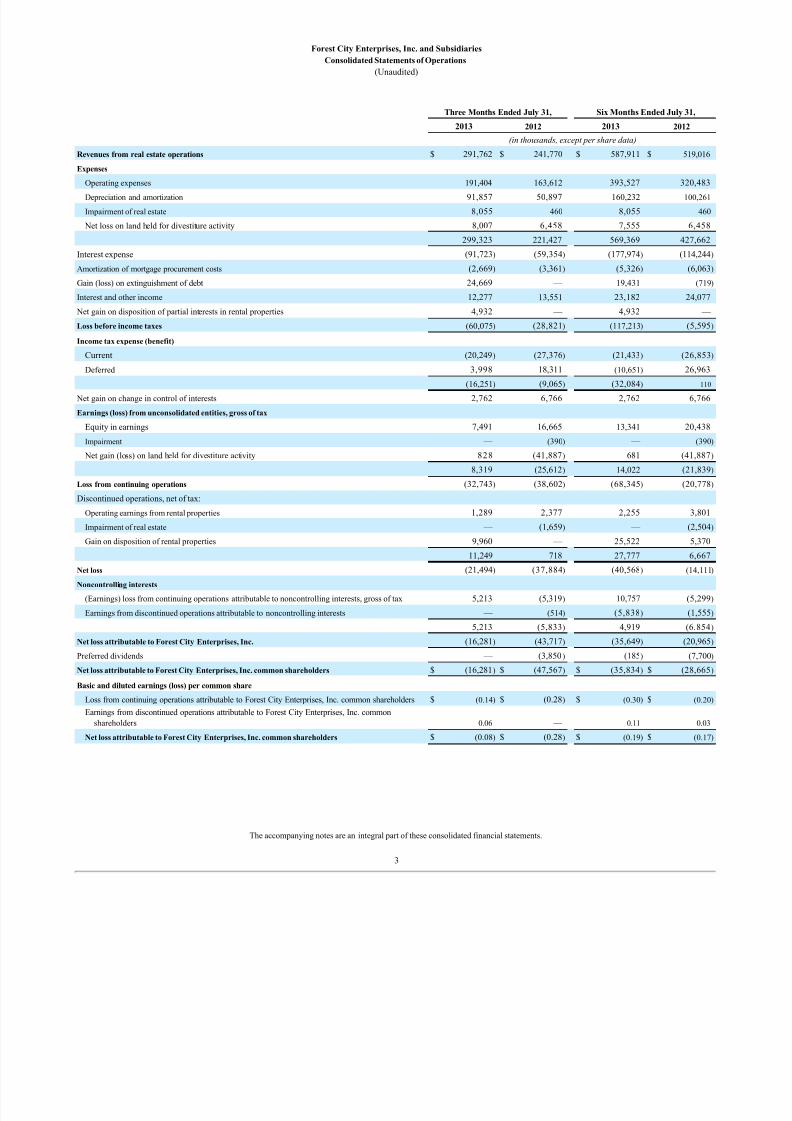
Forest City Enterprises, Inc. and Subsidiaries
Consolidated Statements of Operations
(Unaudited)
Three Months Ended July 31, Six Months Ended July 31,
2013 2012 2013 2012
(in thousands, except per share data)
Revenues from real estate operations $ 291,762 $ 241,770 $ 587,911 $ 519,016
Expenses
Operating expenses 191,404 163,612 393,527 320,483
Depreciation and amortization 91,857 50,897 160,232 100,261
Impairment of real estate 8,055 460 8,055 460
Net loss on land held for divestiture activity 8,007 6,458 7,555 6,458
299,323 221,427 569,369 427,662
Interest expense (91,723) (59,354) (177,974) (114,244)
Amortization of mortgage procurement costs (2,669) (3,361) (5,326) (6,063)
Gain (loss) on extinguishment of debt 24,669 — 19,431 (719)
Interest and other income 12,277 13,551 23,182 24,077
Net gain on disposition of partial interests in rental properties 4,932 — 4,932 —
Loss before income taxes (60,075) (28,821) (117,213) (5,595)
Income tax expense (benefit)
Current (20,249) (27,376) (21,433) (26,853)
Deferred 3,998 18,311 (10,651) 26,963
(16,251) (9,065) (32,084) 110
Net gain on change in control of interests 2,762 6,766 2,762 6,766
Earnings (loss) from unconsolidated entities, gross of tax
Equity in earnings 7,491 16,665 13,341 20,438
Impairment — (390) — (390)
Net gain (loss) on land held for divestiture activity 828 (41,887) 681 (41,887)
8,319 (25,612) 14,022 (21,839)
Loss from continuing operations (32,743) (38,602) (68,345) (20,778)
Discontinued operations, net of tax:
Operating earnings from rental properties 1,289 2,377 2,255 3,801
Impairment of real estate — (1,659) — (2,504)
Gain on disposition of rental properties 9,960 — 25,522 5,370 11,249 718 27,777 6,667
Net loss (21,494) (37,884) (40,568) (14,111)
Noncontrolling interests
(Earnings) loss from continuing operations attributable to noncontrolling interests, gross of tax 5,213 (5,319) 10,757 (5,299)
Earnings from discontinued operations attributable to noncontrolling interests — (514) (5,838) (1,555)
5,213 (5,833) 4,919 (6,854)
Net loss attributable to Forest City Enterprises, Inc. (16,281) (43,717) (35,649) (20,965)
Preferred dividends — (3,850) (185) (7,700)
Net loss attributable to Forest City Enterprises, Inc. common shareholders $ (16,281) $ (47,567) $ (35,834) $ (28,665)
Basic and diluted earnings (loss) per common share
Loss from continuing operations attributable to Forest City Enterprises, Inc. common shareholders $ (0.14) $ (0.28) $ (0.30) $ (0.20)
Earnings from discontinued operations attributable to Forest City Enterprises, Inc. common
shareholders 0.06 — 0.11 0.03Net loss attributable to Forest City Enterprises, Inc. common shareholders $ (0.08) $ (0.28) $ (0.19) $ (0.17)
The accompanying notes are an integral part of these consolidated financial statements.
3

7/29/2019 ForestCityEnterprisesInc 8 Copy
http://slidepdf.com/reader/full/forestcityenterprisesinc-8-copy 5/69
Forest City Enterprises, Inc. and Subsidiaries
Consolidated Statements of Comprehensive Income (Loss)
(Unaudited)
Three Months Ended July 31,
2013 2012
(in thousands)
Net loss $ (21,494) $ (37,884)
Other comprehensive income (loss), net of tax: Unrealized net gains on investment securities (net of tax of $(111) and $(9), respectively) 175 15
Foreign currency translation adjustments (net of tax of $0 and $(534), respectively) — 842
Unrealized net gains (losses) on interest rate derivative contracts (net of tax of $(10,510) and $2,306, respectively) 16,604 (3,699)
Total other comprehensive income (loss), net of tax 16,779 (2,842)
Comprehensive loss (4,715) (40,726)
Comprehensive income (loss) attributable to noncontrolling interest 4,507 (5,781)
Total comprehensive loss attributable to Forest City Enterprises, Inc. $ (208) $ (46,507)
Six Months Ended July 31,
2013 2012
(in thousands)
Net loss $ (40,568) $ (14,111)Other comprehensive income (loss), net of tax:
Unrealized net gains on investment securities (net of tax of $(195) and $(7), respectively) 307 10
Foreign currency translation adjustments (net of tax of $100 and $(623), respectively) (158) 984
Unrealized net gains on interest rate derivative contracts (net of tax of $(10,776) and $(1,480), respectively) 17,029 2,289
Total other comprehensive income, net of tax 17,178 3,283
Comprehensive loss (23,390) (10,828)
Comprehensive income (loss) attributable to noncontrolling interest 4,217 (6,806)
Total comprehensive loss attributable to Forest City Enterprises, Inc. $ (19,173) $ (17,634)
The accompanying notes are an integral part of these consolidated financial statements.
4
7/29/2019 ForestCityEnterprisesInc 8 Copy
http://slidepdf.com/reader/full/forestcityenterprisesinc-8-copy 6/69
Table of Contents
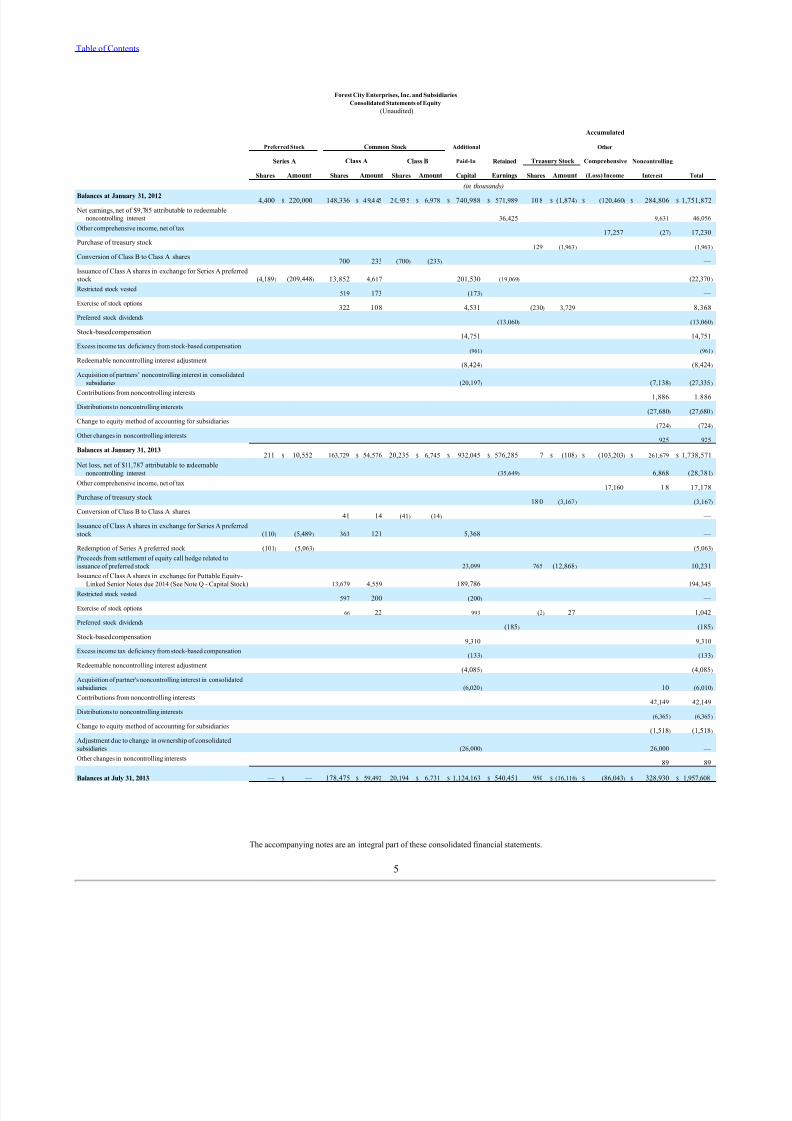
Forest City Enterprises, Inc. and Subsidiaries
Consolidated Statements of Equity
(Unaudited)
Accumulated
Preferred Stock Common Stock Additional Other
Series A Class A Class B Paid-In Retained Treasury Stock Comprehensive Noncontrolling
Shares Amount Shares Amount Shares Amount Capital Earnings Shares Amount (Loss) Income Interest Total
(in thousands)
Balances at January 31, 20124,400 $ 220,000 148,336 $ 49,445 20,935 $ 6,978 $ 740,988 $ 571,989 108 $ (1,874) $ (120,460) $ 284,806 $ 1,751,872
Net earnings, net of $9,785 attributable to redeemablenoncontrolling interest 36,425 9,631 46,056
Other comprehensive income, net of tax 17,257 (27) 17,230
Purchase of treasury stock 129 (1,963) (1,963)
Conversion of Class B to Class A shares 700 233 (700) (233) —
Issuance of Class A shares in exchange for Series A preferredstock (4,189) (209,448) 13,852 4,617 201,530 (19,069) (22,370)
Restricted stock vested 519 173 (173) —
Exercise of stock options 322 108 4,531 (230) 3,729 8,368
Preferred stock dividends (13,060) (13,060)
Stock-based compensation 14,751 14,751
Excess income tax deficiency from stock-based compensation (961) (961)
Redeemable noncontrolling interest adjustment (8,424) (8,424)
Acquisition of partners’ noncontrolling interest in consolidated
subsidiaries (20,197) (7,138) (27,335)
Contributions from noncontrolling interests 1,886 1,886
Distributions to noncontrolling interests (27,680) (27,680)
Change to equity method of accounting for subsidiaries (724) (724)
Other changes in noncontrolling interests 925 925
Balances at January 31, 2013211 $ 10,552 163,729 $ 54,576 20,235 $ 6,745 $ 932,045 $ 576,285 7 $ (108) $ (103,203) $ 261,679 $ 1,738,571
Net loss, net of $11,787 attributable to redeemablenoncontrolling interest (35,649) 6,868 (28,781)
Other comprehensive income, net of tax 17,160 18 17,178
Purchase of treasury stock 180 (3,167) (3,167)
Conversion of Class B to Class A shares 41 14 (41) (14) —
Issuance of Class A shares in exchange for Series A preferredstock (110) (5,489) 363 121 5,368 —
Redemption of Series A preferred stock (101) (5,063) (5,063)
Proceeds from settlement of equity call hedge related to
issuance of preferred stock 23,099 765 (12,868) 10,231
Issuance of Class A shares in exchange for Puttable Equity-Linked Senior Notes due 2014 (See Note Q - Capital Stock) 13,679 4,559 189,786 194,345
Restricted stock vested 597 200 (200) —
Exercise of stock options 66 22 993 (2) 27 1,042
Preferred stock dividends (185) (185)
Stock-based compensation 9,310 9,310
Excess income tax deficiency from stock-based compensation (133) (133)
Redeemable noncontrolling interest adjustment (4,085) (4,085)
Acquisition of partner's noncontrolling interest in consolidated
subsidiaries (6,020) 10 (6,010)
Contributions from noncontrolling interests 42,149 42,149
Distributions to noncontrolling interests (6,365) (6,365)
Change to equity method of accounting for subsidiaries (1,518) (1,518)
Adjustment due to change in ownership of consolidatedsubsidiaries (26,000) 26,000 —
Other changes in noncontrolling interests 89 89
Balances at July 31, 2013 — $ — 178,475 $ 59,492 20,194 $ 6,731 $ 1,124,163 $ 540,451 950 $ (16,116) $ (86,043) $ 328,930 $ 1,957,608
The accompanying notes are an integral part of these consolidated financial statements.
5

7/29/2019 ForestCityEnterprisesInc 8 Copy
http://slidepdf.com/reader/full/forestcityenterprisesinc-8-copy 7/69
Forest City Enterprises, Inc. and Subsidiaires
Consolidated Statements of Cash Flows
(Unaudited)
Six Months Ended July 31,
2013 2012
(in thousands)
Net loss $ (40,568) $ (14,111)
Depreciation and amortization 160,232 100,261
Amortization of mortgage procurement costs 5,326 6,063
Impairment of real estate 8,055 460Impairment of unconsolidated entities — 390
Write-offs of abandoned development projects 777 13,659
(Gain) loss on extinguishment of debt (19,431) 719
Net loss on land held for divestiture activity 7,555 6,458
Net gain on disposition of partial interests in rental properties (4,932) —
Net gain on change in control of interests (2,762) (6,766)
Deferred income tax expense (benefit) (10,651) 26,963
Equity in earnings (13,341) (20,438)
Net (gain) loss on land held for divestiture activity of unconsolidated entities (681) 41,887
Stock-based compensation expense 6,135 5,208
Amortization and mark-to-market adjustments of derivative instruments 11,989 (5,262)
Non-cash interest expense related to Senior Notes 220 186
Cash distributions from operations of unconsolidated entities 29,580 30,119
Discontinued operations: Depreciation and amortization 1,987 6,994
Amortization of mortgage procurement costs 50 492
Loss on extinguishment of debt 40 —
Impairment of real estate — 4,090
Deferred income tax expense (benefit) 242 (4,070)
Gain on disposition of rental properties (43,103) (8,879)
Cost of sales of land included in projects under construction and development and completed rental properties 6,222 2,875
Decrease (increase) in land held for development and sale 309 (1,811)
Decrease in land held for divestiture 26 33,479
(Increase) decrease in notes and accounts receivable (5,782) 11,355
Decrease in other assets 5,096 2,235
Decrease in accounts payable, accrued expenses and other liabilities (42,551) (14,743)
Net cash provided by operating activities 60,039 217,813
Cash Flows from Investing Activities Capital expenditures (242,091) (442,098)
Payment of lease procurement costs (4,763) (5,886)
Increase in other assets (18,505) (19,140)
(Increase) decrease in restricted cash and escrowed funds used for investing purposes (11,029) 187,297
Proceeds from disposition of rental properties 81,841 8,896
Decrease (increase) in investments in and advances to unconsolidated entities 21,966 (11,992)
Net cash used in investing activities (172,581) (282,923)
Cash Flows from Financing Activities
Proceeds from nonrecourse mortgage debt and notes payable 89,054 461,579
Principal payments on nonrecourse mortgage debt and notes payable (183,107) (329,184)
Borrowings on bank revolving credit facility 225,950 75,000
Payments on bank revolving credit facility (225,950) (75,000)
Proceeds from issuance of Convertible Senior Notes due 2020, net of $8,750 of issuance costs 291,250 —
Make-whole premium and inducements related to exchange of Senior Notes due 2014 for Class A common stock (5,490) —
Transaction costs related to exchange of Senior Notes due 2014 for Class A common stock (2,300) —
Redemption of Senior Notes due 2015 (53,253) —
Deferred financing costs (6,996) (7,471)
Increase in restricted cash and escrowed funds used for financing purposes (75,525) (8,208)
Purchase of treasury stock (3,167) (1,591)
Exercise of stock options 1,042 13
Redemption of Series A preferred stock (5,063) —
Proceeds from equity call hedge related to the issuance of Series A preferred stock 10,231 —
Dividends paid to preferred shareholders (185) (7,700)
Contributions from noncontrolling interests 42,149 240
Distributions to noncontrolling interests (6,365) (19,188)
Acquisitions of noncontrolling interests (6,010) —
Net cash provided by financing activities 86,265 88,490
Net (decrease) increase in cash and equivalents (26,277) 23,380

7/29/2019 ForestCityEnterprisesInc 8 Copy
http://slidepdf.com/reader/full/forestcityenterprisesinc-8-copy 8/69
Cash and equivalents at beginning of period 333,220 217,486
Cash and equivalents at end of period $ 306,943 $ 240,866
The accompanying notes are an integral part of these consolidated financial statements.
6
7/29/2019 ForestCityEnterprisesInc 8 Copy
http://slidepdf.com/reader/full/forestcityenterprisesinc-8-copy 9/69
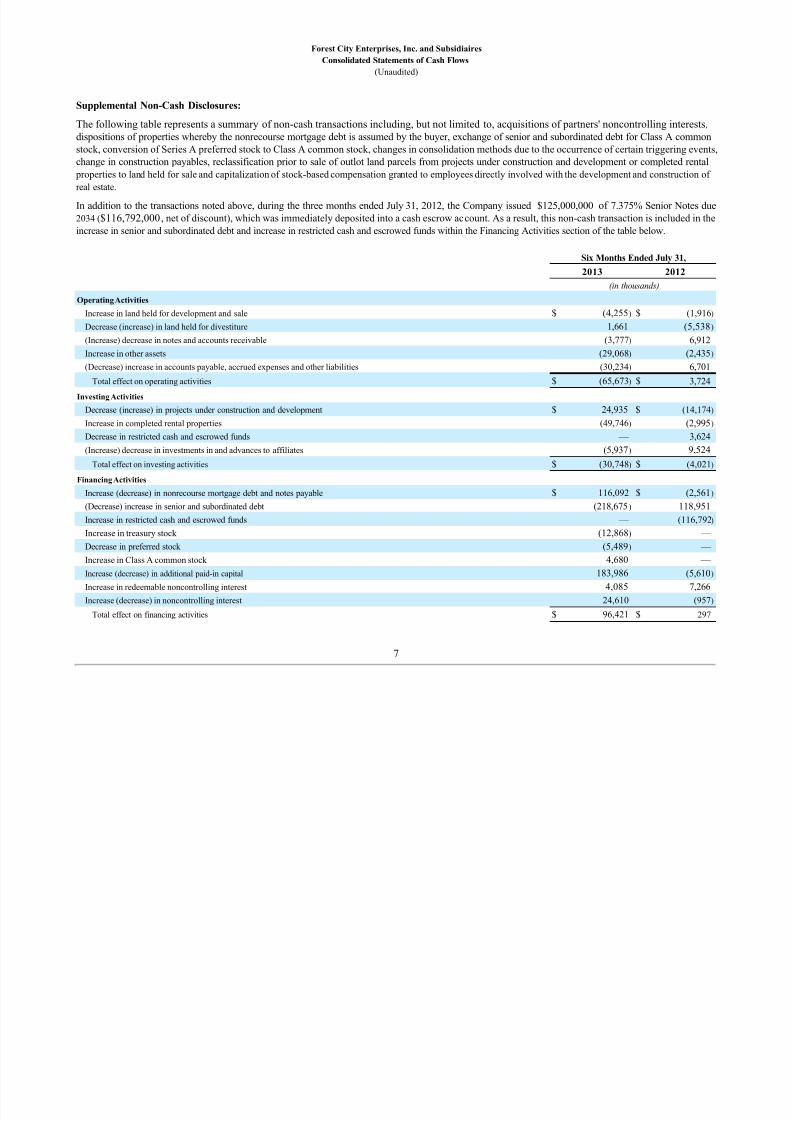
Forest City Enterprises, Inc. and Subsidiaires
Consolidated Statements of Cash Flows
(Unaudited)
Supplemental Non-Cash Disclosures:
The following table represents a summary of non-cash transactions including, but not limited to, acquisitions of partners' noncontrolling interests,dispositions of properties whereby the nonrecourse mortgage debt is assumed by the buyer, exchange of senior and subordinated debt for Class A common
stock, conversion of Series A preferred stock to Class A common stock, changes in consolidation methods due to the occurrence of certain triggering events,
change in construction payables, reclassification prior to sale of outlot land parcels from projects under construction and development or completed rental
properties to land held for sale and capitalization of stock-based compensation granted to employees directly involved with the development and construction of
real estate.
In addition to the transactions noted above, during the three months ended July 31, 2012, the Company issued $125,000,000 of 7.375% Senior Notes due
2034 ($116,792,000, net of discount), which was immediately deposited into a cash escrow account. As a result, this non-cash transaction is included in the
increase in senior and subordinated debt and increase in restricted cash and escrowed funds within the Financing Activities section of the table below.
Six Months Ended July 31,
2013 2012
(in thousands)
Operating Activities
Increase in land held for development and sale $ (4,255) $ (1,916)
Decrease (increase) in land held for divestiture 1,661 (5,538)
(Increase) decrease in notes and accounts receivable (3,777) 6,912
Increase in other assets (29,068) (2,435)
(Decrease) increase in accounts payable, accrued expenses and other liabilities (30,234) 6,701
Total effect on operating activities $ (65,673) $ 3,724
Investing Activities
Decrease (increase) in projects under construction and development $ 24,935 $ (14,174)
Increase in completed rental properties (49,746) (2,995)
Decrease in restricted cash and escrowed funds — 3,624
(Increase) decrease in investments in and advances to affiliates (5,937) 9,524
Total effect on investing activities $ (30,748) $ (4,021)
Financing Activities
Increase (decrease) in nonrecourse mortgage debt and notes payable $ 116,092 $ (2,561)
(Decrease) increase in senior and subordinated debt (218,675) 118,951
Increase in restricted cash and escrowed funds — (116,792)
Increase in treasury stock (12,868) —
Decrease in preferred stock (5,489) — Increase in Class A common stock 4,680 —
Increase (decrease) in additional paid-in capital 183,986 (5,610)
Increase in redeemable noncontrolling interest 4,085 7,266
Increase (decrease) in noncontrolling interest 24,610 (957)
Total effect on financing activities $ 96,421 $ 297
7
7/29/2019 ForestCityEnterprisesInc 8 Copy
http://slidepdf.com/reader/full/forestcityenterprisesinc-8-copy 10/69
Table of Contents
Forest City Enterprises, Inc. and Subsidiaries
Notes to Consolidated Financial Statements
(Unaudited)
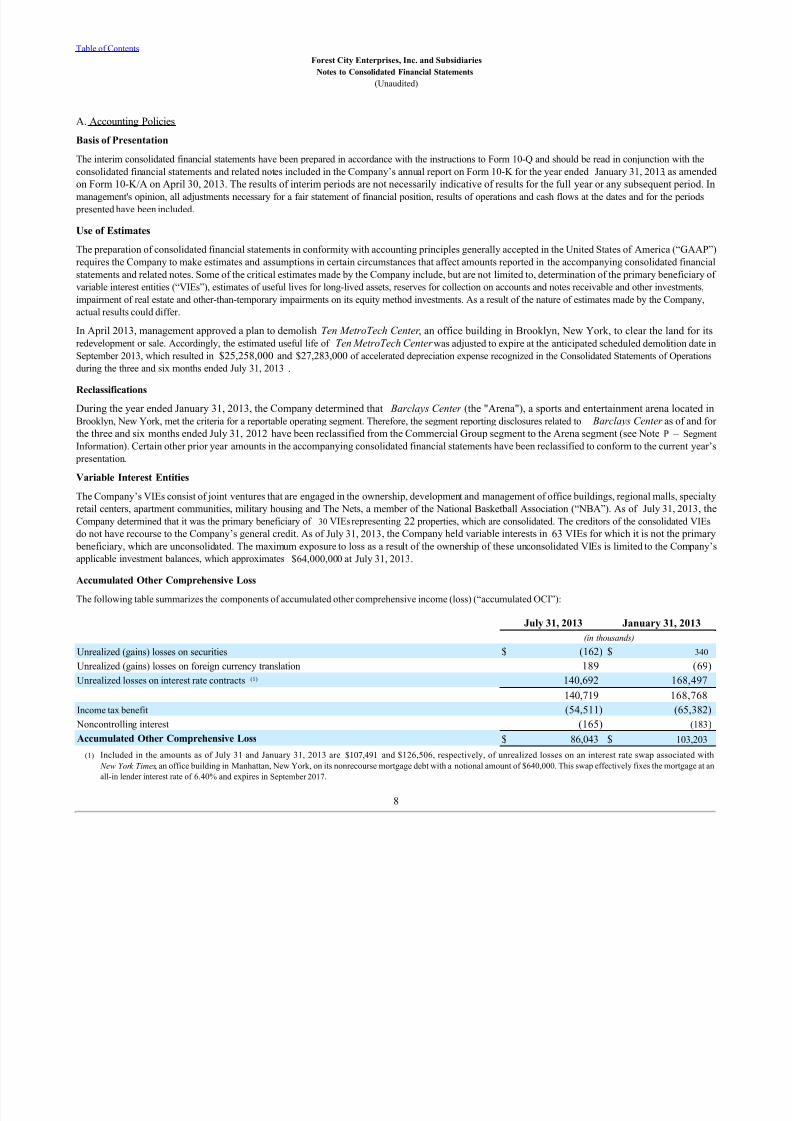
A. Accounting Policies
Basis of Presentation
The interim consolidated financial statements have been prepared in accordance with the instructions to Form 10-Q and should be read in conjunction with the
consolidated financial statements and related notes included in the Company’s annual report on Form 10-K for the year ended January 31, 2013, as amended
on Form 10-K/A on April 30, 2013. The results of interim periods are not necessarily indicative of results for the full year or any subsequent period. Inmanagement's opinion, all adjustments necessary for a fair statement of financial position, results of operations and cash flows at the dates and for the periods
presented have been included.
Use of Estimates
The preparation of consolidated financial statements in conformity with accounting principles generally accepted in the United States of America (“GAAP”)
requires the Company to make estimates and assumptions in certain circumstances that affect amounts reported in the accompanying consolidated financial
statements and related notes. Some of the critical estimates made by the Company include, but are not limited to, determination of the primary beneficiary of
variable interest entities (“VIEs”), estimates of useful lives for long-lived assets, reserves for collection on accounts and notes receivable and other investments,
impairment of real estate and other-than-temporary impairments on its equity method investments. As a result of the nature of estimates made by the Company,
actual results could differ.
In April 2013, management approved a plan to demolish Ten MetroTech Center , an office building in Brooklyn, New York, to clear the land for itsredevelopment or sale. Accordingly, the estimated useful life of Ten MetroTech Center was adjusted to expire at the anticipated scheduled demolition date in
September 2013, which resulted in $25,258,000 and $27,283,000 of accelerated depreciation expense recognized in the Consolidated Statements of Operations
during the three and six months ended July 31, 2013 .
Reclassifications
During the year ended January 31, 2013, the Company determined that Barclays Center (the "Arena"), a sports and entertainment arena located inBrooklyn, New York, met the criteria for a reportable operating segment. Therefore, the segment reporting disclosures related to Barclays Center as of and for
the three and six months ended July 31, 2012 have been reclassified from the Commercial Group segment to the Arena segment (see Note P – Segmen
Information). Certain other prior year amounts in the accompanying consolidated financial statements have been reclassified to conform to the current year’s
presentation.
Variable Interest Entities
The Company’s VIEs consist of joint ventures that are engaged in the ownership, development and management of office buildings, regional malls, specialty
retail centers, apartment communities, military housing and The Nets, a member of the National Basketball Association (“NBA”). As of July 31, 2013, theCompany determined that it was the primary beneficiary of 30 VIEs representing 22 properties, which are consolidated. The creditors of the consolidated VIEs
do not have recourse to the Company’s general credit. As of July 31, 2013, the Company held variable interests in 63 VIEs for which it is not the primary
beneficiary, which are unconsolidated. The maximum exposure to loss as a result of the ownership of these unconsolidated VIEs is limited to the Company’sapplicable investment balances, which approximates $64,000,000 at July 31, 2013.
Accumulated Other Comprehensive Loss
The following table summarizes the components of accumulated other comprehensive income (loss) (“accumulated OCI”):
July 31, 2013 January 31, 2013
(in thousands)
Unrealized (gains) losses on securities $ (162) $ 340
Unrealized (gains) losses on foreign currency translation 189 (69)
Unrealized losses on interest rate contracts (1) 140,692 168,497
140,719 168,768
Income tax benefit (54,511) (65,382)
Noncontrolling interest (165) (183)Accumulated Other Comprehensive Loss $ 86,043 $ 103,203
(1) Included in the amounts as of July 31 and January 31, 2013 are $107,491 and $126,506, respectively, of unrealized losses on an interest rate swap associated with
New York Times, an office building in Manhattan, New York, on its nonrecourse mortgage debt with a notional amount of $640,000. This swap effectively fixes the mortgage at an
all-in lender interest rate of 6.40% and expires in September 2017.
8
7/29/2019 ForestCityEnterprisesInc 8 Copy
http://slidepdf.com/reader/full/forestcityenterprisesinc-8-copy 11/69
Table of Contents
Forest City Enterprises, Inc. and Subsidiaries
Notes to Consolidated Financial Statements
(Unaudited)
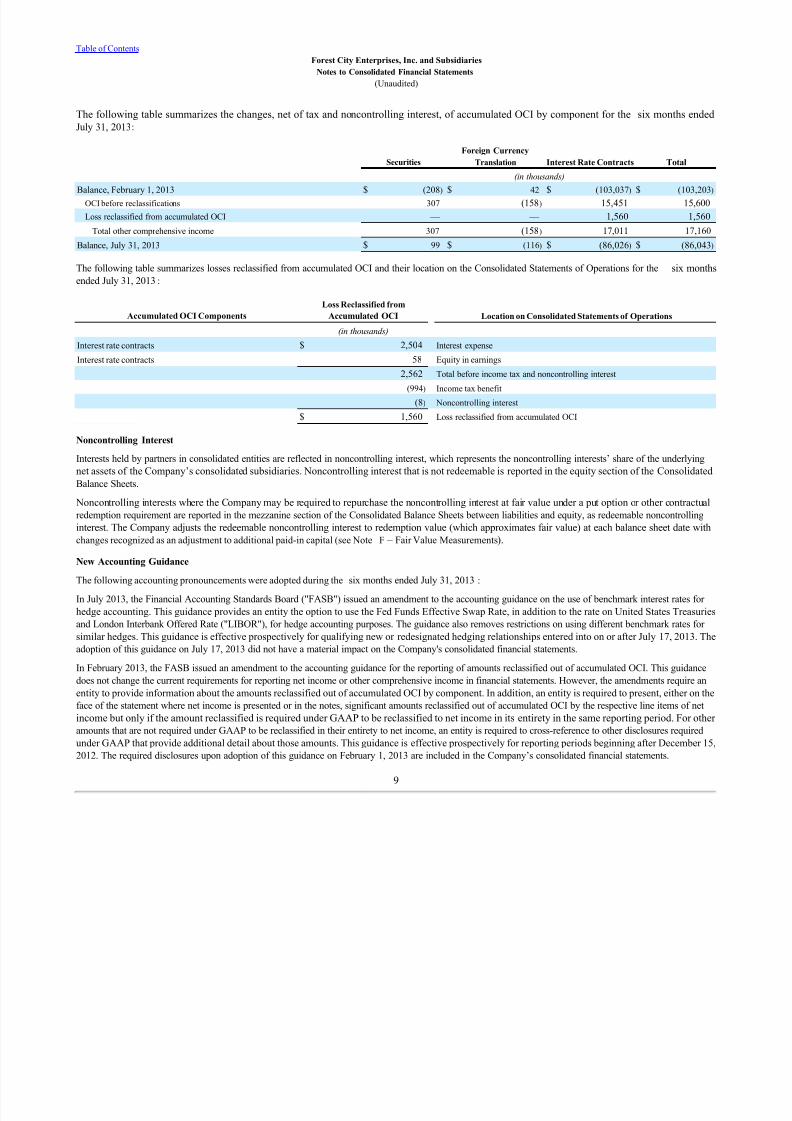
The following table summarizes the changes, net of tax and noncontrolling interest, of accumulated OCI by component for the six months endedJuly 31, 2013:
Securities
Foreign Currency
Translation Interest Rate Contracts Total
(in thousands)
Balance, February 1, 2013 $ (208) $ 42 $ (103,037) $ (103,203)
OCI before reclassifications 307 (158) 15,451 15,600
Loss reclassified from accumulated OCI — — 1,560 1,560
Total other comprehensive income 307 (158) 17,011 17,160
Balance, July 31, 2013 $ 99 $ (116) $ (86,026) $ (86,043)
The following table summarizes losses reclassified from accumulated OCI and their location on the Consolidated Statements of Operations for the six months
ended July 31, 2013:
Accumulated OCI Components
Loss Reclassified from
Accumulated OCI Location on Consolidated Statements of Operations
(in thousands)
Interest rate contracts $ 2,504 Interest expense
Interest rate contracts 58 Equity in earnings 2,562 Total before income tax and noncontrolling interest
(994) Income tax benefit
(8) Noncontrolling interest
$ 1,560 Loss reclassified from accumulated OCI
Noncontrolling Interest
Interests held by partners in consolidated entities are reflected in noncontrolling interest, which represents the noncontrolling interests’ share of the underlying
net assets of the Company’s consolidated subsidiaries. Noncontrolling interest that is not redeemable is reported in the equity section of the Consolidated
Balance Sheets.
Noncontrolling interests where the Company may be required to repurchase the noncontrolling interest at fair value under a put option or other contractual
redemption requirement are reported in the mezzanine section of the Consolidated Balance Sheets between liabilities and equity, as redeemable noncontrolling
interest. The Company adjusts the redeemable noncontrolling interest to redemption value (which approximates fair value) at each balance sheet date with
changes recognized as an adjustment to additional paid-in capital (see Note F – Fair Value Measurements).New Accounting Guidance
The following accounting pronouncements were adopted during the six months ended July 31, 2013 :
In July 2013, the Financial Accounting Standards Board ("FASB") issued an amendment to the accounting guidance on the use of benchmark interest rates for
hedge accounting. This guidance provides an entity the option to use the Fed Funds Effective Swap Rate, in addition to the rate on United States Treasuries
and London Interbank Offered Rate ("LIBOR"), for hedge accounting purposes. The guidance also removes restrictions on using different benchmark rates for
similar hedges. This guidance is effective prospectively for qualifying new or redesignated hedging relationships entered into on or after July 17, 2013. The
adoption of this guidance on July 17, 2013 did not have a material impact on the Company's consolidated financial statements.
In February 2013, the FASB issued an amendment to the accounting guidance for the reporting of amounts reclassified out of accumulated OCI. This guidance
does not change the current requirements for reporting net income or other comprehensive income in financial statements. However, the amendments require an
entity to provide information about the amounts reclassified out of accumulated OCI by component. In addition, an entity is required to present, either on the
face of the statement where net income is presented or in the notes, significant amounts reclassified out of accumulated OCI by the respective line items of net
income but only if the amount reclassified is required under GAAP to be reclassified to net income in its entirety in the same reporting period. For other amounts that are not required under GAAP to be reclassified in their entirety to net income, an entity is required to cross-reference to other disclosures required
under GAAP that provide additional detail about those amounts. This guidance is effective prospectively for reporting periods beginning after December 15,
2012. The required disclosures upon adoption of this guidance on February 1, 2013 are included in the Company’s consolidated financial statements.
9

7/29/2019 ForestCityEnterprisesInc 8 Copy
http://slidepdf.com/reader/full/forestcityenterprisesinc-8-copy 12/69
Table of Contents
Forest City Enterprises, Inc. and Subsidiaries
Notes to Consolidated Financial Statements
(Unaudited)
In July 2012, the FASB issued an amendment to the accounting guidance on testing indefinite-lived intangible assets for impairment. This guidance provides
an entity the option to first assess qualitative factors to determine whether the existence of events and circumstances indicates that it is more likely than not that
the indefinite-lived intangible asset is impaired. If an entity concludes that it is not more likely than not that the asset is impaired, then the entity is not required
to take further action. If an entity concludes otherwise, it is required to determine the fair value of the indefinite-lived intangible asset and perform thequantitative test by comparing the fair value with the carrying amount. This guidance is effective for annual and interim impairment tests performed for fiscal
years beginning after September 15, 2012. The adoption of this guidance on February 1, 2013 did not have a material impact on the Company’s consolidatedfinancial statements.
In December 2011, the FASB issued an amendment to the accounting guidance on derecognition of in substance real estate. This guidance specifies that when
a parent company (reporting entity) ceases to have a controlling financial interest (as described in the accounting guidance on consolidation) in a subsidiary
that is in substance real estate as a result of a default on the subsidiary’s nonrecourse debt, the reporting entity should apply the guidance on property, plant
and equipment to determine whether it should derecognize the in substance real estate. Generally, a reporting entity would not satisfy the requirements to
derecognize the in substance real estate before the legal transfer of the real estate to the lender and the extinguishment of the related nonrecourse indebtedness.
This guidance is effective for fiscal years and interim reporting periods within those years, beginning on or after June 15, 2012. The adoption of this guidance
on February 1, 2013 did not impact the Company’s consolidated financial statements or their comparability to previously issued financial statements as the
guidance in this amendment is consistent with the Company's previous accounting policies.
In December 2011, the FASB issued an amendment to the accounting guidance that requires entities to disclose both gross and net information on financial
instruments and transactions eligible for offset on the balance sheets and financial instruments and transactions subject to an agreement similar to a master
netting arrangement. In January 2013, the FASB issued guidance clarifying that the scope of disclosures about offsetting assets and liabilities should apply
only to derivatives and hedging instruments. This guidance is effective for annual and interim reporting periods beginning on or after January 1, 2013. The
adoption of this guidance on February 1, 2013 did not have a material impact on the Company’s consolidated financial statements.
The following new accounting pronouncement will be adopted on its respective required effective date:
In July 2013, the FASB issued an amendment to the accounting guidance on the presentation of an unrecognized tax benefit when a net operating losscarryforward, a similar tax loss, or tax credit carryforward exists. This guidance, which clarifies whether the unrecognized tax benefit should be recorded as a
liability or reduction of the related deferred tax asset, is effective for fiscal years and interim reporting periods within those years, beginning after December
15, 2013. The amendments should be applied prospectively to all unrecognized tax benefits that exist at the effective date. Retrospective application is permitted. The Company does not expect the adoption of this guidance to have a material impact on the Company's consolidated financial statements.
B. Mortgage Debt and Notes Payable, Nonrecourse
The following table summarizes the mortgage debt and notes payable, nonrecourse maturities, as of July 31, 2013:
Fiscal Years Ending January 31,
Total
Maturities
(in thousands)
2014 $ 579,133
2015 1,018,782
2016 487,247
2017 365,948
2018 1,192,940
Thereafter 2,118,649
Total $ 5,762,699
10
7/29/2019 ForestCityEnterprisesInc 8 Copy
http://slidepdf.com/reader/full/forestcityenterprisesinc-8-copy 13/69
Table of Contents
Forest City Enterprises, Inc. and Subsidiaries
Notes to Consolidated Financial Statements
(Unaudited)
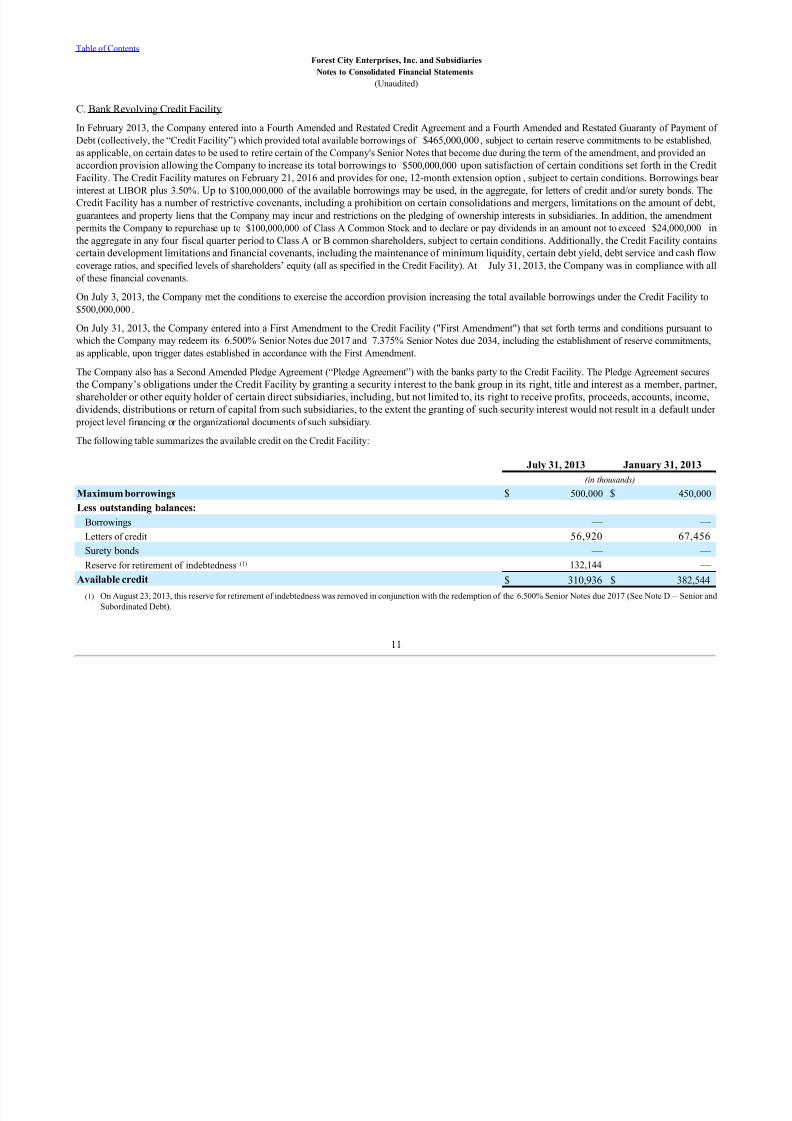
C. Bank Revolving Credit Facility
In February 2013, the Company entered into a Fourth Amended and Restated Credit Agreement and a Fourth Amended and Restated Guaranty of Payment of
Debt (collectively, the “Credit Facility”) which provided total available borrowings of $465,000,000, subject to certain reserve commitments to be established,
as applicable, on certain dates to be used to retire certain of the Company's Senior Notes that become due during the term of the amendment, and provided an
accordion provision allowing the Company to increase its total borrowings to $500,000,000 upon satisfaction of certain conditions set forth in the Credit
Facility. The Credit Facility matures on February 21, 2016 and provides for one, 12-month extension option , subject to certain conditions. Borrowings bearinterest at LIBOR plus 3.50%. Up to $100,000,000 of the available borrowings may be used, in the aggregate, for letters of credit and/or surety bonds. The
Credit Facility has a number of restrictive covenants, including a prohibition on certain consolidations and mergers, limitations on the amount of debt,
guarantees and property liens that the Company may incur and restrictions on the pledging of ownership interests in subsidiaries. In addition, the amendment
permits the Company to repurchase up to $100,000,000 of Class A Common Stock and to declare or pay dividends in an amount not to exceed $24,000,000 inthe aggregate in any four fiscal quarter period to Class A or B common shareholders, subject to certain conditions. Additionally, the Credit Facility contains
certain development limitations and financial covenants, including the maintenance of minimum liquidity, certain debt yield, debt service and cash flowcoverage ratios, and specified levels of shareholders’ equity (all as specified in the Credit Facility). At July 31, 2013, the Company was in compliance with all
of these financial covenants.
On July 3, 2013, the Company met the conditions to exercise the accordion provision increasing the total available borrowings under the Credit Facility to
$500,000,000.
On July 31, 2013, the Company entered into a First Amendment to the Credit Facility ("First Amendment") that set forth terms and conditions pursuant towhich the Company may redeem its 6.500% Senior Notes due 2017 and 7.375% Senior Notes due 2034, including the establishment of reserve commitments,
as applicable, upon trigger dates established in accordance with the First Amendment.
The Company also has a Second Amended Pledge Agreement (“Pledge Agreement”) with the banks party to the Credit Facility. The Pledge Agreement secures
the Company’s obligations under the Credit Facility by granting a security interest to the bank group in its right, title and interest as a member, partner,shareholder or other equity holder of certain direct subsidiaries, including, but not limited to, its right to receive profits, proceeds, accounts, income,dividends, distributions or return of capital from such subsidiaries, to the extent the granting of such security interest would not result in a default under
project level financing or the organizational documents of such subsidiary.
The following table summarizes the available credit on the Credit Facility:
July 31, 2013 January 31, 2013
(in thousands)
Maximum borrowings $ 500,000 $ 450,000
Less outstanding balances:
Borrowings — —
Letters of credit 56,920 67,456
Surety bonds — —
Reserve for retirement of indebtedness (1) 132,144 —
Available credit $ 310,936 $ 382,544
(1) On August 23, 2013, this reserve for retirement of indebtedness was removed in conjunction with the redemption of the 6.500% Senior Notes due 2017 (See Note D – Senior and
Subordinated Debt).
11
7/29/2019 ForestCityEnterprisesInc 8 Copy
http://slidepdf.com/reader/full/forestcityenterprisesinc-8-copy 14/69
Table of Contents
Forest City Enterprises, Inc. and Subsidiaries
Notes to Consolidated Financial Statements
(Unaudited)
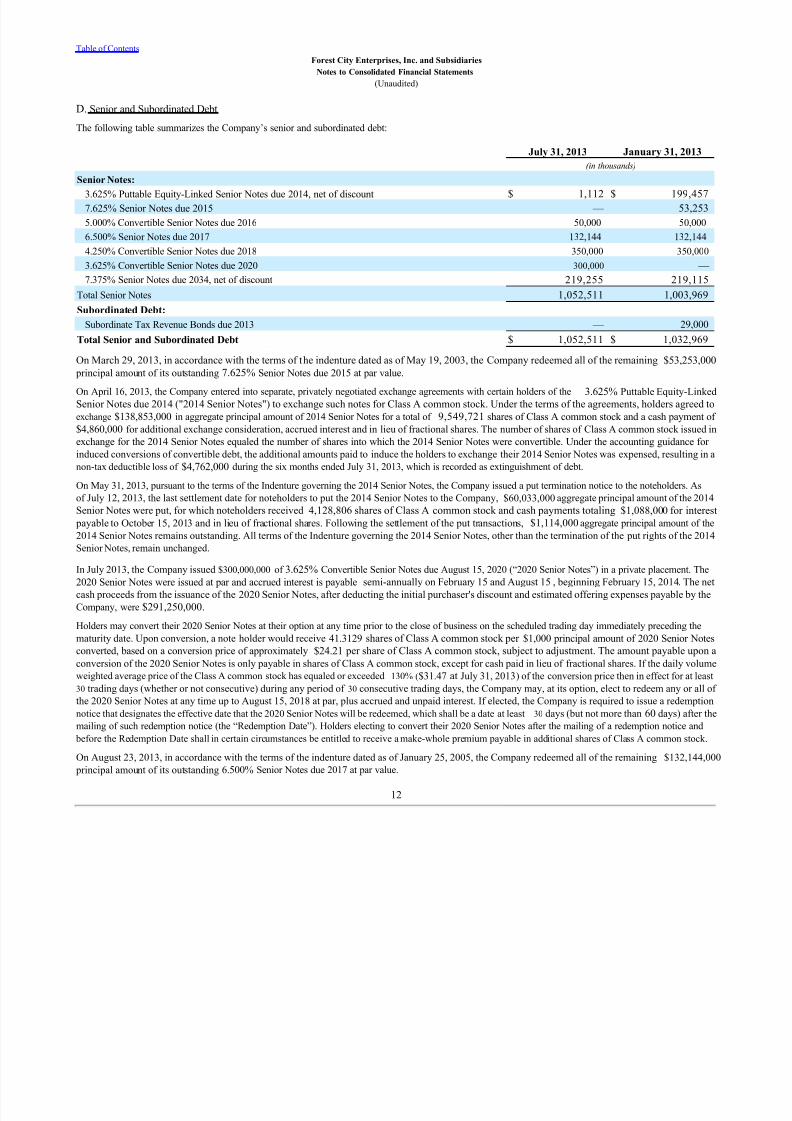
D. Senior and Subordinated Debt
The following table summarizes the Company’s senior and subordinated debt:
July 31, 2013 January 31, 2013
(in thousands)
Senior Notes: 3.625% Puttable Equity-Linked Senior Notes due 2014, net of discount $ 1,112 $ 199,457
7.625% Senior Notes due 2015 — 53,253
5.000% Convertible Senior Notes due 2016 50,000 50,000
6.500% Senior Notes due 2017 132,144 132,144
4.250% Convertible Senior Notes due 2018 350,000 350,000
3.625% Convertible Senior Notes due 2020 300,000 —
7.375% Senior Notes due 2034, net of discount 219,255 219,115
Total Senior Notes 1,052,511 1,003,969
Subordinated Debt:
Subordinate Tax Revenue Bonds due 2013 — 29,000
Total Senior and Subordinated Debt $ 1,052,511 $ 1,032,969
On March 29, 2013, in accordance with the terms of the indenture dated as of May 19, 2003, the Company redeemed all of the remaining $53,253,000 principal amount of its outstanding 7.625% Senior Notes due 2015 at par value.
On April 16, 2013, the Company entered into separate, privately negotiated exchange agreements with certain holders of the 3.625% Puttable Equity-Linked
Senior Notes due 2014 ("2014 Senior Notes") to exchange such notes for Class A common stock. Under the terms of the agreements, holders agreed toexchange $138,853,000 in aggregate principal amount of 2014 Senior Notes for a total of 9,549,721 shares of Class A common stock and a cash payment of
$4,860,000 for additional exchange consideration, accrued interest and in lieu of fractional shares. The number of shares of Class A common stock issued in
exchange for the 2014 Senior Notes equaled the number of shares into which the 2014 Senior Notes were convertible. Under the accounting guidance for
induced conversions of convertible debt, the additional amounts paid to induce the holders to exchange their 2014 Senior Notes was expensed, resulting in a
non-tax deductible loss of $4,762,000 during the six months ended July 31, 2013, which is recorded as extinguishment of debt.
On May 31, 2013, pursuant to the terms of the Indenture governing the 2014 Senior Notes, the Company issued a put termination notice to the noteholders. As
of July 12, 2013, the last settlement date for noteholders to put the 2014 Senior Notes to the Company, $60,033,000 aggregate principal amount of the 2014
Senior Notes were put, for which noteholders received 4,128,806 shares of Class A common stock and cash payments totaling $1,088,000 for interest
payable to October 15, 2013 and in lieu of fractional shares. Following the settlement of the put transactions, $1,114,000 aggregate principal amount of the
2014 Senior Notes remains outstanding. All terms of the Indenture governing the 2014 Senior Notes, other than the termination of the put rights of the 2014
Senior Notes, remain unchanged.
In July 2013, the Company issued $300,000,000 of 3.625% Convertible Senior Notes due August 15, 2020 (“2020 Senior Notes”) in a private placement. The
2020 Senior Notes were issued at par and accrued interest is payable semi-annually on February 15 and August 15 , beginning February 15, 2014. The net
cash proceeds from the issuance of the 2020 Senior Notes, after deducting the initial purchaser's discount and estimated offering expenses payable by the
Company, were $291,250,000.
Holders may convert their 2020 Senior Notes at their option at any time prior to the close of business on the scheduled trading day immediately preceding the
maturity date. Upon conversion, a note holder would receive 41.3129 shares of Class A common stock per $1,000 principal amount of 2020 Senior Notes
converted, based on a conversion price of approximately $24.21 per share of Class A common stock, subject to adjustment. The amount payable upon a
conversion of the 2020 Senior Notes is only payable in shares of Class A common stock, except for cash paid in lieu of fractional shares. If the daily volume
weighted average price of the Class A common stock has equaled or exceeded 130% ($31.47 at July 31, 2013) of the conversion price then in effect for at least
30 trading days (whether or not consecutive) during any period of 30 consecutive trading days, the Company may, at its option, elect to redeem any or all of
the 2020 Senior Notes at any time up to August 15, 2018 at par, plus accrued and unpaid interest. If elected, the Company is required to issue a redemption
notice that designates the effective date that the 2020 Senior Notes will be redeemed, which shall be a date at least 30 days (but not more than 60 days) after the
mailing of such redemption notice (the “Redemption Date”). Holders electing to convert their 2020 Senior Notes after the mailing of a redemption notice and before the Redemption Date shall in certain circumstances be entitled to receive a make-whole premium payable in additional shares of Class A common stock.
On August 23, 2013, in accordance with the terms of the indenture dated as of January 25, 2005, the Company redeemed all of the remaining $132,144,000
principal amount of its outstanding 6.500% Senior Notes due 2017 at par value.
12
7/29/2019 ForestCityEnterprisesInc 8 Copy
http://slidepdf.com/reader/full/forestcityenterprisesinc-8-copy 15/69
Table of Contents
Forest City Enterprises, Inc. and Subsidiaries
Notes to Consolidated Financial Statements
(Unaudited)
All of the Company’s senior notes are unsecured senior obligations and rank equally with all existing and future unsecured indebtedness; however, they are
effectively subordinated to all existing and future secured indebtedness and other liabilities of the Company’s subsidiaries to the extent of the value of the
collateral securing such other debt, including the Credit Facility. The indentures governing the senior notes contain covenants providing, among other things,
limitations on incurring additional debt and payment of dividends. At July 31, 2013, the Company was in compliance with these financial covenants.
E. Derivative Instruments and Hedging ActivitiesRisk Management Objective of Using Derivatives
The Company maintains an overall interest rate risk management strategy that incorporates the use of derivative instruments to minimize significantunplanned impact on earnings and cash flows that may be caused by interest rate volatility. The Company’s strategy includes the use of interest rate swaps
and option contracts that have indices related to the pricing of specific balance sheet liabilities. The Company enters into interest rate swaps to convert certain
floating-rate debt to fixed-rate long-term debt, and vice-versa, depending on market conditions, or forward starting swaps to hedge the changes in benchmark
interest rates on forecasted financings. The Company enters into interest rate swap agreements for hedging purposes for periods that are generally one to ten
years. Option products utilized include interest rate caps, floors and Treasury options. The use of these option products is consistent with the Company’s risk
management objective to reduce or eliminate exposure to variability in future cash flows primarily attributable to changes in benchmark rates relating to
forecasted financings, and the variability in cash flows attributable to increases relating to interest payments on its floating-rate debt. The caps and floors have
typical durations ranging from one to three years while the Treasury options are for periods of five to ten years . The Company does not have any forwardstarting swaps or Treasury options outstanding at July 31, 2013.
Cash Flow Hedges of Interest Rate Risk
The Company’s objectives in using interest rate derivatives are to add stability to interest expense and to manage exposure to interest rate movements. The
Company primarily uses interest rate caps and swaps as part of its interest rate risk management strategy. Interest rate caps designated as cash flow hedges
involve the receipt of variable-rate amounts from a counterparty if interest rates rise above the strike rate on the contract in exchange for an upfront premium.
Interest rate swaps designated as cash flow hedges involve the receipt of variable-rate amounts from a counterparty in exchange for the Company making fixed-
rate payments over the life of the agreements without exchange of the underlying notional amount.
The effective portion of changes in the fair value of derivatives designated and qualifying as cash flow hedges is recorded in accumulated OCI and issubsequently reclassified into earnings in the period that the hedged forecasted transaction affects earnings. The ineffective portion of the change in fair value
of the derivatives is recognized directly in earnings. During both the three and six months ended July 31, 2013, the Company recorded $597,000 as anincrease to interest expense related to ineffectiveness arising from the early termination of an interest rate swap. The swap was terminated because the hedged
debt was paid off early as a result of an asset sale. The amount of ineffectiveness charged to earnings was insignificant for the three and six months ended
July 31, 2012. As of July 31, 2013, the Company expects that within the next twelve months it will reclassify amounts recorded in accumulated OCI into
earnings as an increase in interest expense of approximately $25,643,000, net of tax. However, the actual amount reclassified could vary due to future changes
in fair value of these derivatives.
Fair Value Hedges of Interest Rate Risk
From time to time, the Company and/or certain of its joint ventures (the “Joint Ventures”) enter into total rate of return swaps (“TRS”) on various tax-exempt
fixed-rate borrowings. The TRS convert these borrowings from a fixed rate to a variable rate. In exchange for a fixed rate, the TRS require the Company and/or
the Joint Ventures to pay a variable rate, generally equivalent to the Securities Industry and Financial Markets Association ("SIFMA") rate plus a spread. At
July 31, 2013, the SIFMA rate was 0.05%. Additionally, the Company and/or the Joint Ventures have guaranteed the fair value of the underlying borrowings
Fluctuation in the value of the TRS is offset by the fluctuation in the value of the underlying borrowings, resulting in minimal financial impact. AtJuly 31, 2013, the aggregate notional amount of TRS that are designated as fair value hedging instruments is $285,845,000. The underlying TRS borrowings
are subject to a fair value adjustment (see Note F – Fair Value Measurements).
Nondesignated Hedges of Interest Rate Risk
The Company entered into derivative contracts that are intended to economically hedge certain interest rate risk, even though the contracts do not qualify for or
the Company has elected not to apply hedge accounting. In situations in which hedge accounting is discontinued, or not elected, and the derivative remains
outstanding, the Company records the derivative at its fair value and recognizes changes in the fair value in the Consolidated Statements of Operations.
13

7/29/2019 ForestCityEnterprisesInc 8 Copy
http://slidepdf.com/reader/full/forestcityenterprisesinc-8-copy 16/69
Table of Contents
Forest City Enterprises, Inc. and Subsidiaries
Notes to Consolidated Financial Statements
(Unaudited)
In instances where the Company enters into separate derivative instruments effectively hedging the same debt for consecutive annual periods, the amount of
notional is excluded from the following disclosure in an effort to provide information that enables the financial statement user to understand the Company’s
volume of derivative activity. The following table presents the fair values and location in the Consolidated Balance Sheets of all derivative instruments:
Fair Value of Derivative Instruments
July 31, 2013
Asset Derivatives
(included in Other Assets)
Liability Derivatives
(included in Accounts Payable, Accrued Expenses and
Other Liabilities)
Current
Notional Fair Value Current
Notional Fair Value
(in thousands)
Derivatives Designated as Hedging Instruments
Interest rate caps $ — $ — $ — $ —
Interest rate swap agreements — — 1,151,054 108,228
TRS 18,970 903 266,875 9,627
Total $ 18,970 $ 903 $ 1,417,929 $ 117,855
Derivatives Not Designated as Hedging Instruments
Interest rate caps $ 477,674 $ 15 $ — $ —
Interest rate swap agreements — — — —
TRS 140,800 13,888 39,521 18,320
Total $ 618,474 $ 13,903 $ 39,521 $ 18,320
January 31, 2013
(in thousands)
Derivatives Designated as Hedging Instruments
Interest rate caps $ — $ — $ — $ —
Interest rate swap agreements — — 1,019,920 129,522
TRS 28,000 965 238,395 10,915
Total $ 28,000 $ 965 $ 1,258,315 $ 140,437
Derivatives Not Designated as Hedging Instruments
Interest rate caps $ 479,085 $ 7 $ — $ —
Interest rate swap agreements 18,877 241 — —
TRS 140,800 20,101 39,562 15,287
Total $ 638,762 $ 20,349 $ 39,562 $ 15,287
14
7/29/2019 ForestCityEnterprisesInc 8 Copy
http://slidepdf.com/reader/full/forestcityenterprisesinc-8-copy 17/69
Table of Contents
Forest City Enterprises, Inc. and Subsidiaries
Notes to Consolidated Financial Statements
(Unaudited)
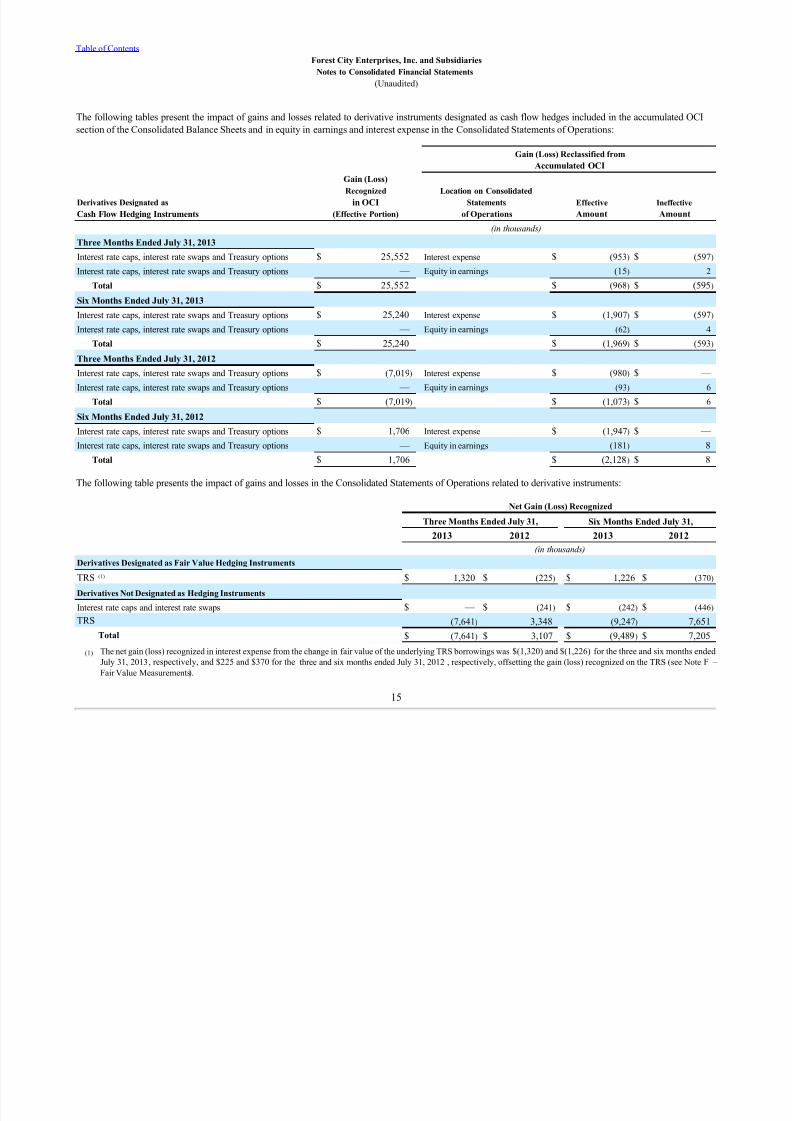
The following tables present the impact of gains and losses related to derivative instruments designated as cash flow hedges included in the accumulated OCI
section of the Consolidated Balance Sheets and in equity in earnings and interest expense in the Consolidated Statements of Operations:
Gain (Loss) Reclassified from
Accumulated OCI
Derivatives Designated as
Cash Flow Hedging Instruments
Gain (Loss)Recognized
in OCI
(Effective Portion)
Location on Consolidated
Statements
of Operations
Effective
Amount
Ineffective
Amount
(in thousands)
Three Months Ended July 31, 2013
Interest rate caps, interest rate swaps and Treasury options $ 25,552 Interest expense $ (953) $ (597)
Interest rate caps, interest rate swaps and Treasury options — Equity in earnings (15) 2
Total $ 25,552 $ (968) $ (595)
Six Months Ended July 31, 2013
Interest rate caps, interest rate swaps and Treasury options $ 25,240 Interest expense $ (1,907) $ (597)
Interest rate caps, interest rate swaps and Treasury options — Equity in earnings (62) 4
Total $ 25,240 $ (1,969) $ (593)
Three Months Ended July 31, 2012 Interest rate caps, interest rate swaps and Treasury options $ (7,019) Interest expense $ (980) $ —
Interest rate caps, interest rate swaps and Treasury options — Equity in earnings (93) 6
Total $ (7,019) $ (1,073) $ 6
Six Months Ended July 31, 2012
Interest rate caps, interest rate swaps and Treasury options $ 1,706 Interest expense $ (1,947) $ —
Interest rate caps, interest rate swaps and Treasury options — Equity in earnings (181) 8
Total $ 1,706 $ (2,128) $ 8
The following table presents the impact of gains and losses in the Consolidated Statements of Operations related to derivative instruments:
Net Gain (Loss) Recognized
Three Months Ended July 31, Six Months Ended July 31,
2013 2012 2013 2012
(in thousands)
Derivatives Designated as Fair Value Hedging Instruments
TRS (1) $ 1,320 $ (225) $ 1,226 $ (370)
Derivatives Not Designated as Hedging Instruments
Interest rate caps and interest rate swaps $ — $ (241) $ (242) $ (446)
TRS (7,641) 3,348 (9,247) 7,651
Total $ (7,641) $ 3,107 $ (9,489) $ 7,205
(1) The net gain (loss) recognized in interest expense from the change in fair value of the underlying TRS borrowings was $(1,320) and $(1,226) for the three and six months ended
July 31, 2013, respectively, and $225 and $370 for the three and six months ended July 31, 2012 , respectively, offsetting the gain (loss) recognized on the TRS (see Note F –
Fair Value Measurements).
15

7/29/2019 ForestCityEnterprisesInc 8 Copy
http://slidepdf.com/reader/full/forestcityenterprisesinc-8-copy 18/69
Table of Contents
Forest City Enterprises, Inc. and Subsidiaries
Notes to Consolidated Financial Statements
(Unaudited)
Credit-risk-related Contingent Features
The principal credit risk to the Company through its interest rate risk management strategy is the potential inability of the financial institution from which the
derivative financial instruments were purchased to cover its obligations. If a counterparty fails to fulfill its obligation under a derivative contract, theCompany’s risk of loss approximates the fair value of the derivative. To mitigate this exposure, the Company generally purchases its derivative financial
instruments from the financial institution that issues the related debt, from financial institutions with which the Company has other lending relationships, or
from financial institutions with a minimum credit rating of AA at the time the Company enters into the transaction.
The Company has agreements with its derivative counterparties that contain a provision under which the derivative counterparty could terminate the derivative
obligations if the Company defaults on its obligations under the Credit Facility and designated conditions are fulfilled. In instances where the Company’s
subsidiaries have derivative obligations that are secured by a mortgage, the derivative obligations could be terminated if the indebtedness between the two
parties is terminated, either by loan payoff or default of the indebtedness. In addition, the Company has certain derivative contracts which provide that if the
Company’s credit rating falls below certain levels, it may trigger additional collateral to be posted with the counterparty up to the full amount of the liability
position of the derivative contracts. Also, certain subsidiaries have agreements that contain provisions whereby the subsidiaries must maintain certainminimum financial ratios.
As of July 31, 2013, the aggregate fair value of all derivative instruments in a liability position, prior to the adjustment for nonperformance risk of $9,818,000, is $145,993,000. The Company had posted collateral consisting primarily of cash and notes receivable of $115,730,000 related to all derivative
instruments. If all credit risk contingent features underlying these agreements had been triggered on July 31, 2013, the Company would have been required to
post collateral of the full amount of the liability position.
F. Fair Value Measurements
The Company’s financial assets and liabilities subject to fair value measurements are interest rate caps, interest rate swap agreements, TRS and borrowings
subject to TRS (see Note E – Derivative Instruments and Hedging Activities ). The Company’s impairment of real estate and unconsolidated entities is also
subject to fair value measurements (see Note L – Impairment of Real Estate, Impairment of Unconsolidated Entities and Write-Off of Abandoned Development
Projects and Note N – Discontinued Operations and Gain on Disposition of Rental Properties ).
Items Measured at Fair Value on a Recurring Basis
The Company’s financial assets consist of interest rate caps, interest rate swap agreements and TRS with positive fair values that are included in other assets.
The Company’s financial liabilities consist of interest rate swap agreements and TRS with negative fair values that are included in accounts payable, accrued
expenses and other liabilities and borrowings subject to TRS included in mortgage debt and notes payable, nonrecourse. The Company records the redeemable
noncontrolling interest related to Brooklyn Arena, LLC at redemption value, which approximates fair value.
16
7/29/2019 ForestCityEnterprisesInc 8 Copy
http://slidepdf.com/reader/full/forestcityenterprisesinc-8-copy 19/69
Table of Contents
Forest City Enterprises, Inc. and Subsidiaries
Notes to Consolidated Financial Statements
(Unaudited)
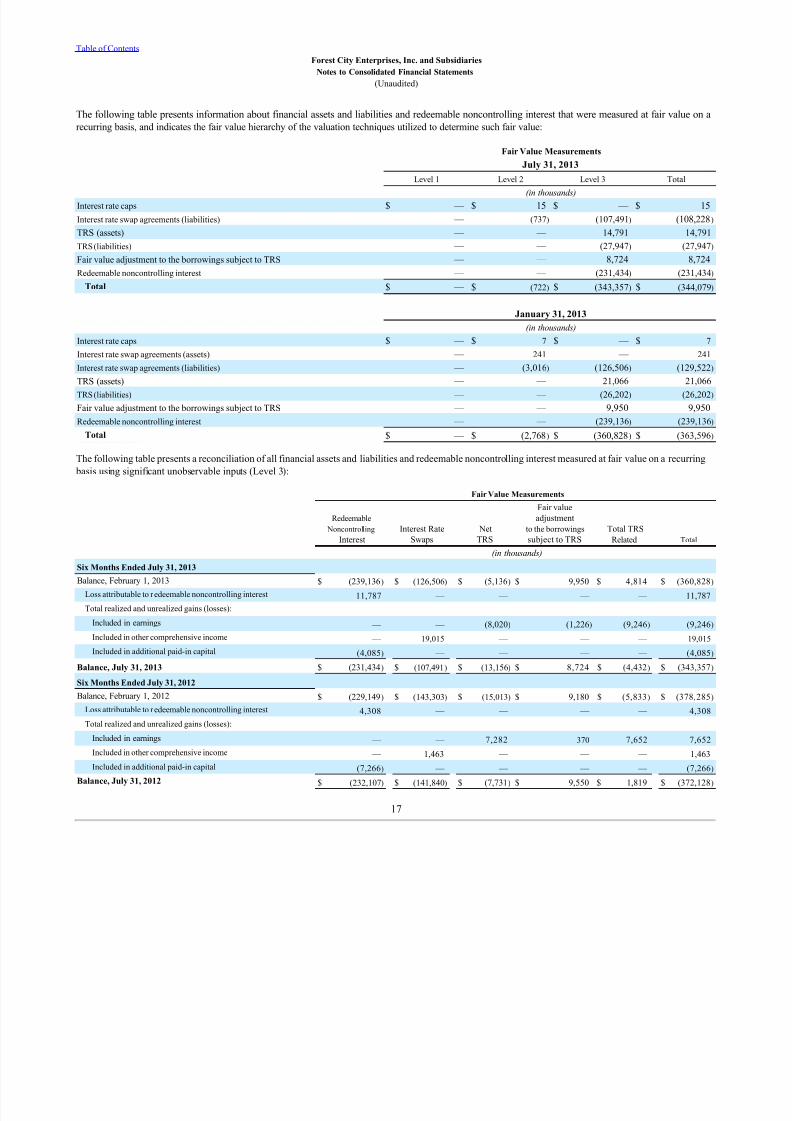
The following table presents information about financial assets and liabilities and redeemable noncontrolling interest that were measured at fair value on a
recurring basis, and indicates the fair value hierarchy of the valuation techniques utilized to determine such fair value:
Fair Value Measurements
July 31, 2013
Level 1 Level 2 Level 3 Total (in thousands)
Interest rate caps $ — $ 15 $ — $ 15
Interest rate swap agreements (liabilities) — (737) (107,491) (108,228)
TRS (assets) — — 14,791 14,791
TRS (liabilities) — — (27,947) (27,947)
Fair value adjustment to the borrowings subject to TRS — — 8,724 8,724
Redeemable noncontrolling interest — — (231,434) (231,434)
Total $ — $ (722) $ (343,357) $ (344,079)
January 31, 2013
(in thousands)
Interest rate caps $ — $ 7 $ — $ 7
Interest rate swap agreements (assets) — 241 — 241
Interest rate swap agreements (liabilities) — (3,016) (126,506) (129,522)
TRS (assets) — — 21,066 21,066
TRS (liabilities) — — (26,202) (26,202)
Fair value adjustment to the borrowings subject to TRS — — 9,950 9,950
Redeemable noncontrolling interest — — (239,136) (239,136)
Total $ — $ (2,768) $ (360,828) $ (363,596)
The following table presents a reconciliation of all financial assets and liabilities and redeemable noncontrolling interest measured at fair value on a recurring
basis using significant unobservable inputs (Level 3):
Fair Value Measurements
Redeemable
Noncontrolling
Interest
Interest Rate
Swaps
Net
TRS
Fair value
adjustment
to the borrowings
subject to TRS
Total TRS
Related
Total
(in thousands)
Six Months Ended July 31, 2013
Balance, February 1, 2013 $ (239,136) $ (126,506) $ (5,136) $ 9,950 $ 4,814 $ (360,828)
Loss attributable to redeemable noncontrolling interest 11,787 — — — — 11,787
Total realized and unrealized gains (losses): Included in earnings — — (8,020) (1,226) (9,246) (9,246)
Included in other comprehensive income — 19,015 — — — 19,015
Included in additional paid-in capital (4,085) — — — — (4,085)
Balance, July 31, 2013 $ (231,434) $ (107,491) $ (13,156) $ 8,724 $ (4,432) $ (343,357)
Six Months Ended July 31, 2012
Balance, February 1, 2012 $ (229,149) $ (143,303) $ (15,013) $ 9,180 $ (5,833) $ (378,285)
Loss attributable to redeemable noncontrolling interest 4,308 — — — — 4,308
Total realized and unrealized gains (losses): Included in earnings — — 7,282 370 7,652 7,652
Included in other comprehensive income — 1,463 — — — 1,463
Included in additional paid-in capital (7,266) — — — — (7,266)
Balance, July 31, 2012 $ (232,107) $ (141,840) $ (7,731) $ 9,550 $ 1,819 $ (372,128)
17

7/29/2019 ForestCityEnterprisesInc 8 Copy
http://slidepdf.com/reader/full/forestcityenterprisesinc-8-copy 20/69
Table of Contents
Forest City Enterprises, Inc. and Subsidiaries
Notes to Consolidated Financial Statements
(Unaudited)
The following table presents quantitative information about the significant unobservable inputs used to estimate the fair value of financial instrumentsmeasured on a recurring basis as of July 31, 2013:
Quantitative Information about Level 3 Fair Value Measurements
Fair Value July 31,
2013
Valuation
Technique
Unobservable
Input Input Values
(in thousands)
Credit valuation adjustment of interest rate swap $ 8,706 Potential future exposure Credit spread 4.25%
TRS $ (13,156) Bond quote Discount rate N/A(1)
Capitalization rate N/A(1)
Fair value adjustment to the borrowings subject to TRS $ 8,724 Bond quote Discount rate N/A(1)
Capitalization rate N/A(1)
Redeemable noncontrolling interest $ (231,434) Discounted cash flows Discount rate 9.3%
(1) The Company does not have access to certain significant unobservable inputs used by these third parties to determine these fair values.
Third party service providers involved in fair value measurements are evaluated for competency and qualifications. Fair value measurements, includingunobservable inputs, are evaluated based on current transactions and experience in the real estate and capital markets.
The Company does not deem the impact of changes in unobservable inputs used to determine the fair market value of the credit valuation adjustment, TRS
and fair value adjustment to the borrowings subject to TRS to be significant; however, changes in the discount rate used to determine the fair market value of
the redeemable noncontrolling interest could have a significant impact on its fair market value.
Fair Value of Other Financial Instruments
The carrying amount of notes and accounts receivable, excluding the Stapleton advances, and accounts payable, accrued expenses and other liabilitiesapproximates fair value based upon the short-term nature of the instruments. The carrying amount of the Stapleton advances approximates fair value since the
interest rates on these advances approximates current market rates. The Company estimates the fair value of its debt instruments by discounting future cash
payments at interest rates that the Company believes approximate the current market. Estimated fair value is based upon market prices of public debt,available industry financing data, current treasury rates, recent financing transactions and loan to value ratios. The fair value of the Company’s debtinstruments is classified as Level 3 in the fair value hierarchy.
The following table summarizes the fair value of nonrecourse mortgage debt and notes payable exclusive of the fair value of derivatives, bank revolving
facility, senior and subordinated debt and nonrecourse mortgage debt and notes payable of land held for divestiture:
July 31, 2013 January 31, 2013
Carrying Value Fair Value Carrying Value Fair Value
(in thousands)
Fixed Rate Debt $ 4,823,275 $ 4,971,911 $ 4,791,113 $ 5,147,849
Variable Rate Debt 1,991,935 1,936,726 1,982,516 1,940,374
Total $ 6,815,210 $ 6,908,637 $ 6,773,629 $ 7,088,223
G. Stock-Based Compensation
During the six months ended July 31, 2013 , the Company granted 241,860 stock options, 653,447 shares of restricted stock and 299,460 performance
shares under the Company’s 1994 Stock Plan. The stock options had a grant-date fair value of $10.97, which was computed using the Black-Scholesoption-pricing model using the following assumptions: expected term of 5.5 years, expected volatility of 74.1%, risk-free interest rate of 0.8%, and expected
dividend yield of 0%. The exercise price of the options is $17.60, the closing price of the underlying Class A common stock on the date of grant. Therestricted stock had a grant-date fair value of $17.60 per share, the closing price of the Class A common stock on the date of grant. The performance shares
had a grant-date fair value of $17.78 per share, which was computed using a Monte Carlo simulation.
At July 31, 2013, there was $4,850,000of unrecognized compensation cost related to stock options that is expected to be recognized over a weighted-average
period of 2.52 years, $22,862,000 of unrecognized compensation cost related to restricted stock that is expected to be recognized over a weighted-average
period of 2.77 years, and $8,469,000 of unrecognized compensation cost related to performance shares that is expected to be recognized over a weighted-
average period of 2.97 years.
18
7/29/2019 ForestCityEnterprisesInc 8 Copy
http://slidepdf.com/reader/full/forestcityenterprisesinc-8-copy 21/69
Table of Contents
Forest City Enterprises, Inc. and Subsidiaries
Notes to Consolidated Financial Statements
(Unaudited)
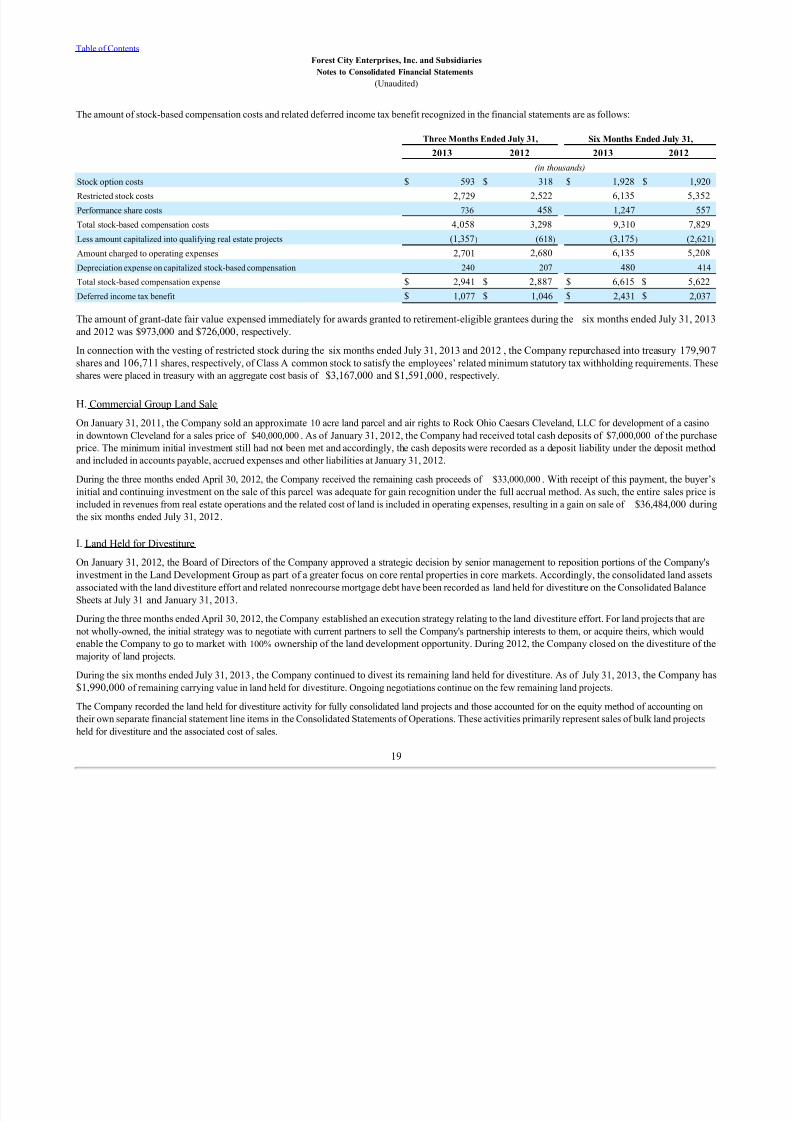
The amount of stock-based compensation costs and related deferred income tax benefit recognized in the financial statements are as follows:
Three Months Ended July 31, Six Months Ended July 31,
2013 2012 2013 2012
(in thousands)
Stock option costs $ 593 $ 318 $ 1,928 $ 1,920Restricted stock costs 2,729 2,522 6,135 5,352
Performance share costs 736 458 1,247 557
Total stock-based compensation costs 4,058 3,298 9,310 7,829
Less amount capitalized into qualifying real estate projects (1,357) (618) (3,175) (2,621)
Amount charged to operating expenses 2,701 2,680 6,135 5,208
Depreciation expense on capitalized stock-based compensation 240 207 480 414
Total stock-based compensation expense $ 2,941 $ 2,887 $ 6,615 $ 5,622
Deferred income tax benefit $ 1,077 $ 1,046 $ 2,431 $ 2,037
The amount of grant-date fair value expensed immediately for awards granted to retirement-eligible grantees during the six months ended July 31, 2013
and 2012 was $973,000 and $726,000, respectively.
In connection with the vesting of restricted stock during the six months ended July 31, 2013 and 2012 , the Company repurchased into treasury 179,907
shares and 106,711 shares, respectively, of Class A common stock to satisfy the employees’ related minimum statutory tax withholding requirements. Theseshares were placed in treasury with an aggregate cost basis of $3,167,000 and $1,591,000, respectively.
H. Commercial Group Land Sale
On January 31, 2011, the Company sold an approximate 10 acre land parcel and air rights to Rock Ohio Caesars Cleveland, LLC for development of a casino
in downtown Cleveland for a sales price of $40,000,000 . As of January 31, 2012, the Company had received total cash deposits of $7,000,000 of the purchase
price. The minimum initial investment still had not been met and accordingly, the cash deposits were recorded as a deposit liability under the deposit method
and included in accounts payable, accrued expenses and other liabilities at January 31, 2012.
During the three months ended April 30, 2012, the Company received the remaining cash proceeds of $33,000,000 . With receipt of this payment, the buyer’s
initial and continuing investment on the sale of this parcel was adequate for gain recognition under the full accrual method. As such, the entire sales price is
included in revenues from real estate operations and the related cost of land is included in operating expenses, resulting in a gain on sale of $36,484,000 during
the six months ended July 31, 2012 .
I. Land Held for Divestiture
On January 31, 2012, the Board of Directors of the Company approved a strategic decision by senior management to reposition portions of the Company's
investment in the Land Development Group as part of a greater focus on core rental properties in core markets. Accordingly, the consolidated land assets
associated with the land divestiture effort and related nonrecourse mortgage debt have been recorded as land held for divestiture on the Consolidated Balance
Sheets at July 31 and January 31, 2013.
During the three months ended April 30, 2012, the Company established an execution strategy relating to the land divestiture effort. For land projects that are
not wholly-owned, the initial strategy was to negotiate with current partners to sell the Company's partnership interests to them, or acquire theirs, which would
enable the Company to go to market with 100% ownership of the land development opportunity. During 2012, the Company closed on the divestiture of the
majority of land projects.
During the six months ended July 31, 2013 , the Company continued to divest its remaining land held for divestiture. As of July 31, 2013, the Company has$1,990,000 of remaining carrying value in land held for divestiture. Ongoing negotiations continue on the few remaining land projects.
The Company recorded the land held for divestiture activity for fully consolidated land projects and those accounted for on the equity method of accounting on
their own separate financial statement line items in the Consolidated Statements of Operations. These activities primarily represent sales of bulk land projects
held for divestiture and the associated cost of sales.
19

7/29/2019 ForestCityEnterprisesInc 8 Copy
http://slidepdf.com/reader/full/forestcityenterprisesinc-8-copy 22/69
Table of Contents
Forest City Enterprises, Inc. and Subsidiaries
Notes to Consolidated Financial Statements
(Unaudited)
The following table summarizes the net loss on land held for divestiture activity of consolidated entities:
Three Months Ended July 31, Six Months Ended July 31,
2013 2012 2013 2012
(in thousands)
Sales of land held for divestiture $ 1,056 $ 34,510 $ 1,768 $ 34,510
Cost of sales of land held for divestiture (63) (25,172) (323) (25,172)
Net gain on closed transactions of land held for divestiture 993 9,338 1,445 9,338
Bad debt expense (9,000) — (9,000) —
Impairment of land held for divestiture — (15,796) — (15,796)
Net loss on land held for divestiture activity $ (8,007) $ (6,458) $ (7,555) $ (6,458)
The Company has a note receivable (the “Note”), related to a 2006 land sale, that was in default at July 31, 2013 and is collateralized by a 1,000 acre land parcel in North Carolina. Negotiations are ongoing to cure the default; however, the Company has no assurance the payee has the intent to pay the Note in full.
Accordingly, the Company established a reserve on the Note to reflect the estimated fair value of the underlying collateral of approximately $4,100,000. As aresult, bad debt expense of $9,000,000 , ($8,300,000, net of noncontrolling interest and $4,980,000, after tax) was recorded during the three and six months
ended July 31, 2013.
The net gain on closed transactions of land held for divestiture for the three and six months ended July 31, 2012 primarily relates to the sale of the Company's
51% ownership interest in a land project in Prosper, Texas. The transaction, which had a sale price of $29,800,000, resulted in a gain of approximately$7,600,000 ($3,900,000, net of noncontrolling interest).
Through the competitive bid process and the negotiation process of taking informal expressions of interest to bona fide purchase offers, the Company obtained
additional information regarding the value of its specific projects as viewed by current market participants. Based on the various levels of interest from potential buyers and information obtained from preliminary sales contracts, letters of intent and other negotiations on the remaining land projects, theCompany reviewed its assumptions used to estimate the fair value of the land held for divestiture. As a result, the Company recorded an impairment charge of
$15,796,000 during the three and six months ended July 31, 2012.
The following table presents quantitative information about the significant unobservable inputs used to determine the fair value of impairment of consolidated
land held for divestiture for the six months ended July 31, 2012:
Quantitative Information about Level 3 Fair Value Measurements
Fair Value July 31,
2012
Valuation
Technique
Unobservable
Input
Range
of Input Values
(in thousands)
Impairment of land held for divestiture $ 15,663 Indicative bids Indicative bids N/A(1)
Impairment of land held for divestiture $ 926 Discounted cash flows (2) N/A N/A
(1) These fair value measurements were developed by third party sources, subject to the Company’s corroboration for reasonableness.
(2) The Company used a discounted cash flow technique to estimate fair value; however, due to the estimated holding period being less than twelve months, the impact of
discounting was deemed immaterial.
The Company also has investments held in unconsolidated entities. The following table summarizes the net gain (loss) on investments in unconsolidated
entities which are part of the land divestiture strategy:
Three Months Ended July 31, Six Months Ended July 31,
2013 2012 2013 2012
(in thousands)
Net gain (loss) on sales of land held for divestiture of unconsolidated entities $ 828 $ (1,481) $ 681 $ (1,481)
Impairment of investments in unconsolidated entities — (40,406) — (40,406)
Net gain (loss) on land held for divestiture activity of unconsolidated entities $ 828 $ (41,887) $ 681 $ (41,887)
During the three months ended July 31, 2012, the Company received an unsolicited offer to purchase its ownership interest in the remaining land parcels at its
Central Station project in downtown Chicago, Illinois for approximately $30,000,000 . The Company evaluated the offer and made a decision to divest itsequity method investment in Central Station as part of its formal land divestiture activities. The proposed sale would support the continued strategic efforts to
focus on core rental products in core markets and delever its balance sheet and as a result, the Company signed a letter of intent. Based on the terms of the
letter of intent, the Company recorded an impairment charge of approximately $17,000,000, which is included in impairment of land held for divestiture of
unconsolidated entities during the three and six months ended July 31, 2012.
20

7/29/2019 ForestCityEnterprisesInc 8 Copy
http://slidepdf.com/reader/full/forestcityenterprisesinc-8-copy 23/69
Table of Contents
Forest City Enterprises, Inc. and Subsidiaries
Notes to Consolidated Financial Statements
(Unaudited)
During the three months ended July 31, 2012, the Company continued to market its equity method ownership interest in a land project in Albuquerque, New
Mexico to several potential buyers. Mesa del Sol is a large 3,000 acre development opportunity in the beginning stage of residential land development and is not
expected to generate positive cash flow in the near-term due to the expected level of development expenditures needed to prepare the first phase of lots for sale.
During the extensive marketing activities, there were few buyers that expressed interest in taking on the long-term development risk, and those that were,
expected larger returns than previously estimated. As a result, based on these negotiations and other market information obtained from these potential buyers
and other industry data, the Company updated its assumptions used in estimating the fair value of the investment, including discount rates, absorption ratesand commercial and residential land pricing. Based on the updated valuation model, the Company recorded an additional impairment charge of approximately
$15,000,000, which is included in impairment of land held for divestiture of unconsolidated entities during the three and six months ended July 31, 2012.
J. Net Gain on Disposition of Partial Interests in Rental Properties
On March 29, 2011, the Company entered into joint venture agreements with an outside partner, an affiliated entity of Madison International Realty LLC. The
outside partner invested in and received a 49% equity interest in 15 mature retail properties located in the New York City metropolitan area. For its 49% equity
interests, the outside partner invested cash and assumed debt of $244,952,000, representing 49% of the nonrecourse mortgage debt on the 15 properties. As o
January 31, 2012, the Company received proceeds of $178,286,000, primarily in the form of a loan. Based on the net amount of cash received, the outside
partner’s minimum initial investment requirement of 20% was not met. Since the transaction did not qualify for full gain recognition, the installment method
of gain recognition was applied and a net gain on disposition of partial interests in rental properties of $9,561,000 was recorded during the year ended January
31, 2012. As of January 31, 2013, the remaining gain of $114,465,000 continued to be deferred and was included in accounts payable, accrued expenses and
other liabilities.
During the three months ended July 31, 2013, the Company used distribution proceeds from the joint ventures to pay down a portion of the loan whichincreases the net cash received for purposes of measuring whether full gain recognition is appropriate. However, the outside partner's investment requirement
was still not met and the installment method of gain recognition was applied, resulting in an additional net gain on disposition of partial interests in rental
properties of $4,932,000 during the three and six months ended July 31, 2013. As of July 31, 2013, the remaining gain of $109,533,000 continued to be
deferred and was included in accounts payable, accrued expenses and other liabilities.
K. Income Taxes
Income tax expense (benefit) for the three months ended July 31, 2013 and 2012 was $(16,251,000) and $(9,065,000), respectively, and $(32,084,000) and$110,000 for the six months ended July 31, 2013 and 2012 , respectively. The difference in the recorded income tax expense/benefit versus the income tax
expense/benefit computed at the statutory federal income tax rate is primarily attributable to state income taxes, changes in state net operating losses, additional
general business credits, changes to the valuation allowances associated with certain deferred tax assets, and various permanent differences between pre-tax
GAAP income and taxable income.
The Company applies an estimated annual effective tax rate to its year-to-date earnings from operations to derive its tax provision for the quarter . Certaincircumstances may arise which make it difficult for the Company to determine a reasonable estimate of its annual effective tax rate for the year. TheCompany’s projected marginal operating results, which include the gain related to the Commercial Group’s land sale as described in Note H – Commercial
Group Land Sale, result in an effective tax rate that changes significantly with small variations in projected income or loss from operations or permanent
differences and thus does not provide for a reliable estimate of the estimated annual effective tax rate. Therefore, in computing the Company’s income tax
provision for the three and six months ended July 31, 2012, the Company excluded the gain on the Commercial Group’s land sale from its estimated annual
effective tax rate calculation and recognized the actual income tax expense related to the gain during the three and six months ended July 31, 2012 .
At January 31, 2013, the Company had a federal net operating loss carryforward for tax purposes of $212,271,000 that expires in the years ending January
31, 2026 through January 31, 2033 , a charitable contribution deduction carryforward of $27,326,000 that expires in the years ending January 31, 2014
through January 31, 2018 , general business credit carryovers of $21,159,000 that expires in the years ending January 31, 2019 through January 31, 2033
and an alternative minimum tax (“AMT”) credit carryforward of $27,452,000 that is available until used to reduce federal tax to the AMT amount.
The Company’s policy is to consider a variety of tax-deferral strategies, including tax deferred exchanges, when evaluating its future tax position. TheCompany has a full valuation allowance against the deferred tax asset associated with its charitable contributions. The Company has a valuation allowance
against its general business credits, other than those general business credits which are eligible to be utilized to reduce future AMT liabilities. The Company
has a valuation allowance against certain of its state net operating losses and state bonus depreciation deferred assets. These valuation allowances exist because
management believes it is more likely than not that the Company will not realize these benefits.
21

7/29/2019 ForestCityEnterprisesInc 8 Copy
http://slidepdf.com/reader/full/forestcityenterprisesinc-8-copy 24/69
Table of Contents
Forest City Enterprises, Inc. and Subsidiaries
Notes to Consolidated Financial Statements
(Unaudited)
The Company applies the “with-and-without” methodology for recognizing excess tax benefits from the deduction of stock-based compensation. The net
operating loss available for the tax return, as is noted in the paragraph above, is greater than the net operating loss available for the tax provision due to excess
deductions from stock-based compensation reported on the return, as well as the impact of adjustments to the net operating loss under accounting guidance on
accounting for uncertainty in income taxes. As of January 31, 2013, the Company has not recorded a net deferred tax asset of approximately $17,299,000from excess stock-based compensation deductions taken on the tax return for which a benefit has not yet been recognized in the Company’s tax provision.
L. Impairment of Real Estate, Impairment of Unconsolidated Entities and Write-Off of Abandoned Development Projects
Impairment of Real Estate
The Company reviews its real estate portfolio, including land held for development and sale, for impairment whenever events or changes indicate that its
carrying value may not be recoverable. In cases where the Company does not expect to recover its carrying costs, an impairment charge is recorded. The
impairments recorded during the three and six months ended July 31, 2013 and 2012 represent write-downs to estimated fair value due to a change in events,
such as a bona fide third-party purchase offer or changes in certain assumptions, including estimated holding periods and current market conditions and the
impact of these assumptions to the properties’ estimated future cash flows, which represents Level 3 inputs.
The following table summarizes the Company's impairment of real estate included in continuing operations:
Three Months Ended July 31, Six Months Ended July 31,
2013 2012 2013 2012
(in thousands)
Investment in triple net lease retail property Kansas City, Missouri $ 6,870 $ — $ 6,870 $ —
Other 1,185 460 1,185 460
$ 8,055 $ 460 $ 8,055 $ 460
Impairment of Real Estate - Discontinued Operations
The Company had impairments related to consolidated real estate assets that were disposed of during the periods presented. The following table summarizes
the Company's impairment of real estate included in discontinued operations:
Three Months Ended July 31, Six Months Ended July 31,
2013 2012 2013 2012
(in thousands)
White Oak Village (Specialty Retail Center) Richmond, Virginia $ — $ 1,566 $ — $ 1,566
Investment in triple net lease retail property Portage, Michigan — 88 2 — 2,263
Other — 261 — 261
$ — $ 2,709 $ — $ 4,090
The following table presents quantitative information about the significant unobservable inputs used to determine the fair value of the impairment of real estate
(including discontinued operations) for the six months ended July 31, 2013 and 2012 :
Quantitative Information about Level 3 Fair Value Measurements
Fair Value
Valuation
Technique
Unobservable
Input
Range
of Input Values
(in thousands)
July 31, 2013 Impairment of real estate $ 8,029 Indicative Bids Indicative Bids N/A (1)
July 31, 2012 Impairment of real estate $ 80,929 Indicative Bids Indicative Bids N/A (1)
(1) These fair value measurements were derived from bona fide purchase offers from third party prospective buyers, subject to the Company’s corroboration for reasonableness.
22

7/29/2019 ForestCityEnterprisesInc 8 Copy
http://slidepdf.com/reader/full/forestcityenterprisesinc-8-copy 25/69
Table of Contents
Forest City Enterprises, Inc. and Subsidiaries
Notes to Consolidated Financial Statements
(Unaudited)
Impairment of Unconsolidated Entities
The Company reviews its portfolio of unconsolidated entities for other-than-temporary impairments whenever events or changes indicate that its carrying value
in the investments may be in excess of fair value. An equity method investment’s value is impaired if management’s estimate of its fair value is less than the
carrying value and the difference is deemed to be other-than-temporary. In order to arrive at the estimates of fair value, the Company uses varying assumptions
that may include comparable sale prices, market discount rates, market capitalization rates and estimated future discounted cash flows specific to thegeographic region and property type, all of which are considered to be Level 3 inputs. For newly opened properties, assumptions also include the timing of
initial lease up at the property. In the event the initial lease up assumptions differ from actual results, estimated future discounted cash flows may vary
resulting in impairment charges in future periods. The Company recorded no impairments of unconsolidated entities during the three and six months ended
July 31, 2013. The Company recorded $390,000 of impairments of unconsolidated entities during the three and six months ended July 31, 2012 .
Write-Off of Abandoned Development Projects
On a quarterly basis, the Company reviews each project under development to determine whether it is probable that the project will be developed. If management determines that the project will not be developed, project costs and other expenses related to the project are written off and expensed as anabandoned development project cost. The Company abandons projects under development for a number of reasons, including, but not limited to, changes in
local market conditions, increases in construction or financing costs or third party challenges related to entitlements or public financing. The Company wrote
off abandoned development projects of $2,696,000 and $2,777,000 during the three and six months ended July 31, 2013 , respectively, and $13,212,000 and$13,659,000 during the three and six months ended July 31, 2012 , respectively.
M. Gain (Loss) on Extinguishment of Debt
For the three and six months ended July 31, 2013 , the Company recorded $24,669,000 and $19,431,000 , respectively, as gain on extinguishment of debt
The amounts for 2013 primarily include a $24,669,000 gain on the extinguishment of nonrecourse debt at Ten MetroTech Center partially offset by a non-
tax deductible loss of $4,762,000 on the exchange of the 2014 Senior Notes for Class A common stock (See Note D – Senior and Subordinated Debt). For
the three and six months ended July 31, 2012 , the Company recorded $0 and $719,000, respectively, as loss on extinguishment of debt.
N. Discontinued Operations and Gain on Disposition of Rental Properties
The following table lists rental properties included in discontinued operations:
Property Location
Square Feet/ Number of
Units Period Disposed
Three Months
Ended 7/31/13
Six Months
Ended
7/31/13
Three Months
Ended 7/31/12
Six Months
Ended
7/31/12
Commercial Group: Higbee Building Cleveland, Ohio 815,000 square feet Q2-2013 Yes Yes Yes Yes
Sheraton Station Square Pittsburgh, Pennsylvania 399 rooms Q2-2013 Yes Yes Yes YesFairmont Plaza San Jose, California 335,000 square feet Q4-2012 — — Yes Yes
White Oak Village Richmond, Virginia 843,000 square feet Q3-2012 — — Yes Yes
Quebec Square Denver, Colorado 739,000 square feet Q1-2012 — — — Yes
Six triple net lease properties Various 287,000 square feet Various (1) — Yes Yes Yes
Residential Group: Millender Center Detroit, Michigan 339 units Q1-2013 — Yes Yes Yes
Emerald Palms Miami, Florida 505 units Q4-2012 — — Yes Yes
Southfield Whitemarsh, Maryland 212 units Q3-2012 — — Yes Yes
(1) Includes one triple net lease property disposed of during Q1-2013, three triple net lease properties disposed of during Q3-2012 and two triple net lease properties disposed of during
Q2-2012.
23

7/29/2019 ForestCityEnterprisesInc 8 Copy
http://slidepdf.com/reader/full/forestcityenterprisesinc-8-copy 26/69
Table of Contents
Forest City Enterprises, Inc. and Subsidiaries
Notes to Consolidated Financial Statements
(Unaudited)
The following table summarizes the operating results related to discontinued operations:
Three Months Ended July 31, Six Months Ended July 31,
2013 2012 2013 2012
(in thousands)
Revenues from real estate operations $ 9,911 $ 20,451 $ 20,445 $ 40,181
Expenses
Operating expenses 5,631 9,999 12,143 20,133
Depreciation and amortization 749 3,525 1,987 6,994
Impairment of real estate — 2,709 — 4,090
6,380 16,233 14,130 31,217
Interest expense (1,515) (3,627) (2,769) (7,361)
Amortization of mortgage procurement costs (19) (325) (50) (492)
Loss on extinguishment of debt — — (40) —
Interest income 111 127 225 280
Gain on disposition of rental properties 21,221 — 43,103 8,879
Earnings before income taxes 23,329 393
46,784 10,270
Income tax expense (benefit) 12,080 (325) 19,007 3,603
Earnings from discontinued operations 11,249 718 27,777 6,667
Noncontrolling interest
Gain on disposition of rental properties — — 5,835 965
Operating earnings from rental properties — 514 3 590
— 514 5,838 1,555
Earnings from discontinued operations attributable to Forest City Enterprises,
Inc. $ 11,249 $ 204 $ 21,939 $ 5,112
The following table summarizes the pre-tax gain on disposition of rental properties:
Three Months Ended July 31, Six Months Ended July 31,
2013 2012 2013 2012
(in thousands)
Sheraton Station Square (Hotel) $ 18,096 $ — $ 18,096 $ —
Higbee Building (Office Building) 2,922 — 2,922 —
Millender Center (Apartment Community) — — 21,660 —
Triple net lease property — — 222 —
Quebec Square (Specialty Retail Center) — — — 8,879
Other 203 — 203 —
$ 21,221 $ — $ 43,103 $ 8,879
Gain (Loss) on Disposition of Unconsolidated Entities
Upon disposition, investments accounted for on the equity method are not classified as discontinued operations; therefore, gains or losses on the disposition of
these properties are reported in continuing operations. The following table summarizes gains and losses on the disposition of unconsolidated entities, which are
included in equity in earnings:
Three Months Ended July 31, Six Months Ended July 31,
2013 2012 2013 2012
(in thousands)
Specialty Retail Centers:
Plaza at Robinson Town Center Pittsburgh, Pennsylvania $ — $ — $ (1,510) $ —
Village at Gulfstream Park Hallandale Beach, Florida — 14,479 — 14,479
Chagrin Plaza I & II (Office Buildings) Beachwood, Ohio — 1,628 — 1,628
$ — $ 16,107 $ (1,510) $ 16,107
24

7/29/2019 ForestCityEnterprisesInc 8 Copy
http://slidepdf.com/reader/full/forestcityenterprisesinc-8-copy 27/69
Table of Contents
Forest City Enterprises, Inc. and Subsidiaries
Notes to Consolidated Financial Statements
(Unaudited)
O. Earnings Per Share
The Company’s restricted stock is considered a participating security pursuant to the two-class method for computing basic earnings per share (“EPS”). The
Class A Common Units, which are reflected as noncontrolling interests in the Consolidated Balance Sheets, are considered convertible participating securities
as they are entitled to participate in any dividends paid to the Company’s common shareholders. The Class A Common Units are included in the computation
of basic EPS using the two-class method and are included in the computation of diluted EPS using the if-converted method. The Class A common stock
issuable in connection with a put or conversion of the 2014 Senior Notes, 2016 Senior Notes, 2018 Senior Notes, 2020 Senior Notes and Series A preferredstock is included in the computation of diluted EPS using the if-converted method. The loss from continuing operations attributable to Forest City Enterprises,
Inc. for the three and six months ended July 31, 2013 and 2012 was allocated solely to holders of common stock as the participating security holders do not
share in the losses.
The reconciliation of the basic and diluted EPS computations is shown in the following table:
Three Months Ended July 31, Six Months Ended July 31,
2013 2012 2013 2012
Numerators (in thousands)
Loss from continuing operations attributable to Forest City Enterprises, Inc. $ (27,530) $ (43,921) $ (57,588) $ (26,077)
Preferred dividends — (3,850 ) (185) (7,700)
Loss from continuing operations attributable to Forest City Enterprises, Inc. common
shareholders ‑ Basic and Diluted $ (27,530) $ (47,771) $ (57,773) $ (33,777)
Net loss attributable to Forest City Enterprises, Inc. $ (16,281) $ (43,717) $ (35,649) $ (20,965)
Preferred dividends — (3,850 ) (185) (7,700)
Net loss attributable to Forest City Enterprises, Inc. common shareholders ‑ Basic and Diluted $ (16,281) $ (47,567) $ (35,834) $ (28,665)
Denominators
Weighted average shares outstanding ‑ Basic and Diluted (1) 194,745,051 169,454,672 189,865,650 169,331,996
Earnings Per Share Loss from continuing operations attributable to Forest City Enterprises, Inc. common
shareholders ‑ Basic and Diluted $ (0.14) $ (0.28) $ (0.30) $ (0.20)
Net loss attributable to Forest City Enterprises, Inc. common shareholders ‑ Basic and Diluted $ (0.08) $ (0.28) $ (0.19) $ (0.17)
(1) Incremental shares from dilutive options, restricted stock, performance shares and convertible securities aggregating 29,282, 326 and 33,430,831 for the three and six month
ended July 31, 2013, respectively, and 52,436,282 and 52,535,035 for the three and six months ended July 31, 2012 , respectively, were not included in the computation of
diluted EPS because their effect is anti-dilutive due to the loss from continuing operations. Weighted-average options, restricted stock and performance shares of 3,759,294 and
3,952,633 for the three and six months ended July 31, 2013 , respectively, and 4,474,149 and 4,479, 739 for the three and six months ended July 31, 2012, respectively, wer
not included in the computation of diluted EPS because their effect is anti-dilutive under the treasury stock method.
25

7/29/2019 ForestCityEnterprisesInc 8 Copy
http://slidepdf.com/reader/full/forestcityenterprisesinc-8-copy 28/69
Table of Contents
Forest City Enterprises, Inc. and Subsidiaries
Notes to Consolidated Financial Statements
(Unaudited)
P. Segment Information
The Company operates through three strategic business units and has six reportable operating segments. The three strategic business units, which represent
four reportable operating segments, are the Commercial Group, Residential Group and Land Development Group (collectively, the “Real Estate Groups”). The
Commercial Group, the Company’s largest strategic business unit, owns, develops, acquires and operates regional malls, specialty/urban retail centers, office
and life science buildings and mixed-use projects. Additionally, the Arena, which opened in September 2012 is reported as a separate reportable operating
segment. The Residential Group owns, develops, acquires and operates residential rental properties, including upscale and middle-market apartments andadaptive re-use developments. Additionally, the Residential Group owns interests in entities that develop and manage military family housing. The Land
Development Group acquires and sells both land and developed lots to residential, commercial and industrial customers. It also owns and develops land into
master-planned communities and mixed-use projects. The remaining two reportable segments are Corporate Activities and The Nets, a member of the NBA in
which the Company accounts for its investment on the equity method of accounting. The following tables summarize financial data for the Company’s six
reportable operating segments. All amounts in the following tables are presented in thousands.
July 31, 2013 January 31, 2013
Identifiable Assets Commercial Group
$ 6,778,113 $ 7,127,228 Residential Group
2,428,143 2,060,892 Arena
974,618 980,321 Land Development Group
277,753 246,873
The Nets — 1,111
Corporate Activities 269,474 196,007
$ 10,728,101 $ 10,612,432
Three Months Ended July 31, Six Months Ended July 31, Three Months Ended July 31, Six Months Ended July 31,
2013 2012 2013 2012 2013 2012 2013 2012
Revenues from Real Estate Operations Operating Expenses
Commercial Group$ 183,437 $ 165,348 $ 355,565 $ 328,697 $ 99,104 $ 90,767 $ 194,265 $ 172,283
Commercial Group Land Sales 791 49 26,391 40,049 184 50 15,547 3,566
Residential Group 63,545 63,679 127,342 125,304 48,200 41,432 96,740 84,575
Arena 21,587 210 50,284 326 15,533 6,469 39,484 10,757
Land Development Group 22,402 12,484 28,329 24,640 15,692 11,271 21,385 22,948
The Nets — — — — — — — —
Corporate Activities — — — — 12,691 13,623 26,106 26,354
$ 291,762 $ 241,770 $ 587,911 $ 519,016 $ 191,404 $ 163,612 $ 393,527 $ 320,483
Depreciation and Amortization Interest Expense
Commercial Group$ 68,866 $ 38,965 $ 113,406 $ 75,981 $ 53,920 $ 42,676 $ 106,755 $ 82,677
Residential Group 14,256 11,536 27,834 23,448 13,913 4,568 22,659 8,238
Arena 7,871 — 17,276 — 9,349 (4,607) 18,362 (8,734)
Land Development Group 102 139 200 246 (178) 2,475 (280) 4,226
The Nets — — — — — — — —
Corporate Activities 762 257 1,516 586 14,719 14,242 30,478 27,837
$ 91,857 $ 50,897 $ 160,232 $ 100,261 $ 91,723 $ 59,354 $ 177,974 $ 114,244
Interest and Other Income Capital Expenditures
Commercial Group$ 2,312 $ 6,174 $ 4,204 $ 9,821 $ 51,375 $ 115,079 $ 107,968 $ 203,631
Residential Group 6,399 4,835 12,546 9,309 52,353 27,648 101,222 53,585
Arena — — — — 17,967 102,679 31,853 184,266
Land Development Group 3,453 2,510 6,273 4,870 6 139 819 181
The Nets — — — — — — — — Corporate Activities 113 32 159 77 — 199 229 435
$ 12,277 $ 13,551 $ 23,182 $ 24,077 $ 121,701 $ 245,744 $ 242,091 $ 442,098
26
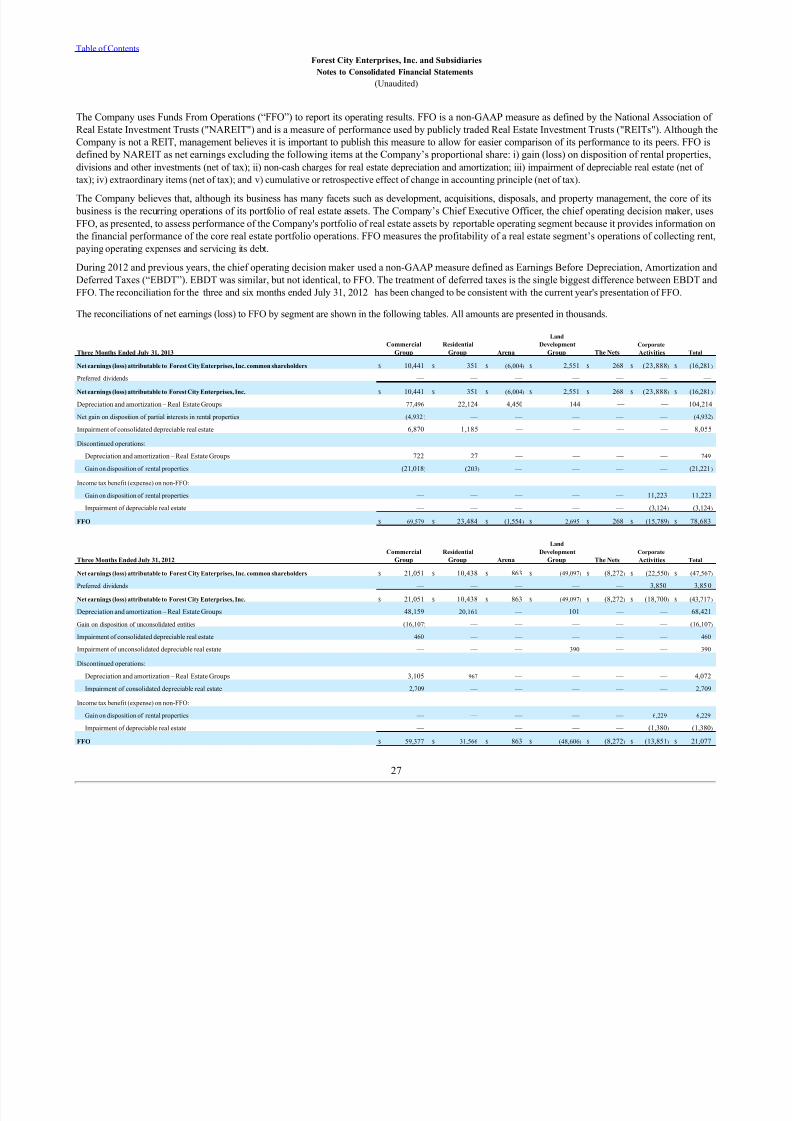
7/29/2019 ForestCityEnterprisesInc 8 Copy
http://slidepdf.com/reader/full/forestcityenterprisesinc-8-copy 29/69
Table of Contents
Forest City Enterprises, Inc. and Subsidiaries
Notes to Consolidated Financial Statements
(Unaudited)
The Company uses Funds From Operations (“FFO”) to report its operating results. FFO is a non-GAAP measure as defined by the National Association of
Real Estate Investment Trusts ("NAREIT") and is a measure of performance used by publicly traded Real Estate Investment Trusts ("REITs"). Although the
Company is not a REIT, management believes it is important to publish this measure to allow for easier comparison of its performance to its peers. FFO is
defined by NAREIT as net earnings excluding the following items at the Company’s proportional share: i) gain (loss) on disposition of rental properties,
divisions and other investments (net of tax); ii) non-cash charges for real estate depreciation and amortization; iii) impairment of depreciable real estate (net of
tax); iv) extraordinary items (net of tax); and v) cumulative or retrospective effect of change in accounting principle (net of tax).
The Company believes that, although its business has many facets such as development, acquisitions, disposals, and property management, the core of its
business is the recurring operations of its portfolio of real estate assets. The Company’s Chief Executive Officer, the chief operating decision maker, uses
FFO, as presented, to assess performance of the Company's portfolio of real estate assets by reportable operating segment because it provides information on
the financial performance of the core real estate portfolio operations. FFO measures the profitability of a real estate segment’s operations of collecting rent,
paying operating expenses and servicing its debt.
During 2012 and previous years, the chief operating decision maker used a non-GAAP measure defined as Earnings Before Depreciation, Amortization and
Deferred Taxes (“EBDT”). EBDT was similar, but not identical, to FFO. The treatment of deferred taxes is the single biggest difference between EBDT and
FFO. The reconciliation for the three and six months ended July 31, 2012 has been changed to be consistent with the current year's presentation of FFO.
The reconciliations of net earnings (loss) to FFO by segment are shown in the following tables. All amounts are presented in thousands.
Three Months Ended July 31, 2013
Commercial
Group
Residential
Group Arena
Land
Development
Group The Nets
Corporate
Activities Total
Net earnings (loss) attributable to Forest City Enterprises, Inc. common shareholders $ 10,441 $ 351 $ (6,004) $ 2,551 $ 268 $ (23,888) $ (16,281)
Preferred dividends — — — — — — —
Net earnings (loss) attributable to Forest City Enterprises, Inc. $ 10,441 $ 351 $ (6,004) $ 2,551 $ 268 $ (23,888) $ (16,281)
Depreciation and amortization – Real Estate Groups 77,496 22,124 4,450 144 — — 104,214
Net gain on disposition of partial interests in rental properties (4,932) — — — — — (4,932)
Impairment of consolidated depreciable real estate 6,870 1,185 — — — — 8,055
Discontinued operations:
Depreciation and amortization – Real Estate Groups 722 27 — — — — 749
Gain on disposition of rental properties (21,018) (203) — — — — (21,221)
Income tax benefit (expense) on non-FFO:
Gain on disposition of rental properties — — — — — 11,223 11,223
Impairment of depreciable real estate — — — — — (3,124) (3,124)
FFO $ 69,579 $ 23,484 $ (1,554) $ 2,695 $ 268 $ (15,789) $ 78,683
Three Months Ended July 31, 2012
Commercial
Group
Residential
Group Arena
LandDevelopment
Group The Nets
Corporate
Activities Total
Net earnings (loss) attributable to Forest City Enterprises, Inc. common shareholders $ 21,051 $ 10,438 $ 863 $ (49,097) $ (8,272) $ (22,550) $ (47,567)
Preferred dividends — — — — — 3,850 3,850
Net earnings (loss) attributable to Forest City Enterprises, Inc. $ 21,051 $ 10,438 $ 863 $ (49,097) $ (8,272) $ (18,700) $ (43,717)
Depreciation and amortization – Real Estate Groups 48,159 20,161 — 101 — — 68,421
Gain on disposition of unconsolidated entities (16,107) — — — — — (16,107)
Impairment of consolidated depreciable real estate 460 — — — — — 460
Impairment of unconsolidated depreciable real estate — — — 390 — — 390
Discontinued operations:
Depreciation and amortization – Real Estate Groups 3,105 967 — — — — 4,072
Impairment of consolidated depreciable real estate 2,709 — — — — — 2,709
Income tax benefit (expense) on non-FFO:
Gain on disposition of rental properties — — — — — 6,229 6,229
Impairment of depreciable real estate — — — — — (1,380) (1,380)
FFO $ 59,377 $ 31,566 $ 863 $ (48,606) $ (8,272) $ (13,851) $ 21,077
27

7/29/2019 ForestCityEnterprisesInc 8 Copy
http://slidepdf.com/reader/full/forestcityenterprisesinc-8-copy 30/69
Table of Contents
Forest City Enterprises, Inc. and Subsidiaries
Notes to Consolidated Financial Statements
(Unaudited)
Reconciliation of Net Earnings (Loss) to FFO by Segment (continued):
Six Months Ended July 31, 2013
Commercial
Group
Residential
Group Arena
Land
Development
Group The Nets
Corporate
Activities Total
Net earnings (loss) attributable to Forest City Enterprises, Inc. common shareholders $ 6,292 $ 18,808 $ (13,515) $ 5,369 $ (2,713) $ (50,075) $ (35,834)
Preferred dividends — — — — — 185 185
Net earnings (loss) attributable to Forest City Enterprises, Inc. $ 6,292 $ 18,808 $ (13,515) $ 5,369 $ (2,713) $ (49,890) $ (35,649)
Depreciation and amortization – Real Estate Groups 131,100 43,198 9,947 182 — — 184,427
Net gain on disposition of partial interests in rental properties (4,932) — — — — — (4,932)
Loss on disposition of unconsolidated entities 1,510 — — — — — 1,510
Impairment of consolidated depreciable real estate 6,870 1,185 — — — — 8,055
Discontinued operations:
Depreciation and amortization – Real Estate Groups 1,811 165 — — — — 1,976
Gain on disposition of rental properties (21,240) (16,028) — — — — (37,268)
Income tax benefit (expense) on non-FFO:
Gain on disposition of rental properties — — — — — 16,831 16,831
Impairment of depreciable real estate — — — — — (3,124) (3,124)
FFO $ 121,411 $ 47,328 $ (3,568) $ 5,551 $ (2,713) $ (36,183) $ 131,826
Six Months Ended July 31, 2012Commercial
GroupResidential
Group Arena
Land
DevelopmentGroup The Nets
CorporateActivities Total
Net earnings (loss) attributable to Forest City Enterprises, Inc. common shareholders $ 76,961 $ 21,246 $ 2,612 $ (48,141) $ (15,230) $ (66,113) $ (28,665)
Preferred dividends — — — — — 7,700 7,700
Net earnings (loss) attributable to Forest City Enterprises, Inc. $ 76,961 $ 21,246 $ 2,612 $ (48,141) $ (15,230) $ (58,413) $ (20,965)
Depreciation and amortization – Real Estate Groups 94,768 40,355 — 209 — — 135,332
Gain on disposition of unconsolidated entities (16,107) — — — — — (16,107)
Impairment of consolidated depreciable real estate 460 — — — — — 460
Impairment of unconsolidated depreciable real estate — — — 390 — — 390
Discontinued operations:
Depreciation and amortization – Real Estate Groups 5,674 1,904 — — — — 7,578
Gain on disposition of rental properties (7,914) — — — — — (7,914)
Impairment of consolidated depreciable real estate 4,090 — — — — — 4,090
Income tax benefit (expense) on non-FFO:
Gain on disposition of rental properties — — — — — 9,281 9,281
Impairment of depreciable real estate — — — — — (1,916) (1,916)
FFO $ 157,932 $ 63,505 $ 2,612 $ (47,542) $ (15,230) $ (51,048) $ 110,229
Q. Capital Stock
On October 16, 2012 and December 13, 2012, the Company entered into separate, privately negotiated exchange agreements with certain holders of its Series A
Cumulative Perpetual Convertible Preferred Stock ("Series A preferred stock") to exchange such stock for shares of the Company's Class A common stock.
Under the terms of the agreements, holders exchanged $209,447,600 in aggregate amount of liquidation preference consisting of 4,188,952 shares of Series A
preferred stock, for 13,852,435 shares of Class A common stock. The amount of common shares issued was equivalent to the initial conversion price of$15.12 per share of Class A common stock. The Company made aggregate cash payments of $19,069,000 to the holders for additional exchangeconsideration, including dividends that would have been payable on December 17, 2012 and March 15, 2013. Under the accounting guidance for induced
conversions of convertible preferred stock, the cash inducement payments were recorded as a reduction to retained earnings.
From January 31, 2013 to March 14, 2013, 109,768 shares of Series A preferred stock were converted into 362,990 shares of Class A common stock inaccordance with the original terms of the Series A preferred stock. On March 15, 2013, the Company redeemed the remaining 101,270 shares of Series A
preferred stock for approximately $5,100,000 , the aggregate amount of liquidation preference plus the dividend that was due and payable on March 15, 2013.
On March 13, 2013, the Company and the counterparties settled an equity call hedge transaction that was entered into in connection with the original issuance
of the Series A preferred stock. As a result, the Company received 765,134 shares of Class A common stock valued at $16.82 per share for a total of$12,868,000 and cash payments of $10,231,000. In accordance with accounting guidance on equity hedge transactions, amounts received upon settlement of
equity call hedge transactions in which the Company has the choice of net share settlement or net cash settlement are reflected as an increase to additional paid-
in capital.
The Company declared and paid Series A preferred stock dividends of $0 and $185,000 during the three and six months ended July 31, 2013 and
$3,850,000 and $7,700,000 during the three and six months ended July 31, 2012 .
28

7/29/2019 ForestCityEnterprisesInc 8 Copy
http://slidepdf.com/reader/full/forestcityenterprisesinc-8-copy 31/69
Table of Contents
Forest City Enterprises, Inc. and Subsidiaries
Notes to Consolidated Financial Statements
(Unaudited)
On April 16, 2013, the Company entered into separate, privately negotiated exchange agreements with certain holders of the 2014 Senior Notes to exchange
such notes for Class A common stock. Under the terms of the agreements, holders agreed to exchange $138,853,000 in aggregate principal amount of 2014
Senior Notes for a total of 9,549,721 shares of Class A common stock and a cash payment of $4,860,000 for additional exchange consideration, accrued
interest and in lieu of fractional shares.
On May 31, 2013, pursuant to the terms of the Indenture governing the 2014 Senior Notes, the Company issued a put termination notice to the noteholders.
Pursuant to the Indenture, following the put termination notice, holders of the 2014 Senior Notes were permitted to put such notes to the Company through June
20, 2013. As of July 12, 2013, the last settlement date for noteholders to put the 2014 Senior Notes to the Company, $60,033,000 aggregate principal amount
of the 2014 Senior Notes were put, for which noteholders received 4,128,806 shares of Class A common stock and cash payments totaling $1,088,000 forinterest payable to October 15, 2013 and in lieu of fractional shares.
29

7/29/2019 ForestCityEnterprisesInc 8 Copy
http://slidepdf.com/reader/full/forestcityenterprisesinc-8-copy 32/69
Table of Contents
Item 2. Management’s Discussion and Analysis of Financial Condition and Results of Operations
The following Management’s Discussion and Analysis of Financial Condition and Results of Operations (“MD&A”) of Forest City Enterprises, Inc. and
subsidiaries should be read in conjunction with the financial statements and the footnotes thereto contained in the annual report on Form 10-K for the year
ended January 31, 2013, as amended on Form 10-K/A on April 30, 2013.
RESULTS OF OPERATIONS
Corporate Description
We principally engage in the ownership, development, management and acquisition of commercial and residential real estate and land throughout the United
States. We operate through three strategic business units and have six reportable operating segments. The Commercial Group, our largest strategic business
unit, owns, develops, acquires and operates regional malls, specialty/urban retail centers, office and life science buildings and mixed-use projects.Additionally, it recently constructed and currently operates Barclays Center , a sports and entertainment arena located in Brooklyn, New York. The Arena
which opened in September 2012, is being reported as a separate reportable operating segment. The Residential Group owns, develops, acquires and operates
residential rental properties, including upscale and middle-market apartments and adaptive re-use developments. Additionally, the Residential Group owns
interests in entities that develop and manage military family housing. The Land Development Group acquires and sells both land and developed lots toresidential, commercial and industrial customers. It also owns and develops land into master-planned communities and mixed-use projects.
Corporate Activities and The Nets, a member of the National Basketball Association in which we account for our investment on the equity method of
accounting, are the other reportable operating segments.
We have approximately $10.7 billion of consolidated assets in 26 states and the District of Columbia at July 31, 2013. Our core markets include Boston,Chicago, Dallas, Denver, Los Angeles, New York City, Philadelphia, the Greater San Francisco metropolitan area and the Greater Washington D.Cmetropolitan area. We have offices in Albuquerque, Boston, Dallas, Denver, Los Angeles, New York City, San Francisco, Washington, D.C. and ourcorporate headquarters in Cleveland, Ohio.
Significant milestones occurring during the second quarter of 2013 include:
• The issuance, at par, of $300,000,000 aggregate principal amount of 3.625% Convertible Senior Notes due 2020 (“2020 Senior Notes”). We received
net cash proceeds of $291,250,000 from the offering;
• Exercising the accordion provision of our existing bank revolving credit facility allowing us to increase our total available borrowings from$465,000,000 to $500,000,000. The expansion reflects the addition of Citibank N.A. to the bank group, as well as increased commitments from
KeyBank National Association and PNC Bank, National Association, both of which were already part of the facility;
• Announcing the results of the termination of put rights associated with our 3.625% Puttable Equity-Linked Senior Notes due 2014 (“2014 Senior Notes”). As of July 12, 2013, the final settlement date for the put transactions, $60,033,000 aggregate principal amount of the 2014 Senior Notes were
put to us, for which the holders received 4,128,806 shares of our Class A common stock together with $1,088,000 for interest payable to October 15,
2013. After the transaction, $1,114,000 aggregate principal amount of the 2014 Senior Notes remains outstanding;
• The closing of a strategic capital partnership with AIG Global Real Estate for the development of 3700M (West Village), a 381 unit apartment
community in Dallas, Texas;
• Announcing the signing of an agreement with Queensland Investment Corporation (“QIC”) to form joint ventures investing in regional malls beginning
with eight of our properties. Under the terms of the agreement, we will contribute our current ownership interest in each of the regional malls and the
outside partner will acquire 49% of those interests for cash. Upon closing, which is expected to occur before the end of our fiscal third quarter, we
expect to raise cash liquidity of approximately $330,000,000, after transaction costs;
• Being selected as the master developer for the first phase of Cornell NYC Tech, an innovation campus that will bring together industry and academia in
a way that fuses scientific and academic excellence with real-world applications and entrepreneurship. In addition, we will serve as fee-developer for the
first academic building, open space and related infrastructure planned for the first phase of the campus;
• The sale of Sheraton Station Square, a hotel in Pittsburgh, Pennsylvania, and the Higbee Building , an office building in Cleveland, Ohio, for a sales
price of $61,000,000 and $79,000,000, respectively. These sales generated net cash proceeds of $53,603,000 and are part of our strategy to sell assets
in non-core markets;
• Commencing construction of Winchester Lofts, a 158 unit apartment community in New Haven, Connecticut; and
• Closing $165,619,000 of nonrecourse mortgage financing transactions.
30
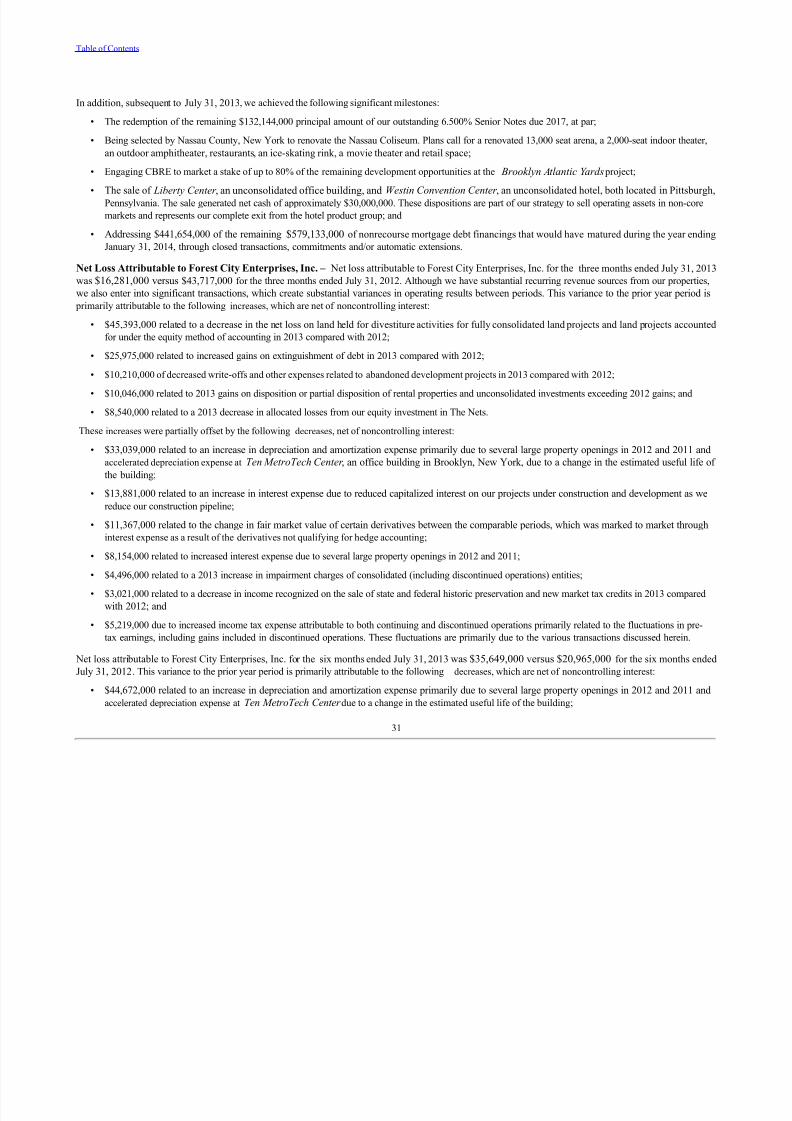
7/29/2019 ForestCityEnterprisesInc 8 Copy
http://slidepdf.com/reader/full/forestcityenterprisesinc-8-copy 33/69
Table of Contents
In addition, subsequent to July 31, 2013, we achieved the following significant milestones:
• The redemption of the remaining $132,144,000 principal amount of our outstanding 6.500% Senior Notes due 2017, at par;
• Being selected by Nassau County, New York to renovate the Nassau Coliseum. Plans call for a renovated 13,000 seat arena, a 2,000-seat indoor theater,
an outdoor amphitheater, restaurants, an ice-skating rink, a movie theater and retail space;
• Engaging CBRE to market a stake of up to 80% of the remaining development opportunities at the Brooklyn Atlantic Yardsproject;
• The sale of Liberty Center , an unconsolidated office building, and Westin Convention Center , an unconsolidated hotel, both located in Pittsburgh,
Pennsylvania. The sale generated net cash of approximately $30,000,000. These dispositions are part of our strategy to sell operating assets in non-core
markets and represents our complete exit from the hotel product group; and
• Addressing $441,654,000 of the remaining $579,133,000 of nonrecourse mortgage debt financings that would have matured during the year ending
January 31, 2014, through closed transactions, commitments and/or automatic extensions.
Net Loss Attributable to Forest City Enterprises, Inc. – Net loss attributable to Forest City Enterprises, Inc. for the three months ended July 31, 2013
was $16,281,000 versus $43,717,000 for the three months ended July 31, 2012. Although we have substantial recurring revenue sources from our properties,
we also enter into significant transactions, which create substantial variances in operating results between periods. This variance to the prior year period is
primarily attributable to the following increases, which are net of noncontrolling interest:
• $45,393,000 related to a decrease in the net loss on land held for divestiture activities for fully consolidated land projects and land projects accounted
for under the equity method of accounting in 2013 compared with 2012;
• $25,975,000 related to increased gains on extinguishment of debt in 2013 compared with 2012;
• $10,210,000 of decreased write-offs and other expenses related to abandoned development projects in 2013 compared with 2012;
• $10,046,000 related to 2013 gains on disposition or partial disposition of rental properties and unconsolidated investments exceeding 2012 gains; and
• $8,540,000 related to a 2013 decrease in allocated losses from our equity investment in The Nets.
These increases were partially offset by the following decreases, net of noncontrolling interest:
• $33,039,000 related to an increase in depreciation and amortization expense primarily due to several large property openings in 2012 and 2011 and
accelerated depreciation expense at Ten MetroTech Center , an office building in Brooklyn, New York, due to a change in the estimated useful life of
the building;
• $13,881,000 related to an increase in interest expense due to reduced capitalized interest on our projects under construction and development as we
reduce our construction pipeline;
• $11,367,000 related to the change in fair market value of certain derivatives between the comparable periods, which was marked to market through
interest expense as a result of the derivatives not qualifying for hedge accounting;
• $8,154,000 related to increased interest expense due to several large property openings in 2012 and 2011;
• $4,496,000 related to a 2013 increase in impairment charges of consolidated (including discontinued operations) entities;
• $3,021,000 related to a decrease in income recognized on the sale of state and federal historic preservation and new market tax credits in 2013 compared
with 2012; and
• $5,219,000 due to increased income tax expense attributable to both continuing and discontinued operations primarily related to the fluctuations in pre-
tax earnings, including gains included in discontinued operations. These fluctuations are primarily due to the various transactions discussed herein.
Net loss attributable to Forest City Enterprises, Inc. for the six months ended July 31, 2013 was $35,649,000 versus $20,965,000 for the six months ended
July 31, 2012. This variance to the prior year period is primarily attributable to the following decreases, which are net of noncontrolling interest:
• $44,672,000 related to an increase in depreciation and amortization expense primarily due to several large property openings in 2012 and 2011 and
accelerated depreciation expense at Ten MetroTech Center due to a change in the estimated useful life of the building;
31

7/29/2019 ForestCityEnterprisesInc 8 Copy
http://slidepdf.com/reader/full/forestcityenterprisesinc-8-copy 34/69
Table of Contents
• $36,484,000 related to the 2012 sale of an approximate 10-acre land parcel and air rights for development of a casino in downtown Cleveland, Ohio;
• $29,619,000 related to an increase in interest expense due to reduced capitalized interest on our projects under construction and development as we
reduce our construction pipeline;
• $17,490,000 related to the change in fair market value of certain derivatives between the comparable periods, which was marked to market through
interest expense as a result of the derivatives not qualifying for hedge accounting;
• $14,117,000 related to increased interest expense due to several large property openings in 2012 and 2011;
• $3,115,000 related to a 2013 increase in impairment charges of consolidated (including discontinued operations) entities; and
• $2,375,000 related to a decrease in income recognized on the sale of state and federal historic preservation and new market tax credits in 2013 compared
with 2012.
These decreases were partially offset by the following increases, net of noncontrolling interest:
• $45,698,000 related to a decrease in the net loss on land held for divestiture activities for fully consolidated land projects and land projects accounted
for under the equity method of accounting in 2013 compared with 2012;
• $21,232,000 related to increased gains on extinguishment of debt in 2013 compared with 2012;
• $16,669,000 related to 2013 gains on disposition or partial disposition of rental properties and unconsolidated investments exceeding 2012 gains;
• $12,517,000 related to a 2013 decrease in allocated losses from our equity investment in The Nets;
• $10,836,000 related to increased commercial outlot land sales in 2013 compared with 2012;• $10,577,000 of decreased write-offs and other expenses related to abandoned development projects in 2013 compared with 2012; and
• $16,790,000 due to decreased income tax expense attributable to both continuing and discontinued operations primarily related to the fluctuations in
pre-tax earnings, including gains included in discontinued operations. These fluctuations are primarily due to the various transactions discussed
herein.
32
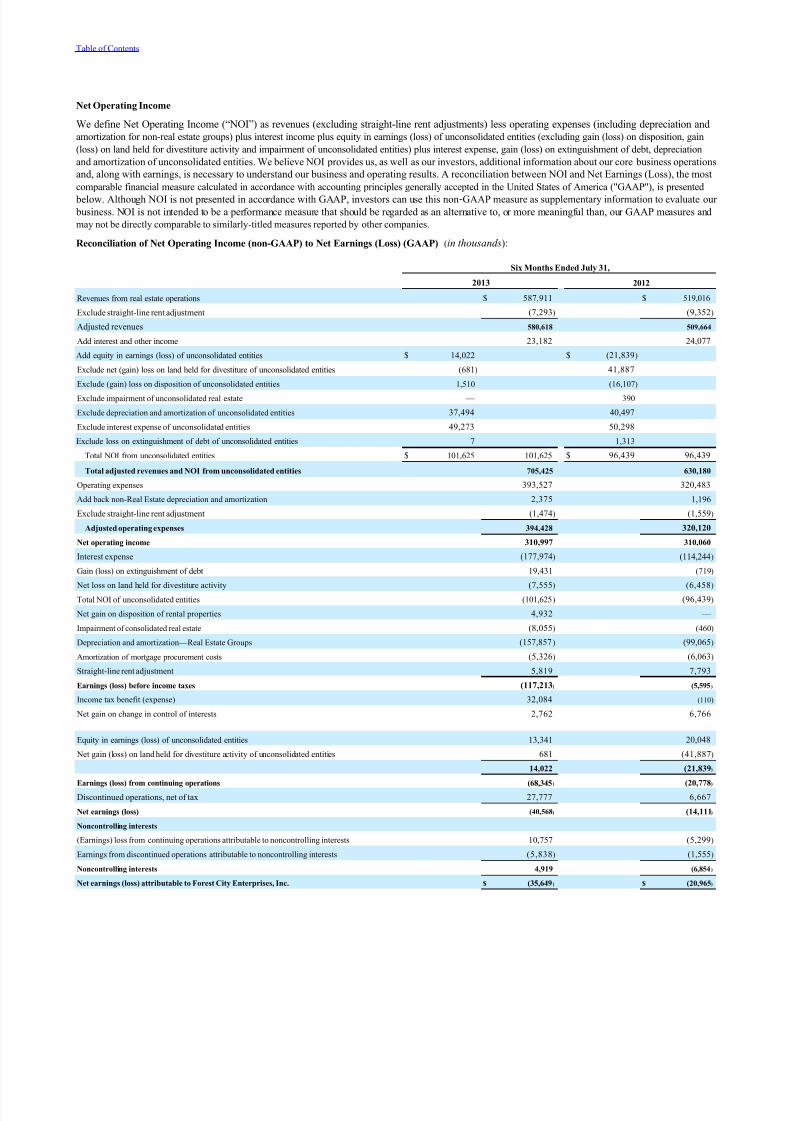
7/29/2019 ForestCityEnterprisesInc 8 Copy
http://slidepdf.com/reader/full/forestcityenterprisesinc-8-copy 35/69
Table of Contents
Net Operating Income
We define Net Operating Income (“NOI”) as revenues (excluding straight-line rent adjustments) less operating expenses (including depreciation andamortization for non-real estate groups) plus interest income plus equity in earnings (loss) of unconsolidated entities (excluding gain (loss) on disposition, gain
(loss) on land held for divestiture activity and impairment of unconsolidated entities) plus interest expense, gain (loss) on extinguishment of debt, depreciation
and amortization of unconsolidated entities. We believe NOI provides us, as well as our investors, additional information about our core business operations
and, along with earnings, is necessary to understand our business and operating results. A reconciliation between NOI and Net Earnings (Loss), the most
comparable financial measure calculated in accordance with accounting principles generally accepted in the United States of America ("GAAP"), is presented
below. Although NOI is not presented in accordance with GAAP, investors can use this non‑GAAP measure as supplementary information to evaluate our
business. NOI is not intended to be a performance measure that should be regarded as an alternative to, or more meaningful than, our GAAP measures and
may not be directly comparable to similarly-titled measures reported by other companies.
Reconciliation of Net Operating Income (non-GAAP) to Net Earnings (Loss) (GAAP) (in thousands):
Six Months Ended July 31,
2013 2012
Revenues from real estate operations $ 587,911 $ 519,016
Exclude straight-line rent adjustment (7,293) (9,352)
Adjusted revenues 580,618 509,664
Add interest and other income 23,182 24,077
Add equity in earnings (loss) of unconsolidated entities $ 14,022 $ (21,839)
Exclude net (gain) loss on land held for divestiture of unconsolidated entities (681) 41,887
Exclude (gain) loss on disposition of unconsolidated entities 1,510 (16,107)
Exclude impairment of unconsolidated real estate — 390
Exclude depreciation and amortization of unconsolidated entities 37,494 40,497
Exclude interest expense of unconsolidated entities 49,273 50,298
Exclude loss on extinguishment of debt of unconsolidated entities 7 1,313
Total NOI from unconsolidated entities $ 101,625 101,625 $ 96,439 96,439
Total adjusted revenues and NOI from unconsolidated entities 705,425 630,180
Operating expenses 393,527 320,483
Add back non-Real Estate depreciation and amortization 2,375 1,196
Exclude straight-line rent adjustment (1,474) (1,559)
Adjusted operating expenses 394,428 320,120
Net operating income 310,997 310,060Interest expense (177,974) (114,244)
Gain (loss) on extinguishment of debt 19,431 (719)
Net loss on land held for divestiture activity (7,555) (6,458)
Total NOI of unconsolidated entities (101,625) (96,439)
Net gain on disposition of rental properties 4,932 —
Impairment of consolidated real estate (8,055) (460)
Depreciation and amortization—Real Estate Groups (157,857) (99,065)
Amortization of mortgage procurement costs (5,326) (6,063)
Straight-line rent adjustment 5,819 7,793
Earnings (loss) before income taxes (117,213) (5,595)
Income tax benefit (expense) 32,084 (110)
Net gain on change in control of interests 2,762 6,766
Equity in earnings (loss) of unconsolidated entities 13,341 20,048
Net gain (loss) on land held for divestiture activity of unconsolidated entities 681 (41,887)
14,022 (21,839)
Earnings (loss) from continuing operations (68,345) (20,778)
Discontinued operations, net of tax 27,777 6,667
Net earnings (loss) (40,568) (14,111)
Noncontrolling interests
(Earnings) loss from continuing operations attributable to noncontrolling interests 10,757 (5,299)
Earnings from discontinued operations attributable to noncontrolling interests (5,838) (1,555)
Noncontrolling interests 4,919 (6,854)
Net earnings (loss) attributable to Forest City Enterprises, Inc. $ (35,649) $ (20,965)

7/29/2019 ForestCityEnterprisesInc 8 Copy
http://slidepdf.com/reader/full/forestcityenterprisesinc-8-copy 36/69
Preferred dividends (185) (7,700)
Net earnings (loss) attributable to Forest City Enterprises, Inc. common shareholders $ (35,834) $ (28,665)
33

7/29/2019 ForestCityEnterprisesInc 8 Copy
http://slidepdf.com/reader/full/forestcityenterprisesinc-8-copy 37/69
Table of Contents
Comparable NOI
In addition to NOI, we use comparable NOI as a metric to evaluate performance of our operating rental property portfolio, specifically for multi-family, office
and retail properties. This measure provides a same-store comparison of operating results of all stabilized properties that are open and operating in both periods
presented. Write-offs of abandoned development projects, non ‑capitalizable development costs and unallocated management and service company overhead,
net of tax credit income, are not directly attributable to an operating property and are considered non-comparable NOI. In addition, certain income and expense
items at the property level, such as lease termination income, real estate tax assessments or rebates and participation payments as a result of refinancing
transactions and NOI impacts of changes in ownership percentages, are removed from comparable NOI and are included in non-comparable NOI. Other
properties and activities such as Arena, hotels, subsidized senior housing, military housing, the Nets, corporate activities and land are not evaluated on asame-store basis and the NOI from these properties and activities are considered non-comparable NOI.
The following is a reconciliation of comparable NOI to total NOI. See the reconciliation of NOI to Net Earnings (Loss), included elsewhere in this Form 10-Q.
Net Operating Income (in thousands)
Six Months Ended July 31, 2013 Six Months Ended July 31, 2012
Full Consolidation Comparable Non-Comparable Total Comparable Non-Comparable Total
Commercial Group
Retail $ 111,292 $ 10,031 $ 121,323 $ 108,801 $ 10,122 $ 118,923
Office 111,203 8,436 119,639 117,751 5,052 122,803
Hotels — 1,391 1,391 — 1,582 1,582
Land Sales — 10,844 10,844 — 36,498 36,498
Other — (22,422) (22,422) — (17,632) (17,632)
Total Commercial Group $ 222,495 $ 8,280 $ 230,775 $ 226,552 $ 35,622 $ 262,174
Arena $ — $ 10,800 $ 10,800 $ — $ (10,509) $ (10,509)
Residential Group
Apartments $ 72,550 $ 6,218 $ 78,768 $ 69,316 $ 2,213 $ 71,529
Subsidized Senior Housing — 7,664 7,664 — 9,111 9,111
Military Housing — 10,377 10,377 — 14,663 14,663
Other — (10,417) (10,417) — (4,284) (4,284)
Total Residential Group $ 72,550 $ 13,842 $ 86,392 $ 69,316 $ 21,703 $ 91,019
Total Rental Properties $ 295,045 $ 32,922 $ 327,967 $ 295,868 $ 46,816 $ 342,684
Land Development Group $ — $ 13,206 $ 13,206 $ — $ 9,469 $ 9,469
The Nets $ — $ (2,713) $ (2,713) $ — $ (15,230) $ (15,230)
Corporate Activities $ — $ (27,463) $ (27,463) $ — $ (26,863) $ (26,863)
Grand Total $ 295,045 $ 15,952 $ 310,997 $ 295,868 $ 14,192 $ 310,060
Six Months Ended July 31,
Comparable NOI 2013 2012 % Change
(in thousands)
Retail Comparable NOI $ 111,292 $ 108,801
NOI attributable to noncontrolling interests (3,348) (3,442)
Subtotal Retail 107,944 105,359 2.5 %
Office Comparable NOI 111,203 117,751
NOI attributable to noncontrolling interests (4,385) (4,294)
Subtotal Office 106,818 113,457 (5.9)% (1)
Apartments Comparable NOI 72,550 69,316
NOI attributable to noncontrolling interests (1,218) (1,284)
Subtotal Apartments 71,332 68,032 4.9 %
Grand Total Comparable NOI $ 286,094 $ 286,848 (0.3)%
(1) Primarily due to decreased occupancy at One Pierrepont Plaza, an office building in Brooklyn, New York.
34

7/29/2019 ForestCityEnterprisesInc 8 Copy
http://slidepdf.com/reader/full/forestcityenterprisesinc-8-copy 38/69
Table of Contents
Net Operating Income by Product TypeFull Consolidation (dollars in thousands)
Six Months Ended July 31, 2013 Six Months Ended July 31, 2012
NOI by Product Type $ 352,894 NOI by Product Type $ 346,512
Hotels 1,391 Hotels 1,582
Non-outlot land sale 8,927 Casino land sale 36,484
Arena 10,800 Arena (10,509)
The Nets (2,713) The Nets (15,230)
Corporate Activities (27,463) Corporate Activities (26,863)
Other (3) (32,839) Other (3) (21,916)
Grand Total NOI $ 310,997 Grand Total NOI $ 310,060
(1) Includes commercial outlot land sales.
(2) Includes limited-distribution subsidized senior housing.
(3) Includes write-offs of abandoned development projects, non-capitalizable development costs and unallocated management and service company overhead, net of tax
credit income.
35
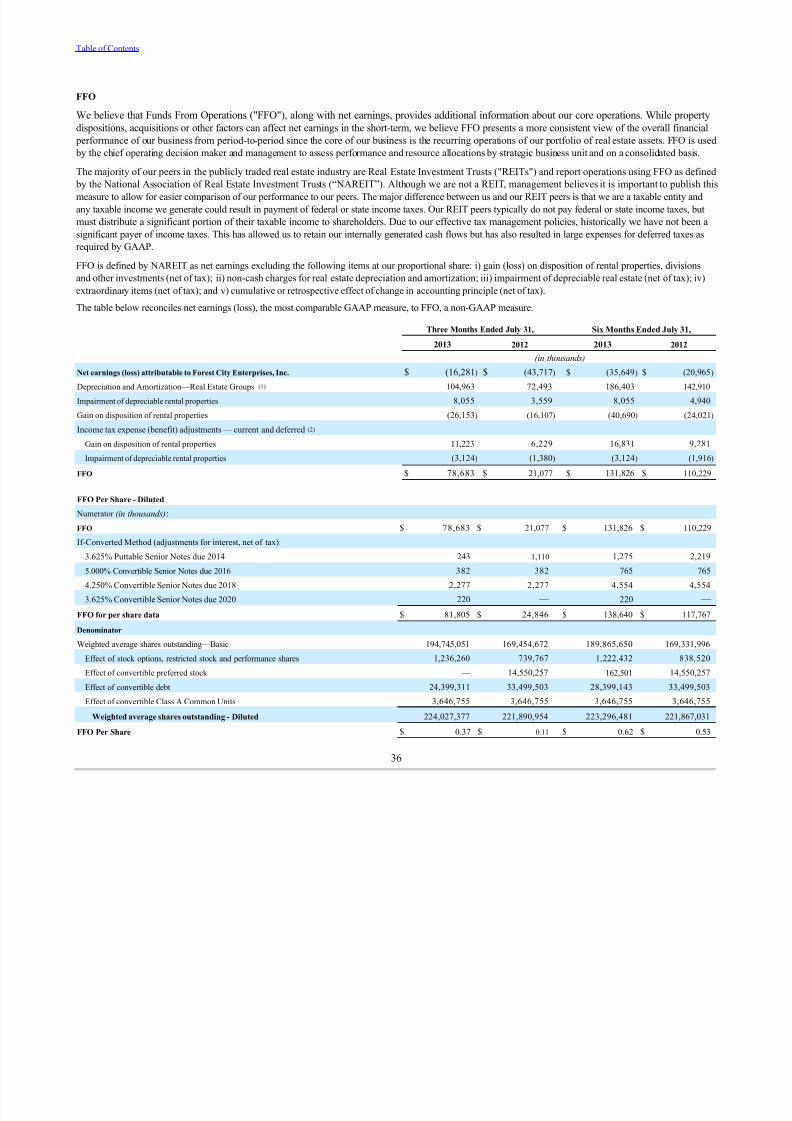
7/29/2019 ForestCityEnterprisesInc 8 Copy
http://slidepdf.com/reader/full/forestcityenterprisesinc-8-copy 39/69
Table of Contents
FFO
We believe that Funds From Operations ("FFO"), along with net earnings, provides additional information about our core operations. While property
dispositions, acquisitions or other factors can affect net earnings in the short-term, we believe FFO presents a more consistent view of the overall financial
performance of our business from period-to-period since the core of our business is the recurring operations of our portfolio of real estate assets. FFO is used
by the chief operating decision maker and management to assess performance and resource allocations by strategic business unit and on a consolidated basis.
The majority of our peers in the publicly traded real estate industry are Real Estate Investment Trusts ("REITs") and report operations using FFO as defined
by the National Association of Real Estate Investment Trusts (“NAREIT”). Although we are not a REIT, management believes it is important to publish thismeasure to allow for easier comparison of our performance to our peers. The major difference between us and our REIT peers is that we are a taxable entity and
any taxable income we generate could result in payment of federal or state income taxes. Our REIT peers typically do not pay federal or state income taxes, but
must distribute a significant portion of their taxable income to shareholders. Due to our effective tax management policies, historically we have not been a
significant payer of income taxes. This has allowed us to retain our internally generated cash flows but has also resulted in large expenses for deferred taxes as
required by GAAP.
FFO is defined by NAREIT as net earnings excluding the following items at our proportional share: i) gain (loss) on disposition of rental properties, divisions
and other investments (net of tax); ii) non-cash charges for real estate depreciation and amortization; iii) impairment of depreciable real estate (net of tax); iv)
extraordinary items (net of tax); and v) cumulative or retrospective effect of change in accounting principle (net of tax).
The table below reconciles net earnings (loss), the most comparable GAAP measure, to FFO, a non-GAAP measure.
Three Months Ended July 31, Six Months Ended July 31,
2013 2012 2013 2012
(in thousands)
Net earnings (loss) attributable to Forest City Enterprises, Inc. $ (16,281) $ (43,717) $ (35,649) $ (20,965)
Depreciation and Amortization—Real Estate Groups (1) 104,963 72,493 186,403 142,910
Impairment of depreciable rental properties 8,055 3,559 8,055 4,940
Gain on disposition of rental properties (26,153) (16,107) (40,690) (24,021)
Income tax expense (benefit) adjustments — current and deferred (2)
Gain on disposition of rental properties 11,223 6,229 16,831 9,281
Impairment of depreciable rental properties (3,124) (1,380) (3,124) (1,916)
FFO $ 78,683 $ 21,077 $ 131,826 $ 110,229
FFO Per Share - Diluted
Numerator (in thousands):
FFO $ 78,683 $ 21,077 $ 131,826 $ 110,229
If-Converted Method (adjustments for interest, net of tax): 3.625% Puttable Senior Notes due 2014 243 1,110 1,275 2,219
5.000% Convertible Senior Notes due 2016 382 382 765 765
4.250% Convertible Senior Notes due 2018 2,277 2,277 4,554 4,554
3.625% Convertible Senior Notes due 2020 220 — 220 —
FFO for per share data $ 81,805 $ 24,846 $ 138,640 $ 117,767
Denominator
Weighted average shares outstanding—Basic 194,745,051 169,454,672 189,865,650 169,331,996
Effect of stock options, restricted stock and performance shares 1,236,260 739,767 1,222,432 838,520
Effect of convertible preferred stock — 14,550,257 162,501 14,550,257
Effect of convertible debt 24,399,311 33,499,503 28,399,143 33,499,503
Effect of convertible Class A Common Units 3,646,755 3,646,755 3,646,755 3,646,755
Weighted average shares outstanding - Diluted 224,027,377 221,890,954 223,296,481 221,867,031
FFO Per Share $ 0.37 $ 0.11 $ 0.62 $ 0.53
36
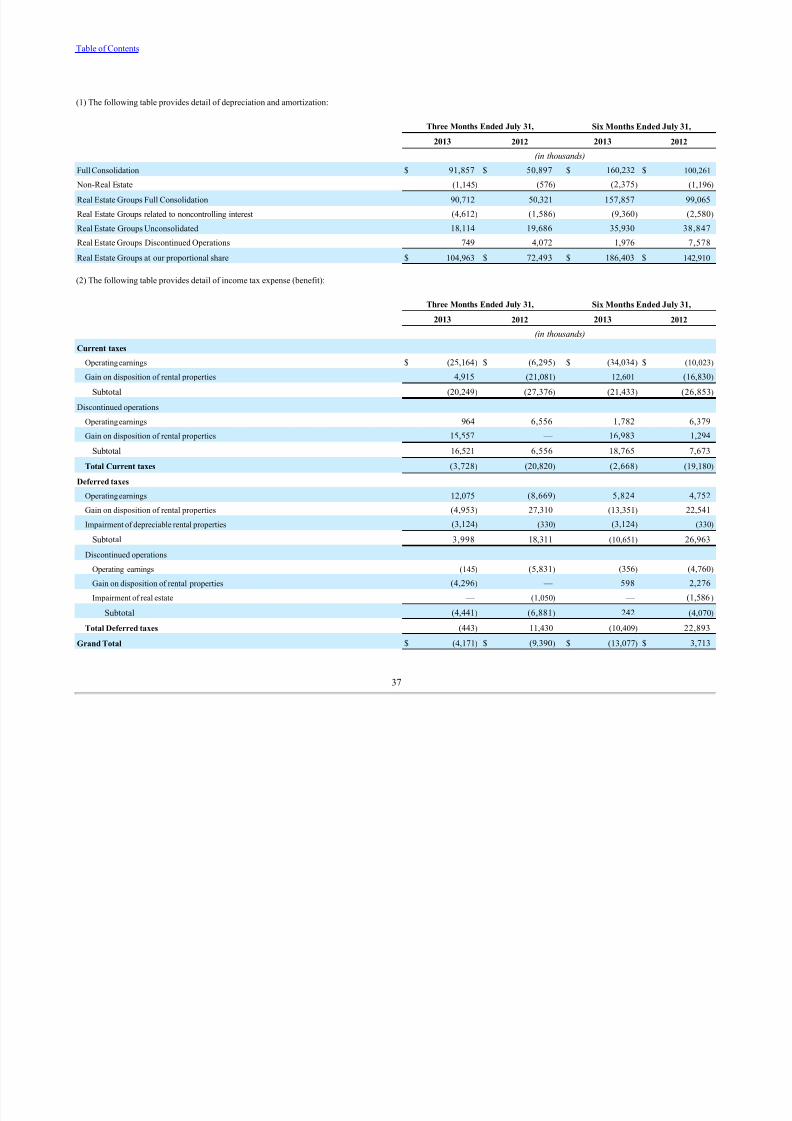
7/29/2019 ForestCityEnterprisesInc 8 Copy
http://slidepdf.com/reader/full/forestcityenterprisesinc-8-copy 40/69
Table of Contents
(1) The following table provides detail of depreciation and amortization:
Three Months Ended July 31, Six Months Ended July 31,
2013 2012 2013 2012
(in thousands)
Full Consolidation $ 91,857 $ 50,897 $ 160,232 $ 100,261
Non-Real Estate (1,145) (576) (2,375) (1,196)
Real Estate Groups Full Consolidation 90,712 50,321 157,857 99,065
Real Estate Groups related to noncontrolling interest (4,612) (1,586) (9,360) (2,580)
Real Estate Groups Unconsolidated 18,114 19,686 35,930 38,847
Real Estate Groups Discontinued Operations 749 4,072 1,976 7,578
Real Estate Groups at our proportional share $ 104,963 $ 72,493 $ 186,403 $ 142,910
(2) The following table provides detail of income tax expense (benefit):
Three Months Ended July 31, Six Months Ended July 31,
2013 2012 2013 2012
(in thousands)
Current taxes
Operating earnings $ (25,164) $ (6,295) $ (34,034) $ (10,023)
Gain on disposition of rental properties 4,915 (21,081) 12,601 (16,830)
Subtotal (20,249) (27,376) (21,433) (26,853)
Discontinued operations
Operating earnings 964 6,556 1,782 6,379
Gain on disposition of rental properties 15,557 — 16,983 1,294
Subtotal 16,521 6,556 18,765 7,673
Total Current taxes (3,728) (20,820) (2,668) (19,180)
Deferred taxes
Operating earnings 12,075 (8,669) 5,824 4,752
Gain on disposition of rental properties (4,953) 27,310 (13,351) 22,541
Impairment of depreciable rental properties (3,124) (330) (3,124) (330)
Subtotal 3,998 18,311
(10,651) 26,963
Discontinued operations
Operating earnings (145) (5,831) (356) (4,760)
Gain on disposition of rental properties (4,296) — 598 2,276
Impairment of real estate — (1,050) — (1,586 )
Subtotal (4,441) (6,881) 242 (4,070)
Total Deferred taxes (443) 11,430 (10,409) 22,893
Grand Total $ (4,171) $ (9,390) $ (13,077) $ 3,713
37

7/29/2019 ForestCityEnterprisesInc 8 Copy
http://slidepdf.com/reader/full/forestcityenterprisesinc-8-copy 41/69
Table of Contents
Summary of Segment Operating Results – The following tables present a summary of revenues from real estate operations, operating expenses, interest
expense, and equity in earnings (loss) by segment. See discussion of these amounts by segment in the narratives following the tables.
Three Months Ended July 31, Six Months Ended July 31,
2013 2012 Variance 2013 2012 Variance
(in thousands)
Revenues from Real Estate Operations
Commercial Group $ 183,437 $ 165,348 $ 18,089 $ 355,565 $ 328,697 $ 26,868
Commercial Group Land Sales 791 49 742 26,391 40,049 (13,658)
Residential Group 63,545 63,679 (134) 127,342 125,304 2,038
Arena 21,587 210 21,377 50,284 326 49,958
Land Development Group 22,402 12,484 9,918 28,329 24,640 3,689
The Nets — — — — — —
Corporate Activities — — — — — —
Total Revenues from Real Estate Operations $ 291,762 $ 241,770 $ 49,992 $ 587,911 $ 519,016 $ 68,895
Operating Expenses
Commercial Group $ 99,104 $ 90,767 $ 8,337 $ 194,265 $ 172,283 $ 21,982
Cost of Commercial Group Land Sales 184 50 134 15,547 3,566 11,981
Residential Group 48,200 41,432 6,768 96,740 84,575 12,165
Arena 15,533 6,469 9,064 39,484 10,757 28,727
Land Development Group 15,692 11,271 4,421 21,385 22,948 (1,563)
The Nets — — — — — —
Corporate Activities 12,691 13,623 (932) 26,106 26,354 (248)
Total Operating Expenses $ 191,404 $ 163,612 $ 27,792 $ 393,527 $ 320,483 $ 73,044
Interest Expense
Commercial Group $ 53,920 $ 42,676 $ 11,244 $ 106,755 $ 82,677 $ 24,078
Residential Group 13,913 4,568 9,345 22,659 8,238 14,421
Arena 9,349 (4,607) 13,956 18,362 (8,734) 27,096
Land Development Group (178) 2,475 (2,653) (280) 4,226 (4,506)
The Nets — — — — — —
Corporate Activities 14,719 14,242 477 30,478 27,837 2,641
Total Interest Expense $ 91,723 $ 59,354 $ 32,369 $ 177,974 $ 114,244 $ 63,730
Equity in Earnings (Loss)
Commercial Group $ 3,316 $ 6,073 $ (2,757) $ 9,147 $ 12,471 $ (3,324)
Gain (loss) on disposition of Commercial Group unconsolidated entities — 16,107 (16,107) (1,510) 16,107 (17,617)
Residential Group 3,919 80 3,839 8,625 4,250 4,375
Arena — — — — — —
Land Development Group (12) 2,677 (2,689) (208) 2,840 (3,048)
The Nets 268 (8,272) 8,540 (2,713) (15,230) 12,517
Corporate Activities — — — — — —
Total Equity in Earnings (Loss) $ 7,491 $ 16,665 $ (9,174) $ 13,341 $ 20,438 $ (7,097)
Commercial Group
Revenues from real estate operations —Revenues from real estate operations for the Commercial Group, including the group’s land sales, increased by
$18,831,000 , or 11.4%, for the three months ended July 31, 2013 compared with the same period in the prior year. The variance is primarily attributable tothe following increases:
• $6,797,000 due to an increase in tenant reimbursable revenue that is also included in operating expenses at multiple properties in the New York
metropolitan area;
• $5,530,000 due to 2013 lease termination fee income at One MetroTech Center , an office building in Brooklyn, New York;
• $3,594,000 related to new property openings as noted in the table below; and
• $3,026,000 related to third party management and consulting fee income.
These increases were partially offset by the following decrease:
• $3,618,000 primarily related to decreased occupancy at Ten MetroTech Center,which is anticipated to be demolished in September 2013, and One
Pierrepont Plaza.

7/29/2019 ForestCityEnterprisesInc 8 Copy
http://slidepdf.com/reader/full/forestcityenterprisesinc-8-copy 42/69
38
7/29/2019 ForestCityEnterprisesInc 8 Copy
http://slidepdf.com/reader/full/forestcityenterprisesinc-8-copy 43/69
Table of Contents
Revenues from real estate operations for the Commercial Group, including the group’s land sales, increased by $13,210,000, or 3.6%, for the six monthsended July 31, 2013 compared with the same period in the prior year. The variance is primarily attributable to the following increases:
• $26,342,000 related to increases in commercial outlot land sales primarily at an undeveloped project in Brooklyn, New York and Orchard Town
Center , a regional mall in Westminster, Colorado;
• $10,134,000 due to an increase in tenant reimbursable revenue that is also included in operating expenses at multiple properties in the New York
metropolitan area;• $8,343,000 related to new property openings as noted in the table below;
• $5,577,000 related to third party management and consulting fee income;
• $5,530,000 due to 2013 lease termination fee income at One Metrotech Center ; and
• $2,095,000 related to the change from the equity method of accounting to full consolidation due to the acquisition of a partner's interest in three office
buildings in Albuquerque, New Mexico in July 2012.
These increases were partially offset by the following decreases:
• $40,000,000 related to the 2012 sale of an approximate 10-acre land parcel and air rights for development of a casino in downtown Cleveland, Ohio;
and
• $8,589,000 primarily related to decreased occupancy at Ten MetroTech Center and One Pierrepont Plaza.
Operating and Interest Expenses —Operating expenses increased by $8,471,000, or 9.3%, for the three months ended July 31, 2013 compared with the
same period in the prior year. The variance is primarily attributable to the following increases:
• $6,562,000 due to an increase in tenant reimbursable expenses that is also included in revenues from real estate operations at multiple properties in the
New York metropolitan area;
• $2,003,000 related to new property openings as noted in the table below;
• $1,250,000 related to the change from the equity method of accounting to full consolidation due to the acquisition of a partner's interest in three office
buildings in Albuquerque, New Mexico in July 2012; and
• $1,150,000 related to increased real estate tax expense at New York Timesdue to a decrease in tax abatements.
These increases were partially offset by the following decrease:
• $12,489,000 related to decreased write-offs of abandoned development projects in 2013 compared with 2012.
The remainder of the increase is primarily due to more development costs being expensed in 2013 compared with 2012 due to the reduced amount of our
projects under active development in addition to other miscellaneous fluctuations at our mature properties, including general operating activities.
Operating expenses increased by $33,963,000 , or 19.3%, for the six months ended July 31, 2013 compared with the same period in the prior year. Thevariance is primarily attributable to the following increases:
• $15,497,000 related to increases in commercial outlot land sales primarily at an undeveloped project in Brooklyn, New York and Orchard Town
Center ;
• $10,229,000 due to an increase in tenant reimbursable expenses that is also included in revenues from real estate operations at multiple properties in the
New York metropolitan area;
• $2,576,000 related to new property openings as noted in the table below;
• $2,478,000 related to increased real estate tax expense at New York Timesdue to a decrease in tax abatements; and
• $1,588,000 related to the change from the equity method of accounting to full consolidation due to the acquisition of a partner's interest in three office
buildings in Albuquerque, New Mexico in July 2012.
These increases were partially offset by the following decreases:
• $12,815,000 related to decreased write-offs of abandoned development projects in 2013 compared with 2012; and
• $3,516,000 related to the 2012 sale of an approximate 10-acre land parcel and air rights for development of a casino in downtown Cleveland, Ohio.
39
7/29/2019 ForestCityEnterprisesInc 8 Copy
http://slidepdf.com/reader/full/forestcityenterprisesinc-8-copy 44/69
Table of Contents
The remainder of the increase is primarily due to more development costs being expensed in 2013 compared with 2012 due to the reduced amount of our
projects under active development in addition to other miscellaneous fluctuations at our mature properties, including general operating activities.
Interest expense for the Commercial Group increased by $11,244,000, or 26.3%, for the three months ended July 31, 2013 and increased by $24,078,000, or29.1%, for the six months ended July 31, 2013 compared with the same periods in the prior year. The increases are primarily attributable to the opening of
new properties, as noted in the table below, and a reduction of capitalized interest on certain development projects.
The following table presents the increases in revenues, operating expenses and interest expense for newly-opened properties for the three and six months endedJuly 31, 2013 compared with the same periods in the prior year:
Variances Related to
Three Months Ended Six Months Ended
July 31, 2013 vs. 2012 July 31, 2013 vs. 2012
Newly-Opened Properties Location
Quarter-Year
Opened Square feet
Revenues from
Real Estate
Operations
Operating
Expenses Interest Expense
Revenues from
Real Estate
Operations
Operating
Expenses Interest Expense
(in thousands)
Retail Centers:
Westchester's Ridge Hill Yonkers, New York Q2-2011/12 1,336,000 $ 2,892 $ 1,675 $ 3,854 $ 6,875 $ 2,013 $ 9,537
The Yards - Boilermaker Shops Washington, D.C. Q4-12 39,000 70 103 120 109 230 248
Other:
Johns Hopkins Parking Garage Baltimore, Maryland Q4-12 492,000 632 225 38 1,359 333 76
Total $ 3,594 $ 2,003 $ 4,012 $ 8,343 $ 2,576 $ 9,861
Comparable occupancy for the Commercial Group is 92.1% and 92.8% for retail and office, respectively, as of July 31, 2013 compared with 91.9% and92.3%, respectively, as of July 31, 2012. Retail and office occupancy as of July 31, 2013 and July 31, 2012 is based on square feet leased at the end of the
fiscal quarter. Comparable occupancy relates to stabilized properties opened and operated in both the six months ended July 31, 2013 and 2012 .
As of July 31, 2013, the average base rent per square feet expiring for retail and office leases is $39.04 and $40.13, respectively. Square feet of expiring leases
and average base rent per square feet are operating statistics that represent 100% of the square footage and base rental income per square foot from expiring
leases.
We monitor retail and office leases expiring in the short to mid-term. Management’s plan to obtain lease renewals for expiring retail and office leases includes
signing of lease extensions, if available, and active marketing for available or soon to be available space to new or existing tenants in the normal course of
business.
Retail Centers
The following tables represent those new leases and gross leasable area (“GLA”) signed on the same space in which there was a former tenant and existingtenant renewals:
Regional Malls
Quarter
Number
of Leases
Signed
GLA
Signed
Contractual
Rent Per
Square Foot (1)(2)
Prior Rent Per
Square Foot (1)(2)
Cash Basis %
Change over
Prior Rent
3rd Quarter 2012 37 128,204 $ 46.09 $ 40.19 14.7%
4th Quarter 2012 23 63,551 $ 55.17 $ 49.44 11.6%
1st Quarter 2013 38 115,625 $ 54.92 $ 46.15 19.0%
2nd Quarter 2013 26 70,059 $ 61.19 $ 52.67 16.2%
Total 124 377,439 $ 53.13 $ 45.88 15.8%
Specialty Retail Centers
Quarter
Number of Leases
Signed
GLA
Signed
ContractualRent Per
Square Foot (1)(2)
Prior Rent Per
Square Foot (1)(2)
Cash Basis %Change over
Prior Rent
3rd Quarter 2012 5 37,129 $ 30.61 $ 31.00 (1.3)%
4th Quarter 2012 4 7,281 $ 43.90 $ 48.20 (8.9)%
1st Quarter 2013 9 51,398 $ 42.58 $ 35.44 20.1 %
2nd Quarter 2013 3 46,194 $ 42.03 $ 42.12 (0.2)%
Total 21 142,002 $ 39.34 $ 37.11 6.0 %
40
7/29/2019 ForestCityEnterprisesInc 8 Copy
http://slidepdf.com/reader/full/forestcityenterprisesinc-8-copy 45/69
Table of Contents
Office Buildings
The following table represents all new leases compared with terms of all expired leases in our office portfolio over the past 12 months. Changes in rent per
square foot between all new and all expired leases are influenced by various factors, including but not limited to non-comparable markets, non-comparable
buildings and varying quality of space within those buildings. Depending on the mix of new and expired leases, the percentage change in rent per square foot will
vary accordingly.
Office Buildings
Quarter
Number
of Leases
Signed
Number
of Leases
Expired
GLA
Signed
GLA
Expired
Contractual
Rent Per
Square Foot (1)(2)
Expiring Rent Per
Square Foot (1)(2)
Cash Basis %
Change over
Prior Rent
3rd Quarter 2012 30 35 195,197 195,523 $ 42.76 $ 41.15 3.9%
4th Quarter 2012 17 27 76,889 124,062 $ 26.10 $ 24.62 6.0%
1st Quarter 2013 32 31 417,154 530,109 $ 52.33 $ 44.37 17.9%
2nd Quarter 2013 26 21 343,641 140,287 $ 33.90 $ 30.15 12.4%
Total 105 114 1,032,881 989,981 $ 42.44 $ 39.24 8.2%
Office Buildings by Product in Core and Non-Core Markets
Number
of Leases
Signed
Number
of Leases
Expired GLA Signed GLA Expired
Contractual
Rent Per
Square Foot (1)(2)
Expiring Rent Per
Square Foot (1)(2)
Cash Basis %
Change over Prior
Rent
Products:
Life Science Office 14 15 335,711 294,853 $ 63.33 $ 56.49 12.1 %
Other Office 64 49 581,212 480,703 $ 34.66 $ 37.38 (7.3)%
Total Office in Core Markets 78 64 916,923 775,556 $ 45.15 $ 44.64 1.1 %
Office in Non-Core Markets 27 50 115,958 214,425 $ 20.96 $ 19.45 7.8 %
Total 105 114 1,032,881 989,981 $ 42.44 $ 39.24 8.2 %
(1) Retail and Office contractual rent per square foot includes base rent and fixed additional charges for common area maintenance and real estate taxes. Retail contractual rent per
square foot also includes fixed additional marketing/promotional charges.
(2) For all new leases, contractual rent per square foot is the new base rent as of rental commencement. For all expiring leases, contractual rent per square foot is the base rent at the
time of expiration, plus any applicable escalations.
Comparable NOI is an operating statistic defined as NOI from stabilized properties opened and operated in all periods presented net of noncontrolling interests.
Comparable NOI is useful because it measures the performance of the same properties on a period-to-period basis and is used to assess operating performance
and resource allocation of the operating properties within our strategic business units. While property dispositions, acquisitions or other factors can impact net
earnings in the short term, we believe comparable NOI gives a more consistent view of the overall performance of our operating portfolio from quarter-to-quarter and year-to-year. The percentage change of comparable NOI over the same period in the prior year is as follows:
Three Months Ended July 31, Six Months Ended July 31,
2013 2012 2013 2012
Retail 3.5% 1.3% 2.5% 1.9%
Office (1) (4.7)% 5.4% (5.9)% 4.7%
(1) Primarily due to decreased occupancy at One Pierrepont Plaza.
esidential Group
Revenues from real estate operations— Included in revenues from real estate operations is fee income related to the development and constructionmanagement related to our military housing projects. Military housing fee income and related operating expenses may vary significantly from period to period
based on the timing of development and construction activity at each applicable project. Revenues from real estate operations for the Residential Group
decreased by $134,000, or 0.2%, during the three months ended July 31, 2013 compared with the same period in the prior year. The variance is primarilyattributable to the following decreases:
• $2,619,000 related to third party management fees and other income; and
• $1,458,000 related to military housing fee income from the management and development of units in our military housing portfolio.
41

7/29/2019 ForestCityEnterprisesInc 8 Copy
http://slidepdf.com/reader/full/forestcityenterprisesinc-8-copy 46/69
Table of Contents
These decreases were partially offset by the following increases:
• $2,244,000 related to the change from equity method to full consolidation method of accounting for Uptown Apartments, an apartment community in
Oakland, California, upon acquisition of our partner's ownership interest; and
• $891,000 related to new property openings as noted in the table below.
Revenues from real estate operations for the Residential Group increased by $2,038,000, or 1.6%, during the six months ended July 31, 2013 compared with
the same period in the prior year. The variance is primarily attributable to the following increases:
• $2,244,000 related to the change from equity method to full consolidation method of accounting for Uptown Apartments; and
• $2,085,000 related to new property openings as noted in the table below.
These increases were partially offset by the following decreases:
• $3,081,000 related to military housing fee income from the management and development of units in our military housing portfolio; and
• $1,129,000 related to third party management fees and other income.
Operating and Interest Expenses— Operating expenses for the Residential Group increased by $6,768,000, or 16.3%, during the three months ended
July 31, 2013 compared with the same period in the prior year. This variance is primarily attributable to the following increases:
• $2,226,000 related to increased write-offs of project costs and other expenses related to abandoned development projects in 2013 compared with 2012;
and
• $630,000 related to new property openings as noted in the table below.The remainder of the increase is primarily due to more development costs being expensed in 2013 compared with 2012 due to the reduced amount of our
projects under active development, the change from equity method to full consolidation method of accounting for Uptown Apartments, managemen
expenditures associated with military housing fee revenues and miscellaneous fluctuations at our mature properties, including general operating activities,
partially offset by decreased expenditures associated with third party management and consulting fee arrangements.
Operating expenses for the Residential Group increased by $12,165,000, or 14.4%, during the six months ended July 31, 2013 compared with the same period
in the prior year. This variance is primarily attributable to the following increases:
• $2,189,000 related to increased write-offs of project costs and other expenses related to abandoned development projects in 2013 compared with 2012;
• $1,024,000 related to management expenditures associated with military housing fee revenues; and
• $822,000 related to new property openings as noted in the table below.
The remainder of the increase is primarily due to more development costs being expensed in 2013 compared with 2012 due to the reduced amount of our
projects under active development, the change from equity method to full consolidation method of accounting for Uptown Apartments and miscellaneous
fluctuations at our mature properties, including general operating activities, partially offset by decreased expenditures associated with third party managementand consulting fee arrangements.
Interest expense for the Residential Group increased by $9,345,000, or 204.6%, during the three months ended July 31, 2013 and by $14,421,000, or175.1%, during the six months ended July 31, 2013 compared with the same periods in the prior year. The increases are primarily a result of mark-to-market
adjustments on non-designated interest rate swaps.
42
7/29/2019 ForestCityEnterprisesInc 8 Copy
http://slidepdf.com/reader/full/forestcityenterprisesinc-8-copy 47/69
Table of Contents
The following table presents the increases (decreases) in revenues and operating expenses for newly-opened properties for the three and six months ended
July 31, 2013 compared with the same periods in the prior year:
Variances Related to
Three Months Ended Six Months Ended
July 31, 2013 vs. 2012 July 31, 2013 vs. 2012
Newly-Opened Properties Location Quarter-Year Opened Units
Revenues from Real
Estate Operations Operating Expenses
Revenues fromReal Estate
Operations
Operating
Expenses
(in thousands)
Continental Building Dallas, Texas Q1-2013 203 $ 96 $ 364 $ 109 $ 498
Botanica Eastbridge Denver, Colorado Q3-2012 118 382 163 615 343
Aster Town Center Denver, Colorado Q1-2012/Q2-2012 85 253 55 561 109
Foundry Lofts Washington, D.C. Q4-2011 170 160 48 800 (128)
Total $ 891 $ 630 $ 2,085 $ 822
Comparable average occupancy for the Residential Group is 94.7% and 94.4% for the six months ended July 31, 2013 and 2012 , respectively. Economic
residential occupancy for the six months ended July 31, 2013 and 2012 is calculated by dividing gross potential rent less vacancy by gross potential rent.Gross potential rent (“GPR”) is calculated based on actual rents per lease agreements for occupied apartment units and at market rents for vacant apartment
units. Market rental rates are determined using a variety of factors which include availability of specific apartment unit types (one bedroom, two bedroom,
etc.), seasonality factors and rents offered by competitive properties for similar apartment types in the same geographic market. Comparable average
occupancy relates to properties opened and operated in both the six months ended July 31, 2013 and 2012 .
The percentage change of comparable NOI over the same period in the prior year is as follows:
Three Months Ended July 31, Six Months Ended July 31,
2013 2012 2013 2012
Residential 7.1% 10.3% 4.9% 10.3%
The following tables present leasing information of our Apartment Communities for the various periods presented. Prior period amounts may differ from data
as reported in previous quarters because the properties that qualify as comparable change from period to period.
Quarterly Comparison Monthly Average Residential Rental Rates (2) Average Residential Occupancy
Leasable
Units at Pro-
Rata %(3)
Three Months Ended July 31,
Quarter-to-Date
July 31,
Comparable Apartment Communities (1) 2013 2012 % Change 2013 2012 % Change
Core Markets 8,041 $ 1,689 $ 1,620 4.3% 95.2% 95.2% —
Non-Core Markets 9,252 $ 957 $ 928 3.1% 94.5% 93.8% 0.7%
Total Comparable Apartments 17,293 $ 1,296 $ 1,249 3.8% 95.0% 94.6% 0.4%
Year-to-Date Comparison Monthly Average Residential Rental Rates (2) Economic Residential Occupancy
Leasable
Units at Pro-
Rata %(3)
Six Months Ended July 31,
Year-to-Date
July 31,
Comparable Apartment Communities (1) 2013 2012 % Change 2013 2012 % Change
Core Markets 8,041 $ 1,681 $ 1,605 4.7% 95.0% 95.2% (0.2)%
Non-Core Markets 9,252 $ 952 $ 926 2.8% 94.2% 93.3% 0.9%
Total Comparable Apartments 17,293 $ 1,290 $ 1,241 3.9% 94.7% 94.4% 0.3%
Sequential Quarter Comparison Monthly Average Residential Rental Rates (2) Economic Residential Occupancy
Leasable
Units at Pro-
Rata %(3)
Three Months Ended Quarter-to-Date
Comparable Apartment Communities (1) July 31, 2013 April 30, 2013 % Change July 31, 2013 April 30, 2013 % Change
Core Markets 8,522 $ 1,774 $ 1,760 0.8% 95.3% 94.7% 0.6%
Non-Core Markets 9,252 $ 957 $ 948 0.9% 94.5% 93.9% 0.6%
Total Comparable Apartments 17,774 $ 1,348 $ 1,337 0.8% 95.0% 94.4% 0.6%
(1) Includes stabilized apartment communities completely opened and operated in the periods presented. These apartment communities include units leased at affordable apartment rates
which provide a discount from average market rental rates. For the three months ended July 31, 2013, 19.3% of leasable units in core markets and 3.5% of leasable units in non-
core markets were affordable housing units. Excludes all military and limited-distribution subsidized senior housing units.
(2) Represents GPR less concessions.
(3) Leasable units at pro-rata represent our share of total leasable units at the apartment community.
43

7/29/2019 ForestCityEnterprisesInc 8 Copy
http://slidepdf.com/reader/full/forestcityenterprisesinc-8-copy 48/69
Table of Contents
Arena
Revenues from Real Estate Operations – Revenues from real estate operations for the Arena increased by $21,377,000 for the three months ended
July 31, 2013 and by $49,958,000 for the six months ended July 31, 2013 compared with the same periods in the prior year. These increases are attributable
to the grand opening of the Arena, which occurred on September 28, 2012.
Operating and Interest Expenses – Operating expenses for the Arena increased by $9,064,000 for the three months ended July 31, 2013 and by
$28,727,000 for the six months ended July 31, 2013 compared with the same periods in the prior year. These increases are attributable to the grand opening of
the Arena.
Interest expense for the Arena increased by $13,956,000 for the three months ended July 31, 2013 and by $27,096,000 for the six months endedJuly 31, 2013 compared with the same periods in the prior year. These increases are due to the cessation of capitalized interest upon the completion of construction and the grand opening of the Arena.
Land Development Group
Activity reported in the Land Development Group in 2013 solely relates to our Stapleton project in Denver, Colorado. The Stapleton project is one of thenation's largest urban redevelopments and is a true mixed-use project with substantial future entitlements, including apartments, retail and office space as well
as single family neighborhoods, where we sell residential lots to builders. We control the future development opportunity at Stapleton through an option
agreement that requires us to maintain an ownership position. This requirement together with the continued strong performance at Stapleton will allow us to
maximize the potential of this project as a great example of a sustainable urban redevelopment focused on walkable neighborhoods, abundant amenities and
open space. Land development, infrastructure, financing and residential and commercial land sales at Stapleton are reported in the Land Development Group
segment. Apartments, office and retail we develop at Stapleton are included in the Residential Group or Commercial Group depending on product type.
Revenues from real estate operations— Revenues from real estate operations for the Land Development Group increased by $9,918,000 and $3,689,000for the three and six months ended July 31, 2013 compared with the same periods in the prior year. These variances are primarily attributable to increased land
sales at Stapleton.
Operating and Interest Expenses— Operating expenses for the Land Development Group increased by $4,421,000 for the three months ended July 31, 2013
and decreased by $1,563,000 for the six months ended July 31, 2013 compared with the same periods in the prior year. These variances are primarilyattributable to increased land sales at Stapleton.
Interest expense for the Land Development Group decreased by $2,653,000 and $4,506,000 during the three and six months ended July 31, 2013 compared
with the same periods in the prior year. The decreases were primarily due to reduced interest allocations from the Corporate Activities segment.
Net Loss on Land Held for Divestiture Activity
The following table summarizes the net loss on land held for divestiture activities of consolidated entities:
Three Months Ended July 31, Six Months Ended July 31, 2013 2012 2013 2012
(in thousands)
Sales of land held for divestiture $ 1,056 $ 34,510 $ 1,768 $ 34,510
Cost of sales of land held for divestiture (63) (25,172) (323) (25,172)
Net gain on closed transactions of land held for divestiture 993 9,338 1,445 9,338
Bad debt expense (9,000) — (9,000) —
Impairment of land held for divestiture — (15,796) — (15,796)
Net loss on land held for divestiture activity $ (8,007) $ (6,458) $ (7,555) $ (6,458)
See Note I – Land Held for Divestiture in the Notes to Consolidated Financial Statements in Item 1 of this Form 10-Q for detailed information.
44
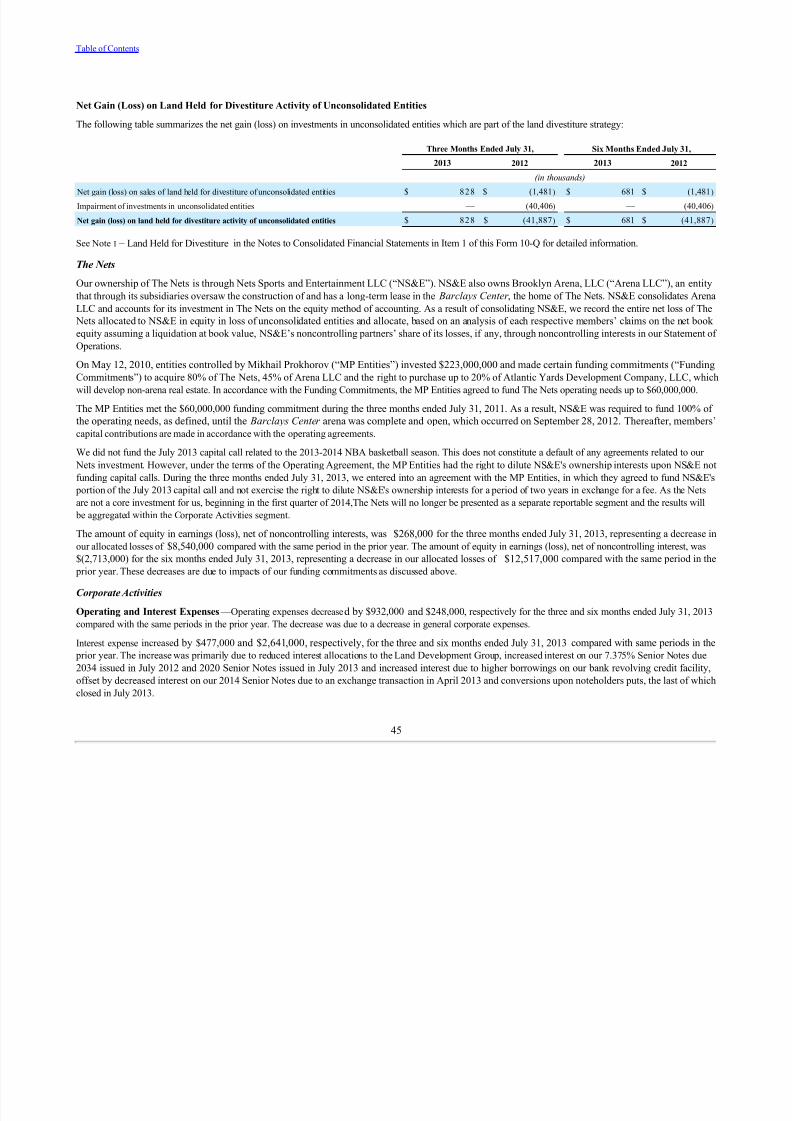
7/29/2019 ForestCityEnterprisesInc 8 Copy
http://slidepdf.com/reader/full/forestcityenterprisesinc-8-copy 49/69
Table of Contents
Net Gain (Loss) on Land Held for Divestiture Activity of Unconsolidated Entities
The following table summarizes the net gain (loss) on investments in unconsolidated entities which are part of the land divestiture strategy:
Three Months Ended July 31, Six Months Ended July 31,
2013 2012 2013 2012
(in thousands) Net gain (loss) on sales of land held for divestiture of unconsolidated entities $ 828 $ (1,481) $ 681 $ (1,481)
Impairment of investments in unconsolidated entities — (40,406) — (40,406)
Net gain (loss) on land held for divestiture activity of unconsolidated entities $ 828 $ (41,887) $ 681 $ (41,887)
See Note I – Land Held for Divestiture in the Notes to Consolidated Financial Statements in Item 1 of this Form 10-Q for detailed information.
The Nets
Our ownership of The Nets is through Nets Sports and Entertainment LLC (“NS&E”). NS&E also owns Brooklyn Arena, LLC (“Arena LLC”), an entity
that through its subsidiaries oversaw the construction of and has a long-term lease in the Barclays Center , the home of The Nets. NS&E consolidates Arena
LLC and accounts for its investment in The Nets on the equity method of accounting. As a result of consolidating NS&E, we record the entire net loss of The
Nets allocated to NS&E in equity in loss of unconsolidated entities and allocate, based on an analysis of each respective members’ claims on the net book
equity assuming a liquidation at book value, NS&E’s noncontrolling partners’ share of its losses, if any, through noncontrolling interests in our Statement of
Operations.
On May 12, 2010, entities controlled by Mikhail Prokhorov (“MP Entities”) invested $223,000,000 and made certain funding commitments (“FundingCommitments”) to acquire 80% of The Nets, 45% of Arena LLC and the right to purchase up to 20% of Atlantic Yards Development Company, LLC, which
will develop non-arena real estate. In accordance with the Funding Commitments, the MP Entities agreed to fund The Nets operating needs up to $60,000,000.
The MP Entities met the $60,000,000 funding commitment during the three months ended July 31, 2011. As a result, NS&E was required to fund 100% of
the operating needs, as defined, until the Barclays Center arena was complete and open, which occurred on September 28, 2012. Thereafter, members’
capital contributions are made in accordance with the operating agreements.
We did not fund the July 2013 capital call related to the 2013-2014 NBA basketball season. This does not constitute a default of any agreements related to our
Nets investment. However, under the terms of the Operating Agreement, the MP Entities had the right to dilute NS&E's ownership interests upon NS&E not
funding capital calls. During the three months ended July 31, 2013, we entered into an agreement with the MP Entities, in which they agreed to fund NS&E's
portion of the July 2013 capital call and not exercise the right to dilute NS&E's ownership interests for a period of two years in exchange for a fee. As the Nets
are not a core investment for us, beginning in the first quarter of 2014,The Nets will no longer be presented as a separate reportable segment and the results will
be aggregated within the Corporate Activities segment.
The amount of equity in earnings (loss), net of noncontrolling interests, was $268,000 for the three months ended July 31, 2013, representing a decrease in
our allocated losses of $8,540,000 compared with the same period in the prior year. The amount of equity in earnings (loss), net of noncontrolling interest, was$(2,713,000) for the six months ended July 31, 2013, representing a decrease in our allocated losses of $12,517,000 compared with the same period in the
prior year. These decreases are due to impacts of our funding commitments as discussed above.
Corporate Activities
Operating and Interest Expenses —Operating expenses decreased by $932,000 and $248,000, respectively for the three and six months ended July 31, 2013
compared with the same periods in the prior year. The decrease was due to a decrease in general corporate expenses.
Interest expense increased by $477,000 and $2,641,000, respectively, for the three and six months ended July 31, 2013 compared with same periods in the
prior year. The increase was primarily due to reduced interest allocations to the Land Development Group, increased interest on our 7.375% Senior Notes due
2034 issued in July 2012 and 2020 Senior Notes issued in July 2013 and increased interest due to higher borrowings on our bank revolving credit facility,
offset by decreased interest on our 2014 Senior Notes due to an exchange transaction in April 2013 and conversions upon noteholders puts, the last of which
closed in July 2013.
45

7/29/2019 ForestCityEnterprisesInc 8 Copy
http://slidepdf.com/reader/full/forestcityenterprisesinc-8-copy 50/69
Table of Contents
Other Activity
The following items are discussed on a consolidated basis.
Depreciation and Amortization
We recorded depreciation and amortization expense of $91,857,000 and $160,232,000 for the three and six months ended July 31, 2013 , respectively, and$50,897,000 and $100,261,000 for the three and six months ended July 31, 2012 , respectively, which are increases of $40,960,000 , or 80.5%, and
$59,971,000, or 59.8%, compared with the same periods in the prior year. The increases are primarily attributable to accelerated depreciation expense of $25,258,000 and $27,283,000 related to Ten MetroTech Center during the three and six months ended July 31, 2013 , respectively. In addition, the increase
for the three months ended July 31, 2013 compared with the same period in the prior year is attributable to new property openings, primarily Barclays Center
arena of $7,870,000 and Westchester's Ridge Hill, a mixed-use retail project in Yonkers, New York, of $2,634,000. The increase for the six months ended
July 31, 2013 compared with the same period in the prior year is also attributable to new property openings, primarily Barclays Center arena of $17,276,000
and Westchester's Ridge Hill of $7,034,000.
Amortization of Mortgage Procurement Costs
For the three and six months ended July 31, 2013 , we recorded amortization of mortgage procurement costs of $2,669,000 and $5,326,000, respectively
Amortization of mortgage procurement costs decreased $692,000 and $737,000 for the three and six months ended July 31, 2013 compared with the same
periods in the prior year.
Gain (Loss) on Extinguishment of Debt
See Note M – Gain (Loss) on Extinguishment of Debt in the Notes to Consolidated Financial Statements in Item 1 of this Form 10 ‑Q for detailed information.
Interest and Other Income
Interest and other income was $12,277,000 and $23,182,000 for the three and six months ended July 31, 2013 , respectively, compared with $13,551,000and $24,077,000 for the three and six months ended July 31, 2012 , respectively. The decrease of $1,274,000 for the three months ended July 31, 2013
compared to the same period in the prior year is primarily related to a decrease in the income recognition on the sale of state and federal historic preservation
and new market tax credits. The decrease of $895,000 for the six months ended July 31, 2013 compared with the same period in the prior year is also primarily related to a decrease in the income recognition on the sale of state and federal historic preservation and new market tax credits.
Net Gain on Change in Control of Interests
Net gain on change in control of interests was $2,762,000 for the three and six months ended July 31, 2013 compared with $6,766,000 for the three and six
months ended July 31, 2012, respectively. The amount for 2013 relates to the acquisition of our partner's ownership interest in Uptown Apartments. Theamount for 2012 relates to the acquisition of our partner's ownership interest in three office buildings in Albuquerque, New Mexico.
Equity in Earnings of Unconsolidated Entities
Equity in earnings of unconsolidated entities was $7,491,000 for the three months ended July 31, 2013 compared with $16,665,000 for the three monthsended July 31, 2012, representing a decrease of $9,174,000. This variance is primarily attributable to the following decreases:
- Commercial Group
• $14,479,000 related to the 2012 gain on disposition of our unconsolidated investment in Village at Gulfstream Park , a specialty retail center inHallandale Beach, Florida; and
• $1,628,000 related to the 2012 gain on disposition of our unconsolidated investment in Chagrin Plaza I & II , office buildings in Beachwood, Ohio.
- Land Development Group
• $2,970,000 related to deferred revenue recognition in 2012 at Central Station, a mixed-use land development project in Chicago, Illinois, upon sale of
the underlying land.
These decreases were partially offset by the following increase:
- The Nets
• $8,540,000 related to a 2013 decrease in allocated losses from our equity investment in The Nets.
46
7/29/2019 ForestCityEnterprisesInc 8 Copy
http://slidepdf.com/reader/full/forestcityenterprisesinc-8-copy 51/69
Table of Contents
Equity in earnings of unconsolidated entities was $13,341,000 for the six months ended July 31, 2013 compared with $20,438,000 for the six months ended
July 31, 2012, representing a decrease of $7,097,000. This variance is primarily attributable to the following decreases:
- Commercial Group
• $14,479,000 related to the 2012 gain on disposition of our unconsolidated investment in Village at Gulfstream Park;
• $1,628,000 related to the 2012 gain on disposition of our unconsolidated investment in Chagrin Plaza I & II; and
• $1,510,000 related to the 2013 loss on disposition of our unconsolidated investment in Plaza at Robinson Town Center , a specialty retail center in
Pittsburgh, Pennsylvania.
- Land Development Group
• $2,970,000 related to deferred revenue recognition in 2012 at Central Station.
These decreases were partially offset by the following increase:
- The Nets
• $12,517,000 related to a 2013 decrease in allocated losses from our equity investment in The Nets.
Discontinued Operations
See Note N – Discontinued Operations and Gain on Disposition of Rental Properties in the Notes to Consolidated Financial Statements in Item 1 of this Form
10-Q for detailed information.
FINANCIAL CONDITION AND LIQUIDITY
Multi-family rental properties continue to perform well throughout the majority of the United States. Other types of commercial real estate are also improving
but to varying degrees depending on the product type and the geographic market. Access to bank credit and capital have continued to improve with banks and
permanent lenders originating new loans for real estate projects, particularly as their existing portfolio loans get paid off. Originations of new loans for commercial mortgage backed securities have continued to improve as well. Although underwriting standards have begun to loosen, lenders continue favoring
high quality operating assets in strong markets. While banks continue to originate construction loans for multifamily projects, construction loans for office or
retail projects remain difficult to obtain, unless the project has substantial pre-leasing in place or higher than historical equity commitments from the company.
Our principal sources of funds are cash provided by operations including land sales, our bank revolving credit facility, nonrecourse mortgage debt and notes
payable, dispositions of operating properties or development projects through sales or equity joint ventures, proceeds from the issuance of senior notes, proceeds from the issuance of common or preferred equity and other financing arrangements. We have consistently disposed of properties in an effort to recycle
capital and reposition our portfolio. Over the last ten years, we have generated cash proceeds from sales and/or disposition of partial interests in rental properties that averaged in excess of $100,000,000 per year. Given the diversity of our portfolio by market and product type, we believe that the market for
property dispositions will continue to be available. The current market should allow us to continue our ongoing strategy to recycle capital and reposition the portfolio through property sales or equity joint ventures.
Our strategic plan drives our capital strategy and business focus on core products and markets. In order to achieve our strategic goals, we have a detailed
process of evaluating each individual asset in our operating and development portfolio to identify those having the best opportunity to provide capital through
full or partial sale in conjunction with our strategy of focusing on our core products and markets. This process may result in reductions to estimated holding
periods and the total estimated undiscounted cash flows used for impairment calculations on our individual consolidated real estate assets. In some cases, this
may result in estimated undiscounted cash flows being less than the carrying value of the consolidated asset and necessitating an impairment charge to write
down the asset to its estimated fair value.
In addition, our capital strategy includes potentially entering into equity joint ventures that can provide capital through the sales of partial interests of operating
properties or reduce our equity requirements and development risk on our development opportunities. Entering into these joint ventures could result in us
granting joint control or losing control of the asset and, accordingly, the asset would no longer be consolidated. Upon deconsolidation, our investment balance
in the joint venture would be compared to estimated fair value and recorded at the lesser of fair value or book value. Additionally, evaluation for other than
temporary impairment on a quarterly basis would be required. This could result in future impairments, some of which could be significant, that would not
otherwise be required if the real estate asset remained consolidated.
47
7/29/2019 ForestCityEnterprisesInc 8 Copy
http://slidepdf.com/reader/full/forestcityenterprisesinc-8-copy 52/69
Table of Contents
We are in the process of developing Brooklyn Atlantic Yards, which is comprised of two phases. Phase I is comprised of the Arena and eight buildings totaling
approximately 3.4 million square feet. Phase II consists of seven buildings totaling approximately 3.3 million square feet.
Substantial additional costs for railyard and infrastructure improvements will be required to proceed with Phase II. There is an upcoming December 31, 2013
deadline to commence construction on the Permanent Railyard and to post the completion guaranty for such work. If we choose to begin construction on the
Permanent Railyard by December 31, 2013, it must be substantially complete by September 30, 2016. We have previously provided an $86,000,000 letter of
credit to the Metropolitan Transit Authority ("MTA") as collateral for such future work related to the construction of the Permanent Railyard. In order to
construct the aforementioned seven buildings in Phase II, we will be required to construct a platform over the new Permanent Railyard. Alternatively, if wechoose not to commence construction on the Permanent Railyard by December 31, 2013, and we do not reach an alternative agreement with the MTA, the MTA
may assert that we are in default of various MTA project agreements and pursue a draw down of our $86,000,000 letter of credit. A default under the MTA
agreements would also result in our loss of approximately 3.3 million square feet of development rights for Phase II resulting in a significant charge related to
abandonment of this development opportunity.
In addition, we are pursuing joint venture partners for the future development of Brooklyn Atlantic Yards. We are very early in the discussion process and can
give no assurance as to whether we can find a joint venture partner for all or any part of the development opportunity at terms acceptable to us. However, if we
are successful, it could result in forming joint ventures whereby we grant joint control or lose control of the asset. If that were to occur, we may have todeconsolidate the individual asset and its allocation of the site acquisition costs. Upon deconsolidation, our investment balance in the joint venture would be
compared to estimated fair value and recorded at the lesser of fair value or book value. Additionally, evaluation on a quarterly basis for other than temporary
impairment of the investment would be required. This could result in future impairments, some of which would likely be significant.
Our principal uses of funds are the financing of our real estate operating and development projects, capital expenditures for our existing operating portfolio,
and principal and interest payments on our nonrecourse mortgage debt and notes payable, bank revolving credit facility and senior notes.
Our primary capital strategy seeks to isolate the operating and financial risk at the property level to maximize returns and reduce risk on and of our equitycapital. As such, substantially all of our operating and development properties are separately encumbered with nonrecourse mortgage debt or notes payable. We
do not cross-collateralize our mortgage debt and notes payable outside of a single identifiable project. We operate as a C-corporation and retain substantially all
of our internally generated cash flows. This cash flow, together with refinancing and property sale proceeds, has historically provided us with the necessary
liquidity to take advantage of investment opportunities. The economic downturn and its impact on the lending and capital markets reduced our ability to
finance development and acquisition opportunities and also modified the required rates of return to make new investment opportunities appealing. As a result
of these market changes, we have established limitations on entering into new development activities.
We continue to make progress on certain other pre-development projects, primarily multifamily projects located in core markets. The cash that we believe is
required to fund our equity in projects under construction and development plus any cash necessary to extend or pay down the remaining 2013 debt maturities
is anticipated to exceed our cash flow from operations. As a result, we intend to extend maturing debt or repay it with net proceeds from property sales, equity
oint ventures or future debt or equity financing.
During the six months ended July 31, 2013 , we closed several transactions which strengthened our balance sheet by increasing liquidity, converting preferred
equity to common equity, reducing certain future fixed charges for interest and preferred dividends and addressing certain near term debt maturities:
• In July 2013, we issued, at par, $300,000,000 aggregate principal amount of 3.625% Convertible Senior Notes due 2020 in a private placement. Wecommitted to use the net proceeds from this offering to repay the outstanding balance our 6.500% Senior Notes due 2017 and other outstanding debt
with higher interest rates.
• On May 31, 2013, pursuant to the terms of the Indenture governing the 3.625% Puttable Equity-Linked Senior Notes due 2014 (“2014 Senior Notes”),
we issued a put termination notice to the noteholders. Pursuant to the Indenture, following the put termination notice, noteholders were permitted to put
their 2014 Senior Notes to us through June 20, 2013. As of July 12, 2013, the last settlement date for noteholders to put the 2014 Senior Notes to us,
$60,033,000 aggregate principal amount of the 2014 Senior Notes were put, for which noteholders received 4,128,806 shares of our Class A common
stock and cash payments totaling $1,088,000 for interest payable to October 15, 2013 and in lieu of fractional shares. Following the settlement of the
put transactions, $1,114,000 aggregate principal amount of our 2014 Senior Notes remains outstanding.
• In April 2013, we entered into separate, privately negotiated exchange agreements whereby we exchanged $138,853,000 in aggregate principal of our
2014 Senior Notes for 9,549,721 shares of Class A common stock and a cash payment of $4,860,000 for additional exchange consideration, accrued
interest and in lieu of fractional shares.
48

7/29/2019 ForestCityEnterprisesInc 8 Copy
http://slidepdf.com/reader/full/forestcityenterprisesinc-8-copy 53/69
Table of Contents
• In March 2013, we redeemed all of the outstanding $53,253,000 principal amount of our outstanding 7.625% Senior Notes due 2015 (“2015 Senior
Notes”) at par value.
• In February 2013, we entered into a Fourth Amended and Restated Credit Agreement and a Fourth Amended and Restated Guaranty of Payment of Debt
(collectively, the “Credit Facility”). The amendment extended the maturity date to February 2016, subject to a one year extension upon the satisfaction
of certain conditions, reduced the interest rate spread on the London Interbank Offered Rate ("LIBOR") option by 25 basis points to 3.50% andremoved the prior LIBOR floor of 100 basis points. The amendment also increased available borrowings to $465,000,000, subject to certain reserve
commitments to be established, as applicable, on certain dates to be used to retire certain of our senior notes that come due during the term of theamendment and provided an accordion provision allowing us to increase our total available borrowings to $500,000,000 upon satisfaction of certain
conditions set forth in the Credit Facility. In July 2013, we met the conditions to exercise the accordion provision increasing our total available borrowings from $465,000,000 to $500,000,000.
• In February 2013, we announced our intention to redeem all of our outstanding shares of Series A preferred stock on March 15, 2013. From January
31, 2013 to March 14, 2013, 109,768 shares of Series A preferred stock were converted into 362,990 shares of Class A common stock in accordance
with the original terms of the Series A preferred stock. On March 15, 2013, we redeemed the remaining 101,270 shares of Series A preferred stock for
approximately $5,100,000 , the aggregate amount of liquidation preference plus the dividend that was due and payable on March 15, 2013.
• We generated net cash proceeds through the sale of non-core operating assets of $69,230,000, net of distributions to noncontrolling interests, related to
the sale of Millender Center , a 339 unit apartment community in Detroit, Michigan, Sheraton Station Square hotel located in PittsburghPennsylvania, and Higbee Building , an office building in Cleveland, Ohio.
• On June 3, 2013, we signed an agreement with a subsidiary of Queensland Investment Corporation (“QIC”) to create joint ventures at each of eight
regional malls (“Retail assets”) currently owned in whole or in part by us (collectively, the “JV”). At closing, we will contribute all of our ownership
interests in each of the Retail assets into the JV for a 51% ownership interest in the JV and QIC will contribute cash for its 49% ownership interest inthe JV. Our resulting ownership percentages of the individual Retail assets will vary depending on existing partnerships at three of the Retail assets.
Cash liquidity generated from the transaction is expected to be approximately $330,000,000, after transaction costs. We continue to negotiate the final
agreements with QIC and cannot assure the transaction will close at the terms described above, or at all.
We continue to explore various options to strengthen our balance sheet and enhance our liquidity, but can give no assurance that we can accomplish any of
these other options on terms favorable to us or at all. If we cannot enhance our liquidity, it could adversely impact our growth and result in further curtailment
of development activities.
We have no nonrecourse mortgages that were in default as of July 31, 2013.
As of July 31, 2013, we had $579,133,000 of nonrecourse mortgage financings with scheduled maturities during the fiscal year ending January 31, 2014, ofwhich $33,497,000 represents regularly scheduled amortization payments. Subsequent to July 31, 2013, we have addressed $441,654,000 of these maturities,
through closed transactions, commitments and/or automatic extensions. We are currently in negotiations to refinance and/or extend the remaining$103,982,000 of nonrecourse debt scheduled to mature during the year ending January 31, 2014. We cannot give assurance as to the ultimate result of these
negotiations. As with all nonrecourse mortgages, if we are unable to negotiate an extension or otherwise refinance the mortgage, we could go into default and the
lender could commence foreclosure proceedings on the single collateralized asset.
As of July 31, 2013, we had three nonrecourse mortgages greater than five percent of our total nonrecourse mortgage debt and notes payable. The mortgages,
encumbering New York Times, an office building in Manhattan, New York, Westchester’s Ridge Hill , a mixed-use retail project in Yonkers, New York, and
Barclays Center , a sports and entertainment arena in Brooklyn, New York, have outstanding balances of $640,000,000, $466,000,000 and $382,119,000,respectively, at July 31, 2013.
As of July 31, 2013, our share of nonrecourse mortgage debt and notes payable recorded on our unconsolidated subsidiaries amounted to $1,992,309,000 ofwhich $149,005,000 ($11,649,000 represents scheduled principal payments) was scheduled to mature during the year ending January 31, 2014. Subsequent
to July 31, 2013, we have addressed $122,145,000 of these maturities, through closed transactions, commitments and/or automatic extensions. Negotiations
are ongoing on the remaining 2013 maturities but we cannot give assurance that we will obtain these financings on favorable terms or at all.
49
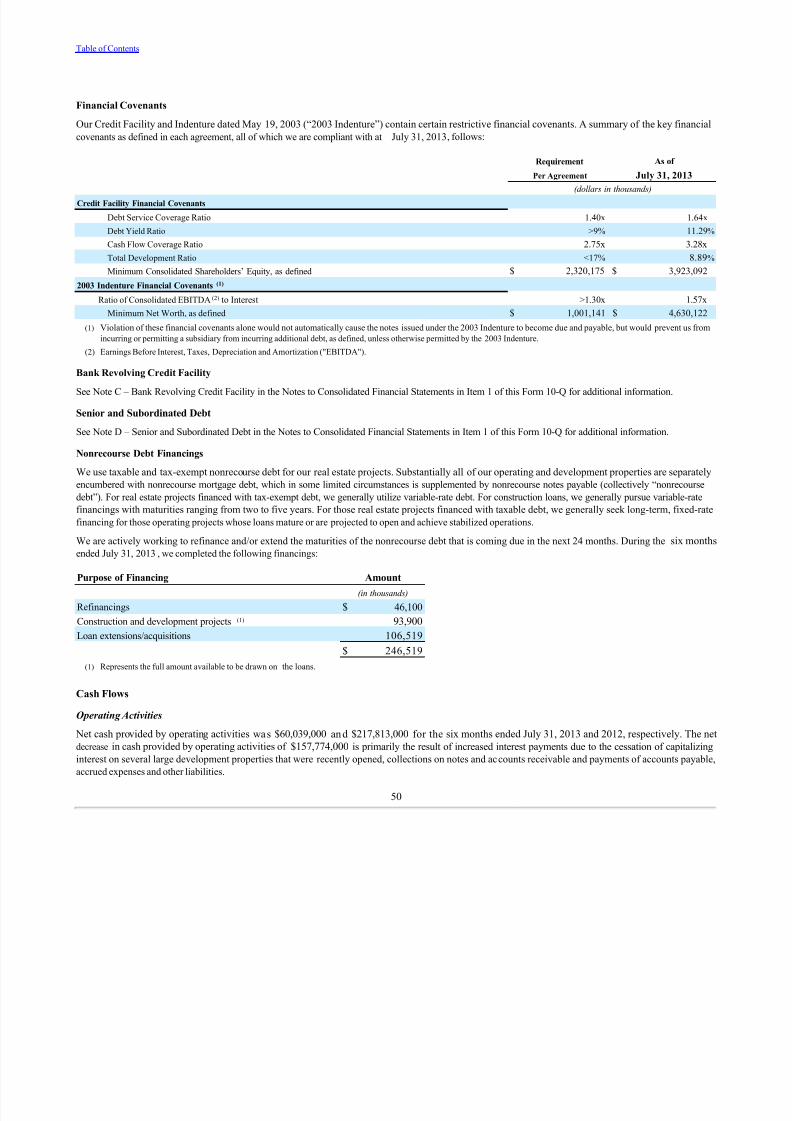
7/29/2019 ForestCityEnterprisesInc 8 Copy
http://slidepdf.com/reader/full/forestcityenterprisesinc-8-copy 54/69
Table of Contents
Financial Covenants
Our Credit Facility and Indenture dated May 19, 2003 (“2003 Indenture”) contain certain restrictive financial covenants. A summary of the key financial
covenants as defined in each agreement, all of which we are compliant with at July 31, 2013, follows:
Requirement As of
Per Agreement July 31, 2013
(dollars in thousands)
Credit Facility Financial Covenants
Debt Service Coverage Ratio 1.40x 1.64x
Debt Yield Ratio >9% 11.29%
Cash Flow Coverage Ratio 2.75x 3.28x
Total Development Ratio <17% 8.89%
Minimum Consolidated Shareholders’ Equity, as defined $ 2,320,175 $ 3,923,092
2003 Indenture Financial Covenants (1)
Ratio of Consolidated EBITDA (2) to Interest >1.30x 1.57x
Minimum Net Worth, as defined $ 1,001,141 $ 4,630,122
(1) Violation of these financial covenants alone would not automatically cause the notes issued under the 2003 Indenture to become due and payable, but would prevent us from
incurring or permitting a subsidiary from incurring additional debt, as defined, unless otherwise permitted by the 2003 Indenture.
(2) Earnings Before Interest, Taxes, Depreciation and Amortization ("EBITDA").
Bank Revolving Credit Facility
See Note C – Bank Revolving Credit Facility in the Notes to Consolidated Financial Statements in Item 1 of this Form 10-Q for additional information.
Senior and Subordinated Debt
See Note D – Senior and Subordinated Debt in the Notes to Consolidated Financial Statements in Item 1 of this Form 10-Q for additional information.
Nonrecourse Debt Financings
We use taxable and tax-exempt nonrecourse debt for our real estate projects. Substantially all of our operating and development properties are separately
encumbered with nonrecourse mortgage debt, which in some limited circumstances is supplemented by nonrecourse notes payable (collectively “nonrecourse
debt”). For real estate projects financed with tax-exempt debt, we generally utilize variable-rate debt. For construction loans, we generally pursue variable-rate
financings with maturities ranging from two to five years. For those real estate projects financed with taxable debt, we generally seek long-term, fixed-rate
financing for those operating projects whose loans mature or are projected to open and achieve stabilized operations.
We are actively working to refinance and/or extend the maturities of the nonrecourse debt that is coming due in the next 24 months. During the six monthsended July 31, 2013, we completed the following financings:
Purpose of Financing Amount
(in thousands)
Refinancings $ 46,100
Construction and development projects (1) 93,900
Loan extensions/acquisitions 106,519
$ 246,519
(1) Represents the full amount available to be drawn on the loans.
Cash Flows
Operating Activities
Net cash provided by operating activities was $60,039,000 and $217,813,000 for the six months ended July 31, 2013 and 2012, respectively. The netdecrease in cash provided by operating activities of $157,774,000 is primarily the result of increased interest payments due to the cessation of capitalizing
interest on several large development properties that were recently opened, collections on notes and accounts receivable and payments of accounts payable,
accrued expenses and other liabilities.
50

7/29/2019 ForestCityEnterprisesInc 8 Copy
http://slidepdf.com/reader/full/forestcityenterprisesinc-8-copy 55/69
Table of Contents
Investing Activities
Net cash used in investing activities was $(172,581,000) and $(282,923,000) for the six months ended July 31, 2013 and 2012 , respectively, and consisted
of the following:
Six Months Ended July 31,
2013 2012
(in thousands)
Capital expenditures:
Construction and development costs: Barc lays Center , a sports and entertainment arena in Brooklyn, New York $ (31,853) $ (184,266)
Atlant ic Yar ds, a mixed-use development project in Brooklyn, New York (25,613) (54,438)
Atlantic Yards - B2, a modular apartment community in Brooklyn, New York (24,044) —
The Yards - Twelve12, an apartment community in Washington, D.C. (18,696) —
Westchester’s Ridge Hill , a mixed-use retail project in Yonkers, New York (12,086) (63,319)
Other (83,684) (92,870)
Total projects under construction or development (1) (195,976) (394,893)
Acquisition of a building at Ante lope Vall ey Mall in Palmdale, California (8,514) —
Operating properties: Commercial Segment (10,780) (8,156)
Residential Segment (3,793) (7,470)
Other (1,048) (616)
Total operating properties (15,621) (16,242)Tenant improvements:
Commercial Segment (21,980) (30,963)
Total capital expenditures $ (242,091) $ (442,098)
Payment of lease procurement costs (2) (4,763) (5,886)
Increase in other assets (18,505) (19,140)
(Increase) decrease in restricted cash and escrowed funds used for investing purposes:
Uptown Apartments, an apartment community in Oakland, California $ (25,200) $ —
One MetroTech Center , an office building in Brooklyn, New York (3,904) (3,565)
The Yards - Twelve12 15,858 —
Atlant ic Yard s 1,161 170,199
Barcl ays Cente r 906 (7,171)
Westchester's Ridge Hill 6 8,962
John Hopkins Park ing Garage in East Baltimore, Maryland — 13,597
Other 144 5,275
Total (increase) decrease in restricted cash and escrowed funds used for investing purposes $ (11,029) $ 187,297
Proceeds from disposition of full or partial interests in rental properties:
Higbee Bui lding , an office building in Cleveland, Ohio $ 37,285 $ —
Mille nder Center , an apartment community in Detroit, Michigan 21,388 —
Sheraton Station Square, a hotel in Pittsburgh, Pennsylvania 16,318 —
Quebec Square, a specialty retail center in Denver, Colorado — 8,642
Other 6,850 254
Total proceeds from disposition of full or partial interests in rental properties $ 81,841 $ 8,896
51

7/29/2019 ForestCityEnterprisesInc 8 Copy
http://slidepdf.com/reader/full/forestcityenterprisesinc-8-copy 56/69
Table of Contents
Investing Activities (continued)
Six Months Ended July 31,
2013 2012
(in thousands)
Change in investments in and advances to unconsolidated entities—(investment in) or return of investment:
Dispositions: Plaza at Ro binson Town Center , a specialty retail center in Pittsburgh, Pennsylvania $ 8,500 $ —
Village at Gulfstream Park, a specialty retail center in Hallandale Beach, Florida — 15,000
Commercial Projects: Atlan tic Cente r, Court St reet , Gun Hill Road and Bruckner Boulev ard , primarily refinancing proceeds at four specialty retail centers in the New
York City metropolitan area 23,440 —
Jackson Buil ding , primarily refinancing proceeds at an office building in Cambridge, Massachusetts 4,898 —
300 Massachusetts Ave, an office building under development in Cambridge, Massachusetts (3,116) —
Bul let in Bui lding , contribution for the repayment of debt at an office building in San Francisco, California — (8,775)
Residential Projects:
3700M (West Village), an apartment community under construction in Dallas, Texas (2,800) —
120 Kingston, an apartment community under construction in Boston, Massachusetts (1,569) (2,943)
8 Spruce Street , a mixed-use residential project in Manhattan, New York — (10,447)
The Grand , primarily refinancing proceeds at an apartment community in North Bethesda, Maryland — 6,485
The Nets, a National Basketball Association member — (10,000)
Other (7,387) (1,312)Total change in investments in and advances to unconsolidated entities 21,966 (11,992)
Net cash used in investing activities $ (172,581) $ (282,923)
(1) We capitalized internal costs related to projects under construction and development of $20,761 and $25,686, including compensation related costs of $17,317 and $20,491, for the six months ended July 31, 2013and 2012, respectively. Total capitalized internal costs represent approximately 8.58% and 5.81% of total capital expenditures for the six months ended July 31, 2013 and 2012 , respectively.
(2) We capitalized internal costs related to leasing activities of $2,126 and $2,504, including compensation related costs of $1,750 and $1,980, for the six months ended July 31, 2013 and 2012 , respectively.
Financing Activities
Net cash provided by financing activities was $86,265,000 and $88,490,000 for the six months ended July 31, 2013 and 2012 . The net decrease in cash provided by financing activities of $2,225,000 relates to increased paydowns of nonrecourse mortgage debt and notes payable, the redemption of the 2015
Senior Notes, increased restricted cash and escrowed funds used to repay debt subsequent to July 31, 2013 and cash payments related to the exchanges of the
2014 Senior Notes, offset by proceeds from the issuance of 2020 Senior Notes and increased contributions from noncontrolling interests. Proceeds from the
issuance of our 2020 Senior Notes were used to redeem the remaining 6.500% Senior Notes due 2017 (“2017 Senior Notes”) in August 2013. The decrease in
net cash provided by financing activities along with the August 2013 redemption of the 2017 Senior Notes is consistent with our ongoing goal of deleveraging
the balance sheet.
LEGAL PROCEEDINGS
We are involved in various claims and lawsuits incidental to our business, and management and legal counsel believe these claims and lawsuits will not have
a material adverse effect on our consolidated financial statements.
NEW ACCOUNTING GUIDANCE
The following accounting pronouncements were adopted during the six months ended July 31, 2013 :
In July 2013, the Financial Accounting Standards Board ("FASB") issued an amendment to the accounting guidance on the use of benchmark interest rates for
hedge accounting. This guidance provides an entity the option to use the Fed Funds Effective Swap Rate, in addition to the rate on United States Treasuries
and LIBOR, for hedge accounting purposes. The guidance also removes restrictions on using different benchmark rates for similar hedges. This guidance is
effective prospectively for qualifying new or redesignated hedging relationships entered into on or after July 17, 2013. The adoption of this guidance on July
17, 2013 did not have a material impact on our consolidated financial statements.
52

7/29/2019 ForestCityEnterprisesInc 8 Copy
http://slidepdf.com/reader/full/forestcityenterprisesinc-8-copy 57/69
Table of Contents
In February 2013, the FASB issued an amendment to the accounting guidance for the reporting of amounts reclassified out of accumulated other comprehensive income ("accumulated OCI"). This guidance does not change the current requirements for reporting net income or other comprehensive income
in financial statements. However, the amendments require an entity to provide information about the amounts reclassified out of accumulated OCI bycomponent. In addition, an entity is required to present, either on the face of the statement where net income is presented or in the notes, significant amounts
reclassified out of accumulated OCI by the respective line items of net income but only if the amount reclassified is required under GAAP to be reclassified to
net income in its entirety in the same reporting period. For other amounts that are not required under GAAP to be reclassified in their entirety to net income, an
entity is required to cross-reference to other disclosures required under GAAP that provide additional detail about those amounts. This guidance is effective prospectively for reporting periods beginning after December 15, 2012. The required disclosures upon adoption of this guidance on February 1, 2013 are
included in our consolidated financial statements.
In July 2012, the FASB issued an amendment to the accounting guidance on testing indefinite-lived intangible assets for impairment. This guidance provides
an entity the option to first assess qualitative factors to determine whether the existence of events and circumstances indicates that it is more likely than not that
the indefinite-lived intangible asset is impaired. If an entity concludes that it is not more likely than not that the asset is impaired, then the entity is not required
to take further action. If an entity concludes otherwise, it is required to determine the fair value of the indefinite-lived intangible asset and perform thequantitative test by comparing the fair value with the carrying amount. This guidance is effective for annual and interim impairment tests performed for fiscal
years beginning after September 15, 2012. The adoption of this guidance on February 1, 2013 did not have a material impact on our consolidated financial
statements.
In December 2011, the FASB issued an amendment to the accounting guidance on derecognition of in substance real estate. This guidance specifies that when
a parent company (reporting entity) ceases to have a controlling financial interest (as described in the accounting guidance on consolidation) in a subsidiary
that is in substance real estate as a result of a default on the subsidiary’s nonrecourse debt, the reporting entity should apply the guidance on property, plant
and equipment to determine whether it should derecognize the in substance real estate. Generally, a reporting entity would not satisfy the requirements to
derecognize the in substance real estate before the legal transfer of the real estate to the lender and the extinguishment of the related nonrecourse indebtedness.This guidance is effective for fiscal years and interim reporting periods within those years, beginning on or after June 15, 2012. The adoption of this guidance
on February 1, 2013 did not impact our consolidated financial statements or their comparability to previously issued financial statements as the guidance in
this amendment is consistent with our previous accounting policies.
In December 2011, the FASB issued an amendment to the accounting guidance that requires entities to disclose both gross and net information on financial
instruments and transactions eligible for offset on the balance sheets and financial instruments and transactions subject to an agreement similar to a master
netting arrangement. In January 2013, the FASB issued guidance clarifying that the scope of disclosures about offsetting assets and liabilities should apply
only to derivatives and hedging instruments. This guidance is effective for annual and interim reporting periods beginning on or after January 1, 2013. The
adoption of this guidance on February 1, 2013 did not have a material impact on our consolidated financial statements.
The following new accounting pronouncement will be adopted on its respective required effective date:
In July 2013, the FASB issued an amendment to the accounting guidance on the presentation of an unrecognized tax benefit when a net operating losscarryforward, a similar tax loss, or tax credit carryforward exists. This guidance, which clarifies whether the unrecognized tax benefit should be recorded as a
liability or reduction of the related deferred tax asset, is effective for fiscal years and interim reporting periods within those years, beginning after December
15, 2013. The amendments should be applied prospectively to all unrecognized tax benefits that exist at the effective date. Retrospective application is permitted. We do not expect the adoption of this guidance to have a material impact on our consolidated financial statements.
53

7/29/2019 ForestCityEnterprisesInc 8 Copy
http://slidepdf.com/reader/full/forestcityenterprisesinc-8-copy 58/69
Table of Contents
INFORMATION RELATED TO FORWARD-LOOKING STATEMENTS
This Form 10-Q, together with other statements and information publicly disseminated by us, contains “forward-looking statements” within the meaning of
Section 27A of the Securities Act of 1933, as amended, and Section 21E of the Securities Exchange Act of 1934, as amended. Such statements reflectmanagement’s current views with respect to financial results related to future events and are based on assumptions and expectations that may not be realized
and are inherently subject to risks and uncertainties, many of which cannot be predicted with accuracy and some of which might not even be anticipated.
Future events and actual results, financial or otherwise, may differ from the results discussed in the forward-looking statements. Risk factors discussed in
Item 1A of our Form 10-K for the year ended January 31, 2013 and other factors that might cause differences, some of which could be material, include, but
are not limited to, the impact of current lending and capital market conditions on our liquidity, ability to finance or refinance projects and repay our debt, the
impact of the current economic environment on the ownership, development and management of our commercial real estate portfolio, general real estate
investment and development risks, using modular construction as a new construction methodology and investing in a facility to produce modular units,
vacancies in our properties, further downturns in the housing market, competition, illiquidity of real estate investments, bankruptcy or defaults of tenants,
anchor store consolidations or closings, international activities, the impact of terrorist acts, risks of owning and operating an arena, risks associated with an
investment in a professional sports team, our substantial debt leverage and the ability to obtain and service debt, the impact of restrictions imposed by our
credit facility and senior debt, exposure to hedging agreements, the level and volatility of interest rates, the continued availability of tax-exempt government
financing, the impact of credit rating downgrades, effects of uninsured or underinsured losses, effects of a downgrade or failure of our insurance carriers,
environmental liabilities, conflicts of interest, risks associated with the sale of tax credits, risks associated with developing and managing properties in
partnership with others, the ability to maintain effective internal controls, compliance with governmental regulations, increased legislative and regulatory
scrutiny of the financial services industry, changes in federal, state or local tax laws, volatility in the market price of our publicly traded securities, inflation
risks, litigation risks, cybersecurity risks and cyber incidents, as well as other risks listed from time to time in our reports filed with the Securities andExchange Commission. We have no obligation to revise or update any forward-looking statements, other than imposed by law, as a result of future events or
new information. Readers are cautioned not to place undue reliance on such forward-looking statements.
Item 3. Quantitative and Qualitative Disclosures About Market Risk
Our market risk includes the inability to obtain construction loans, refinance existing construction loans into long-term fixed-rate nonrecourse financing,
refinance existing nonrecourse financing at maturity, obtain renewals or replacement of credit enhancement devices, such as letters of credit, or otherwise
obtain funds by selling real estate assets or by raising equity. We also have interest-rate exposure on our current variable-rate debt portfolio. During the
construction period, we have historically used variable-rate debt to finance developmental projects. At July 31, 2013, our outstanding variable-rate debt,
including borrowings under our bank revolving credit facility, consisted of $1,499,106,000 of taxable debt and $492,829,000 of tax-exempt debt. Upon
opening and achieving stabilized operations, we have historically procured long-term fixed-rate financing for our rental properties. We may not be able to
procure long-term fixed rate financing and accordingly pursue extending maturities with existing lenders. Additionally, we are exposed to interest rate risk upon
maturity of our long-term fixed-rate financings.
Interest Rate Exposure
At July 31, 2013, the composition of nonrecourse debt was as follows:
Operating
Properties
Development
Projects
Land
Projects Total
Total
Weighted
Average Rate
(dollars in thousands)
Fixed Rate $ 3,493,111 $ 277,653 $ — $ 3,770,764 5.47%
Variable Rate
Taxable 1,433,701 65,405 — 1,499,106 4.74%
Tax-Exempt 399,981 53,555 39,293 492,829 1.60%
$ 5,326,793 $ 396,613 $ 39,293 $ 5,762,699 4.95%
Total gross commitment from lenders $ 572,420 $ 39,293
54

7/29/2019 ForestCityEnterprisesInc 8 Copy
http://slidepdf.com/reader/full/forestcityenterprisesinc-8-copy 59/69
Table of Contents
To mitigate short-term variable interest rate risk, we have purchased interest rate hedges for our variable-rate debt as follows:
Taxable (Priced off of LIBOR Index)
Caps Swaps
Notional Average Base Notional Average Base
Period Covered Amount Rate Amount Rate (dollars in thousands)
08/01/13 - 02/01/14 $ 291,884 3.28% $ 961,554 3.83%
02/01/14 - 02/01/15 63,914 3.69% 861,320 4.20%
02/01/15 - 09/01/17 — —% 640,000 5.50%
Tax-Exempt (Priced off of Securities Industry and Financial Markets Association ("SIFMA") Index)
Caps
Notional Average Base
Period Covered Amount Rate
(dollars in thousands)
08/01/13 - 02/01/14 $ 169,160 5.67%
02/01/14 - 02/01/15 169,160 5.67%
02/01/15 - 03/24/16 9,695 6.96%
The tax-exempt caps generally were purchased in conjunction with lender hedging requirements that require the borrower to protect against significantfluctuations in interest rates. Except for those requirements, we generally do not hedge tax-exempt debt because, since 1990, the base rate of this type of
financing has averaged 2.58% and has never exceeded 8.00%.
Sensitivity Analysis to Changes in Interest Rates
Including the effect of the protection provided by the interest rate swaps, caps and long-term contracts in place as of July 31, 2013, a 100 basis point increase
in taxable interest rates (including properties accounted for under the equity method, corporate debt and the effect of interest rate floors) would increase the
annual pre-tax interest cost for the next 12 months of our variable-rate debt by approximately $7,226,000 at July 31, 2013. Although tax-exempt rates generally
move in an amount that is smaller than corresponding changes in taxable interest rates, a 100 basis point increase in tax-exempt rates (including properties
accounted for under the equity method) would increase the annual pre-tax interest cost for the next 12 months of our tax-exempt variable-rate debt byapproximately $6,723,000 at July 31, 2013. This analysis includes a portion of our taxable and tax-exempt variable-rate debt related to construction loans for
which the interest expense is capitalized.
From time to time, we and/or certain of our joint ventures (the “Joint Ventures”) enter into total rate of return swaps (“TRS”) on various tax-exempt fixed-rate
borrowings generally held by us and/or within the Joint Ventures. The TRS convert these borrowings from a fixed rate to a variable rate and provide anefficient financing product to lower the cost of capital. In exchange for a fixed rate, the TRS require that we and/or the Joint Ventures pay a variable rate,
generally equivalent to the SIFMA rate plus a spread. At July 31, 2013, the SIFMA rate was 0.05%. Additionally, we and/or the Joint Ventures have guaranteed
the fair value of the underlying borrowings. Any fluctuation in the value of the TRS would be offset by the fluctuation in the value of the underlying borrowings, resulting in minimal financial impact to us and/or the Joint Ventures. At July 31, 2013, the aggregate notional amount of TRS that are designated
as fair value hedging instruments is $285,845,000. The underlying TRS borrowings are subject to a fair value adjustment. In addition, we have TRS with a
notional amount of $180,321,000 that is not designated as fair value hedging instruments, but is subject to interest rate risk.
We estimate the fair value of our hedging instruments based on interest rate market and bond pricing models. At July 31 and January 31, 2013, we recorded
interest rate caps at fair value of $15,000 and $7,000, respectively, in other assets. We also recorded interest rate swap agreements and TRS with positive fair
values of approximately $14,791,000 and $21,307,000 at July 31 and January 31, 2013, respectively, in other assets. At July 31 and January 31, 2013, werecorded interest rate swap agreements and TRS that had a negative fair value of approximately $136,175,000 and $155,724,000, respectively, in accounts
payable, accrued expenses and other liabilities.
5 5

7/29/2019 ForestCityEnterprisesInc 8 Copy
http://slidepdf.com/reader/full/forestcityenterprisesinc-8-copy 60/69
Table of Contents
We estimate the fair value of our long-term debt instruments by market rates, if available, or by discounting future cash payments at interest rates thatapproximate the current market. Estimated fair value is based upon market prices of public debt, available industry financing data, current treasury rates and
recent financing transactions. Based on these parameters, the table below contains the estimated fair value of our long-term debt at July 31, 2013.
Carrying Value Fair Value
Fair Value
with 100 bp Decrease
in Market Rates (in thousands)
Fixed $ 4,823,275 $ 4,971,911 $ 5,229,017
Variable
Taxable 1,499,106 1,454,926 1,457,361
Tax-Exempt 492,829 481,800 478,207
Total Variable $ 1,991,935 $ 1,936,726 $ 1,935,568
Total Long-Term Debt $ 6,815,210 $ 6,908,637 $ 7,164,585
The following tables provide information about our financial instruments that are sensitive to changes in interest rates.
5 6
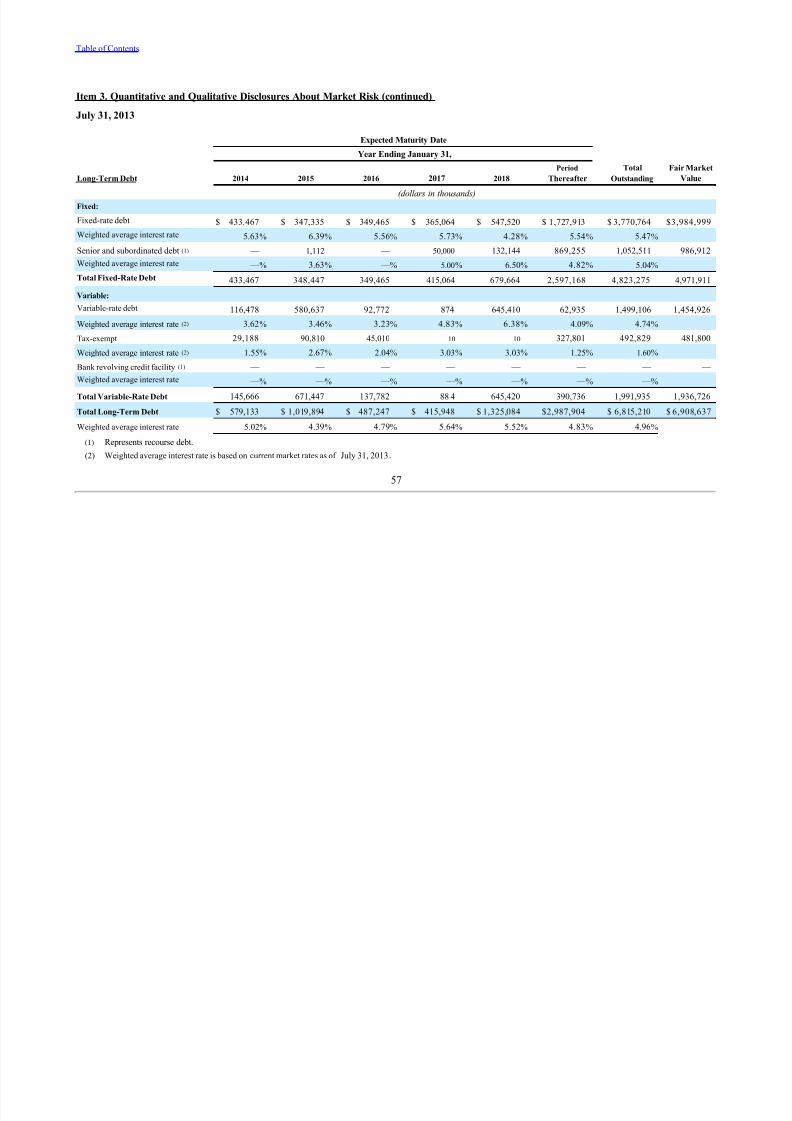
7/29/2019 ForestCityEnterprisesInc 8 Copy
http://slidepdf.com/reader/full/forestcityenterprisesinc-8-copy 61/69
Table of Contents
Item 3. Quantitative and Qualitative Disclosures About Market Risk (continued)
July 31, 2013
Expected Maturity Date
Year Ending January 31,
Long-Term Debt 2014 2015 2016 2017 2018
Period
Thereafter
Total
Outstanding
Fair Market
Value (dollars in thousands) Fixed: Fixed-rate debt $ 433,467 $ 347,335 $ 349,465 $ 365,064 $ 547,520 $ 1,727,913 $ 3,770,764 $3,984,999
Weighted average interest rate 5.63% 6.39% 5.56% 5.73% 4.28% 5.54% 5.47%
Senior and subordinated debt (1) — 1,112 — 50,000 132,144 869,255 1,052,511 986,912
Weighted average interest rate — % 3.63% — % 5.00% 6.50% 4.82% 5.04%
Total Fixed-Rate Debt 433,467 348,447 349,465 415,064 679,664 2,597,168 4,823,275 4,971,911
Variable: Variable-rate debt 116,478 580,637 92,772 874 645,410 62,935 1,499,106 1,454,926
Weighted average interest rate (2) 3.62% 3.46% 3.23% 4.83% 6.38% 4.09% 4.74%
Tax-exempt 29,188 90,810 45,010 10 10 327,801 492,829 481,800
Weighted average interest rate (2) 1.55% 2.67% 2.04% 3.03% 3.03% 1.25% 1.60%
Bank revolving credit facility (1) — — — — — — — —
Weighted average interest rate — % — % — % — % — % — % — %
Total Variable-Rate Debt 145,666 671,447 137,782 88 4 645,420 390,736 1,991,935 1,936,726
Total Long-Term Debt $ 579,133 $ 1,019,894 $ 487,247 $ 415,948 $ 1,325,084 $2,987,904 $ 6,815,210 $ 6,908,637
Weighted average interest rate 5.02% 4.39% 4.79% 5.64% 5.52% 4.83% 4.96%
(1) Represents recourse debt.
(2) Weighted average interest rate is based on current market rates as of July 31, 2013.
57

7/29/2019 ForestCityEnterprisesInc 8 Copy
http://slidepdf.com/reader/full/forestcityenterprisesinc-8-copy 62/69
Table of Contents
Item 3. Quantitative and Qualitative Disclosures About Market Risk (continued)
January 31, 2013
Expected Maturity Date
Year Ending January 31,
Long-Term Debt 2014 2015 2016 2017 2018 PeriodThereafter Total
Outstanding
Fair
MarketValue
(dollars in thousands)
Fixed: Fixed-rate debt $ 646,225 $ 296,354 $ 350,543 $ 366,205 $ 555,014 $ 1,543,803 $3,758,144 $ 4,086,909
Weighted average interest rate 6.18% 6.01% 5.55% 5.71% 4.26% 5.53% 5.51%
Senior and subordinated debt (1) 29,000 (3) 199,457 53,253 50,000 132,144 569,115 1,032,969 1,060,940
Weighted average interest rate 7.88% 3.63% 7.63% 5.00% 6.50% 5.45% 5.39%
Total Fixed-Rate Debt 675,225 495,811 403,796 416,205 687,158 2,112,918 4,791,113 5,147,849
Variable: Variable-rate debt 160,412 607,113 34,560 179 644,670 63,996 1,510,930 1,477,374
Weighted average interest rate(2) 4.31% 3.53% 3.48% 3.21% 6.38% 5.90% 4.93%
Tax-exempt 1 90,810 45,010 10 10 335,745 471,586 463,000
Weighted average interest rate(2) 3.06% 2.71% 2.12% 3.06% 3.06% 1.28% 1.64% Bank revolving credit facility (1) — — — — — — — —
Weighted average interest rate — % — % — % — % — % — % — %
Total Variable-Rate Debt 160,413 697,923 79,570 189 644,680 399,741 1,982,516 1,940,374
Total Long-Term Debt $ 835,638 $ 1,193,734 $ 483,366 $ 416,394 $1,331,838 $ 2,512,659 $6,773,629 $7,088,223
Weighted average interest rate 5.88% 4.10% 5.31% 5.62% 5.51% 4.95% 5.09%
(1) Represents recourse debt.
(2) Weighted average interest rate is based on current market rates as of January 31, 2013.
(3) The mandatory tender date of the custodial receipts, which represent ownership in the bonds, was used for the expected maturity date in lieu of the maturity date on the face of
the bonds.
58
7/29/2019 ForestCityEnterprisesInc 8 Copy
http://slidepdf.com/reader/full/forestcityenterprisesinc-8-copy 63/69
Table of Contents
Item 4. Controls and Procedures
The Company maintains a set of disclosure controls and procedures designed to ensure that information required to be disclosed by the Company in reports
that it files or furnishes under the Securities Exchange Act of 1934 (“Securities Exchange Act”) is recorded, processed, summarized and reported within the
time periods specified in Securities and Exchange Commission rules and forms and that such information is accumulated and communicated to theCompany’s management, including the Chief Executive Officer (“CEO”) and Chief Financial Officer (“CFO”), as appropriate, to allow timely decisions
regarding required disclosure. As of the end of the period covered by this quarterly report, an evaluation of the effectiveness of the Company’s disclosure
controls and procedures, as defined in Rules 13a-15(e) and 15d-15(e) under the Securities Exchange Act, was carried out under the supervision and with the participation of the Company’s management, which includes the CEO and CFO. Based on that evaluation, the CEO and CFO have concluded that theCompany’s disclosure controls and procedures were effective as of July 31, 2013.
There have been no changes in the Company’s internal control over financial reporting that occurred during the fiscal quarter ended July 31, 2013 that havematerially affected, or are reasonably likely to materially affect, the Company’s internal control over financial reporting.
In connection with the rules, the Company continues to review and document its disclosure controls and procedures, including the Company’s internal control
over financial reporting, and may from time to time make changes aimed at enhancing their effectiveness and ensuring that the Company’s systems evolve
with the business.
PART II — OTHER INFORMATION
Item 1. Legal Proceedings
The Company is involved in various claims and lawsuits incidental to its business, and management and legal counsel believe these claims and lawsuits will
not have a material adverse effect on the Company’s consolidated financial statements.
Item 2. Unregistered Sales of Equity Securities and Use of Proceeds
(a) and (b) – Not applicable.
(c) – Repurchase of equity securities during the quarter.
For the three months ended July 31, 2013, there were no repurchases of stock.
For information regarding termination of the put rights associated with the 2014 Senior Notes, see Note Q – Capital Stock in the Notes to the Consolidated
Financial Statements in Item 1 of this Form 10-Q.
5 9
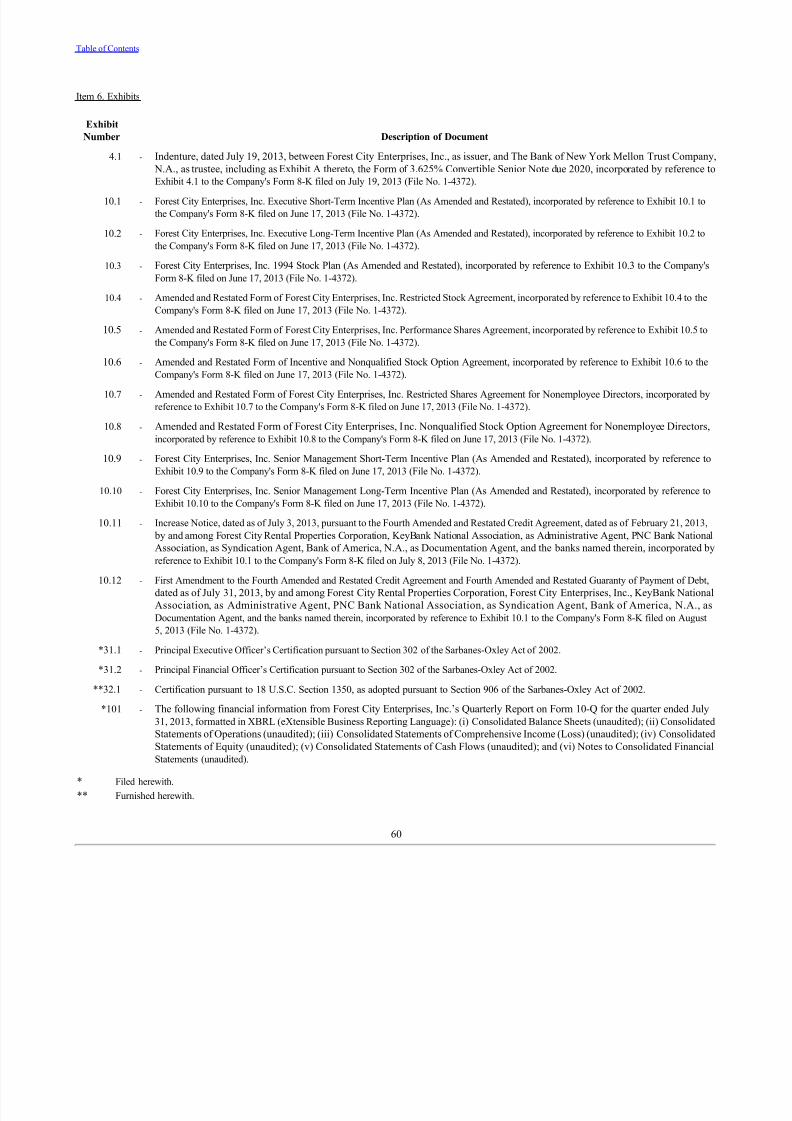
7/29/2019 ForestCityEnterprisesInc 8 Copy
http://slidepdf.com/reader/full/forestcityenterprisesinc-8-copy 64/69
Table of Contents
Item 6. Exhibits
Exhibit
Number Description of Document
4.1 - Indenture, dated July 19, 2013, between Forest City Enterprises, Inc., as issuer, and The Bank of New York Mellon Trust Company,
N.A., as trustee, including as Exhibit A thereto, the Form of 3.625% Convertible Senior Note due 2020, incorporated by reference to
Exhibit 4.1 to the Company's Form 8-K filed on July 19, 2013 (File No. 1-4372).
10.1 - Forest City Enterprises, Inc. Executive Short-Term Incentive Plan (As Amended and Restated), incorporated by reference to Exhibit 10.1 to
the Company's Form 8-K filed on June 17, 2013 (File No. 1-4372).
10.2 - Forest City Enterprises, Inc. Executive Long-Term Incentive Plan (As Amended and Restated), incorporated by reference to Exhibit 10.2 to
the Company's Form 8-K filed on June 17, 2013 (File No. 1-4372).
10.3 - Forest City Enterprises, Inc. 1994 Stock Plan (As Amended and Restated), incorporated by reference to Exhibit 10.3 to the Company's
Form 8-K filed on June 17, 2013 (File No. 1-4372).
10.4 - Amended and Restated Form of Forest City Enterprises, Inc. Restricted Stock Agreement, incorporated by reference to Exhibit 10.4 to the
Company's Form 8-K filed on June 17, 2013 (File No. 1-4372).
10.5 - Amended and Restated Form of Forest City Enterprises, Inc. Performance Shares Agreement, incorporated by reference to Exhibit 10.5 to
the Company's Form 8-K filed on June 17, 2013 (File No. 1-4372).
10.6 - Amended and Restated Form of Incentive and Nonqualified Stock Option Agreement, incorporated by reference to Exhibit 10.6 to the
Company's Form 8-K filed on June 17, 2013 (File No. 1-4372).
10.7 - Amended and Restated Form of Forest City Enterprises, Inc. Restricted Shares Agreement for Nonemployee Directors, incorporated by
reference to Exhibit 10.7 to the Company's Form 8-K filed on June 17, 2013 (File No. 1-4372).
10.8 - Amended and Restated Form of Forest City Enterprises, Inc. Nonqualified Stock Option Agreement for Nonemployee Directors,
incorporated by reference to Exhibit 10.8 to the Company's Form 8-K filed on June 17, 2013 (File No. 1-4372).
10.9 - Forest City Enterprises, Inc. Senior Management Short-Term Incentive Plan (As Amended and Restated), incorporated by reference to
Exhibit 10.9 to the Company's Form 8-K filed on June 17, 2013 (File No. 1-4372).
10.10 - Forest City Enterprises, Inc. Senior Management Long-Term Incentive Plan (As Amended and Restated), incorporated by reference to
Exhibit 10.10 to the Company's Form 8-K filed on June 17, 2013 (File No. 1-4372).
10.11 - Increase Notice, dated as of July 3, 2013, pursuant to the Fourth Amended and Restated Credit Agreement, dated as of February 21, 2013,
by and among Forest City Rental Properties Corporation, KeyBank National Association, as Administrative Agent, PNC Bank National
Association, as Syndication Agent, Bank of America, N.A., as Documentation Agent, and the banks named therein, incorporated byreference to Exhibit 10.1 to the Company's Form 8-K filed on July 8, 2013 (File No. 1-4372).
10.12 - First Amendment to the Fourth Amended and Restated Credit Agreement and Fourth Amended and Restated Guaranty of Payment of Debt,
dated as of July 31, 2013, by and among Forest City Rental Properties Corporation, Forest City Enterprises, Inc., KeyBank NationalAssociation, as Administrative Agent, PNC Bank National Association, as Syndication Agent, Bank of America, N.A., asDocumentation Agent, and the banks named therein, incorporated by reference to Exhibit 10.1 to the Company's Form 8-K filed on August
5, 2013 (File No. 1-4372).
*31.1 - Principal Executive Officer’s Certification pursuant to Section 302 of the Sarbanes-Oxley Act of 2002.
*31.2 - Principal Financial Officer’s Certification pursuant to Section 302 of the Sarbanes-Oxley Act of 2002.
**32.1 - Certification pursuant to 18 U.S.C. Section 1350, as adopted pursuant to Section 906 of the Sarbanes-Oxley Act of 2002.
*101 - The following financial information from Forest City Enterprises, Inc.’s Quarterly Report on Form 10-Q for the quarter ended July
31, 2013, formatted in XBRL (eXtensible Business Reporting Language): (i) Consolidated Balance Sheets (unaudited); (ii) ConsolidatedStatements of Operations (unaudited); (iii) Consolidated Statements of Comprehensive Income (Loss) (unaudited); (iv) Consolidated
Statements of Equity (unaudited); (v) Consolidated Statements of Cash Flows (unaudited); and (vi) Notes to Consolidated FinancialStatements (unaudited).
* Filed herewith.
** Furnished herewith.
60

7/29/2019 ForestCityEnterprisesInc 8 Copy
http://slidepdf.com/reader/full/forestcityenterprisesinc-8-copy 65/69
Table of Contents
SIGNATURES
Pursuant to the requirements of the Securities Exchange Act of 1934, the registrant has duly caused this report to be signed on its behalf by the undersigned
thereunto duly authorized.
FOREST CITY ENTERPRISES, INC.
(Registrant)
Date: September 5, 2013 /s/ ROBERT G. O’BRIEN
Name: Robert G. O’Brien
Title: Executive Vice President and
Chief Financial Officer
Date: September 5, 2013 /s/ CHARLES D. OBERT
Name: Charles D. Obert
Title: Senior Vice President, Corporate Controller and Chief
Accounting Officer
61
7/29/2019 ForestCityEnterprisesInc 8 Copy
http://slidepdf.com/reader/full/forestcityenterprisesinc-8-copy 66/69
Exhibit 31.1
PRINCIPAL EXECUTIVE OFFICER’S CERTIFICATION
PURSUANT TO SECTION 302 OF THE SARBANES-OXLEY ACT OF 2002
I, David J. LaRue, certify that:
1. I have reviewed this quarterly report for the three and six months ended July 31, 2013 on Form 10-Q of Forest City Enterprises, Inc.;
2. Based on my knowledge, this report does not contain any untrue statement of a material fact or omit to state a material fact necessary to make thestatements made, in light of the circumstances under which such statements were made, not misleading with respect to the period covered by this
report;
3. Based on my knowledge, the financial statements, and other financial information included in this report, fairly present in all material respects the
financial condition, results of operations and cash flows of the registrant as of, and for, the periods presented in this report;
4. The registrant’s other certifying officer and I are responsible for establishing and maintaining disclosure controls and procedures (as defined in
Exchange Act Rules 13a-15(e) and 15d-15(e)) and internal control over financial reporting (as defined in Exchange Act Rules 13a-15(f) and 15d-
15(f)) for the registrant and have:
a) designed such disclosure controls and procedures, or caused such disclosure controls and procedures to be designed under our
supervision, to ensure that material information relating to the registrant, including its consolidated subsidiaries, is made known to us by
others within those entities, particularly during the period in which this report is being prepared;
b) designed such internal control over financial reporting, or caused such internal control over financial reporting to be designed under our
supervision, to provide reasonable assurance regarding the reliability of financial reporting and the preparation of financial statements for
external purposes in accordance with generally accepted accounting principles;
c) evaluated the effectiveness of the registrant’s disclosure controls and procedures and presented in this report our conclusions about the
effectiveness of the disclosure controls and procedures, as of the end of the period covered by this report based on such evaluation; and
d) disclosed in this report any change in the registrant’s internal control over financial reporting that occurred during the registrant’s most
recent fiscal quarter (the registrant’s fourth fiscal quarter in the case of an annual report) that has materially affected, or is reasonably likely
to materially affect, the registrant’s internal control over financial reporting; and
5. The registrant’s other certifying officer and I have disclosed, based on our most recent evaluation of internal control over financial reporting, to the
registrant’s auditors and the audit committee of the registrant’s board of directors (or persons performing the equivalent functions):
a) all significant deficiencies and material weaknesses in the design or operation of internal control over financial reporting which are
reasonably likely to adversely affect the registrant’s ability to record, process, summarize and report financial information; and
b) any fraud, whether or not material, that involves management or other employees who have a significant role in the registrant’s internal
control over financial reporting.
Date: September 5, 2013 /s/ DAVID J. LARUE
Name: David J. LaRue
Title: President and Chief Executive Officer
7/29/2019 ForestCityEnterprisesInc 8 Copy
http://slidepdf.com/reader/full/forestcityenterprisesinc-8-copy 67/69
Exhibit 31.2
PRINCIPAL FINANCIAL OFFICER’S CERTIFICATION
PURSUANT TO SECTION 302 OF THE SARBANES-OXLEY ACT OF 2002
I, Robert G. O’Brien, certify that:
1. I have reviewed this quarterly report for the three and six months ended July 31, 2013 on Form 10-Q of Forest City Enterprises, Inc.;
2. Based on my knowledge, this report does not contain any untrue statement of a material fact or omit to state a material fact necessary to make thestatements made, in light of the circumstances under which such statements were made, not misleading with respect to the period covered by this
report;
3. Based on my knowledge, the financial statements, and other financial information included in this report, fairly present in all material respects the
financial condition, results of operations and cash flows of the registrant as of, and for, the periods presented in this report;
4. The registrant’s other certifying officer and I are responsible for establishing and maintaining disclosure controls and procedures (as defined in
Exchange Act Rules 13a-15(e) and 15d-15(e)) and internal control over financial reporting (as defined in Exchange Act Rules 13a-15(f) and 15d-
15(f)) for the registrant and have:
a) designed such disclosure controls and procedures, or caused such disclosure controls and procedures to be designed under our
supervision, to ensure that material information relating to the registrant, including its consolidated subsidiaries, is made known to us by
others within those entities, particularly during the period in which this report is being prepared;
b) designed such internal control over financial reporting, or caused such internal control over financial reporting to be designed under our
supervision, to provide reasonable assurance regarding the reliability of financial reporting and the preparation of financial statements for
external purposes in accordance with generally accepted accounting principles;
c) evaluated the effectiveness of the registrant’s disclosure controls and procedures and presented in this report our conclusions about the
effectiveness of the disclosure controls and procedures, as of the end of the period covered by this report based on such evaluation; and
d) disclosed in this report any change in the registrant’s internal control over financial reporting that occurred during the registrant’s most
recent fiscal quarter (the registrant’s fourth fiscal quarter in the case of an annual report) that has materially affected, or is reasonably likely
to materially affect, the registrant’s internal control over financial reporting; and
5. The registrant’s other certifying officer and I have disclosed, based on our most recent evaluation of internal control over financial reporting, to the
registrant’s auditors and the audit committee of the registrant’s board of directors (or persons performing the equivalent functions):
a) all significant deficiencies and material weaknesses in the design or operation of internal control over financial reporting which are
reasonably likely to adversely affect the registrant’s ability to record, process, summarize and report financial information; and
b) any fraud, whether or not material, that involves management or other employees who have a significant role in the registrant’s internal
control over financial reporting.
Date: September 5, 2013 /s/ ROBERT G. O’BRIEN
Name: Robert G. O’Brien
Title: Executive Vice President and
Chief Financial Officer
7/29/2019 ForestCityEnterprisesInc 8 Copy
http://slidepdf.com/reader/full/forestcityenterprisesinc-8-copy 68/69
Exhibit 32.1
CERTIFICATION PURSUANT TO
18 U.S.C. SECTION 1350,
AS ADOPTED PURSUANT TO
SECTION 906 OF THE SARBANES-OXLEY ACT OF 2002
In connection with the quarterly report of Forest City Enterprises, Inc. (the “Company”) on Form 10-Q for the three and six months ended July 31, 2013 , as
filed with the Securities and Exchange Commission on the date hereof (the “Report”), each of the undersigned officers of the Company certifies, pursuant to 18U.S.C. § 1350, as adopted pursuant to § 906 of the Sarbanes-Oxley Act of 2002, that, to such officer’s knowledge:
(1) The Report fully complies with the requirements of Section 13(a) or 15(d) of the Securities Exchange Act of 1934; and
(2) The information contained in the Report fairly presents, in all material respects, the financial condition and results of operations of the
Company as of the dates and for the periods expressed in the Report.
Date: September 5, 2013 /s/ DAVID J. LARUE
Name: David J. LaRue
Title: President and Chief Executive Officer
/s/ ROBERT G. O’BRIEN
Name: Robert G. O’Brien
Title: Executive Vice President and
Chief Financial Officer
The foregoing certification is being furnished solely pursuant to 18 U.S.C. § 1350 and is not being filed as part of the Report or as a separate disclosure
document.

7/29/2019 ForestCityEnterprisesInc 8 Copy
http://slidepdf.com/reader/full/forestcityenterprisesinc-8-copy 69/69