forest stand structure and composition in 96 sites along
TRANSCRIPT
Data Papers
Ecology, 91(10), 2010, p. 3118� 2010 by the Ecological Society of America
Forest stand structure and composition in 96 sites alongenvironmental gradients in the central Western Ghats of India
Ecological Archives E091-216
B. R. RAMESH,1 M. H. SWAMINATH,2 SANTOSHGOUDA V. PATIL,1 DASAPPA,2 RAPHAEL PELISSIER,1,3,5
P. DILIP VENUGOPAL,1,4 S. ARAVAJY,1 CLAIRE ELOUARD,1 AND S. RAMALINGAM1
1French Institute of Pondicherry, UMIFRE 21 CNRS-MAEE, 11 St Louis Street, Puducherry 605001 India2Karnataka Forest Department, Aranya Bhavan, 18th Cross, Malleshwaram, Bangalore 560003 India
3IRD, UMR AMAP, Montpellier, F-34000 France4Department of Entomology, University of Maryland, 4124 Plant Sciences Building, College Park, Maryland 20742-4454 USA
Abstract. This data set reports woody plant species abundances in a network of 96sampling sites spread across 22 000 km2 in the central Western Ghats region, Karnataka, India(748150–758400 E; 158150–138300 N). Due to its varied climate and diverse topography, thestudy area, which is part of the Western Ghats–Sri Lanka biodiversity hotspot, supports awide array of non-equatorial tropical habitats including wet evergreen, moist and drydeciduous, and intact as well as degraded forests and scrublands. These formations,floristically moderately rich and diversified, are characterized by a lower rate of endemismthan in the southern part of the Western Ghats. This data paper provides abundance and girthdata for 76 813 trees and lianas of 446 species collected in 96 sampling sites during 1996–1997.A total of 61 965 individuals �10-cm girth at breast height (gbh) were recorded in 96 1-hamacroplots, while 14 848 individuals ,10 cm gbh, but .1 m height, were sampled in three 0.1-ha microplots located within each macroplot. Additional data regarding the stand structure(average canopy height, percent canopy cover, number of strata) and the level of degradationare available for the macroplots, along with environmental data derived from other sourcesand analyses, such as soil types, rainfall, length of the dry season, and altitude. These datahave been used to produce ecological research papers, as well as to elaborate conservationvalue maps and recommendations toward sustainable management of the forests of the centralWestern Ghats region.
Key words: biodiversity sampling plots; central Western Ghats; India; Karnataka; mesoscale plotnetwork; plant species abundances; tropical forest types.
Manuscript received 27 January 2010; accepted 24 May 2010. Corresponding Editor: W. K. Michener.5 Corresponding author. E-mail: [email protected]
The complete data sets corresponding to abstracts published in the Data Papers section of the journal are publishedelectronically in Ecological Archives at hhttp://esapubs.org/archivei. (The accession number for each Data Paper is givendirectly beneath the title.)
3118

Ecological Archives E091-216-D1
B. R. Ramesh, M. H. Swaminath, Santoshgouda V. Patil, Dasappa, Raphaël Pélissier, P. Dilip Venugopal, S.Aravajy, Claire Elouard, and S. Ramalingam. 2010. Forest stand structure and composition in 96 sites alongenvironmental gradients in the central Western Ghats of India. Ecology 91:3118.
Abstract: This data set reports woody plant species abundances in a network of 96 sampling sites spread across 22000 km2 in centralWestern Ghats region, Karnataka, India (74°15' – 75°40' E; 15°15' – 13°30' N). Due to its varied climate and diverse topography, the studyarea, which is part of the Western Ghats–Sri Lanka biodiversity hotspot, supports a wide array of non-equatorial tropical habitats includingwet evergreen, moist and dry deciduous intact as well as degraded forests and scrublands. These formations, floristically moderately rich anddiversified, are characterized by a lower rate of endemism than in the southern part of the Western Ghats. This data paper provides abundanceand girth data for 76813 trees and lianas of 446 species collected in 96 sampling sites during 1996–1997. A total of 61965 individuals >10 cmgirth at breast height (gbh) were recorded in 96 1-ha macroplots, while 14848 individuals <10 cm gbh but >1 m height were sampled in three0.1-ha microplots located within each macroplot. Additional data regarding the stand structure (average canopy height, percent canopy cover,number of strata) and the level of degradation are available for the macroplots, along with environmental data derived from other sources andanalyses, such as soil types, rainfall, length of the dry season, and altitude. These data have been used to produce ecological research papersas well as to elaborate conservation value maps and recommendations toward sustainable management of the forests of the central WesternGhats region.
Key words: biodiversity sampling plots; central Western Ghats; India; Karnataka; mesoscale plot network; plant species abundances;tropical forest types.
INTRODUCTION
Patterns of floristic diversity at the mesoscale (Holt 1993) deserve particular attention as they are of direct relevance to operationalmanagement and conservation of natural resources. Particularly in tropical regions where the natural vegetation persists only as fragments,data on forest stand structure and composition gathered across large scale environmental and/or degradation gradients, aid in defining andmapping forest types (Condit 1996). Such data also enables understanding forest succession and dynamics (Sheil et al. 2000) as well astesting hypotheses about the ecological processes through which species diversity is maintained (e.g., Couteron et al. 2003, Munoz et al.2007). However, if vast areas of the humid tropics have been sampled by forest services, large-scale reliable floristic data are generally scarceand limit ecological studies.
This data paper documents the abundance of woody plant species in a network of 96 sampling sites that covers an area of about 22000 km2
in the central Western Ghats region, Karnataka, India, which belongs to the Western Ghats–Sri Lanka biodiversity hotspot (Myers et al.2000). The sampling plots, laid out in 1996–1997 in the framework of a collaborative project between the Karnataka Forest Department andthe French Institute of Pondicherry, are 1-ha in size and sample a wide array of habitats including wet evergreen, moist and dry deciduous,intact as well as degraded forests and scrublands. A total of 61965 individuals of 400 trees and lianas species with girth at breast height (gbh)equal or above 10 cm were recorded in the 1-ha plots (macroplots), while 14848 individuals of 334 species less than 10 cm dbh but more than1 m height were recorded within 3 0.1-ha subsamples (microplots) in each macroplot. Additional data on stand level structural parameters(mean canopy height, canopy cover, etc.), disturbance level as well as bioclimatic variables (rainfall, dry season length, etc.) are alsoprovided.
This data set has already been used to publish ecological research papers (Munoz et al.2007, 2008, Ramesh et al.2010b) as well as to deriveconservation value maps and recommendations towards sustainable management of the forests of the central Western Ghats region (Rameshand Swaminath 1999, Ramesh et al. 1999, 2009a,b).
METADATA
CLASS I. DATA DESCRIPTORS
A. Data Set Identity. Karnataka Biodiversity Sampling Plots, Western Ghats, India
B. Data Identification Code. IFP_ECODATA_KBSP_v4
C. Data Set Descriptors.
1. Originators.
B. R. Ramesh ([email protected]) and S. V. Patil, Ecology Department, French Institute of Pondicherry, 11 St. Louis Street,Puducherry 605001, India;
M. H. Swamminath and Desappa, Forest Research Institute, Karnataka Forest Department, Aranya Bhavan, 18th Cross, Malleswaram,Bangalore 560003, India.
2. Abstract. This data set reports woody plant species abundances in a network of 96 sampling sites spread across 22000 km2 in centralWestern Ghats region, Karnataka, India (74°15' to 75°40' E; 15°15' to 13°30' N). Due to its varied climate and diverse topography, the studyarea, which is part of the Western Ghats–Sri Lanka biodiversity hotspot, supports a wide array of non-equatorial tropical habitats includingwet evergreen, moist and dry deciduous intact as well as degraded forests and scrublands. These formations, floristically moderately rich anddiversified, are characterized by a lower rate of endemism than in the southern part of the Western Ghats. This data paper provides abundanceand girth data for 76813 trees and lianas of 446 species collected in 96 sampling sites in 1996–1997. A total of 61965 individuals >10 cmgirth at breast height (gbh) were recorded in 96 1-ha macroplots, while 14848 individuals <10 cm gbh but >1 m height were sampled in 30.1-ha microplots located within each macroplot. Additional data regarding the stand structure (average canopy height, percentage of canopycover, number of strata) and the level of degradation are available for the macroplots, along with environmental data derived from other
sources and analyses, such as soil types, rainfall, length of the dry season, and altitude. These data have been used to produce ecologicalresearch papers as well as to elaborate conservation value maps and recommendations towards sustainable management of the forests of thecentral Western Ghats region.
D. Key Words: biodiversity sampling plots; central Western Ghats; India; Karnataka; mesoscale plot network; plant species abundances;tropical forest types.
CLASS II. RESEARCH ORIGIN DESCRIPTORS
A. Overall Project description.
1. Identity. Assessment and conservation of forest biodiversity in the Western Ghats of Karnataka, India.
2. Originators.
B. R. Ramesh ([email protected]), Ecology Department, French Institute of Pondicherry, 11 St. Louis Street, Puducherry 605001,India;
M. H. Swamminath, Forest Research Institute, Karnataka Forest Department, Aranya Bhavan, 18th Cross, Malleswaram, Bangalore 560003,India.
3. Period of Study. 1996–1999.
4. Objectives. This project responded to a need for an integrated, comprehensive resource management approach, through the development ofnew policies to protect and conserve the ecologically and economically valuable forests of the central Western Ghats region of Karnataka,India. Based on regional level vegetation mapping, landscape scale analyses of forest status and fine scale studies on impacts of disturbanceon the forest structure and composition, the project has elaborated conservation value maps and recommendations towards the sustainablemanagement of forests.
5. Abstract. Within the framework of the Western Ghats Forestry Project (http://www.odi.org.uk/projects/98-99-tropical-forestry/projects/3275.htm), the Forest Research Institute of the Karnataka Forest Department (KFD), in the mid 1990s, has established anetwork of 102 1-ha Biodiversity Sampling Plots covering a wide range of vegetation in the central Western Ghats region of Karnataka State,India. The original project, among other objectives, aimed at delineating zones for management considerations based on forest status anddistribution, along with details on anthropogenic pressures. Between 1996–1999, under the aegis of the project "Assessment andConservation of Forest Biodiversity in the Western Ghats of Karnataka, India" funded by the Fonds Français pour l'Environnement Mondial(FFEM; http://whc.unesco.org/en/ffem), the botanists of the French Institute of Pondicherry (FIP) collaborated with KFD to review thetaxonomic identification of the plant species in 96 of the 100 ! 100 m macroplots established by KFD (six plots located in plantations werenot considered). They also enumerated all woody plants below 10 cm gbh but above 1 m height in three microplots of 10 ! 10 m locatedwithin each macroplot. The FFEM project comprised of three separate components: The FFEM project comprised of three separatecomponents: (1) an update of the forest maps of South India in order to assess the forest cover changes between 1977 and 1997, whichrevealed a loss of ca. 12% of the forest area in 20 years, concentrated in zones already degraded and fragmented (i.e., outside the "reserveforests"), and attributed primarily to the extension of coffee plantations; (2) an assessment of tree biodiversity from the network of plotsreported here, which showed that a strong interaction between bioclimatic and anthropogenic (disturbance regime) factors predicted the majorforest types in the region; and (3) an in-depth study of the impact of selective logging on the wet evergreen forest of the Kadamakal ReserveForest, which revealed that a minimum rotation of 30–40 years between two successive harvests was necessary to allow the forest to recoverin terms of biomass, structure and floristic composition. Results from these studies have yielded conservation value maps and priorities forforest conservation (Ramesh and Swaminath 1999, Ramesh et al. 2009a,b) as well as updated 1:250,000 forest maps of South India (Pascal etal. 1982–1997a,b,c) and a few scientific papers (Pascal et al. 1998, Pélissier et al. 1998, Guero and Ramesh 1999, Ramesh et al. 1999).
B. Brief subproject description.
1. Site description.
• Site type. Network of forest sampling plots covering various non-equatorial tropical forest types in various degradation stages.
• Geography. The study area is located between 74°15' E to 75°40 E' and 15°15' to 13°30' N coordinates, falling within the administrativeboundaries of Uttara Kannada, Shimoga, and Chikmagalur districts of Karnataka State in south-west India. The total area covered isestimated to be ca. 21970 km2 of the central Western Ghats (WG) region, and extends from the coastal plain of the Arabian Sea to the humidhill zone (locally called Malnad) at the foot of the Western Ghats 'great escarpment', and to the Karnataka plateau (locally called Maidan),which overlooks the coastal lowlands and recedes towards the eastern upland region. Sampling plots were located up to 80 km and 125 kminland, in the northern and southern portions of the study area, respectively (Fig. 1).
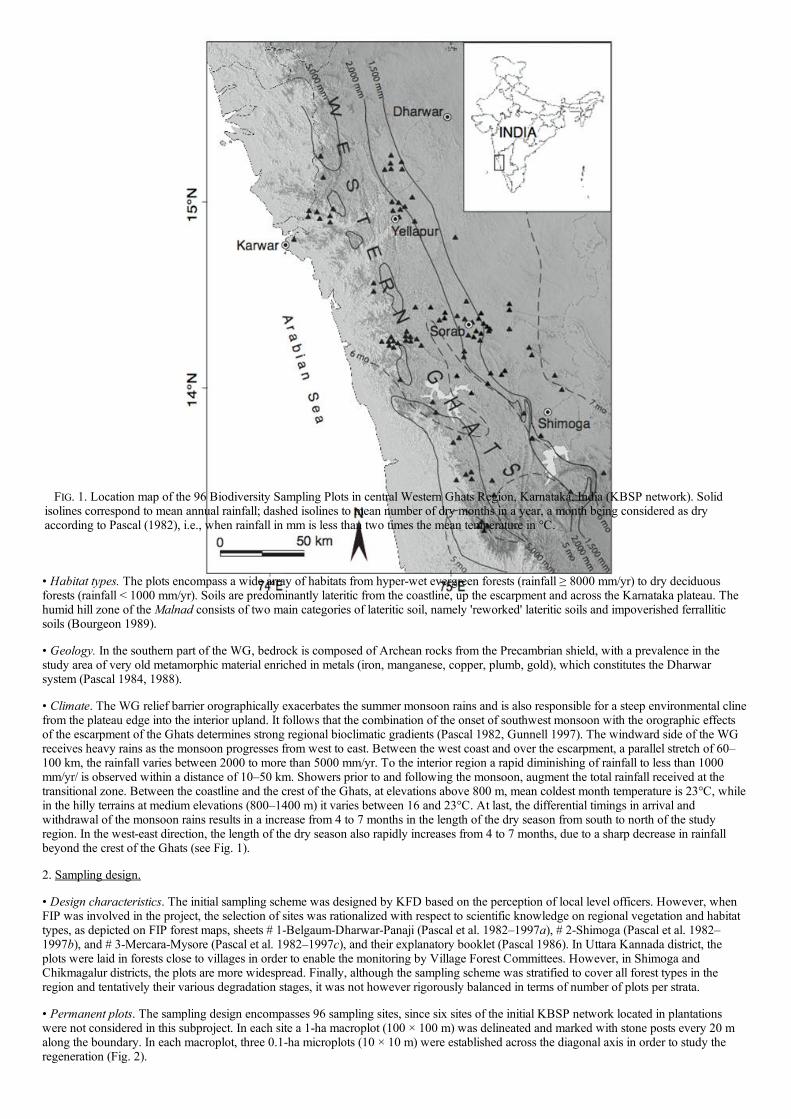
FIG. 1. Location map of the 96 Biodiversity Sampling Plots in central Western Ghats Region, Karnataka, India (KBSP network). Solidisolines correspond to mean annual rainfall; dashed isolines to mean number of dry months in a year, a month being considered as dryaccording to Pascal (1982), i.e., when rainfall in mm is less than two times the mean temperature in °C.
• Habitat types. The plots encompass a wide array of habitats from hyper-wet evergreen forests (rainfall ! 8000 mm/yr) to dry deciduousforests (rainfall < 1000 mm/yr). Soils are predominantly lateritic from the coastline, up the escarpment and across the Karnataka plateau. Thehumid hill zone of the Malnad consists of two main categories of lateritic soil, namely 'reworked' lateritic soils and impoverished ferralliticsoils (Bourgeon 1989).
• Geology. In the southern part of the WG, bedrock is composed of Archean rocks from the Precambrian shield, with a prevalence in thestudy area of very old metamorphic material enriched in metals (iron, manganese, copper, plumb, gold), which constitutes the Dharwarsystem (Pascal 1984, 1988).
• Climate. The WG relief barrier orographically exacerbates the summer monsoon rains and is also responsible for a steep environmental clinefrom the plateau edge into the interior upland. It follows that the combination of the onset of southwest monsoon with the orographic effectsof the escarpment of the Ghats determines strong regional bioclimatic gradients (Pascal 1982, Gunnell 1997). The windward side of the WGreceives heavy rains as the monsoon progresses from west to east. Between the west coast and over the escarpment, a parallel stretch of 60–100 km, the rainfall varies between 2000 to more than 5000 mm/yr. To the interior region a rapid diminishing of rainfall to less than 1000mm/yr/ is observed within a distance of 10–50 km. Showers prior to and following the monsoon, augment the total rainfall received at thetransitional zone. Between the coastline and the crest of the Ghats, at elevations above 800 m, mean coldest month temperature is 23°C, whilein the hilly terrains at medium elevations (800–1400 m) it varies between 16 and 23°C. At last, the differential timings in arrival andwithdrawal of the monsoon rains results in a increase from 4 to 7 months in the length of the dry season from south to north of the studyregion. In the west-east direction, the length of the dry season also rapidly increases from 4 to 7 months, due to a sharp decrease in rainfallbeyond the crest of the Ghats (see Fig. 1).
2. Sampling design.
• Design characteristics. The initial sampling scheme was designed by KFD based on the perception of local level officers. However, whenFIP was involved in the project, the selection of sites was rationalized with respect to scientific knowledge on regional vegetation and habitattypes, as depicted on FIP forest maps, sheets # 1-Belgaum-Dharwar-Panaji (Pascal et al. 1982–1997a), # 2-Shimoga (Pascal et al. 1982–1997b), and # 3-Mercara-Mysore (Pascal et al. 1982–1997c), and their explanatory booklet (Pascal 1986). In Uttara Kannada district, theplots were laid in forests close to villages in order to enable the monitoring by Village Forest Committees. However, in Shimoga andChikmagalur districts, the plots are more widespread. Finally, although the sampling scheme was stratified to cover all forest types in theregion and tentatively their various degradation stages, it was not however rigorously balanced in terms of number of plots per strata.
• Permanent plots. The sampling design encompasses 96 sampling sites, since six sites of the initial KBSP network located in plantationswere not considered in this subproject. In each site a 1-ha macroplot (100 " 100 m) was delineated and marked with stone posts every 20 malong the boundary. In each macroplot, three 0.1-ha microplots (10 " 10 m) were established across the diagonal axis in order to study theregeneration (Fig. 2).
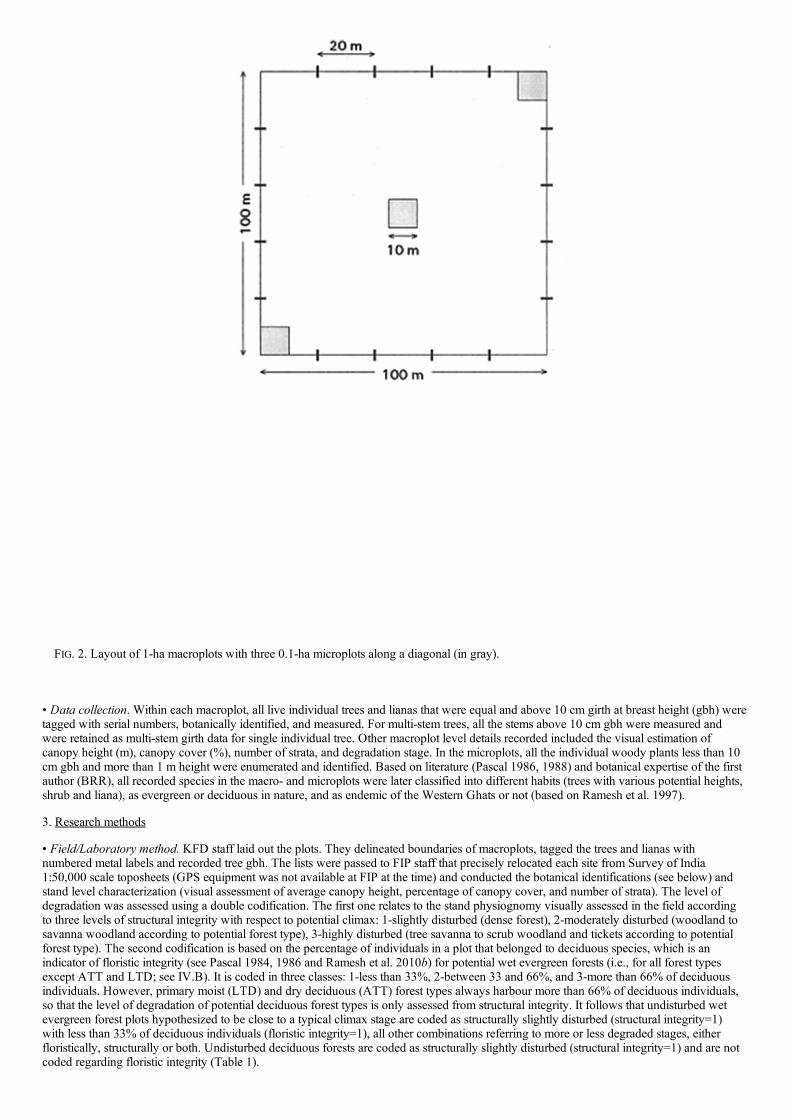
FIG. 2. Layout of 1-ha macroplots with three 0.1-ha microplots along a diagonal (in gray).
• Data collection. Within each macroplot, all live individual trees and lianas that were equal and above 10 cm girth at breast height (gbh) weretagged with serial numbers, botanically identified, and measured. For multi-stem trees, all the stems above 10 cm gbh were measured andwere retained as multi-stem girth data for single individual tree. Other macroplot level details recorded included the visual estimation ofcanopy height (m), canopy cover (%), number of strata, and degradation stage. In the microplots, all the individual woody plants less than 10cm gbh and more than 1 m height were enumerated and identified. Based on literature (Pascal 1986, 1988) and botanical expertise of the firstauthor (BRR), all recorded species in the macro- and microplots were later classified into different habits (trees with various potential heights,shrub and liana), as evergreen or deciduous in nature, and as endemic of the Western Ghats or not (based on Ramesh et al. 1997).
3. Research methods
• Field/Laboratory method. KFD staff laid out the plots. They delineated boundaries of macroplots, tagged the trees and lianas withnumbered metal labels and recorded tree gbh. The lists were passed to FIP staff that precisely relocated each site from Survey of India1:50,000 scale toposheets (GPS equipment was not available at FIP at the time) and conducted the botanical identifications (see below) andstand level characterization (visual assessment of average canopy height, percentage of canopy cover, and number of strata). The level ofdegradation was assessed using a double codification. The first one relates to the stand physiognomy visually assessed in the field accordingto three levels of structural integrity with respect to potential climax: 1-slightly disturbed (dense forest), 2-moderately disturbed (woodland tosavanna woodland according to potential forest type), 3-highly disturbed (tree savanna to scrub woodland and tickets according to potentialforest type). The second codification is based on the percentage of individuals in a plot that belonged to deciduous species, which is anindicator of floristic integrity (see Pascal 1984, 1986 and Ramesh et al. 2010b) for potential wet evergreen forests (i.e., for all forest typesexcept ATT and LTD; see IV.B). It is coded in three classes: 1-less than 33%, 2-between 33 and 66%, and 3-more than 66% of deciduousindividuals. However, primary moist (LTD) and dry deciduous (ATT) forest types always harbour more than 66% of deciduous individuals,so that the level of degradation of potential deciduous forest types is only assessed from structural integrity. It follows that undisturbed wetevergreen forest plots hypothesized to be close to a typical climax stage are coded as structurally slightly disturbed (structural integrity=1)with less than 33% of deciduous individuals (floristic integrity=1), all other combinations referring to more or less degraded stages, eitherfloristically, structurally or both. Undisturbed deciduous forests are coded as structurally slightly disturbed (structural integrity=1) and are notcoded regarding floristic integrity (Table 1).
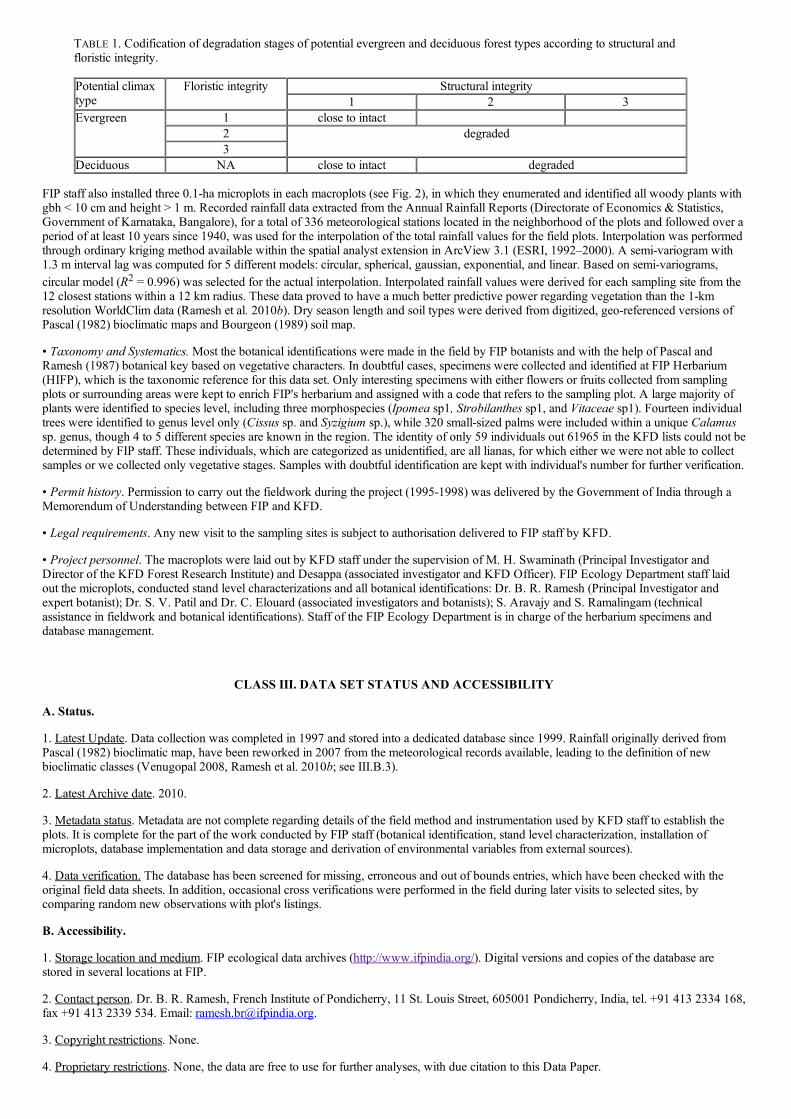
TABLE 1. Codification of degradation stages of potential evergreen and deciduous forest types according to structural andfloristic integrity.
Potential climaxtype
Floristic integrity Structural integrity1 2 3
Evergreen
1 close to intact2 degraded3
Deciduous NA close to intact degraded
FIP staff also installed three 0.1-ha microplots in each macroplots (see Fig. 2), in which they enumerated and identified all woody plants withgbh < 10 cm and height > 1 m. Recorded rainfall data extracted from the Annual Rainfall Reports (Directorate of Economics & Statistics,Government of Karnataka, Bangalore), for a total of 336 meteorological stations located in the neighborhood of the plots and followed over aperiod of at least 10 years since 1940, was used for the interpolation of the total rainfall values for the field plots. Interpolation was performedthrough ordinary kriging method available within the spatial analyst extension in ArcView 3.1 (ESRI, 1992–2000). A semi-variogram with1.3 m interval lag was computed for 5 different models: circular, spherical, gaussian, exponential, and linear. Based on semi-variograms,circular model (R2 = 0.996) was selected for the actual interpolation. Interpolated rainfall values were derived for each sampling site from the12 closest stations within a 12 km radius. These data proved to have a much better predictive power regarding vegetation than the 1-kmresolution WorldClim data (Ramesh et al. 2010b). Dry season length and soil types were derived from digitized, geo-referenced versions ofPascal (1982) bioclimatic maps and Bourgeon (1989) soil map.
• Taxonomy and Systematics. Most the botanical identifications were made in the field by FIP botanists and with the help of Pascal andRamesh (1987) botanical key based on vegetative characters. In doubtful cases, specimens were collected and identified at FIP Herbarium(HIFP), which is the taxonomic reference for this data set. Only interesting specimens with either flowers or fruits collected from samplingplots or surrounding areas were kept to enrich FIP's herbarium and assigned with a code that refers to the sampling plot. A large majority ofplants were identified to species level, including three morphospecies (Ipomea sp1, Strobilanthes sp1, and Vitaceae sp1). Fourteen individualtrees were identified to genus level only (Cissus sp. and Syzigium sp.), while 320 small-sized palms were included within a unique Calamussp. genus, though 4 to 5 different species are known in the region. The identity of only 59 individuals out 61965 in the KFD lists could not bedetermined by FIP staff. These individuals, which are categorized as unidentified, are all lianas, for which either we were not able to collectsamples or we collected only vegetative stages. Samples with doubtful identification are kept with individual's number for further verification.
• Permit history. Permission to carry out the fieldwork during the project (1995-1998) was delivered by the Government of India through aMemorendum of Understanding between FIP and KFD.
• Legal requirements. Any new visit to the sampling sites is subject to authorisation delivered to FIP staff by KFD.
• Project personnel. The macroplots were laid out by KFD staff under the supervision of M. H. Swaminath (Principal Investigator andDirector of the KFD Forest Research Institute) and Desappa (associated investigator and KFD Officer). FIP Ecology Department staff laidout the microplots, conducted stand level characterizations and all botanical identifications: Dr. B. R. Ramesh (Principal Investigator andexpert botanist); Dr. S. V. Patil and Dr. C. Elouard (associated investigators and botanists); S. Aravajy and S. Ramalingam (technicalassistance in fieldwork and botanical identifications). Staff of the FIP Ecology Department is in charge of the herbarium specimens anddatabase management.
CLASS III. DATA SET STATUS AND ACCESSIBILITY
A. Status.
1. Latest Update. Data collection was completed in 1997 and stored into a dedicated database since 1999. Rainfall originally derived fromPascal (1982) bioclimatic map, have been reworked in 2007 from the meteorological records available, leading to the definition of newbioclimatic classes (Venugopal 2008, Ramesh et al. 2010b; see III.B.3).
2. Latest Archive date. 2010.
3. Metadata status. Metadata are not complete regarding details of the field method and instrumentation used by KFD staff to establish theplots. It is complete for the part of the work conducted by FIP staff (botanical identification, stand level characterization, installation ofmicroplots, database implementation and data storage and derivation of environmental variables from external sources).
4. Data verification. The database has been screened for missing, erroneous and out of bounds entries, which have been checked with theoriginal field data sheets. In addition, occasional cross verifications were performed in the field during later visits to selected sites, bycomparing random new observations with plot's listings.
B. Accessibility.
1. Storage location and medium. FIP ecological data archives (http://www.ifpindia.org/). Digital versions and copies of the database arestored in several locations at FIP.
2. Contact person. Dr. B. R. Ramesh, French Institute of Pondicherry, 11 St. Louis Street, 605001 Pondicherry, India, tel. +91 413 2334 168,fax +91 413 2339 534. Email: [email protected].
3. Copyright restrictions. None.
4. Proprietary restrictions. None, the data are free to use for further analyses, with due citation to this Data Paper.
CLASS IV. DATA STRUCTURAL DESCRIPTORS
A. Data set file.
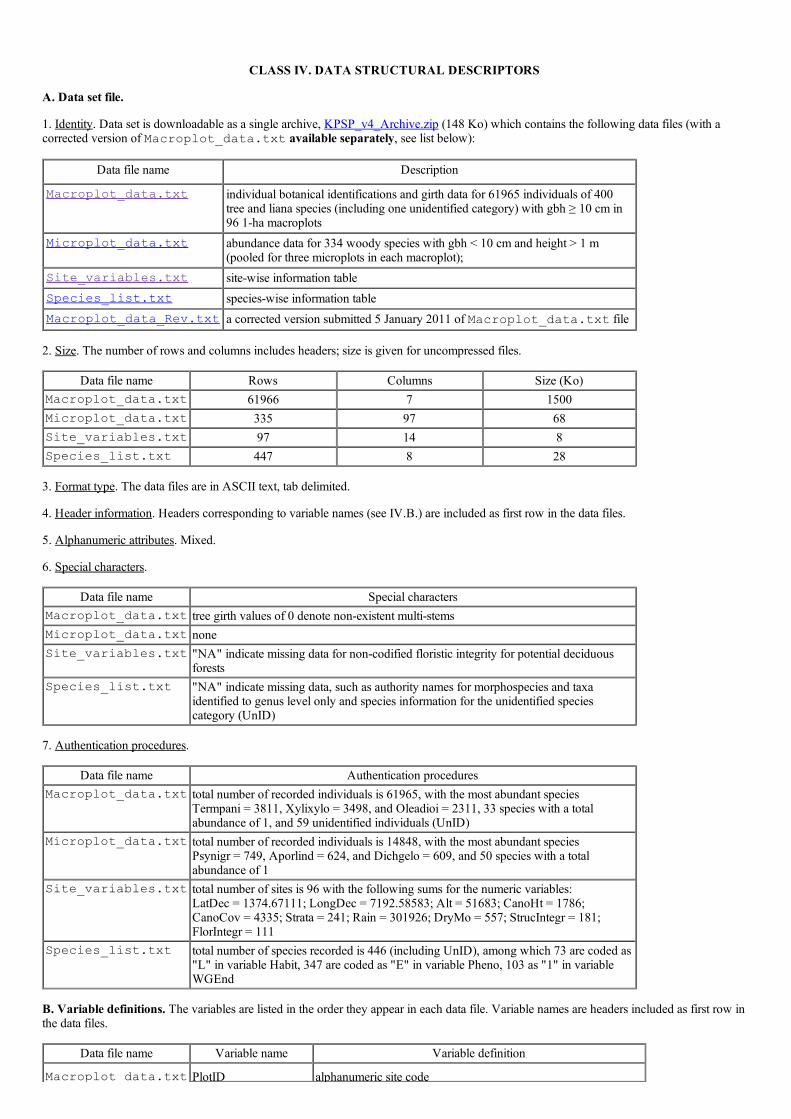
1. Identity. Data set is downloadable as a single archive, KPSP_v4_Archive.zip (148 Ko) which contains the following data files (with acorrected version of Macroplot_data.txt available separately, see list below):
Data file name Description
Macroplot_data.txt individual botanical identifications and girth data for 61965 individuals of 400tree and liana species (including one unidentified category) with gbh ! 10 cm in96 1-ha macroplots
Microplot_data.txt abundance data for 334 woody species with gbh < 10 cm and height > 1 m(pooled for three microplots in each macroplot);
Site_variables.txt site-wise information tableSpecies_list.txt species-wise information tableMacroplot_data_Rev.txt a corrected version submitted 5 January 2011 of Macroplot_data.txt file
2. Size. The number of rows and columns includes headers; size is given for uncompressed files.
Data file name Rows Columns Size (Ko)Macroplot_data.txt 61966 7 1500Microplot_data.txt 335 97 68Site_variables.txt 97 14 8Species_list.txt 447 8 28
3. Format type. The data files are in ASCII text, tab delimited.
4. Header information. Headers corresponding to variable names (see IV.B.) are included as first row in the data files.
5. Alphanumeric attributes. Mixed.
6. Special characters.
Data file name Special charactersMacroplot_data.txt tree girth values of 0 denote non-existent multi-stemsMicroplot_data.txt noneSite_variables.txt "NA" indicate missing data for non-codified floristic integrity for potential deciduous
forestsSpecies_list.txt "NA" indicate missing data, such as authority names for morphospecies and taxa
identified to genus level only and species information for the unidentified speciescategory (UnID)
7. Authentication procedures.
Data file name Authentication proceduresMacroplot_data.txt total number of recorded individuals is 61965, with the most abundant species
Termpani = 3811, Xylixylo = 3498, and Oleadioi = 2311, 33 species with a totalabundance of 1, and 59 unidentified individuals (UnID)
Microplot_data.txt total number of recorded individuals is 14848, with the most abundant speciesPsynigr = 749, Aporlind = 624, and Dichgelo = 609, and 50 species with a totalabundance of 1
Site_variables.txt total number of sites is 96 with the following sums for the numeric variables:LatDec = 1374.67111; LongDec = 7192.58583; Alt = 51683; CanoHt = 1786;CanoCov = 4335; Strata = 241; Rain = 301926; DryMo = 557; StrucIntegr = 181;FlorIntegr = 111
Species_list.txt total number of species recorded is 446 (including UnID), among which 73 are coded as"L" in variable Habit, 347 are coded as "E" in variable Pheno, 103 as "1" in variableWGEnd
B. Variable definitions. The variables are listed in the order they appear in each data file. Variable names are headers included as first row inthe data files.
Data file name Variable name Variable definition
Macroplot_data.txt PlotID alphanumeric site code

Macroplot_data.txtSpCode alphanumeric species codeTreeGirth1 girth measurement for the largest stem with gbh ! 10 cm (in cm
rounded to unity)TreeGirth2 toTreeGirth5
additional girth measurement in decreasing order for extra-stemswith gbh ! 10 cm (in cm rounded to unity); value of 0 indicatesthat the stem doesn't exist
Microplot_data.txt SpCode alphanumeric species codeColumns 2 to 97 alphanumeric sites codes corresponding to variable PlotID
Site_variables.txt PlotID alphanumeric site codeForestDiv administrative forest division where is located the site (according
to KFD nomenclature)LatDec and
LongDec
latitudinal and longitudinal coordinates in decimal degreesextrapolated from Survey of India 1:50,000 scale toposheets
Alt elevation above mean sea level in meters, extrapolated fromSurvey of India 1:50,000 scale toposheets
CanoHt visual estimation of average canopy height in the macroplots (inm)
CanoCov visual estimation of percentage of canopy cover in the macroplotsStrata visual estimation of the number of forest strata observed in the
macroplotsRain mean annual rainfall (in mm/yr) interpolated at each site from 336
meteorological stations located in the neighbourhood andfollowed over a period of at least 10 years (see II.B.3)
DryMo length of the dry season (in mo) at the site derived from a geo-referenced digital version of the 1:500,000 scale bioclimatic mapof Pascal (1982), with the definition that a month is considered asdry when rainfall (in mm) is less than two times the meantemperature (in °C)
ForestType code for potential climax forest type according to Pascal (1984,1986 and 1988):
• ATT = Anogeissus latifolia - Tectona grandis - Terminaliatomentosa
• DDD = Dipterocarpus indicus - Diospyros candolleana -Diospyros oocarpa
• DDD+P = Poecilonueron indicum facies of Dipterocarpusindicus - Diospyros candolleana - Diospyros oocarpa
• DHP = Dipterocarpus indicus - Humboldtia brunonis -Poeciloneuron indicum
• DP = Dipterocarpus indicus - Persea macrantha
• KAN = Diospyros spp. - Dysoxylum malabaricum - Perseamacrantha (kan forest)
• LTD = Lagestroemia microcarpa - Tectona grandis - Dilleniapentagyna
• MSA = Memecylon umbellatum – Syzygium cumini –Actinodaphne angustifolia
• PDH = Persea macrantha - Diospyros spp. - Holigarna spp.
• PPH = Palaquium ellipticum - Poeciloneuron indicum - Hopeaponga
Soil code for morpho-pedological landscape types derived from a geo-referenced digital version of the 1:1,000,000 scale soil map ofBourgeon(1989):
• S2 = dissected hilly hinterland of the coastal area
• S3 = Western Ghats escarpment and residual hills in the coastalarea
• S4 = strongly dissected high level back slope of the Ghats(Malnad)

• S6 = partially dissected intermediate levels backslope of theGhats (Malnad) on greywackes
• S7 = partially dissected intermediate levels backslope of theGhats (Malnad) on gneisses and granites
• S8 = strongly dissected (dense hydrographic network)intermediate levels back slope of the Ghats (Malnad) ongreywackes
• S10 = degraded intermediate levels with large convexo-concaverelief of the transitional area (semi-Malnad)
• S11 = degraded intermediate levels with smooth convexo-concave relief of the transitional area (semi-Malnad)
• S13 = residual reliefs of the semi-arid area (Maidan)
StrucIntegr class of structural integrity from visual assessement of plotphysiognomy (see II.B.3):
• 1 = slightly disturbed
• 2 = moderately disturbed
• 3 = highly disturbedFlorIntegr class of floristic integrity from the percentage of individuals
belonging to deciduous species (for potential wet evergreen foresttypes only; see II.B.3):
• 1 = less than 33%
• 2 = between 33 and 66%
• 3 = more than 66%Species_list.txt SpCode Alphanumeric species code built from the first four letters of the
genus name and first four letters of the specific epithet, except for:the 3 morphospecies, which are coded as Ipomsp1, Strobsp1 andVitaceae1, respectively; the 3 genus level only identified taxa,which are coded as Cisssp., Syzisp. and Calasp; and theunidentified species, which are coded as UniID
Name complete latin name of species updated from latest synonymybased on Ramesh et al. (2010a)
Author authority name for the speciesSynonym old latin names of species used in the original databaseFamily botanical family to which belong the speciesHabit Species habit coded as (from Pascal 1984, 1988 and Ramesh et
al. 1997):
• S = shrub
• L = liana
• T1 = tree with potential height < 8 m
• T2 = tree with potential height ! 8 and < 16 m
• T3 = tree with potential height !16 and < 24 m
• T4 = tree with potential height ! 24 and < 34 m
• T5 = tree with potential height ! 34 mPheno phenological feature of species (from literature and botanists'
expertise) coded as:
• E = evergreen
• D = deciduousWGEnd binary code for species endemic to the Western Ghats of India
(from Ramesh et al. 1997, 2010a):
• 1 = endemic to the WG

• 0 = non-endemic to the WG
CLASS V. SUPPLEMENTARY DESCRIPTORS
A. Data acquisition.
1. Data forms. Initial census data (tree numbers and gbh measurements) for the macroplots were taken by KFD staff and passed to FIP staff aspaper lists, one for each macroplot. Macro- and microplots species identifications as well as plot level details were taken on specific emptydata sheets prepared in advance. An example of such data sheet is given in Ramesh and Swaminath (1999; see also Ramesh et al. 2009a).
2. Data entry/verification procedures. Data were computerized by FIP technicians who participated in the field measurements, one personreading the field sheet to another one entering the data in the computer while repeating what he heard (see also V.A.1 above). Further cross-verification procedures of the database have been implemented once the data entry completed.
B. Archiving. Original data sheets are stored at FIP Botany Lab. One master copy of the complete database and an extraction of the presentdata set are stored on the FIP server with several copies on computers and CDs at FIP.
C. Publications and results. A few related studies have been carried out by FIP staff and collaborators from this data set or parts thereof:Ramesh and Swaminath (1999), Ramesh et al. (1999), Belna (2006), Munoz et al. (2007, 2008), Venugopal (2008), Ramesh et al. (2009a,b,2010b).
D. History of data set usage. Part of this data set was requested in 2009 by I. Parmentier, post-doctoral fellow at Laboratoire d'éco-éthologieévolutive, Université Libre de Bruxelles, CP160/12, Av. F. D. Roosevelt 50, 1050 Brussels, Belgium.
VI. LITERATURE CITED
Belna, K. 2006. Analysis of the floristic variation across the 1-ha plots laid out in the Western Ghats of Karnataka for the FFEM project.French Institute, Pondicherry, Internal Report.
Bourdillon, T. F. 1908. Forest trees of Travancore. The Travancore Government Press, Trivandrum, India.
Bourgeon, G. 1989. Explanatory booklet on the reconnaissance soil map of forest area - Western Karnataka and Goa. Travaux de la SectionScientifique et Technique, Hors Série n°20. French Institute, Pondicherry, India.
Caius, J. F. 1986. The Medicinal and Poisonous Plants of India. Scientific Publishers, Jodhpur, India.
Chandrabose, M., and N. C. Nair. 1987. Flora of Coimbatore. Bishan Singh Mahendra Pal Singh, Dehra Dun, India.
Condit, R. 1996. Defining and mapping vegetation types in mega-diverse tropical forests. Trends in Ecology & Evolution 11:4–5.
Couteron, P., R. Pélissier, D. Mapaga, J.-F. Molino, and L. Tellier. 2003. Drawing ecological insights from a management-oriented forestinventory in French Guiana. Forest Ecology and Management 172: 89–108.
ESRI, 1992–2000. ArcView 3.1. Environmental Systems Research Institute, Redlands, Washington, USA.
Guero, M. C., and B. R. Ramesh. 1999. Forest vegetation maps to Western Ghats, GIS@Development 3:42–64.
Gunnell, Y. 1997. Relief and climate in south India: the influence of the Western Ghats on the current climate pattern of penisular India.International Journal of Climatology 17:1169–1182.
Holt, R. D. 1993. Ecology at the mesoscale: the influence of regional processes on local communities. Pages 77–88 in R. D. Ricklefs and D.Schluter, editors. Species diversity in ecological communities-Historical and geographical perspectives. University of Chicago Press,Chicago, Illinois, USA.
Jain, S. K. 1981. Glimpses of Indian Ethnobotany. Oxford and IBH Publishing, New Delhi, India.
Keshava Murthy, K. R., and S. N. Yoganarasimhan. 1990. Flora of Coorg. Vimsat Publishers, Bangalore, India.
Myers, N., R. Mittermeier, C. Mittermeier, G. Da Fonseca, and J. Kent. 2000. Biodiversity hot-spots for conservation priorities. Nature403:853–858.
Munoz, F., P. Couteron, B. R. Ramesh, and R. S. Etienne. 2007. Estimating parameters of neutral communities: from one single large toseveral small samples. Ecology 88:2482–2488.
Munoz, F., P. Couteron, and B. R. Ramesh. 2008. Beta-diversity in spatially implicit neutral models: a new way to assess species migration.The American Naturalist 172:116–127.
Pascal, J.-P. 1982. Bioclimates of the Western Ghats. Travaux de la Section Scientifique et Technique, Hors Série n°17. French Institute,Pondicherry, India.
Pascal, J.-P. 1984. Les forêts denses humides sempervirentes des Ghâts occidentaux de l'Inde : écologie, structure, floristique, succession.Travaux de la Section Scientifique et Technique n° 20. French Institute, Pondicherry, India.
Pascal, J.-P. 1986. Explanatory booklet on the forest map of south India (sheets: Belgaum-Dharwar-Panaji, Shimoga, Mercara-Mysore).Travaux de la Section Scientifique et Technique, Hors Série 18. French Institute, Pondicherry. http://hal.archives-ouvertes.fr/hal-00444285/fr/
Pascal, J.-P. 1988. Wet evergreen forests of the Western Ghats of India: ecology, structure, floristic composition and succession. Travaux dela Section Scientifique et Technique n° 20bis. French Institute, Pondicherry, India.
Pascal, J.-P., and B. R. Ramesh. 1987. A field key to the trees and lianas of evergreen forests of the Western Ghats (India).Publication duDepartement d'Ecologie n° 23. French Institute, Pondicherry, India.
Pascal, J.-P., S. Shyam-Sunder, and V. M. Meher-Homji. 1982–1997a. Forest Map of South India (Mercara-Mysore). Travaux de la SectionScientifique et Technique, Hors Série 18a. French Institute, Pondicherry. http://hal.archives-ouvertes.fr/hal-00444285/fr/
Pascal, J.-P., S. Shyam-Sunder, and V. M. Meher-Homji. 1982–1997b. Forest Map of South India (Belgaum-Darwar-Panaji). Travaux de laSection Scientifique et Technique, Hors Série 18b. French Institute, Pondicherry. http://hal.archives-ouvertes.fr/hal-00444285/fr/
Pascal, J.-P., S. Shyam-Sunder, and V. M. Meher-Homji. 1982–1997c. Forest Map of South India (Shimoga). Travaux de la SectionScientifique et Technique, Hors Série 18c. French Institute, Pondicherry. http://hal.archives-ouvertes.fr/hal-00444285/fr/
Pascal, J.-P., R. Pélissier, M. E. Loffeier, and B. R. Ramesh. 1998. Floristic composition, structure, diversity and dynamics of two evergreenforests plots in Karnataka state, India. Pages 507–511 in F. Dallmier, and J. A. Comiskey J. A., editors. Forest biodiversity research,monitoring and modelling. Man and the Biosphere Series vol. 20, The Parthenon Publishing Group, Paris, France.
Pélissier, R., J.-P. Pascal, F. Houllier, and H. Laborde. 1998. Impact of selective logging on the dynamics of a low elevation dens moistevergreen forest in the Western Ghats (South India), Forest Ecology and Management 105:107–119.
Rama Rao, R., and M. Sahib. 1914. Flowering plants of Travancore. The Government Press, Trivandrum, India.
Ramesh, B. R., and J.-P. Pascal. 1997. Atlas of endemics of the Western Ghats (India). Distribution of tree species in the evergreen and semi-evergreen forests. Publication du Departement d'Ecologie n° 38. French Institute, Pondicherry, India.
Ramesh, B. R., and M. H. Swaminath. 1999. Assessment and conservation of forest biodiversity in the Western Ghats of Karnataka, India.French Institute, Pondicherry, India, and Fonds Francais de l'Environment Mondial, Paris, Project Report.
Ramesh B. R., M. H. Swaminath, and M. Seetharam. 1999. Strategies for the conservation of biodiversity of the Western Ghats. My Forest35:9–14.
Ramesh, B. R., M. Seetharam, M. C. Guero, and R. Michon. 2009a. Assessment and Conservation of Forest Biodiversity in the WesternGhats of Karnataka, India. 1. General Introduction and Forest Land Cover and Land Use Changes (1977-1997). Pondy Papers in Ecology n°6. French Institute, Pondicherry. http://hal.archives-ouvertes.fr/hal-00408263/fr/
B. R. Ramesh, M. H. Swaminath, S. V. Patil, S. Aravajy, and C. Elouard. 2009b. Assessment and Conservation of Forest Biodiversity in theWestern Ghats of Karnataka, India. 2. Assessment of Tree Biodiversity, Logging Impact and General Discussion. Pondy Papers in Ecology n°7. French Institute, Pondicherry. http://hal.archives-ouvertes.fr/hal-00408305/fr/
Ramesh, B. R., N. Ayyappan, P. Grard, J. Prosperi, S. Aravajy, and J.-P. Pascal. 2010a. Western Ghats v.1.0 - A multimedia identificationsystem of evergreen species of the Western Ghats, India. Collection Ecologie 46, French Institute, Pondicherry.http://www.biotik.org/downloads/WGhats.zip
Ramesh, B. R., P. D. Venugopal, R. Pélissier, S. V. Patil, M. H. Swaminath, and P. Couteron. 2010b. Mesoscale patterns in the floristiccomposition of forests in the central Western Ghats of Karnataka, India. Biotropica, doi 10.1111/j.1744-7429.2009.00621.x.
Sheil, D., S. B. Jennings, and P. Savill. 2000. Long-term permanent plot observations of vegetation dynamics in Budongo, a Ugandan rainforest. Journal of Tropical Ecology 16:765–800.
Subramanian, K. N. 1995. Flora of Thenmala. International Book Distributors, Dehra Dun, India.
Subramanian, K. N., N. Venkatasubramanian, and V. K. Nallaswamy. 1987. Flora of Palghat. Bishen Singh Mahendra Pal Singh, DehraDun, India.
Venugopal, P. D. 2008. Regional patterns in the floristic composition and structure of forests in the Western Ghats, India. Internal Report,French Institute, Pondicherry, India.
[Back to E091-216]
View publication statsView publication stats