forest ecology and management - southern research fileriparian zones in southern appalachian...
TRANSCRIPT

Forest Ecology and Management 258 (2009) 2282–2293
Riparian zones in southern Appalachian headwater catchments:Carbon and nitrogen responses to forest cutting
Jennifer D. Knoepp *, Barton D. Clinton
USDA Forest Service, Southern Research Station, Coweeta Hydrologic Laboratory, Otto, NC 28763, USA
A R T I C L E I N F O
Article history:
Received 27 August 2008
Received in revised form 3 April 2009
Accepted 7 April 2009
Keywords:
Riparian buffer
Nitrogen availability
Dissolved organic carbon (DOC)
Dissolved organic nitrogen (DON)
Nitrogen leaching
A B S T R A C T
There is little understanding about the role eastern US forested headwater riparian areas play in
protecting aquatic habitats and water quality from impacts of side slope forest harvest. To better
understand this important riparian area function, we selected three sites from management units with a
2-age regeneration silvicultural prescription located on the Nantahala National Forest, North Carolina,
USA. Each site was harvested and a riparian buffer was left uncut along the stream. Buffer widths were
10 m and 30 m; we included a 0 m buffer to experimentally determine nutrient and riparian zone
responses to forest cutting under extreme conditions. A fourth site was selected to serve as an uncut
reference. Transects were established perpendicular to a 200 m stream reach, from streamside to 50 m
upslope for intensive study. Forest cutting increased extractable NO3� at both 0–10 cm and 10–30 cm
soil depths compared to pre-treatment concentrations. Soil solution NO3� concentrations increased only
in harvested areas, on all sites; increases were greater in sites with narrow riparian buffers. Stream water
NO3� concentration increased significantly following site harvest only on the 0 m buffer site. Dissolved
organic C and N did not respond to harvesting in either soil solution or stream samples. Our results
suggest that riparian buffers are effective in removing NO3� from soil solution prior to its entering the
stream.
Published by Elsevier B.V.
Contents lists available at ScienceDirect
Forest Ecology and Management
journa l homepage: www.e lsevier .com/ locate / foreco
1. Introduction
The riparian zone is the interface between terrestrial andaquatic ecosystems through which water and materials move.Forested riparian zones are not easily delineated being a mosaic oflandforms, above and belowground communities, and environ-mental conditions (Gregory et al., 1991). Naiman et al. (2000)examined large streams with steep gradients and large inputs ofcoarse wood in the Pacific Coastal Rainforest of North America.They concluded that boundaries of riparian areas could bedelineated by changes in soil conditions, vegetation, and otherfactors that reflect aquatic and terrestrial interactions. However,regional climatic differences result in varying patterns of debrisand sediment movement in the Pacific Northwest region (PNW)compared with those in the eastern US, making direct comparisonsof stream characteristics among regions difficult.
First-order streams are the dominate stream type (i.e., 50% oftotal stream network length) in most forested watersheds(National_Research_Council, 2002; Wifli et al., 2007) yet, mostof the scientific knowledge about riparian zone structure andfunction has been derived from studies of higher order streams,
* Corresponding author. Tel.: +1 828 524 2128x103; fax: +1 828 369 6768.
E-mail address: [email protected] (J.D. Knoepp).
0378-1127/$ – see front matter . Published by Elsevier B.V.
doi:10.1016/j.foreco.2009.04.006
where geomorphic and fluvial controls are much more important(Verry et al., 2004). First-order streams in forested catchments areclosely linked to terrestrial systems with a high edge-to-area ratioand increased shading and vary greatly throughout the US. Thesestreams often have little geomorphological differentiationbetween the side slope and riparian area, however plant speciesand soil series often differ in near-stream areas (Moore et al., 2005;Moore and Wondzell, 2005; Richardson and Danehy, 2006).
In the steep headwater catchments of the southern Appala-chians, morphological, soils, and vegetation inventories arerequired for riparian area definition prior to managementprescriptions (Joan Brown, Nantahala Ranger District Silviculturist;personal communication). Studies have found greater total C andlower C:N ratios in stream side and cove soils (convergence areas).Near-stream soils also have greater total and available Nconcentrations, as well as higher N mineralization rates comparedto upper-slope soils (Garten et al., 1994; Knoepp and Swank, 1998).This, coupled with decreased C:N ratios suggests improved soilorganic matter quality and greater C and N turnover rates inriparian zone soils. Riparian areas often have higher plant diversitythan upper-slope areas (Richardson and Danehy, 2006), althoughthis may not be the case in small headwater catchments (Clintonet al., personal communication).
It has been shown that soil nutrient cycling responds tosilvicultural treatments with increased availability of N (Burger

J.D. Knoepp, B.D. Clinton / Forest Ecology and Management 258 (2009) 2282–2293 2283
and Pritchett, 1984; Donaldson and Henderson, 1990; Knoepp andSwank, 1993). However, soil solution NO3
� responses to harvestare low in magnitude. For example, NO3
�-N concentrationsincreased from 0.03 mg N L�1 in an undisturbed forest to3.7 mg N L�1 following site harvest in the southern Appalachians(Montagnini et al., 1991); stream concentrations increased from<0.01 to 0.17 mg NO3
�-N L�1.Forestry best management practices (BMPs) are applied during
harvest activities to minimize forest floor disturbance and soilexposure, reducing measurable fluxes of nutrients and sediment tostreams. Most state forest BMPs require riparian zones to remainunharvested to mitigate potential effects of upslope disturbance onstream water quality. While nutrient and sediment responses totimber management activities may be less than responses toagricultural practices the protection of stream water quality iscentral to overall resource management objectives. Due to theimportance and abundance of headwater stream ecosystems,understanding of the effectiveness of riparian buffers for theprotection of aquatic resources is essential to forest land managers.
Our objectives were two-fold, (1) characterize carbon andnitrogen cycling responses in forested headwater catchmentriparian zones following harvest, and (2) determine the effective-ness of varying riparian buffer widths for mitigating impacts ofupslope site disturbance on streams.
2. Materials and methods
2.1. Site description
Study sites were located at 35860N, 83860W, on the NantahalaRanger District of the Nantahala National Forest in the Blue RidgePhysiographic Province of western North Carolina. The area hasabundant rainfall (approximately 1800 mm yr�1) which is dis-tributed evenly throughout the year (Swift et al., 1988); greatestrainfall is generally in March and least in October. Less than 5% oftotal annual precipitation falls as snow or ice. Mean annual airtemperature is 12.6 8C ranging from 3.3 8C in January to 21.6 8C inJuly. Four headwater catchments with similar vegetation, topo-
Fig. 1. Graphic depiction of site transect layout along the 200 m stream reach. Nutrient c
transect center-line by 7.5 m. Groundwater wells are located between the end of the tra
selected location along the sample line.
graphy, and soils were selected for the study. Three of the siteswere selected by the Nantahala National Forest to receive a 2-ageregeneration treatment (Miller et al., 1995), leaving 3.4–4.6 m2 ha�1 residual basal area of 30–40 cm diameter at breastheight overstory vegetation. The fourth site was not harvested andserved as a reference. All catchments were east-facing, ranged insize from 6 ha to 10 ha, in elevation from 850 m to 950 m, and hadstream gradients ranging from �0.07% to �0.23%.
Sites have similar soils that are generally loamy to coarse loamyand derived from material weathered from high grade metamor-phosed rock or from colluvium. Side slope soils range from 15% to50% slope and are mapped in the Evard–Cowee complex (fine-loamy, mixed, mesic Typic Hapludults) which includes about 20%inclusion of the Trimont series (fine-loamy, mixed, mesic HumicHapludults). These Ultisols are moderately well-drained to well-drained, deep (solum thickness �1 m) and greater than 1.5 m tobedrock. The saprolite layer beneath the solum may be up to 6 mdeep (Thomas, 1996). Cove or stream side soils were formed incolluvium, 15–50% slope, and are mapped in the Cullasaja series.These soils are loamy-skeletal, mixed, mesic Typic Haplumbrepts,very deep, well-drained soils; solum thickness is <1.5 m; >1.8 mto bedrock (Thomas, 1996).
Forests in the southern Appalachians are generally consideredN limited (Swank and Vose, 1997; Knoepp and Swank, 1998).Nitrogen deposition averages 9.5–12.6 kg N ha�1 yr�1, increasingwith elevation and is composed of 40% NO3
�-N, 40% NH4+-N, and
20% organic N (Knoepp et al., 2008).
2.2. Sample collection and experimental treatment
The three harvest sites were assigned one of the followingbuffer widths; 30 m, 10 m, and 0 m. We selected a 200 m streamreach at the lower end of each harvest unit for intensive study. Sitelayout and sampling were identical on the reference site. Atransect-based sampling approach was used to quantify changes insoil and soil solution nitrogen. Eight 50 m transects, spaced 25 mapart, were established perpendicular to the stream reach onalternating sides of the stream (four on each side) (Fig. 1). Four
ycling transects are centered on litter fall traps, with tension lysimeters off-set from
nsect and the center of the stream. Soil sample collections take place at randomly

Table 1Site harvest dates and sample collection dates. All pre-treatment data presented are spring, summer, and fall 2005.
Site Harvest begin Harvest end Post-treatment soil and soil solution collections
Reference n/a n/a Spring, summer, fall 2006
30 m July 2006 February 2007 Spring, summer, fall 2007
10 m October 2005 December 2005 Spring, summer, fall 2006
0 m January 2006 July 2006 Summer, fall 2006; spring 2007
1 The use of trade or firm names in this publication is for reader information and
does not imply endorsement by the U.S. Department of Agriculture of any product
or service.
J.D. Knoepp, B.D. Clinton / Forest Ecology and Management 258 (2009) 2282–22932284
transects were randomly selected for nitrogen cycling measure-ments. Transects ran from near-stream to upper-slope, the portionin the harvested area ranged from 50 m (0 m buffer site) to 20 m(30 m buffer site). The number of transects sampled varieddepending on the parameter. Sampling intensity was greaterwithin 20 m of the stream to increase the likelihood of detectingresponses within the riparian zone.
Harvesting began in October, 2005 on the 10 m site andconcluded in February 2007 on the 30 m site. Treatment was a 2-age harvest prescription (previously described) using primarilycable-yarding techniques to facilitate access to areas difficult orimpossible to harvest with a conventional rubber-tired skidder. Anadded benefit of cable-yarding is the reduction in forest floordisturbance because logs are suspended above the forest floorduring removal (Miller and Sirois, 1986). Site harvest and samplecollection dates are presented in Table 1. The percent of the totalwatershed length harvested was 30 m—28%, 10 m—40%, and 0 m—54% (Joan Brown, Nantahala Ranger District Silviculturist; personalcommunication).
2.2.1. Stream sample collection and analysis
Stream sample collection began in January 2004. Weekly grabsamples were collected below each harvest unit, and on thereference site. Weekly samples were analyzed for NO3
� and NH4+
concentrations, by ion chromatography and colorimetrically by thealkaline phenol method (USEPA, 1983a,b), respectively. Most (95%)stream samples were collected during baseflow conditions.Intensive hydrologic studies within Coweeta Hydrologic Labora-tory showed that in low elevation first-order watershedsapproximately 50% of rainfall occurs as runoff with 5% occurringas storm runoff (Swift et al., 1988). Estimates of stream dischargewere not made due to the short length of the study reach (200 m).
2.2.2. Soil sample collection and analysis
Pre-treatment soil sampling was conducted to characterize thenear-stream to upper-slope gradient. Soil profiles along each of thefour nutrient cycling transects were described and sampled duringthe summers of 2004 and 2005; two transects each year. Samplelocations were 1 m, 2 m, 4 m, 7 m, 10 m, 13 m, 16 m, 20 m, 30 m,and 50 m from the stream. At each sample location we used a2.5 cm soil probe to describe the mineral soil profile and collect soilsamples by horizon. Soil samples were collected by horizon downto saprolite. Minimum horizon depth was 5 cm, horizons greaterthan 20 cm deep were divided (uniformly) for sample collection;80–100 samples were collected per transect. Maximum profiledepth was 110 cm. Soil profiles were described using basic SoilTaxonomic characterization (USDA, 1996), based on changes incolor and texture. Samples were placed in re-sealing plastic bagsand mixed thoroughly. Approximately 10 g of fresh soil was addedto 50 mL, 2 mol KCl L�1 in pre-weighed 125 mL plastic bottles forNO3
� and NH4+ extraction within 1 h of collection. Bottles plus soil
were weighed upon returning to the laboratory to determineactual soil weight and allowed to settle overnight. KCl supernatantwas subsampled for analysis. Concentrations of NH4
+ and NO3�
were determined on an autoanalyzer using alkaline phenol(USEPA, 1983a,b) and cadmium reduction (USEPA, 1983a,b)techniques, respectively. Pre-treatment soil NO3
� and NH4+
concentrations are reported on a fresh weight basis. Total C andN concentrations were determined by combustion using a ThermoElectron/Carlo Erba Flash EA 11121 on air-dried, sieved (<2 mm),and powdered subsamples from each horizon. Soil profile nutrientcontent was determined using average bulk density values(total g cm�3) from other soil experiments in the southernAppalachians (Knoepp, unpublished data) along with measuredNO3
�, NH4+, total C, and total N concentrations. We calculated pre-
treatment nutrient content for depths 0–10 cm and 10–30 cmusing depth weighted means of N concentrations from appropriatesoil horizons to allow pre- and post-treatment comparisons.
Post-treatment soil sampling was conducted at each distancefrom the stream along each transect at a randomly selecteddistance along the contour from the transect center (Fig. 1) inspring, summer, and fall. At each location 3–4 individual soilsamples, collected from a 0.25 m2 area, were composited from 2depths, 0–10 cm, and 10–30 cm. KCl extractable NO3
� and NH4+
were determined in the field on soils sieved <6 mm as describedabove. A 10–20 g subsample of each soil sample was weighed,dried overnight at 105 8C, and reweighed to determine percentmoisture of the original soil sample. One year (spring, summer, andfall) post-treatment soil collections were used to determinetreatment effects and make site comparisons. Post-treatmentNO3
� and NH4+ concentrations are presented on an oven-dried
weight basis.Total C and N concentrations were determined on the first post-
treatment soils collection. Air-dried soils were sieved to <2 mm,powdered, and analyzed for total C and N as described above.
2.2.3. N transformation indices
We used NO3� and NH4
+ adsorption by anion and cationexchange resin membrane sheets as an index of soil nitrogentransformation, nitrification and mineralization, respectively (W.Jarrell, personal communication, 1996). Cation and anion resinsheets were charged prior to use by repeated washing (3 times for10 min each) in 0.5 mol NaHCO3 L�1 solution to charge all exchangesites. One pair of resin sheets were placed at each distance along eachof four transects on all sites (40 cation and 40 anion sheets per site),5 cm below the mineral soil surface, and left in place for 14 days.Sheets were removed from the soil, excess soil and organic matterremoved and placed in one zipper type plastic bag per samplelocation. Before extraction, resin sheets were rinsed thoroughly withdeionized water to remove any remaining soil and organic matterparticles. Resin sheets (anion and cation) from each sample locationwere placed in a 10 cm petri dish with 25 mL of 0.5 mol HCl L�1 andshaken gently for 20 h. Solutions were analyzed for NO3
� and NH4+,
colorimetrically as described above. Nitrogen absorption values arepresented as mg cm�2 of resin sheet surface area.
2.2.4. Soil solution collection
We installed porous cup tension lysimeters (5 cm diameterPVC) vertically into the soil along two transects perpendicular tothe stream at each distance from the stream (Fig. 1). We used the

Fig. 2. Total C and N through the soil profile along the transect for near-stream to upper-slope position. Data represent the mean value of pre-harvest soil collection from all
four sites (n = 4) at each distance from the stream. Error bars represent one standard error of the mean. (A) Carbon concentration (%) in the A and the B horizon soils. (B)
Nitrogen concentration (%) in the A and B horizon soils. (C) Total C in the soil profile Mg ha�1 from soil surface to surface of the saprolite. (D) Total C in the soil profile Mg ha�1
from soil surface to surface of the saprolite.
J.D. Knoepp, B.D. Clinton / Forest Ecology and Management 258 (2009) 2282–2293 2285
falling tension method; each week after sample collection0.03 MPa of tension was applied to the lysimeter, to begincollecting the sample for the following week. Lysimeters equili-brated in the soil for six weeks before water samples werecollected for chemical analyses. During the equilibration period,lysimeters were pumped out weekly to flush through the system.After four weeks test samples were analyzed for NO3
�-N to insure aconsistent pre-treatment concentration before sample collectionbegan. At each location we installed two lysimeters, one 15 cmdeep, one at the bottom of the B horizon above saprolite (depths:36–100 cm). Soil solution chemistry collected from shallowlysimeters indicates mobile soil nutrients and nutrient availability.The deep soil solution sample is below the major rooting zone andabove the saprolite measuring nutrients potentially moving out ofor leaching from the soil. Shallow lysimeters were 30 cm in length,the center of the porous cup was 15 cm deep. The deep lysimeterswere 60 cm in length, polypropylene tubing attached to thevacuum, and sample ports allowed access from the soil surface. Soilsolution samples from both shallow and deep lysimeters werecollected weekly. A monthly composited sample was generated byfreezing a 10 mL subsample following collection of each weeklysample. We determined NO3
� and NH4+-N as previously described.
2.2.5. DOC and DON concentrations
We measured dissolved organic carbon (DOC) and totaldissolved nitrogen (TN) concentrations in soil solution, ground-water and streams on all four sites. Groundwater wells were
installed at the stream end of each transect to collect solutionwithin the hyporheic zone; between 3 and 5 wells were locatedwithin 1 m of and in the middle of the stream (Fig. 1). We collectedwell solution samples once monthly. Wells were pumped out oneweek prior to sample collection. This monthly sample collectioncoincided with lysimeter and stream sampling. Lysimeter sampleswere not composited prior to DOC and TN analysis. Well andstream samples were filtered on collection day, through a 0.45 mmglass-fiber filter. DOC and TN were determined in each sample on aShimadzu TOC-VCPH with a TN analyzer attachment. NO3
� andNH4
+ were determined in each sample as described above.Dissolved organic nitrogen (DON) was calculated as TN-(NO3
� + NH4+).
2.2.6. Statistical analysis
We analyzed the overall effect of harvest treatment as a splitplot design using site and distance from stream as fixed variables;transects served as replicates within a site, a random variable.Comparing slope sections within a site is also a split plot design.We also examined differences in the buffer widths among the 4sites; a split–split plot experimental design. We used analysis ofcovariance for post-treatment comparisons within and amongsites using pre-treatment data as the covariate. For soil solutiondata we used the seasonal means for each transect and bufferwidth for analysis, the same season of the pre-treatment year wasused as the covariate. Percent total soil N and C, and KCl extractableNO3
� and NH4+ concentrations used pre-treatment soil profile

J.D. Knoepp, B.D. Clinton / Forest Ecology and Management 258 (2009) 2282–22932286
data. Pre-treatment DOC and DON data were limited; thereforeonly post-treatment comparisons were conducted. We used themixed procedure in SAS (SAS, 2000) for all analyses; significantdifferences reported are at a � 0.05 unless otherwise noted.
Treatment effects on stream water chemistry were determinedby comparing treated and reference streams using pre- and post-treatment data to identify significant treatment impacts. Teststatistics were generated using regression analysis on thedifferences in NO3
� concentration between the referencewatershed and each treated watershed, by comparing beforetreatment differences to post-treatment differences in concentra-tions using the GLM procedure of SAS (SAS, 2000). Significantdifferences were evaluated at the a � 0.05 level.
3. Results and discussion
3.1. Total N and C
Depth of soil to saprolite varied significantly with distance fromthe stream (Clinton et al., personal communication). Total depth
Fig. 3. Total soil C concentration in surface soils (0–10 cm), pre- and post-treatment in th
near-stream, mid-slope, and upper-slope positions. Post-treatment data are the mean va
section. Error bars represent one standard error of the mean. Bars within a site with diffe
site. Bars within a slope section with different letters (x, y, z) designate significant diff
was just over 40 cm near the stream, increased until 13 m from thestream, then remained constant across the slope. A horizon depthaveraged between 15 cm and 20 cm across the entire slopetransect. Percent total soil C and N varied across the slope transect.A horizon total C and N increased from 1 m to 7 m from the stream(Fig. 2) and then became variable. B horizon C and N, on the otherhand, decreased between 1 m and 7 m from the stream and thenremained constant to 50 m. This pattern, increased concentrationat shallow soil depth near the stream and decreasing concentra-tions with increasing depth away from the stream, led to a fairlyconstant total C and N content within the soil profile along thenear-stream to upper-slope transect (Fig. 2).
We compared the pre- and post-treatment total N and Cconcentration in the unharvested buffer zones and harvested areasby distance from the stream; referred to as near-stream (0–10 m),mid-slope (10–30 m), and upper-slope (50 m), respectively. Pre-treatment, we found that only the 0 m site had significantdifferences in surface soil (0–10 m) total C along the slope. Thenear-stream section had significantly greater C than upper-slopesection (Fig. 3). Total C in subsurface soil (10–30 cm) of the 0 m
e reference, 30 m buffer, 10 m buffer, and 0 m buffer sites along the slope including
lues of the first soil sample collection; of each sample transect (n = 4) for each slope
rent letters (A, B, C) designate significant differences among slope sections within a
erences for a slope section between sites.

J.D. Knoepp, B.D. Clinton / Forest Ecology and Management 258 (2009) 2282–2293 2287
near-stream section also tended to be greater than other slopesections (P < 0.07) (data not shown). There were similar differ-ences for total N. Both the near-stream and mid-slope sections hadgreater total N than the upper-slope surface soils; however,subsurface soil total N was greater only in near-stream soils. Thereference site also had greater subsurface total N in the near-stream position. This pattern of greater soil total C and N in near-stream soils is common among soils in the southeastern US (Gartenet al., 1994; Knoepp and Swank, 1998; Knoepp et al., 2000). Thisresults in a lower C:N ratio in near-stream soils, suggesting greatersoil organic matter quality and increased C and N turnover rates inriparian zone soils (Knoepp et al., 2000). Changes in soil C is a soilproperty used to define riparian areas and riparian soils. Thistransition between riparian and side slope soils was evident in thecounty soil survey as noted in the site description. Rosenblatt et al.(2001) were successful in using the Soil Survey Geographic data baseto identify potentially effective riparian zones across Rhode Island.
There was no measurable impact of site harvest on total soil C(Fig. 3) or N (data not shown) in any of the sites, in either harvestedor unharvested buffer sections at either soil depth. Total C and Nresponses to forest harvest have been shown to vary considerably
Fig. 4. Soil NO3�-N concentration in surface soils (0–10 cm), pre- and post-treatment in th
near-stream, mid-slope, and upper-slope positions. Post-treatment data shown are the m
each slope section. Error bars represent one standard error of the mean. Bars within a site
within a site. Bars within a slope section with different letters (x, y, z) designate signifi
among studies. Johnson et al. (2002) examined the long-termimpacts of whole-tree, complete tree, and sawlog harvest on totalsoil C content in sites across the southeastern US. They found initialsoil C responses to harvest only on sites with intensive samplingschemes following harvest; other sites showed no response. Allsites showed long-term changes in total C although they were notattributed to harvest treatment. Knoepp and Swank (1997)measured a rapid increase in total soil C and N content of surfacesoils following clear-cut harvest in the southern Appalachians. Thisresponse was attributed to root mortality and rapid decompositionof logging residue, such as leaves and small branches. On the otherhand, when examining three different harvest methods in similarforests (2-age regeneration, shelterwood, and group selection),Elliott and Knoepp (2005) found no total soil C or N responsefollowing harvest.
3.2. Extractable NO3� and NH4
+ and N transformation indices
Pre-treatment extractable soil NO3� concentrations did not differ
between near-stream,mid-slope, or upper-slopesectionsforany sitein either the surface or subsurface soils (Fig. 4). NH4
+ concentrations
e reference, 30 m buffer, 10 m buffer, and 0 m buffer sites along the slope including
ean values of spring, summer and fall collections, of each sample transect (n = 4) for
with different letters (A, B, C) designate significant differences among slope sections
cant differences for a slope section between sites.

Fig. 5. Soil NH4+-N concentration in surface soils (0–10 cm), pre- and post-treatment in the reference, 30 m buffer, 10 m buffer, and 0 m buffer sites along the slope including
near-stream, mid-slope, and upper-slope positions. Post-treatment data shown are the means spring, summer and fall collections, of each sample transect (n = 4) for each
slope section. Error bars represent one standard error of the mean. Bars within a site with different letters (A, B, C) designate significant differences among slope sections
within a site. Bars within a slope section with different letters (x, y, z) designate significant differences for a slope section between sites.
J.D. Knoepp, B.D. Clinton / Forest Ecology and Management 258 (2009) 2282–22932288
were greater in near-stream surface soils compared to the upper-slope in both the 0 m and 10 m buffer sites (Fig. 5). The pattern ofincreased extractable N concentrations as well as increased Nmineralization rates in the near-stream position is common (Gartenet al., 1994; Knoepp and Swank, 1998; Knoepp et al., 2000). Thissuggests that these soils have increased N cycling rates.
NO3� concentrations in surface soils differed among slope
positions following harvest. NO3� concentrations increased only in
the harvested sections of all sites; the upper-slope had the greatestresponse in the 10 m and 30 m sites; all slope positions had greaterNO3
� compared to pre-treatment in the 0 m site (Fig. 4). NO3� in
subsurface soils responded to harvest in near-stream and mid-slope sections in the 0 m and 10 m sites (data not shown).
Soil NH4+ concentrations also increased in slope sections
disturbed by harvest (Fig. 5). The 10 m and 30 m site had greatestNH4
+ concentrations in the upper-slope while the 0 m site hadincreases across all slope positions. Only the 0 m subsurface soilshad significant increases in NH4
+. All slope positions responded,the near-stream concentrations were the greatest, followed bymid-slope and upper-slope (data not shown).
Disturbance due to harvest also resulted in increased NO3 andNH4 transformation indices (Fig. 6a and b). There were no pre-harvest differences in N transformations among slope positions onany site (Clinton et al., personal communication). Followingharvest, all sites had greater NO3 and NH4 transformations withinthe harvested slope sections; the response was significant in theupper-slope 10 m and 30 m site, and all slope positions for the 0 msite. In the post-treatment measurements, reference site NO3
transformation was greater at the near-stream position than eitherthe mid- or upper-slope.
Increases in extractable soil NO3�, NH4
+, and N transformationindices following forest harvest are common (Burger and Pritchett,1984; Donaldson and Henderson, 1990; Knoepp and Swank, 1993).These responses are attributed to both the increased microbialproduction of NO3
� and NH4+ due to increased soil temperature
and moisture as well as reduced plant uptake. Soil N responses toforest management practices and disturbance, such as increases inNO3- and NH4
+, vary with disturbance intensity and initial Navailability. Responses may be short-lived (Knoepp et al., personalcommunication) or last for 3–4 years (Waide et al., 1988; Knoepp

Fig. 6. (a) Index of soil nitrification potential as measured using NO3�-N captured during a 14 day on anion exchange resin sheets, pre- and post-treatment in the reference,
30 m buffer, 10 m buffer, and 0 m buffer sites along the slope including near-stream, mid-slope, and upper-slope positions. Post-treatment data shown are the means spring,
summer and fall collections, of each sample transect (n = 4) for each slope section. Bars represent one standard error of the mean. Bars within a site with different letters (A, B,
C) designate significant differences among slope sections within a site. Bars within a slope section with different letters (x, y, z) designate significant differences for a slope
section between sites. (b) Index of soil N mineralization potential as measured using NH4+-N captured during a 14 day on cation exchange resin sheets, pre- and post-
treatment in the reference, 30 m, 10 m, and 0 m buffer sites along the slope including near-stream, mid-slope, and upper-slope positions. Post-treatment data shown are the
means spring, summer and fall collections, of each sample transect (n = 4) for each slope section. Bars represent one standard error of the mean. Bars within a site with
different letters (A, B, C) designate significant differences among slope sections within a site. Bars within a slope section with different letters (x, y, z) designate significant
differences for a slope section between sites.
J.D. Knoepp, B.D. Clinton / Forest Ecology and Management 258 (2009) 2282–2293 2289
et al., 2004). Even when forest soil responses to disturbance arehigh, soil N concentrations remain low. In this study, NO3
�
concentrations increased 10 times in the 0 m site following harvestand yet remained below 2 mg kg�1.
3.3. Soil solution nitrogen
Shallow lysimeter solution N concentrations indicate mobile Nwithin the rooting zone and plant nutrient availability. Pre-treatment NO3
� concentrations in shallow lysimeters did not differamong slope sections for any site (Fig. 7). While the 0 m site had anoverall increase in shallow lysimeter NO3
� concentrationsfollowing harvest, other sites did not show any significantharvesting effect. There was no significant change in solutionNH4
+ concentrations between pre- and post-treatment in any site(data not shown).
Soil solution NO3� concentration responses to harvest varied.
Most harvested slope sections responded to harvest, with increasesat all slope positions in the 0 m and in the mid-slope position in the10 m site. There was no significant response in the 30 m site. Therewas no evidence of surface solution NO3
� moving from harvestedto undisturbed slope sections. There were no significant differ-ences or patterns along the slope in NH4
+ concentrations in eitherthe pre- or post-treatment sampling periods (data not shown).
Pre-treatment deep lysimeter soil solution NO3� differed
among slope positions in the 10 m site only, near-stream NO3�
concentrations were greater than either mid- or upper-slopesolutions (Fig. 8). Following harvest, there was a trend towardincreased deep soil solution NO3
� concentrations in both the 0 mand the 10 m (P = 0.12) site. However, this trend was also evidentin the reference site (P = 0.10) in post-treatment sampling. The30 m site did not exhibit a deep soil solution NO3
� concentrationresponse to forest cutting. Again, there was no significant NO3
�
increase on slope sections adjacent or below harvested sections,suggesting that NO3
�movement did not occur. Differences in deepsoil solution NH4
+ concentrations between pre- and post-treat-ment years varied among sites and slope position with noconsistent differences or trends (data not shown).
Increased N mobility, as measured by soil solution NO3
concentrations, is common following site disturbance or Nadditions (Titus et al., 1997; Hentschel et al., 2007; Zotarelliet al., 2007). Regulation of N leaching has been attributed todecreased vegetation uptake, site condition, and soil C:N ratio(Titus et al., 1997; Hentschel et al., 2007).
Increased soil measures of N availability and mobility(extractable NO3
� and NH4+, NO3
� release, and NO3� in soil
solution) is common following site disturbance. Our data show anincrease in extractable N, soil solution N and soil NO3
� release.

Fig. 7. Shallow soil (15 cm) solution NO3�-N concentrations collected using soil porous cup, tension lysimeters. Site values presented are means of seasonal mean values of
monthly composited samples for each transect at each slope position. Bars represent one standard error of the mean. ‘*’ designates significant differences between pre- and
post-treatment values for a slope sections within a site. Letters (A, B, C) designate significant differences between slope sections within a site.
J.D. Knoepp, B.D. Clinton / Forest Ecology and Management 258 (2009) 2282–22932290
While these soil N measures increased there was little evidence ofNO3
� movement between slope sections. Responses within eachsite were limited to the harvested slope section. N movementbeyond the disturbed slope section was only evident in the streamdata of the 0 m site, where there was a significant increase instream NO3
� concentration after harvest compared to thereference watershed (Fig. 9). There was no stream NO3 responseto harvest in the other two harvested sites. In a study of N cyclingpatterns among vegetation types in the southern Appalachians,Knoepp et al. (2000) found that cove sites (convergence areas) hadmeasurable NO3
� below the rooting zone less frequently than sideslope mixed oak forests, suggesting efficient N retention by thisecosystem type. Yeakley et al. (2003) found increased NO3
�
concentrations in shallow and deep lysimeter solutions as well asstream water for 3 years following understory cutting andoverstory windfall on a hillslope. Swank (1988) examined streamresponses following the commercial clear-cut of a 59 hawatershed, no riparian buffer was retained. Following this largedisturbance there was an immediate stream NO3
� response; themaximum NO3
� concentration was measured 3 years followingdisturbance. The management units cut in our study did notrepresent the entire watershed drainage area. The percent of the
total stream length harvested on each site was, 28% of the 30 m,40% of the 10 m, and 54% of the 0 m, possibly not enough of thedrainage area to alter stream chemistry in the 30 m or the 10 m.Mayer et al. (2007) did a meta-analysis of 45 published studiesexamining the effectiveness of 89 riparian buffers and found widevariation in N retention following upper-slope disturbance.Retention of surface soil solution NO3
� was most effective inbuffers >50 m wide. Their data showed that subsurface NO3
�
retention was more efficient and was not related to buffer width.Effective NO3
� uptake from soil solution by riparian zone soilsrequires the movement of the solution through the soil, not seepsand channels. This has been found in glaciated soils of theNortheastern US (Gold et al., 2001), Appalachian soils including theridge and valley region (Lowrance et al., 1997), and agriculturalsoils of western Oregon (Wigington et al., 2003). Lowrance et al.(1997) summarized several studies examining the movement of Nto the Chesapeake Bay through the various landscape types withinthe watershed. The coastal plain wetlands, areas closest to the bay,varied in effectiveness in NO3
� removal from shallow ground-water. Their exploration of the effectiveness of riparian areas forNO3
� removal within differing landscape types and physiographicregions suggests that Appalachian systems with their deep
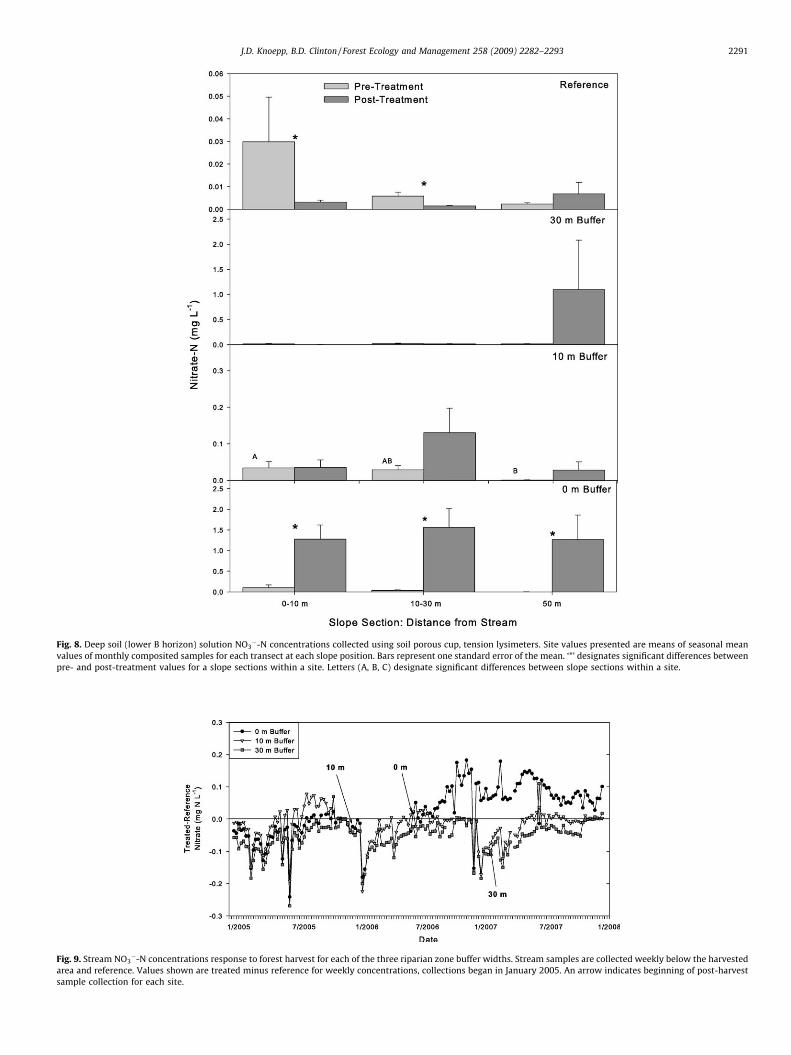
Fig. 8. Deep soil (lower B horizon) solution NO3�-N concentrations collected using soil porous cup, tension lysimeters. Site values presented are means of seasonal mean
values of monthly composited samples for each transect at each slope position. Bars represent one standard error of the mean. ‘*’ designates significant differences between
pre- and post-treatment values for a slope sections within a site. Letters (A, B, C) designate significant differences between slope sections within a site.
Fig. 9. Stream NO3�-N concentrations response to forest harvest for each of the three riparian zone buffer widths. Stream samples are collected weekly below the harvested
area and reference. Values shown are treated minus reference for weekly concentrations, collections began in January 2005. An arrow indicates beginning of post-harvest
sample collection for each site.
J.D. Knoepp, B.D. Clinton / Forest Ecology and Management 258 (2009) 2282–2293 2291

Table 2DOC and DON concentrations along the hillslope–stream interface for sites with riparian buffer widths of 30 m, 10 m, and 0 m as well as a reference site. Values shown are
means of growing season (spring, summer, and fall) stream and groundwater wells, as well as, shallow and deep soil solution samples from near-stream, mid-slope, and
upper-slope positions. Data presented are post-harvest. Values followed by different letters within a column section are significantly different (P � 0.05) as determined by
analysis of covariance.
Sample Reference 30 m 10 m 0 m
DOC DON DOC DON DOC DON DOC DON
Stream 0.57 (0.05) 0.03 (0.01) 0.46 (0.03) 0.02 (0.003) 0.50 (0.07) 0.03 (0.004) 0.50 (0.07) �0.04 (0.06)
Groundwater well 1.10 (0.21) 0.05 (0.01) 0.45 (0.03) 0.02 (0.002) 0.75 (0.17) 0.03 (0.005) 0.54 (0.09) 0.04 (0.01)
Soil solution—shallow (15 cm)
Near-stream 8.13a (1.44) 0.25 (0.03) 4.28 (0.78) 0.16b (0.03) 10.79 (1.78) 0.36 (0.06) 11.77a (3.02) 1.22 (0.50)
Mid-slope 10.37a (1.67) 0.29 (0.03) 4.27 (0.75) 0.15b (0.05) 7.31 (1.30) 0.27 (0.06) 5.57a (0.42) 0.38 (0.11)
Upper-slope 6.21b (0.97) 0.18 (0.04) 5.46 (1.01) 0.39a (0.17) 12.95 (6.38) 0.31 (0.09) 8.07b (2.23) 0.32 (0.10)
Soil solution—deep (30–100 cm)
Near-stream 1.75 (0.29) 0.05 (0.02) 0.74b (0.08) 0.02 (0.003) 2.33 (0.54) 0.08 (0.03) 2.11 (0.58) 0.31 (0.22)
Mid-slope 1.80 (0.30) 0.04 (0.01) 0.97b (0.22) 0.03 (0.004) 2.02 (0.32) 0.06 (0.01) 2.43 (0.53) 0.14 (0.02)
Upper-slope 1.22 (0.19) 0.03 (0.01) 4.71a (1.29) 0.21 (0.06) 3.9 (1.80) 0.12 (0.06) 1.35 (0.20) 0.10 (0.05)
J.D. Knoepp, B.D. Clinton / Forest Ecology and Management 258 (2009) 2282–22932292
unsaturated drainage areas would be medium to high, dependenton retention time, and the presence of seeps. Lyons et al. (1998)found that riparian areas had a maximum P retention capacity, andonce that maximum was reached, P moved into the stream. Ourdata suggest that we did not exceed the N retention capacity of theriparian soils in either the 30 m or the 10 m site. The presence ofNO3
� in the deep soil solution (the 10 m site) without itsmovement into the stream suggests that NO3
� uptake ortransformation (biological or chemical) may take place withinthe saprolite layer. The loss of NO3
� through denitrification alsodecreases N movement to the stream. Davidson and Swank (1987)measured high denitrification potentials in near-stream soilsfollowing site harvest, with greatest rates in soil 6–15 cm.Denitrification in deeper soils was limited by C availability(Davidson and Swank, 1987; Addy et al., 1999).
3.4. DOC and DON
Shallow soil solution post-treatment values of DOC weresignificantly lower in the upper-slope position in both thereference and the 0 m site (Table 2). There were no significantdifferences among slope positions in the 10 m or 30 m sites. In the30 m site, deep lysimeter solutions in the upper-slope position hadthe greatest DOC concentrations. DOC concentration in deep soilsolutions of the upper-slope position on the 10 m site also tendedto be greater (P = 0.13). DON concentrations in the upper-slopeposition on the 30 m site were significantly greater than either thenear-stream or mid-slope positions (Table 2). The near-streamposition tended to have the greatest DON concentrations in boththe 10 m (P = 0.10) and the 0 m (P = 0.14) sites. There were nosignificant differences or patterns in DON concentrations evidentamong slope sections in the sub-soil solution (Table 2).
DOC represents an important energy transfer from terrestrial toaquatic systems (Richardson and Danehy, 2007). Yeakley et al.(2003) examined effects of hillslope understory removal andoverstory blowdown on N and DOC movement. Followingunderstory cutting, soil water DOC concentrations increased(small increase), groundwater DOC did not change. However, onthe hillslope with overstory blowdown, there were large increasesin NO3
� and DOC concentrations in both soil solution andgroundwater. McGlynn and McDonnell (2003) examined patternsof DOC in stream water during storm hydrographs. The hillslopeappeared to be disconnected from the stream early in the storm,but as the hillslope water content increased the connection wasmade and DOC concentrations in the hillslope and in the streamwere similar. Bhat et al. found that 73% of the total N output from aforest watershed occurred as overland flow during storm events.
Our sample collections represent largely baseflow. This could haveprecluded our observation of stream DOC or DON responses.
Futter et al. (2007) used models to explore regulatorymechanisms of in stream DOC concentrations of boreal forestswith peat. They found that model predictions of stream DOC weremost sensitive to climate, litter fall, soil organic carbon content,and soil moisture content. Their predictions support our finding ofno DOC response to cutting as related to the fact that we found nototal soil C or N responses.
3.5. Summary and conclusions
This study examined the effects of timber harvesting activitieson near-stream to upper-slope N concentrations and N and Ctransfer down slope. Our objective was to determine the functionof the riparian zone in mitigating upslope disturbance as it relatesto soil, soil solution, groundwater, and stream N and C responses.We examined N and C responses for the first growing seasonfollowing timber harvest. There were significant increases in Navailability and movement following harvest, largely within thedisturbed areas of the slope. NO3
� moved below the rooting zonemaking it available for leaching loss to the stream in all sites.However, there was no evidence of N moving from disturbed slopesections into or through undisturbed riparian buffer areas. Only thestream draining the site with no buffer had increased NO3
�
concentrations following harvest. Data suggest that processeswithin the saprolite may have retained or transformed the NO3
�
released by site disturbance in the other sites. Additional researchis required to understand the long-term effectiveness of riparianbuffers and responses to changes in vegetation and organic matterinputs to these stream/riparian ecosystems.
References
Addy, K.L., Gold, A.J., Groffman, P.M., Jacinthe, P.A., 1999. Groundwater nitrateremoval in subsoil of forested and mowed riparian buffer zones. Journal ofEnvironmental Quality 28, 962–970.
Burger, J.A., Pritchett, W.L., 1984. Effects of clearfelling and site preparation onnitrogen mineralization in a southern pine stand. Soil Science Society ofAmerica Journal 48, 1432–1437.
Davidson, E.A., Swank, W.T., 1987. Factors limiting denitrification in soils frommature and disturbed southeastern hardwood forests. Forest Science 33, 135–144.
Donaldson, J., Henderson, G., 1990. Nitrification potential of secondary-successionalupland oak forests: I. Mineralization and nitrification during laboratory incuba-tions. Soil Science Society of America Journal 54, 892–897.
Elliott, K.J., Knoepp, J.D., 2005. The effects of three regeneration harvest methods onplant diversity and soil characteristics in the southern Appalachians. ForestEcology and Management 211, 296–317.
Futter, M.N., Butterfield, D., Cosby, B.J., Dillon, P.J., Wade, A.J., Whitehead, P.G., 2007.Modeling the mechanisms that control in-stream dissolved organic carbon

J.D. Knoepp, B.D. Clinton / Forest Ecology and Management 258 (2009) 2282–2293 2293
dynamics in upland and forested catchments. Water Resources Research 43,W02424, doi:10.1029/2006WR004960.
Garten Jr., C.T., Huston, M.A., Thoms, C.A., 1994. Topographic variation of soilnitrogen dynamics at Walker Branch Watershed, Tennessee. Forest Science40, 497–512.
Gold, A.J., Groffman, P.M., Addy, K., Kellogg, D.Q., Stolt, M., Rosenblatt, A.E., 2001.Landscape attributes as controls on ground water nitrate removal capacity ofriparian zones. Journal of the American Water Resources Association 37, 1457–1464.
Gregory, S.V., Swanson, F.J., McKee, W.A., Cummins, K.W., 1991. An ecosystemperspective of riparian zones. BioScience 41, 540–551.
Hentschel, K., Borken, W., Matzner, E., 2007. Leaching losses of inorganic N and DOCfollowing repeated drying and wetting of a spruce forest soil. Plant and Soil 300,21–34.
Johnson, D.W., Knoepp, J.D., Swank, W.T., Shan, J., Morris, L.A., Van Lear, D.H.,Kapeluck, P.R., 2002. Effects of forest management on soil carbon: results ofsome long-term resampling studies. Environmental Pollution 116, S201–S208.
Knoepp, J.D., Coleman, D.C., Crossley Jr., D.A., Clark, J.S., 2000. Biological indices ofsoil quality: an ecosystem case study of their use. Forest Ecology and Manage-ment 138, 357–368.
Knoepp, J.D., Swank, W.T., 1993. Site preparation burning to improve southernAppalachian pine-hardwood stands: nitrogen responses in soil, soil water, andstreams. Canadian Journal of Forest Research 23, 2263–2270.
Knoepp, J.D., Swank, W.T., 1997. Forest management effects on surface soil carbonand nitrogen. Soil Science Society of America Journal 61, 928–935.
Knoepp, J.D., Swank, W.T., 1998. Rates of nitrogen mineralization across an eleva-tion and vegetation gradient in the southern Appalachians. Plant and Soil 204,235–241.
Knoepp, J.D., Vose, J.M., Swank, W.T., 2004. Long-term soil responses to sitepreparation burning in the southern Appalachians. Forest Science 50, 540–550.
Knoepp, J.D., Vose, J.M., Swank, W.T., 2008. Nitrogen deposition and cycling acrossan elevation and vegetation gradient in southern Appalachian forests. Inter-national Journal of Environmental Studies 65, 389–408.
Lowrance, R., Altier, L.S., Newbold, J.D., Schnabel, R.R., Groffman, P.M., Denver, J.M.,Correll, D.L., Gillian, J.W., Robinson, J.L., Brinsfield, R.B., Staver, K.W., Lucas, W.,Todd, A.H., 1997. Water quality functions of riparian forest buffers in Chesa-peake Bay watersheds. Environmental Management 21, 687–712.
Lyons, J.B., Gorres, J.H., Amador, J.A., 1998. Spatial and temporal variability ofphosphorus retention in a riparian forest soil. Journal of Environmental Quality27, 895–903.
Mayer, P.M., Reynolds, S.K., McCutchen, M.D., Canfield, T.J., 2007. Meta-analysis ofnitrogen removal in riparian buffers. Journal of Environmental Quality 36,1172–1180.
McGlynn, B.L., McDonnell, J.J., 2003. Role of discrete landscape units in controllingcatchment dissolved organic carbon dynamics. Water Resources Research 39,1090, doi:10.1029/2002WR001525.
Miller, G.W., Wood, P.B., Nichols, J.V., 1995. Two-age silviculture—an innovative toolfor enhancing species diversity and vertical structure in Appalachian hard-woods. In: Eskew, L.G. (Ed.), Forest Health Through Silviculture. USDA ForestService, Denver, CO, pp. 175–182.
Miller, J.H., Sirois, D.L., 1986. Soil disturbance by skyline yarding vs. skidding in aloamy hill forest. Soil Science Society of America Journal 50, 1579–1583.
Montagnini, F., Haines, B., Swank, W.T., 1991. Soil solution chemistry in black locust,pine/mixed hardwoods and oak/hickory forest stands in the southern Appa-lachians, USA. Forest Ecology and Management 40, 199–208.
Moore, R.D., Spittlehouse, D.L., Story, A., 2005. Riparian microclimate and streamtemperature response to forest harvesting: a review. Journal of the AmericanWater Resources Association 41, 813–834.
Moore, R.D., Wondzell, S.M., 2005. Physical hydrology and the effects of forestharvesting in the Pacific Northwest: a review. Journal of the American WaterResources Association 41, 763–784.
Naiman, R.J., Bilby, R.E., Bisson, P.A., 2000. Riparian ecology and management in thePacific Coastal Rain Forest. BioScience 50, 996–1011.
National_Research_Council, 2002. Riparian Areas: Functions and Strategies forManagement. The National Academy Press, Washington, DC.
Richardson, J.S., Danehy, R.J., 2006. A synthesis of the ecology of headwater streamsand their riparian zones in temperate forests. Forest Science 53, 131–147.
Richardson, J.S., Danehy, R.J., 2007. A synthesis of the ecology of headwater streamsand their riparian zones in temperate forests. Forest Science 53, 131–147.
Rosenblatt, A.E., Gold, A.J., Stolt, M.H., Groffman, P.M., Kellogg, D.Q., 2001. Identify-ing riparian sinks for watershed nitrate using soil surveys. Journal of Environ-mental Quality 30, 1596–1604.
SAS, 2000. SAS version 9.1. In: SAS Systems for Windows, SAS Institute Inc., Cary, NC.Swank, W.T., 1988. Stream chemistry responses to disturbance. In: Swank, W.T.,
Crossley, Jr., D.A. (Eds.), Forest Hydrology and Ecology at Coweeta, vol. 66.Springer-Verlag, New York, pp. 469.
Swank, W.T., Vose, J.M., 1997. Long-term nitrogen dynamics of Coweeta forestedwatersheds in the southeastern United States of America. Global Biogeochem-ical Cycles 11, 657–671.
Swift Jr., L.W., Cunningham, G.B., Douglass, J.E., 1988. Climatology and hydrology.In: Swank, W.T., Crossley, Jr., D.A. (Eds.), Forest Hydrology and Ecology atCoweeta, vol. 66. Springer-Verlag, New York, pp. 469.
Thomas, D.J., 1996. Soil Survey of Macon County. USDA Natural Resource Con-servation Service, North Carolina, p. 322.
Titus, B.D., Roberts, B.A., Deering, K.W., 1997. Soil solution concentrations on threewhite birch sites in central Newfoundland following different harvestingintensities. Biomass and Bioenergy 13, 313–330.
USDA, N.R.C.S., 1996. Keys to Soil Taxonomy. USDA, Natural Resource ConservationService, Washington, DC.
USEPA, 1983a. Methods for chemical analysis of water and waste. Determination ofnitrogen as ammonia. In: Method 350.1, Environmental Monitoring and Sup-port Lab., Office of Research and Development, USEPA, Cincinnati, OH.
USEPA, 1983b. Methods for chemical analysis of water and waste. Determination ofnitrite/nitrate by automated cadmium reduction. In: Method 353.2, Environ-mental Monitoring and Support Lab, Office of Research and Development,USEPA, Cincinanati, OH.
Verry, E.S., Dolloff, C.A., Manning, M.E., 2004. Riparian ecotone: a functionaldefinition and delineation for resource assessment. Water Air and Soil Pollution4, 67–94.
Waide, J.B., Caskey, W.H., Todd, R.L., Boring, L.R., 1988. Changes in soil nitrogenpools and transformations following forest clearcutting. In: Swank, W.T.,Crossley, Jr., D.A. (Eds.), Forest Hydrology and Ecology at Coweeta.Springer-Verlag, New York, p. 66.
Wifli, M.S., Richardson, J.S., Naiman, R.J., 2007. Ecological linkages between head-waters and downstream ecosystems: transport of organic matter, invertebrates,and wood down headwater channels. Journal of the American Water ResourcesAssociation 43, 72–85.
Wigington, P.J., Griffith, S.M., Field, J.A., Baham, J.E., Horwath, W.R., Owen, J., Davis,J.H., Rain, S.C., Steiner, J.J., 2003. Nitrate removal effectiveness of a riparianbuffer along a small agricultural stream in Western Oregon. Journal of Envir-onmental Quality 32, 162–170.
Yeakley, J.A., Coleman, D.C., Haines, B.L., Kloeppel, B.D., Meyer, J.L., Swank, W.T.,Argo, B.W., Deal, J.M., Taylor, S.F., 2003. Hillslope nutrient dynamics followingupland riparian vegetation disturbance. Ecosystems 6, 154–167.
Zotarelli, L., Scholberg, J.M., Dukes, M.D., Munoz-Carpena, R., 2007. Monitoring ofnitrate leaching in sandy soils: comparison of three methods. Journal ofEnvironmental Quality 36, 953–962.