forest ecology and management - east china normal university
TRANSCRIPT

Forest Ecology and Management 483 (2021) 118910
Available online 15 January 20210378-1127/© 2021 Elsevier B.V. All rights reserved.
Mapping mangrove forests in the Red River Delta, Vietnam
Chuqi Long a, Zhijun Dai a,b,*, Xiaoyan Zhou a, Xuefei Mei a, Cong Mai Van c
a State Key Laboratory of Estuarine and Coastal Research, East China Normal University, Shanghai, China b Laboratory for Marine Geology, Qingdao National Laboratory for Marine Science and Technology, Qingdao, China c Faculty of Civil Engineering, Thuyloi University, Hanoi, Viet Nam
A R T I C L E I N F O
Keywords: Mangrove forests Red River Delta Anthropogenic activities Natural forcings
A B S T R A C T
Mangrove forests (MFs), which occur along tropical and subtropical coastal zone, are among the most productive and richest carbon-rich ecosystems in the world. However, MFs have experienced great losses worldwide due to the impacts of intensive human activities and relative sea level rise. Here, the recent dynamic changes in the MFs of the Red River Delta (RRD), the second largest delta in Vietnam, were quantified using the random forest algorithm based on 328 remote images obtained by Landsat TM/ETM+/OLI during 1986–2019. The results show obvious increasing trends in the MF area with a change rate of 39 ha/y from 1,655 ha in 1986 to 2,944 ha in 2019. The change rates in the northern RRD (NP) and southern RRD (SP) were 8.44 ha/y and 30.62 ha/y, respectively, even though MFs in the tropics worldwide encountered significant losses. Further, approximately 1,091 ha of MF was converted into aquaculture ponds during 2000–2006 in the interior of the RRD, while the shoreline of MFs in the NP and SP continually expanded seaward to the northeast and southwest at average rates of 38.9 m/y and 17.9 m/y, respectively. Moreover, although the fluvial sediment supply declined dramatically from 199.57 to 16.41 mt/y during 1986–2017, the sediment supply was not responsible for the present seaward expansion of MFs. Wave action drove sediments to overwash barriers, and tidal dynamics carried this sediment into tidal channels, depositing sediments behind the barriers and on both sides of tidal channels with continuing MF growth. In addition, the conversion of MFs into aquaculture ponds by human activities was responsible for the massive losses of MFs in 2000–2006, but these impacts were alleviated as conservation policies were implemented by local governments in subsequent years. This study indicates that the growth, loss and recovery of MFs are affected by various factors, and it is vital to map the variations in MFs to better implement regional ecological restoration programs for coastal MFs.
1. Introduction
Mangrove forests (MFs) are salt-tolerant forest ecosystems that dominate the land–ocean interface along tropical and subtropical coastlines (Donato et al., 2011; Hamilton and Snedaker et al., 1984). MFs provide many regional ecological, economic and societal benefits to humans with an estimated value of $194,000 ha− 1 y− 1 (Costanza et al., 2014; Jennerjahn and Ittekot, 2002). A wide range of valuable site- specific functions can be performed by MFs, including serving as important nursery grounds and breeding sites for animals, alleviating coastal erosion resulting from natural disasters, and achieving carbon sequestration (Atwood et al., 2017; Carugati et al., 2018; FAO, 2005). Despite their importance, mangroves are some of the most threatened ecosystems on Earth: the mangrove area has decreased by 30–50% over the past half-century due to intensive human interference (FAO, 2007).
If this trend continues, the ecological services provided by MFs may disappear within the next 100 years (Duke et al., 2007).
Mangrove forests were estimated to account for 137,760 km2 in 118 countries and territories in 2000, occupying only 0.1% of the Earth’s total continental surface area (Giri et al., 2010; Jennerjahn and Ittekot, 2002). MFs are highly susceptible to external forces, especially under the long-term pressures imposed by human interference and the serious influence of global climate change. Along with rapid urbanization and industrialization, a great deal of sewage and industrial effluents have been dumped into coastal and estuarine areas; the transport of these effluents along coastlines, in combination with oil from spills, promote rapid reductions in mangrove forests (Lotfinasabasl, 2013). Moreover, the rates of change in elevation cannot keep pace with the rate of sea level rise, such as in the Gulf of Thailand, the southeast coast of Sumatra, and the north coasts of Java and Papua New Guinea, which had suffered
* Corresponding author at: State Key Laboratory of Estuarine and Coastal Research, East China Normal University, Shanghai, China. E-mail address: [email protected] (Z. Dai).
Contents lists available at ScienceDirect
Forest Ecology and Management
journal homepage: www.elsevier.com/locate/foreco
https://doi.org/10.1016/j.foreco.2020.118910 Received 26 September 2020; Received in revised form 26 December 2020; Accepted 28 December 2020

Forest Ecology and Management 483 (2021) 118910
2
heavy mangrove losses (Gilman et al. 2008; Lovelock et al., 2015). Therefore, it is urgent to map the spatial variability and temporal changes of mangrove forests, which are greatly beneficial. Such maps could be used to help draft comprehensive policies for the protection and restoration of damaged coastal mangroves worldwide.
Mangroves usually occur in delta, estuary, lagoon, and carbonate reef environments and other depositional landforms with good growth conditions in sheltered, muddy locations regularly inundated by tides (Giri et al., 2010; Woodroffe et al., 2016). Some works have indicated that MFs in intertidal zones are affected bysea-level rise, extreme high water events and storms (Gilman et al., 2008; Rogers et al., 2005; Smoak et al., 2013), while other studies have shown that tidal hydrodynamics (such as the frequency, depth, and duration of tidal inundation) (Krauss et al., 2006; Rodriguez et al., 2017) and hydroperiods (Crase et al., 2013; Krauss et al., 2014) can restrict the growth locations of mangrove for-ests. Moreover, Woodroffe et al. (2016) implied that the amount of seaward expansion of mangroves in a delta is a direct function of the amount of sediment deposition in the delta. For example, in Thailand, the sediment supply has decreased by 80% in the Chao Phraya River delta, which has resulted in kilometers of mangrove shoreline retreat (Kondolf et al., 2014).
Anthropogenic activities have had dramatic effects on mangrove forests (Alongi, 2002; Gan, 1995; Hamilton and Casey, 2016; Rodriguez et al., 2017). In recent decades, Alongi (2002) hypothesized that re-ductions in mangrove areas are usually associated with human activ-ities, among which the illegal deforestation of mangroves, the overexploitation of fisheries, and aquaculture are the greatest threats to mangroves. It has been estimated that the total area of mangroves on earth is decreasing by about 0.16% to 0.39% per year, with an annual average deforestation rate of 5.83% in Asia due to intensive shrimp culture (Hamilton and Casey, 2016; Richards and Friess, 2015; Valiela et al., 2001). Moreover, Gan (1995) found that mangroves in the Matang Reserve in Malaysia continue to be felled for timber and for the expansion of human settlements.
Unravelling the distributions of and variations in mangrove forests at the regional level based on field measurements has been difficult due to the inaccessibility of natural mangrove forests. With the development of satellite technology and the launch of various platforms, studies have clearly presented spatiotemporal information on mangrove forests by utilizing remotely sensed imagery (Kuenzer et al., 2011), which is a cost- effective way to understand the large-scale, real-time temporal changes of mangroves. For instance, medium-resolution images, such as Landsat TM (Thematic Mapper), and Spot HRV (High Resolution Visible) data, have been widely used for mangrove mapping (Giri et al., 2010; Long et al., 2014; Thomas et al., 2018) and they are acknowledged as the best option for applications on a national or regional scale (Kuenzer et al., 2011; Kirui et al., 2013). In this study, multiple images from Landsat TM, ETM+ (Enhanced Thematic Mapper Plus), and OLI (Operational Land Imager) were collected to map the dynamic pattern of mangrove forests in the Red River Delta (RRD) of Vietnam, a typical tropical delta.
Due to ignorance concerning mangrove conservation and manage-ment in combination with intense human interference and sea level rise, Southeast Asia, especially in the RRD, has experienced some of the most significant reductions in mangrove area in the world (Thomas et al., 2017). To date, however, little information has been obtained with re-gard to the actual spatial distribution of mangrove forests in the RRD at annual and decadal scales. Therefore, the aims of this paper are (1) to determine the temporal variation in mangrove forest area coverage within the RRD between 1986 and 2019; (2) to map the distribution of mangrove forests within the RRD; and (3) to determine the possible mechanisms driving the conversion of mangrove forests to other habitat types. In light of the potential impacts of anthropogenic interference and future climate change on mangroves, the present research can have great value for the consideration of policies regarding the conservation, evolution and management of mangrove forests in tropical and sub-tropical areas.
2. Materials and methods
2.1. Study area
The Red River rises in central Yunnan Province, Southwest China, and flows 1,175 km southeast through a deep, narrow gorge to enter the RRD through the Vietnamese capital city of Hanoi and discharges into the Gulf of Tonkin (Fig. 1). The RRD has two major tributaries: the Lo River on the left bank and the Da River on the right bank. The RRD has a distinct tropical monsoon climate with a wet season from June to October and a dry season from November to May (van Maren and Hoekstra, 2004). The average annual rainfall is 1300–1800 mm, to which the wet season contributes approximately 85–95% (Gao et al., 2015). Due to the sufficient sunshine and precipitation this region re-ceives, mangrove forests grow abundantly. Various species of man-groves can be found in this region; the dominant genera are Aegiceras corniculatum, Bruguiera gymnorhiza, and Kandelia candel (Seto and Fragkias, 2007).
The RRD is characterized by a vast triangular low-lying deltaic plain with an area of approximately 15,000 km2. The center of the triangular RRD predominantly exhibits a seaward extension with an active bidi-rectional barrier-spit system that is over 25 km long (Fig. 1) (van Maren and Hoekstra, 2004). The Red River divides the RRD into the south part (SP) of delta and the north part (NP) of delta, and two main transverse tidal channels separate the mangroves of NP and SP into four parts (NP1, NP2, SP1 and SP2) (Fig. 1). Tidal channels are a significant path for sediment transport and constantly transport nutrients required for mangroves to grow. The average annual water discharge and annual total suspended sediment at the Son Tay gauging station were reported to be 137 × 109 m3 y-1 and 116 × 106 t y-1, respectively (Pruszak et al., 2005). Only 37.8% of the total sediment supply and 21% of the total discharge of Red River basin flow through the Red River (Ba Lat) mouth (Duc et al., 2012; van Maren, 2005). In addition, RRD is a wave- dominated delta with a seasonally varying wave directionality from the northeast and south in the dry and wet seasons, respectively. The significant wave height in the Gulf of Tonkin is approximately 1.4 m during the wet season and below 1 m during the dry season (van Maren, 2005). The tidal range near the RRD is approximately 2.5 m during spring tide and approximately 0.5 m during neap tide. Mangrove forests are located mainly in lagoons and lagoonal creeks and along the river banks of the RRD (van Maren and Hoekstra, 2004). Moreover, Xuan Thuy is the only area in the southern RRD that has been designated a nature reserve; it was appointed as a reserve in 1989, with 120 km2 of mangroves protected in this area (Fig. 1c). The adjacent area of Tien Hai in the northern RRD was designated a nature reserve in 1995 with an area of 125 km2 (Fig. 1c).
2.2. Materials
All available Landsat Collection 1 level-1 and Landsat Collection 1 level-2 satellite images (path 126 row 46) from 1986 to 2019 with land cloud cover of less than 80% were downloaded from the website of the United States Geological Survey Center for Earth Resources Observation and Science (https://earthexplorer.usgs.gov/). A total of 328 images generated from the TM, ETM+, and OLI sensors based on the WGS84 (World Geodetic System 1984) geographical coordinate system and UTM (Universal Transverse Mercator) projection coordinate system were used. The level-1 images, when we received them, had already been geometrically corrected (georectified) by using ground control points and digital elevation model (DEM) data, and they were suitable for pixel-level time series analysis. The level-2 products that we received had inherit characteristic of the Landsat Collection 1 level-1 productions and they are the output of LaSRC (Landsat 8 Surface Reflectance Code) algorithm and LEDAPS (Landsat Ecosystem Disturbance Adaptive Pro-cessing System) algorithm. Cloud Confidence, Cloud Shadow, and Snow/Ice flags were detected by the CFmask (C version of Fmask)
C. Long et al.

Forest Ecology and Management 483 (2021) 118910
3
algorithm (Campbell and Aarup, 1989; Vermote et al., 2016; Zhu and Woodcock, 2012; Zhu et al., 2015).
Monthly river runoff and suspended sediment discharge (SSD) for the period between 1984 and 2017 in Son Tay station were collected from Vietnam Meteorological and Hydrological Administration (website: https://cmh.com.vn) (Fig. 1). Wave height, tidal current, and sediment transport data were obtained from Duc et al. (2012), Pruszak et al. (2005), and van Maren (2005).
2.3. Methods
Continuous Change Detected and Classification (CCDC) algorithm is
a recently developed robust methodology for identifying when and how a land surface pixel changes over time (Zhu and Woodcock, 2012). It employs every clear observation from all available Landsat data including images with clouds to build a time series model that has components of seasonality, trend and breaks (Eq. (1)) (Zhu and Wood-cock, 2014). By comparing the model predictions with satellite images clear pixel, changes can be detected. If a pixel is observed to change in the three successive images, it will be identified as occurring land cover change. All the parameters output from time series model and change detection (including coefficient, RMSEs), combining with other ancil-lary variables (such as slop, aspect, vegetation index) will serve as the input data for the Radom Forest Classifier (RFC) to perform land cover
Fig. 1. Geographic information of the study area including (a) The map of Vietnam and location of Red River Delta (RRD); (b) Enlarged map of the RRD showing location of Ba Lat Delta and the hydrological gauging station (Son Tay station); (c) The Ba Lat Delta is divided into four sub-parts, including: North Part 1 (NP1), North Part 2 (NP2), South Part 1 (SP1) and South Part 2 (SP2). The remote sensing photo is taken by Sentinel 2A in July 27, 2018. (For interpretation of the references to color in this figure legend, the reader is referred to the web version of this article.)
C. Long et al.
Forest Ecology and Management 483 (2021) 118910
4
classification (Zhu and Woodcock, 2012, 2014; Zhu et al., 2015).
ρ̂(i, x)OLS = a0,i + a1,icos(
2πT
x)
+ b1,isin(
2πT
x)
+ c1,ix (1)
{τ*
k− 1 < x < τ*k
}
where x is Julian date, i is the ith Landsat Band, ET is number of days per year (T = 365), a0,i is the coefficient for overall value for the ith Landsat Band, a1,i, b1,i is the coefficient for intra-annul change for the ith Landsat Band, c1,i is the coefficient for inter-annul change for the ith Landsat Band, τ*
k is the kth break point, ̂ρ(i, x)OLS is the predicted value for the ith Landsat Band at Julian date x.
Thereafter, the collected images were firstly corrected by classifica-tion, radiation correction, atmospheric correction, and geometric correction. Then stacking bands in sequence of Blue, Green, Red, NIR, SWIR1, SWIR2, TIR, Fmask and put them into ENVI format. Subse-quently, the prepared images were processed by the CCDC algorithm to map mangroves in the RRD.
The study area was divided into southern and northern parts. The south part (SP) was divided into SP1 and SP2 by a tidal channel with a width of approximately 370 m, and the north part (NP) was divided into NP1 and NP2 on the other side of the tidal channel with width of 1082 m as the boundary (Fig. 1). Further, the shorelines of fringe mangroves were extracted to analyze their position change rates by using Digital Shoreline Analysis System (DSAS) software, an extension for Esri ArcGIS that allows rate-of-change statistics to be calculated from historical shoreline positions and can automatically generate measurement tran-sects and metadata based on user-specified parameters (Miller et al., 2005; Thieler et al., 2009). The calculated rates of shoreline change herein were taken according to the end point rate (EPR), which is used to compute the rate of shoreline change by dividing the distance over which the shoreline moves by the time elapsed between the oldest and most recent shoreline measurements (Thieler et al., 2009). This method is easy to compute and requires shoreline measurements from only two dates with reliable accuracy (Smith et al., 2013).
EPR =D
Y2 − Y1(2)
where D is distance in meters, Y1 is the latest year, Y2 is the oldest year. Thereafter, the shorelines of mangroves were extracted every four
years, and they were taken as the input to Eq. (2). Then, the erosion and accretion of the shoreline were quantitatively depicted. In this study, the shoreline of an MF is defined as the outermost edge of the MF, which directly faces the sea. The mangrove shorelines in each of the 4 parts were extracted every four years from 1986 to 2019. The studied
shorelines were selected from the four regions of the RRD, and the EPR of each region’s shorelines was calculated based on three representative transects for year-by-year analysis (Fig. 1c).
3. Results
3.1. Changes in MFs areas
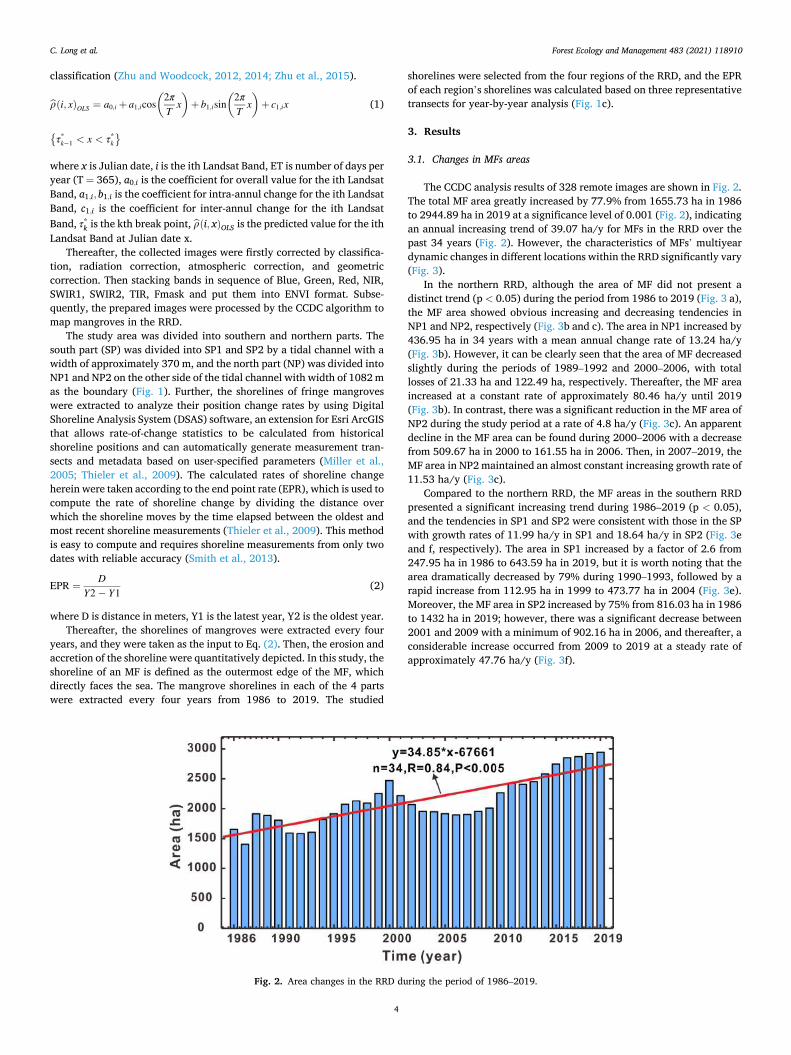
The CCDC analysis results of 328 remote images are shown in Fig. 2. The total MF area greatly increased by 77.9% from 1655.73 ha in 1986 to 2944.89 ha in 2019 at a significance level of 0.001 (Fig. 2), indicating an annual increasing trend of 39.07 ha/y for MFs in the RRD over the past 34 years (Fig. 2). However, the characteristics of MFs’ multiyear dynamic changes in different locations within the RRD significantly vary (Fig. 3).
In the northern RRD, although the area of MF did not present a distinct trend (p < 0.05) during the period from 1986 to 2019 (Fig. 3 a), the MF area showed obvious increasing and decreasing tendencies in NP1 and NP2, respectively (Fig. 3b and c). The area in NP1 increased by 436.95 ha in 34 years with a mean annual change rate of 13.24 ha/y (Fig. 3b). However, it can be clearly seen that the area of MF decreased slightly during the periods of 1989–1992 and 2000–2006, with total losses of 21.33 ha and 122.49 ha, respectively. Thereafter, the MF area increased at a constant rate of approximately 80.46 ha/y until 2019 (Fig. 3b). In contrast, there was a significant reduction in the MF area of NP2 during the study period at a rate of 4.8 ha/y (Fig. 3c). An apparent decline in the MF area can be found during 2000–2006 with a decrease from 509.67 ha in 2000 to 161.55 ha in 2006. Then, in 2007–2019, the MF area in NP2 maintained an almost constant increasing growth rate of 11.53 ha/y (Fig. 3c).
Compared to the northern RRD, the MF areas in the southern RRD presented a significant increasing trend during 1986–2019 (p < 0.05), and the tendencies in SP1 and SP2 were consistent with those in the SP with growth rates of 11.99 ha/y in SP1 and 18.64 ha/y in SP2 (Fig. 3e and f, respectively). The area in SP1 increased by a factor of 2.6 from 247.95 ha in 1986 to 643.59 ha in 2019, but it is worth noting that the area dramatically decreased by 79% during 1990–1993, followed by a rapid increase from 112.95 ha in 1999 to 473.77 ha in 2004 (Fig. 3e). Moreover, the MF area in SP2 increased by 75% from 816.03 ha in 1986 to 1432 ha in 2019; however, there was a significant decrease between 2001 and 2009 with a minimum of 902.16 ha in 2006, and thereafter, a considerable increase occurred from 2009 to 2019 at a steady rate of approximately 47.76 ha/y (Fig. 3f).
Fig. 2. Area changes in the RRD during the period of 1986–2019.
C. Long et al.

Forest Ecology and Management 483 (2021) 118910
5
3.2. Variations in the spatial distribution of MFs
3.2.1. Spatial variations of MFs in the NP When the MFs in the RRD exhibited an increasing tendency, they
showed completely different temporal variation characteristics between the SP and NP (Fig. 2 and Fig. 3). In particular, the MFs in NP2 and SP2 showed opposite changes (Fig. 3c and e). Correspondingly, different spatial evolutionary processes were observed in the northern and southern RRD during the period of 1986–2019.
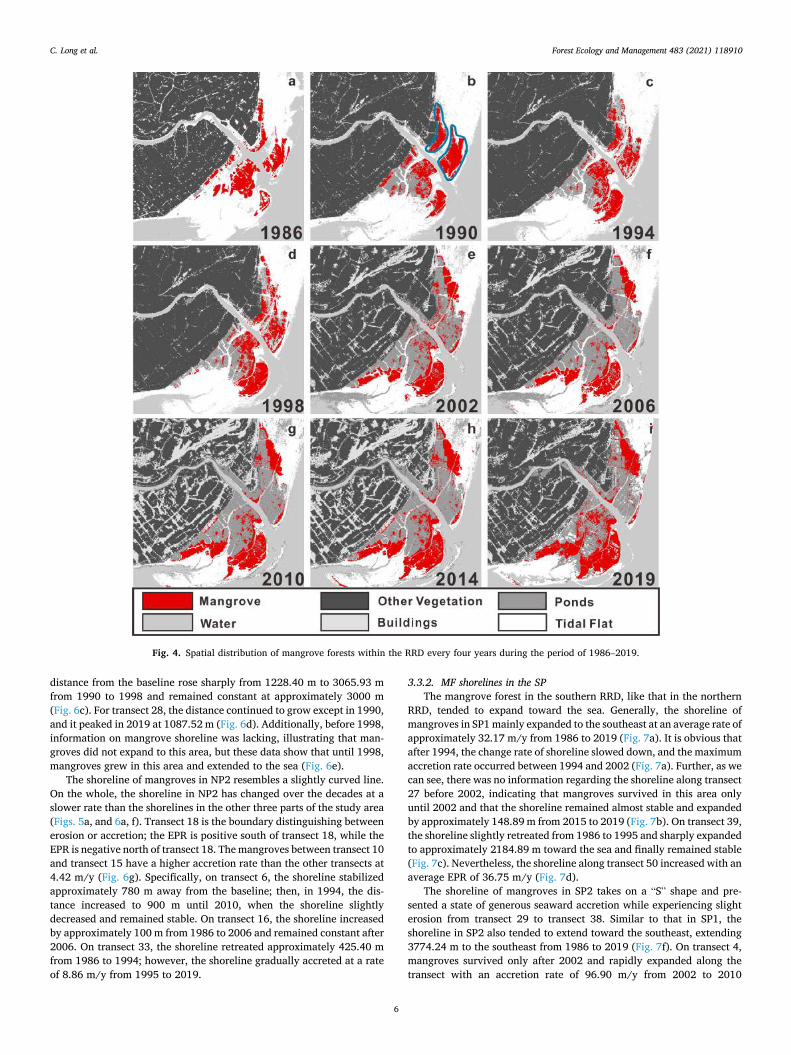
The spatial patterns of mangroves in the northern RRD changed significantly from 1986 to 2019 (Fig. 4). In 1986, the mangrove tidal flat in the northern RRD that we divided by a tidal channel into NP1 and NP2 grew with relatively intact mangroves, which showed elongated and liver-shape morphologies, respectively (Figs. 1c and 4b). Subsequently, the MFs in the upper NP1 begin to shrink in 1990, and the mangroves had almost completely disappeared in 1994, suggesting that MFs were lost first in NP1 and eventually became almost nonexistent with only sparse coverage involving some MFs along the tidal inlet (Fig. 4b and c). In contrast, the MFs in NP2 remained basically unchanged and expanded toward the sea as a whole (Fig. 4b), but the interior mangroves became fragmented (Fig. 4c and d) during 1986–1994.
In 1998, the MFs in NP1 expanded landward along tidal channels and were distributed in a band shape, while in NP2, the fragmentation of the mangroves increased, and the number of patches increased by 56% compared with that in 1990 (Fig. 4d). However, after 1998, NP1 maintained only striped MFs along the northern seaward margin, and NP2 contained only residual linear mangroves distributed in the outer edges of the RRD (Fig. 4e, f). During the period from 2006 to 2019, the spatial pattern of mangroves maintained the status quo of 2006 when the northern mangroves in NP1 continuously expanded toward the sea along the edge of NP1 (Fig. 4g, h and i).
3.2.2. Spatial variations of MFs in the SP Compared with those in the northern RRD, the mangroves in the
southern RRD dynamically changed (Fig. 4). In 1986, the southern mangroves were divided into three integrated patches by two tidal inlets—SP1, upper SP2 and lower SP2 (Fig. 4a). Then, in 1990, the innermost mangroves began to disintegrate, and the middle region lost its southern extent of mangroves, while the outermost mangroves
became lush and expanded toward the southeast accompanied by patches interlaced with bare beaches and MFs (Fig. 4b). The spatial patterns of mangrove remained unchanged until 1998 (Fig. 4c). It is worth noting that some mangroves were distributed in the northern part of SP1 in small, scattered patches, while the previous mangroves grad-ually disappeared (Fig. 4d). By 2002, the small and scattered patches in SP1 developed into belt-shaped patches along barrier spits. In upper SP2, the majority of MFs were lost, and only small quantities of man-groves remained, while the MFs in lower SP2 continually expanded to the southwest (Fig. 4e). However, in 2006, the mangroves developed along the sand spit in SP1 and expanded further toward the sea, while mangroves also occupied the bare flat. Except for the tidal channel edge in upper SP2, the mangroves almost disappeared, while the mangroves in lower SP2 continued to expand southwestward (Fig. 4f).
Moreover, during 2006–2019, the MFs in SP1 remained in their original state but expanded toward the southwest (Fig. 4f-4i). The mangroves in upper SP2 gradually appeared as sporadic MFs along the RRD and then began to spread southwestward. In 2019, the distribution of MFs in lower SP2 remained unchanged with further expansion to the southwest (Fig. 4i).
3.3. Changes in MF shorelines
3.3.1. MF shorelines in the NP Shoreline change is an important indicator of the erosion or accretion
of mangroves along fringes (Nguyen et al., 2013). The shorelines in both NP1 and SP1 were in a state of deposition (Fig. 6b and g). However, in NP2, mangroves eroded in the north and accreted in the south (Fig. 7b), while those in SP2 eroded in the middle, and the majority accreted on both sides (Fig. 7g).
The shoreline of mangroves in NP1 were close to the edge of a 75◦
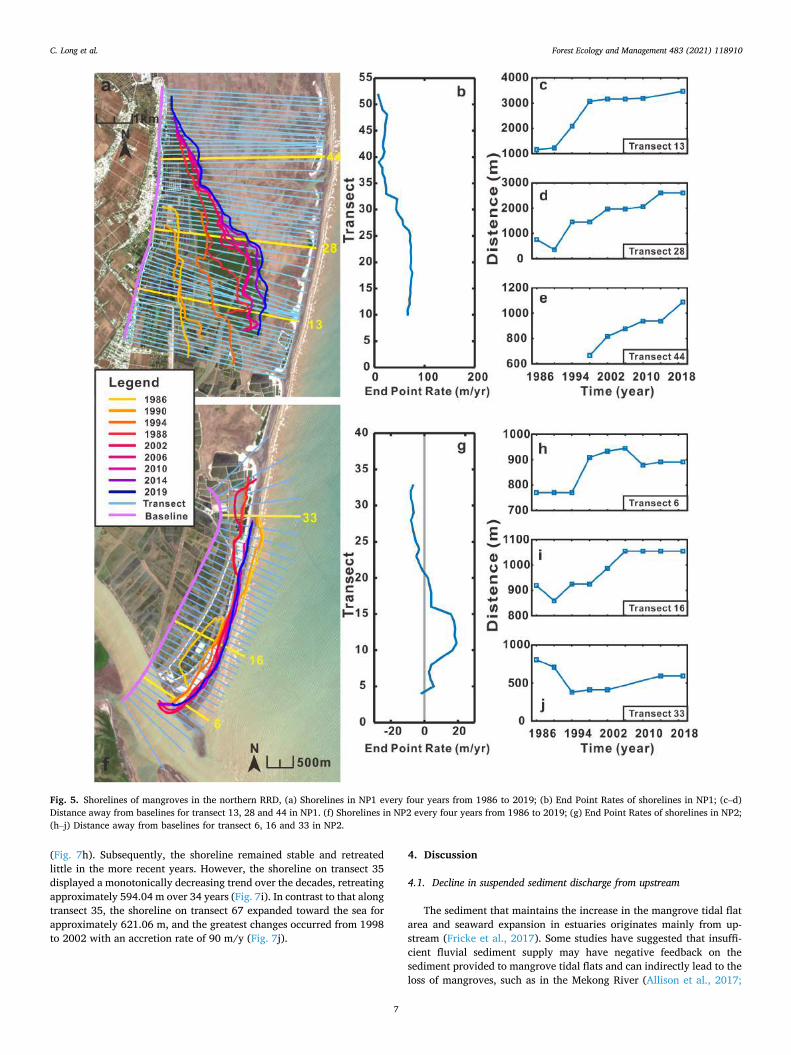
oblique line, and the shoreline continued to expand outward and tended to move to the south. The shoreline in 2019 was 4.11 km longer than that in 1986, and the additional length extended to the south. During the period from 1990 to 2002, the shoreline of mangroves had the highest change rate, and the largest migration distance occurred from 1990 to 1994, with an extension rate of 229.82 m/y. However, the change rate slowed down and remained almost stable after 2002, during which expansion occurred for only 20.07 m/y (Fig. 6a). On transect 13, the
Fig. 3. Changes in area of mangrove forests over time, and regression lines and statistics, in subregions, (a) NP1, (b) NP2, (c) SP1 and (d) SP2.
C. Long et al.
Forest Ecology and Management 483 (2021) 118910
6
distance from the baseline rose sharply from 1228.40 m to 3065.93 m from 1990 to 1998 and remained constant at approximately 3000 m (Fig. 6c). For transect 28, the distance continued to grow except in 1990, and it peaked in 2019 at 1087.52 m (Fig. 6d). Additionally, before 1998, information on mangrove shoreline was lacking, illustrating that man-groves did not expand to this area, but these data show that until 1998, mangroves grew in this area and extended to the sea (Fig. 6e).
The shoreline of mangroves in NP2 resembles a slightly curved line. On the whole, the shoreline in NP2 has changed over the decades at a slower rate than the shorelines in the other three parts of the study area (Figs. 5a, and 6a, f). Transect 18 is the boundary distinguishing between erosion or accretion; the EPR is positive south of transect 18, while the EPR is negative north of transect 18. The mangroves between transect 10 and transect 15 have a higher accretion rate than the other transects at 4.42 m/y (Fig. 6g). Specifically, on transect 6, the shoreline stabilized approximately 780 m away from the baseline; then, in 1994, the dis-tance increased to 900 m until 2010, when the shoreline slightly decreased and remained stable. On transect 16, the shoreline increased by approximately 100 m from 1986 to 2006 and remained constant after 2006. On transect 33, the shoreline retreated approximately 425.40 m from 1986 to 1994; however, the shoreline gradually accreted at a rate of 8.86 m/y from 1995 to 2019.
3.3.2. MF shorelines in the SP The mangrove forest in the southern RRD, like that in the northern
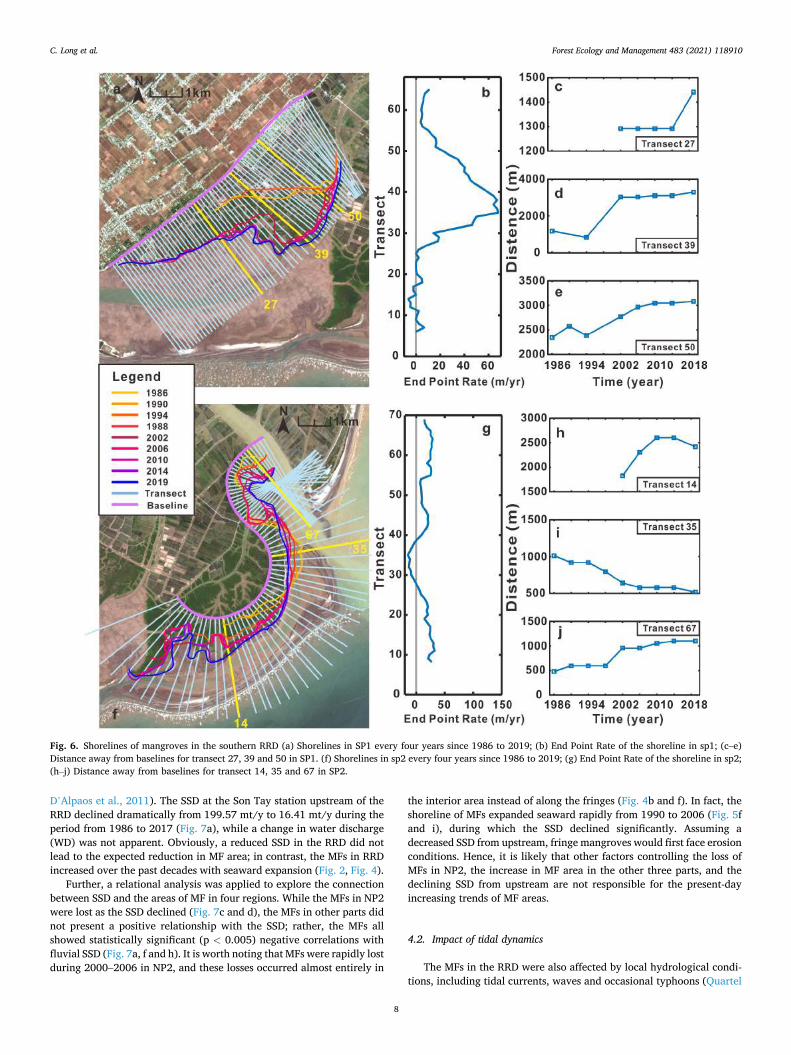
RRD, tended to expand toward the sea. Generally, the shoreline of mangroves in SP1 mainly expanded to the southeast at an average rate of approximately 32.17 m/y from 1986 to 2019 (Fig. 7a). It is obvious that after 1994, the change rate of shoreline slowed down, and the maximum accretion rate occurred between 1994 and 2002 (Fig. 7a). Further, as we can see, there was no information regarding the shoreline along transect 27 before 2002, indicating that mangroves survived in this area only until 2002 and that the shoreline remained almost stable and expanded by approximately 148.89 m from 2015 to 2019 (Fig. 7b). On transect 39, the shoreline slightly retreated from 1986 to 1995 and sharply expanded to approximately 2184.89 m toward the sea and finally remained stable (Fig. 7c). Nevertheless, the shoreline along transect 50 increased with an average EPR of 36.75 m/y (Fig. 7d).
The shoreline of mangroves in SP2 takes on a “S” shape and pre-sented a state of generous seaward accretion while experiencing slight erosion from transect 29 to transect 38. Similar to that in SP1, the shoreline in SP2 also tended to extend toward the southeast, extending 3774.24 m to the southeast from 1986 to 2019 (Fig. 7f). On transect 4, mangroves survived only after 2002 and rapidly expanded along the transect with an accretion rate of 96.90 m/y from 2002 to 2010
Fig. 4. Spatial distribution of mangrove forests within the RRD every four years during the period of 1986–2019.
C. Long et al.
Forest Ecology and Management 483 (2021) 118910
7
(Fig. 7h). Subsequently, the shoreline remained stable and retreated little in the more recent years. However, the shoreline on transect 35 displayed a monotonically decreasing trend over the decades, retreating approximately 594.04 m over 34 years (Fig. 7i). In contrast to that along transect 35, the shoreline on transect 67 expanded toward the sea for approximately 621.06 m, and the greatest changes occurred from 1998 to 2002 with an accretion rate of 90 m/y (Fig. 7j).
4. Discussion
4.1. Decline in suspended sediment discharge from upstream
The sediment that maintains the increase in the mangrove tidal flat area and seaward expansion in estuaries originates mainly from up-stream (Fricke et al., 2017). Some studies have suggested that insuffi-cient fluvial sediment supply may have negative feedback on the sediment provided to mangrove tidal flats and can indirectly lead to the loss of mangroves, such as in the Mekong River (Allison et al., 2017;
Fig. 5. Shorelines of mangroves in the northern RRD, (a) Shorelines in NP1 every four years from 1986 to 2019; (b) End Point Rates of shorelines in NP1; (c–d) Distance away from baselines for transect 13, 28 and 44 in NP1. (f) Shorelines in NP2 every four years from 1986 to 2019; (g) End Point Rates of shorelines in NP2; (h–j) Distance away from baselines for transect 6, 16 and 33 in NP2.
C. Long et al.
Forest Ecology and Management 483 (2021) 118910
8
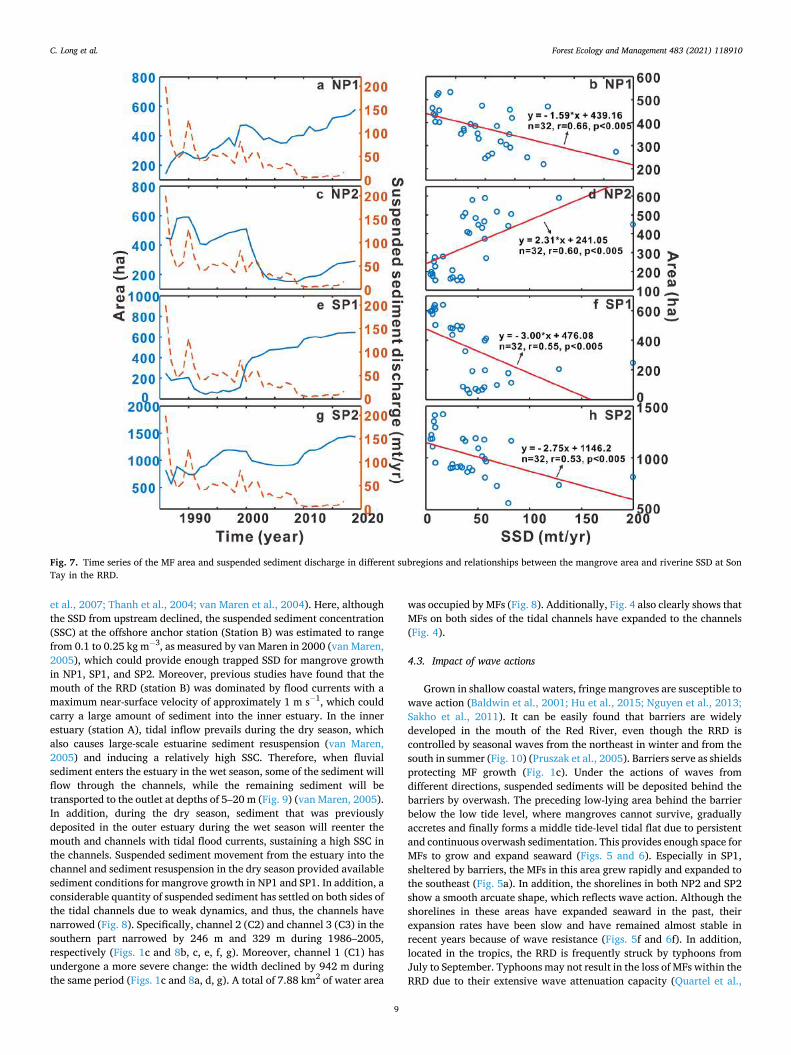
D’Alpaos et al., 2011). The SSD at the Son Tay station upstream of the RRD declined dramatically from 199.57 mt/y to 16.41 mt/y during the period from 1986 to 2017 (Fig. 7a), while a change in water discharge (WD) was not apparent. Obviously, a reduced SSD in the RRD did not lead to the expected reduction in MF area; in contrast, the MFs in RRD increased over the past decades with seaward expansion (Fig. 2, Fig. 4).
Further, a relational analysis was applied to explore the connection between SSD and the areas of MF in four regions. While the MFs in NP2 were lost as the SSD declined (Fig. 7c and d), the MFs in other parts did not present a positive relationship with the SSD; rather, the MFs all showed statistically significant (p < 0.005) negative correlations with fluvial SSD (Fig. 7a, f and h). It is worth noting that MFs were rapidly lost during 2000–2006 in NP2, and these losses occurred almost entirely in
the interior area instead of along the fringes (Fig. 4b and f). In fact, the shoreline of MFs expanded seaward rapidly from 1990 to 2006 (Fig. 5f and i), during which the SSD declined significantly. Assuming a decreased SSD from upstream, fringe mangroves would first face erosion conditions. Hence, it is likely that other factors controlling the loss of MFs in NP2, the increase in MF area in the other three parts, and the declining SSD from upstream are not responsible for the present-day increasing trends of MF areas.
4.2. Impact of tidal dynamics
The MFs in the RRD were also affected by local hydrological condi-tions, including tidal currents, waves and occasional typhoons (Quartel
Fig. 6. Shorelines of mangroves in the southern RRD (a) Shorelines in SP1 every four years since 1986 to 2019; (b) End Point Rate of the shoreline in sp1; (c–e) Distance away from baselines for transect 27, 39 and 50 in SP1. (f) Shorelines in sp2 every four years since 1986 to 2019; (g) End Point Rate of the shoreline in sp2; (h–j) Distance away from baselines for transect 14, 35 and 67 in SP2.
C. Long et al.
Forest Ecology and Management 483 (2021) 118910
9
et al., 2007; Thanh et al., 2004; van Maren et al., 2004). Here, although the SSD from upstream declined, the suspended sediment concentration (SSC) at the offshore anchor station (Station B) was estimated to range from 0.1 to 0.25 kg m− 3, as measured by van Maren in 2000 (van Maren, 2005), which could provide enough trapped SSD for mangrove growth in NP1, SP1, and SP2. Moreover, previous studies have found that the mouth of the RRD (station B) was dominated by flood currents with a maximum near-surface velocity of approximately 1 m s− 1, which could carry a large amount of sediment into the inner estuary. In the inner estuary (station A), tidal inflow prevails during the dry season, which also causes large-scale estuarine sediment resuspension (van Maren, 2005) and inducing a relatively high SSC. Therefore, when fluvial sediment enters the estuary in the wet season, some of the sediment will flow through the channels, while the remaining sediment will be transported to the outlet at depths of 5–20 m (Fig. 9) (van Maren, 2005). In addition, during the dry season, sediment that was previously deposited in the outer estuary during the wet season will reenter the mouth and channels with tidal flood currents, sustaining a high SSC in the channels. Suspended sediment movement from the estuary into the channel and sediment resuspension in the dry season provided available sediment conditions for mangrove growth in NP1 and SP1. In addition, a considerable quantity of suspended sediment has settled on both sides of the tidal channels due to weak dynamics, and thus, the channels have narrowed (Fig. 8). Specifically, channel 2 (C2) and channel 3 (C3) in the southern part narrowed by 246 m and 329 m during 1986–2005, respectively (Figs. 1c and 8b, c, e, f, g). Moreover, channel 1 (C1) has undergone a more severe change: the width declined by 942 m during the same period (Figs. 1c and 8a, d, g). A total of 7.88 km2 of water area
was occupied by MFs (Fig. 8). Additionally, Fig. 4 also clearly shows that MFs on both sides of the tidal channels have expanded to the channels (Fig. 4).
4.3. Impact of wave actions
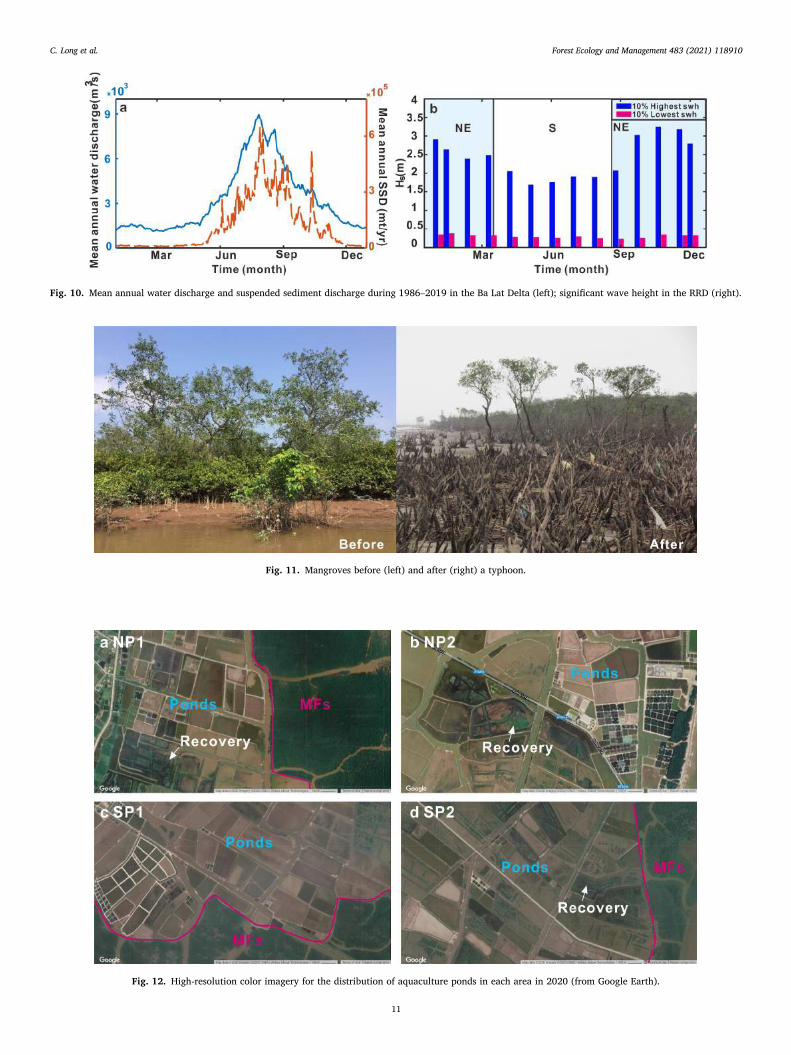
Grown in shallow coastal waters, fringe mangroves are susceptible to wave action (Baldwin et al., 2001; Hu et al., 2015; Nguyen et al., 2013; Sakho et al., 2011). It can be easily found that barriers are widely developed in the mouth of the Red River, even though the RRD is controlled by seasonal waves from the northeast in winter and from the south in summer (Fig. 10) (Pruszak et al., 2005). Barriers serve as shields protecting MF growth (Fig. 1c). Under the actions of waves from different directions, suspended sediments will be deposited behind the barriers by overwash. The preceding low-lying area behind the barrier below the low tide level, where mangroves cannot survive, gradually accretes and finally forms a middle tide-level tidal flat due to persistent and continuous overwash sedimentation. This provides enough space for MFs to grow and expand seaward (Figs. 5 and 6). Especially in SP1, sheltered by barriers, the MFs in this area grew rapidly and expanded to the southeast (Fig. 5a). In addition, the shorelines in both NP2 and SP2 show a smooth arcuate shape, which reflects wave action. Although the shorelines in these areas have expanded seaward in the past, their expansion rates have been slow and have remained almost stable in recent years because of wave resistance (Figs. 5f and 6f). In addition, located in the tropics, the RRD is frequently struck by typhoons from July to September. Typhoons may not result in the loss of MFs within the RRD due to their extensive wave attenuation capacity (Quartel et al.,
Fig. 7. Time series of the MF area and suspended sediment discharge in different subregions and relationships between the mangrove area and riverine SSD at Son Tay in the RRD.
C. Long et al.

Forest Ecology and Management 483 (2021) 118910
10
2007; Hashim et al., 2013; Horstman et al., 2014), but typhoons can cause erosion of the mangrove tidal flats along the outermost edge to a certain extent, and thus, the MFs will be submerged and die (Fig. 11).
4.4. Impact of anthropogenic activities
Large-scale and high-intensity human activities have resulted in different levels of loss of coastal MFs in the tropics and subtropics (Abuodha and Kairo, 2001; FAO, 2007; Shi et al., 2020). In addition to natural forces, MFs are increasingly being influenced by anthropogenic factors (Abuodha and Kairo, 2001; Jia et al., 2015). The Red River Delta is among the most densely populated regions in Vietnam, and man-groves in this area are highly affected by human activities. In 1986, the Vietnam government implemented the Doi Moi economic reforms to increase national productivity and encourage farmers to develop the aquaculture industry (Seto and Fragkias, 2007). As a result, significant sections of mangroves were destroyed within a few years and converted into more highly commercial resources, such as shrimp aquaculture ponds (Fig. 4b and c) (Seto and Fragkias, 2007). Since 1989, Xuan Thuy National Park (located in SP2) has become the only Ramsar site (Ramsar Convention Bureau, 1997) in Vietnam, and mangroves in this area have been well preserved and continue to grow naturally (Figs. 1c, 4). However, aquaculture industries transferred to other areas because of the establishment of nature reserves. Since 1989, some small mangrove patches have been converted into aquaculture ponds, and this activity peaked in 2000–2006 (Fig. 4e and f). Afterwards, some small patches of
Fig. 8. Changes in the channel width of the RRD during the period of 1986–2019; (a and d) remote sensing images of channels in the NP of the RRD obtained in 1986 and 2019, respectively; (b, c, e and f) the channels in the SP; (g) statistics of the channel width in each channel.
Fig. 9. Surface suspended sediment transport near the RRD (revised after Do Minh Duc 2006).
C. Long et al.
Forest Ecology and Management 483 (2021) 118910
11
Fig. 10. Mean annual water discharge and suspended sediment discharge during 1986–2019 in the Ba Lat Delta (left); significant wave height in the RRD (right).
Fig. 11. Mangroves before (left) and after (right) a typhoon.
Fig. 12. High-resolution color imagery for the distribution of aquaculture ponds in each area in 2020 (from Google Earth).
C. Long et al.
Forest Ecology and Management 483 (2021) 118910
12
mangroves have regenerated with the constant implementation of pro-tection policies.
However, although the northern area of Tien Hai (NP1 and NP2) was also established as a nature reserve in 1995, protection policies have not been fully enforced, and a large number of MFs were removed; this activity reached its peak in the period of 2000–2006. In recent years, deforested mangrove areas have gradually recovered as anthropogenic interference stabilized and these policies were implemented. Obviously, human activities accelerate the deforestation of MFs, but at the same time, the execution of policies can promote the restoration of mangroves to some extent. It is anticipated that if such policies are further imple-mented or strengthened, the area’s mangrove forests will recover.
We clearly found that the landward (NP1 and SP1) and seaward (NP2 and SP2) decline of mangroves is not synchronized. From 1990 to 1995, MF areas in both NP1 and SP1 declined (Fig. 3a and c), and indigenous areas began to develop aquaculture offshore, albeit not on a large scale (Fig. 4b). Further, the mass loss of MFs in NP2 and SP2 occurred mainly during the period of 2000–2006 (Fig. 3b and d), during which a
considerable proportion of MF area was converted into aquaculture ponds (Fig. 4e, f, Fig. 12). However, after 2006, the total area of MF increased at a modest rate of 80 ha/y (Fig. 2). Previous areas suffering from severe mangrove deforestation, such as SP1 (Figs. 1c and 4e), have recovered since 2006 due to the effective enforcement of conservation policies from the local government, especially in Xuan Thuy National Park. However, policies implemented in the SP were low in efficiency, and MF recovery in the SP is occurring relatively slowly. The local government is mainly concentrated on the south rather than the north. Overall, approximately 2,668 ha of MF was converted to aquaculture ponds in 34 years, indicating that human activities are responsible for 49% of lost MFs.
4.5. Mapping patterns of MF changes
The development of MFs in the RRD is influenced by many factors, such as fluvial sediments, tides, waves and human activities. Based on the above discussion, the change patterns of MFs can be divided into
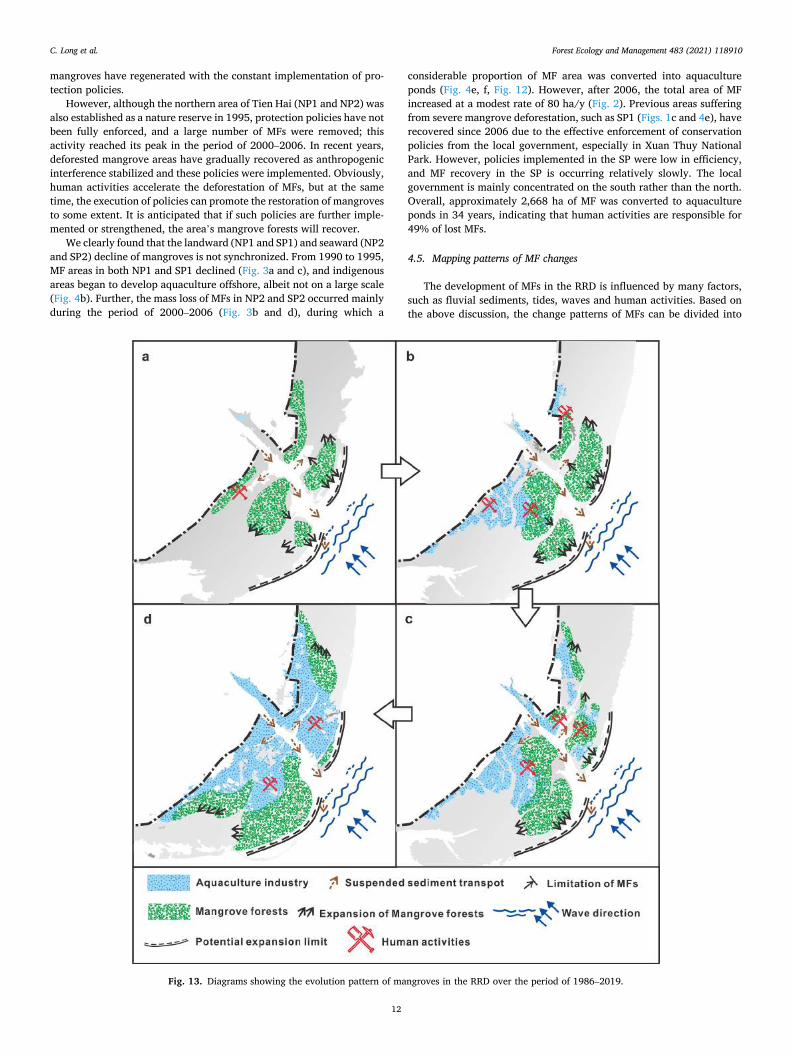
Fig. 13. Diagrams showing the evolution pattern of mangroves in the RRD over the period of 1986–2019.
C. Long et al.
Forest Ecology and Management 483 (2021) 118910
13
four stages (Fig. 13). During the period of 1986–1990 (stage 1), MFs grew under natural
conditions with little anthropogenic interference, and MF patches were relatively intact (Fig. 13a). Rivers carried a large amount of sediment into the estuary and tidal channels between MFs. During the wet season, sediment outside the estuary was transported to the mangrove tidal flat by flood currents (Fig. 13a). In addition, strong northeasterly waves triggered the overwashing of sediment through the barriers, and the sediment was then transported to the inner shelf. Sediment was trapped by MFs, which accelerated the deposition of tidal flats; this provided space and conditions for MFs to grow further.
Subsequently, during 1990–1994 (stage 2), human activities started to have a preliminary impact on MFs from the shore to the sea (Fig. 13b). Considerable quantities of mangroves were occupied by aquaculture ponds, and the fragmentation of mangroves increased. Although MFs near the shore encountered severe losses due to human activities, MFs in outer areas maintained a state of expansion under natural conditions and continued to expand both seaward and landward to the northeast and southwest.
In the period of 1994–2002 (stage 3), MFs were still under the pressures of increasing human maritime activity, and the effects of human activity continued to spread from the shore to the sea (Fig. 13c). At this time, the influence of human activities on the RRD reached its peak. The MFs in SP2 were the only well-preserved community in the RRD, having remained in its state of natural expansion. However, as MFs continued to expand to the sea, they were subjected to greater wave exposure, and thus, the rate of seaward expansion slowed down. Trig-gered by the constant replenishment of sediment and wave action, MFs rapidly colonized the tidal flat in northeastern NP1 and southwestern SP1, which were sheltered by a sandbar in the front and were in a low- energy environment.
In stage four, between 2002 and 2019, the anthropogenic interfer-ence of MFs in the RRD was alleviated, and parts of MFs were recovered from artificial ponds (Fig. 13d). Meanwhile, the MF shorelines in NP2 and SP2 reached their potential expansion limits due to the constraint of wave action. The expansion of MFs in this stage was mainly concen-trated in northeastern NP1 and southwestern SP1. It is anticipated that MFs in the RRD will continue to expand along the shore to the southwest and northeast while remaining stable in the southeast (Fig. 13d).
However, sea level rise has the potential to have a threatening in-fluence on MFs (Hanh and Furukawa, 2007; Doyle et al., 2010). The average rate of sea level rise in the RRD based on tide gauge records was in the range from 1.75 to 2.56 mm/y (Hanh and Furukawa, 2007). If the frequency and duration of inundation caused by SLR exceed the physi-ological thresholds that mangroves can tolerate, mangroves may die, which will increase the risk of “drowning” in estuaries and limit the further expansion of mangroves (Ball, 1988; Hu et al., 2020). At present, the outward expansion of MFs in the RRD is basically at its limit, which is controlled by wave action. Moreover, due to reduced fluvial sediment, barriers may not receive replenished sediments or will even receive less sediment. Under the current situation of sea level rise, it is expected that the outermost MFs in the RRD will drown following the deposition of sediment behind the barriers.
5. Conclusions
Mangrove forests are some of the most productive ecosystems on Earth and provide considerable ecological, economic and social value to Vietnam. However, mangroves are also some of the most threatened ecosystems, as they are affected by insufficient sediment supply, sea level rise and, significantly, anthropogenic interference. Based on 328 images extracted by a random forest algorithm, the dynamic changes of MFs in the RRD were detected. Some important conclusions can be summarized as follows:
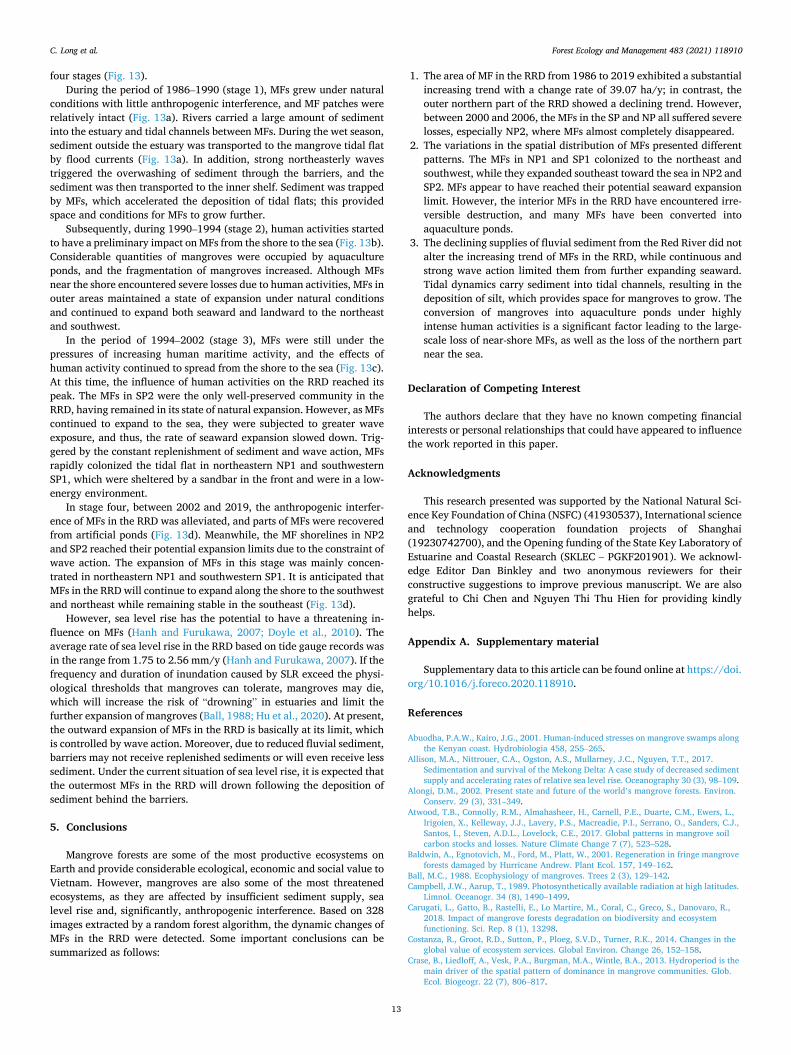
1. The area of MF in the RRD from 1986 to 2019 exhibited a substantial increasing trend with a change rate of 39.07 ha/y; in contrast, the outer northern part of the RRD showed a declining trend. However, between 2000 and 2006, the MFs in the SP and NP all suffered severe losses, especially NP2, where MFs almost completely disappeared.
2. The variations in the spatial distribution of MFs presented different patterns. The MFs in NP1 and SP1 colonized to the northeast and southwest, while they expanded southeast toward the sea in NP2 and SP2. MFs appear to have reached their potential seaward expansion limit. However, the interior MFs in the RRD have encountered irre-versible destruction, and many MFs have been converted into aquaculture ponds.
3. The declining supplies of fluvial sediment from the Red River did not alter the increasing trend of MFs in the RRD, while continuous and strong wave action limited them from further expanding seaward. Tidal dynamics carry sediment into tidal channels, resulting in the deposition of silt, which provides space for mangroves to grow. The conversion of mangroves into aquaculture ponds under highly intense human activities is a significant factor leading to the large- scale loss of near-shore MFs, as well as the loss of the northern part near the sea.
Declaration of Competing Interest
The authors declare that they have no known competing financial interests or personal relationships that could have appeared to influence the work reported in this paper.
Acknowledgments
This research presented was supported by the National Natural Sci-ence Key Foundation of China (NSFC) (41930537), International science and technology cooperation foundation projects of Shanghai (19230742700), and the Opening funding of the State Key Laboratory of Estuarine and Coastal Research (SKLEC – PGKF201901). We acknowl-edge Editor Dan Binkley and two anonymous reviewers for their constructive suggestions to improve previous manuscript. We are also grateful to Chi Chen and Nguyen Thi Thu Hien for providing kindly helps.
Appendix A. Supplementary material
Supplementary data to this article can be found online at https://doi. org/10.1016/j.foreco.2020.118910.
References
Abuodha, P.A.W., Kairo, J.G., 2001. Human-induced stresses on mangrove swamps along the Kenyan coast. Hydrobiologia 458, 255–265.
Allison, M.A., Nittrouer, C.A., Ogston, A.S., Mullarney, J.C., Nguyen, T.T., 2017. Sedimentation and survival of the Mekong Delta: A case study of decreased sediment supply and accelerating rates of relative sea level rise. Oceanography 30 (3), 98–109.
Alongi, D.M., 2002. Present state and future of the world’s mangrove forests. Environ. Conserv. 29 (3), 331–349.
Atwood, T.B., Connolly, R.M., Almahasheer, H., Carnell, P.E., Duarte, C.M., Ewers, L., Irigoien, X., Kelleway, J.J., Lavery, P.S., Macreadie, P.I., Serrano, O., Sanders, C.J., Santos, I., Steven, A.D.L., Lovelock, C.E., 2017. Global patterns in mangrove soil carbon stocks and losses. Nature Climate Change 7 (7), 523–528.
Baldwin, A., Egnotovich, M., Ford, M., Platt, W., 2001. Regeneration in fringe mangrove forests damaged by Hurricane Andrew. Plant Ecol. 157, 149–162.
Ball, M.C., 1988. Ecophysiology of mangroves. Trees 2 (3), 129–142. Campbell, J.W., Aarup, T., 1989. Photosynthetically available radiation at high latitudes.
Limnol. Oceanogr. 34 (8), 1490–1499. Carugati, L., Gatto, B., Rastelli, E., Lo Martire, M., Coral, C., Greco, S., Danovaro, R.,
2018. Impact of mangrove forests degradation on biodiversity and ecosystem functioning. Sci. Rep. 8 (1), 13298.
Costanza, R., Groot, R.D., Sutton, P., Ploeg, S.V.D., Turner, R.K., 2014. Changes in the global value of ecosystem services. Global Environ. Change 26, 152–158.
Crase, B., Liedloff, A., Vesk, P.A., Burgman, M.A., Wintle, B.A., 2013. Hydroperiod is the main driver of the spatial pattern of dominance in mangrove communities. Glob. Ecol. Biogeogr. 22 (7), 806–817.
C. Long et al.
Forest Ecology and Management 483 (2021) 118910
14
D’Alpaos, A., Mudd, S.M., Carniello, L., 2011. Dynamic response of marshes to perturbations in suspended sediment concentrations and rates of relative sea level rise. J. Geophys. Res. 116, F04020.
Donato, D.C., Kauffman, J.B., Murdiyarso, D., Kurnianto, S., Stidham, M., Kanninen, M., 2011. Mangroves among the most carbon-rich forests in the tropics. Nature Geoence 4 (5), 293–297.
Doyle, T.W., Day, R.H., Michot, T.C., 2010. Development of sea level rise scenarios for climate change assessments of the Mekong Delta, Vietnam. U.S. Geological Survey Open-File Report 2010-1165, 110 p.
Duc, D.M., Nhuan, M.T., Ngoi, C.V., 2012. An analysis of coastal erosion in the tropical rapid accretion delta of the Red River, Vietnam. J. Asian Earth Sci. 43 (1), 98–109.
Duke, N.C., Meynecke, J.O., Dittmann, S., Ellison, A.M., Anger, K., Berger, U., Cannicci, S., Diele, K., Ewel, K.C., Field, C.D., Koedam, N., Lee, S.Y., Marchand, C., Nordhaus, L., Dahdouh-Guebas, F., 2007. A world without mangroves? Science 317 (5834), 41–42.
Food and Agriculture Organization of the United Nations (FAO), 2005. Global Forest Resources Assessment 2005. FAO, Rome, Italy.
Food and Agriculture Organization of the United Nations (FAO), 2007. The World’s Mangroves 1980–2005. FAO Forestry Paper. FAO, Rome, Italy.
Fricke, A.T., Nittrouer, C.A., Ogston, A.S., Vo-Luong, H.P., 2017. Asymmetric progradation of a coastal mangrove forest controlled by combined fluvial and marine influence, Cù Lao Dung, Vietnam. Continental Shelf Res. 147, 78–90.
Gan, B.K., 1995. A working plan for the matang mangrove forest reserve: Perak. Perak, Malaysia: state government of Perak Darul Ridzuan, 214 pp.
Gao, J., Dai, Z.J., Mei, X.F., Ge, Z.P., Wei, W., Xie, H.L., Li, S.S., 2015. Interference of natural and anthropogenic forcings on variations in continental freshwater discharge from the Red River (Vietnam) to sea. Quat. Int. 380–381, 133–142.
Gilman, E.L., Ellison, J., Duke, N.C., Field, C., 2008. Threats to mangroves from climate change and adaptation options: A review. Aquat. Bot. 89 (2), 237–250.
Giri, C., Ochieng, E., Tieszen, L.L., Zhu, Z., Singh, A., Loveland, T., Masek, J., Duke, N., 2010. Status and distribution of mangrove forests of the world using earth observation satellite data. Glob. Ecol. Biogeogr. 20 (1), 154–159.
Hamilton, S.E., Casey, D., 2016. Creation of a high spatio-temporal resolution global database of continuous mangrove forest cover for the 21st century (CGMFC-21). Glob. Ecol. Biogeogr. 25 (6), 729–738.
Hamilton, L.C., Snedaker, S.C. (Eds.), 1984, Handbook for mangrove area management. United Nations Environment Programme (UNEP)/East-West Centre, Environment and Policy Institute. 25 pp.
Hanh, P.T.T., Furukawa, M., 2007. Impact of sea level rise on coastal zone of Vietnam. Bulletin-College Sci. Univ. Ryukyus 84, 45–59.
Hashim, A.M., Catherine, S.M.P., Takaijudin, H., 2013. Effectiveness of mangrove forests in surface wave attenuation: a review. Res. J. Appl. Sci., Eng. Technol. 5 (18), 4483–4488.
Horstman, E.M., Dohmen-Janssen, C.M., Narra, P.M.F., Berg, N.J.F.V.D., Siemerink, M., Hulscher, S.J.M.H., 2014. Wave attenuation in mangroves: a quantitative approach to field observations. Coast. Eng. 94, 47–62.
Hu, Z., Van Belzen, J., Daphne, V.D.W., Balke, T., Wang, Z.B., Stive, M., Bouma, T.J., 2015. Windows of opportunity for salt marsh vegetation establishment on bare tidal flats: the importance of temporal and spatial variability in hydrodynamic forcing. J. Geophys. Res.: Biogeoences 120 (7), 1450–1469.
Hu, Z., Zhou, J., Wang, H., He, Z., Peng, Y., Zheng, P., Cozzoli, F., Bouma, T.J., 2020. A novel instrument for bed dynamics observation supports machine learning applications in mangrove biogeomorphic processes. Water Resour. Res. 56 e2020WR027257.
Jennerjahn, T.C., Ittekot, V., 2002. Relevance of mangroves for the production and deposition of organic matter along tropical continental margins. Naturwissenschaften 89 (1), 23–30.
Jia, M., Wang, Z., Zhang, Y., Ren, C., Song, K., 2015. Landsat-based estimation of mangrove forest loss and restoration in Guangxi province, China, influenced by human and natural factors. IEEE J. Sel. Top. Appl. Earth Obs. Remote Sens. 8, 311–323.
Kirui, K.B., Kairo, J.G., Bosire, J., Viergever, K.M., Rudra, S., Huxham, M., Briers, R.A., 2013. Mapping of mangrove forest land cover change along the Kenya coastline using Landsat imagery. Ocean Coast. Manag. 83, 19–24.
Kondolf, G.M., Rubin, Z.K., Minear, J.T., 2014. Dams on the Mekong: Cumulative sediment starvation. Water Resour. Res. 50 (6), 5158–5169.
Krauss, K.W., Doyle, T.M., Twilley, R.R., Rivera-Monroy, V.H., Sullivan, J.K., 2006. Evaluating the relative contributions of hydroperiod and soil fertility on growth of south Florida mangroves. Hydrobiologia 569 (1), 311–324.
Krauss, K.W., McKee, K.L., Lovelocck, C.E., Cahoon, D.R., Saintilan, N., Reef, R., Chen, L., 2014. How mangrove forests adjust to rising sea level. New Phytol. 202, 19–34.
Kuenzer, C., Bluemel, A., Gebhardt, S., Quoc, T.V., Dech, S., 2011. Remote sensing of mangrove ecosystems: a review. Remote Sens. 3, 878–928.
Long, J., Napton, D., Giri, C., Graesser, J., 2014. A mapping and monitoring sssessment of the Philippines’ mangrove forests from 1990 to 2010. J. Coastal Res. 294, 260–271.
Lotfinasabasl, S., Gunale, V.R., Rajurkar, N.S., 2013. Petroleum hydrocarbons pollution in soil and its bioaccumulation in mangrove species, avicennia marina from alibaug mangrove ecosystem, Maharashtra, India. Int. J. Adv. Res. Technol. 2 (2), 1–7.
Lovelock, C.E., Cahoon, D.R., Friess, D.A., Guntenspergen, G.R., Krauss, K.W., Reef, R., Rogers, K., Saunders, M.L., Sidik, F., Swales, A., Saintilan, N., Thuyen, L.X., Triet, T., 2015. The vulnerability of Indo-Pacific mangrove forests to sea-level rise. Nature 526 (7574), 559–563.
Miller, T.L., Morton, R.A., and Sallenger, A.H., 2005. The National Assessment of Shoreline Change—A GIS compilation of vector shorelines and associated shoreline change data for the U.S. Southeast Atlantic Coast: U.S. Geological Survey.
Nguyen, H.-H., McAlpine, C., Pullar, D., Johansen, K., Duke, N.C., 2013. The relationship of spatial-temporal changes in fringe mangrove extent and adjacent land-use: Case study of Kien Giang coast, Vietnam. Ocean Coastal Manage. 76, 12–22.
Pruszak, Z., Ninh, P.V., Szmytkiewicz, M., Hung, N.M., Ostrowski, R., 2005. Hydrology and morphology of two river mouth regions (temperate Vistula Delta and subtropical Red River Delta). Oceanologia 47 (3), 365–385.
Quartel, S., Kroon, A., Augustinus, P.G.E.F., Santen, P.V., Tri, N.H., 2007. Wave attenuation in coastal mangroves in the Red River Delta, Vietnam. J. Asian Earth Sci. 29 (4), 576–584.
Ramsar Convention Bureau, (Ed.), 1997. The Ramsar Convention Manual: A Guide to the Convention on Wetlands, second ed., Ramsar Convention Bureau.
Richards, D.R., Friess, D.A., 2015. Rates and drivers of mangrove deforestation in Southeast Asia, 2000–2012. Proc. Natl. Acad. Sci. U. S. A. 113 (2), 344–349.
Rodriguez, J.F., Saco, P.M., Sandi, S., Saintilan, N., Riccardi, G., 2017. Potential increase in coastal wetland vulnerability to sea-level rise suggested by considering hydrodynamic attenuation effects. Nat. Commun. 8, 16094.
Rogers, K., Heijnis, N.S., 2005. Mangrove encroachment of salt marsh in western port bay, victoria: the role of sedimentation, subsidence, and sea level rise. Estuaries 28 (4), 551–559.
Sakho, I., Mesnage, V., Deloffre, J., Lafite, R., Niang, I., Faye, G., 2011. The influence of natural and anthropogenic factors on mangrove dynamics over 60 years: The Somone Estuary, Senegal. Estuarine Coast. Shelf Sci. 94 (1), 93–101.
Seto, K.C., Fragkias, M., 2007. Mangrove conversion and aquaculture development in Vietnam: A remote sensing-based approach for evaluating the Ramsar Convention on Wetlands. Global Environ. Change 17 (3–4), 486–500.
Shi, C., Yu, L., Chai, M., Niu, Z., Li, R., 2020. The distribution and risk of mercury in shenzhen mangroves, representative urban mangroves affected by human activities in china. Mar. Pollut. Bull. 151, 110866.1–110866.9.
Smith, T.L., Himmelstoss, E.A., and Thieler, E.R., 2013. Massachusetts shoreline change project—A GIS compilation of vectors horelines and associated shoreline change data for the 2013 update: U.S. Geological Survey Open-File Report 2012–1183.
Smoak, J.M., Breithaupt, L.L., Smith III, T.J., Sanders, C., 2013. Sediment accretion and organic carbon burial relative to sea-level rise and storm events in two mangrove forests in Everglades National Park. Catena 104 (2), 58–66.
Thanh, T.D., Saito, Y., Huy, D.V., Nguyen, V.L., Ta, T.K.O., Tateishi, M., 2004. Regimes of human and climate impacts on coastal changes in Vietnam. Reg. Environ. Change 4 (1), 49–62.
Thieler, E.R., Himmelstoss, E.A., Zichichi, J.L., Ergul, Ayhan, 2009. Digital Shoreline Analysis System (DSAS) version 4.0—An ArcGIS extension for calculating shoreline change: U.S. Geological Survey Open-File Report 2008-1278. *current version 4.3.
Thomas, N., Bunting, P., Lucas, R., Hardy, A., Rosenqvist, A., Fatoyinbo, T., 2018. Mapping mangrove extent and change: a globally applicable approach. Remote Sens. 10 (9), 1466.
Thomas, N., Lucas, R., Bunting, P., Hardy, A., Rosenqvist, A., Simard, M., 2017. Distribution and drivers of global mangrove forest change, 1996–2010. PLoS ONE 12 (6), e0179302.
Valiela, I., Bowen, J.L., York, J.K., 2001. Mangrove forests: one of the World’s threatened major tropical environments. Bioscience 51 (10), 807–815.
Van Maren, D.S., 2005. Barrier formation on an actively prograding delta system: The Red River Delta, Vietnam. Mar. Geol. 224 (1–4), 123–143.
van Maren, D.S., Hoekstra, P., Hoitink, A.J.F., 2004. Tidal flow asymmetry in the diurnal regime: bed-load transport and morphologic changes around the Red River Delta. Ocean Dyn. 54 (3–4), 424–434.
Van Maren, D.S., Hoekstra, P., 2004. Seasonal variation of hydrogynamics and sediment dynamics in a shallow subtropical estuary: the Ba Lat River, Vietnam. Estuarine, Coast. Shelf Sci. 60, 529–540.
Vermote, E., Justice, C., Claverie, M., Franch, B., 2016. Preliminary analysis of the performance of the Landsat 8/OLI land surface reflectance product. Remote Sens. Environ. 185, 46–56.
Woodroffe, C.D., Rogers, K., McKee, K.L., Lovelock, C.E., Mendelssohn, I.A., Saintilan, N., 2016. Mangrove sedimentation and response to relative sea-level rise. Annu. Rev. Mar. Sci. 8 (1), 243.
Zhu, Z., Woodcock, C.E., 2012. Object-based cloud and cloud shadow detection in Landsat imagery. Remote Sens. Environ. 118, 83–94.
Zhu, Z., Woodcock, C.E., 2014. Continuous change detection and classification of land cover using all available Landsat data. Remote Sens. Environ. 144, 152–171.
Zhu, Z., Wang, S., Woodcock, C.E., 2015. Improvement and expansion of the Fmask algorithm: cloud, cloud shadow, and snow detection for Landsats4-7, 8, and Sentinel 2 images. Remote Sens. Environ. 159, 269–277.
C. Long et al.