forensic entropy analysis of microsoft windows … · security essentials, adobe acrobat and flash...
TRANSCRIPT
Vol.105(2) June 2014 SOUTH AFRICAN INSTITUTE OF ELECTRICAL ENGINEERS 63
FORENSIC ENTROPY ANALYSIS OF MICROSOFT WINDOWSSTORAGE VOLUMES
P. J. Weston∗ and S. D. Wolthusen†
∗ Information Security Group, Royal Holloway, University of London, Egham, Surrey TW20 0EX, UKE-mail: [email protected]† Norwegian Information Security Laboratory, Gjøvik University College, N-2818 Gjøvik, Norway andInformation Security Group, Royal Holloway, University of London, Egham, Surrey TW20 0EX, UKE-mail: [email protected]
Abstract: The use of file or volume encryption as a counter-forensic technique depends on the ability toplausibly deny the presence of such encrypted data. Establishing the likely presence of encrypted data ishighly desirable for forensic investigations. We claim that the current or previous existence of encryptedvolumes can be derived from studying file and volume entropy characteristics using knowledge of thedevelopment of volume entropy over time. To validate our hypothesis, we have examined severalversions of the Microsoft Windows operating system platform over a simulated installation life-cycleand established file and volume entropy metrics. Similarly we verified the hypothesis that the ageingthrough regular use of an installation is identifiable through entropy fingerprint analysis. The resultsobtained and tests devised allow the rapid identification of several volume-level operations and alsodetect anomalous slack space entropy indicative of the use of encryption techniques.
Key words: File System Entropy, Installation Aging, Encrypted File Systems
1. INTRODUCTION
The use of volume encryption by itself is insufficient
to keep data confidential or as a counter-forensic
technique when access to key material can be obtained
or enforced. This may occur e.g. pursuant to Part III
of the UK Regulation of Investigatory Powers Act 2000,
requiring that a suspect supply decrypted information
and/or cryptographic keys to authorised government
representatives [1]. A skilled adversary will hence aim to
use a combination of cryptography and steganography∗to
achieve plausible deniability, whilst forensic investigators
must identify the presence of encrypted volumes for further
analysis as an in-depth manual inspection may not always
be feasible.
Entropy is a measure of the amount of information present
in a signal or file∗∗. A low entropy measurement implies a
well-ordered, well-structured signal whilst a high entropy
measurement indicates a signal with little apparent order
or structure. Encrypted information, however, must not
show discernible order or structure lest this make the
encryption vulnerable to various forms of statistical attack
i.e. encrypted data must have high entropy. Measurements
of entropy and randomness taken against a computer
system should reveal some information about the current
state of that system and the data stored on it even when file
signature evidence has been removed or replaced.
The very presence of high entropy data on a system
∗see e.g. the United Nations Office on Drugs and Crime report
“The use of the Internet for terrorist purposes”, Sep. 2012 discussing
steganographic mechanisms used for covert communication by terrorist
entities with a case study involving the Revolutionary Armed Forces of
Colombia (FARC).∗∗We rely on the standard Shannon entropy in the following.
may therefore prevent a suspect from plausibly denying
the presence of encrypted information. However, file
compression may result in similar high entropy encoding,
requiring a more careful analysis. We have hence
sought to characterise the relative entropy found for
encrypted and unencrypted (including compressed) data,
but also the effects of utilising different operating system
versions as well as usage patterns. The research reported
in this paper aimed to determine experimentally the
extent to which measures of entropy and randomness
can differentiate between encrypted and unencrypted
data, different computer operating system versions and
configurations and typical and atypical computer usage.
A large number of Microsoft Windows workstation
installations are run through a simulated ageing process
consisting of —
• applying patches and updates,
• installing and configuring applications, and
• creating and deleting large numbers of data files of
known types.
Forensic images of each workstation were captured at key
points during the ageing process and entropy and statistical
randomness measurements were taken from each image
for each storage volume and every installed image file. In
order to verify the results obtained through simulation, a
number of images captured from production workstations
are analysed and compared.
As Microsoft Windows is by far the dominant platform
in terms of desktop systems deployed, we focus here
on this platform; analogue experiments for the Linux
environment have, however, been conducted with broadly
comparable results, only some of these are reported
here in the interest of completeness. However, the
Based on “Forensic entropy analysis of Microso� Windows storage volumes”, by P. J.Weston and S. D. Wolthusen which appeared in the Proceedings of Information Security South African (ISSA) 2013, Johannesburg, 14 to 16 August 2013. © 2013 IEEE
� � � � � � � � � � � � � � � � � � � � � � � � �* Information Security Group, Royal Holloway, University of London, Egham, Surrey TW20 0EX, UK
E-mail: [email protected]
† Norwegian Information Security Laboratory, Gjøvik University College, N-2818 Gjøvik, Norway and
Information Security Group, Royal Holloway, University of London, Egham, Surrey TW20 0EX, UK
E-mail: [email protected]
Vol.105(2) June 2014SOUTH AFRICAN INSTITUTE OF ELECTRICAL ENGINEERS64
existence of several alternative file systems and morefrequent significant release changes reduces the time seriesavailable for equivalent analysis. The remainder of thispaper is structured as follows: In section 2. we brieflyoutline related work, followed by a description of theexperimental setup in section 3. used for the subsequentanalyses in sections 4. and 5. for file and volume analysis,respectively. We discuss key findings in section 6. beforedescribing our conclusions and future work in section 7.
2. RELATED WORK
Research into signature and content analysis forms thebasis of many file identification techniques, while workon multimedia data in particular is seen as vital todigital forensics. As this is a crucial pre-requisitefor effective carving in the presence of fragmented ordeleted data, file system behaviour allowing the effectivegrouping and identification of fragments has been studiedby a number of researchers; Holleboom and Garciainvestigated and performed experiments on informationretention in slack-space for micro-fragments of previousfiles occupying the same clusters [2] with extensions byBlacher for the case of NTFS [3]; this also provides afurther bound on the entropy of such clusters that is to beexpected over the life-cycle of a frequently-reused storagemedium.
A recent overview of the state of the art of multimediaforensic investigations is given by Poisel and Tjoa [4]while Ahmed et al. give examples of advanced methodsused to improve file identification [5]. Shannon’s analysisof ASCII and entropy scoring building on his namesake’swork is of particular interest [6], as is recent work byWu et al. showing how entropy and randomness testingcan be used on encrypted images [7]; the tool TCHuntby 16 Systems identifies TrueCrypt images specificallyby combining a search for volume (including sparsevolumes) characteristics of TrueCrypt with a simpleentropy analysis. Statistical analysis of file system clusterscan yield insights on file types even for isolated clusters asdiscussed by Veenman [8]; for more specific file analyses,Lyda and Hamrock describe an entropy-driven approachfor detecting encrypted malware, albeit relying only onblock frequency (binning) to obtain a relatively coarsemetric [9]. For the case of packed malware — which isbeyond the scope of the present paper — this may not besufficient if counter-forensic techniques are employed asrecently described by Ugarte-Pedrero et al. [10]. This isalso closely related to the need to predict the compositionof file fragments; algorithms for which have e.g. beenstudied by Calhoun and Coles [11] with related approachesfor classification described by Roussev and Garfinkel [12].
3. EXPERIMENTAL SETUP
The focus of the present work is, without loss of generality,on the Microsoft Windows operating system platform.Initially, eight production disk images were captured frompre-existing Microsoft Windows workstation installationsusing forensic capture tools. A total of 7 variants of
Microsoft Windows 7, Vista, and XP were installed indefault VMware Fusion 3.1 virtual machines (VM) usingthe VMware “Easy Install” wizard [13] at this time. At alater date, 2 variants of Microsoft Windows 7 and 8 wereinstalled in default VMware Fusion 5.0 virtual machinesand a Windows 8 production disk image was captured.The Boot volume of each installation was analysed. Inall cases, the file system used was NTFS, and the clustersize set to eight 512 byte sectors. Except as noted, allstorage sectors were zeroed prior to installation of theoperating system instances. All images captured duringthis project were captured from Windows installations afterthe operating system had been shut down. MicrosoftWindows workstation installations are categorised in thispaper as either “Home” or “Business” depending uponthe usage pattern and the installed applications and data.A common application suite — consisting of MicrosoftSecurity Essentials, Adobe Acrobat and Flash Player, andVMware Tools — was installed on all virtual machineimages. In addition, Oracle Java and Microsoft Officewere installed on business VM images. Open Office,Mozilla Firefox and Thunderbird, Google Picasa, AppleiTunes and the Steam client application were installed onhome virtual machine images to reflect different usagepatterns. All applications were the latest versions at timeof installation (June 2012 or September 2013). Document,music, picture, video and archive files were added to eachvirtual machine image; business virtual machine imagescontained relatively more document files, whilst homevirtual machine images contained relatively more mediafiles of different types. The relative proportions of eachfile type is the same in all cases but a different set of fileswere used for the later workstation images.
A total of 69 VM images were created through a simulatedproduction life-cycle consisting of patching Windows,copying and deleting data files on the Boot volume, andexercising the installed applications. In ascending order ofage, the simulated life-cycle stages are referred to in thispaper as “Initial”, “Patched”, “Base”, and “Copyx” (wherex is the number of iterations). Captured images are referredto as “Actual” with a number identifying the image and aletter suffix indicating life-cycle stage where known (“a”is older than “b”, etc.). Newer images are identified by the“new” suffix. So as to obtain images reflecting realisticlonger-term use, the authors relied on images obtainedfrom volunteers for validation. However, whilst all imagesand scripts utilised in obtaining the results described herecan be made freely available on request, this does not applyto these validation images for privacy reasons. Encrypteddata was obtained by creating TrueCrypt containers ofvarious sizes using AES, Serpent and Twofish encryptionalgorithms and RIPEMD-160, SHA-512 and Whirlpoolhash algorithms; AES with RIPEMD-160 was the defaultconfiguration. The same (weak) password was used inall cases, although all algorithms are sufficiently robust toeliminate influence on the entropy of encrypted data.
Data sectors were extracted from the volume images usingtools provided in The Sleuth Kit [14]. Entropy andrandomness calculations were performed on extracted data
Vol.105(2) June 2014 SOUTH AFRICAN INSTITUTE OF ELECTRICAL ENGINEERS 65
7-Zip 7-Zip TrueCrypt TrueCrypt
File Cluster File Cluster
Count 237 1539 99 1024
Mean 7.999 7.955 8.000 7.955
Median 7.999 7.955 8.000 7.955
Min. 7.996 7.940 8.000 7.942
Max. 8.000 7.967 8.000 7.967
Table 1: 7-Zip and TrueCrypt Entropy (Bits/Byte)
at the byte level using the ent utility [15]. Where byte-levelentropy calculations are impractical or inappropriate,data compression has been used as an analogue; allcompression ratios reported in this paper result from GZIPcompression at the “-4” compression level, utilising theLempel-Ziv algorithm at its core [16], albeit utilising theDEFLATE format [17]. We note that not all applicationswere available for each version of the platform, resultingin some results not being available for all points of a timeseries; these data sets are reported as far as compatibilitywas retained. The results do not address possible changesof behaviour of users over time such as migrating fromone application or platform to another as such behaviouralchanges and hypotheses underpinning behaviour werebeyond the scope of the research.
4. FILE ANALYSIS
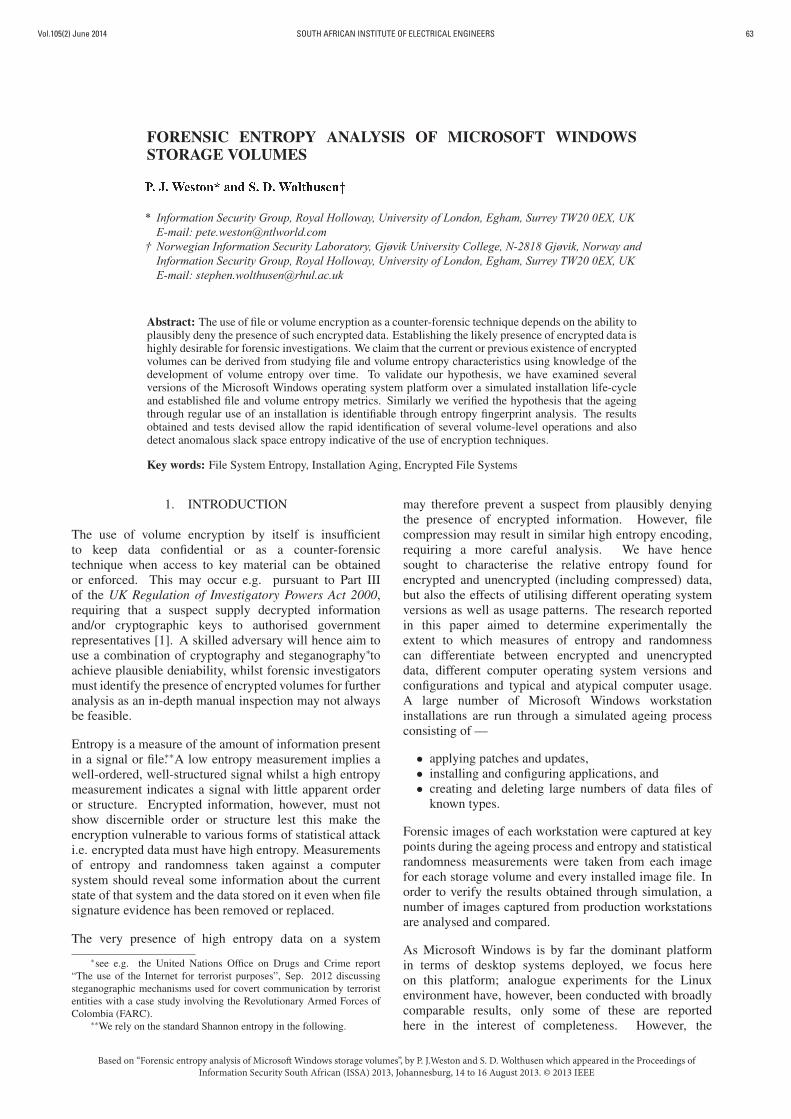
Entropy and randomness was measured at the byte-levelfor a statistically significant number of test files of varioustypes: the mean and median number of files of each typeanalysed were 716 and 255 respectively with the minimumnumber of files of any one type being 11. Media andmodern document file formats were found to exhibit highmean entropy in the range 7.270 to 7.981 bits/byte; mostexecutables and older document formats exhibited lowermean entropy in the range 3.822 to 5.989 bits/byte. Thisreflects the use of improved compression algorithms in thenewer file formats.
For file archives, entropy results reflect the relativeperformance of the compression algorithms used: LZNT1shows the lowest mean entropy (947 files analysed,mean 7.558 bits/byte) and (G)ZIP and 7-Zip the highestmean entropy (96 files, mean 7.981 and 237 files,mean 7.999 bits/byte respectively). Encrypted TrueCryptfiles consistently exhibit the highest possible byte-levelentropy. TrueCrypt and 7-Zip clusters analysed inisolation, however, exhibit very similar (lower) entropy toeach other (see Table 1).
χ-square, byte mean value, Monte Carlo π, and serialcorrelation values were calculated for all tested files. Theχ-square test indicated that, with few exceptions, only7-Zip and TrueCrypt files exhibit uniform randomnessat the byte level. At the file level it was also notedthat TrueCrypt containers consistently return χ-squareresults slightly closer to uniform randomness than thetested archive files; this does not apply when TrueCryptcontainers are viewed at the cluster level (see Table 2).
7-Zip 7-Zip TrueCrypt TrueCrypt
File Cluster File Cluster
Mean 256.353 253.776 254.078 254.652
Median 258.247 253.375 254.073 253.750
Min. 190.077 182.750 204.452 185.500
Max. 324.218 340.375 322.160 326.500
Table 2: 7-Zip/TrueCrypt Chi-Square Statistics
4.1 Media File Analysis
Specific analyses were conducted for a number of file typesincluding text, formatted text (XML, PDF), document(different Microsoft Office formats as well as OpenDocument format files), and media (image, video, andaudio) data. Of particular interest in the context of thepresent paper are compressed file formats, which arecharacteristic of media data, but also more recent modernfile formats noted above. Here, we have analysed basicdescriptive statistics for file samples
MP3 M4A
Count 6465 1088
Mean Entropy 7.967 7.981
Standard Deviation 0.041 0.011
Sample Variance 0.002 0.000
Kurtosis 334.617 80.982
Skewness -15.283 -7.736
Minimum 6.710 7.822
Maximum 7.995 7.994
Confidence Level(95%) 0.001 0.001
Table 3: Entropy - Descriptive Statistics (Music files)
Table 3 shows that the compressed MP3 and M4A musicfile formats exhibit very high mean levels of entropy(similar to the entropy levels exhibited by compressedimage file formats). Music file formats similarly alsoexhibit very little variance or deviation from their meanentropy value. For the music file types tested, χ-squarerandomness indicators have values well above valuesexpected for random data (see Table 4). We can see easilythat the tested music file formats do not exhibit randomnessat the byte level; this is to be expected given the internalstructure of the formats used, but yields a usable andefficient distinguishing feature. It is clearly necessary toperform this type of analysis as can be seen from thecompression levels found in common file types; figure 1provides a summary of the mean entropy for file types; thisdistribution is notably different once entropy is studied atthe block or cluster level.
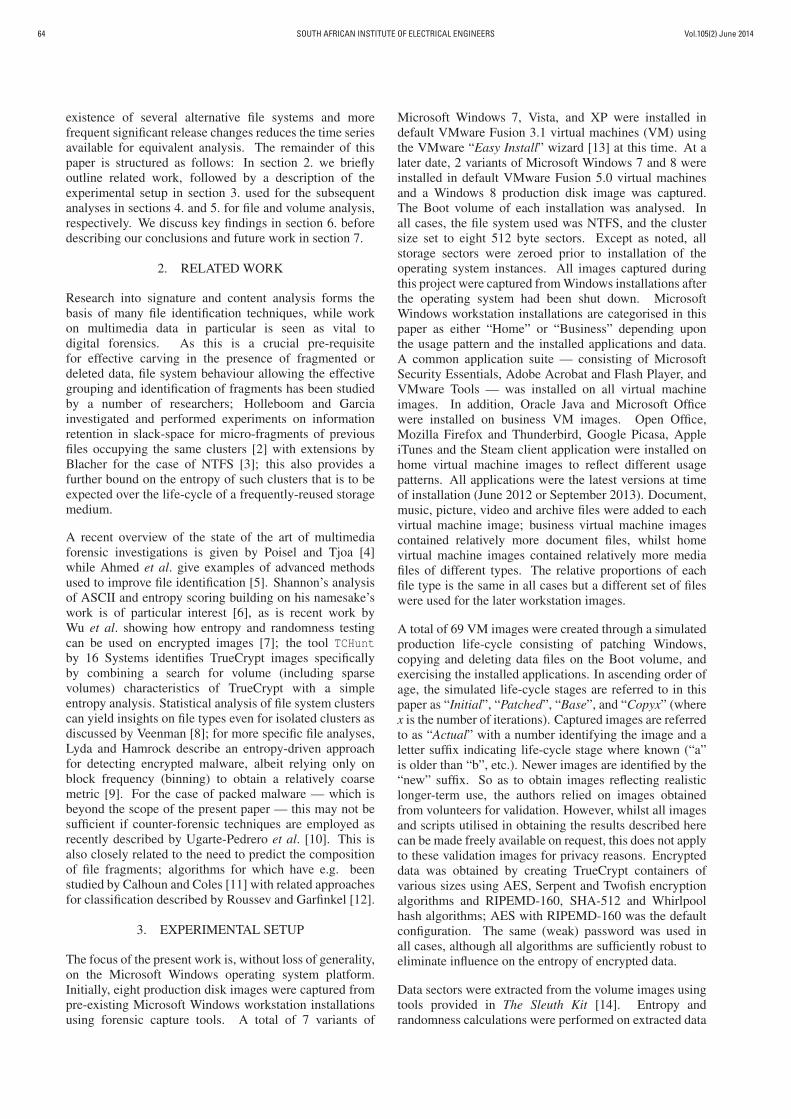
4.2 System File Analysis
Entropy and randomness values were calculated forWindows system and meta-data files at various points inthe (simulated) Windows life-cycle. Entropy-frequencyplots of the complete set of files forming each Microsoftoperating system were found to be quite different to a
Vol.105(2) June 2014SOUTH AFRICAN INSTITUTE OF ELECTRICAL ENGINEERS66
Figure 1: Overall File Mean Entropy (by Type). At least 1000
files per format were analysed.
Figure 2: Operating System File Entropy (Initial Installation)
similar plot of a recent Linux distribution. Figure 2shows how different versions of Windows were observedto have relatively distinct entropy-frequency plots at initialinstallation. These distinctions tended to dissipate asdata files were added to each installation although it wasalways possible to differentiate between Windows andLinux instances.
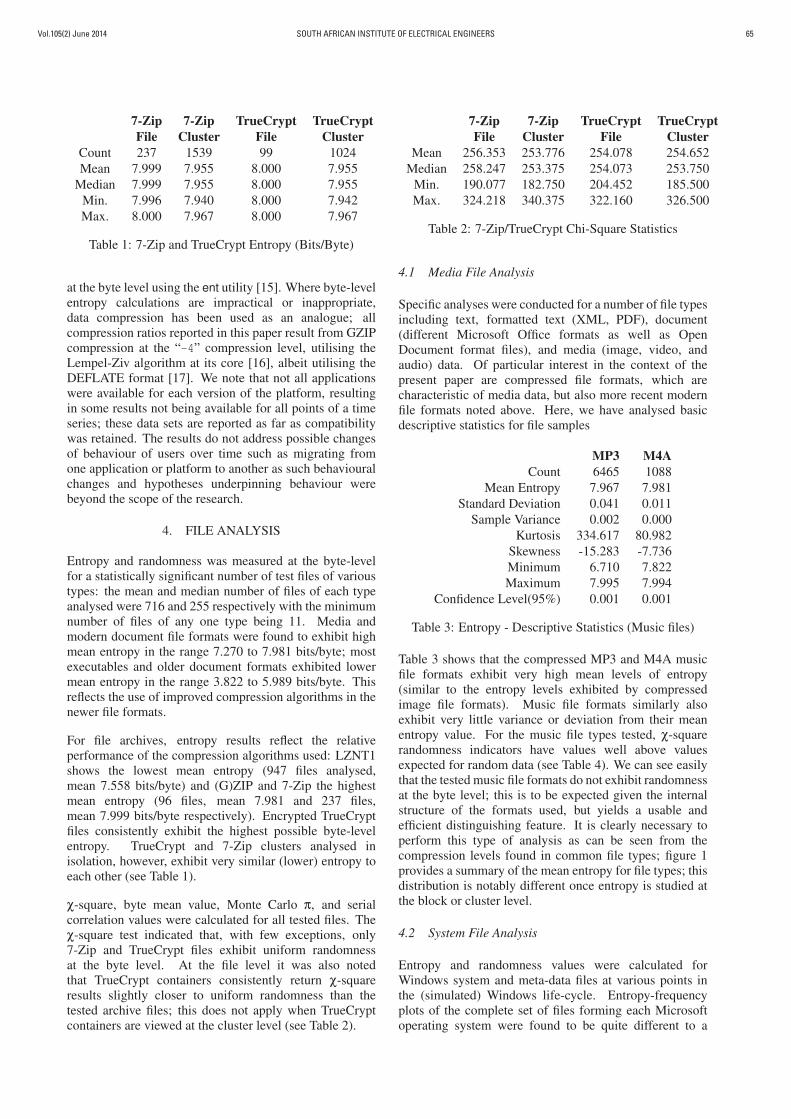
Windows uses the file PAGEFILE.SYS for virtual memorymanagement. This paging file is not, by default, clearedwhen Windows is shut down [18] and hence entropy resultscan be expected to reflect data that has been swapped frommain memory during Windows operation. Windows 8“Modern” Apps use an additional SWAPFILE.SYS file tostore their whole (private) working when suspended [19].
Figure 3 shows how the entropy of the Windows pagingfiles generally increases over time. The test results indicatethat the entropy of the paging file reflects the memoryresources available on the host system. The Windows8 (x64) test images, for instance, show significantlyhigher paging file entropy because they were generatedon a virtual machine with half of the minimum memoryrequirement for this operating system. The greatestentropy of any paging file observed during testing was a
Figure 3: PAGEFILE.SYS File Entropy
Figure 4: $LOGFILE File Entropy
“Base” Windows 7 image installed on a disk that had firstbeen initialised by a UNIX urandom device. Paging fileswith unusually high entropy values may therefore be ableto give some information about the history of a Windowssystem.
Windows 8 “Modern” Apps were not consciouslyexercised on the Windows 8 test images and consequentlythe Windows 8 SWAPFILE.SYS file exhibits extremely lowentropy values on the test images. “Modern” Apps were,however, used on the production Windows 8 image and inthis case swap file entropy is much higher. Entropy figuresfor the Windows 8 SWAPFILE.SYS file may therefore givesome indication about the types of applications used on aWindows 8 sytem.
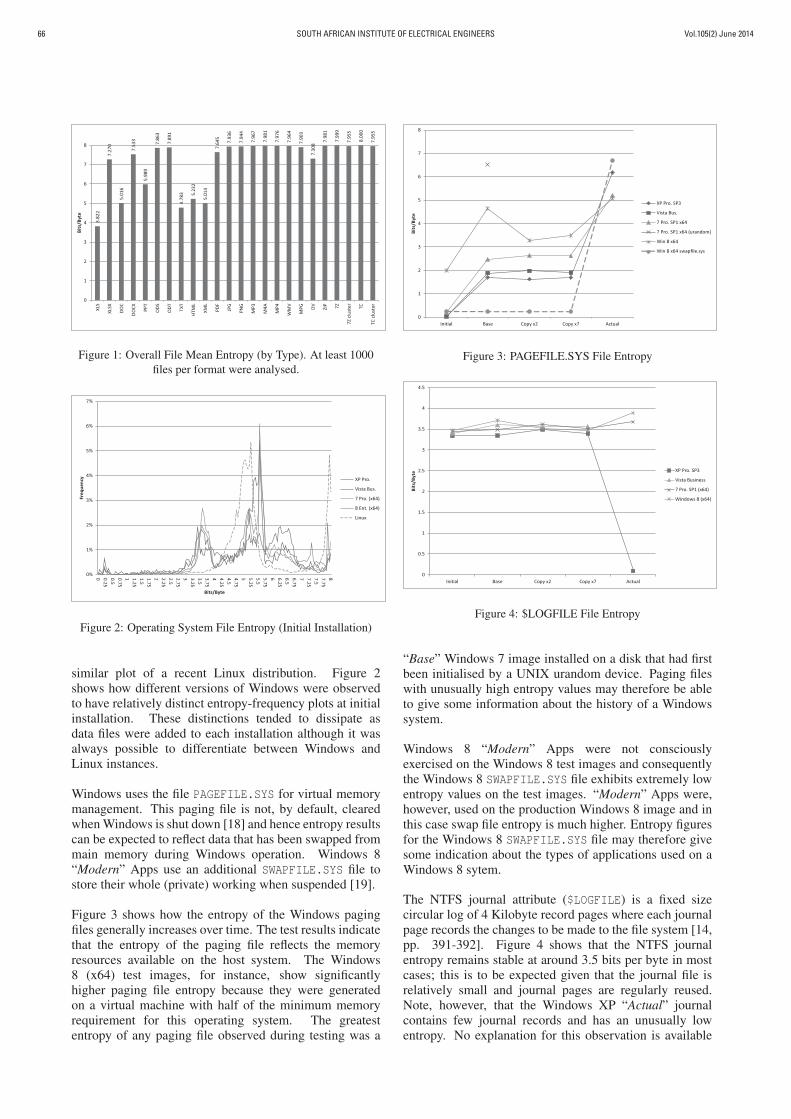
The NTFS journal attribute ($LOGFILE) is a fixed sizecircular log of 4 Kilobyte record pages where each journalpage records the changes to be made to the file system [14,pp. 391-392]. Figure 4 shows that the NTFS journalentropy remains stable at around 3.5 bits per byte in mostcases; this is to be expected given that the journal file isrelatively small and journal pages are regularly reused.Note, however, that the Windows XP “Actual” journalcontains few journal records and has an unusually lowentropy. No explanation for this observation is available
Vol.105(2) June 2014 SOUTH AFRICAN INSTITUTE OF ELECTRICAL ENGINEERS 67
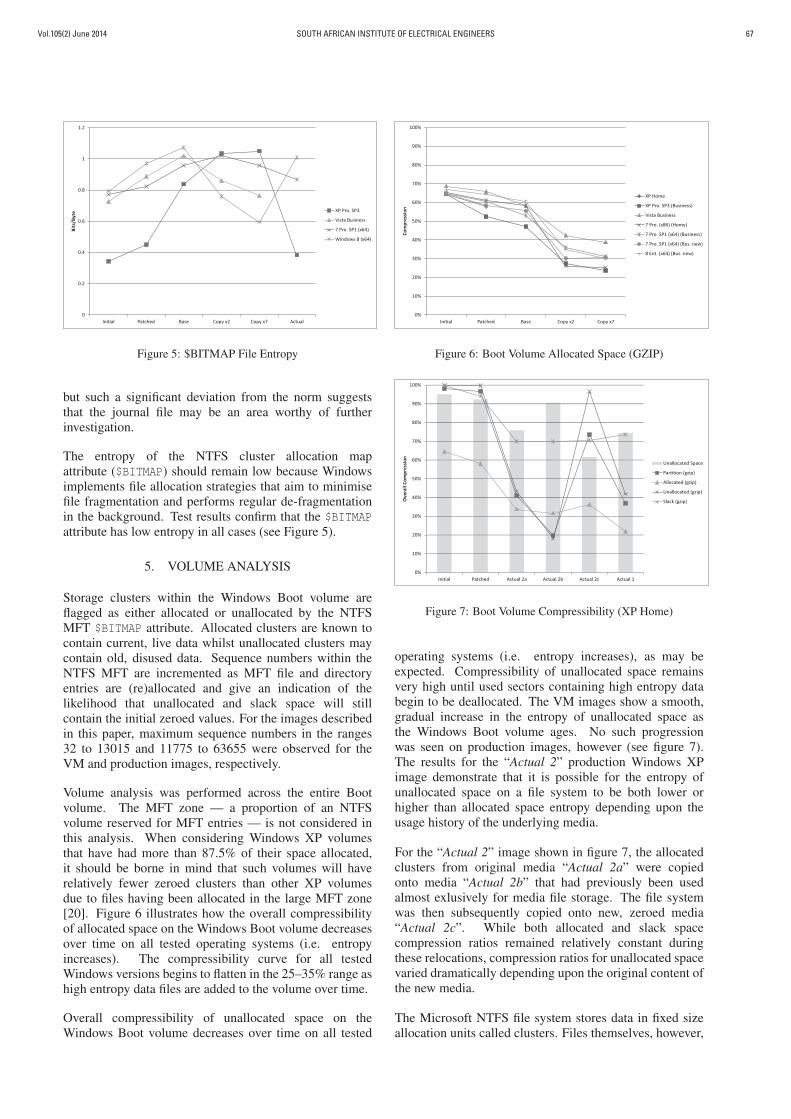
Figure 5: $BITMAP File Entropy
but such a significant deviation from the norm suggeststhat the journal file may be an area worthy of furtherinvestigation.
The entropy of the NTFS cluster allocation mapattribute ($BITMAP) should remain low because Windowsimplements file allocation strategies that aim to minimisefile fragmentation and performs regular de-fragmentationin the background. Test results confirm that the $BITMAPattribute has low entropy in all cases (see Figure 5).
5. VOLUME ANALYSIS
Storage clusters within the Windows Boot volume areflagged as either allocated or unallocated by the NTFSMFT $BITMAP attribute. Allocated clusters are known tocontain current, live data whilst unallocated clusters maycontain old, disused data. Sequence numbers within theNTFS MFT are incremented as MFT file and directoryentries are (re)allocated and give an indication of thelikelihood that unallocated and slack space will stillcontain the initial zeroed values. For the images describedin this paper, maximum sequence numbers in the ranges32 to 13015 and 11775 to 63655 were observed for theVM and production images, respectively.
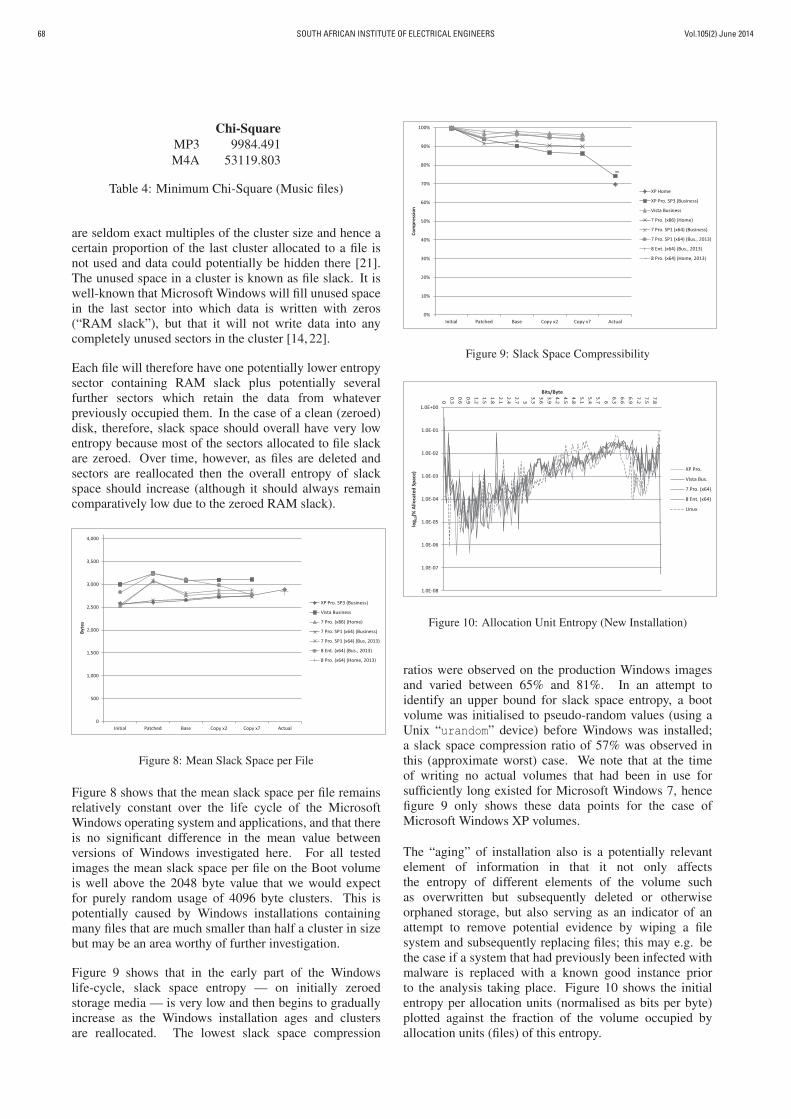
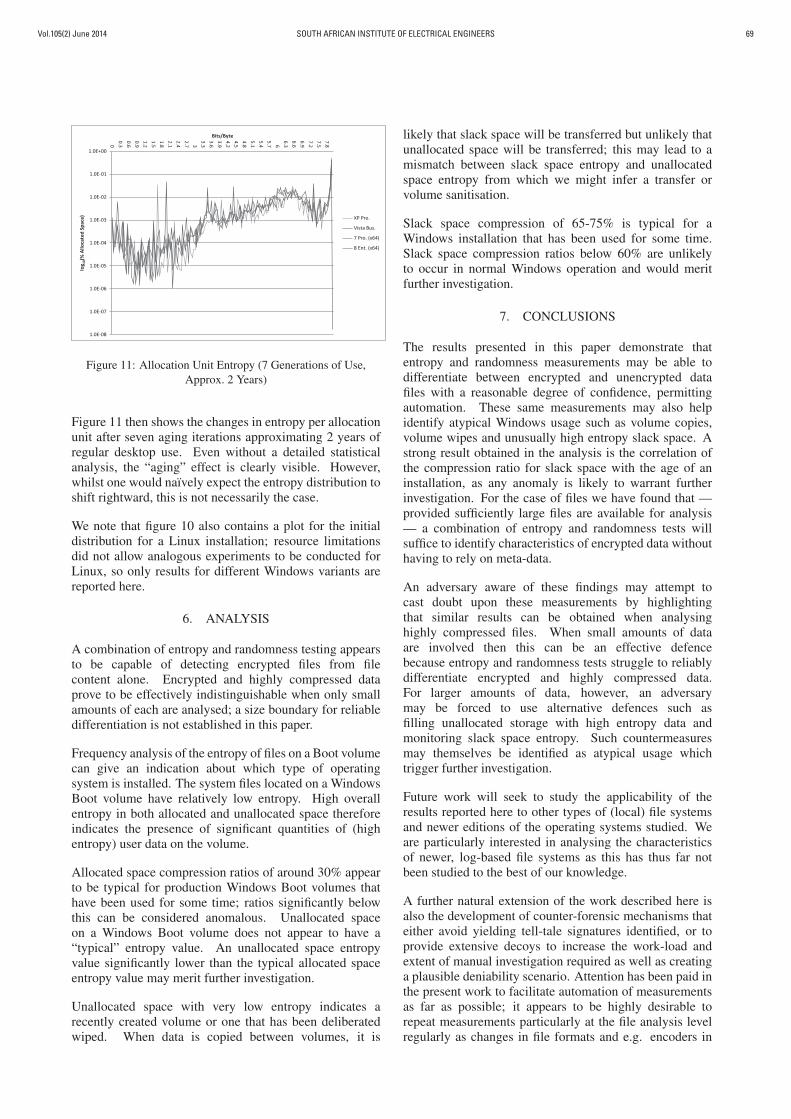
Volume analysis was performed across the entire Bootvolume. The MFT zone — a proportion of an NTFSvolume reserved for MFT entries — is not considered inthis analysis. When considering Windows XP volumesthat have had more than 87.5% of their space allocated,it should be borne in mind that such volumes will haverelatively fewer zeroed clusters than other XP volumesdue to files having been allocated in the large MFT zone[20]. Figure 6 illustrates how the overall compressibilityof allocated space on the Windows Boot volume decreasesover time on all tested operating systems (i.e. entropyincreases). The compressibility curve for all testedWindows versions begins to flatten in the 25–35% range ashigh entropy data files are added to the volume over time.
Overall compressibility of unallocated space on theWindows Boot volume decreases over time on all tested
Figure 6: Boot Volume Allocated Space (GZIP)
Figure 7: Boot Volume Compressibility (XP Home)
operating systems (i.e. entropy increases), as may beexpected. Compressibility of unallocated space remainsvery high until used sectors containing high entropy databegin to be deallocated. The VM images show a smooth,gradual increase in the entropy of unallocated space asthe Windows Boot volume ages. No such progressionwas seen on production images, however (see figure 7).The results for the “Actual 2” production Windows XPimage demonstrate that it is possible for the entropy ofunallocated space on a file system to be both lower orhigher than allocated space entropy depending upon theusage history of the underlying media.
For the “Actual 2” image shown in figure 7, the allocatedclusters from original media “Actual 2a” were copiedonto media “Actual 2b” that had previously been usedalmost exlusively for media file storage. The file systemwas then subsequently copied onto new, zeroed media“Actual 2c”. While both allocated and slack spacecompression ratios remained relatively constant duringthese relocations, compression ratios for unallocated spacevaried dramatically depending upon the original content ofthe new media.
The Microsoft NTFS file system stores data in fixed sizeallocation units called clusters. Files themselves, however,
Vol.105(2) June 2014SOUTH AFRICAN INSTITUTE OF ELECTRICAL ENGINEERS68
Chi-Square
MP3 9984.491
M4A 53119.803
Table 4: Minimum Chi-Square (Music files)
are seldom exact multiples of the cluster size and hence a
certain proportion of the last cluster allocated to a file is
not used and data could potentially be hidden there [21].
The unused space in a cluster is known as file slack. It is
well-known that Microsoft Windows will fill unused space
in the last sector into which data is written with zeros
(“RAM slack”), but that it will not write data into any
completely unused sectors in the cluster [14, 22].
Each file will therefore have one potentially lower entropy
sector containing RAM slack plus potentially several
further sectors which retain the data from whatever
previously occupied them. In the case of a clean (zeroed)
disk, therefore, slack space should overall have very low
entropy because most of the sectors allocated to file slack
are zeroed. Over time, however, as files are deleted and
sectors are reallocated then the overall entropy of slack
space should increase (although it should always remain
comparatively low due to the zeroed RAM slack).
Figure 8: Mean Slack Space per File
Figure 8 shows that the mean slack space per file remains
relatively constant over the life cycle of the Microsoft
Windows operating system and applications, and that there
is no significant difference in the mean value between
versions of Windows investigated here. For all tested
images the mean slack space per file on the Boot volume
is well above the 2048 byte value that we would expect
for purely random usage of 4096 byte clusters. This is
potentially caused by Windows installations containing
many files that are much smaller than half a cluster in size
but may be an area worthy of further investigation.
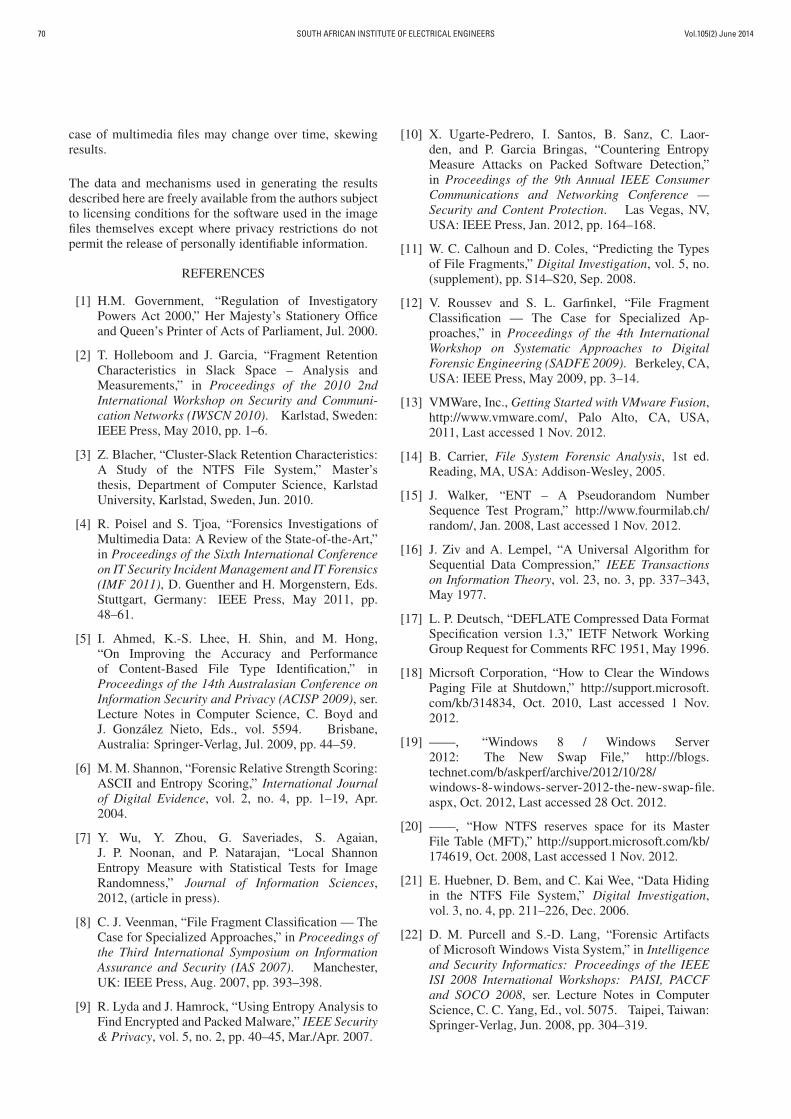
Figure 9 shows that in the early part of the Windows
life-cycle, slack space entropy — on initially zeroed
storage media — is very low and then begins to gradually
increase as the Windows installation ages and clusters
are reallocated. The lowest slack space compression
Figure 9: Slack Space Compressibility
Figure 10: Allocation Unit Entropy (New Installation)
ratios were observed on the production Windows images
and varied between 65% and 81%. In an attempt to
identify an upper bound for slack space entropy, a boot
volume was initialised to pseudo-random values (using a
Unix “urandom” device) before Windows was installed;
a slack space compression ratio of 57% was observed in
this (approximate worst) case. We note that at the time
of writing no actual volumes that had been in use for
sufficiently long existed for Microsoft Windows 7, hence
figure 9 only shows these data points for the case of
Microsoft Windows XP volumes.
The “aging” of installation also is a potentially relevant
element of information in that it not only affects
the entropy of different elements of the volume such
as overwritten but subsequently deleted or otherwise
orphaned storage, but also serving as an indicator of an
attempt to remove potential evidence by wiping a file
system and subsequently replacing files; this may e.g. be
the case if a system that had previously been infected with
malware is replaced with a known good instance prior
to the analysis taking place. Figure 10 shows the initial
entropy per allocation units (normalised as bits per byte)
plotted against the fraction of the volume occupied by
allocation units (files) of this entropy.
Vol.105(2) June 2014 SOUTH AFRICAN INSTITUTE OF ELECTRICAL ENGINEERS 69
Figure 11: Allocation Unit Entropy (7 Generations of Use,
Approx. 2 Years)
Figure 11 then shows the changes in entropy per allocation
unit after seven aging iterations approximating 2 years of
regular desktop use. Even without a detailed statistical
analysis, the “aging” effect is clearly visible. However,
whilst one would naıvely expect the entropy distribution to
shift rightward, this is not necessarily the case.
We note that figure 10 also contains a plot for the initial
distribution for a Linux installation; resource limitations
did not allow analogous experiments to be conducted for
Linux, so only results for different Windows variants are
reported here.
6. ANALYSIS
A combination of entropy and randomness testing appears
to be capable of detecting encrypted files from file
content alone. Encrypted and highly compressed data
prove to be effectively indistinguishable when only small
amounts of each are analysed; a size boundary for reliable
differentiation is not established in this paper.
Frequency analysis of the entropy of files on a Boot volume
can give an indication about which type of operating
system is installed. The system files located on a Windows
Boot volume have relatively low entropy. High overall
entropy in both allocated and unallocated space therefore
indicates the presence of significant quantities of (high
entropy) user data on the volume.
Allocated space compression ratios of around 30% appear
to be typical for production Windows Boot volumes that
have been used for some time; ratios significantly below
this can be considered anomalous. Unallocated space
on a Windows Boot volume does not appear to have a
“typical” entropy value. An unallocated space entropy
value significantly lower than the typical allocated space
entropy value may merit further investigation.
Unallocated space with very low entropy indicates a
recently created volume or one that has been deliberated
wiped. When data is copied between volumes, it is
likely that slack space will be transferred but unlikely that
unallocated space will be transferred; this may lead to a
mismatch between slack space entropy and unallocated
space entropy from which we might infer a transfer or
volume sanitisation.
Slack space compression of 65-75% is typical for a
Windows installation that has been used for some time.
Slack space compression ratios below 60% are unlikely
to occur in normal Windows operation and would merit
further investigation.
7. CONCLUSIONS
The results presented in this paper demonstrate that
entropy and randomness measurements may be able to
differentiate between encrypted and unencrypted data
files with a reasonable degree of confidence, permitting
automation. These same measurements may also help
identify atypical Windows usage such as volume copies,
volume wipes and unusually high entropy slack space. A
strong result obtained in the analysis is the correlation of
the compression ratio for slack space with the age of an
installation, as any anomaly is likely to warrant further
investigation. For the case of files we have found that —
provided sufficiently large files are available for analysis
— a combination of entropy and randomness tests will
suffice to identify characteristics of encrypted data without
having to rely on meta-data.
An adversary aware of these findings may attempt to
cast doubt upon these measurements by highlighting
that similar results can be obtained when analysing
highly compressed files. When small amounts of data
are involved then this can be an effective defence
because entropy and randomness tests struggle to reliably
differentiate encrypted and highly compressed data.
For larger amounts of data, however, an adversary
may be forced to use alternative defences such as
filling unallocated storage with high entropy data and
monitoring slack space entropy. Such countermeasures
may themselves be identified as atypical usage which
trigger further investigation.
Future work will seek to study the applicability of the
results reported here to other types of (local) file systems
and newer editions of the operating systems studied. We
are particularly interested in analysing the characteristics
of newer, log-based file systems as this has thus far not
been studied to the best of our knowledge.
A further natural extension of the work described here is
also the development of counter-forensic mechanisms that
either avoid yielding tell-tale signatures identified, or to
provide extensive decoys to increase the work-load and
extent of manual investigation required as well as creating
a plausible deniability scenario. Attention has been paid in
the present work to facilitate automation of measurements
as far as possible; it appears to be highly desirable to
repeat measurements particularly at the file analysis level
regularly as changes in file formats and e.g. encoders in
Vol.105(2) June 2014SOUTH AFRICAN INSTITUTE OF ELECTRICAL ENGINEERS70
case of multimedia files may change over time, skewing
results.
The data and mechanisms used in generating the results
described here are freely available from the authors subject
to licensing conditions for the software used in the image
files themselves except where privacy restrictions do not
permit the release of personally identifiable information.
REFERENCES
[1] H.M. Government, “Regulation of Investigatory
Powers Act 2000,” Her Majesty’s Stationery Office
and Queen’s Printer of Acts of Parliament, Jul. 2000.
[2] T. Holleboom and J. Garcia, “Fragment Retention
Characteristics in Slack Space – Analysis and
Measurements,” in Proceedings of the 2010 2nd
International Workshop on Security and Communi-
cation Networks (IWSCN 2010). Karlstad, Sweden:
IEEE Press, May 2010, pp. 1–6.
[3] Z. Blacher, “Cluster-Slack Retention Characteristics:
A Study of the NTFS File System,” Master’s
thesis, Department of Computer Science, Karlstad
University, Karlstad, Sweden, Jun. 2010.
[4] R. Poisel and S. Tjoa, “Forensics Investigations of
Multimedia Data: A Review of the State-of-the-Art,”
in Proceedings of the Sixth International Conference
on IT Security Incident Management and IT Forensics
(IMF 2011), D. Guenther and H. Morgenstern, Eds.
Stuttgart, Germany: IEEE Press, May 2011, pp.
48–61.
[5] I. Ahmed, K.-S. Lhee, H. Shin, and M. Hong,
“On Improving the Accuracy and Performance
of Content-Based File Type Identification,” in
Proceedings of the 14th Australasian Conference on
Information Security and Privacy (ACISP 2009), ser.
Lecture Notes in Computer Science, C. Boyd and
J. Gonzalez Nieto, Eds., vol. 5594. Brisbane,
Australia: Springer-Verlag, Jul. 2009, pp. 44–59.
[6] M. M. Shannon, “Forensic Relative Strength Scoring:
ASCII and Entropy Scoring,” International Journal
of Digital Evidence, vol. 2, no. 4, pp. 1–19, Apr.
2004.
[7] Y. Wu, Y. Zhou, G. Saveriades, S. Agaian,
J. P. Noonan, and P. Natarajan, “Local Shannon
Entropy Measure with Statistical Tests for Image
Randomness,” Journal of Information Sciences,
2012, (article in press).
[8] C. J. Veenman, “File Fragment Classification — The
Case for Specialized Approaches,” in Proceedings of
the Third International Symposium on Information
Assurance and Security (IAS 2007). Manchester,
UK: IEEE Press, Aug. 2007, pp. 393–398.
[9] R. Lyda and J. Hamrock, “Using Entropy Analysis to
Find Encrypted and Packed Malware,” IEEE Security
& Privacy, vol. 5, no. 2, pp. 40–45, Mar./Apr. 2007.
[10] X. Ugarte-Pedrero, I. Santos, B. Sanz, C. Laor-
den, and P. Garcia Bringas, “Countering Entropy
Measure Attacks on Packed Software Detection,”
in Proceedings of the 9th Annual IEEE Consumer
Communications and Networking Conference —
Security and Content Protection. Las Vegas, NV,
USA: IEEE Press, Jan. 2012, pp. 164–168.
[11] W. C. Calhoun and D. Coles, “Predicting the Types
of File Fragments,” Digital Investigation, vol. 5, no.
(supplement), pp. S14–S20, Sep. 2008.
[12] V. Roussev and S. L. Garfinkel, “File Fragment
Classification — The Case for Specialized Ap-
proaches,” in Proceedings of the 4th International
Workshop on Systematic Approaches to Digital
Forensic Engineering (SADFE 2009). Berkeley, CA,
USA: IEEE Press, May 2009, pp. 3–14.
[13] VMWare, Inc., Getting Started with VMware Fusion,
http://www.vmware.com/, Palo Alto, CA, USA,
2011, Last accessed 1 Nov. 2012.
[14] B. Carrier, File System Forensic Analysis, 1st ed.
Reading, MA, USA: Addison-Wesley, 2005.
[15] J. Walker, “ENT – A Pseudorandom Number
Sequence Test Program,” http://www.fourmilab.ch/
random/, Jan. 2008, Last accessed 1 Nov. 2012.
[16] J. Ziv and A. Lempel, “A Universal Algorithm for
Sequential Data Compression,” IEEE Transactions
on Information Theory, vol. 23, no. 3, pp. 337–343,
May 1977.
[17] L. P. Deutsch, “DEFLATE Compressed Data Format
Specification version 1.3,” IETF Network Working
Group Request for Comments RFC 1951, May 1996.
[18] Micrsoft Corporation, “How to Clear the Windows
Paging File at Shutdown,” http://support.microsoft.
com/kb/314834, Oct. 2010, Last accessed 1 Nov.
2012.
[19] ——, “Windows 8 / Windows Server
2012: The New Swap File,” http://blogs.
technet.com/b/askperf/archive/2012/10/28/
windows-8-windows-server-2012-the-new-swap-file.
aspx, Oct. 2012, Last accessed 28 Oct. 2012.
[20] ——, “How NTFS reserves space for its Master
File Table (MFT),” http://support.microsoft.com/kb/
174619, Oct. 2008, Last accessed 1 Nov. 2012.
[21] E. Huebner, D. Bem, and C. Kai Wee, “Data Hiding
in the NTFS File System,” Digital Investigation,
vol. 3, no. 4, pp. 211–226, Dec. 2006.
[22] D. M. Purcell and S.-D. Lang, “Forensic Artifacts
of Microsoft Windows Vista System,” in Intelligence
and Security Informatics: Proceedings of the IEEE
ISI 2008 International Workshops: PAISI, PACCF
and SOCO 2008, ser. Lecture Notes in Computer
Science, C. C. Yang, Ed., vol. 5075. Taipei, Taiwan:
Springer-Verlag, Jun. 2008, pp. 304–319.
Vol.105(2) June 2014 SOUTH AFRICAN INSTITUTE OF ELECTRICAL ENGINEERS 71
MOVING REPUTATION TO THE CLOUD
C. Hillebrand∗ and M. Coetzee†
∗ Academy of Computer Science and Software Engineering, University of Johannesburg, South AfricaSAP P&I BIT Mobile Empowerment, Pretoria, South Africa E-mail: [email protected]† Academy of Computer Science and Software Engineering, University of Johannesburg, South AfricaE-mail: [email protected]
Abstract: Reputation is used to regulate relationships of trust in online communities. Whendeploying a reputation system, the requirements and constrains of the specific community needs tobe accommodated in order to assist the community to reach their goals. This paper identifies a need fora framework for a configurable reputation system with the ability to accommodate the requirementsof a variety of online communities. Such a reputation system can be defined as a service on theCloud, to be composed with the application environment of the online community. Consequently, thispaper introduces the concept of RaaS (Reputation-as-a-Service) and discusses a potential framework tosupport the creation of a RaaS. In order to define the framework, research is conducted into features ofSaaS (Software-as-a-Service) architecture components, user requirements for trust and reputation, andfeatures of current centralized online reputation frameworks that can be configured in order to supporta reputation service on the Cloud.
Key words: Reputation-as-a-Service, trust, reputation, Software-as-a-Service, reputation framework,cloud service.
1. INTRODUCTION
Online shopping has grown significantly in the pastyears and it is predicted that such sales will increaseannually by 10% for the next 4 years [1, 2]. Peopleare influenced by product reviews to make purchasingdecisions and therefore tend to buy from online storeswith a good reputation [1]. As online shopping ischaracterized by insecurity, anonymity, lack of control andpotential opportunism, online communities should take thenecessary steps to ensure that participants are trustworthy.
For online trading communities such as eBay, a centralizedonline reputation system is used to compute and publishreputation scores for service providers, services, productsor entities such as buyers and seller within a community.The reputation score reflects the collection of opinionsor ratings that entities have about the objects. Ratingsare provided to a reputation algorithm to computereputation scores [3]. In order to be effective, reputationmanagers need to accommodate the specific needs of thecommunities where they are deployed.
Consider the example of Organization ABC, an onlinestore for a start-up company that sells products toconsumers over the mobile web. As trust and reputationis a major component to enable m-commerce, the onlinestore of Organization ABC needs to deploy a reputationsystem to control trust relationships between consumers,suppliers and their portal. As there is no off-the-shelfreputation system to integrate into their applicationenvironment, and it is expensive to custom develop,the m-commerce web site may initially be implementedwithout it. Ideally, Organization ABC needs a reputationsystem that is simple to use, with easy to understand ratingsbetween 0 and 5 to ensure the growth of the community. In
another type of online community, where crime incidentsare posted and recorded with mobile phones, a reputationsystem is needed to ensure that no malicious or falseincidents are reported. The requirements for this reputationsystem may be very different to those of the online storeof Organization ABC. This highlights that a configurableor customizable reputation system is needed that cansupport multiple online communities in a cost-effectiveand efficient manner.
Recently, a business model for software applicationsnamely SaaS (Software-as-a-Service) has emerged whichlowers the cost of development, customization, deploy-ment and operation of applications [4]. As SaaSapplications generally support the concept of softwareapplication configuration and customization, this researchproposes to present a configurable reputation system asa SaaS solution. Here, a multi-tenant architecture isfollowed where organizations pay only for the features thatthey access, and are able to configure or customize thereputation system to suit their community’s needs.
The contribution of this paper is to identify require-ments and challenges in order to define a RaaS(Reputation-as-a-Service) framework. As trust andreputation systems can be very complex, the focus ofthis research is the definition of a RaaS framework thatprovides similar but configurable functionality currentlysupported by central online reputation systems.
In the next section, trust and reputation is defined for thisresearch. Five general components of reputations systemsare given which is referred to throughout the paper.The requirements for a RaaS component is identified byconsidering SaaS configuration aspects, user requirementsfor trust and reputation and finally requirements from
Based on “Towards reputation-as-a-service”, by C. Hillebrand and M. Coetzee which appeared in the Proceedings of Information Security South African (ISSA) 2013, Johannesburg, 14 to 16 August 2013. © 2013 IEEE
� � � � � � � � � � � � � � � � � � � � � � �* Academy of Computer Science and Software Engineering, University of Johannesburg, South Africa
SAP P&I BIT Mobile Empowerment, Pretoria, South Africa
E-mail: [email protected]
† Academy of Computer Science and Software Engineering, University of Johannesburg, South Africa
E-mail: [email protected]
Vol.105(2) June 2014SOUTH AFRICAN INSTITUTE OF ELECTRICAL ENGINEERS72
reputation frameworks. A RaaS framework is presented
and the paper is concluded.
2. TRUST AND REPUTATION
Trust and reputation is present in a variety of online
communities. Trust is the individual’s perspective on a
particular service or product and reputation is a group’s
perspective on a particular service or product [5]. As
trust and reputation are concepts that are often used
interchangeably, they are now defined for the purposes of
this research.
2.1 Trust
Trust is challenging to define as it manifests itself in many
different ways in varying contexts. Almost every aspect
of daily life is supported by some form of trust. For
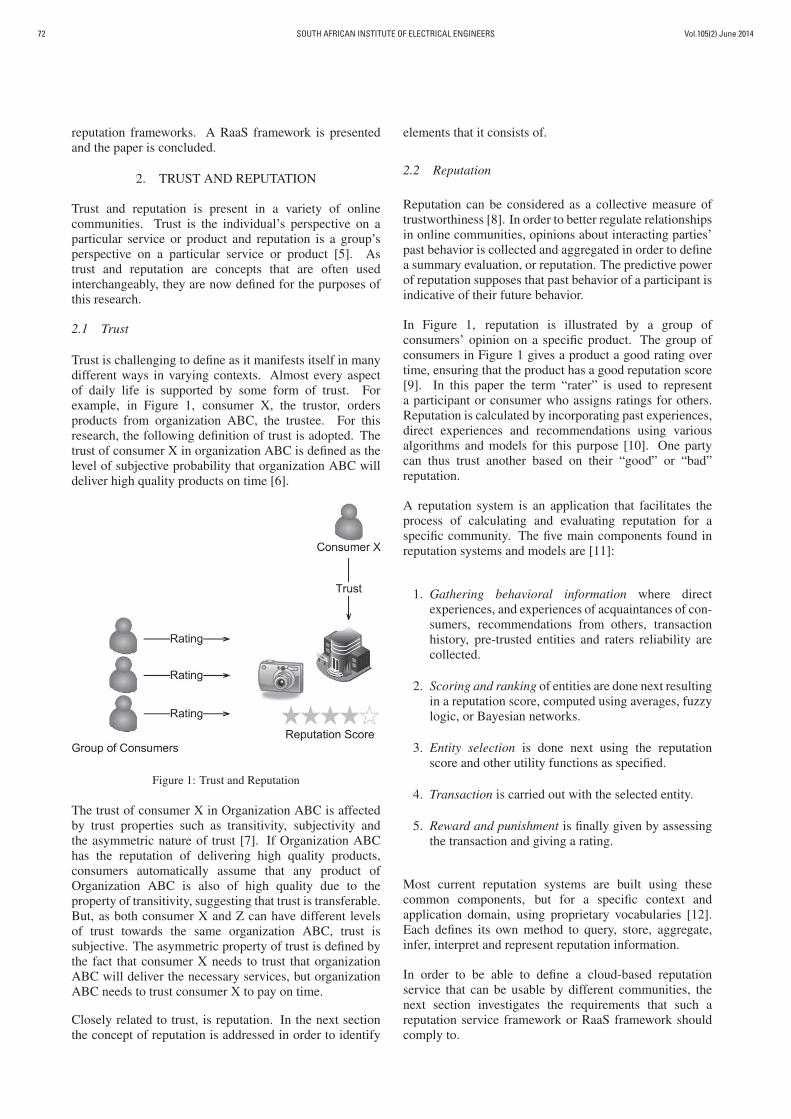
example, in Figure 1, consumer X, the trustor, orders
products from organization ABC, the trustee. For this
research, the following definition of trust is adopted. The
trust of consumer X in organization ABC is defined as the
level of subjective probability that organization ABC will
deliver high quality products on time [6].
Figure 1: Trust and Reputation
The trust of consumer X in Organization ABC is affected
by trust properties such as transitivity, subjectivity and
the asymmetric nature of trust [7]. If Organization ABC
has the reputation of delivering high quality products,
consumers automatically assume that any product of
Organization ABC is also of high quality due to the
property of transitivity, suggesting that trust is transferable.
But, as both consumer X and Z can have different levels
of trust towards the same organization ABC, trust is
subjective. The asymmetric property of trust is defined by
the fact that consumer X needs to trust that organization
ABC will deliver the necessary services, but organization
ABC needs to trust consumer X to pay on time.
Closely related to trust, is reputation. In the next section
the concept of reputation is addressed in order to identify
elements that it consists of.
2.2 Reputation
Reputation can be considered as a collective measure of
trustworthiness [8]. In order to better regulate relationships
in online communities, opinions about interacting parties’
past behavior is collected and aggregated in order to define
a summary evaluation, or reputation. The predictive power
of reputation supposes that past behavior of a participant is
indicative of their future behavior.
In Figure 1, reputation is illustrated by a group of
consumers’ opinion on a specific product. The group of
consumers in Figure 1 gives a product a good rating over
time, ensuring that the product has a good reputation score
[9]. In this paper the term “rater” is used to represent
a participant or consumer who assigns ratings for others.
Reputation is calculated by incorporating past experiences,
direct experiences and recommendations using various
algorithms and models for this purpose [10]. One party
can thus trust another based on their “good” or “bad”
reputation.
A reputation system is an application that facilitates the
process of calculating and evaluating reputation for a
specific community. The five main components found in
reputation systems and models are [11]:
1. Gathering behavioral information where direct
experiences, and experiences of acquaintances of con-
sumers, recommendations from others, transaction
history, pre-trusted entities and raters reliability are
collected.
2. Scoring and ranking of entities are done next resulting
in a reputation score, computed using averages, fuzzy
logic, or Bayesian networks.
3. Entity selection is done next using the reputation
score and other utility functions as specified.
4. Transaction is carried out with the selected entity.
5. Reward and punishment is finally given by assessing
the transaction and giving a rating.
Most current reputation systems are built using these
common components, but for a specific context and
application domain, using proprietary vocabularies [12].
Each defines its own method to query, store, aggregate,
infer, interpret and represent reputation information.
In order to be able to define a cloud-based reputation
service that can be usable by different communities, the
next section investigates the requirements that such a
reputation service framework or RaaS framework should
comply to.
Vol.105(2) June 2014 SOUTH AFRICAN INSTITUTE OF ELECTRICAL ENGINEERS 73
3. REQUIREMENTS FOR A RAAS FRAMEWORK
In order to determine requirements to define a RaaSframework, this research now reports on the twomain drivers for a RaaS framework namely generalSaaS application requirements and current state-of-the-artreputation system requirements to create a comprehensivelist of requirements for the RaaS framework.
3.1 Requirements for SaaS applications
SaaS applications are deployed on cloud infrastructuresand exposed to applications or users to be consumed overthe Internet. SaaS is pay-per use, meaning organizationsonly have to pay for the features they want to use inan application, making it a cost effective solution [13,14]. The main motivation for organizations adaptingSaaS applications is to reduce IT support costs, ensurebusiness agility and outsource hardware and softwaremaintenance. SaaS architecture, design attributes andapplication requirements are now investigated to identifyrequirements that a cloud reputation service needs to meet.
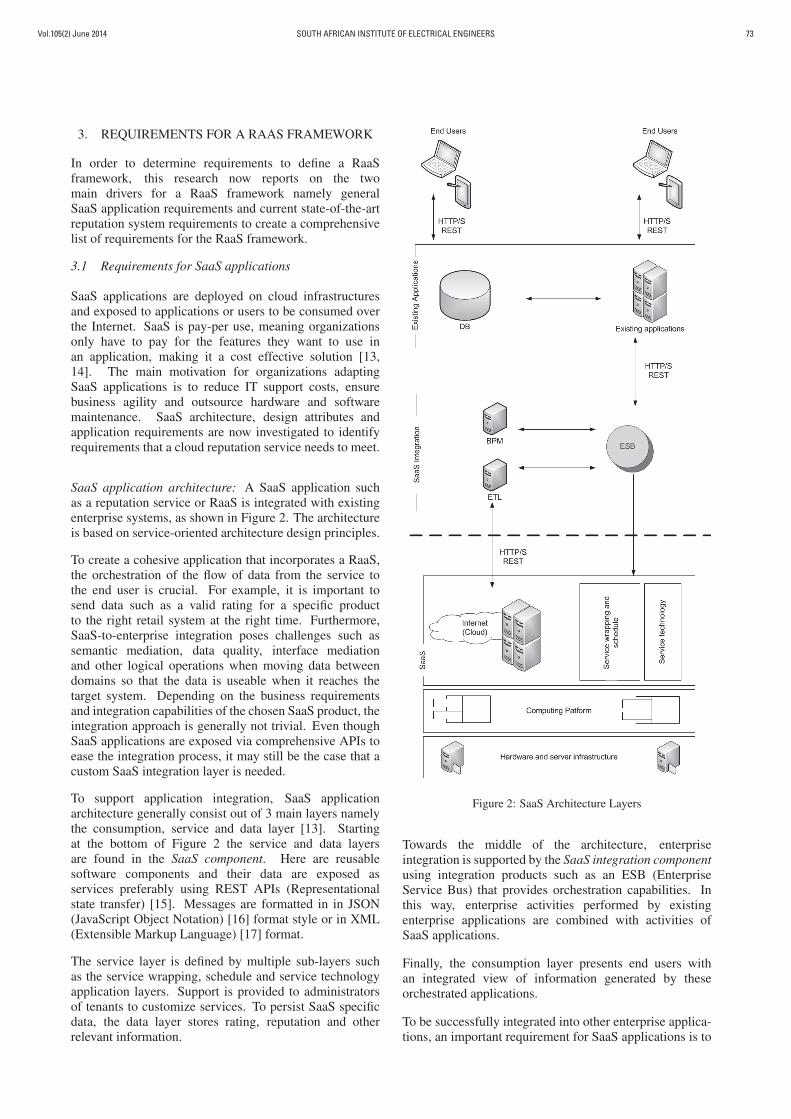
SaaS application architecture: A SaaS application suchas a reputation service or RaaS is integrated with existingenterprise systems, as shown in Figure 2. The architectureis based on service-oriented architecture design principles.
To create a cohesive application that incorporates a RaaS,the orchestration of the flow of data from the service tothe end user is crucial. For example, it is important tosend data such as a valid rating for a specific productto the right retail system at the right time. Furthermore,SaaS-to-enterprise integration poses challenges such assemantic mediation, data quality, interface mediationand other logical operations when moving data betweendomains so that the data is useable when it reaches thetarget system. Depending on the business requirementsand integration capabilities of the chosen SaaS product, theintegration approach is generally not trivial. Even thoughSaaS applications are exposed via comprehensive APIs toease the integration process, it may still be the case that acustom SaaS integration layer is needed.
To support application integration, SaaS applicationarchitecture generally consist out of 3 main layers namelythe consumption, service and data layer [13]. Startingat the bottom of Figure 2 the service and data layersare found in the SaaS component. Here are reusablesoftware components and their data are exposed asservices preferably using REST APIs (Representationalstate transfer) [15]. Messages are formatted in in JSON(JavaScript Object Notation) [16] format style or in XML(Extensible Markup Language) [17] format.
The service layer is defined by multiple sub-layers suchas the service wrapping, schedule and service technologyapplication layers. Support is provided to administratorsof tenants to customize services. To persist SaaS specificdata, the data layer stores rating, reputation and otherrelevant information.
Figure 2: SaaS Architecture Layers
Towards the middle of the architecture, enterprise
integration is supported by the SaaS integration component
using integration products such as an ESB (Enterprise
Service Bus) that provides orchestration capabilities. In
this way, enterprise activities performed by existing
enterprise applications are combined with activities of
SaaS applications.
Finally, the consumption layer presents end users with
an integrated view of information generated by these
orchestrated applications.
To be successfully integrated into other enterprise applica-
tions, an important requirement for SaaS applications is to
Vol.105(2) June 2014SOUTH AFRICAN INSTITUTE OF ELECTRICAL ENGINEERS74
ensure that integration with other applications is seamless.To ensure that many types of enterprises can integrate SaaSapplications, design attributes, discussed next should beaddressed.
SaaS design attributes: In order to design a RaaScomponent, several design attributes should be taken intoconsideration to ensure conformance to a typical SaaSapplication [18]:
• Multi-tenancy to ensure that a single instance of aRaaS can be used by multiple tenants and their clientswith different needs and functionalities.
• Single version provides the capability that only oneversion of the RaaS is exposed to clients.
• Logical data separation accommodates the storageof different tenants’ data such as configuration andrating data is in their own data domain.
• Application integration, as mentioned in the previoussection, should be supported so that applications oftenants can integrate functions of the RaaS into theirapplications with ease.
To ensure the flexibility of SaaS applications, anapplication is configured in such a way to supportdesign attributes and integration processes. Next, SaaSapplication requirements for RaaS are discussed to supportconfiguration.
SaaS application requirements for RaaS: The focus ofa RaaS model is to deliver software functions to manyclients over the Web with a single instance of a softwareapplication running on a multi-tenancy platform [19].However, every tenant that needs to use a RaaS supportedwith this model can be unique, requiring changes to thereputation system.
Tenants may have a different industry focus, theircustomers may behave differently, they may supportdiverse product offerings and have different regulations,organizational culture and operational strategy. Thesefeatures require RaaS components to be tailored, byleveraging two major approaches namely configurationand customization [19].
Configuration does not involve source code change of theRaaS application and support differences through settingpre-defined parameters, or leveraging tools to changeapplication functions within pre-defined scope, such asadding data fields, changing field names, modifyingdrop-down lists, adding buttons, and changing businessrules. On the other hand, customization involves RaaSapplication source code changes to create functionality,leading to a more costly approach for both SaaS vendorsand clients.
There are seven fundamental configuration and customiza-tion requirements that can be tailored, to make the RaaScomponent as flexible as possible [19] namely:
• Support for different organization structures requirethe ability to add, delete and changes roles.
• Support for different types of data can be madepossible by adding custom fields and types, anddeleting data not needed.
• Support for different processes requires tasks to beswitched, added and reordered and their roles to bechanged.
• Business rules can be modified by changing or settingrules and the rule triggers.
• Reputation computations can be made more genericby adding or changing actions or triggering actions atdifferent points.
• The user interface can be changed with respect to thelook and feel, the data presented and the addition ofdata.
• Reporting can be changed with respect to style,dataset used and query rules.
In summary, the RaaS should be developed to havestandardized software features to serve as many clientsas possible using a configuration approach. TheRaaS developer needs a strategy to enable self-definedconfiguration by their tenants without changing the SaaSapplication source code for any individual tenant [19].
The RaaS environment needs to be thoroughly analyzedto determine the common configuration requirements. Inconjunction, a sophisticated web based tool is needed toallow clients to configure the RaaS service themselves.
The next step is to investigate the second main driverto determine RaaS requirements, namely those stemmingfrom trust and reputation systems.
3.2 Trust and reputation system requirements for RaaS
Centralized online reputation systems, which is the focusof this research, collects users’ opinions on products,transactions and events as reputation information, toaggregate and publish it. Many trust and reputation modelshave been proposed, each targeting different contexts,with their own unique features. While most researchfocuses on addressing the ever-increasing complexity, notmuch attention has been paid to the process of integratingreputation systems into applications. The next section hasthe aim of identifying a set of basic requirements to beaddressed the RaaS by firstly investigating real-world userrequirements, and then general trust and reputation systemcomponents.
Vol.105(2) June 2014 SOUTH AFRICAN INSTITUTE OF ELECTRICAL ENGINEERS 75
User requirements for trust and reputation systems:
Previous research [10] collected formal user requirementsfor trust and reputation systems from system developers.It was found that users required a clear, layered andpluggable architecture for representing the calculationprocess of the trust score. Categorized user requirementswere found to be closely coupled with the previouslydiscussed five components found in reputation systems[20].
User needs for each of the first three components wereidentified as follows:
• Information Gathering
– The success of each interaction needs to be ratedand quality parameters continuously monitored.
– Simple and intuitive rating scales should beused.
– The quality parameters of a service shouldbe controlled and certified by a trusted party;ratings of such a party can be used as a startingpoint for trust computation.
– Raters reliability must be controlled as theycould provide dishonest ratings.
– Initial rating should not influence or biassubsequent votes.
– Similarity between recommenders’ preferencesshould be considered.
– Trust values decay and become invalid overtime.
• Scoring and Ranking
– There is a need for a single trust rating whichis calculated by taking into account differentservice aspects and their weights.
– The calculation should be an aggregation of allweighted aspects, similar to an “average”.
• Entity Selection
– When entities or services are selected, theyshould be sorted according to their trust rank andmade comparable to each other.
By considering such a user-centered design approach, theproposed RaaS component can be created to fulfill theneeds of users as far as possible. General reputationframework requirements are discussed next.
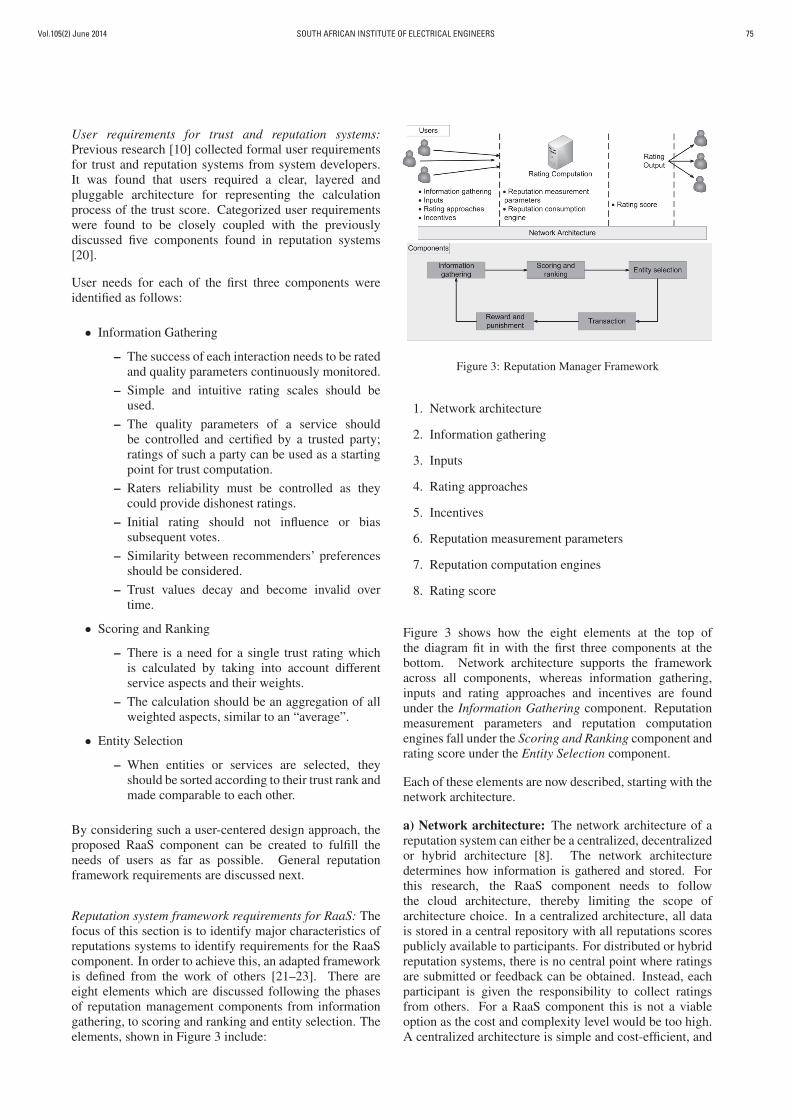
Reputation system framework requirements for RaaS: Thefocus of this section is to identify major characteristics ofreputations systems to identify requirements for the RaaScomponent. In order to achieve this, an adapted frameworkis defined from the work of others [21–23]. There areeight elements which are discussed following the phasesof reputation management components from informationgathering, to scoring and ranking and entity selection. Theelements, shown in Figure 3 include:
Figure 3: Reputation Manager Framework
1. Network architecture
2. Information gathering
3. Inputs
4. Rating approaches
5. Incentives
6. Reputation measurement parameters
7. Reputation computation engines
8. Rating score
Figure 3 shows how the eight elements at the top of
the diagram fit in with the first three components at the
bottom. Network architecture supports the framework
across all components, whereas information gathering,
inputs and rating approaches and incentives are found
under the Information Gathering component. Reputation
measurement parameters and reputation computation
engines fall under the Scoring and Ranking component and
rating score under the Entity Selection component.
Each of these elements are now described, starting with the
network architecture.
a) Network architecture: The network architecture of a
reputation system can either be a centralized, decentralized
or hybrid architecture [8]. The network architecture
determines how information is gathered and stored. For
this research, the RaaS component needs to follow
the cloud architecture, thereby limiting the scope of
architecture choice. In a centralized architecture, all data
is stored in a central repository with all reputations scores
publicly available to participants. For distributed or hybrid
reputation systems, there is no central point where ratings
are submitted or feedback can be obtained. Instead, each
participant is given the responsibility to collect ratings
from others. For a RaaS component this is not a viable
option as the cost and complexity level would be too high.
A centralized architecture is simple and cost-efficient, and
Vol.105(2) June 2014SOUTH AFRICAN INSTITUTE OF ELECTRICAL ENGINEERS76
conforms to the RaaS and user requirements identifiedpreviously. This choice directly influences the discussionof the next elements, as they need to comply with thisrequirement.
Next the elements related to the Information Gathering
component are discussed. For this research, a transactionbetween two participants is the basis of a rating. Generally,a participant cannot rate another one without having hada transaction with him. After a transaction, participantsusually have no direct incentive for providing rating aboutthe other party. The information gathering phase should becarefully designed to address this issue.
b) Information gathering: The information gatheringphase collects rating inputs over a period of time. There area numbers of important aspects to consider such as [24]:
• the collection channel,
• the information sources,
• the number of raters, rating granularity and reputationof raters,
• collection costs.
Collection channels can be direct or indirect. Directchannels collect information from raters just after thetransaction, by sending emails asking them to do a ratingor by using a 3rd party for rating collection. Indirectchannels collect information from other reputationssystems, increasing complexity of information gathering.
Most online reputation systems consider reputation ratingsfrom a global perspective. For example, eBay’s feedbackforum provides feedback profiles of sellers and buyerspublicly to the all users. The shortcoming of sucha global view is that these values lack personalization[5]. Information can be gathered from past experiences,direct experiences and recommendations [20]. Thegathered information plays a major role to calculate areputation score for a particular user or product. Thisinformation might come from several sources such asdirect experiences with the targeting entity, neighboursof participants, acquaintances, the group the participantbelongs to or organizations. In this regard it is importantto consider the set of raters, their expertise and credibility[24].
A sufficient number of raters who rate transactions canhelp a reputation system to avoid personal bias whereasa restriction on the number of raters may influence level ofdetail between raters and objects being rated. A reputationsystem can be defined to have no restrictions on the numberof raters leaving ratings, which means anyone can rate;or only registered participants can provide a rating; oronly some registered raters can provide a rating after atransaction has finished such as eBay allows. It should notbe allowed to rate a transaction or object more than once,for example, in eBay if buyers and sellers transact, the
reputation system will only allow one rating per transactionto avoid the manipulation of the reputation score.
Directly related to the number of raters who ratedobjects is granularity [25], which indicates if the modelis context-dependent or not. As raters may have agood reputation for their expertise in one domain, anda low reputation for another, granularity identifies howinformation sources associates to the reputation object.When a system allows any raters to do a rating, thegranularity is usually very loose. If a reputation systemrequires information sources to have a good credibility toleave reviews this increases the cost for a rater to provide arating which in turn reduces the number of invalid ratings.
The reputation of the rater should be considered by havingother participants to give feedback on those ratings. Somereputation systems have a ranking mechanism for theirusers, called the Karma mechanism that records everyaction of a user and gives points to it [23].
Finally, the input collection costs should be considered.This is the cost that indicates how much time it takesto collect a single unit of reputation information, wherecollection channels can have an important effect on thiscost [24].
Next, the type of information source is described.
c) Inputs: Different information formats can be chosenbased on the way in which they will be used in areputation system. Some reputation systems supportarithmetic operations and other evidence where numericquantification is more appropriate. It can also be possibleto provide a mapping from qualitative to numeric labels.For example, ratings such as a score between 0 and 10can easily be aggregated to an overall score, to give acomparable value between reputation objects. On the otherhand, text reviews contain detailed information which canbe very useful.
Generally, a rating can be expressed as either a quantitativeor Boolean format [21]. A quantitative metric is ameasurable input such as a value between 0 and 10 whereasa Boolean format is either 0 or a 1 to represent ”like” or”dislike”. As it is important that the reputation score isuseful to the community where it will be used, the RaaScan be configured for this purpose.
In order to ensure the completeness of ratings collected,rating approaches are discussed next.
d) Rating approaches: A larger variety of ratinginformation can give a better view of a reputation object asit provides a more complete picture. For example, travelreputation systems can allow participants to rate hotelsfor their value, rooms, location, cleanliness and serviceseparately [24].
In single-criterion rating systems or binary rating systems,participants reveal their general opinion with regards to a
Vol.105(2) June 2014 SOUTH AFRICAN INSTITUTE OF ELECTRICAL ENGINEERS 77
reputation object, resulting in reputation information thatis not too reliable and accurate.
In systems where multiple-criteria can be used, betterquality reputation scores can be defined. A set of criterianeeds to be defined and a rating is provided for each.This can allow a participant to choose a partner based onspecific criteria that matches his own. On the down side,many rating criteria may reduce the evaluators’ motivationon leaving ratings. This can be overcome by making somecriteria optional to rate.
Next the role of incentives in information gathering isdiscussed.
e) Incentives: Raters of a reputation system may havedifferent motivations for providing ratings. Incentives areimportant as their absence drives only some of the users tovoice their opinions and report feedback where those witha moderate outlook are unlikely to provide ratings [25].This results in an unrepresentative sample of ratings andopinions. For example, reputation systems have incentivesfor raters such as sellers to behave honestly in order to bechosen by buyers as this can increase their profit throughthe increased amount of transactions. These incentives arenecessary because fabricated ratings can promote specificsellers or to discredit others - e.g. authors can write fakereviews on Amazon in order to boost the sale of their ownbooks. In order for RaaS to be implemented successfully,the motivations for providing a rating should be identified.
There are various types of motivations [23] such asaltruistic motivation which is in favour of doing good tousers being rated and can be classified as tit-for-tat, friend-ship and exploiting opinionated incentives. Commercialmotivation, is used to generate revenue and is categorizedas direct revenue incentives and branding incentives.Egocentric motivation is used for self-gratification andis categorized as fulfilment incentives and recognitionincentives.
By explicitly rewarding participants for reporting feed-back, rewards made by the reputation systems mustcover the cost of reporting feedback to encourage moreparticipants to report, giving a more representative setof ratings. In addition, rewards must be designed sothat selfish participants are convinced to rate truthfully toadvance themselves [25].
The next section now considers the next reputationcomponent namely the Scoring and Ranking of ratings.Here, the reputation computation engine and ratingapproaches are discussed.
f) Reputation computation engines: One of the mostcritical features of a reputation system is the reputationcomputation aggregation algorithm. Such an algorithmintegrates ratings into one score, and at the same timeneeds to ensure that bad raters are identified and removedto obtain accurate ratings. There are many complexaggregating algorithms that have been proposed such asfuzzy models and Bayesian systems.
Currently, most online reputation systems as eBay andAmazon choose to use simple algorithms [8], such assummation, average or percentage. Simple summationadds all of the ratings, regardless if it is positive, neutralor negative and the calculation is easily understood andadopted by users [8, 21]. Unfortunately, this feedbackmetric is flawed, for example, if a user has 10 positivefeedback points out of 10 transactions and another has20 positive and 10 negative feedback points out of 30transactions, they would have the same reputation score[5].
Average rating is based on the same principle as simplesummation, however average rating is perceived as moreaccurate. Ratings can also be calculated by means ofweighted average ratings. This infers that each userhas a credibility score that determines their weight ratio[5]. Many interesting aggregating algorithms have beenproposed that can be classified into five categories [26]:
• By averaging ratings, simplicity in algorithm designis ensured and low cost in system execution.
• Weightings are introduced by weighting the ratings ofacquaintances but those of strangers are averaged.
• Only ratings from witnesses are used, who haveinteracted with the entity being rated. In such aweighted majority algorithm only the ratings fromwitnesses are aggregated, and the weight of witnessesis decreased if it differs from self-own recognition.
• The weight of ratings is based on the similarity of theexperience between the rater and the other participantto improve accuracy.
• Ratings can be aggregated and weights of raters canbe updated through deriving the expectation of theBeta distribution.
In simulation [26] it was found that most complexalgorithms will have better results. However, in severalcircumstances the simple algorithm can outperform thecomplicated algorithms. In particular, the first averagealgorithm is found to be more resistant to different typeof bad raters [26].
To configure the reputation aggregation algorithm for aRaaS, one of these aggregation algorithms can be chosen asthey may be able to accommodate a variety of communitiesand would be understood and adopted by users [5].
g) Reputation measurement parameters: There arecrucial parameters which may increase the accuracy ofthe expected reputation score namely transitivity rate andtime [21].
Transitivity rate represents the fact that recommendationsfrom third-hand ratings with a transitivity degree ofthree may have the least influence on the trustworthinessmeasurement. Therefore, in a recommendation chain,
Vol.105(2) June 2014SOUTH AFRICAN INSTITUTE OF ELECTRICAL ENGINEERS78
recommendations from known participants who alreadyhave had interaction with the requested party should havemore weight as first-hand recommendations, than thosewho are known but have not had any previous interactionswith the requested party or those who are unknown.
Time influences the effect of ratings on the computationas the most recent rating will have a higher weight ratiothan ratings that are older. Thus ratings decay over time.The advantage is that users benefit from having a ratingvalue that reflects how the most recent services performed.These parameters attempt to ensure that ratings are moreaccurate as weight ratios are an effective way to counteract“bad” raters.
Finally, the Entity Selection component is consideredwhere the resultant reputations is now used.
h) Rating score: The reputation system finally reports itsresults to users in two different formats namely aggregatedreputation scores and individual ratings and opinions [24].Reputation scores are the result of the scoring and rankingcomponent, whereas the individual ratings are collectedthrough the information gathering component.
When reputation scores are presented, the time lineit represents should be provided to assist users withdecision-making. Reputation information is disseminatedto end users via different access methods such as websites, emails or RSS (Rich Site Summary) feeds. Certaininformation may be made publicly available, whereasothers may require a subscription fee.
Next, the requirements for a RaaS framework arepresented.
3.3 Requirements for a RaaS framework
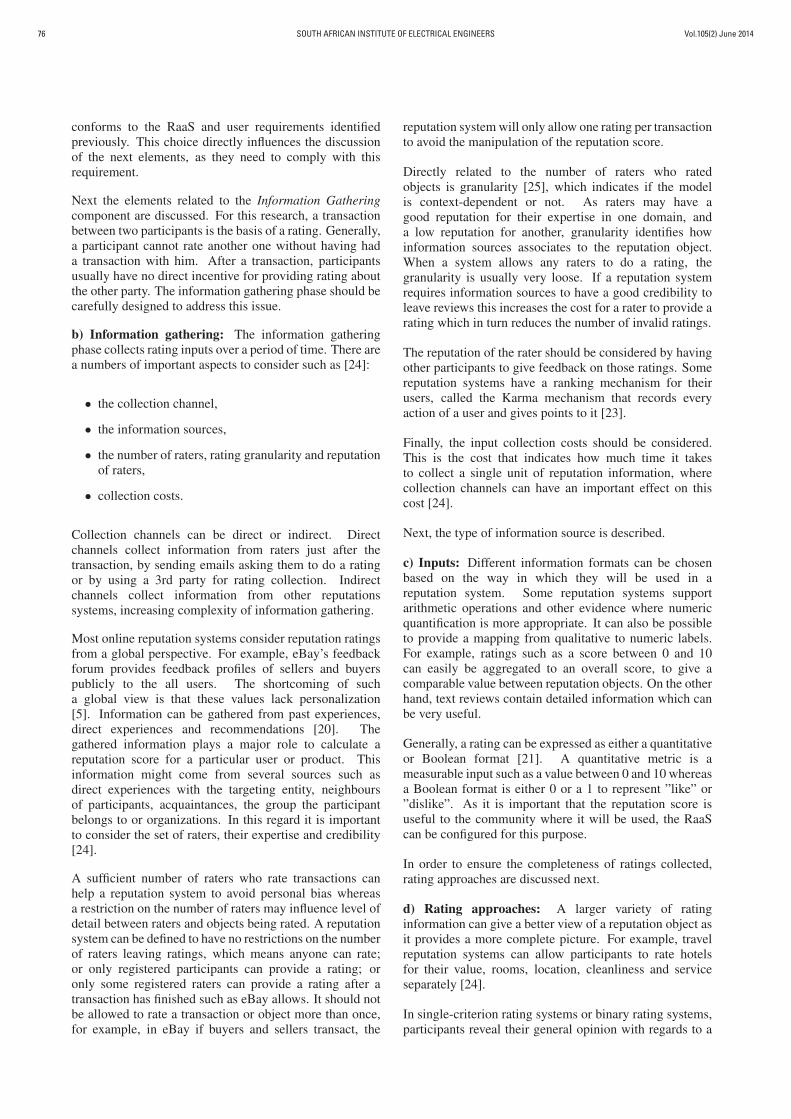
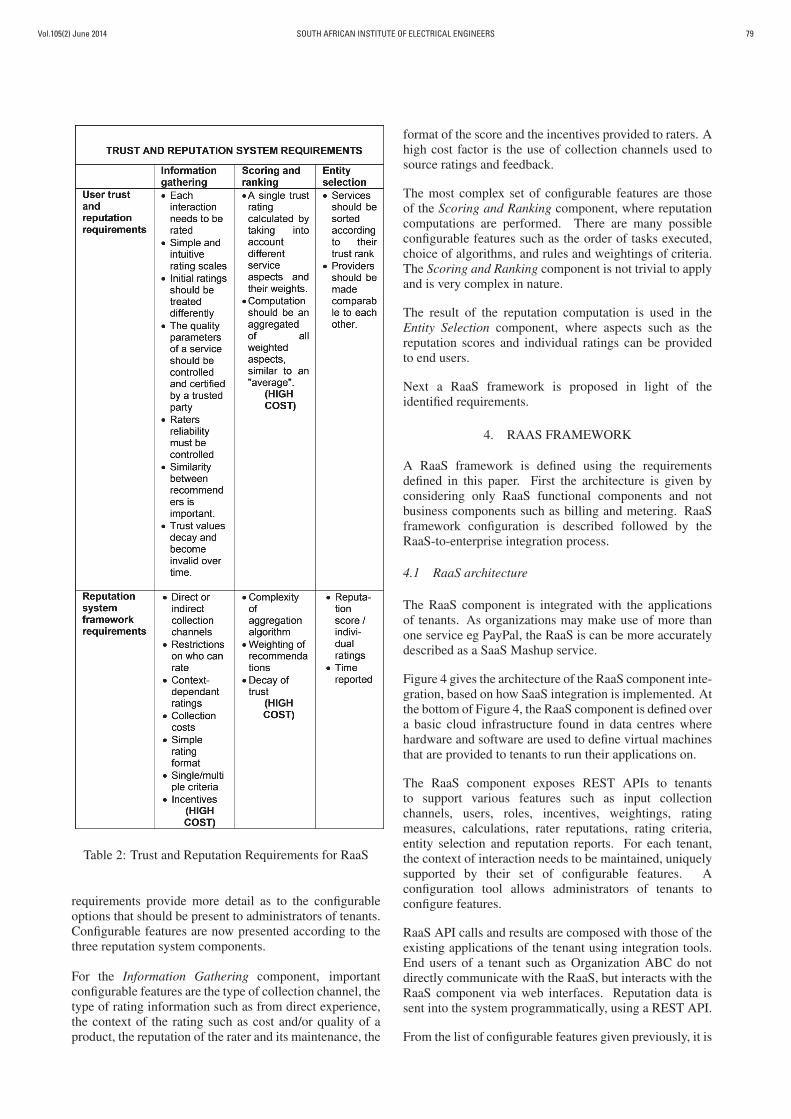
Table 1 and Table 2 briefly provides the most relevantrequirements for a RaaS framework. The requirements aregiven according to the two main drivers and the first threecomponents of reputation systems. It has been indicatedon the table where a high cost is associated with a set ofrequirements. In the last case, the list of requirementsidentifies a set of configurable features that should bepresent.
SaaS requirements: From the list of requirements in Table1, the design of the RaaS component is driven by consid-ering integration features, SaaS design considerations andconfiguration features. SaaS application architecture anddesign attributes are requirements that should all be appliedwhen designing and implementing the RaaS and are notconfigurable in nature.
Configurable features: SaaS application feature require-ments shown in the last section in Table 1 providean indication of the possible configurable options thatshould be present to administrators of tenants. Importantconfiguration options are those allowing the configurationof input data such as roles, data types such as rating and
Table 1: SaaS Requirements for RaaS
reputation scores, rules that apply the strictness by whichtypes of raters are allowed to rate or incentives, actions bywhich algorithms are applied, and reporting of ratings andreputation scores. This list only provides an indication ofthe types of configurable features that should be present.These features can be fleshed out in more detail after Table2 is reviewed.
Trust and reputation system requirements: Table 2summarises the requirements elicited from users, and thosefrom investigating trust and reputation system components.Between these two sets, some overlap can be noted. Bothsets highlight that the manner in which ratings are done -preferably after each and every transaction - is importantto apply. Furthermore, that the results produced by thereputation algorithm can be understood with ease, thatthe reputation of the rater needs to be verified, the decayof trust and the sorting of reputation scores needs to beimplemented.
Configurable features: Trust and reputation system
Vol.105(2) June 2014 SOUTH AFRICAN INSTITUTE OF ELECTRICAL ENGINEERS 79
Table 2: Trust and Reputation Requirements for RaaS
requirements provide more detail as to the configurable
options that should be present to administrators of tenants.
Configurable features are now presented according to the
three reputation system components.
For the Information Gathering component, important
configurable features are the type of collection channel, the
type of rating information such as from direct experience,
the context of the rating such as cost and/or quality of a
product, the reputation of the rater and its maintenance, the
format of the score and the incentives provided to raters. A
high cost factor is the use of collection channels used to
source ratings and feedback.
The most complex set of configurable features are those
of the Scoring and Ranking component, where reputation
computations are performed. There are many possible
configurable features such as the order of tasks executed,
choice of algorithms, and rules and weightings of criteria.
The Scoring and Ranking component is not trivial to apply
and is very complex in nature.
The result of the reputation computation is used in the
Entity Selection component, where aspects such as the
reputation scores and individual ratings can be provided
to end users.
Next a RaaS framework is proposed in light of the
identified requirements.
4. RAAS FRAMEWORK
A RaaS framework is defined using the requirements
defined in this paper. First the architecture is given by
considering only RaaS functional components and not
business components such as billing and metering. RaaS
framework configuration is described followed by the
RaaS-to-enterprise integration process.
4.1 RaaS architecture
The RaaS component is integrated with the applications
of tenants. As organizations may make use of more than
one service eg PayPal, the RaaS is can be more accurately
described as a SaaS Mashup service.
Figure 4 gives the architecture of the RaaS component inte-
gration, based on how SaaS integration is implemented. At
the bottom of Figure 4, the RaaS component is defined over
a basic cloud infrastructure found in data centres where
hardware and software are used to define virtual machines
that are provided to tenants to run their applications on.
The RaaS component exposes REST APIs to tenants
to support various features such as input collection
channels, users, roles, incentives, weightings, rating
measures, calculations, rater reputations, rating criteria,
entity selection and reputation reports. For each tenant,
the context of interaction needs to be maintained, uniquely
supported by their set of configurable features. A
configuration tool allows administrators of tenants to
configure features.
RaaS API calls and results are composed with those of the
existing applications of the tenant using integration tools.
End users of a tenant such as Organization ABC do not
directly communicate with the RaaS, but interacts with the
RaaS component via web interfaces. Reputation data is
sent into the system programmatically, using a REST API.
From the list of configurable features given previously, it is
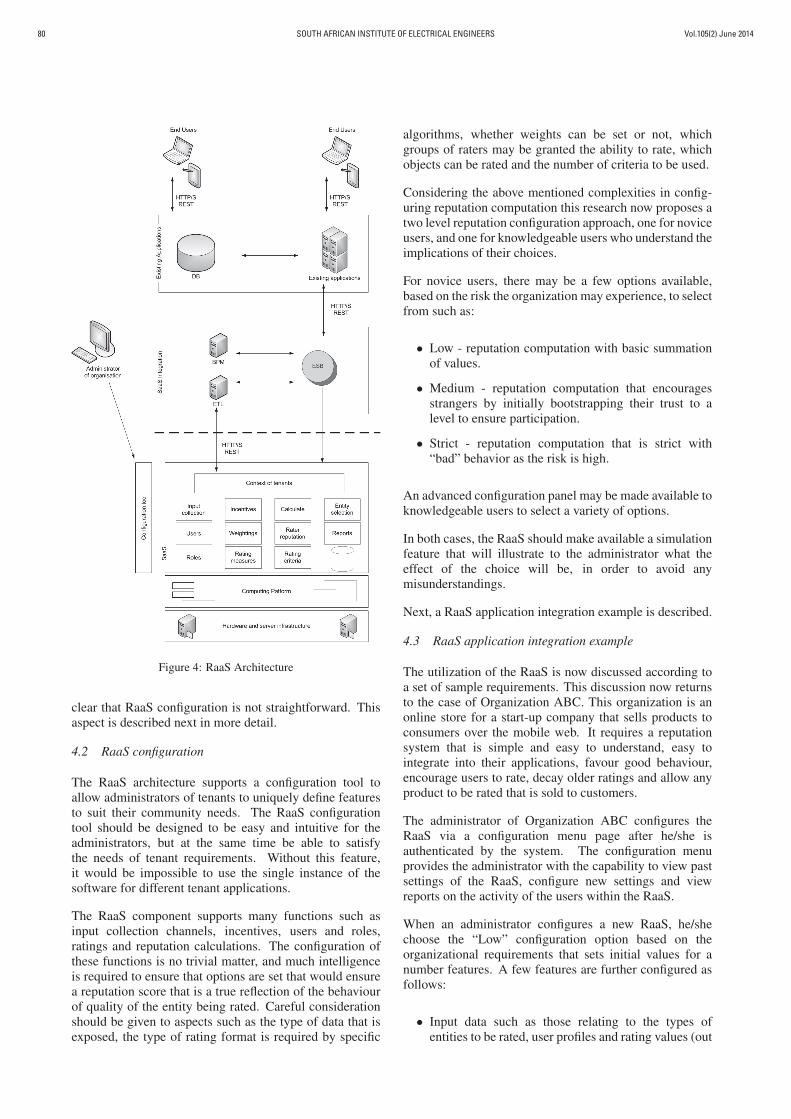
Vol.105(2) June 2014SOUTH AFRICAN INSTITUTE OF ELECTRICAL ENGINEERS80
Figure 4: RaaS Architecture
clear that RaaS configuration is not straightforward. Thisaspect is described next in more detail.
4.2 RaaS configuration
The RaaS architecture supports a configuration tool toallow administrators of tenants to uniquely define featuresto suit their community needs. The RaaS configurationtool should be designed to be easy and intuitive for theadministrators, but at the same time be able to satisfythe needs of tenant requirements. Without this feature,it would be impossible to use the single instance of thesoftware for different tenant applications.
The RaaS component supports many functions such asinput collection channels, incentives, users and roles,ratings and reputation calculations. The configuration ofthese functions is no trivial matter, and much intelligenceis required to ensure that options are set that would ensurea reputation score that is a true reflection of the behaviourof quality of the entity being rated. Careful considerationshould be given to aspects such as the type of data that isexposed, the type of rating format is required by specific
algorithms, whether weights can be set or not, whichgroups of raters may be granted the ability to rate, whichobjects can be rated and the number of criteria to be used.
Considering the above mentioned complexities in config-uring reputation computation this research now proposes atwo level reputation configuration approach, one for noviceusers, and one for knowledgeable users who understand theimplications of their choices.
For novice users, there may be a few options available,based on the risk the organization may experience, to selectfrom such as:
• Low - reputation computation with basic summationof values.
• Medium - reputation computation that encouragesstrangers by initially bootstrapping their trust to alevel to ensure participation.
• Strict - reputation computation that is strict with“bad” behavior as the risk is high.
An advanced configuration panel may be made available toknowledgeable users to select a variety of options.
In both cases, the RaaS should make available a simulationfeature that will illustrate to the administrator what theeffect of the choice will be, in order to avoid anymisunderstandings.
Next, a RaaS application integration example is described.
4.3 RaaS application integration example
The utilization of the RaaS is now discussed according toa set of sample requirements. This discussion now returnsto the case of Organization ABC. This organization is anonline store for a start-up company that sells products toconsumers over the mobile web. It requires a reputationsystem that is simple and easy to understand, easy tointegrate into their applications, favour good behaviour,encourage users to rate, decay older ratings and allow anyproduct to be rated that is sold to customers.
The administrator of Organization ABC configures theRaaS via a configuration menu page after he/she isauthenticated by the system. The configuration menuprovides the administrator with the capability to view pastsettings of the RaaS, configure new settings and viewreports on the activity of the users within the RaaS.
When an administrator configures a new RaaS, he/shechoose the “Low” configuration option based on theorganizational requirements that sets initial values for anumber features. A few features are further configured asfollows:
• Input data such as those relating to the types ofentities to be rated, user profiles and rating values (out
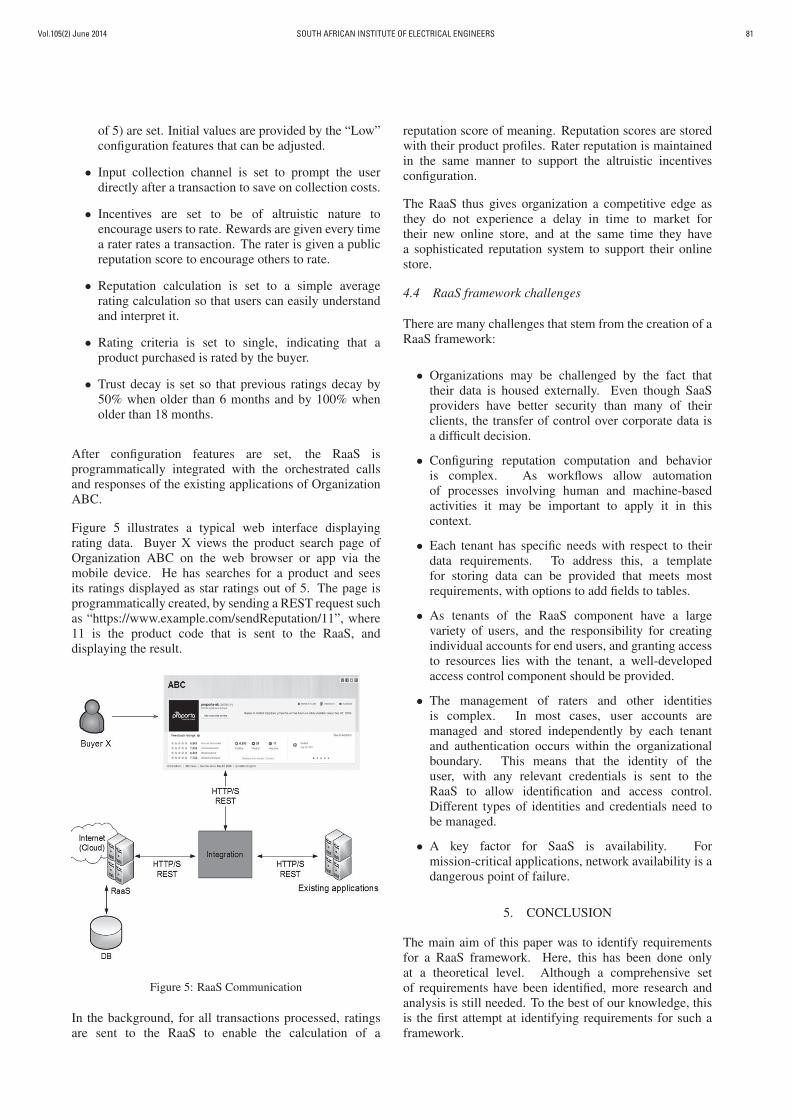
Vol.105(2) June 2014 SOUTH AFRICAN INSTITUTE OF ELECTRICAL ENGINEERS 81
of 5) are set. Initial values are provided by the “Low”configuration features that can be adjusted.
• Input collection channel is set to prompt the userdirectly after a transaction to save on collection costs.
• Incentives are set to be of altruistic nature toencourage users to rate. Rewards are given every timea rater rates a transaction. The rater is given a publicreputation score to encourage others to rate.
• Reputation calculation is set to a simple averagerating calculation so that users can easily understandand interpret it.
• Rating criteria is set to single, indicating that aproduct purchased is rated by the buyer.
• Trust decay is set so that previous ratings decay by50% when older than 6 months and by 100% whenolder than 18 months.
After configuration features are set, the RaaS isprogrammatically integrated with the orchestrated callsand responses of the existing applications of OrganizationABC.
Figure 5 illustrates a typical web interface displayingrating data. Buyer X views the product search page ofOrganization ABC on the web browser or app via themobile device. He has searches for a product and seesits ratings displayed as star ratings out of 5. The page isprogrammatically created, by sending a REST request suchas “https://www.example.com/sendReputation/11”, where11 is the product code that is sent to the RaaS, anddisplaying the result.
Figure 5: RaaS Communication
In the background, for all transactions processed, ratingsare sent to the RaaS to enable the calculation of a
reputation score of meaning. Reputation scores are storedwith their product profiles. Rater reputation is maintainedin the same manner to support the altruistic incentivesconfiguration.
The RaaS thus gives organization a competitive edge asthey do not experience a delay in time to market fortheir new online store, and at the same time they havea sophisticated reputation system to support their onlinestore.
4.4 RaaS framework challenges
There are many challenges that stem from the creation of aRaaS framework:
• Organizations may be challenged by the fact thattheir data is housed externally. Even though SaaSproviders have better security than many of theirclients, the transfer of control over corporate data isa difficult decision.
• Configuring reputation computation and behavioris complex. As workflows allow automationof processes involving human and machine-basedactivities it may be important to apply it in thiscontext.
• Each tenant has specific needs with respect to theirdata requirements. To address this, a templatefor storing data can be provided that meets mostrequirements, with options to add fields to tables.
• As tenants of the RaaS component have a largevariety of users, and the responsibility for creatingindividual accounts for end users, and granting accessto resources lies with the tenant, a well-developedaccess control component should be provided.
• The management of raters and other identitiesis complex. In most cases, user accounts aremanaged and stored independently by each tenantand authentication occurs within the organizationalboundary. This means that the identity of theuser, with any relevant credentials is sent to theRaaS to allow identification and access control.Different types of identities and credentials need tobe managed.
• A key factor for SaaS is availability. Formission-critical applications, network availability is adangerous point of failure.
5. CONCLUSION
The main aim of this paper was to identify requirementsfor a RaaS framework. Here, this has been done onlyat a theoretical level. Although a comprehensive setof requirements have been identified, more research andanalysis is still needed. To the best of our knowledge, thisis the first attempt at identifying requirements for such aframework.
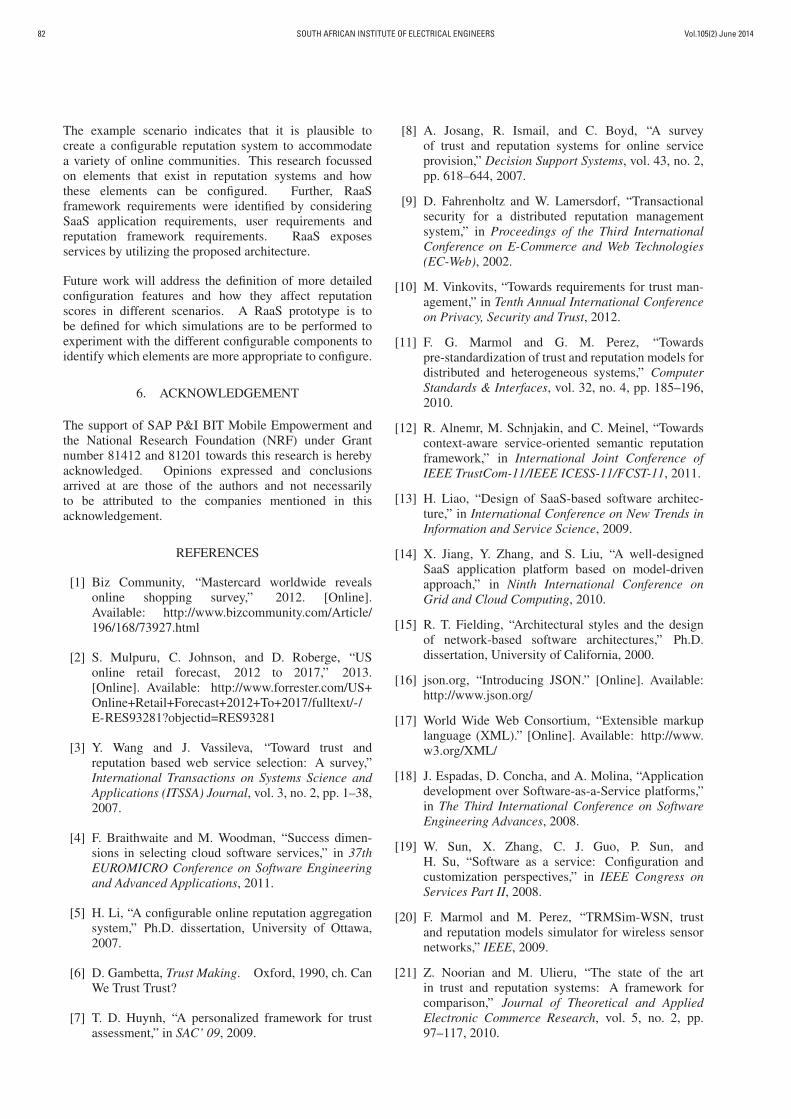
Vol.105(2) June 2014SOUTH AFRICAN INSTITUTE OF ELECTRICAL ENGINEERS82
The example scenario indicates that it is plausible to
create a configurable reputation system to accommodate
a variety of online communities. This research focussed
on elements that exist in reputation systems and how
these elements can be configured. Further, RaaS
framework requirements were identified by considering
SaaS application requirements, user requirements and
reputation framework requirements. RaaS exposes
services by utilizing the proposed architecture.
Future work will address the definition of more detailed
configuration features and how they affect reputation
scores in different scenarios. A RaaS prototype is to
be defined for which simulations are to be performed to
experiment with the different configurable components to
identify which elements are more appropriate to configure.
6. ACKNOWLEDGEMENT
The support of SAP P&I BIT Mobile Empowerment and
the National Research Foundation (NRF) under Grant
number 81412 and 81201 towards this research is hereby
acknowledged. Opinions expressed and conclusions
arrived at are those of the authors and not necessarily
to be attributed to the companies mentioned in this
acknowledgement.
REFERENCES
[1] Biz Community, “Mastercard worldwide reveals
online shopping survey,” 2012. [Online].
Available: http://www.bizcommunity.com/Article/
196/168/73927.html
[2] S. Mulpuru, C. Johnson, and D. Roberge, “US
online retail forecast, 2012 to 2017,” 2013.
[Online]. Available: http://www.forrester.com/US+
Online+Retail+Forecast+2012+To+2017/fulltext/-/
E-RES93281?objectid=RES93281
[3] Y. Wang and J. Vassileva, “Toward trust and
reputation based web service selection: A survey,”
International Transactions on Systems Science and
Applications (ITSSA) Journal, vol. 3, no. 2, pp. 1–38,
2007.
[4] F. Braithwaite and M. Woodman, “Success dimen-
sions in selecting cloud software services,” in 37th
EUROMICRO Conference on Software Engineering
and Advanced Applications, 2011.
[5] H. Li, “A configurable online reputation aggregation
system,” Ph.D. dissertation, University of Ottawa,
2007.
[6] D. Gambetta, Trust Making. Oxford, 1990, ch. Can
We Trust Trust?
[7] T. D. Huynh, “A personalized framework for trust
assessment,” in SAC’ 09, 2009.
[8] A. Josang, R. Ismail, and C. Boyd, “A survey
of trust and reputation systems for online service
provision,” Decision Support Systems, vol. 43, no. 2,
pp. 618–644, 2007.
[9] D. Fahrenholtz and W. Lamersdorf, “Transactional
security for a distributed reputation management
system,” in Proceedings of the Third International
Conference on E-Commerce and Web Technologies
(EC-Web), 2002.
[10] M. Vinkovits, “Towards requirements for trust man-
agement,” in Tenth Annual International Conference
on Privacy, Security and Trust, 2012.
[11] F. G. Marmol and G. M. Perez, “Towards
pre-standardization of trust and reputation models for
distributed and heterogeneous systems,” Computer
Standards & Interfaces, vol. 32, no. 4, pp. 185–196,
2010.
[12] R. Alnemr, M. Schnjakin, and C. Meinel, “Towards
context-aware service-oriented semantic reputation
framework,” in International Joint Conference of
IEEE TrustCom-11/IEEE ICESS-11/FCST-11, 2011.
[13] H. Liao, “Design of SaaS-based software architec-
ture,” in International Conference on New Trends in
Information and Service Science, 2009.
[14] X. Jiang, Y. Zhang, and S. Liu, “A well-designed
SaaS application platform based on model-driven
approach,” in Ninth International Conference on
Grid and Cloud Computing, 2010.
[15] R. T. Fielding, “Architectural styles and the design
of network-based software architectures,” Ph.D.
dissertation, University of California, 2000.
[16] json.org, “Introducing JSON.” [Online]. Available:
http://www.json.org/
[17] World Wide Web Consortium, “Extensible markup
language (XML).” [Online]. Available: http://www.
w3.org/XML/
[18] J. Espadas, D. Concha, and A. Molina, “Application
development over Software-as-a-Service platforms,”
in The Third International Conference on Software
Engineering Advances, 2008.
[19] W. Sun, X. Zhang, C. J. Guo, P. Sun, and
H. Su, “Software as a service: Configuration and
customization perspectives,” in IEEE Congress on
Services Part II, 2008.
[20] F. Marmol and M. Perez, “TRMSim-WSN, trust
and reputation models simulator for wireless sensor
networks,” IEEE, 2009.
[21] Z. Noorian and M. Ulieru, “The state of the art
in trust and reputation systems: A framework for
comparison,” Journal of Theoretical and Applied
Electronic Commerce Research, vol. 5, no. 2, pp.
97–117, 2010.
Vol.105(2) June 2014 SOUTH AFRICAN INSTITUTE OF ELECTRICAL ENGINEERS 83
[22] G. Swamynathan, “Reputation management in
decentralized networks.” [Online]. Available:
http://www.powershow.com/view/11e08-ndu1z/
reputation management in decentralized networks
powerpoint ppt presentation
[23] F. R. Farmer and B. Glass, Web Reputation Systems.
O’Reilly, 2010.
[24] L. Liu and M. Munro, “Systematic analysis of
centralized online reputation system,” Decision
support systems, vol. 52, no. 2, pp. 438–449, 2012.
[25] R. Jurca, “Truthful reputation mechanisms for online
systems,” Ph.D. dissertation, 2007.
[26] Z. Liang and W. Shi, Collaborative Computing:
Networking, Applications and Worksharing, 2005,
ch. Performance Evaluation of Rating Aggregation
Algorithms in Reputation Systems.

Vol.105(2) June 2014SOUTH AFRICAN INSTITUTE OF ELECTRICAL ENGINEERS84

Vol.105(2) June 2014 SOUTH AFRICAN INSTITUTE OF ELECTRICAL ENGINEERS 85
� � � � � � � � � � � � � � �� � � � � � � � � � � � � � � � � � � � � � � � � � � � � � � � � � � � �
The Managing Editor, SAIEE Africa Research Journal,
PO Box 751253, Gardenview 2047, South Africa.
E-mail: [email protected]
The Managing Editor, SAIEE Africa Research Journal, PO Box 751253, Gardenview 2047, South Africa.
E-mail: [email protected]� � � � � � � � �� � � � � � � � � � � � � � � � � � � � � � �