foreign direct investments in spain and hungary - developments
TRANSCRIPT

1
Andrea Éltető:
Foreign direct investment in Spain and Hungary: main patterns and effects
with a special regard to foreign trade

2
Budapest University of Economic Sciences and Public Administration Department of World Economy
Supervisor: Professor Carmela Martín Universidad Complutense de Madrid

3
Budapest University of Economic Sciences and Public Administration International Relations Ph.D. Program
Foreign direct investment in Spain and Hungary: main patterns and effects
with a special regard to foreign trade
Ph.D. Thesis
Andrea Éltető
Budapest, 2000

4
Contents
Introduction
I. Brief theoretical and empirical overview...............................................................
1. Determinants of FDI ........................................................................................
2. Effects of FDI on host countries ......................................................................
2.1.Effects on trade..........................................................................................
2.2 Effects on technology, human capital and productivity...........................
2.3.Effects on production structure and growth.............................................
II. General patterns of FDI.................................................................................................
1. Trends and main features of FDI inflows in Spain and Hungary...................
III. Location-specific advantages of Spain and Hungary .............................................
1. Macro-economic environment and economic policy .....................................
2. Technological capacity ....................................................................................
3. Labour costs and productivity..........................................................................
4. Infrastructure facilities .....................................................................................
5. Empirical evidence on FDI-determinants .......................................................
IV. The effects of FDI on Spanish and Hungarian economies with special
emphasis on foreign trade.................................................................................
1. Effects on the technological level....................................................................
2. Impact on productivity and growth patterns of the manufacturing
industry .................................................................................................................
3. The effects on trade performance and trade specialisation.............................
3.1. Trade balance............................................................................................
3.2. Trade specialisation: inter-industry and intra-industry trade ................
V. Conclusions............................................................................................................
Annex

5
References
List of Tables
Table 1. Country profile .........................................................................................................
Table 2. Distribution of FDI among manufacturing sectors .................................................
Table 3. Manufacturing sectors above 50% share of foreign capital ...................................
Table 4. Selected indicators of technology level and human capital....................................
Table 5. Labour costs in manufacturing, hour/USD on current prices.................................
Table 6. Indicators of infrastructure dotation ........................................................................
Table 7. Determinants of FDI in Spain..................................................................................
Table 8. Determinants of FDI: Hungary...............................................................................
Table 9. Share of sectors in the value-added of manufacturing industry (percentage)........
Table 10.: Share of industries in Spanish manufacturing export to the EU (%) ..................
Table 11.: Share of industries in Hungarian manufacturing export (%)...............................
Table 12. RCA indices, Spain-EU relation............................................................................
Table 13. Revealed comparative advantages, Hungary-EU relation....................................
Table 14. Intra-industry trade between Spain and the EU, 1990 and 1998..........................
Table 15.: Positive and negative adjustments in the Spanish
manufacturing trade with the EU..................................................................
Table 16.:Intra-industry trade between Hungary and the EU, 1990 and 1998.....................
Table 17. Positive and negative adjustments in Hungarian
manufacturing trade with the EU..................................................................
List of Graphs
Graph 1. FDI inflows in percentage of GDP .........................................................................
Graph 2: Real GDP (percentage change from previous period) ...........................................
Graph 3. Selected macro-economic indicators of Spain .......................................................
Graph 4. Selected macro-economic indicators of Hungary ..................................................
Graph 5: Level of unit labour costs in Spain and Hungary...................................................
Graph 6. Foreign trade balance in percentage of the GDP....................................................

6
To the memory of my mother

7
Introduction
After the collapse of the old political and economic system in Central and Eastern
Europe it has been popular to compare these countries to the present peripheral
members of the European Union, in most cases to the Iberian countries. The broad
objective of the thesis is also to explore the likely analogies in the economic
development induced by foreign direct investment existing between Spain and
Hungary. There are good reasons for choosing Spain as an object of comparison.
Spain is already over its first decade of integration within the European Union
where Hungary also aims to integrate itself. At the time of economic opening the
development level of both Spain and Hungary was significantly inferior to that of
the Union and both countries were after a long period of state interventionism.
Since accession Spain has registered a remarkable process of development within
the EU, and thanks to its impressive improvement in nominal convergence has
became a founding member of the Economic and Monetary Union, which can be
considered the highest level of integration ever reached in Europe. Hungary has
been going through a rapid period of liberalisation and its macroeconomic
performance during the following decade has shown certain features similar to
those of Spain.
Apart from all above mentioned reasons, the key role that the foreign direct
investment (FDI) seems to have played in shaping Spanish economic development
- as it appears to be happening in the case of Hungary - justify our choice of Spain
as a reference country.
There are however important internal and external differences between the two
countries' situations. The main internal difference is that even before the opening
Spain had been a market economy with dominating private ownership, while in
Hungary market economy and its institutional framework had to be recreated
recently. The main external difference can be found in the changed international
environment (the high degree of globalization, the creation of the Economic and
Monetary Union, etc.) which exerts influence on the countries.

8
The structure of the thesis is the following. The first chapter provides an overview
of the main theories concerning the determinants of FDI. Apart from this, also the
effects of foreign direct investment on trade, technology level, production
structure and growth are taken into account here. After the description of the
theoretical background, the discussion follows in further three chapters.
The second chapter describes the general trend and patterns of foreign direct
investment in the two countries. Both Spain and Hungary have been favourite
targets of foreign investors within their sub-region (Southern-Europe and Central-
Eastern Europe), attracting high amounts of foreign capital. We describe the main
trends of FDI-inflow, its geographical origin and sectoral pattern in the case of
Spain and Hungary.
The third chapter of the thesis aims to discover the reasons why these countries
have been so attractive to foreign investors. That is to say: what are their
respective location-specific advantages and how they have changed over the last
years. Apart from the economic policy background similarities and differences in
the motivations of foreign investors are pointed out. For that purpose, we offer a
detailed survey of the statistical and econometric evidence on the issue.
The fourth chapter examines the likely effects of foreign direct investment inflow
on the domestic economic and manufacturing structure. In both countries
important changes have taken place in this respect after the liberalisation.
Performance and efficiency indicators of foreign investment enterprises have to be
analysed as well as their contribution to the increase of the technological level in
the country.
Further on, this chapter focuses on the analysis of the changes occurred in the
foreign trade structure and discusses the extent to which they may have been
induced by FDI. The more in depth analysis of the effects of FDI on foreign trade
is reasoned by the importance of foreign trade in a small open country like
Hungary but also in Spain, where the heritage of a closed economy has been a
burden. Our main focus is on the trade with the European Union, which is justified
by its overwhelming share on the total trade of the two countries and also by the
availability of homogeneous data provided by Eurostat. For the sectoral analysis
we have grouped the manufacturing sectors according to their technology-

9
intensity. The industry classification follows the method of OECD [1993] and the
same classification system is applied to Spain and Hungary in order to ensure
comparability.
Particularly, given that it is widely believed that the CEE countries and the Iberian
countries can mainly be competitive in the labour-intensive fields, special
emphasis is put on exploring the extent to which this statement is true. In order to
assess the main features of the structure of comparative advantages, the concept of
revealed comparative advantage introduced by Balassa [1965] is used. Trade-
balance-based revealed comparative advantage (RCA) indices are calculated for
the 1990-97 period using the technology-level classification.
Still in this chapter the share of intra-industry trade (IIT) in Hungarian and Spanish
foreign trade with the EU is calculated. As known, the measurement of the share
of this type of trade is an essential piece of information on the assessing of the
nature of trade adjustment cost induced by an economic integration process. It can
be said that our methodology for the analysis of IIT is rather new in Hungary,
because it is better than those used in previous studies on the issue for Hungary.
Thus, apart from the fact that a more detailed classification (SITC 5 digit level
with 3464 products) is applied, also unit value calculations are made in order to
separate horizontal (two-way trade of similar type, similar quality-products) and
vertical type (similar type products differing in quality) of IIT. Data are afterwards
aggregated to the sectoral groups according to technology level.
I. Brief theoretical and empirical overview
To begin, it is useful to clarify what is called foreign direct investment. According
to the standard definition of the OECD and the IMF1 foreign direct investment
reflects the lasting interest of a resident entity in one economy in an entity resident
in another economy. The lasting interest implies a long-term relationship between
1 See for example the OECD Detailed Benchmark Definition of Foreign Direct Investment [1992] and IMF Balance of Payments Statistics Yearbook series.

10
the investor and the enterprise and a significant degree of influence by the investor
on the management of the enterprise. Thus, the purpose of FDI is to obtain
ownership and control over companies abroad. Direct investment transactions are
sub-classified into equity capital, reinvested earnings and other capital (intra-firm
borrowing and lending).
Measurement and registration of FDI differs across countries, even across
developed OECD countries. Usually, following the IMF guidelines the
qualification of FDI is controlling 10% or more in the foreign firm (if this share is
less, the investment belongs to the portfolio category), but countries can deviate
from this. Furthermore, many times it is difficult to define the nationality of an
investment made by a multinational company, because a part of FDI is carried out
by firms that are not the ultimate source of capital (via regional affiliates or tax
"havens"). More details on definition and measurement problems of FDI can be
found in Bellak [1998]. In any event, in our analysis the Spanish and the
Hungarian FDI-statistical system will be followed.
In general there are three statistical sources on FDI. The first is balance of
payment statistics, which collects capital flows without including reinvested
earnings. The second one is the official statistical registration as a result of
previous authorisation. The third data source are the enterprise surveys, providing
mainly stock data.
1. Determinants of FDI
The issue of the determinants of FDI was addressed in the framework of the neo-
classical trade theory. Thus, Mundell [1957] was the first to include the
international movements of capital in this framework and explained them on the
basis of the factor proportion theory. Then by extending the Heckscher-Ohlin
model he showed that - under the basic assumptions of this model - an increase in
trade barriers stimulates capital movements and an increase in restrictions on
capital movements stimulates trade (see point 2.1.).
However, this approach did not seem to be very useful in explaining the observed

11
performance of multinational firms, an inseparable phenomenon of FDI flows.
Therefore another approach to FDI was developed in the framework of the
industrial organisation field.
In this sense the seminal work in the theory of multinational companies was the
paper of Hymer[1960] where the author, after clarifying the distinction between
direct and portfolio investment2, looks for the reasons of international operations.
Thus, taking into account the ideas of Coase [1937] and Penrose [1959]3 he
introduces the argument that certain firms have considerable advantages in
particular activities relative to other firms. The possession of these advantages
may cause them to have extensive international operations. The same theoretical
line was further developed by Kindleberger [1969] detailing foreign firm specific
advantages in product and factor markets, economies of scale and government
limitations.
Another important "milestone" of FDI- theory is that of Vernon [1966] who used
the micro-economic concept of the well-known product-cycle theory4 to explain
the foreign investment of US multinational companies. As the product -originally
produced only in the innovative developed country- is being more matured and
standardised, instead of exports, its production is being transferred to less
developed countries. In this way, international trade of products was linked here
with international investment, also explaining partly the development of
multinational companies (see Gál-Simai [1994] more detailed).
These new approaches promoted several followers treating the issue of FDI or
multinational companies. The work of a huge number of economists is collected
and organised in the book of Caves [1996], who also makes a distinction between
three types of multinational enterprises. The first is the horizontally integrated
multinational firm with plants in different countries producing the same or similar
2 Already Marx differentiated between “working capital” and “loan capital”, see Szentes [1995] p.434. for more details 3 The definition and development of multi-plant enterprises has the roots in the work of Coase [1937] who founded the notion of transaction costs seeking the answer to the question why can be more costly to use market prices than establishing a firm. Another aspect is the expansion of the firm. As emphasized by Penrose [1959], market size can limit the exploitation of firm capacities. 4 See the description of this theory for example in Szentes [1995] p.306.
12
goods. Its existence requires certain location-specific advantages and also some
transactional advantages of placing the plants under common control. The second
type is the vertically integrated multinational company, where the different stages
of the production process are located in different nations. In other words the output
of one plant is the input of another plant, the market of intermediate products is in
this way internalised. The third, type is the diversified multinational company,
whose plants' products are neither horizontally, nor vertically related. The goal
here is to spread (diversify) business risks.
Using this above-mentioned typology Krugman [1983] constructed the models of
horizontal and vertical multinational companies allowing for imperfect
competition. In explaining horizontal multinationals the author concludes that
firms by R&D spending acquire the ability to manufacture different products, they
can export this technology either by establishing foreign subsidiaries or by
embodying technology in goods. Which route they take depends on economic
incentives, which may be distorted by tariffs. In the vertical case a monopsonistic
firm keeps the price of its raw material down and thus distorts the production
decisions of its suppliers. By going multinational and integrating backward,
distortion is eliminated and there are efficiency gains.
The previous theories of FDI were organised into a general framework referring to
the determinants of multinational companies' activity by Dunning [1993]5. He
constructed the famous eclectic paradigm. The main hypothesis of this paradigm is
that if foreign investment fits in the long-term management strategy of the firm,
this foreign activity of a firm will depend on the existence of three types of
advantages. The first is the so-called ownership-specific (O) advantages mainly in
the form of intangible assets or from common governance. Among others property
rights, product innovations, production management, marketing system belong
here. A considerable part of these advantages are firm-specific, knowledge-based
assets6. If the enterprise perceives it to be in its interest to add value to its O
advantages rather than to sell them, then the second type of advantages called
internalisation (I) advantages exist. An aim can be here to avoid government
5 See also his previous works: Dunning [1974], [1980]. 6 The importance of these assets is emphasized by Markusen [1995], [1998] and in his other

13
intervention, cost of negotiation, broken contracts, to control supplies and
conditions of sale, market outlets, etc. In order to utilise the O advantages in a
foreign location rather than at home, the so-called location-specific (L) advantages
should exist. Examples of such advantages are natural and created resource
endowments, transport costs, investment incentives, infrastructure, language and
culture, institutional framework.
The three types of advantages are equally important7 - as Dunning [1998] writes:
"the OLI triad of variables determining FDI may be likened to a three-legged
stool; each leg is supportive of the other". In this research the focus will be on
location-specific advantages (see Chapter III.), given that our main purpose is to
explore the patterns and effects of FDI inflows on the economic performance of
two specific host countries: Spain and Hungary. Moreover, in the following we
will focus on three types of L advantages which have an important theoretical and
empirical background: knowledge or human skills, agglomeration economies and
the provision of government incentives.
The importance of location-specific advantages is growing at the international
level. As Dunning [1998] points out there are significant changes, new trends in
the world economy in the 1990s. The intellectual capital has emerged as a key
asset in most industrial economies. Knowledge-intensive assets are created assets
of an intangible nature, which are mainly generated by investing in R&D and
education. They include among others skills, attitudes, business culture, innovation
or learning and managerial capabilities, stock of information (UNCTAD, [1998]).
Markusen [1998] argues that the knowledge-based assets are more closely
associated with multinationals than physical capital, because the services of
knowledge capital can be more easily transported to foreign production facilities
and because knowledge capital (blueprints, chemical formulaes) often has a joint-
input nature within the firm. In relation to the increased role of knowledge, the
boom of mergers and alliances, collaborations, demonstrates the growth of
strategic asset-seeking FDI. Location needs of corporations shifted towards access
to knowledge-intensive assets.
works. 7 Although there are opinions according to which internalization is the key factor explaining

14
The agglomeration economies make that the spatial concentration of economic
activities provides greater rentability to the following investment located in the
area. The advantages of geographic concentration of economic activities due to the
existence of agglomeration economies has received a renewed interest in the
context of the so called "new trade" and "new economic geography" theories8. For
the purpose of the present research the most interesting studies are those which
link the location strategies of (multinational) firms with the factors explaining the
existence of the agglomeration economies. Thus Venables [1996] proves that firms
like to be close to each other because of direct input-output (forward-backward)
linkages among themselves. Having a larger number of upstream firms in a
location benefits downstream firms who obtain their intermediate goods more
cheaply leading to clustering of vertically related industries.
The new geography-ideas have brought about a large number of empirical studies.
As an example Kozul-Wright-Rowthorn [1998] confirms that FDI is influenced by
strong neighbourhood effects. Audretsch [1998] points out that - although
globalisation combined with the telecommunication revolution reduced the cost of
transporting information across space - given the tacit nature of knowledge
(transmitted only informally, demands direct and repeated contacts) technological
spillovers are spatially restricted and clustered. And Ottaviano-Puga [1998]
concludes that the combination of increasing returns to scale and trade costs
encourage firms to locate close to large markets with high economic activity.
In that sense, it has been argued that economic integration affect the location
strategies of firms, as trade costs decrease. The European Union is particularly
interesting case study in this respect. In fact, it is the reference of many papers.
Amiti [1998] uses the case of the EU to prove that as for vertical linkages are
stronger when the proportion of intermediate goods is higher in production, the
level of geographic concentration is higher in industries that use more intensively
intermediate inputs in final production. According to the computations of
Brühlhart [1998a] for 11 EU countries between 1980-1990, an increasing
manufacturing specialisation is manifested. At the same time he found that internal
FDI, see Ethier [1986]. 8 See for example Krugman [1990] and [1991], Venables [1996].

15
scale-sensitive industries are localised at the EU-core, labour-intensive industries
are relatively dispersed and high-tech industries are highly localised but not along
the centre-periphery.
There is also some evidence on that economic integration can promote FDI. For
example based on a three-country, three-firm model, Motta-Norman [1996] shows
that integration, by improving market accessibility, will induce foreign firms to
invest in the integrated regional bloc. In this respect integration is likely to lead to
intra-regional export platform investments, but if there is intra-regional FDI prior
to integration, increased market accessibility after the integration may lead to
rationalisation.
Policy of host countries towards multinational companies and FDI is a debated
issue since the sixties. Several aspects of host government policies are treated in
Dunning [1993] and in Simai [1996]. As a consequence of globalization and
agglomeration tendencies, the role of FDI policies and incentives within the L
advantages has increased. Countries and regions compete for attracting FDI and
regulations have become more and more liberalised. According to the World
Investment Report (UNCTAD [1998]) 94 per cent of the 151 FDI policy changes
occurred between 1991-1997 created more favourable conditions for FDI. The
number of activities in which FDI is restricted has been significantly reduced,
ownership requirements and control are limited to certain strategic industry and
most countries replaced authorisation with registration. Privatization policy and
trade policy is strongly attached to FDI, but investment policy framework has been
extended to other policy fields that may also affect FDI. These are, on the one
hand, macro-economic policies (monetary-, exchange rate-, fiscal-, tax-policy) and
on the other hand macro-organizational policies (industry-policy, labour market-,
education, R&D-policy and infrastructure facilities.). The totality of these and
other legal and political factors contribute to determine the level of the so-called
"country-risk" which is always crucial in investment decisions, often preceding
profit considerations (Simai [1996]).
Another possible classification is given by Brewer [1993] who argues that
government policies affect FDI via their effects on market imperfections. There
are policies that increase market imperfections and increase FDI also (protectionist

16
import policy, undervalued currency, subsidies on inbound FDI, etc). There are
policies that increase market imperfections but decrease FDI (price controls,
restrictions on inbound FDI, trade restrictions of inputs and outputs of FDI
projects, etc). A further group consists of those policies that decrease market
imperfections and increase FDI (liberalisation, privatisation, currency
convertibility, etc) and the last (very small) group of policies decrease market
imperfections and also decrease FDI (vigorous enforcement of antitrust policies).
The effects of policies on FDI also depend on the scope of the policy (selective or
general), on the relative position compared to other countries and on the relation
between the FDI host and home country.
Investment promotion has also increased rapidly. Various incentives are further
means to attract FDI. Incentives are "any measurable economic advantage afforded
to specific enterprises or categories of enterprises by a government in order to
encourage them to behave in a certain manner" (UNCTAD[1998]p.102.) These
incentives can be fiscal incentives (tax reduction, accelerated depreciation, duty-
exemption, etc.), financial incentives (grant, subsidised credits, etc.), market
preferences (protection from import competition, preferential government
contracts, monopoly rights, etc.) and other incentives (like subsidised
infrastructure and services). According to survey evidence incentives play a
relatively negligible role compared to other factors in investment decisions,
although if the broad region (for example EU or Central Europe) has already been
chosen, incentives offered by countries within this region can be important. The
strength of FDI-incentives is in their "uniqueness", it means that the more
widespread they are, the less effective they are.
Regarding location-specific advantages, finally the infrastructure facilities should
be mentioned. Infrastructure can be defined as the group of public services
(energy, water, telecommunication, waste water treatment), public works (roads
and dams) and other transport (railroads, ports, waterways, airports, city-
transport).The importance of infrastructure in increasing growth and productivity
was first emphasized by Aschauer [1989] who based on econometric analysis of
data between 1949-1985 found that public capital stock is important in
determining productivity, having the “core” infrastructure (roads, airport,
electricity, water) the greatest explanatory power. Kessides [1993] argues that

17
infrastructure contributes to economic growth through reduced production costs,
better access to modern technology, increasing productivity and contributes to
raising the quality of life also. The beneficial effects are realised however on
certain conditions: adequate macro-economic climate, sufficient complement of
other resources, existence of reliable, good quality infrastructure and user charges.
All the direct effects of infrastructure and public capital can be complemented by
its indirect impact via fostering private investment (Sanchez-Robles [1998]).
2. Effects of FDI on host countries
Apart from the determinants of foreign direct investment, another part of the
literature concentrates on the host country analysing the effects of inward FDI on
the host countries. Foreign direct investment have both macroeconomic and
microeconomic effects on the host countries. Thus, first FDI affects the level and
structure of investments and the balance of payment, but it also has many other
repercussions such as: the domestic competition, the structure of the market and
consumption, employment and wages, etc. In this respect, “FDI-spillovers” is a
concept used to integrate all kinds of impacts of the multinational enterprises have
on their suppliers, competitors and customers, and more generally on the host
economies in which they operate.
Here we focus on three main effects. The first one is foreign trade, the second is a
group of effects on technology, human capital and productivity and the third one (a
consequence of the previous ones) is its impact on production structure and
growth.
2.1. Effects on trade
Within the early theories of foreign direct investment and multinational firms FDI
and foreign trade were considered to be substitutes. First Mundell [1957] built a
model where both FDI and foreign trade is based on the price differences of
products and production factors determined by the different factor endowments of

18
the countries.
The already mentioned product-cycle theory of Vernon [1966] was also based on
this substitution principle. Foreign direct investment replaces the export as the
product matures. Still based on the traditional comparative advantage theory,
Kojima [1975] introduced the concept of trade-oriented (pro-trade) and anti-trade-
oriented FDI based on the theory of comparative advantages. According to this, we
can speak about trade creating, or pro-trade FDI if the investment is undertaken
from the home country's comparatively disadvantaged industries into the host
country's comparatively advantaged industries. Both countries gain from the
following trade creation. In the case of anti-trade FDI, however, investment is
undertaken by a firm of the home country's comparative advantage industry into
the host country's comparative disadvantage industry. In this way the home
country has an excess demand for importable goods and an excess supply of
exportable goods. The two countries are competing in importing and exporting
capacities, thus FDI can even destroy trade.
At the end of the seventies "new international trade" theories emphasise, however
the complementary relationship between FDI and foreign trade (see for example
Krugman [1990] and [1991], Venables [1996].) This is the result of introducing
new aspects in the models like increasing returns to scale, product differentiation,
technology-differences among nations. Allowing for these factors and assuming
identical relative factor endowments Markusen [1983] proved that factor (capital)
movements between two economies lead to an increase in the volume of trade.
Thus, depending on the circumstances FDI can have trade substituting or trade
creating effects. Regarding the strategies of investors, really two main distinct
investor types can be differentiated. One is the export-oriented investor and the
other is the market-oriented type.9 (The subtypes of these two groups are
described by Dunning [1993]10). The export-oriented investment aims to exploit
the low cost resources, relative factor abundance, institutional structure, economic
policy etc. of the local market, and to provide export markets by concentrating
9 The final goal of both type is the same: to sell the most. 10 He call these groups as efficiency-seekers, resource-seekers, market seekers and strategic asset seekers.
19
production to a few locations.
Those companies belong to the market-oriented investors, which invest in a
country or into a region in order to supply these markets with their goods or
services. The increase of the market or economic policy changes in the aimed
country can promote the foreign company to invest. The aim of the investment is
to preserve or gain market shares. The products made by the affiliate are sold in
the local or regional market.
The effect on the foreign trade depends on whether the investment is oriented
towards exports (trade creating effect) or towards the domestic market (trade
creating or substitutive). These two kinds of investment have different effects on
the host-country’s balance of trade. Export-oriented investments may improve the
trade balance, even if case studies show that many firms tend to import most of
their inputs initially. Market-oriented firms, on the other hand, may worsen the
trade balance, if their exports are negligible and many of their inputs are imported.
In principle, the size of the host country is likely to influence the trade strategy of
foreign investors. Thus, big countries tend to be more suitable for market-oriented
companies. Whereas small host countries appearing to be more suitable for export-
oriented FDI because, apart from having a small domestic market, they use to have
a higher degree of openness (ratio of trade to GDP) then large countries.
In any event, although the impact on net trade balance of host countries may differ
depending on the trade strategy of FDI, the bulk of the studies support that foreign
investment firms are more export-intensive and more import-intensive than
domestic firms. Dunning [1993] argues that they are likely to be more trade-
oriented than national companies partly because foreign production cannot take
place without some trade in intermediate products. Looking at European periphery
countries, this has been confirmed by empirical studies on Ireland, Portugal (Barry
and Bradley [1997], Corado [1996]) and, as we will see in chapter IV., also on
Spain.
As Kozul-Wright-Rowthorn [1998] points out the relationship between FDI and
foreign trade can also be affected by economic integration of countries. Within
regional blocks FDI and trade are often complementary, as a consequence of
internal division of labour within the same firm. Between regional blocks

20
however, FDI and trade are more likely to be alternatives, as for distance, culture
create barriers to inter-block trade, which is often overcome by setting up local
facilities.
It is important to remark that FDI affects not only the volume of trade but also the
composition of trade flows or, in other words, the trade patterns of specialisation.
In order to ascertain the way in which FDI influences the trade patterns of the host
countries it is common to examine the changes registered in both inter-industry
and intra-industry trade. For assessing the former, one may use the concept of
revealed comparative advantages was introduced by Balassa [1965] based on the
assumption that if countries are specialised according to their comparative
advantages, this should be manifested (revealed) in their foreign trade. There are
two basic types of revealed comparative advantage (RCA) indices. One compares
the export and import structure of a given country, the other compares the export
structure of a given country to the export structure of a country group or the
world.11
As for the analysis of the impact of FDI on intra-industry trade (IIT)12, the index
of Grubel and Lloyd [1975] is used. However, since the work of Greenaway and
Milner [1994] two types of intra-industry trade are distinguished. The first is
called vertical IIT, when the products traded are of the same type but different in
11 It should be mentioned, however that both types of indices were criticised, because state interventions, protectionism or monoculture can distort the relation between real comparative advantages and the revealed ones (see Szentes [1995] for more details). The disadvantage of the index of first type is that contains data only for one country and does not show its export performance compared to others. The index can rise even then if domestic demand and import is restricted but export remains the same (Török, [1986]). There are critics also concerning the second type of index, see Yeats [1985]. 12 Intra-industry trade is characteristic for the sophisticated manufactured products. Monopolies, increasing returns to scale, homogeneous consumer preferences in partner countries explain this type of trade. Intra-industry trade is especially intensive among developed countries, which trade with similar, diversified manufactured products. This type of trade can be the exchange of the same goods on the basis of different packing or seasonal effects, can be the exchange of differentiated or substitutive goods or can be induced by intra-industrial cooperation. The more similar the factor endowments of the partner countries are, the greater the extent of IIT is. It should be mentioned that intra-industrial trade is often mixed with trade within the production vertical. Thus, if a country imports motors and exports cars, it is not intra-industry trade although in a high enough aggregation level both products belong to the “vehicles and components” category. Therefore proper disaggregation is very important in the measurement of intra-industry trade. It should be clarified that intrafirm trade - between a multinational parent company and affiliates - can be of intra-industrial type but not necessarily, intrafirm trade is not a part of intra-

21
quality, the other is the horizontal IIT, when also the quality of products is very
similar. Definition of the types (quality judgement) is made by the calculation of
the export and import unit values (see chapter IV, point 3.2.)
Separating vertical and horizontal IIT is important from more points of view.
Regarding the effect of integration, in the case of countries which are of different
development level, integration can enhance vertical IIT. In this case, products of
the less developed country, which are of lower quality can be crowded out by
better quality import of more developed countries, thus the costs of adjustment can
be high. Regarding theory, empirical verification of the role of scale economies in
creating IIT remained rather poor. Calculations showed that generally vertical IIT
is much more significant than horizontal IIT, therefore interest has grown in
analysing and explaining vertical IIT.
And here a turn towards the traditional comparative advantage explanation can be
observed.13 Falvey [1981] pointed out that difference in quality among similar
goods (that is vertical IIT) on the supply side is caused by the differing
capital/labour ratio of their production. High-quality products require more
capital-intensive production techniques. On the demand side there is an aggregate
demand for a variety of differentiated products, low-income consumers will buy
lower quality products, high-income consumers high quality products. A relatively
labour abundant country will export the lower quality/labour intensive version of
the product (aiming low-income consumers abroad) and will import the higher
quality product (for high-income consumers on the domestic market). Thus IIT is
explained by comparative advantages. From another aspect Davis [1995] also
shows that IIT can take place without increasing returns and imperfect
competition. Here the emphasis is on technical differences between the countries
which determine specialisation on one or other type of intra-industry product.
The available evidence on how FDI affected trade specialisation patterns of host
countries is however rather scarce. According to the studies it seems that FDI
increases the share of IIT. But, apart from the fact that empirical evidence is small,
it is far from being conclusive. As an illustration it is interesting to quote
industry trade and vice versa.( Fontagné et al.[1995]). 13 See detailed in Blanes-Martín [2000]

22
Aturupane-Djankov-Hoekman [1997]: "the relationship between FDI and IIT is
ambiguous. Vertical IIT is likely to be associated with the presence of inward FDI
as foreign firms combine their technological knowledge with local endowments to
produce goods of varying qualities that are then exported. In the case of
horizontally differentiated products, FDI may substitute for exports of the goods
that were previously produced in the investor's home country. Whether this would
reduce IIT depend on the export structure of the industry in the host country prior
to entry by the multinational. If the industry did not produce similar goods or if the
foreign entrants have positive net exports, horizontal IIT may increase".
(Aturupane-Djankov-Hoekman [1997] p.6.)
What seems to be more clear is the significant impact of FDI on intra-firm trade.
The propensity for intra-firm trade differs according to industries and also depends
on firm and country-specific factors.14 Applying intra-firm trade multinational
companies can manipulate the terms of trade, tackle the different tax systems of
governments. Intra-firm trade in itself is not good or bad, its costs and benefits for
the host country depend on the particular circumstances.
2.2. Effects on technology, human capital and productivity
Perhaps the most often mentioned and debated FDI spillover is the transfer of
technology. (The process, period, growth and welfare aspects of international
technology and productivity transfer by multinational enterprises is thoroughly
analysed by Caves [1996] also surveying the relevant literature.) Several empirical
studies exist on FDI spillovers on technology, training and productivity (see
Blomström-Kokko [1998 a,b] for references). In this respect it has been argued
that FDI can help host countries to reduce their gaps in productivity.
In the eighties and nineties multinational companies account for the majority of
research activity and 90% of the trade in technology or technology-intensive
products (Dunning [1993]). Physical investment is increasingly accompanied by
14 Referring to studies Dunning [1993] enumerates four factors that generate intra-firm trade. The first is the technological intensity of the products, the second is the size of FDI involved, the third is the divisibility of the production process and the fourth is the need to control after-sales service and maintenance. The role of regional or country-specific L-advantages is also important,

23
intangible investment to which technology, research and training belongs together
with design, advertising, marketing, management (Hatzichronoglou [1993]).
Although Patel-Pavitt [1991] found that production of technology is highly
centralised in the headquarters of multinational firms, there are some signs of a
tendency in multinational enterprises towards a certain decentralisation of their
R&D activities around the world (Dunning [1993], Simai [1996], OECD[1998]).
According to data for 15 OECD countries, in 1994 R&D handled by foreign
affiliates accounted for more than 12% of the total industrial R&D spending of
these countries. The strength of this phenomenon is country- and industry-specific
(for example in Ireland the share is 62%, in Spain 31%, in Finland 7%).15
Outsourcing of R&D activity appears to be basically motivated either by
supporting foreign production via adaptations to the specific markets or by cost
considerations, rationalisation (Kumar [1996]).16 Factors contributing to increased
multinational R&D activity abroad have been grouped under three heading by
Cheng-Bolon [1993] namely: conditions (internal or external factors that make
foreign R&D possible or rational), motivations (organizational benefits a firm can
obtain from foreign R&D activities) and precipitating circumstances (inside or
outside events that trigger foreign R&D activity). The relative influence of the
factors vary from company to company.
The early model of international diffusion of technology is the already mentioned
product cycle theory of Vernon [1966]. Innovation and the location decision of
multinational companies are linked here. Later the author explained losing of
power of his theory for the US investments and large companies regarding the
changing international environment, namely the spreading of multinational
networks and the shrinking differences in income levels of major developed
a good example for this is the deepening of EU-integration. 15 OECD, [1998] p. 16. 16 Kumar [1996] examined what determines the overseas distribution of R&D activity of US multinationals. He looked for explanatory factors of R&D intensity of majority owned US affiliates in 54 countries in 1977, 1982, 1989. Regarding the whole sample market size, national R&D efforts and extent of patent protection in the host country proved to be the most important significantly positive determinants. Results were different for only the developing countries, here the scale of FDI in the host country, market size, host country sales share of US affiliates, national R&D efforts, communication infrastructure and tariff+non-tariff barriers on intermediate inputs proved to be important explanatory factors. This shows that in developing countries R&D activity is mainly directed towards the product-adaptation for local market.

24
countries (Vernon[1979]). However for smaller firms he considered it still
relevant.
As far as empirical studies about technology diffusion are concerned, based on the
experience of OECD countries, it was first observed in Pavitt [1971] that the
multinational firm became an increasingly important agent for international
technology transfer, which had considerable effects on economic growth and trade
patterns in high-tech industries. The transfer process was influenced by national
technological capabilities and specialisation. Concerning the less developed
countries the author states that "key technologies" for these countries are very
different from those for the advanced countries and the sophisticated technologies
of the MNEs may not be appropriate to the needs of the less developed
countries17. Adaptation of technologies is induced by local factor-price
differences, scale-motivations (smaller output produced by local affiliate) local
material and supply availability, and different consumption patterns. However, as
the markets of these countries are often a very small part of the multinational
firm’s total market, the MNEs may be reluctant to make efforts of adaptation.
Therefore the given country may have to promote the realisation of the necessary
changes.
Teece [1977] surveyed 26 cases of technology transfer from the point of view of
their costs. He differentiated between embodied knowledge (physical items) and
unembodied knowledge (information) and concentrated on the transfer-costs of the
latter. He found that these costs vary from case to case, they tend to be higher for
the first time and for new technologies and lower the more experienced the
recipient is. This differentiation between the two types of technical knowledge
(physically embedded, explicit and tacit knowledge) has been kept and developed
further later on in works analysing the costs, methods and mobility of technology
transfer (Kogut-Zander [1993], Tsang [1997], Sölvell-Zander [1998]). Regarding
the costs, they depend on the type of knowledge and on the method of transfer.
The more tacit the technology is, the more likely will be transferred to a wholly
17 Inappropriate modern technology for the developing countries was especially heavily criticised and debated in the sixties by post-keynesianist scholars like Singer and others (analysed and cited by Szentes [1995].

25
owned subsidiary. Regarding the mobility, although recently skilled human capital
is more mobile than before, there is still an important part of formal and informal
tacit knowledge which cannot be taken out of local systems without losing its
value. Knowledge embedded in machinery is more mobile than tacit knowledge.
The leakage period of technology was measured by Mansfield and Romeo [1980].
Based on a sample of US firms they calculated the average period between the
introduction of a new technology at the firm and its transfer abroad. They found
that if the transfer is directed toward subsidiaries in developed countries this
period is 6 years but in case of less developed countries 10 years. In certain cases
the transferred product or process was imitated at least 2.5 years earlier than the
firms would have expected if the technology had not been transferred to the
overseas subsidiary.
According to Lall [1983] four level or type of technology development can be
distinguished: one is the know-how (assimilation of imported techniques, quality
control, etc) the second is the know-why (deepening and extending the first) the
third is applied research and the fourth is basic scientific research. The
contribution of multinationals in the host country can take place at any or all of
these levels, positive and negative effects may coexist, the range of potential
permutations is big.
The relation between local and foreign firms, or impact of multinationals on
technology development can be assessed by three ways (Lall [1983]): a, within the
affiliate and the parent company (transfer of know-how and outsourcing of
research activity), b,. developments of the foreign affiliate relative to similar local
firms (differences in R&D intensity, innovation) and c,. direct or indirect effects of
the multinational affiliate on related, -vertically linked or competitive - firms in the
host country (transfer of skills, design, incentive for local firms to improve their
technology).
Blomström-Kokko [1996] describes spillovers from transnational companies
focusing on productivity and technology spillovers in host countries. They define
three types of spillovers: the first is the case when a local firm improves its
productivity by copying some technology used by multinational affiliates in the
local market. The second type occurs as a consequence of increased competition

26
because of the entry of multinationals which forces local firms to use the existing
technology more efficiently. The third kind of spillover forces the local firms to
search for new, more efficient technologies.
In a later work Lall [1990] emphasises an aspect of technology transfer from the
recipient side. He claims that countries differ in their technological capabilities,
which directly affects their success in industrial productivity and competitive
position in international trade. A country's existing technological capability
supported by specific policy measures will also determine its ability to cope with
new future technologies. Technological capabilities are present on national and on
firm-level. The determinants of national technological capabilities are the rate of
growth of physical capital, human capital, technological effort and policies, trade
and competition policies and macro-economic environment. The final
manifestation of a nation's capabilities in industry is the competitiveness of its
manufacturing firms in the international market. Firm-level technological
capabilities mean entrepreneurial, managerial and technical capabilities.
Technological capacity of the host country is also crucial according to Cantwell-
Dunning [1991]. Where this capacity is weak, the investments of multinational
companies may drive out local competition in the given industry, gaining markets
from local firms who do not have enough resources to invest in R&D. Local
technological capacity may even be reduced further, thus, a vicious circle can be
created. If, however the local environment is innovative, and technological
capacity is adequate, the foreign investment can act as a catalyst to bring about a
virtuous circle, because the multinational affiliate increases local technological
dissemination, and the increased competition promotes local rivals to realise
further innovations.18 The important role of the local level of technological
development on the possibilities of taking advantages of the FDI spillovers was
also confirmed by the empirical study of Perez [1998] who examined the
innovative activity of American and Japanese multinationals in the EU. He found
that the technological content of their activity differs considerably among the
countries and innovative activity is concentrated in the more developed EU-
18 Econometric analysis of Narula-Wakelin [1996] also showed that the share of inward FDI is positively influenced by technological capability and human capital availability in industrialised

27
countries.19
The impact of FDI on human capital accumulation is likely to be relatively small,
because the existence of such a stock (well trained labour force) seems to be a kind
of precondition for FDI. However if the host country has passed a development
threshold, the transfer of technology by FDI increases the human capital. The
econometric results of Borensztein et al. [1995] prove that the effect of FDI on
economic growth is dependent on the human capital available in the host country.
The authors found a strong positive interaction between FDI and the level of
educational attainment.
Blomström et al [1994] suggests enhancing technological capabilities and transfer
by foreign multinationals by a host country policy which supports the efforts of
domestic firms to learn from foreigners. Thus increased competitiveness in local
firms narrows the technological gap with respect to foreign affiliates, this reduces
the demand for the affiliates’products and motivates them to bring in new
technology to restore or maintain their advantages. Government policy creating
competitive climate and improving labour quality proves to be important. The
importance of human resources is also stressed in the study of Kuemmerle [1999]
where after the analysis of the data from R&D laboratory investments the results
showed that a firm’s propensity to invest in R&D activities abroad rises with the
quality of the human resource pool and with the level of scientific achievement in
relevant sciences. Mello [1997] also confirms that the transfer of technology and
knowledge to the host countries is expected to be highest, the higher the level of
education of the labour force in the host country, the tougher the competition with
existing firms and the fewer the legal and institutional impediments to the
operation of foreign companies.
economies. Countries with strong national systems of innovation attract more FDI. 19 Apart from that the results also showed that the sectoral structure of R&D activity of American multinationals in Europe does not correspond to the known strengths and weaknesses of the given country’s industrial system, but rather to the investor country-characteristics and previous investment patterns. Japanese firms however are highly active in the leading sectors of the national productive and innovative system ofthe host country.

28
2.3. Effects on the production structure and growth
Several studies examine the effect of FDI on the host country’s production and
industry structure. Foreign firms can change the internal structure of a branch and
influence in this way production patterns. A major question here is whether the
entry of foreign firms explain industry structure or whether industry structure
determines if foreign firms enter or not. A further problem can be that there is
some confusion regarding effects endemic to multinational firms and those effects
that are only speeded up by the presence of such firms (Blomström-Kokko
[1996]).
A lot of studies are able to establish a positive correlation between foreign entry
and seller concentration in host country industries, however the causal links are
more difficult to prove. Blomström-Kokko [1996] points out that the general
assumption is that competition improves efficiency and welfare but there are cases
where it must not necessarily be the case. If foreign entry increases concentration
in relatively small national industries, resource allocation and efficiency
(economies of scale) may improve from the increase in average firm size. Local
circumstances are also important, for instance a fall in the number of competitors
from thirty to twenty is less harmful than from three to two. Apart from that,
increased concentration is worse in protected industries than in a liberal
environment.
The impact of FDI on growth can depend on the nation size. The two examined
countries in this thesis are different to this respect, Hungary is a small, while Spain
is a large economy. (Smallness is defined usually by small population and
geographic area and possibly by little or no market power.) Small nations are
generally open, trade dependent countries. The effects of FDI in these countries
can be bigger than in large ones and generally trade-augmenting (Castello et al.
[1997])20. On the macro-economic level small economies high propensity to
20 An example of a small nation's export-led growth via FDI is Ireland. O'Sullivan [1993]: concludes that Irish capital formation is positively linked to foreign direct investment and that foreign-owned firms have contributed significantly to the expansion and diversification of Irish merchandise exports. Generally, by reducing tariff barriers, subsidizing FDI and importing modern technology, the Irish economy enlarged its industrial base, reduced some of its export dependence from the UK, and achieved a remarkable GDP growth. However, FDI exacerbated the dualistic structure of the manufacturing sector, increased the import-dependence, could not

29
engage in foreign businesses implies a larger shift in the mentioned investment
development path than in the case of large countries, because small countries are
more dependent on inward investment in their early stages of development and
then become more strongly oriented to outward investment. In the case of small
countries FDI can help to overcome economic constraints, can bring new contacts,
new markets, access to new technologies, promote further openness.21
The empirical study of Balasubramanyam et al.[1999], by using data of 46
countries between 1970-1985 found that the effectiveness of FDI in promoting
growth depends also on the type of the trade regime applied in the host country.
The efficiency of FDI is higher (the coefficient of FDI is significantly higher in the
growth equation) in countries with export promoting policies than in those
pursuing import substitution strategy.
The connection between FDI and growth appears in those works which apply a
stages approach to the economic development. Such approach is the idea of an
"investment development path" introduced by Dunning [1981], which means an
association between a country's level of development (GDP/capita) and its
international investment (net FDI) position. The main assumption is that as the
country develops the conditions for domestic and foreign companies change
affecting the flows of inward and outward FDI. However, FDI affects the
economic structure as well, there is a dynamic interaction between the two.
According to the investment development path (IDP) theory countries may be
significantly decrease unemployment and the profit of the owned firms is repatriated. The example of Ireland warns to the costs of this strategy. 21 In the case of the small Central and East European Countries (CEEC's), Bellak [1997] points out that these countries have a long-term interest in inward FDI. They can import technology via the multinational companies, which can be applied in a flexible way by domestic small firms also, productivity increase and favourable location factors (like relatively cheap skilled labour) create an appropriate environment for large multinational companies for outsourcing and subcontracting. For today it is evident that the activity of large, capital-rich multinational companies has connected the CEEC's in the process of globalization. Similarly to other developing countries we can speak also here about an asymmetric interdependence. As for the CEEC's are on the "weaker side" of this interdependence, it has several negative effects for these countries. However, as Szentes [1999] veriFIE's the real alternative for these countries is not to stay out (the so-called "delinking") but to strive for making these asymmetric relations more symmetric. The role of national policies, the development of human capital is crucial in this respect.

30
classified into four main groups corresponding to four stages of development. In
the first stage there is almost no inward and outward FDI, domestic market is very
small, infrastructure is inadequate, labour force is mainly unskilled. There are
insufficient location specific advantages offered. The development of some
location advantages (like infrastructure) by local policies leads to the second stage
with more inward investment mostly aiming to the domestic market. Outward
investment is very little, domestic firms lack ownership advantages. In the third
stage the growth of inward FDI is less pronounced, at the same time outward FDI
is increasing, so the net inward investment per capita starts to fall.. Domestic firms
will be more competitive and stronger in domestic and international fields. These
tendencies will turn countries into a net outward investor position which is the
fourth stage. Ownership advantages of domestic firms are strong, and they have an
increasing propensity to exploit them internally in a foreign rather than a domestic
location. Intra-industry type trade is growing as a result of the growing similarity
to other countries' economic structure. As follows from this theory, the graphical
picture of the net outward investment curve is U or J formed if GDP/capita of the
countries is on the X axis.22
The analysis of Dunning [1981] is based on cross-sectional country data. It is
however difficult to fit the general theory of the IDP on a given country with long
time series data, because of country-specific factors which influence FDI.23
Another problem of this theory that it does not deal with the extent of causality
between FDI and GDP, the two trends are put beside each other. (According to our
view therefore this theory is rather a sort of speculative concept trying to apply
one scheme on the development of different countries.)
Similarly to the IDP theory, also four stages of competitive development of
nations were described in the often cited work of Porter [1990]. The initial stage is
the factor-driven stage, where the nation draw its advantage from the basic factors
22 More recently a fifth stage was included also into the theory which is characterised by high cross-border trade within multinational companies, converging economic structures of countries with more balanced international direct investment positions (see Dunning-Narula[1996]). 23 Buckley-Castro [1998] for example after analysing the Portuguese case concludes that a careful observation of the individual elements behind the IDP is necessary and that integration (joining to EFTA, EU) and political factors (end of dictatorship, changes in Central Europe) can be more important for the evolution of inward and outward FDI than domestic growth.

31
of production (natural resources or cheap labour pool, etc.). The range of
internationally successful industries is limited. Foreign firms provide most of the
access to foreign markets. Technology is sourced from other nations, the economy
is sensitive to world cycles. The second is the investment-driven stage, where
firms invest aggressively in modern facilities with modern technology. Foreign
technologies not just applied but improved upon by increasingly skilled workers.
At this stage firms still compete with relatively standardised products, production
is almost solely based on foreign technology, equipment. The role of FDI is
crucial. The next stage is the innovation-driven one, where firms not only improve
technology from other nations but create them. Research facilities and
infrastructure become more sophisticated, firms compete in more differentiated
industry segments. Services (marketing, engineering) are well developed. The last
phase is the wealth-driven stage, which leads to decline. Attention is paid to
preserve the achieved wealth, firms lose their competitive advantage, investment
declines, innovation is slowing down. Mergers and acquisitions are widespread to
reduce rivalry. Foreign firms begin to acquire domestic ones. The loss of
manufacturing positions leads to the rising share of services in GDP. It is
important in this theory that each country's trajectory differs within the stages, they
can jump phases and return to previous ones.
In general it seems reasonable to think that developing countries - especially open
countries - learn from those ones already advanced. The process of learning means
the existence of a hierarchy of economies in terms of stages of economic
development. The advanced countries transfer their knowledge and skills down to
the hierarchy (Ozawa [1992]). Regarding underdeveloped countries (neither Spain
nor Hungary belong to this group) however there can be cases when FDI hinders
domestic economic development and helps to maintain the old structures. Negative
effects of foreign capital inflow on the developing (third world and Latin-
American) countries are stressed by several post-keynesianist scholars24. In the
underdeveloped countries foreign investments can create enclaves, isolated
industries with foreign control and profit repatriation. The activity of multinational
companies can maintain or increase the dependence of underdeveloped countries
24 Main representatives are Myrdal,G.,Prebisch,R.,Singer,H.,Furtado,C., Hirschman,A.O.

32
from the developed ones. (About these and other views see Szentes, [1995] more
detailed).
The theoretical literature on the impact of FDI on growth is well surveyed by de
Mello [1997]. As he states, the basic shortcoming of the neo-classical growth
models as far as FDI is concerned is that FDI can only affect output growth in the
short run (while in the long run under the assumption of diminishing returns to
capital inputs the recipient economy would converge to its steady state). The
endogenous growth theory opened the way to research the effects of FDI on
growth in the long run. The impact of FDI is greater the greater the value-added
content of FDI-related production and productivity spillovers of FDI, which leads
to increasing returns in domestic production. FDI is also considered to be a source
of human capital augmentation and technological change in developing countries.
Via capital accumulation, FDI is growth-enhancing by helping the introduction of
new inputs and technologies in the production of the recipient countries.
Technology and knowledge transfer also leads to process innovations leading to
increasing returns and enhance different types of externalities.
The conventional way to model the impact of human capital accumulation on
growth is to define total factor productivity growth as a function of the level of
education or human capital stock. The contribution of FDI to economic growth
takes place in two ways (Borensztein et al. [1995]). On the one hand FDI increases
the overall level of investment and on the other hand FDI is more productive than
domestic investment which depend on the interaction with human capital. As far
as the overall level of investment is concerned, it can be influenced differently
depending on the type of FDI. Greenfield investments with new production
facilities have bigger contribution than acquisitions of interest in already existing
companies (Kozul-Wright-Rowthorn [1998]).
In his conclusions, de Mello [1997] points out that the association between growth
rates and FDI does not prove the causality or temporal precedence between the
two variables. FDI may take place in a developing economy because of its growth
prospects. The direction of causation between FDI and growth may also depend on
existing factor endowments, shortly: on the determinants of FDI.

33
II. General patterns of FDI inflows
Before we begin the examination of FDI patterns in Spain and Hungary it seems
advisable to offer a general picture of both economies. In this respect Table 1.
shows certain indicators of size, openness and development.
Table 1. Country profiles 1998 (percentage data based on current prices if not otherwise indicated)
Spain Hungary
Population, million persons 39.371 10.135 GDP per capita, USD 11506 4694 Share of agriculture in GDP 3.7 6.3 Share of industry in GDP 22.8 27.7 Share of services + construction in GDP 73.5 66.0 Import/GDP 28.2 55.1 Export/GDP 29.0 49.3 Share of agriculture in employment 8.0 8.2 Share of industry in employment 20.5 27.1 Share of services+construction in employment
71.5 64.7
Savings rate, % of disposable gross national income
21.6 25.9
Source: Banco Bilbao Vizcaya Informe Anual 1998, Central Statistical Office of Hungary It is well shown that the size (territory and GDP) of Spain is about four times
bigger than that of Hungary. It also turns out from the table, that in accordance
with the general belief, the small Hungary is a more open country than Spain in
terms of the significance of foreign trade. The structure of the economy is
somewhat different, the agricultural sector has two times a larger weight in the
Hungarian GDP than in the Spanish one (the share in employment is however not
so different, which can hint to efficiency differences). The role of the service
sector is bigger in Spain than in Hungary.
Now that we have a general image of both countries, the characteristics of the
registration method of FDI in each one should be mentioned. In Spain there are
differences between two sources of data, the Directorate General of Foreign
Transactions (DGTE) and the Balance of Payments. The Balance of Payments
made by the Banco de Espana (from 1991) collects the net flows of investment,
does not include contributions in kind and the investments of foreign affiliates

34
residents in Spain. The DGTE registers authorised FDI projects, which are
sometimes quite different from the realised ones in that year and only considers
projects with more than 50% foreign ownership. As a third source two enquiries to
firms should be mentioned: the firm balance sheet survey elaborated by the bank
of Spain („Central de Balances”) and the questionnaire-survey called „Encuesta
sobre Estrategias Empresariales” (ESEE) elaborated for the Ministry of Industry
and Energy.
In Hungary the National Bank registers FDI inflows as a part of the Balance of
Payment, including equity capital and intra-firm loans from 1996. Data referring to
the stock of FDI are derived from yearly national currency inflows cumulated
since 1989 and converted at year-end exchange rate. Contribution in kind is
registered by the Ministry of the Economy. Another source of data is the
Hungarian Central Statistical Office (CSO), which collects FDI data based on the
annual corporation tax declarations, which include the value of the stock of issued
capital and its distribution by sector of ownership. The CSO also makes an annual
survey covering 5000 foreign investment enterprises.
1. Trends and main features of FDI inflows in Spain and Hungary
During the hard dictatorial period of Franco there was hardly any foreign
investment inflows in Spain. Since the sixties, however, following the Stabilisation
Plan of 1959, foreign investment has been growing at a rather high path with a
boom in the years after the adhesion of Spain to the EU. During the eighties,
besides the United Kingdom Spain was the country within the EU which attracted
the most foreign direct investment. Yearly FDI inflows has amounted to 1-3% of
GDP (see graph 1). FDI inflows are also significant expressed as a percentage of
gross fixed capital formation, fluctuating between 5-10% (see table A1 in annex).
Regarding the composition of the flows, between 1990-1996 on average
approximately 5% of FDI inflows were greenfield, 48% take-over, 41% capital
increase in existing firms and 6% intra-firm loans25. Concerning the stock of FDI
in Spain, it made up 23% of the GDP in 1999 (see table A1).
25 Ministry of Industry and Energy data

35
Graph 1. FDI inflows in percentage of GDP
0123456789
10
1986 1987 1988 1989 1990 1991 1992 1993 1994 1995 1996 1997 1998 1999
Spain Hungary
Source: IMF Financial Statistics Yearbook 1998 and national bank data for 1999
In the case of Hungary, as in the other Central European countries, the real activity
of foreign investors began only after the collapse of the communist system, so later
than in Spain. In the first half of the nineties, Hungary was the most attractive
Central European country for the foreign investors. Thus, at the end of 1999 FDI
stock per capita in Hungary was around USD 2000, the highest in the region. The
stock of FDI is very high in relation to the GDP as well (40%), higher than in the
Spanish case (see table A1 in annex). According to national bank data, in end-
1999 the stock of FDI without contributions in kind amounted to US$ 19,5 billion,
while FDI stock with contributions in kind accounted for US$ 20,9 billion.
Regarding FDI inflows, two years, 1993 and 1995, show outstanding results
attributable to large privatisation deals (see graph 1. and table A3). Since 1996
there were no big privatisation projects of this kind, although FDI inflows have
been stabilised around yearly USD 2 bn.
As far as the composition of FDI is concerned, until the end of 1996
approximately 20% of the foreign capital inflows in Hungary took the form of
greenfield investments, which is a relatively high share in the CEEC region. The
220 greenfield projects represented a value of US$ 3,05 billion, more than half of
which stemmed from only seven multinationals26 (Dicházi [1996]). Until 1996 the
26 Guardin Glass, Philips, GM, Audi, Suzuki, Ford and IBM

36
majority (41%) of the FDI inflows took place within the framework of
privatization, but later on, as privatisation has been completed this share
decreased. The intra-firm loans, which are considered to be also an FDI has been
fluctuating, being 9% of the FDI inflow registrated in the balance of payments in
1996, 27% in 1998 and 13% in 199927.
Regarding the geographical origin of foreign investments in Spain, the OECD
countries have always had the an almost 100% share. After Spain became a
member of the EU, the share of the member states increased by almost 20%. The
EU has become for today the most important source of FDI (Table A2). The main
investors are France, Germany, the UK and the Netherlands (this latter mainly as a
transit country because of the tax allowances there) . 28 The share of the United
States has decreased radically: while between 1960-79 it represented on average
33,4% of total FDI, between 1991-96 it was only 6,8%. However, the
reinvestments of foreign (many American) affiliates already resident in Spain
made up 23% in the latter period. Regarding the whole FDI stock, Germany and
the USA are the main investors. In the case of Hungary Germany, Austria, the
United States and the Netherlands are the largest investors, the latter having the
same transit role as in Spain. Reinvested capital is not registered in Hungary, but
regarding the FDI via privatisation between 1990-1999 we do have a geographical
distribution of investments: 25.3% came from Germany, 13.2% from the USA,
8.9% from France and 5.2% from Austria.29
Regarding the sectoral distribution, up to the eighties, foreign capital preferred the
Spanish industrial sector, 70% of the total FDI flowed into the industry between
1960 and 1985. After the second half of the eighties (after the adhesion of Spain to
the EU) however, the service sector (mainly financial services) took the leading
role. As a relatively recent phenomenon, the position of the industry as a
destination of FDI seems to strengthen again, which coincides with the general
reinforcement of Spanish industrial development and the slowing down of the
desindustrialisation process. The food, electronic, automobile, chemical branches
have been the manufacturing sectors most favoured by FDI. Penetration of foreign
27 Data of the Hungarian National Bank 28 In 1996 for example 23% of FDI inflow came statistically from the Netherlands into Spain, but only 4.6% had the real origin in the Netherlands (Ministry of Industry and Energy data).

37
capital is the highest in rubber and plastic-producing sectors and in transport
equipment (see table 2).
Regarding Hungary, partly as a consequence of the privatisation process,
manufacturing sector has been the most attractive for FDI but also the role of
energy sector and services is important in this respect. It is interesting to observe
from table 2. that the distribution of FDI among manufacturing sectors have been
rather similar in Spain and in Hungary: food, vehicle, electrical machinery and
chemical sectors have been the main target. This phenomenon, (which is
regardless of country size) can be explained by the fact that these are such
„globalised” sectors, which are everywhere attractive for foreign investors.
However there are certain differences. For example the share of food and electrical
machinery sector is greater in Hungary, while in Spain the share of chemicals and
motor vehicles is higher.
Table 2. Distribution of FDI among manufacturing sectors Spain
1988-1990 Spain
1991-1997 Hungary end 1997
High demand and technology
26.2 27.7 23.3
Chemicals 17.4 18.5 11.1 Office machinery 4.0 0.6 0.7 Electrical mach., radio, TV sets, medical, precision instruments
4.8 8.6 11.5
Medium demand and technology
26.4 27.2 20.0
Rubber and plastic 5.6 3.8 4.5 Machinery and equipment n.e.c.
2.2 2.5 5.1
Motor vehicles, transport equip.
18.3 20.2 9.4
Furniture, manufacturing n.e.c.
0.3 0.7 1.0
Low demand and technology
47.4 45.1 56.7
Food, beverages, tobacco 10.9 16.3 26.2 Textiles, clothing, leather 2.2 1.7 4.7 Wood, paper and printing 13.6 7.1 6.5
29 Data from State Privatisation Agency (www.apvrt.hu)

38
Minerals and non-met minerals
14.6 16.6 6.3
Ferr. and non-ferrous metals 1.5 1.0 5.6 Basic and fabricated metals 4.6 2.4 7.4 MANUFACTURING 100 100 100
Note: Data for Spain are the distribution of accumulated FDI inflows into the manufacturing industry in the period indicated. Data for Hungary show the distribution of foreign capital in the manufacturing enterprises as of the end of 1997.
Source: Hungarian Central Statistical Office, Martín [2000]p.188.
Data on the weight of foreign investment enterprises in the manufacturing sectors
(foreign penetration) could be especially interesting. In the Spanish case however,
any information of this kind is only available for the end of the eighties and the
beginning of the nineties. These data were obtained by the estimations made by
studies. According to Iranzo [1991] foreign investment enterprises represented
27.7% of the manufacturing value-added in 1988. Martinez-Myro [1992]
estimated that 36.5% of Spanish industrial production was controlled by foreigners
in 1990. On the basis of the results of Martín-Velázquez [1993] foreign investment
enterprises (defined as having more than 10% of foreign capital) had a 59.4%
share in the production, 58.7% in the value-added and 50.5% in the employment of
the manufacturing sector in 1989. According to Merino-Salas [1995] who use
enterprise survey data and consider as foreign enterprises those where the share of
foreign capital was higher than 30% in the social capital of the company, the
30.7% of manufacturing value-added in Spain was controlled by foreigners in
1991. The latest estimation elaborated by Martín-Velázquez [1996] for the year
1993 obtained that 44.5% of manufacturing social capital was in foreign hands.
Foreign penetration (defined as the pure foreign share in the total nominal capital
of the sector) in the Hungarian manufacturing industry increased rapidly in the
nineties. In manufacturing as a whole, the share of foreign capital was 59.7% in
1998 (see table A4). If we take the total capital of foreign investment enterprises
into consideration, their share in the sectoral nominal capital is even higher: in
1998 it was 72.7%. Regarding the value-added of the manufacturing industry, 69%

39
of it was given by foreign participation firms in 199830.
Table 3 shows the most penetrated branches (where the share of foreign capital is
above 50% of the total capital of the sector) in Spain (here the latest available year
is 1993) and in Hungary. First it can be seen that the number of such branches is
much higher in Hungary than is Spain and second that certain branches are
similarly highly penetrated in both countries. Presumably in Spain the number of
the most penetrated branches increased since 1993 considerably.
Table 3. Manufacturing sectors above 50% share of foreign capital
Spain, 1993 Hungary, 1997
Rubber and plastic (79.8%)
Transport material (68.1%)
Chemicals (57.9%)
Industrial and agricultural machines (51.4%)
Tobacco (92.0%)
Electrical machinery (78.7%)
Office machinery (73.9%)
Motor vehicles (72.0%)
Other non metallic minerals (71.2%)
Paper products (66.7%)
Chemicals (60.3%)
Food (60.1%)
Rubber and plastic (57.3%)
Radio, TV sets (53.2%)
Textiles (53.1%)
Wood (52.1%)
Note: Data in Spain refer to the social capital of the sector, in Hungary refer to the nominal capital.
Source: Martín-Velázquez [1996] p. 169. and calculations from Hungarian Central Statistical Office data (see table A4)
In Hungary the share of foreign investment enterprises (FIE's) in the employment
of the manufacturing sector has slightly grown, it was 31.6% in 1993 and 44.8% in
1998. FIE's share in employment has increased much less than their share in
nominal capital. There are some branches where almost all of the workers are
employed by FIE's (tobacco, electrical machinery). As Table A5 shows FIE's also
have a determining role in the net sales revenue (70%), and total export of the
branches (85.8%). As far as capital intensity is concerned, in general FIE's are
30 Central Statistical Office data

40
better endowed with capital than domestic companies in the manufacturing
industries. FIE's are relatively more capital intensive and function with fewer
employees than domestic firms.
Overall, considering the role of FDI in both countries we can state that the
macroeconomic weight of foreign direct investments in terms of GDP and GFCF
is higher in Hungary than in Spain. The picture is similar at the level of
manufacturing industries where foreign penetration seems to be also much higher
in Hungary (although comparison is difficult because of the lack of Spanish data
on this topic). As far as the distribution of FDI is concerned, similar, also
internationally popular branches proved to be attractive for foreign investors in
both countries.
III. Location-specific advantages of Spain and Hungary
In terms of the mentioned OLI framework of determinants of FDI, in this chapter
we concentrate on the location-specific advantages of Spain and Hungary as two
host countries. In both countries we observed an upsurge of FDI-inflows in the
periods after the major economic liberalisation. Apart from the degree of
liberalisation of the economy and other regulatory issues with a direct influence on
FDI, other factors such as the macro-economic (monetary- and fiscal policy) and
macro-organizational policies (industrial-policy, R&D-policy and infrastructure
development), which seem to determine the location attractiveness of a country for
FDI will be a analysed here.
1. Macro-economic environment and economic policy
Before the accession to the EU, between 1975-1985 the Spanish economy was in a
deep recession caused mainly by the oil-price crisis. Level of unemployment
jumped above 20%, inflation increased. Until 1982 there was also a political
uncertainty characterised by conflicts among parties, constitution building and the
attempt of military coup. From 1982 on, the socialist party strove for overcoming
the crisis and preparing the country to integration. Between 1986 and 1991 came a
new growth period already within the European Union (see graph 2). At that time

41
the economy boomed, investment rate was extremely high, unemployment
decreased. In 1992-93, following the crisis in the European Monetary System,
Spain was hit by the recession, which was overcome from 1994.31
Graph 2: Real GDP (percentage change from previous period)
-12
-10
-8
-6
-4
-2
0
2
4
6
1986 1987 1988 1989 1990 1991 1992 1993 1994 1995 1996 1997 1998 1999
Spain EU Hungary
Source: OECD Economic Outlook 1998, IMF Financial Statistics Yearbook 1998
Before the accession the Spanish economy used to suffer from some
macroeconomic problems: high inflation, high public and foreign trade deficit,
excessive state intervention (Fuentes Quintana [1999]). Traditionally high
unemployment also should be mentioned here, to which the high share of young
people, women and long-time unemployed is characteristic. As far as the foreign
trade deficit is concerned (see later in chapter IV), it should be noted that in the
balance of payments this has been to a large extent counterbalanced by revenues
from tourism, FDI inflows and financial transfers from EU funds.
Regarding the chronic problem of public deficit and debt, public deficit could be
reduced between 1985-89, because of increases in state revenues (for example
31 It should be mentioned that the amplitude of the growth cycles is always larger in Spain than in the EU, partly caused by the fact that the EU cycle is an aggregation of 15 countries, but partly caused by the specific economic and political factors in Spain.

42
from VAT introduced). At the end of the eighties, however the industrial
reconversion programmes, the deficits of public companies, the state investments
(celebration of 1992) contributed to the increase of the public deficit. As an
achievement of the consequent application of the National Convergence Plan,
public deficit decreased constantly from 1995. In 1998 its level was only 1.5%
which was another major achievement on the road towards EMU. The deficit of
the Social Security system could be reduced. Also, the social and health system
was reformed. Subsidies to certain state companies were abolished, wages of the
public sector were fixed, some public investment projects were cancelled.
Revenues were increased from privatisation. Restrictive measures could be made
acceptable to the people, because EMU membership was perceived as a common
aim. In this respect the economic policy of the government was successful: in May
1998 the country was qualified to be among the 11 founding members of the
EMU. In 1999 the public deficit was further reduced to 1.1% of the GDP.
Inflation has been another chronic problem of the Spanish economy. One
important aim of the monetary policy has been its curbing. The most important
characteristic of the Spanish inflation is its duality, which means that the increase
of service sector prices tend to be significantly and increasingly higher than that of
the industry (Fuentes Quintana, [1999]). This tendency could be observed since
the seventies and did not improve after 1986. This duality of prices can be mainly
explained by two reasons: the higher improvement of the productivity in the
industry and by the higher level of protection and the stronger regulated
framework prevailing in the service sector. More recently, however the service
sector has been experiencing a process of liberalisation and deregulation. The
latter combined with strong monetary policy, contributed to the spectacular
decrease of the inflation along 1995-98, which has been one of the most salient
features of the convergence process. In 1998 the rate of inflation was only 1.4%.
The year of 1999 brought a certain increase in the inflation to 2%.
During the first years after the accession the peseta depreciated substantially but
when in 1989 Spain became a member of the European Monetary System, the
strengthening of the inflow of capital lead to an appreciation of the peseta. So that
in the early nineties the peseta had to be devalued: between 1992-93 it was
devaluated three times (by 5%, 6% and 8%) under the speculation attacks. In June

43
1994 the Parliament approved legislation granting the Bank of Spain autonomy
according to the spirit of the Maastricht Treaty. The target of reducing inflation
was announced. In the beginning of 1995, following the turbulence in the
international capital markets a further devaluation of the peseta became necessary,
this time by 7%. Since then, however the Spanish currency is stable and has
remained close to the central parity. In 1998 the exchange rate of one euro was
fixed in 166, 386 pts.
With the accession of Spain to the EU, a trade liberalisation program was
adopted32. Export tariffs had to be immediately abolished. Import tariffs for
industrial goods were gradually reduced to zero by 1992. Tariffs for agricultural
goods coming from the EU also had to be reduced to zero in seven years except for
fruits and vegetables (here the transition period was ten years). Spain also had
seven years to apply the Common External Tariff of the EU. Quantitative
restrictions also had to be reduced drastically with EU-membership.
Graph 3. Selected macro-economic indicators of Spain
-10
-5
0
5
10
15
20
25
1986
1987
1988
1989
1990
1991
1992
1993
1994
1995
1996
1997
1998
1999
unemployment inflation public deficit/GDP current a./GDP
Source: European Economy 1998 no.65 and national bank data for 1999
32 The first liberalization program was introduced in 1959 with the economic Stabilization Plan. Steps were made towards the convertibility of the peseta, the progressive abolition of the quantitative import restriction was decided and regulations concerning foreign capital were liberalised (free repatriation of capital and profit). The Stabilisation Plan based the growth of the following decades.

44
After giving a rather short overview of the macro-economic situation, let us see the
characteristics of the legal framework for FDI. The first normative rules
concerning FDI were defined in 1974 by the 3021/74 Decree of Regulation of
Foreign Investments, which laid the basics of a liberal regulation. With the
entrance in the EU, a Law on Foreign Investments was created by the Royal
Decree of 2077/1986, which established the principles of regulation. According to
these, more than 20% capital foreign ownership in a company was considered as
FDI. Investments of foreign residents in Spain were only considered foreign
investment if it was realised with foreign capital. Basically three type of foreign
investments were defined: direct investments, portfolio investments and
investment in real estates (Fernández,Y. [1993]).
After EU-adhesion, foreign investments were further liberalised. Spain had to
adopt EU Directive 1988/361 on foreign investments. The only restrictions remain
towards non-EU investors in sectors with special regulation, such as gambling,
television, radio, defence sectors and air transport (Duce, [1995]). Investment in
these sectors are regulated by separate legislation, prior authorisation is necessary.
From the 1st of February 1992, Spain eliminated every restriction on capital
movements. The Royal Decree 671-672/1992 of July changed and simplified
foreign investment regulations. The number of cases requiring prior government
approval was reduced by raising the value and control criteria for foreign
investments. All investments in Spain undertaken by non-residents are considered
foreign investments, irrespective of the source of the funds. The classification of
FDI was also changed, following the IMF and OECD regulations above 10% of
foreign equity share can be considered as direct investment. Also real estate
investment is registered as FDI (Gual-Martín, [1996]).
Regarding the incentives of investment, these do not depend on the nationality of
the investor. The same rules are applied for domestic and for foreign investors.
Discrimination of any kind is not allowed by the EU-rules. Foreign investors,
equally like national ones, can benefit from general types of incentives. One type
is the general state incentives in the tax system (possibility of several kinds of
deductions).
Another type is the regional incentives in specific economic zones. These are

45
called Economic Promotion Zones (regions with the lowest amount of economic
activity and income) where a certain part of the investments can be subventioned
by the state (in 1996 for the 373 approved projects the average share of state
subvention was 15.8% in these areas33). National level incentives are coordinated
by the Ministry of the Economy. Local authorities and regional governments can
also provide incentives. Regarding the high level of regional autonomy, these
incentives have a significant role in Spain.
It can also be considered a further type of incentive that participation in EU
programmes and application for structural fund support is viable also for foreign
participation firms.
An important form of acquisition of domestic companies by foreigners can be
privatization. The privatization process in Spain accelerated in the mid-nineties. A
major reason for this was the necessity for state revenues to decrease the public
deficit, which was a condition of the EMU. Between 1985-1996 the number of
privatized companies was 77 and the revenues reached 19 billion USD. In 1996
the Modernisation Program of the Public Enterprise Sector was accepted which
gave an impetus to privatization (Ferreras [1998]). The programme was based on
separating the management and the ownership of the public enterprises, applying
transparency and favouring those bids which maintain employment and make
investments34. Between 1996 and 1998 21 companies were privatized for USD 18
bn.35
Regarding the new owners of the privatised companies, it is interesting to note that
there are hardly any foreign (strategic) investors. The majority of the firms were
privatised on the stock exchange, or were sold to national firms or groups. Spanish
banks obtained important shares in these companies, maintaining the strong links
33 Informe sobre la Industria Espanola 1996-1997, vol.I. p.328. 34 The privatisation programme divides public companies into four groups. To the first belong companies with natural monopoly and good profitability. These companies have been already sold. In the second group are those which are in potentially competitive sectors. To the third group belong those, which were not to be privatized because of social or strategic reasons, but despite that certain companies have already been given to private hands. The fourth group consists of companies which are downsizing and need to be restructured before selling. The national airlines, Iberia is also in this group. 35 The state sold its remaining shares in Telefónica, Repsol (oil), Gas Natural, aluminium and steel company, bank group Argentaria, in Endesa (electricity), Tabacalera and in Retevisión (telephone).

46
between banks and industry. Up to certain periods (3-10 years) the state still holds
a so-called "golden share" in the privatized blue-chip companies, which means a
prior authorisation of strategic decisions or control of more than 10% shares in
these companies.36
Turning now to the Hungarian case, it is worth mentioning that as shown in Graph
1, Hungary suffered a deep recession in the beginning of the nineties stemming
from the transformation shock. The GDP growth recuperated for 1994 and since
1996 an intensive increase can be observed. Economic policy concentrated on the
establishment of a market economy in the first years after the political changes and
this policy has generally been favourable to foreign investors.
In macro-economic terms, two main areas have been of major concern in the
nineties: the current account balance and inflation. The external position of the
country took a serious turn in 1994/95. The current account deficit reached 9% of
GDP and debt service obligations accumulated alarmingly. The periodically
returning speculative attacks, the worsening external financial conditions and the
reversal of capital flows reflected ever-increasing macro-economic problems.
Ultimately, these developments induced the government to introduce tough
stabilisation measures, promote rapid privatisation and take initial steps towards
reforming the public sector. These measures met their objectives of improving the
external and internal equilibrium. In 1998, the current account deficit was 4.8% of
GDP and a new phenomenon was the significant, nearly 1 billion USD profit
transfer of FIE's from the country. This transfer was realised by only a few
multinational affiliates. It is no wonder that as the major investments matured,
production and exports increased, significant profit was created. Furthermore, the
mother companies may have compensated the losses caused by the Asian crisis in
that year by drawing on profits from other regions. The inward FDI/repatriated
profit ratio in Hungary is still not low in international comparison, in 1998 it was
1.6, which can be compared to the Spanish figure of 1.8 in 1997. (Hunya [1999]).
36 This “golden share” was criticized by the European Commission in its memorandum to the Spanish Government in July 1999 considering it as a restriction for the free circulatuion of capital.

47
In 1999 the repatriated profit from Hungary was less than in 1998.37
Since 1990 the main emphasis in Hungarian monetary policy has been on
restraining inflation as liberalisation in the early 1990's bore inflationary
consequences. Exchange rate policy was also directed towards reducing inflation.
Reducing inflation is important also from the foreign investor's point of view.
According to one survey (Éltető-Sass [1997]), inflation was the greatest barrier to
the proper functioning of joint ventures in Hungary. 85% of the companies in the
survey considered inflation to have an essentially negative impact on investment.
Inflation and the anticipation of future policy actions to control inflation increase
the uncertainty of the economic environment and can depress investment.38
Regarding trade policy, as a consequence of the free-trade agreements and the
application of the Uruguay Round results, the greater part of Hungarian foreign
trade is already free of customs duties; free trade of industrial goods with the EU
has already been achieved. For agricultural and food products, EU-membership
will determine the rules.
Graph 4. Selected macro-economic indicators of Hungary
-15-10
-505
101520253035
1990 1991 1992 1993 1994 1995 1996 1997 1998 1999
Unemployment InflationPublic deficit/GDP Current a./GDP
Source: OECD Economic Outlook, National Bank of Hungary
37 USD 883 million, according to National Bank data 38 As Buiter et al. [1996] write: "Any factor influencing the cost to firms of entering into contracts.....will affect enterprise performance. The macro-economic environment is an important determinant of the transaction costs incurred among enterprises". (Buiter et al [1996] p. 19) High inflation is one of the factors responsible for high transaction costs.

48
As far as the general legal framework for FDI is concerned, companies with
foreign participation are treated in principle as national companies; they are sub-
ject to the Hungarian legal system. Since 1972 it has been legally possible to
establish companies with foreign capital. However, the "breakthrough" in this
aspect came with the XXIV/1988 law pertaining to foreign investments in Hungary.
This law displayed very liberal features. Apart from basic legal guarantees, it
provided important allowances for foreigners. 39
Some specific activities may only be carried out by foreigners under a specific
concession, such as the defence industry or essential services (for example
transport, gambling and mining). Reservations towards foreigners apply to
acquisition of a license for domestic air transport, a license to operate in
international waters and to the provision of asset management services to domestic
compulsory private pension funds. Investments by foreign investors enjoy full
protection and security, dividends received by a foreign investor can be freely
transferred.
A very important regulation of the XXIV/1988 law of foreign investment is the
provision governing customs-free zones. Companies with foreign participation
may establish their own customs-free zones under the control of the customs
authorities, within which they are regarded as foreigners for the purposes of
exchange control and foreign trade. They maintain their accounts in foreign
currencies but are subject to Hungarian taxation with the exception of VAT. These
zones have proved to be especially attractive for foreign companies which export
significant quantities of finished or semi-finished goods made from imported raw
materials and components (see Chapter IV.).40
From January 1998 on, a new foreign investment law was enacted replacing the
39 Until November 1995 the foreign investment law provided for exemption from customs duties in cases of contribution in kind. 40 The regulation of these zones will have to be be changed after the adhesion of the country to the EU. According to the "Avis" on Hungary: "the exact scope of the activities performed in these numerous free trade zones will require close examination in relation to Community legislation". Therefore probably these zones will function until the moment of accession and then converted to normal firms without retroactive cost burden.

49
law that had been in force for the past ten years.41 The fundamental principle of
the law is that foreigners enjoy the same protection as domestic firms. Granting
permission to establish foreign branches is a new feature incumbent upon
members of the OECD. These branches (mainly branches of banks and financial
investment companies) are part of the foreign company, but individual
organisations at the same time. The regulations no longer make a distinction
between affiliates and branches of foreign companies.
For foreign participation enterprises the most important part of the taxation system
is the corporate profit tax. Until the end of 1994 enterprises paid a 36% corporate
profit tax (down from 40% in 1993). From January 1995, the corporate profit tax
was set at 18%, which is not high by international standards.
In the beginning foreign investors received important tax allowances.42 These
remained generous up until the 31. of December 1993 when they were abolished
altogether. In 1994, however, individual tax allowances could be obtained in
respect of foreign investments of outstanding size and importance. The CVI/1995
law amending the corporate tax law already referred in equal terms to domestic
companies and joint ventures.43 From 1998 on, new incentives entered into force.
These incentives are related to the companies in underdeveloped areas where
unemployment had stood at more than 15% for one or two years prior to
investment. In this instance, the investor is exempt from payment of corporate tax
for ten years if: 1. The value of investment is more than HUF 3 billion, 2.
41 It describes three forms of foreign investment or presence: (i). companies with foreign participation (they can establish or buy other companies); (ii). branches without legal entity; and (iii) representation office (not entitled to conduct any business ). 42 The XXIV/1988 law provided foreign investors a 20% reduction in corporate tax if the foreign share in the base capital was at least 20% or HUF 5 million. A tax-reduction of 60% during the first five years and of 40% for the following five years was available if more than half of the company’s net sales revenue was earned from manufacturing activities and the total base capital exceeded HUF 25 million, of which at least 30% was held by foreigners. These allowances were increased to 100% and 60% for qualifying companies engaged in one or more priority activities specified in the annex to the law. These priority activities included electronics, production of components for vehicles, production of machine tools, machinery components, production of pharmaceuticals, production of food-processing products, agricultural production, tourism, public telecommunication services and production of equipment and products for environmental protection. 43 Firms became eligible for a 50% tax exemption, if they effected an investment after 31 December 1995 to the value of at least HUF 1 billion and if they yielded a 25% or at least HUF 600 million increase in exports. In addition to that, if firms invested in regions where the unemployment rate was at least 15%, they could under certain conditions obtain a 100% tax

50
Company turnover increases by at least 5% of the investment value; and 3. At least
100 new workers are employed. The ten-year exemption is not regionally limited
if the investment exceeds the value of HUF 10 billion and 500 new jobs are
created.44
Apart from the tax system, investment promotion measures are also important.
These play a diversionary role in regional and sectoral investment. The
government has established a number of funds with the objective of promoting
both domestic and foreign direct investment. These funds are financed, some
partly, others entirely, from the state budget and provide mainly cash support or
subsidised loans for investors.45
A recent incentive facility for investors, among them foreigners, has been provided
with the possibility of settling in industrial parks. In 1996, the government
approved a three-year programme for the creation of a country-wide network of
industrial parks. At the end of 1999 the number of firms in industrial parks is 668,
they employ 60 000 persons and their productivity is higher than the average in the
manufacturing sector46.
A further important form of incentive is the local support provided by the
authorities at the county and city level. They lend particular assistance to new
projects or those which are likely to revitalise failing enterprises. Possible
examples are the provision of cheap land; assistance in finding and training
employees; provision of infrastructure investments; and introductions to other
reliable local suppliers.47
rebate. 44 IBM Storage Products benefited from this allowance because of its US$40 billion investment in extending its factory. General Electric and the Japanese Sinwha also realised major investments in East-Hungary. 45 The main fund available for the support of foreign investments in 1991-1994 was the Investment Incentive Fund. This fund was established specifically to support inward-oriented investment in high technology. In 1995 the Government created the Economic Development Fund managed by the Ministry of the Economy which supports domestic and foreign entrepreneurs alike. In 1998 several partly foreign owned companies received support from this fund. 46 Ministry of Economy data 47 Apart from the official programmes, several organisations and associations of foreign investors help to improve domestic conditions for foreigners and represent the interests of investors. The most important organisations are the mixed chambers and the Joint Venture Association which can examine and comment on draft acts and amendments as well as make suggestions. It can also enter into direct contact with lawmakers and authorities. It also provides

51
Privatisation policy as such began in 1990. As of 1998 the vast majority of the
state’s assets had already been privatised. The first privatisation concept was based
on selling firms for cash on a competitive basis (through public and private tenders
or capital market operations). As Hungarian investors had practically no capital,
foreigners participated in the privatisation process. After a period of relative
slowdown, from 1995 onwards the privatisation process speeded up as government
strategy was defined: the aim being to increase cash revenues, augment capital
investments and promote the participation of foreign capital in the process. These
principles were applied in the privatisation of some "strategic" branches such as
electricity, gas, petroleum, telecommunications and banks. The group of firms in
long-term state ownership was reduced. Between 1990-1997 revenues from
privatisation reached USD 13 billion. In 1998-1999 privatization revenues were
around 1 billion USD48.
2. Technological capacity
A major concern of industrial policy in both countries is to raise the level of
research and development. As mentioned in Chapter I., the technological level and
technological capacity of the host country is of crucial importance in the
technological transfer process realised by FDI. Regarding Spain, since the Law of
the Science and Technology approved in 1986, the government has been paying
more attention to the goal of increasing R&D expenditures. In fact, since then R&D
expenditures increased spectacularly. With the adhesion to the EU, Spain was
connected to the international and European research and development activity.
However, in 1998 still 0.9% of the GDP was allocated to R&D (the EU-average is
1.91%), in which the share of the companies was 49%. Even smaller, 12% was the
share of the innovative companies within the firms. As Martín [2000] points out,
the stock of technological capital in Spain represented only 37% of the EU-
average in 1998, in spite of the convergence realised from 1986 (then it was 21%)
in this respect. Regarding the “output” side, in the case of scientific publications
first-hand information to members, establishes contacts with prospective partners and organises social events.

52
and number of patents Spain is also behind the European average, despite the
improvements in the last decade.
The government realised that one way to produce higher value-added and to
increase competitiveness is to promote technological development and innovative
efforts. Therefore the National Plan of Technological Research Development and
Innovation for 2000-2003 aims to increase R&D expenditures to 1.2% of the GDP
and to raise the participation of the enterprise sector to 60%49.
The role of human capital endowment in attracting FDI and in the technology-
transfer is unquestionable. This also belongs to the technological capabilities of a
country, which affects productivity and growth. Measured by the population with
superior or alike formation, Martín [2000] estimates that the stock of Spanish
human capital was 65% that of the EU-average in 1997. This stock however
increased at a much bigger pace in the last decade than in the EU. In 1982 the
number of researchers for 1000 persons was 1, and in 1998 it was 3.3. Researchers
are younger than the EU-average, which brings dynamism to the innovation
system. The share of Spanish scientific publications in such publications of the
world increased from 0.8 to 2.3 between 1982 and 1995 (Dorado-Rojo [1991] and
Martín [1999]. In certain fields (biology, health, chemistry) Spanish scientific
results are outstanding. Campa-Guillén [1996] enumerates three fields of Spanish
technological strength: industrial machinery, motor vehicles (firms make more
than 90% of R&D expenditure here) and fabricated metals (here the government
share of R&D expenditures is approximately 20%).
Table 4 shows certain indicators of technological background of Spain and
Hungary. It can be seen that the figures are not very different in the case of the two
countries, with the exception of the education indicator, where Spain was more
backward in 1996 than Hungary. The share of enterprise sector in the R&D
expenditures is higher in Spain.
48 Source: Privatization State Agency 49 Promotion of entrepreneurial R&D activities is carried out in frames of concerted projects of the National Plan. A considerable part of the budget is directed towards medium or small sized enterprises. From 1989 a company making R&D activity can receive a tax allowance can decrease its corporate profit tax by the sum of 30% of its invested capital into new products or processes.

53
Table 4. Selected indicators of technology level and human capital 1996 Hungary Spain Total R&D expenditures in % of GDP
0,66 0,87
Share of government in R&D expenditures %
50,0 43,9
Share of enterprise sector in R&D expenditures %
38,9 45,5
Share of foreign financing in R&D expenditures %
4,6 5,6
R&D employees/1000 inhabitants 4,9 5,4 Scientists & engineers in R&D per million people 1985-95
1033 1217
Number of patents/10000 inhabitants
0,8 0,6
Public expenditure on education in 1996
4.7 4.9
Share of population with at least secondary school in total population between age 25-64,%
63 30
Source: OECD Main Science and Technology Indicators 1998 and OECD: Education at a Glance 1998, World Bank World Development Report, 1999/2000
In Hungary R&D expenditures accounted for 1.61% of the GDP in 1990 and for a
mere 0,70% in 1998. The majority of expenditures (52%) is funded by the state;
the role of firms is relatively small, 40% and 8% stems from abroad.50 However,
the share of companies in R&D expenditure has been growing since 1993 after a
period of decline.
As an incentive for companies, tax regulations in force since 1997 provide one
allowance: R&D costs of 120% are tax-deductible. As of 1988, the government
launched a new incentive for companies investing at least HUF 500 million in
R&D and employing at least 30 researchers. These companies are eligible for state
support up to 25% of the amount invested in R&D. Support can be obtained via
tender.
As far as human capital endowment is concerned, the CEECs have their own
peculiarities stemming from the old regime, which is true for Hungary also (Inzelt
[1998]). The adaptation level of companies was low, and firms were left outside
50 Hungarian Central Statistical Office data for 1998.

54
the international networks and alliances, technology remained outdated, etc.
Despite the distortions of the system, its collapse left a very substantial human
capital endowment. As Dyker [1997] (p.447.) says: "however distorted the science
and technology systems of the socialist countries may have been, they did train
millions of men and women to a high level of scientific and technical knowledge".
As case studies show, Western engineers coming to Hungary after the systemic
changes experienced the outstanding capabilities and creativity of the workers.
High levels of creativity have been "forced" by the mentioned shortcomings,
without modern tools and machines good ideas were indispensable. Individual
achievements however have not been synthesised or summed up on a firm level
because of organizational problems (Szalavetz [1999]). Privatization and foreign
ownership therefore several times gave an impetus to productivity increases.
The continuous improvement of human resources is important. The share of high
school and university students has grown in the nineties, as well as the role of the
universities in R&D activity. The number of researchers has declined, but the
number of scientific publications has increased in the first half of the 90s. As
shown by Inzelt [1998] Hungarian scientific performance is outstanding in the
CEEC region regarding scientific publications and patent applications.
There are signs that the development of human capital is helped by foreign
companies. Already there is formation of certain number of students in the
universities according to the needs of multinational companies together with their
financial support (Mosoniné [1998]). There is however a danger of "internal brain-
drain" also, which means that the multinational affiliates divert the qualified
labour force from domestic companies.
3. Labour costs and productivity
Apart from the qualification of the labour force another important factor is the cost
of labour. As already mentioned, in EU-comparison Spain has been considered a
low labour cost country. The advantage of Hungary is however bigger in this
respect (see table 5a.)

55
Table 5. Labour costs in manufacturing, hour/USD on current prices
1992 1993 1994 1995 1996 1997
Spain 19.6 16.8 16.6 18.7 15.9 14.3
Hungary 3.4 3.5 3.7 3.7 3.6 3.5
Germany 30.1 29.8 31.3 36.8 36.8 31.7
Source: ILO Yearbooks of Labour Statistics, own calculations
As a part of location-specific advantages, not only labour costs but also
productivity is taken into account in foreign investment decisions. Therefore focus
is mostly on the development of unit labour costs which also take productivity into
account.
Graph 5: Level of unit labour costs in manufacturing in Spain and Hungary
0
0,1
0,2
0,3
0,4
0,5
0,6
0,7
1992 1993 1994 1995 1996 1997Spain Hungary
Source: own calculations from Table 5 and OECD National Accounts series, OECD Labour Force Statistics series, Statistical Yearbook and National Accounts of Hungary series The labour productivity in the Spanish economy has been increasing after the EU-
adhesion at a higher rate than the EU average. Examining productivity (value-
added per capita) in sectoral division it turns out that the productivity growth has
been different among sectors. In this sense it is clear that the performance of the
aggregate productivity is not only influenced by the productivity of the sectors but
also by labour force migration between them, that is to say by the changes in the
employment structure. According to the results of Maté Rubio [1995] who tried to
separate the two effects, between 1981-85 mainly the productivity of the sectors

56
determined the overall Spanish productivity trend. However, between 1985-91 the
effect of employment changes (migration) was the most important.
Apart from the direct costs there are special features of the Spanish labour market,
which can be characterised with one word: rigidity. Although this has been
considerably alleviated in the past decade, certain aspects remained. When the
adhesion of Spain to the EU took place, the major peculiarities of the labour market
were the following: 1., The costs and bureaucratic procedure of firing were extremely
high for the companies. 2., Only one state employment agency was allowed. 3., Strict
regulations (so-called "ordenanzas laborales") stemming from the fifties concerning
job-types were still in vigour, so mobility among branches and among regions was
very low. Flexibilization of the labour market is still going on since the mid-eighties
as a constant task of the governments. From 1984, contracts for definite periods were
allowed. As a consequence, short and part-time jobs boomed. The 1994 labour market
reform introduced new forms of temporary contracts and eased firing for the firms.
The monopoly of the employment agency was dissolved, and the "ordenanzas
laborales" were gradually abolished. As a result of the labour reforms a high grade of
duality developed in the Spanish labour market, which means the coexistence of a
stable, protected workforce with contracts for indefinite time and a much less
organised rotating workforce with temporary, or definite period-contracts. At the
peak, in 1995 the share of this second group in the labour force was 35%, while the
EU-average was 12% (Éltető[1996]).
Wages in Hungary are considered to be low by international standards (gross
nominal average monthly earning of blue-collar workers in the industry was 225
USD in 199751). However, the wage-related burden on employers in the form of
mandatory social-security contributions is high by international standards and
increases employment costs by more than 50 percent. This high non-wage burden
is often criticised by companies.
Improvement of productivity in the first half of the nineties was due primarily to
the abolition of hidden unemployment and the termination of loss-making
activities. Thus, the increase in productivity has been largely attributable to a
decrease in employment (termed ‘contractive productivity increase’ by
Ternovszky [1996]) and to a lesser degree to an improvement in the organisation
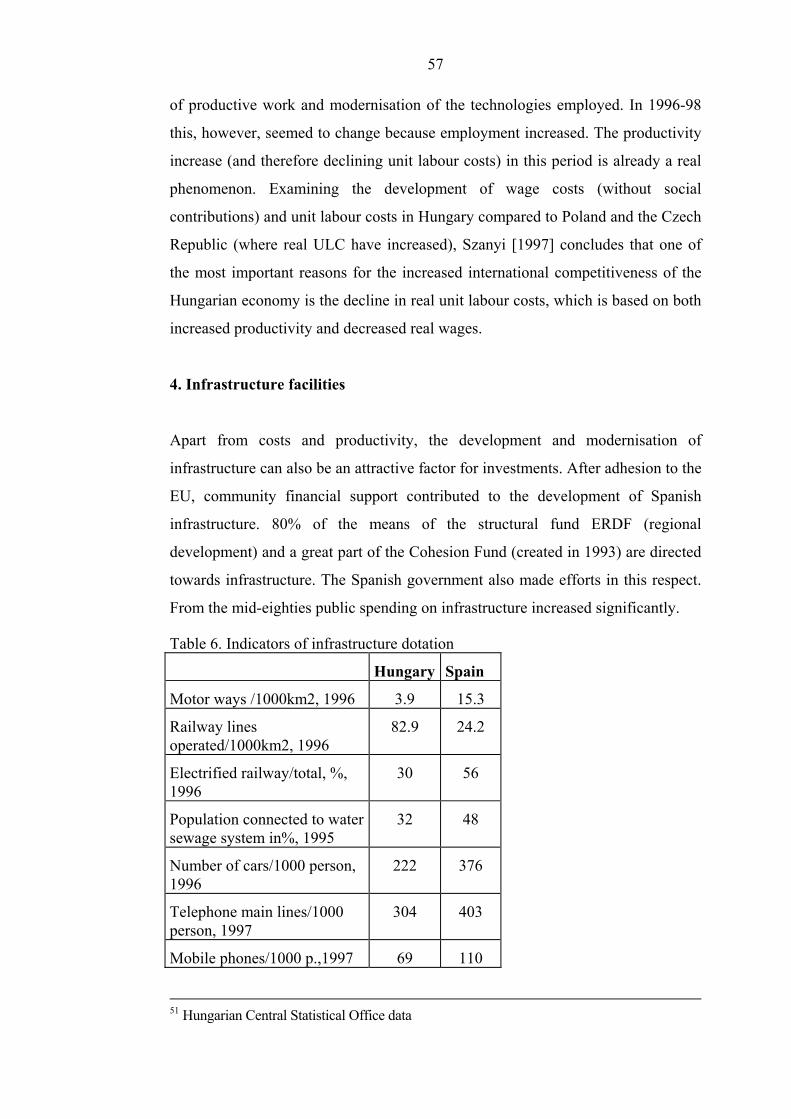
57
of productive work and modernisation of the technologies employed. In 1996-98
this, however, seemed to change because employment increased. The productivity
increase (and therefore declining unit labour costs) in this period is already a real
phenomenon. Examining the development of wage costs (without social
contributions) and unit labour costs in Hungary compared to Poland and the Czech
Republic (where real ULC have increased), Szanyi [1997] concludes that one of
the most important reasons for the increased international competitiveness of the
Hungarian economy is the decline in real unit labour costs, which is based on both
increased productivity and decreased real wages.
4. Infrastructure facilities
Apart from costs and productivity, the development and modernisation of
infrastructure can also be an attractive factor for investments. After adhesion to the
EU, community financial support contributed to the development of Spanish
infrastructure. 80% of the means of the structural fund ERDF (regional
development) and a great part of the Cohesion Fund (created in 1993) are directed
towards infrastructure. The Spanish government also made efforts in this respect.
From the mid-eighties public spending on infrastructure increased significantly.
Table 6. Indicators of infrastructure dotation
Hungary Spain
Motor ways /1000km2, 1996 3.9 15.3
Railway lines operated/1000km2, 1996
82.9 24.2
Electrified railway/total, %, 1996
30 56
Population connected to water sewage system in%, 1995
32 48
Number of cars/1000 person, 1996
222 376
Telephone main lines/1000 person, 1997
304 403
Mobile phones/1000 p.,1997 69 110
51 Hungarian Central Statistical Office data

58
Costs of international phone calls, $, 1995
3.34 4.05
Personal computers/1000 persons,1997
49 122
Source: UN Annual Bulletin of Transport Statistics 1998, World Bank World Development Report 1999/2000
The most spectacular development is to be observed in the case of public roads in
Spain. In 1986 177 million peseta and in 1993 786 million peseta were spent on
such construction. Thus, the length of the public roads more than doubled52.
Improvement in the endowment of transport infrastructure is well illustrated by the
fact that in 1986 it was 71% of the EU average, but in 1997 it was already 92%
(Martín, [2000]). (This is especially appreciated if we take into account that in
1986 the EU consisted of 12 countries but in 1995 three well-developed countries
joined.)
If there is no adequate infrastructure available, it can be a bottleneck of economic
modernisation. From the other side, development of the infrastructure directly or
indirectly affects positively the economic growth of the country and improves
productivity. Such effects were proved also in the case of Spain. Argimón et al
[1993] found that public infrastructure -mainly the “core” transportation and
communication infrastructure- played an important role in the acceleration of
private sector productivity after 1985 in Spain. Considering also transport and
telecommunication infrastructure Más et al [1995], and Rus-Roman-Trujillo
[1995] observed spillover effects stemming also from the network characteristics
of infrastructure. More recently Flores et al [1998] analysed Spanish data between
1964-1992 and found that a transitory increase of one percentage point in the rate
of growth of public capital stock implies a permanent increase in the level of
output by 2.8, of employment by 0.3, and private capital by 3.1 percentage points.
In the field of telecommunication important steps were made, several million new
phone lines were installed and the process of digitalisation advanced. Despite this,
the level is still below the EU-average, and because of the until recently quasi-
monopolistic position of the national phone company, international phone costs
remained the highest in OECD comparisons.

59
Regarding the state of the infrastructure in Hungary, the general picture is rather
disappointing. Rail, road, water management systems remained obsolete compared
to the EU-average despite the investment carried out in this field (thorough
analysis of the infrastructure heritage and its development is done by Ehrlich
[1997]). There are important regional differences, Budapest and Western Hungary
continues to have a relatively developed infrastructure. There are however
successful fields, like air transport, tourism and where the catching-up has been
spectacular: telecommunication. As characterised by Ehrlich [1997], Hungary has
undergone a telecommunications revolution since the systemic changes. Also such
services are available which are relatively new in Europe. Mobile phone service
for example began in 1989, at the same time as in Southern Europe and for today
the density and usage is much higher than the EU-average. As Fleischer [1998]
indicates, mobile phones partly substituted the basic telephone dotation.
As far as transport infrastructure is concerned, the present government seems to
puit an emphasis on motorway building. In April 2000 the Ministry of Economy
elaborated a national development plan which aims to spend considerable amount
of money (HUF 120 bn in 2001-02) to motorway building. The development of
transport infrastructure can be attractive for investors as it is proved by economic
literature and international experience.
5. Empirical evidence on FDI determinants
The location-specific factors enumerated so far, like size and rapid growth of the
market, economic liberalisation, and price stability could all have been attractive
factors to foreign investors during the eighties. As we have seen, EU membership
of Spain facilitated the finance of education and skill development, such as the
improvement of infrastructure, which belong to the "created assets" of the country
and mean further incentives to FDI. Empirical evidence on FDI-determinants
consist mainly of econometric studies. There is only one survey we can mention
(see table 7).
This survey is of Buesa-Molero-Casado [1995], which was made among German
and Dutch investors in Spain. According to the results, the size and characteristics
TP
52 Espańa en la Unión Europea - Diez ańos desde la firma del Tratado de Adhesión (1995)

60
of the domestic market were ranked by far the most important attractive factor for
the German investors. The Dutch investors appreciated cost-related factors, fiscal
incentives, legal framework more. This shows that the location advantages of the
same country can vary according to the origin of the investor.
Table 7. Determinants of FDI in Spain
Study Method Data Period Resulting determinants of FDI
Bajo [1991]
econometric model, time series
FDI inflow in Spain
1961-1988
*GDP/capita *inflation *integration effect
Egea-Lopez [1991]
cluster analysis
FDI inflow into the Spanish manufactuing sectors
1985-1989
*major economic role of the sector (weight in demand, production , export) *dinamic development of the sector (growth of production, export and demand)
Bajo-Sosvilla [1992]
econometric model, cointegration analysis
FDI inflow in Spain
1961-1989
*Real GDP *inflation *integration effect
Bajo-Torres [1992]
econometric model, time series
FDI/capita in Spain
1961-1988
*GDP/capita *real increase of GDP *integration effect
Buesa-Molero-Casado [1995]
survey German and Dutch investors in Spain
*for German investors: size of the market * for Dutch investors: cost factors, fiscal incentives, legal framework
Martin-Velázquez [1996b]
econometric panel model
bilateral flows of FDI among OECD countries
1983-1992
*technological superiority of the investor *distance *transport infrastructure *human capital *legal framework
Campa-Guillén [1996]
econometric model
FDI inflow to Spanish manufacturing
1988-1992
*GDP/capita *trade with investor country
Diaz de Sarralde-Martinez [1996]
econometric model, time series
FDI inflow to Spain
1970-1992
*real GDP *integration effect *relative exchange rate
Martin-Velázquez [1999]
econometric panel model
bilateral flows of FDI among OECD countries, 3 year moving average
1987-1995
*technological superiority of the investor *relative abundance of physical capital *transport infrastructure *human capital *size of the host country

61
In the beginning of the nineties studies were made to analyse the determinants of
FDI in Spain, also taking the possible effects of EU-adhesion into account. The
studies of Bajo [1991], Bajo-Torres [1992], Bajo-Sosvilla [1992] belong to this
line. According to the results FDI was attracted by the domestic market (GDP or
GDP/capita) and economic stability (inflation decrease). The integration effect
(measured by a dummy variable from 1986) proved to be also one of the major
determinants of FDI. Integration was an important determining factor in the later
study of Diaz de Sarralde-Martinez [1996] also together with market size and
relative exchange rate position. In all these works, contrary to the general belief, it
was found that labour costs were not significant determinants, not even in the
manufacturing sector.
Regarding the manufacturing sector, the study of Egea-Lopez [1991] looked for
the determinants of distribution of FDI among manufacturing sectors. It was
shown that those sectors were attractive which had a major economic role and
dynamic development within the total manufacturing industry. Campa-Guillén
[1996] analysed FDI in Spanish manufacturing broken down by investor countries
first, and found that GDP per capita of the investor country and the intensity of
trade with this country affect positively the amount of inward FDI. Secondly, the
regression of inward FDI by destination sectors showed that inward FDI tends to
be more intense in manufacturing industries with high levels of profitability,
intangible assets (measured by nominal expenditure on advertising) and relatively
high export orientation (trade balance to industrial production ratio).
Another line of econometric research analysed FDI-determinants not only in Spain
but in OECD countries (Martín-Velázquez [1996b], [1999]). Results are similar to
the previous studies to that respect that it was found that in general the investment
flows cannot really be explained by the differences in remuneration (labour costs).
There were however other factors with much more explanatory power. These were
the following: technology level of the investor country compared to the host
country, distance, dotation in transport infrastructure and human capital and the
legal framework of the host country.
Considering the case of Hungary -as for capital inflow boomed in the nineties, it is
understandable that the analysis of FDI in the CEE countries by surveys is
relatively recent. In 1995-98 some surveys with more than 100 companies in the

62
sample were made. These are shown in the table53.
There are three of these surveys, which treat investors as a homogeneous group.
Konings-Janssens [1996] found that as a main motivation exploring new markets
was chosen by 43% of the investors, achieving strategic positions by 37% and
cheap labour by 26%. According to the results of Pye [1996], 40% of the answers
put "access to market" (share, growth, development) as a first motive, and it was
the most frequent answer even in the second place. Followed this in less
proportion (12-16%) the "improvement of strategic position of the investor
company" (being present), "investment climate" and "financial efficiency" (like
profits, labour costs). In the study of Engelhard-Eckert [1994], market access goals
were important or very important for 81% of the sample. Profit chances and risk
diversification were also important, cost advantages were in fourth place (being
important or very important for 31%).
In the other surveys the main principle was the differentiation among certain
groups of investors. Joint ventures are different in motivation, aims, and reaction
to policy measures. What can be important for one, need not be important for the
other. The main aim was to examine what differences can be observed in the
activity and motivation of the companies according to their group characteristics.
The grouping was made according to the export-orientation or domestic market
orientation of investors. In this way, these surveys wanted to highlight the
different determinants of the two main types of investments mentioned in chapter
I.
In Éltető-Sass [1998] as it was expected, the export-oriented companies ranked
higher the motivating factors concerning foreign markets than those not export-
oriented. The Association Agreement, the export basis towards the EU and its
facilitation (tax reductions, customs-free zones) were ranked higher in importance
for the export-oriented group. At the same time, the flexibility of the labour force
proved to be more important and the most important factor of all was the qualified
labour force for the export-oriented firms. Factors concerning the labour force
were more important for the export-oriented firms than for the domestic market-
oriented ones. This shows that on the foreign markets (which mainly the European
Union) the high quality and other rules require qualified labour force. The not
53 A thorough literature overview of foreign investors’motivation is provided by Szanyi [1998].

63
export-oriented companies considered first of all the acquisition of domestic
market shares, economic prospects and stability by their decisions to invest.
Former contacts with Hungarian companies also proved to be more important for
them than for the export-oriented firms.
The differing motivations of the different investor groups can be detected in the
surveys of Meyer[1996] and Lankes-Venables[1996] also. Among the market-
oriented investments examined by Meyer, the size of the market is in first place. It
is followed by the quality of political-economical environment (stability), previous
contacts, no competitors in the given market and the revenues of consumers
(purchasing power). As far as the factor-price oriented investments are concerned,
by far the most important are the low labour costs, followed by the qualification of
the workers, access to local markets, favourable political-economic environment
and former contacts. Also the former contacts among firms are very important for
market-oriented investors in Meyer's survey.
In case of the groups of Lankes-Venables[1996] there is a difference in
motivations also. Examining the first five main motivations for "local suppliers"
market share is the main motivating factor followed by the access to regional
market, production costs, opportunities in privatisation programme and qualified
labour costs. For the "exporters" lower production costs were the most important,
followed closely by the entrance in local and regional markets, qualified labour
force an possibility of entering the EU market.
Regarding FDI determinants, we can also draw conclusions for Hungary from the
econometric literature dealing especially with determinants of FDI inflow in the
CEE region. The two most important studies in this respect are Lansbury et al
[1996] and Holland and Pain [1998]. Lansbury et al [1996] examines investment
by 14 OECD countries into Poland, Hungary and the Czech Republic from 1991-
1993. According to their results relative labour costs within the Visegrád
economies have influenced the distribution of foreign investment within those
economies more than costs relative to Southern Europe. They also found that
domestic technology (proxied as the stock of patents granted) had a positive
impact on the level of FDI. Concerning trade effects, the results showed that trade
with the investor country is positively associated with FDI. As for one important
attracting factor in the CEE countries was privatisation, the authors included this

64
also. They found that inward FDI is higher in those countries with a higher private
sector share.
Holland and Pain [1998] using a panel model observes 11 transition economies
between 1992-1996. They found that wages relative to other transition economies
have a significant impact on FDI although wages relative to the EU did not have
this impact. Productivity relative to the regional average was found important.
Regarding trade barriers and distance it turned out that those countries which have
common border with the EU received relatively higher levels of FDI. Privatisation
was included here also as a factor, but it was found that privatisation method was
more important than the private sector share. The results implied that countries
with a programme of direct privatisation through cash sales have attracted higher
inward investment than those countries using voucher privatisation.
One phenomenon however is missing from all three econometric studies. As it
turned out from the survey results, the main attracting factor of investors is
generally the local market or expansion (growth) prospects of the host country.
This is difficult to confirm by an econometric analysis as the inflows of FDI in the
beginning of the nineties coincided with a deep recession period in the CEE
countries, suggesting a negative correlation between FDI and growth, which is not
the case.
Table 8. Determinants of FDI: Hungary Study Method Data Resulting determinants of FDI Engelhard-Eckert [1994]
survey 268 German firms active in CEEC's/ FSU, 1992
*local market *profit possibilities *risk diversification
Konings-Janssens [1996]
survey 281 Belgian companies investing in CEEC's
*local market *obtaining strategic positions *cheap labour force
Pye [1996]
survey 334 FIE's in the CEEC's region
*local market *strategic positions *investment climate *financial efficiency
Meyer [1996]
survey, grouping of investors1
139 British and 130 German firms inves- ted in CEEC's 1995
For DO: *market size *political,econo- mic stability *previous contacts
for EO: *cheap labour *qualified labour *local market
Lankes- survey, 145 western For DO: for EO:

65
Venables [1997]
grouping of investors1
investments in CEEC/ FSU 1995
*market share *regional market *production costs
*production costs *local+regional markets *qualified labour
Éltető-Sass [1998]
survey, grouping of investors1
125 FIE's functioning in Hungary 1996
For DO: *local market *prospects for development *legal stability
for EO: *political,legal stability *qualified labour *flexibility of labour
Lansbury et al. [1996]
econometric model, time series
FDI by 14 OECD countries in CEECs between 1991-1993
*labour costs relative to the region *domestic technology *trade with the investor country *privatisation
Holland-Pain [1998]
econometric panel model
FDI in 11 transition countries between 1992-1996
*wages * productivity (relative to other host countries) * common border with EU * privatization method
Note: The main groups are: domestic market-oriented (DO) and export-oriented (EO)
In this chapter the main location specific advantages of Spain and Hungary and
their development have been described. In the macroeconomic field, after the
recession in the beginning of the nineties, both countries performed well at the
second half of the nineties. Spain successfully became a founding member of the
EMU and Hungary made important steps to enhance growth and curb inflation.
This - together with several types of incentives - created a safe environment for
foreign investors. Regarding the local background of investments technological
capacity, infrastructure and labour costs were examined more closely. Spain has
shown considerable development in the former two factors, which has been
promoted by EU financial transfers. Hungary has a significant advantage in the
costs of qualified labour. The mentioned location-specific advantages are
manifested in surveys and econometric studies deling with determinants and
motivations of FDI. These results first of all emphasized the importance of access
to market and to relatively cheap qualified labour force.
IV. The effects of FDI on Spanish and Hungarian economies with special emphasis on foreign trade

66
As it was mentioned in Chapter I., effects of FDI on the host economy can be
various. In this chapter we put the emphasis first on technological development,
productivity and growth and then, above all on trade performance and trade
specialisation.
1. Effects of FDI on the technological level
International experience showed that for today technology development can be
bound to the activity of multinational companies. Related to this, one of the major
effects FDI can exert on host economies - in our case Spain and Hungary - is the
transfer of technology. According to Buesa-Molero [1993] there are four types of
strategies of multinational affiliates concerning technology and R&D in Spain
(and also elsewhere). First is a passive adaptation of the technology transferred by
the parent company. Second is an active adaptation of the same, employing
improvements or changes. Third is a technological cooperation with the parent
company and the fourth is a partially autonomous technological strategy of the
affiliate where the own R&D activity is the highest.
R&D expenditures of Spanish firms increased significantly after EU-entry. The
small average size of Spanish companies, however, does not facilitate R&D
activity. Investment in R&D and innovation is risky, and brings returns only in the
long run. This can explain that expenditure on R&D among Spanish firms remains
below the EU average in spite of the developments of the last decade in this field.
80% of the R&D expenditures of firms are concentrated in three sectors: the
extracting and chemical industry, metal processing and other manufacturing
industries. Metal processing is the most significant, representing 50% of total
expenditures. Dividing this further on subsectors it turns out that the companies
that spend the most on research and development can be found in transport
equipment, electronics, and the computer industry. These are sectors with
significant foreign penetration and several multinationals.
Data show that companies with foreign (mainly majority) ownership spend more
on R&D than domestic firms and FIE's tend to import more technology. The
strong demand manufacturing sectors (which received more FDI) are also much
stronger in R&D activity. The technological and financial apport of multinational

67
companies helped Spanish industrial development, first of all via the import of
technology. FDI had a positive effect on technology, although empirical analyses
(based on balance sheet data of firms) showed that this positive effect was
relatively small (Martín-Velázquez, [1996]). However, multinational companies
had a certain demonstration effect on the R&D activity of domestic companies
(this is one of the spillovers described in chapter I.). Before the massive inflow of
FDI, domestic companies mainly realised copying activity, but the penetration of
multinationals and growing competition induced them to realise the importance of
own R&D and innovation activity (Éltető, [1994]). Econometric analysis using
production quota measures of multinationals González [1997] showed that once
the firms decided to realise R&D activity, the presence of multinationals
stimulates this activity. If the market quota of the foreign companies increases by
10 percentage points, the realised R&D efforts of domestic companies increase by
0.8 percentage points if the market is large and by 0.5 points if it is small.
As mentioned, R&D activity is concentrated in certain sectors. If we eliminate the
sectoral effect and observe the companies within the sectors then the results of
González [1999] are interesting. This study is based on a survey among
approximately 2000 manufacturing enterprises between 1990 and 1994. The
innovative effort (R&D expenditures/total sales) of the companies were in the
focus. The firms were divided according to the grade of foreign participation, by
size and by the technological level of the sectors. In every category, a negative
effect of FDI was found on the innovative effort. This effect was the most apparent
in the high technology sector and among small companies. Apart from that, where
the participation of foreign capital was small (smaller than 30%) the effect was
more negative than in those companies where foreign participation was large
(more than 50%). The author explain this by the integration of firms into
multinational networks, where mostly the parent company realises the innovative
activity and the Spanish affiliate is technologically dependent, making
complementary activities. (Another explanation can stem from the nature of the
R&D intensity indicator, because total sales of multinationals can be much higher
than that of other companies so even if they spend more on R&D, the value of the
index will be less.)
The analysis of the structure of R&D expenditures showed that these mean first of

68
all expenditure on technology import, licensing, which increased technological
dependency. This kind of dependency is higher in the case of foreign investment
enterprises. In her earlier study, González [1997] differentiates between two types
of R&D activity, one is the own activity of the firm and the other is the import of
technology. Regarding minority FIE's, the impact of FDI is positive both on own
R&D activity, both on technology import. This can mean that the foreign owner
does not share completely its knowledge with the affiliate but the foreign capital
helps to finance R&D activity. Regarding those companies where the participation
of foreign capital was more than 50%, the effect of FDI proved to be negative on
own R&D activities and positive on technology import. It means that the majority
foreign companies are more likely to by technology from abroad (from the parent
company) than to develop it in the firm54. This suggests that FDI increases
technological dependency. Indeed, defining the grade of technological autonomy
as ((expenditure on R&D/ expenditure on R&D + technology import)*100), the
regression results showed that the majority FIE's present 12 percentage points less
technological autonomy.
Spanish companies participate in several EU programs in the field of R&D and
technology. Regarding the EU’s IV. Framework Program, the share of Spain here
(6.3%) is similar to the share of its GDP (6.5%) and its contribution to the
community budget (6.5%) (Martín-Sanz [1999]). According to the analysis of
Martín-Sanz [1999], those companies that are more productive, invest more in
R&D, belong to an association, have already received national or international
support and are bigger in size have a greater probability of getting access to EU
support or participate in EU programs.
In the case of Hungary, research and development activity and the technological
level have been also influenced by the past regime. New generic technologies,
flexible production systems, digitalisation was missing. In this respect, the effects
of foreign investment enterprises, the behaviour of multinational companies is
important. Hungary also participates in the IV. Framework Programme of the EU
54 However, there are examples of own R&D centers of multinationals in Spain. Recently for example Siemens decided to move its multimedia mobile phone research centre from Munich to Spain based on the positive experiences they have already had in the country.

69
with 163 projects.
As we have seen R&D expenditure compared to GDP has been decreasing in the
nineties, and company expenditures have been decreasing at the largest pace.55
Business enterprise R&D expenditure within the manufacturing industry is
concentrated on certain sectors, as in Spain. In 1997 the 69.4% of manufacturing
R&D expenditure of the firms was realised in the chemical sector and 24.3% in the
machinery industry. The pattern of this concentration has been changing in favour
of the machinery sector, in 1993 the share of the chemical sector was 76.4% and
that of the machinery sector was 18.4%.56
According to a survey57 of innovation and R&D activities among companies,
expenditure on R&D in proportion to net revenues is generally low: between 1 and
5%. Expenditures were mainly directed towards product innovation. The major
aim of innovation was to improve product quality and expand the range of
products and also to improve access to the domestic market. Technological
innovation was a characteristic feature in the electricity, wood-processing and
paper and basic chemicals industries. By far the largest factor hindering R&D
activities was the lack of financial resources. Based on another survey Farkas
[1998] points out that the main barrier of R&D and innovative activity in the case
of Hungarian companies is mainly the lack of capital and credit. Also the lack of
markets and proper marketing, weak infrastructure, low wages and brain-drain was
mentioned.
Regarding foreign investment enterprises, their R&D expenditures in 1997 made
up 45% of the total R&D expenditures of the firms. The expenditures are growing
much faster in FIE's than in domestic companies.58 The Hungarian experience
shows that R&D intensity of FIE's is much higher than that of the domestic
companies (see for example Farkas [1995], Inzelt [1998], Szalavetz [1999]) The
analysis of the statistical data of 478 companies carrying out R&D activity
between 1992-95 showed that FIE's investing most in R&D are in the food-,
55 One part of the decrease of R&D expenditures is not necessarily negative phenomenon if it means at the same time an improvement in the utilisation (efficiency) of the money spent. 56 Calculations based on Central Statistical Office (KSH[1999]) data. 57 The survey based on questionnaires examining 110 companies was made by the Innovation Research Centre at the beginning of 1994. Results were published in Külgazdaság 1995/7-8 58 In 1997 the following foreign investment firms spent the most (above HUF 2 mn) on R&D: GM, Ford, Siemens, IBM, Hitachi, Toyota and Matshushita Electric.(B.Horváth [1999]).

70
chemical and machinery branch (Inzelt[1998]). In the first two industries
adaptation-aimed research dominates, while in the machinery industry smaller
licence changes, innovations also take place. The activity of FIEs contributed to
the fact that the share of imported material among the sources of R&D increased
from 19% to 38% between 1994-97.
The role of foreign investors in shaping the Hungarian innovation and the R&D
process is open to debate. There are good examples (in the software and electric
lighting industries, for example) of foreign companies bringing their R&D centres
to Hungary and utilising the qualified workforce in the country59. Possible
negative and positive effects (like crowding out domestic R&D but bringing new
technologies) of FDI in domestic R&D is enumerated in Farkas [1995] who also
provides pro and contra case studies. A thorough analysis of technology-transfer,
absorption, innovation, horizontal and vertical contacts is made by Szalavetz
[1999] using case studies of German-owned manufacturing companies.
Information available on R&D and technology transfer made by foreign investors
is rather scarce. Inzelt [1998] points out that case studies in themselves cannot
provide an overall picture. Szalavetz [1999] argues that statistical indicators
strongly undervalue the quantity of technology transfer accepted by Hungarian
companies because of not measurable knowledge and because of neglecting the
wide application of new technologies in certain joining areas (services, packaging
industry, etc). Apart from that, as the technological capabilities (see Chapter I.) of
the country improve, the characteristics of technology transfer, innovation-
cooperation also change.
2. Impact on productivity and growth patterns of the manufacturing industry
59 General Electric maintained the laboratory (created in 1921) of the privatized Hungarian company, Tungsram, and brought additional research tasks. Another example is the Knorr-Bremse affiliate with a 30 employee innovation department. In the software field Oracle, Microsoft and Ericsson also make research and even IBM has begun to develop some R&D activity. In 1997 some companies established or announced to establish an innovation base in the country. The Finnish Nokia created a 530 employee base and applied research department for mobile phones and closes its "birthplace" in Finland. The new investments are due to the good human capital and to the already described government incentive valid in 1998.

71
As we have seen in Chapter II, in both Spain and Hungary FDI inflow has been
significant into such similar sectors, which are also internationally attractive for
investors. Therefore we can suppose that FDI seems to have helped approaching
the structure of production and value-added in manufacturing towards the EU
patterns in both countries.
During the eighties and the nineties the internal structure and the characteristics of
Spanish industry changed60. Between 1981-1991 certain sectors decreased their
shares in the value-added of the manufacturing sector (minerals, metal products,
textiles) and others increased (rubber and plastic, food, electric equipment).
Despite these tendencies, Martín [1995] compared the Spanish industrial
specialisation to that of the EU. In 1991, Spain was still underspecialised to the
sectors of machinery, equipment, chemicals (strong demand and technology
sectors) and also in paper and printing but food, non metallic products, minerals
and textile (low demand and technology sectors) had bigger weight in the
manufacturing value-added than they had in the EU. This situation remained the
same in 1997. However in the case of the medium demand and technology sectors
a certain convergence could be observed, which suggests a move towards the
European average. This trend was the most apparent in the transport material
sector (owned mainly by foreign participation enterprises), which relative weight
even surpassed the EU average (Martín [2000]). The changing technological
structure of Spanish manufacturing industry is shown in table 9.
Table 9. Share of sectors in the value-added of manufacturing industry (percentage)
Sectors EU Hungary Spain
1986 1997 1992 1997 1986 1997
High demand and technology
21.3 25.8 16.4 25.1 16.8 19.7
Chemicals 9.0 10.6 8.4 10.3 8.2 9.4
Office machinery 3.3 4.4 0.4 3.5 2.2 1.8
60 After adhesion, the process of "de-industrialization" was exacerbated in Spain. The manufacturing sector in 1986 represented 17.5% of the GDP which decreased to 16.5% in 1996 (Oporto del Olmo, [1997].)

72
Electrical mach., radio, TV sets, medical, precision instruments
9.0 10.8 7.6 11.3 6.4 8.5
Medium demand and technology
29.5 28.0 18.0 21.7 23.1 25.2
Rubber and plastic 3.8 4.3 2.3 3.7 4.4 4.8
Machinery and equipment n.e.c.
10.2 8.9 8.9 7.4 4.7 4.5
Motor vehicles, transport equip.
10.3 10.0 3.2 8.5 8.8 11.5
Furniture, manufacturing n.e.c.
5.2 4.8 3.6 2.1 5.2 4.4
Low demand and technology
49.2 46.3 65.6 53.2 60.1 55.2
Food, beverages, tobacco 14.7 13.8 21.4 15.6 21.2 20.5
Textiles, clothing, leather 8.2 6.5 9.9 7.8 11.1 8.2
Wood, paper and printing 8.1 8.3 8.2 8.1 6.5 6.1
Minerals and non-met minerals
5.2 5.0 4.3 4.2 8.2 8.5
Minerals and non-ferrous metals
4.4 4.3 13.6 8.6 5.5 4.5
Basic and fabricated metals 8.6 8.4 8.2 8.9 7.6 7.4
Source Martín [2000]p.17. and own calculations from Central Statistical Office data
Regarding Hungary, table 9 shows that manufacturing is still strongly specialised
on low demand and technology sectors. However, the share of high demand and
technology sectors in value added increased spectacularly and during five years
surpassed the achievement of Spain in ten years. Main driving force here was the
chemical and electrical machinery sector. At the same time low-technology
branches (mainly food and minerals) lost from their importance. The increased
share of technology-intensive branches (which is even more apparent in the export
structure, see point 3.) is an important phenomenon regarding output data too.
Analyses of industrial production data between 1992-1998 reinforce the structural
changes among the manufacturing branches. The motor of the production growth
was the machinery sector, mainly motor vehicle, telecommunication equipment

73
and computer electronics branch has gained rapidly force (the base of production
increase was export), while precision tool, and agricultural machinery branch for
example lost from their weight (see annex table A6). The chemical sector still
remains one of the biggest sector in Hungarian manufacturing industry. Within the
chemical industry an internal shift has been realised from oil refining towards the
plastics branch and the production of the pharmaceutical branch had only a small
increase. The performance of the food industry stagnated and that of the textile
branches has been decreasing except for the dynamic confection clothing branch.
As far as the effect of foreign investments is concerned, it would be very difficult
statistically to detect a significant correlation between the foreign penetration and
the growth pattern of the production of the sectors given the high level of
aggregation. There are sectors with significant foreign capital where production
has stagnated (chemicals) and there are branches where production has increased
almost without FDI (base metals). However in the case of the production and
export activity of the machinery industry the effect of FDI can be confirmed given
the ownership structure of the branches. The domination of multinationals in the
high- and medium technology sectors and their importance in the export activity is
evident. (see point 3.).
One field where the role of FIE's is obvious to contribute production is investment.
Official statistics show that FIE's are responsible for an ever increasing share of
investments in Hungary. The empirical evidence (Hunya [1997], Szanyi - Szemlér,
[1997], Szanyi, [1997]) indicates that foreign capital involvement acts as a catalyst
and triggers substantial investments in joint ventures. In the manufacturing
industries there were industries where basically only FIE's invested: computers
and business machines, road vehicles, electrical engineering, and instruments.
Manufacturing investments were already dominated by FIE's in 1992, when they
took 50,8 % of the total. This share increased to 78% in 1998.
There are different methods to distinguish „strong” and „weak” industries. One
possible way is applied by Borsi et al.[1998] who apply the output per domestic
demand ratio. It means that those sectors which produce more than their domestic
demand (the ratio is above 100), can find foreign markets for their products and
feature strong specialisation. The definition of domestic demand is:
output+import-export. According to the results in 1996 food, tobacco, fur, wood,

74
electrical machinery, motor vehicles were the strong sectors. These either
remained strong since 1993 or became strong rapidly. However as the authors
themselves say, this measurement is very simplifying, because the sectors
characterised by export led growth can fall in the „weak” category although they
are in a lot of cases internationally competitive. (This is the case of office
machinery for example where the mentioned ratio increased spectacularly since
1993 but still remained slightly below 100 in 1996).
Regarding the effect of FDI on industrial productivity, in Spain studies showed
that firms with foreign capital are more productive than domestic companies. In
Farinas et al [1999b] based on the ESEE survey among 2000 companies,
regression results proved that the presence of foreign capital is associated with a
higher efficiency of labour (higher production/employees ratio). The effect of
foreign capital as a determining factor was also detectable in the increase of
productivity between 1991-94.
In the case of Hungary Borsi et al. [1998] point out that in general, productivity
(value added per number of employees) of the manufacturing sectors improved
significantly between 1993-96. This improvement originated by a simultaneous
growth in the value added and by a shrinking in employment in the case of the
food, tobacco, paper, leather, chemical industry, motor vehicles and other transport
equipment. Both value added and employment increased together with
productivity growth in the case of textile, wood, rubber and plastic, machinery,
office machinery, electrical machinery medical, precision instruments and radio,
TV sets (so almost in all high-tech branches).
Regarding the effect of FDI on productivity, table A7 in annex justifies that firms
with majority or 100% foreign ownership are more productive in almost all sectors
than domestic companies. (The picture is similar for firms with minority foreign
ownership too.) Not only the absolute level of productivity but also its increase is
spectacular in certain cases of FIEs: 100 percent foreign owned firms in the office
machinery branch increased their productivity by 8100% between 1993-96, and by
480% in the motor vehicle sector.
3. The effects on trade balance and trade specialisation

75
Our analysis puts a special emphasis on the effects of FDI on the foreign trade.
The main reason for this is that for a small, open economy like Hungary, the
development of the foreign trade is crucial. Although Spain is a larger market,
foreign trade has an important role here also in the external balance and economic
development.
3.1. Trade balance
The balance of Spanish foreign trade deteriorated rapidly after the adhesion to the
EU. Mainly manufactured goods have been responsible for the serious increase of
deficit in EU-relation after 1985, as for the foreign trade balance of energy
products remained the same and that of agricultural products even improved after
the EU-entry. Within the manufactured products there are product groups, in case
of which foreign trade deficit was a new phenomenon: these are mainly textile
products (yarns, clothing, knitwear, carpets) and furniture.
As for the general deterioration of the foreign trade balance and the increase of
FDI inflows coincided, no wonder that several studies tried to follow the role
foreign investment enterprises played in the increasing foreign trade deficit of
Spain. Based on FDI and trade data between 1977-1992 Bajo-Munoz [1996]
estimated export and import equation separately and found that a higher Spanish
investment abroad would lead to higher exports and a higher foreign investment in
Spain would result in higher imports.
According to Martín-Velázquez [1993] and Bajo-López [1996], enterprises with
foreign capital register a larger ratio of exports and imports to total sales (which is
the definition of export and import propensity) than domestic ones. What is more
important, their import propensity is even higher than their export propensity,
mainly of those companies with majority foreign ownership. Their results are
further confirmed by Moreno-Rodríguez [1998] who find a significant effect of
foreign participation on the probability to export and import. Apart from that, the
foreign trade balance of FIE's is worse than that of the domestic companies. Export
and import propensity is anyway much higher in the strong demand sectors (which
attracted more FDI) than elsewhere.

76
Export and import propensity is further analysed in another study of Moreno-
Rodriguez [1999]. According to the results company size has a significant
influence on both import and export probability and propensity, bigger companies
export and import more. Examining the probability to import, the effect of FDI is
bigger in this respect in the case of small companies than in large ones. Majority
small FIE's are similar to large FIE's regarding import propensity. This means that
the penetration of FDI has a similarly important influence on import propensity as
the company size. Regarding exports, further differentiation is made among
companies depending on whether they have own means of market access or not.
The effect of FDI-penetration is not very different according to the company size.
So, the effects of FDI are much bigger on the probability and propensity to import
than on the probability and propensity to export. Therefore it confirms the negative
effects of FIE's on the trade balance.
Increased imports could have been counterbalanced by growing export activity,
but this was hindered by several factors. One factor is the domestic economic
situation with booming consumption and domestic demand, which held companies
at home. Increased domestic demand attracted foreign investors also, which
increased competition on the Spanish market, so Spanish companies had to defend
their positions. Another factor is the appreciation of the peseta from 1987 on,
which meant a heavy burden for exporters.
A third factor is the traditional characteristics of Spanish companies (see e.g.
Alonso-Donoso, [1989]). Firms are smaller than the European average, in terms of
capital and employees. This makes the exploitation of scale revenues, the finance
of company financing and export activity difficult. Thus the small and medium
sized Southern companies have always been relatively less oriented towards
foreign markets and more toward the domestic market. They had no foreign
distribution network. According to a survey, in the beginning of the nineties, 56%
of the companies had no expenditure on export development, 20% of them realised
foreign investments at all, and less than 30% of Spanish companies realised any
export activity.61 These results are confirmed by the balance sheet data analysed
by Valero [1997], which show that the percentage of exporting companies in the
total decreased constantly from 1986 to 1991 (from 39% to 25%) and increased

77
afterwards again to 40% in 1995. The 1992-93 European recession made these
shortcomings of Spanish enterprises more apparent. Therefore, in the economic
policy of the government, at the chambers, professional organizations, and in the
press a campaign was launched to "internationalise" Spanish companies. This
coincided with the devaluation of the peseta, which helped Spanish exports.
Developments in the last three-four years show that a real quality change did occur
in the strategy of companies. They discovered other parts of the world. As it is
seen on the graph, the foreign trade deficit improved significantly between 1994-
1998. The main aimed area of investors is Latin-America, more than half of
Spanish investments are directed here. Not only banks and large companies like
Telefónica, Tabacalera, Repsol, Iberdrola, Endesa have built networks there, but
also small family enterprise ventures. As a consequence, Spain became the largest
European investor in the region. Marocco, Portugal and the South of France are
also popular destinations. (The effect of the internationalisation of Spanish
companies is also manifested on the macro-economic level: in 1998 Spain was
already a net capital investor country instead of being a net recipient.)
Graph 6. Foreign trade balance in percentage of the GDP
-12
-10
-8
-6
-4
-2
0
2
4
1986 1987 1988 1989 1990 1991 1992 1993 1994 1995 1996 1997 1998 1999
Spain Hungary
Source:IMF Financial Statistics Yearbook series, national bank data, own calculations
61 Información Comercial Espaňola 1992/710

78
As can be seen in graph 5, the foreign trade balance of Hungary deteriorated
deeply in the nineties. This deterioration was more severe than that of Spain after
liberalisation. The trend was reversed from 1995-97 but since 1998 the deficit has
been slightly increasing again. The development of the foreign trade balance has
also been influenced by the activity of foreign-owned firms. In accordance with
international experiences (and as was the case in Spain), the propensity of FIE's to
export and import is higher than that of domestic firms. If we define export
intensity as the export sales share in total sales, in almost every manufacturing
sector FIE's are more export intensive than domestic companies.
On the import side, surveys and case studies show that FIE's are also more import-
intensive than domestic firms. Regarding the whole economy, the export-intensity
of FIE's was 29.5% in 1997, while that of the domestic companies was 8.8%. Import-
intensity was 32.2% at the FIE's, and 10.3% among domestic companies62. These
figures show that import-intensity is higher than export-intensity to the same extent,
both in the case of FIE's and domestic companies. This is also confirmed by
regression figures based on an empirical survey of Hungarian manufacturers,
which illustrated that majority foreign ownership does not increase the probability
of greater imports. There is no significant difference in the import-propensity of
two firms with the same parameters, one of which is in majority foreign ownership
(Kopint [1997], p. 146.).
Considering the effect of FIE's on the Hungarian trade balance, presumably two
periods can be separated. In the first half of the nineties, companies with foreign
investment, especially large greenfield projects, realised high import activity,
which was necessary to establish their production capacities. Later on, however,
although imports remained high, export activity strengthened to such an extent that
the trade balance of a large part of FIE's in manufacturing became positive.
3.2. Trade specialisation: inter-industry and intra-industry trade
According to the traditional approach to international trade based on the theory of
comparative advantage, factor endowments induce countries to specialise their
production and trade in goods the production of which is intensive in factors they

79
possess in abundance. The reduction of trade barriers and integration promote this
specialisation and inter-industry type trade increases. According to the “new”
international trade theories - that introduced more realistic assumptions like
product differentiation, oligopolistic competition, increasing returns to scale,-
among countries with rather similar endowments and production structures
integration enhances intra-industry type trade.
In both Spain and Hungary, the abundant factor is said to be the skilled, relatively
cheap labour force, so these countries have usually had comparative advantages in
labour-intensive industries (and sometimes resource-intensive ones). In the
following parts we examine what kind of changes in foreign trade specialisation
have taken place due to liberalisation in Spain and Hungary. Our hypothesis is that
liberalisation (integration) and the inflow of FDI induced important changes in
specialisation and an increase in intra-industry trade in Spain and in Hungary.
The integration of Spain into the EU increased the openness of the country.
Spanish exports have increased constantly to the world, but even more rapidly to
the EU. Import penetration (share of imports in domestic demand for
manufacturing products) also increased drastically, from 17.4% to 35.9% between
1986 and 199763. Adhesion to the EU also modified the direction of foreign trade,
which became more intensive with the Union.
Today, France, Germany, Italy, the UK and Portugal are the most important EU-
partners of Spain (see table A8 in annex). The rapid intensification of trade with
the neighbouring Portugal was due to the accession, because economic relations
between the two countries had been insignificant before. As a non-EU partner in
trade, the USA is the most important for Spain, although with a decreasing share
since 1986. Among the developing countries, Latin-America as a traditional
partner and the Maghreb countries are significant. Trade decreased with these
regions in the decade after the adhesion but recently has revived again.
Apart from geographic structure, the product composition of foreign trade has also
changed. We have grouped the manufacturing sectors according to their
technology-intensity. The industry classification is based on the method of OECD
62 Own calculations based on Central Statistical Office data 63 Martín [1999].p.74.

80
(1993, p.84) which used ISIC Rev2. classification64. Three groups have been
created: high-technology, medium-technology and low-technology intensive
products65. The SITC 5 digit trade data (3464 items) given by the Eurostat Comext
database were converted to ISIC Rev2 classification, which was corresponded to
the presently used ISIC Rev3 classification.66
The following tendencies can be observed in exports to the EU for Spain and
Hungary. 67
In Spanish exports to the European Union, the weight of medium technology
sectors increased between 1990-98, which was first of all due to the transport
equipment branch. (see table 10). This was a continuation of the tendencies in the
eighties (Martín[1999]). The share of low technology sectors decreased, for which
the main responsible were the textile-clothing, iron and steel and alimentation
branches. These products had been traditionally important in Spanish exports, but
after the adhesion they lost some of their importance. However, at the end of the
period, these traditional branches, mainly the food and textile branches, reinforced
their role again.
Regarding the high technology-level sectors, their share in exports to the EU has
been constantly but slowly increasing from 1980. Between 1993-98 a certain
fluctuation can be observed.68. Regarding the import side (not shown in the table),
in 1998 the share of high-tech products was 20.85%, that of medium-tech products
was 51.21% and the share of low-tech products was 27.94%.
64 The indicator of technological intensity (weighted according to sectors and countries) is the share of R&D expenditures in production or value-added. 65 At the end of the nineties based on the experiences the OECD revised the grouping (Hatzichronoglou [1997]) and divided the medium-tech group into two parts. Medium-high and medium-low groups were created, precision instruments and electrical machinery were put into the former one. However, the application of the old grouping is still more frequent. 66 ISIC Rev3. classification is used in the Hungarian industrial statistics, Spanish data were grouped into this scheme for the sake of comparison. 67 In the database the EU is the reporter country, so „export to the EU” means the EU import from the country. 68 In the non-EU relation, the share of low-technology sectors are much higher and that of medium technology sectors are much lower than in the EU-relation. The share of high-technology branches increased much more rapidly here than in the export towards the EU (Martín [1999])

81
Table 10.: Share of industries in Spanish manufacturing export to the EU (%)
ISIC sectors 1990 1993 1996 1997 1998
High technology 11.25 12.82 12.53 12.76 13.50
2423 Pharmaceuticals 0.55 0.38 0.51 0.46 0.51
30 Office machinery 2.41 2.51 2.08 1.71 1.89
32 Radio, TV sets 1.82 2.55 2.52 2.84 3.06
31 Electrical machinery and appliances
4.73 4.77 4.71 5.01 4.75
353 Aircraft, spacecraft 0.82 1.62 1.44 1.55 2.05
33 Medical, precision, opt. instruments
0.93 0.99 1.26 1.19 1.24
Medium technology 50.86 54.54 54.79 54.08 54.36
241 Organic, inorganic basic chemicals
4.62 4.47 4.50 4.32 4.04
251 Manufacture of rubber products
2.12 2.46 2.36 2.31 2.45
252 Manufacture of plastic products
0.94 0.87 0.99 1.02 1.10
272-73
Non-ferrous metals. aluminium
1.62 1.78 2.17 2.21 1.76
29 Machinery and equipment
7.15 5.18 5.13 5.08 5.19
352 Railway and tramway locomotives
0.06 0.08 0.05 0.19 0.21
34 Motor vehicles, trailers 31.38 36.36 36.17 35.44 35.75
354 Manufacture of bicycles and motorcycles
0.18 0.54 0.49 0.60 0.70
355 Manufacture of transport equipment n.e.c.
0.01 0.01 0.00 0.01 0.01
36,37 Other manufacturing industries
1.09 1.05 0.98 0.96 0.97
242-2423
Chemical products except pharmaceuticals
1.69 1.74 1.93 1.94 2.18
Low Technology 37.89 32.65 32.68 33.16 32.14
15,16 Food, beverages, tobacco 9.00 9.33 9.67 10.49 9.79
17-19 Textile, clothing, leather 8.45 7.24 7.25 7.44 7.26
20 Wood and wood products
2.12 1.70 1.82 1.84 1.96
21-22 Paper and printing 3.52 2.82 2.92 2.75 2.66
231 Manufacture of refined 2.27 1.65 1.06 0.95 0.75

82
petroleum products
232 Coal and petroleum products
0.45 0.36 0.21 0.16 0.11
26 Other non-metallic minerals
3.36 3.09 3.07 3.04 2.90
271 Manufacture of basic metals
5.28 4.05 3.87 3.64 3.63
28 Fabricated metals 3.13 2.38 2.74 2.81 3.04
351 Building and repairing of pleasure and sporting boats
0.30 0.04 0.08 0.05 0.04
D Manufacturing 100 100 100 100 100
Source: own calculations based on Eurostat Comext data
If we observe Spanish exports to the European Union on the SITC 5 digit product
level (table A9 in annex), we can see that in 1998 the first ten product group (from
the 3464 items) represented 35% of total Spanish exports. Even among the first
ten, there is a high concentration to the first article (17%), which is "motor
vehicles for the transport of persons (SITC 78120)". Parts and accessories for
motor vehicles and motor vehicles for the transport of goods occupy the second
and third places, which prove the high role of the automotive industry in the
Spanish exports. This branch has been one of the most important targets of foreign
investors and it is completely in foreign hands. Statistical calculations also confirm
the above mentioned high concentration: the Herfindahl-Hirschmann index69 for
EU-imports from Spain was 0.175 in 1990, 0.217 in 1993 and 0.188 in 1998.70
Analyses of the Spanish foreign trade structure (Gordo, [1996]) reinforce that after
the adhesion, Spain remained weak in producing products of high technological
content, and strong in producing consumer goods, which sector however has been
vulnerable to the liberalisation process.
As in other CEEC's, the reorientation of Hungarian foreign trade towards the EU
took place around 1990–91.The reorientation process in Central Europe has been
thoroughly analysed by others (Gács [1994], Landesmann [1994], Brenton-Gros
69HHI= [Σisi
2 ]1/2 , where si is the share of the product group in total exports. The index varies between 1/n1/2 and 1 (full concentration). 70 Own calculations based on SITC 5-digit nomenclature, Eurostat Comext.

83
[1997] and Havlik [1996] etc.) The collapse of the Comecon markets obliged firms
to seek new markets. Much of their production capacity had to be closed down or
restructured. The main direction of exports became Western markets as early as
1991. From our point of view, the question can be raised whether or not foreign
direct investment played a role in this reorientation process. Some foreign
investment was already taking place in 1990. However, major flows of FDI and
massive production by FIE's can be said to have begun about 1991–92. So the
FIE's cannot be said to have played a big role in the geographical reorientation of
trade as such. They only intensified (and later modified) an already existing
structure.
Turning to the present geographical distribution of trade, 76.2 per cent of the
exports and 64.4% of imports were realised with the EU in 1999 (table A10 in
annex). The EU share has been increasing steadily since the major reorientation of
trade, partly because of the accession of EFTA countries and partly through a real
growth of trade. FDI contributed to the latter in two ways. On the one hand, US,
Japanese and other non-EU multinationals have set out to penetrate the EU market
through the associated CEE countries. (The association agreements with the EU
set out to establish industrial free trade, while applying rules of origin for
products.) On the other hand, export-oriented firms and multinationals from the
EU found good opportunities for outsourcing some of their activity to the four
countries. Foreign investment provided new markets and contacts for privatized
firms.
FIE's also play a role in increasing trade among Hungary and the neighbouring
countries. Foreign investors have been able to utilise earlier contacts of the
acquired domestic firms. Those aiming to conquer new markets, have established a
base in one of the four countries, intending to supply the whole region from there.
FIE's have contributed strongly to a revival of intra-regional trade in recent years.
They are active especially in chemicals, foods and raw materials, where they treat
the whole region as a domestic market.
For today, the most important characteristic of Hungarian foreign trade is the
activity of industrial customs-free zones. Since 1994, two new trends can be

84
observed.71 From one side domestic companies relocated their activity to customs-
free zones, and from the other side foreign "follower" supplier firms invested in
such zones. It seems, thus, that there is a self-increasing trend of customs-free
zones. There were around 100 industrial customs-free zones spread throughout
Hungary in 1998, the majority of which belong to the machinery industry.
Investments in these zones are mainly 100% foreign-owned and greenfield
investments. In 1996 these areas produced a 318 million USD trade surplus, in
1997 1026 million USD, in 1999 2091 million USD, so they have increasingly
contributed to the improvement of the foreign trade balance of the country. In
1999, 43% of the Hungarian exports and 30% of the imports stemmed from
customs-free zones. These zones give the dynamic of the exports, in 1999 the
extent of export increase here was 30% (compared to the previous year), while it
was a 3.2 % decrease in the case of the traditional exports. Regarding the direction
of customs-free trade, two-thirds of this export and more than half of this import is
carried out only with Germany. The share of Spain and the UK is also important.
The share of customs-free exports to the CEEC region is very small but has been
increasing and the balance in this direction is also positive (Baghy [1999]).
Concerning the product composition of customs-free trade, almost 100% of this
export is given by group SITC 7 (machinery and transport equipment). The role of
customs-free zones is thus the pure manifestation of the effect of FDI on foreign
trade in Hungary. The impact of customs-free trade on the foreign trade structure
and development is entirely due to foreign investments and capital.
Based on the importance of export-oriented investments and the increased weight
of the above mentioned customs-free zones, our hypothesis is that FIE's have had a
strong influence on the change of the product composition of exports. It is worth
examining how significant these changes were in the whole structure of Hungarian
exports to the EU in 1990-98. The Finger similarity index72 provides a certain
view of the structural changes. The value of the index shows the extent to which
the export structure in 1998 resembled that of 1990. Clearly, considerable changes
have taken place over these years, as the value of the index is 0.40. This means
71 See Antalóczy [1999]. 72F=Σmin(Xi90,Xi98)*100, where X90 and X98 are the shares of the commodity i in total exports in 1990 and 1998.

85
that the export structures are only 40 per cent similar.
Observing the structural changes in Hungarian exports after having divided the
examined period into sub-periods, it turns out that one major part of the structural
changes happened between 1990-1991 (see Éltető, 1998b). This means that in
Hungarian exports, huge structural changes took place during one year. The main
driving factor was the above-mentioned forced reorientation of trade and not FDI.
However, afterwards there is a second, longer and smoother period of structural
changes where the effects of FDI are already important, taken into account the
growing activity of greenfield investments described above. Changes in the export
structure manifest interesting trends if we group the manufacturing sectors
according to technology level (Table 11.)
Table 11.: Share of industries in Hungarian manufacturing export (%)
ISIC sectors 1990 1993 1996 1997 1998
High Technology 9.73 16.26 25.84 32.57 34.54
2423 Pharmaceuticals 0.37 0.29 0.12 0.11 0.08
30 Office machinery 0.18 0.90 3.22 6.99 9.22
32 Radio, TV sets 1.47 2.02 6.56 9.81 10.97
31 Electrical machinery and appliances
7.05 11.74 14.74 14.48 13.01
353 Aircraft, spacecraft 0.04 0.18 0.03 0.02 0.03
33 Medical, precision, opt. instruments
0.62 1.14 1.17 1.16 1.23
Medium technology 23.52 24.62 32.92 34.66 37.12
241 Organic, inorganic basic chemicals
7.55 5.36 4.01 3.50 2.65
251 Manufacture of rubber products
1.42 1.31 1.25 1.17 1.20
252 Manufacture of plastic products
0.45 0.84 0.90 0.95 0.81
272-73
Non-ferrous metals. aluminium
3.74 2.37 2.77 2.68 2.00
29 Machinery and equipment 7.94 7.01 5.92 5.41 5.26
352 Railway and tramway locomotives
0.02 0.14 0.22 0.24 0.37
34 Motor vehicles, trailers 1.25 5.21 16.30 19.51 23.71
354 Manufacture of bicycles 0.01 0.04 0.08 0.05 0.05

86
and motorcycles
355 Manufacture of transport equipment n.e.c.
0.00 0.00 0.01 0.01 0.01
36,37 Other manufacturing industries
0.69 0.89 0.66 0.60 0.52
242-2423
Chemical products except pharmaceuticals
0.44 1.44 0.80 0.56 0.54
Low Technology 66.75 59.12 41.24 32.76 28.34
15,16 Food, beverages, tobacco 19.94 13.96 8.53 6.21 4.77
17-19 Textile, clothing, leather 24.79 27.22 16.42 13.54 11.68
20 Wood and wood products 4.83 4.68 3.89 3.26 3.22
21-22 Paper and printing 1.26 1.18 1.01 1.05 0.96
231 Manufacture of refined petroleum products
2.53 1.59 2.50 1.53 1.16
232 Coal and petroleum products
0.51 0.25 0.11 0.07 0.03
26 Other non-metallic minerals
2.37 2.90 1.81 1.51 1.40
271 Manufacture of basic metals
6.88 2.27 2.85 2.02 2.04
28 Fabricated metals 3.48 4.65 4.11 3.54 3.07
351 Building and repairing of pleasure and sporting boats
0.16 0.43 0.02 0.03 0.01
D Manufacturing 100 100 100 100 100
Source: own calculations from Eurostat Comext database
The first striking phenomenon is the extremely rapid increase of high-technology
sectors in manufacturing exports. This share more than tripled during seven years
and in 1998 reached 34%. This trend is due to three subsectors, electrical
machinery, telecommunication equipment and office machinery. Meanwhile, the
traditionally important pharmaceutical sector lost some of its importance.
Medium-technology sectors also increased their share (although to a much smaller
extent) for which the motor vehicle branch is entirely responsible. The share of
low-technology sectors, however rapidly decreased, mainly due to the food and
beverage, textile-clothing and basic metal branches73. (These results are in line
with those of Eichengreen-Kohl (1988) who find that among CEEC's, Hungary
73 The decrease refers to the share, the absolute value of the low-tech exports has increased.

87
displays huge increases in R&D, capital and skill-intensive sectors and
corresponding drops in low R&D and low skill-intensive sectors.) Török-Petz
[1999] constructed an econometric model and proved the explaining role of R&D-
intensity in shaping export structure change and development. Regarding the
import side (not shown in the table), the share of high-tech groups in Hungarian
imports from the EU was 20.85% in 1998. The share of medium-tech and low-tech
groups were 51.21% and 27.90% respectively.
Observing the total Hungarian-EU trade on the SITC 5 digit product level (table
A11 in annex), it turns out that the first ten product groups were responsible for
35.6 per cent of the total exports to the EU in 1998 with a considerable increase
from 1990 (then 13%). Meanwhile the structure of the top ten completely changed.
The leading export product in 1990 (footwear) and the agricultural and other non-
machinery products completely vanished from the list. The top product group with
by far the largest share in 1998, 12 per cent, is reciprocating piston engines for
cars of a cylinder capacity exceeding 1000 cc’s. Computer storage units and video
recording apparatus are in second and third place with 4.37% and 3.48%
respectively. These are high-tech products such as several other products in the top
ten: telecommunications equipment, storage units for automatic data processing
and electrical machinery products. These products are produced by a small number
of multinational affiliates (mainly in customs-free zones). In 1998, three
companies (IBM, Phillips, GE) produced 61% of total high-tech exports for
Hungary.
Since the top ten groups account for a large and increasing share in exports at such
a detailed product level, concentration can be called an important characteristic of
Hungarian exports to the EU. This can be underlined also by statistical
calculations on concentration. Values for the Herfindahl-Hirschmann index
increased significantly between 1990 and 1998. In 1990 the HHI index was 0.068.
In 1993 it was 0.077 and in 1998 it was 0.157.74
As it turns out from the product structure, the increasing concentration of exports
was caused by the activity and export growth of FIE's in certain branches. Other
branches did not manifest such a rapid rate of increase, so that their weight in total
exports has fallen. The data show a general trend for two groups of products still

88
important at the beginning of the 1990s to lose export shares in the period up to
1996. One group consists of textile, clothing and leather products, which are
strongly associated with outward-processing and not dominated by FDI. The other
group, whose share tended to decrease is iron and steel and raw-material products
(wood, fossil fuels, cement). Meanwhile there was an already mentioned increase
in the electrical, office and transport machinery groups, where foreign investment
had taken place.
Inter-industry trade
The concept of revealed comparative advantages was introduced in Chapter I. The
RCA index we apply here is also-called a "specialisation index" (Török, [1986]) or
"net export index" (Balassa-Noland, [1987])) and its definition is:
RCA = 100*(Xi-Mi)/(Xi+Mi), where Xi is the exports of sector i and Mi is its
import. We can speak about advantages, or specialisation if the value of the index
is positive.
For the EU-Spain relation Martín [2000]calculated the above defined RCA index
and concluded that there have been certain changes after the adhesion. There has
been a deterioration of RCA values in almost every sector until 1994. This
tendency was especially strong in the case of certain branches which had
traditionally strong comparative advantages. In the transport equipment and non-
metallic mineral branch, specialisation existed in each observed year. Revealed
comparative disadvantage decreased from 1989 in high-tech sectors, and in low-
tech sectors. Slight comparative advantages are shown in medium-tech sectors. As
Martín [2000] points out, major changes (deterioration) in Spanish RCAs took
place between 1985 and 1989, and in certain branches these were rather drastic. As
mentioned, these are those labour and resource intensive sectors where
traditionally and even one year before the adhesion Spain still had comparative
advantages, like textiles, food and beverages, rubber, etc. The reason for this
phenomenon is that before the accession Spanish specialisation patterns were
distorted because of the protective tariff structure. Once this was removed the
distortions also gradually ceased.
Our analysis refers to the nineties. Table 12 shows that from 1990 to 1998 the
74 Own calculations based on Eurostat Comext

89
mentioned tendencies were slowly reversed, the food sector showed positive RCA
values again, and that of textile products has improved since 1993. At the same
time, improvement in the field of high-technology goods was much slower, and no
new revealed comparative advantages appear there. It seems, thus, that after a
period of “shock” caused by the liberalisation measures and import boom Spain
has - to a certain extent - respecialised itself in those traditional branches where it
had revealed comparative advantages before EU-membership.
As described in chapter II., the most popular manufacturing sectors for foreign
investors were food and beverages, transport equipment, non-metallic minerals,
paper and printing. All of these sectors possessed revealed comparative advantages
in 1985 but had deteriorating RCA values afterwards. Some of them later
recuperated.
Table 12. RCA indices, Spain-EU relation
ISIC rev3
sectors 1990 1993 1996 1997 1998
High technology -40.81 -33.34 -36.29 -35.25 -35.19
2423 Pharmaceuticals -27.89 -40.94 -31.33 -33.10 -20.15
30 Office machinery -46.38 -40.81 -38.23 -49.83 -48.90
32 Radio, TV sets -50.62 -31.75 -43.36 -35.75 -39.37
31 Electrical machinery and app.
-26.40 -27.26 -26.77 -24.51 -26.01
353 Aircraft, spacecraft -27.82 6.96 -30.39 -22.88 -17.21
33 Medical, precision, opt. instruments
-63.04 -61.09 -51.44 -53.16 -51.40
Medium technology -19.81 -9.49 -6.88 -9.64 -12.00
241 Organic, inorganic basic chemicals
-33.67 -33.56 -30.04 -34.75 -36.17
251 Manufacture of rubber products
5.35 4.23 0.32 0.42 1.31
252 Manufacture of plastic products
-8.71 -30.33 -25.28 -26.23 -24.67
272,273
Non-ferrous metals, aluminium
-29.25 -15.76 -3.82 -7.69 -15.84
29 Machinery and equipment -48.45 -43.54 -46.26 -48.78 -50.60
352 Railway and tramway locomotives
-17.24 -29.54 -37.89 27.96 17.11
34 Motor vehicles, trailers -2.10 10.62 13.90 11.53 7.49

90
354 Manufacture of bicycles and motorcycles
-69.21 -12.90 -3.18 -0.63 -0.35
355 Manufacture of transport equipment n.e.c.
-53.16 -63.61 -74.63 -69.01 -71.97
36,37 Other manufacturing industries
-40.63 -43.66 -36.69 -36.84 -36.49
242-2423
Chemical products except pharm.
-37.34 -44.56 -35.61 -38.50 -33.49
Low technology -2.53 -10.33 -6.56 -6.64 -8.04
15,16 Food, beverages, tobacco 2.59 -7.27 3.70 8.94 5.22
17,18,19
Textile, clothing leather -0.52 -15.68 -7.39 -5.91 -6.66
20 Wood and wood products -3.18 -8.42 -7.90 -9.16 -8.82
21,22 Paper and printing -11.37 -20.01 -27.61 -29.45 -30.76
231 Manufacture of refined petroleum
18.52 -3.48 3.93 -23.84 -19.99
232 Coal and petroleum products
54.65 60.19 48.72 27.19 20.54
26 Other non-metallic minerals
11.84 12.55 14.70 13.69 14.35
271 Manufacture of basic metals
-7.99 -0.19 -8.53 -16.74 -17.04
28 Fabricated metals -23.43 -32.80 -24.08 -20.16 -19.94
351 Building and repairing of boats
-25.06 -65.40 -45.24 -59.97 -71.05
D Manufacturing -17.56 -13.71 -11.88 -13.10 -14.93
Source: own calculations from Eurostat Comext database
Table 13. Revealed comparative advantages, Hungary-EU relation
ISIC rev3
1990 1993 1996 1997 1998
High technology -23.82 -20.47 -5.22 6.38 8.57
2423 Pharmaceuticals -31.49 -45.62 -66.20 -62.42 -64.58
30 Office machinery -85.07 -63.83 -16.04 14.00 13.94
32 Radio, TV sets -47.24 -50.70 -13.76 9.31 13.62
31 Electrical machinery and app.
17.62 13.82 12.94 12.66 12.34
353 Aircraft, spacecraft 7.44 -29.91 -82.41 -88.00 -86.13
33 Medical. precision. opt. instruments
-71.73 -58.81 -47.86 -46.66 -40.14
Medium technology -36.80 -41.37 -19.39 -19.10 -17.82

91
241 Organic. inorganic basic chemicals
-9.06 -18.47 -21.48 -21.46 -25.40
251 Manufacture of rubber products
11.34 5.03 -0.02 -5.09 -0.13
252 Manufacture of plastic products
-36.31 -38.69 -37.44 -34.12 -41.95
272.273
Non-ferrous metals. aluminium
64.88 24.97 33.31 24.54 16.26
29 Machinery and equipment -51.35 -48.24 -47.58 -46.42 -47.19
352 Railway and tramway locomotives
-46.55 -12.36 -42.84 0.74 41.47
34 Motor vehicles. trailers -70.85 -55.37 6.21 -0.86 -0.67
354 Manufacture of bicycles and motorcycles
-78.51 -77.63 -31.70 -42.39 -36.09
355 Transport equipment n.e.c. -94.48 -85.03 -15.88 -5.72 -8.56
36.37 Other manufacturing industries
-51.45 -52.68 -52.30 -55.33 -57.73
242-2423
Chemical products except pharm.
-82.42 -58.15 -66.96 -73.70 -71.42
Low technology 28.52 9.86 3.24 -2.14 -2.91
15.16 Food. beverages. tobacco 68.90 30.46 39.22 26.35 28.82
17.18.19
Textile. clothing leather 10.53 9.06 3.89 3.55 3.18
20 Wood and wood products 68.34 25.92 28.04 24.24 24.86
21.22 Paper and printing -39.61 -53.65 -68.53 -63.30 -61.52
231 Manufacture of refined petroleum
88.13 64.99 45.03 33.51 44.23
232 Coal and petroleum products
88.53 32.39 -2.96 -16.88 -47.50
26 Other non-metallic minerals
-4.14 -3.15 -25.59 -28.48 -27.01
271 Manufacture of basic metals
36.52 -10.00 5.08 -10.90 -9.51
28 Fabricated metals -1.23 -6.87 -13.69 -18.63 -23.84
351 Building and repairing of boats
66.11 81.78 -17.17 -20.32 -54.80
D Manufacturing -1.89 -13.87 -7.44 -6.50 -5.81
Source: own calculations based on Eurostat Comext database.
In the case of Hungary, the findings in Table 13. reveal some interesting trends. A

92
radical and then milder decrease can be observed in the labour-intensive, low
technology sectors. Traditionally well-performing sectors like textiles, food, wood,
petroleum have still conserved comparative advantages but to a much smaller
extent than in 1990. On the other hand, there is a rapid improvement of the index
for high technology-intensive products. The RCA index has even turned positive
since 1997, which already shows a clear specialisation. This is caused by the office
machinery sector (that means by the automatic data processing storage units),
radio,TV, video sets and electrical appliances.
On that basis, one can say that Hungary has maintained its specialisation (although
to a lesser extent) in labour-intensive, low technology goods, but at the same time
has been able to develop an important export activity in high technology goods.
Since the RCA index used here is calculated from the export and import ratios of
products, the RCA value will rise if exports are increasing considerably faster than
imports. This is just what happened in some high and medium-technology
products (cars and components, electronic equipment, etc.) between 1990 and
1998. The production of these goods is already dominated by efficiency-seeking
FIE's. Changes in RCA values seem to have mainly been due to the increase of
exports in a few dominant goods produced by multinationals. Improvement in the
high-technology field shows that foreign investors invested in those sectors where
they could utilise a qualified labour force.75 Due to the activity of FIE's, skilled
labour intensity is increasingly manifest in foreign trade.
Intra-industry trade
As mentioned in Chapter I., by intra-industry trade we mean the exchange of the
same type of goods. In the case of trade partners with similar factor endowments,
integration can promote this kind of trade. We analyse now the Spanish and
Hungarian -EU relation from this aspect.
The basic indicator used to measure intra-industry trade is the Grubel-Lloyd index
based on the work of Grubel and Lloyd [1975]. The definition of the index for a
given product group i is the following:
Bi = 1-[(Xi-Mi)/(Xi+Mi)]*100

93
The index for the whole economy (or a sector group) is the weighted average of
the product group indices according to the weight of the product groups in foreign
trade (Wi). X and M are export and import respectively:
Biw = Σ Wi Bi where
Wi = (Xi+Mi)/ Σ(Xi+Mi)
The value of the index can change between 0 and 100, a higher index means a
higher level of IIT. Note that the less detailed aggregation used, the higher the
value of the index is, IIT should therefore be calculated at a very detailed level of
classification.76
As mentioned in Chapter I., intra-industry trade can be separated into horizontal
(HIIT) and vertical (VIIT) types based on the unit value of exports. This method
proxies quality differences of export and imports.77 If the export and import unit
value differ by less then 15% then IIT is horizontal (the traded goods are of the
same quality), if the difference is bigger in such a way that export unit values are
higher then IIT is high quality vertical, otherwise IIT is low-quality vertical.78
In the case of Spain Martin-Gordo [1996], Carrera [1997], Blanes-Martín [2000]
and Martín [2000] examined intra-industry trade patterns. In line with the above
mentioned aggregation problems Carrera [1997] found that IIT values for Spain
vary between 25% and 63% depending on the classification details used. He also
finds that the major part of Spanish IIT is of the vertical type, independently from
the election of commercial partners analysed. Within the vertical type, low quality
dominates. Carrera [1997] also concludes that as for the specialisation patterns of
Spanish trade with less developed countries differ from the patterns with more
developed countries, bilateral IIT values are much lower in several cases than the
aggregated one. Blanes-Martín [2000] calculated IIT between Spain and the
OECD countries and non-OECD countries separately for the 1988-1995 period.
They found that IIT has been constantly growing, vertical type is more significant
75 This statement is reinforced by the survey results on motivations described previously. 76 The GL indicator was "dynamised" by Brülhart (1994) who introduced the concept of marginal IIT, which takes the change of export and import into consideration. About problems of the GL indicator and other types of measures see Vona (1991) more detailed. 77 The principle of “bigger price, bigger quality” can be criticised (for example the products can be overpriced), however there is no better method found out for signing quality differences. 78 If 0.85≤ UVx/UVm ≤1.15 than IIT is horizontal

94
than the horizontal one particularly with non-OECD countries. What is more, low
quality VIIT is greater with OECD countries and high quality VIIT is greater with
non-OECD countries. IIT patterns thus also depend on the development level of
the trade partner.
Regarding the EU-relation, which is in our focus, Martín [2000] aggregated
indicators from an SITC 5 digit level. It turned out that intra-industry trade
increased after the adhesion to the EU. In 1985 the index was 43.6, in 1992 it was
57.5 and in 1997 it was 57.8 for the total manufacturing industry. In the second
half of the eighties in Spanish-EU trade, vertical IIT was everywhere higher than
horizontal IIT and within vertical IIT, generally low quality dominated.79
Using the same method we calculated total, vertical and horizontal IIT indices for
1990 and 1998 in Spanish-EU trade. We apply the sectoral grouping according to
technology level as before. The results are shown in table 14.
Table 14. Intra-industry trade between Spain and the EU, 1990 and 1998
sectors IIT Horizontal Vert. low Vert. high
High technology 1990 1998 1990 1998 1990 1998 1990 1998
Pharmaceuticals 55.4 49,0 0.2 22,2 17.1 25,2 37.1 1,6
Office machinery 53.1 48,7 20.5 2,7 25.1 4,7 7.5 41,3
Radio, TV sets 47.6 43,1 31.2 1,8 12.4 30,2 4.0 11,1
Electrical machinery and appliances
65.6 63,9 28.4 29,6 28.2 29,2 9.0 5,1
Aircraft, spacecraft 42.9 66,0 0.0 24,6 11.6 35,4 31.3 6,0
Medical, precision, opt. instruments
36.1 46,9 6.9 18,9 22.4 19,1 6.8 8,9
Medium technology
Organic, inorganic basic chemicals
38.5 45,1 11.1 10,5 19.0 25.1 8.4 9,5
Manufacture of rubber products
77.1 79,3 54.5 48,1 19.8 24,1 2.8 7,1
Manufacture of 73.1 67,7 55.4 26,7 17.7 36,8 0.0 4,2
79 Developments of intra-industry trade between Spain and the EU cover different patterns with the member states. Gordo-Martín [1996] observes that Spain's trade with Germany exhibits a high proportion of vertical low quality IIT while in the bilateral trade with Portugal high quality vertical IIT dominates.

95
plastic products
Non-ferrous metals, aluminium
40.7 61,4 21.9 27,3 15.9 30,9 2.9 3,2
Machinery and equipment
44.8 45,1 13.3 10,7 25.4 27,7 6.1 6,7
Railway and tramway locomotives
56.4 60,3 3.0 58,6 50.1 0,3 3.3 1,4
Motor vehicles, trailers
76.8 73,4 12.8 62,4 62.1 4,2 1.9 6,8
Manufacture of bicycles and motorcycles
30.7 87,8 16.1 53,6 14.0 21,0 0.6 13,2
Manufacture of transport equipment n.e.c.
46.8 28,0 0.0 28,0 46.8 0,0 0.0 0,0
Other manufacturing industries
44.7 50,5 11.9 15,3 16.4 26,8 16.4 8,4
Chemical products except pharmaceuticals
51.3 55,9 16.8 20,6 23.9 22,4 10.6 12,9
Low technology
Food, beverages, tobacco
26.9 39,3 5.7 13,2 10.9 14,2 10.3 11,9
Textile, clothing leather
44.7 58,7 12.9 20,6 19.7 24,6 12.1 13,5
Wood and wood products
62.5 70,8 33.6 29,1 17.8 26,1 11.1 15,6
Paper and printing 51.9 52,2 22.2 23,9 24.7 23,7 5.0 4,6
Manufacture of refined petroleum products
55.2 58,3 22.8 34,1 3.2 0,0 29.2 24,2
Coal and petroleum products
32.1 53,9 27.4 30,9 4.0 20,6 0.7 2,4
Other non-metallic minerals
47.2 50,7 12.3 12,8 22.2 25,3 12.7 12,6
Manufacture of basic metals
52.2 50,3 39.1 39.5 8.6 13,9 4.5 3,1
Fabricated metals 64.0 68,4 27.5 23,5 30.7 30,7 5.8 14,2
Building and 31.2 21,9 4.2 11,9 26.8 7,1 0.2 2,9

96
repairing of pleasure and sporting boats
Manufacturing 55.5 58.8 17.6 31.3 31.0 18.0 6.9 9.5
Source: own calculations from Eurostat Comext data
In total manufacturing and in most sectors intra-industry trade has grown.
Exceptions are the plastics, basic metal sector, pharmaceuticals, production of
boats, motor vehicles, transport equipment, electrical machinery and radio-TV
sets, where IIT decreased. Horizontal IIT increased considerably in general which
means an improvement in manufacturing export quality. Among the high-
technology sectors horizontal IIT has grown radically in aircraft, spacecraft,
pharmaceuticals, medical instruments, but decreased radically in office machinery
and telecommunication equipment groups. Regarding medium-technology
branches, a significant horizontal IIT increase can also be seen in the chemicals,
manufacture of transport equipment, motor vehicles, bicycles, motorcycles,
railways. In the low-quality group, horizontal IIT has grown, except for wood
products, fabricated metals. In a lot of cases vertical high IIT increased which also
shows an export-quality improvement.
The case of textile-clothing, food-beverage sectors are especially interesting. If we
remember, these are the branches where traditional comparative advantages
decreased after the adhesion but were reinforced again for 1996-98. The increase
in horizontal or vertical high-quality IIT in these fields means that this
reinforcement has been followed by quality upgrading.
As Martín [2000] and other authors indicate, the observed increase of IIT in
several sectors was caused by the considerably increased imports. Therefore it has
to be indicated here that stemming from the properties of IIT index, an increase of
intra-industry trade can be observed in certain cases if the trade balance improves
but also if the trade balance worsens. The IIT indicator can increase if import
grows from a lower level than export but export remains similar. Therefore we
consider it important to analyse what caused the increase of intra-industry trade.
As we have seen, the developments in the trade balance of a sector are manifested
in the previously used RCA indicator. So with the help of the RCA indicator
combined with IIT indicator we can create four groups of industries. These four
groups are different regarding their “trade adjustment” process.

97
It can be seen below that in the case of wood products, textiles and paper printing,
the increase in IIT derives from the deterioration of the trade balance. The most
positive adjustment process happened in those sectors where both RCA and IIT
improved (certain high and medium-technology products mainly) and adjustment
were the most negative where both indicators decreased (office machinery,
pharmaceuticals, rubber, petroleum, metals)
Table 15.: Positive and negative adjustments in the Spanish manufacturing trade with the EU
1990-1998 IIT increased IIT decreased
RCA increased aircraft-spacecraft, chemical products, precision instruments, machinery, ferr. and non ferr. metals, railway, motorcycles, food, other non-metallic minerals
electrical goods, motor vehicles, radio, TV sets
RCA decreased wood products, textile-clothing, paper and printing, refined petroleum, minerals
pharmaceuticals, office machinery, rubber, plastic, other transport equipment, boats
Blanes-Martín [2000] built a model to explore the determinants of Spanish intra-
industry trade. They included the variable of foreign capital also as explanatory
variable, proxied as the proportion of foreign share holding in the sector’s total
share capital. They found that the determinants of vertical and horizontal IIT are
not the same, the industry-specific variables (technological intensity, scale
economies, product differentiation, etc) behave differently. Technological
intensity for example had a significant positive effect on vertical IIT and a
negative effect on horizontal IIT. According to the expectations it turned out that
vertical IIT seems to be greater in industries that are more intensive in technology
and in industries where this feature interacts with the existence of scale economies.
as far as the effect of FDI is concerned, foreign capital penetration had a
significant positive effect on both vertical and horizontal IIT. This means that the
activity of foreign investment companies influences the development of intra-
industry trade between Spain and its partners.
Regarding Hungary, the domestic literature on intra-industry trade development is

98
yet small. Three studies can be mentioned here. The first is the one made by
Kovács [1996] who used both Hungarian and Eurostat data and calculated IIT and
marginal IIT indices for 1991 and 1994 using SITC 3 digit level (269 products).
The second was made by Gáspár-Kacsirek [1997] where intra-industry trade
indices were calculated for the machinery industry, detailed level of classification
(HS 4 digit) was applied only to selected product groups. The principle of
selection was turnover and the dominant foreign partner. As third, the most recent
is the study of Pula [1999], who also used Eurostat Comext data and calculated IIT
indices for 1988-1996. Here NACE 3 digit classification is used (108 products)
and Grubel-Lloyd and marginal IIT indices are also calculated, but further division
of intra-industry trade (into vertical and horizontal type) is not applied. An
analysis of quality upgrading is however done according to the price/quality-gap
method (Landesmann-Burgstaller [1995]), which consists of the calculation of
product prices and then comparing these to the average price for the given product
in total EU import.
Our methodology is different and new in Hungary, because a far more detailed
classification (the mentioned SITC 5 digit level with 3464 products) is applied and
also the separation of vertical and horizontal IIT is made. The results are then
grouped according to the technology-intensity level generally used in this thesis.
Observing the developments of intra-industry trade in the Hungarian-EU trade
(table 16), it can be confirmed that in almost every branch, intra-industry trade
increased between 1990-98. Regarding the whole manufacturing sector, mainly
horizontal and vertical high quality IIT has grown. In line with the international
experiences the vertical type dominates also in Hungary within intra-industry
trade.
Among the high-technology groups in the case of pharmaceuticals a decrease in
(mostly vertical low quality) IIT can be observed, but in office machinery,
telecommunications equipment and electronic machinery a significant increase is
manifested in horizontal IIT. In the case of medical, precision instruments low
quality vertical IIT increased.
Table 16.:Intra-industry trade between Hungary and the EU, 1990 and 1998
sectors IIT Horizontal Vert. low Vert. high

99
High technology 1990 1998 1990 1998 1990 1998 1990 1998
Pharmaceuticals 43.0 28.8 0.5 1.1 27.6 12.9 14.9 14.8
Office machinery 13.1 46.5 0.9 33.9 10.1 11.4 2.1 1.2
Radio, TV sets 32.6 34.8 1.3 12.9 26.8 16.6 4.5 5.3
Electrical machinery and app.
38.4 53.3 8.0 17.4 28.0 26.3 2.4 9.6
Aircraft, spacecraft 60.0 13.0 0.0 0.2 3.5 12.5 56.5 0.3
Medical, precision, opt. instruments
25.1 44.9 0.9 2.7 18.3 35.7 5.9 6.5
Medium technology
Organic, inorganic basic chemicals
20.6 27.8 2.5 3.6 11.2 19.0 6.9 5.2
Manufacture of rubber products
34.1 55.8 2.6 3.3 31.1 41.7 0.4 10.8
Manufacture of plastic products
51.4 52.8 0.0 11.4 50.6 39.1 0.8 2.3
Non-ferrous metals, aluminium
19.5 39.3 3.8 13.9 12.7 25.3 3.0 0.1
Machinery and equipment
32.1 37.8 0.7 6.2 30.6 25.7 0.8 6.0
Railway and tramway locomotives
36.5 57.6 1.2 15.7 35.3 41.8 0.0 0.1
Motor vehicles, trailers
17.9 30.5 2.7 0.1 13.5 12.7 1.7 17.7
Manufacture of bicycles and motorcycles
19.4 47.7 0.0 6.0 14.7 14.4 4.7 27.3
Manufacture of transport equipment n.e.c.
5.5 91.4 5.5 0.0 0 0.0 0 91.4
Other manufacturing industries
33.4 23.6 0.2 4.3 30.9 13.8 2.3 6.5
Chemical products except pharmaceuticals
11.4 12.7 0.3 2.7 9.8 6.3 1.3 3.7
Low technology
Food, beverages, tobacco
9.1 21.8 1.3 2.9 3.9 7.3 3.9 11.6
Textile, clothing leather
33.7 38.1 11.6 10.4 13.5 8.1 8.6 19.6

100
Wood and wood products
23.3 52.9 0.5 3.6 22.5 46.0 0.3 3.3
Paper and printing 22.2 26.1 1.6 3.0 19.6 14.6 1.0 8.5
Manufacture of refined petroleum products
1.8 40.3 0.0 26.9 1.8 13.2 0.0 0.2
Coal and petroleum products
11.5 9.1 0.0 0.0 11.5 9.1 0.0 0.0
Other non-metallic minerals
39.1 49.4 1.9 8.0 30.6 27.7 6.6 13.7
Manufacture of basic metals
17.2 31.8 0.5 2.2 16.2 27.7 0.5 1.9
Fabricated metals 47.0 54.7 2.2 3.0 44.1 47.2 0.7 4.3
Building and repairing of pleasure and sporting boats
4.3 40.8 0.2 21.9 3.8 16.8 0.3 2.1
Manufacturing 26.8 38.2 4.0 8.9 18.9 19.2 3.9 10.1
Source: own calculations from Eurostat Comext data
In the case of low technology sectors, increase in intra-industry trade (although
from a low level) is general and in several cases it means an increase in horizontal
or vertical high quality IIT (textile, paper, metals), which suggests quality
upgrading. Regarding medium-technology sectors, the situation is the same. The
increase in vertical high quality IIT is especially spectacular in the case of
transport equipment (except for railway locomotives).
Quality upgrading in certain (mainly machinery) branches is confirmed by the
price-quality gap analysis of Pula [1999]. He also states that this upgrading is the
biggest in those branches where intra-industry trade has an important role,
therefore quality catch-up is not a precondition but a consequence of increasing
IIT. We conclude that in these branches the increase in IIT is mainly due to the
intra-firm trade of multinational affiliates.
If we observe the adjustment of the branches according to the classification box
created previously we can see that this was very successful in almost all high and
medium technology sectors (those areas where FIE's are especially active) and was
the least positive in pharmaceuticals and aircraft-spacecraft (see table 17). In all
low technology sectors, increases in IIT came from the worsening of the trade
balance. It should be mentioned here again that this analysis takes only trade with

101
the EU into consideration. Patterns of RCA and IIT are significantly different in
the Central European or other non-EU relations.80
Table 17. Positive and negative adjustments in Hungarian manufacturing trade with the EU
1990-1998 IIT increased IIT decreased
RCA increased office machinery, radio, TV sets, electrical machinery, precision instruments, chemicals, plastic products, transport equipment, machinery
-
RCA decreased rubber products, food, textile-clothing, wood, paper and printing, petroleum, minerals, non-metallic minerals, basic and fabricated metals, boats
pharmaceuticals, aircraft, coke, furniture, other manufacturing
Based on the product-level analysis we can state that FDI does play an important
role in the increase of intra-industry trade between Hungary and the EU. (The
conclusions of Aturupane-Djankov-Hoekman [1997] obtained on the basis of an
econometric analysis of EU-CEEC trade after controlling for country-specific
factors are similar, they found a positive and significant relationship between FDI
and both vertical and horizontal intra-industry trade.) The growth of IIT made the
mutual trade pattern more similar to the EU member states' intra-trade (where high
levels of intra-industry trade are characteristic).81
80 Pharmaceuticals for example underwent an important restructuring and regained positions in the Eastern market in the end of nineties. 81 However, if we regard the Hungarian trade separately with some important EU-members, it turns out that the effect of FDI can be twofold on intra-industry trade. FDI either can increase this type of trade, like in case of the German-Hungarian relation where the indicator has grown radically or FDI can hold the level of intra-industry trade low, as in the case of the Spanish-Hungarian relation where the index remained almost unchanged (Éltető [1998]). In this latter case more than two third of the mutual trade is given by one product: GM Hungary delivers motors to a Spanish factory. But because there is no similar import from Spain (GM Hungary imports its inputs from other countries) there is no appearance of intra-industry trade. Therefore, the level of intra-industry trade (and the effect of FDI on it) depends not only on the aggregation level but also on the country group we define. (This phenomenon is called "geographical bias" by Fontagné-Freudenberg [1997] who argue that when different partner countries are put together, the sign of the trade balance for a given product may change from one partner to another and will show up as a "multilateral" intra-industry flow, which is a pure artefact. Though conscious of this fact, in the calculations EU is assumed to be one geographical unit.)

102
V. Conclusions
The decade of the nineties brought important changes in the Hungarian economic
system. This period was characterised by the establishment of liberal market
environment and modernisation. Increasing inflow of foreign direct investment
accompanied the process of liberalisation. Based on the amount of FDI in the
country, for the end of the nineties Hungary is considered to be a success story in
attracting investors within the Central and Eastern European region. Without
doubt, foreign capital contributed to the economic modernisation and in this
respect the development path of Hungary became similar to that of other countries.
Among the peripheral countries of the European Union Spain is such a country;
since the end of the eighties Spanish economic development is also a success
story. A major aim of this thesis was to point out similarities and differences in the
FDI-helped modernisation of the two countries.
If we want to characterise in general the development pattern of Spain and
Hungary and the role of FDI, a major difference can be pointed out, three factors
be taken into account: economic liberalisation, institutional integration into the EU
and structural changes (of converging type to the EU) induced partly by FDI. In
the case of Spain, liberalisation and integration took place first and at the same
time. Structural changes in production and trade were realised later on. In the case
of Hungary, liberalisation happened first, then during the nineties important
structural convergence to developed countries has taken place in which the role of
FDI has been very important and larger than in Spain. Institutional integration will
only follow in the future.
Foreign direct investments have a huge international theoretical literature. There
are several schools and theories on this topic, which were divided into two main
parts in the first chapter of the thesis. To the first part belong the theories
concerning the determinants of FDI and to the second those of dealing with the
effects of FDI on the host economies.
Regarding the determinants, theories and empirical evidence have been organised
into a framework based on three factors: ownership-, location-specific, and

103
internalisation advantages for the investors. The thesis applied this framework to
that extent that it focused on the location-specific advantages of the two countries.
Regarding the effects of FDI, the emphasis has been put on the fields of
technology, productivity, production structure and especially foreign trade,
therefore the literature concerning these fields were described in the beginning
chapter.
Following the theoretical survey, the general characteristics of FDI in the two
countries were described in the second chapter. The amount of FDI absorbed by
both economies has been significant in terms of both GDP and investments.
However, as it turned out, the share of FDI appears to be much bigger in Hungary
than in Spain: the estimated stock of FDI as of the end of 1999 in Hungary was
40% of GDP while in Spain the corresponding figure was 23%. It is a difference
between the two countries that while in Hungary a major way of FDI involvement
has been the privatization process, in Spain privatization began relatively late and
was carried out without significant involvement of foreigners. The two types of
privatization are rather different in their characteristics, scale and nature.
The distribution of foreign capital in the two countries is to a large extent similar.
It was interesting to remark that in both countries foreign investors preferred the
same „globalised” manufacturing industries: chemical sector, electrical machinery,
motor vehicles and food industry register the highest shares of foreign investment.
Regarding the distribution of FDI, one of our previous hypotheses was, that the
bigger the country-size (market-size) the more FDI is oriented to domestic market.
However, the results of the surveys and econometric studies suggest that in both
countries FDI is devoted to supply both the domestic and export markets, which
finding is to a certain extent contradictory to the mentioned hypothesis. In the case
of Hungary, several surveys pointed out that (as in the Spanish case) the local
market is very important for investors. There are two possible explanations for
this. One is that the local market - however small it is - was still a new market. The
other is to think that apart from being a local market, Hungary is also a regional
one: somehow is a door to the Central-European market. As for the Spanish case,
it is clear that the quite big size of the domestic market is one of its attracting
factors, but it is also clear that a significant amount of FDI aims at supplying
exports.

104
We attempted to determine the weight of foreign investment enterprises in the
manufacturing sectors (foreign penetration). Foreign penetration (defined as the
pure foreign share in the total nominal capital of the sector) in the Hungarian
manufacturing industry increased rapidly in the nineties. In manufacturing as a
whole, the share of foreign capital was 56.6% in 1997. If we take the total capital
of foreign investment enterprises into consideration, their share in the sectoral
nominal capital is even higher: in 1997 it was 71%. Foreign participation
companies also have a determining role in the net sales revenue, total export and
value added of the branches. In the Spanish case, any information on sectoral
foreign penetration is only available for the end of the eighties and the beginning
of the nineties. These data were obtained by the estimations made by studies. The
latest estimation elaborated by Martín-Velázquez [1996] for the year 1993
obtained that 44.5% of manufacturing social capital was in foreign hands.
Having described and compared the major patterns of FDI in Spain and Hungary,
our attention has been directed to the assessment of location-specific advantages of
each country. In this respect, on the basis of the analysis carried out in Chapter III.,
some tentative conclusions emerge. First it seems that both the liberalisation
process and EU membership have been important attraction factors of Spain for
FDI. These two factors in great part coincided in time, liberalisation was a
relatively gradual process still going on after the accession. The opening process
of Hungary has been more rapid and radical in the context of its transformation to
a market economy, which seems to have been also a key factor to attract FDI
inflows. The expectation of the future joining to the EU can be considered as an
additional positive factor to capture direct investment projects.
In both countries there are several types of general and regional investment
incentives. In Hungary tax concessions benefited only foreign investors in the
beginning in Hungary but since 1995, they benefit all investors. In the case of
greenfield investments, investors were able to take advantage of tax allowances
and special regulations such as customs-free zones. In any event, as it happen to be
the case in Spain, major investors and large-scale projects (especially in the
automotive industry) were able to negotiate special incentive packages.
Being a further location-specific advantage, theoretical studies have shown how

105
important the technological level and human capital endowment of a country are in
the attraction of FDI. It seems that both Spanish and Hungarian policy-makers
realised the tendencies concerning the rapidly increased role of knowledge and
human capital and promoted R&D activity and innovation such as education. As
an interesting difference, while Spanish incentives target mainly the small and
medium-sized companies, the Hungarian policy measures have attracted the R&D
activity of large multinationals in the country.
Relatively low labour costs belong to location-specific advantages too. Our
calculations have shown that the labour costs of Hungary are still considerably
behind those of Spain and far behind those of Germany while differences in
productivity and unit labour costs are somewhat smaller. In spite of that, several
studies proved that low labour costs alone (disregarding qualification) in neither
countries played a major role in attracting FDI. Even for efficiency seeker
investors the role of human capital, and the qualification of the workforce had
higher importance in both countries.
Certainly, with the changes of macroeconomic situation and business environment
location-specific advantages, as well as the motivations of investors change with
time. It is a general experience, which is true for Hungary and Spain also. In this
thesis we made an evaluation for both countries focusing to the nineties.
Having discovered the attractive factors for investors in the two countries, we tried
to analyse the effects of FDI on the host economies. One can learn that FDI has
had substantial effect on the economy structure. Apart from its direct impact on
savings and investment it induced technological spillovers which has favoured
productivity and growth. Those technological spillovers are however very difficult
to measure. Spanish data show that companies with foreign (mainly majority)
ownership spend more on R&D than domestic firms. The analysis of the structure
of R&D expenditures showed that these mean first of all expenditure on
technology import or licensing. The technology import of foreign investment
enterprises increased a kind of technological dependency. Similarly to Spain,
Hungarian experience shows that R&D intensity of FIE's is much higher than that
of the domestic companies. In both countries we can find examples of
establishment of R&D centres by multinational companies.
The structure of production and value added in the Hungarian manufacturing

106
industry has changed considerably in the nineties, to which the activity of foreign
companies strongly contributed. Changes have been less pronounced in Spain in
the same period. In both countries the presence of foreign capital is associated
with a higher efficiency of labour. The effect of foreign capital as a determining
factor was also detectable in the increase of productivity.
A major focus of our analysis has been the development of foreign trade in the two
countries. Trade and FDI have been considered to be substitutes in the early
theories, but later on their complementary relationship and the trade enhancing
role of FDI was put into the foreground. Chapter IV further on concentrated on the
analysis of the changes in foreign trade specialisation and the likely influence
which FDI may have had on it. In the development of the foreign trade of Spain
and Hungary, the liberalisation process has had similar consequences. In both
countries we can observe a considerable increase in exports and imports. The
increase has been more pronounced in the case of imports, therefore the balance of
foreign trade deteriorated rapidly and drastically. (As it has been seen in the third
chapter, in the case of Hungary this deterioration even caused balance of payment
problems in the beginning of 1995. In Spain the trade deficit could be balanced by
EU transfers and tourism revenues). It is most probable that the foreign investment
enterprises contributed to the deterioration of the trade balance as for it was
observed that in both countries these firms have more propensity to export and
import than domestic companies and what is more, their propensity to import has
been higher than to export. However, towards the end of the examined period, the
activity of export-oriented foreign investment enterprises functioning in industrial
customs-free zones in Hungary has strongly contributed to the improvement of the
trade balance.
An important characteristic of Spanish and Hungarian exports to the EU is
concentration. Although Spanish exports have been more concentrated during the
whole period than those of Hungary, concentration increased rapidly in the case
of Hungary also.
As mentioned, FDI had important effects on the production structure in both
countries. Therefore, we presumed that these changes have also been manifested in
the structure of exports. In Chapter IV, structural changes in the Spanish and
Hungarian exports to the European Union have been examined through the

107
development of technology-intensity of the products between 1990 and 1998. In
the product-classification we applied the method of the OECD, differentiating
among high-tech, medium-tech and low-tech product groups. Based on the results,
we can say that our assumption has been justified. Regarding Hungary, the share
of high technology product groups in the exports increased extremely rapidly
during the nineties. In 1998 this - in international comparison high - share (34.5%)
was much higher than the corresponding Spanish figure (13.5%). The product-
level analysis showed that this tendency has been due to a few technology
intensive products produced by a small number of multinational affiliates in the
country. The strong increase in share of high-tech products took place at the
expense of the low-technology group.
In Spain no such radical changes were observed, high-, and medium-technology
product groups increased and low-technology group decreased somewhat their
share. Thus, the extent of the changes in the export structure coincides with the
extent of the changes in the production structure; in both cases developments in
Hungary have been more radical than in Spain.
The results of the simple structural analysis of the foreign trade give basis to
suppose that the inter-, and intra-industry trade specialisation of the two countries
have also changed. Inter-industry trade specialisation can be measured by one type
of the so called revealed comparative advantage (RCA) indicator, which was
applied in the thesis. One important result of the calculation valid for both
countries is that traditional specialisation patterns prior to the liberalisation have
not been reinforced afterwards. In Spain the deterioration of revealed comparative
advantages - which took place in all manufacturing fields after the accession - has
been the most striking in those labour intensive sectors where the country had
traditionally comparative advantages. In several cases this kind of specialisation
vanished. However, for the end of the examined period, the RCA indicator of
certain labour intensive branches (textile-clothing and the food sector) showed
positive values again, hinting to a certain re-specialisation to the traditional
manufacturing sectors. Revealed comparative advantages of the transport
equipment branch have been maintained during the period.
Developments in Hungary are to some extent similar, but also different in another
sense. Similarly to Spain, revealed comparative advantages of low-technology

108
labour intensive traditional sectors (textile, food, etc.) decreased. This decrease has
not meant the complete vanishing of advantages, specialisation remained existing.
However, at the same time high-technology sectors appeared as new fields of
revealed comparative advantages. As it was the case in the export-structure
changes, this process is due to the same FDI-dominated product groups. In
Hungary thus, the weakening of the specialisation on labour intensive, traditional
products could be compensated by other goods. However, in Spain during the
nineties no new areas of revealed comparative advantage emerged.
Having examined the inter-industry specialisation patterns, in chapter IV also an
in-depth calculation and analysis of intra-industry trade indices were carried out.
The results showed that the general level of IIT in the Spanish manufacturing
sectors is higher than in the Hungarian one. The level of intra-industry trade
increased both in Spain and Hungary during the examined period. Intra-industry
trade was separated into horizontal (trade of same quality products) and vertical
(trade of different quality products) types by applying the unit value calculation
method, in order to judge whether a product quality upgrading has also taken place
or not. It turned out that although in both countries vertical IIT dominates, the
level of horizontal IIT in Spain is in every field higher than in Hungary. Regarding
vertical IIT in Hungary, within this group the share of the low-quality type vertical
IIT is generally higher, but the high-quality type has been increased. This increase,
which hints to a product quality upgrading took place mainly in those product
groups where the trade is dominated by multinational companies, presumably by
intra-firm trade.
We also analysed the statistical components of the increase of intra-industry trade.
Stemming from the properties of IIT index, such an increase can be observed in
certain cases if the trade balance improves but also if the trade balance worsens.
With the combination of the RCA and IIT indicator four different groups could be
created regarding their “trade adjustment” process. Trade adjustment in Hungary
has been very successful in almost all high and medium technology sectors, which
means that the increase of IIT happened together with the increase of foreign trade
balance. Both indices worsened in the case of pharmaceuticals and aircraft-

109
spacecraft, furniture and coke. In all low technology sectors, increases in IIT came
from the worsening of the trade balance. In the Spanish case there are more sectors
where trade adjustment can be said to have been negative. In the case of certain
medium-tech and low-tech products, the value of both indices increased.
In overall, we can conclude that the effect of FDI on foreign trade is much more
apparent in the case of Hungary than in Spain. As we have seen, a small number of
foreign investment enterprises are responsible for the structural, inter-, and intra-
industrial changes in Hungary, while in Spain no such strong role could be
detected. This can be caused partly by the different size of the two countries (in
the small Hungarian market, even the presence of domestic market-oriented FDI is
manifested in exports to neighbouring regions) and to the possible lower extent of
FDI penetration in Spain. Regarding the near future, based on the new investments
and promises in sight, we can state that the concentration of the production and
exports on high-tech goods in electronics and on car-industry products is likely to
continue.82
Finally, based on the results of this thesis some implications for the economic
policy can be made. The present technological structure of the Hungarian exports
to the EU characterised by the high share of high-tech products is very promising
in international comparison. If the maintenance or improvement of this „modern”
structure of exports is desirable, than one way of this is to promote the
investments of foreign companies specialised to high-tech products. Regarding
promotion, the application of individual incentives can be effective only on the
short run. On the long run, however, the improvement of the domestic
technological capacity and of the links between domestic and foreign companies is
82 Major latest investments announced: In November 1999 Audi decided to build a new new motor factory in Gyõr for DM 650 million. On the short run the plant will employ 500 employees, later on more. General Electric will set up a new plant with an investment of USD 100m to produce various energetic equipment for power plants in Veresegyhaza where GE is currently constructing an aircraft engine repair facility. Production is to start at the beginning of 2000. Korea's largest manufacturer of electronic equipments and parts, Samsung Electro-Mechanics Co (SEMCO) is planning to set up a new greenfield electronics assembly plant in Hungary through investment of USD 21m. Sony builds for USD 10 million an LCD monitor plant near to Budapest, Sanyo establishes a mobile phone battery factory in Dorog for USD 100 million and Nakashima a roller bearing factory in Debrecen for USD 10 million.

110
more important. Technological capacity means not only R+D expenditures but
also the development of human capital. The development of these factors increase
the attractiveness of the country in the future and able to maintain and improve
competitive positions internationally and also within the European Union.

111
Annex
Table A1a: Stock of inward FDI as a percentage of the GDP
1990 1994 1995 1997 1998 1999
Hungary 1.7 15.6 26.7 34.7 38.5 39.9
Spain 13.4 25 20 19 21.5 23.1
Table A1b: Inflow of FDI as a percentage of gross fixed capital formation
1991 1992 1993 1994 1995 1996 1997 1998 1999
Hungary 21.2 20.2 32.1 13.7 52.8 20.6 20.5 17.4 12.8
Spain 10 10.6 10.1 9.8 5.9 5.7 5.9 9.5 7.3
Source: UNCTAD World Investment Report 1999
Table A2: Geographical origin of foreign investments in % of total, Spain
Hiba! A könyvjelző nem létezik.
1960-79 1980-85 1986-90 1991-96
EU 15 38,7 41,8 60,0 62.0
France 6,8 9,6 14,8 14.4
Netherlands 4,3 7,1 18,8 13.2
Germany 12,1 10,7 7,9 10.5
UK 8,7 7,7 9,5 8.6
USA 33,4 17,9 4,0 6,3*
Reinvestment 3,0 12,1 22,5 22,6*
* data for 1991-1994
Source: based on DGTE data Martín-Velázquez [1996a] p. 166. and Martín [1997] p.219.
Table A3: FDI inflows into Hungary (millions of current US dollars)
1991 1992 1993 1994 1995 1996 1997 1998 1999
Cash 1459 1471 2339 1147 4453 2275 2173 2037 1944
In kind 155 170 142 173 117 57 22 11 7
Total 1614 1641 2481 1320 4570 2332 2195 2048 1951
Source: Hungarian National Bank and Ministry of the Economy
Table A 4.: Development of foreign penetration (Foreign capital/nominal capital, %)
ISIC Industries 1993 1996 1998 increase 98/93

112
15 Food products, beverages 41.45 50.59 61.02 1.47
16 Tobacco 95.47 67.39 86.84 0.91
17 Textiles 23.69 47.63 53.37 2.25
18 Wearing apparel, dressing
28.49 38.50 49.21 1.73
19 Tanning and dressing of leather
14.40 34.37 50.47 3.50
20 Wood 18.46 51.20 50.95 2.76
21 Paper and paper products 34.45 43.65 69.19 2.01
22 Publishing, printing 27.07 31.33 28.69 1.06
23 Coke and petroleum 0.13 31.51 54.61 420.08
24 Chemicals 19.64 58.71 58.87 3.00
25 Rubber and plastic 40.02 56.86 49.85 1.25
26 Other non-metallic minerals
48.23 68.85 68.78 1.43
27 Basic metals 11.30 36.15 51.06 4.52
28 Fabricated metals 32.41 33.31 60.57 1.87
29 Machinery and equipment n.e.c.
24.53 44.85 49.01 2.00
30 Office machinery 31.23 60.80 77.78 2.49
31 Electrical machinery and app.
73.26 85.06 81.32 1.11
32 Radio, TV sets 17.72 46.29 64.39 3.63
33 Medical, precision, opt. instruments
15.18 29.12 30.91 2.04
34 Motor vehicles, trailers 38.17 64.45 79.52 2.08
35 Other transport equipment
55.11 37.06 39.62 0.72
36 Furniture, manufacturing n.e.c.
22.92 29.41 39.55 1.73
37 Recycling 39.36 15.28 26.67 0.68
D Manufacturing 31.31 50.20 59.75 1.91
Source: calculations based on Central Statistical Office data
Table A 5.: Share of foreign investment enterprises (1998, in percentages)
ISIC number of
organisa-
no.of emplo-yees
net sales revenue
export sales

113
tions
15 Food and beverages 12.93 40.26 55.71 66.98
16 Tobacco 62.50 87.87 95.71 100.0
17 Textiles 15.44 38.32 55.93 72.06
18 Wearing apparel, dressing 11.51 32.88 47.20 60.23
19 Tanning and dressing of leather
20.39 47.77 57.28 77.12
20 Wood 9.74 23.04 45.50 69.38
21 Paper and paper products 13.67 55.81 77.58 85.84
22 Publishing, printing 6.90 21.14 40.53 31.11
23 Coke and petroleum 25.00 99.91 99.97 100.0
24 Chemicals 21.94 72.32 83.62 92.38
25 Rubber and plastic 15.16 40.96 51.68 64.92
26 Other non-metallic minerals
15.28 50.49 70.18 81.26
27 Basic metals 15.87 36.64 47.66 59.40
28 Fabricated metals 10.55 30.84 39.06 62.52
29 Machinery and equipment n.e.c.
12.58 42.23 52.57 76.09
30 Office machinery 12.64 77.33 95.80 99.86
31 Electrical machinery and app.
13.01 66.81 79.91 92.74
32 Radio, TV sets 12.20 46.42 82.80 87.03
33 Medical, precision, opt. instruments
11.10 35.06 40.60 57.14
34 Motor vehicles, trailers 28.90 79.13 96.85 99.12
35 Other transport equipment
13.36 35.99 48.62 79.06
36 Furniture, manufacturing n.e.c.
9.01 25.72 32.99 56.47
37 Recycling 12.18 29.72 31.63 85.53
D Manufacturing 11.76 44.88 70.01 85.86
Source: calculations based on Central Statistical Office data
Table A6: Changes in industrial structure (net sales revenues of manufacturing = 100, 1998 prices)
1990 1998

114
Food, drink, tobacco 26.4 18.8
Textile, clothing 7.7 4.5
Wood, paper, printing 5.1 5.3
Chemicals 25.2 17.5
Non metallic mineral 4.0 3.1
Coke and petroleum 12.1 9.3
Machinery 17.4 39.9
Other manufacturing 1.9 1.2
Manufacturing total 100 100
Source: Central Statistical Office
Table A7: Productivity (value added/number of employees, USD thousand) in Hungarian manufacturing
All firms Firms with 50-90% foreign share
Firms with 100% foreign share
ISIC Code
Industries 1993 1996 1993 1996 1993 1996
15 Food products, beverages
8 10 15 15 17 16
16 Tobacco 18 28 n.a. n.a. n.a. n.a.
17 Textiles 5 5 9 9 5 9
18 Wearing apparel, dressing
4 4 6 6 4 5
19 Tanning and dressing of leather
4 4 4 6 5 7
20 Wood 4 5 10 11 7 17
21 Paper and paper products
9 15 12 24 12 29
22 Publishing, printing 9 9 16 16 18 18
23 Coke and petroleum 47 43 n.a. n.a. n.a. n.a.
24 Chemicals 15 20 27 23 22 26
25 Rubber and plastic 7 10 9 14 21 18
26 Other non-metallic minerals
9 10 13 19 16 19
27 Basic metals 6 9 8 8 10 11
28 Fabricated metals 5 7 8 11 9 12

115
29 Machinery and equipment n.e.c.
7 5 9 10 8 13
30 Office machinery 8 24 6 5 1 82
31 Electrical machinery and app.
6 12 7 14 7 15
32 Radio, TV sets 6 9 12 11 11 14
33 Medical, precision, opt. instruments
7 9 12 13 10 13
34 Motor vehicles, trailers
10 19 27 25 10 58
35 Other transport equipment
5 11 6 9 -3 7
36 Furniture, manufacturing n.e.c.
5 4 6 8 8 7
D Manufacturing 8 9 12 15 11 17
Source: Borsi et al. [1998] from Central Statistical Office data
Table A8: Geographical composition of Spanish foreign trade
1990 1998 1999
Export Import Export Import Export Import
EU 69.3 59.5 71.5 66.9 72.5 67.4
Germany 13.5 16.4 13.6 15.4 13.2 15.7
France 20.7 14.6 19.5 18.2 19.6 18.1
Italy 11.5 10.1 9.3 9.7 9.2 9.1
UK 8.0 7.2 8.4 7.4 8.4 7.5
USA 5.8 8.2 4.2 5.8 4.3 5.4
Japan 1.1 4.4 0.9 3.0 1.0 3.2
Total 100 100 100 100 100 100
Source: calculations based on Banco de Espana data (Boletín estadístico, July 1999 and March 2000.)
Table A9 :The first ten product groups in the EU-import from Spain
SITC 1990 SITC 1993 SITC 1996 SITC 1997
78120 16.10 78120 20.47 78120 18.56 78120 17,14
78439 3.99 78439 4.44 78439 3.87 78439 3,88
78219 2.79 99999 2.76 78219 2.75 78219 3,69
85148 1.96 78219 1.75 71322 1.62 99999 3,50

116
05712 1.62 05712 1.61 99999 1.57 71322 1,45
42141 1.46 85148 1.35 05712 1.27 76110 1,34
05711 1.30 05459 1.21 85148 1.16 85148 1,09
71322 1.23 05711 1.14 76110 1.06 11217 1,08
05459 1.06 11217 1.10 05711 1.01 05440 1,00
11217 0.99 76110 1.10 05459 1.01 05712 0,98
SUM 32.53 SUM 36.96 SUM 33.93 SUM 35,15
Source: Own calculations based on SITC 5-digit nomenclature, Eurostat Comext.
Name of SITC numbers: 05440: tomatoes fresh or chilled, 05459: vegetable fresh or chilled, 05711: oranges fresh or dry, 05712: mandarines fresh or dry, 11217: wine, grape must, 42141: virgin olive oil, 71322:piston engines of a cyl. capacity exc.1000cc, 76110: television receivers, color or sound and video recorders, 78120: motor vehicles for the transport of persons, 78219: motor veh.for the transport of goods, 78439: parts and accessories for motor vehicles, 85148: footwear of leather
Table A10: Geographical composition of Hungarian foreign trade
1990 1998 1999
Export Import Export Import Export Import
EU 35.4 36.8 73.0 64.1 76.2 64.4
Germany 20.1 23.3 36.6 28.2 38.4 29.2
Austria 7.5 9.9 10.6 9.6 9.6 8.9
Italy 5.8 4.0 5.7 7.5 5.9 7.7
CEEC's 14.0 11.3 15.9 15.1 12.4 14.3
Russia 20.1 19.0 2.8 6.5 1.4 5.8
Total 100 100 100 100 100 100
Source: calculations from CSO and Ministry of Economy data
Table A11: The first ten product groups in the EU-import from Hungary
SITC 1990 SITC 1993 SITC 1996 SITC 1998
85148 1.78 77313 3.20 71322 8.16 71322 12,89
00121 1.72 85148 2.35 77313 3.06 75270 4,37
01291 1.49 71322 1.84 78120 2.54 76381 3,48
85190 1.33 85190 1.74 33430 1.50 78120 2,96
01235 1.32 84230 1.33 76499 1.44 75997 2,53
01233 1.18 22240 1.31 76110 1.41 77313 2,49
77821 1.12 01235 1.27 78439 1.35 76110 2,24
84230 1.08 84140 1.21 85148 1.31 78439 1,80

117
01232 1.07 84130 1.20 75997 1.29 75260 1,45
77521 1.04 84270 1.10 85190 1.13 71323 1,42
SUM 13.17 SUM 16,60 SUM 23.24 SUM 35,63
Source: own calculations based on Eurostat Comext
Name of SITC numbers: 00121:sheep, live, 01232: poultry, not cut in pieces, frozen, 01233: fatty livers of geese, 01235: poultry cuts, frozen, 01291: meat of rabbits, hares, fresh or frozen, 22240: sunflower seeds, 33430: gas oils, 71322: reciprocating piston engines of a cylinder capacity exceeding 1000 CC, 71323: compression-ignition engines (diesel or semi diesel) for road vehicles 75260: input/output units in data processing 75270: storage units for data processing 75997: parts of automatic data processing machines, magnetic or optical readers 76110: television receivers, color or sound and video recorders, 76381:video recording or reproducing apparatus 76499: parts of sound recorders and TV image and sound recorders or reproducers, 77313: ignition and other wiring sets used in vehicles, 77821:filament lamps, 78120: motor vehicles for the transport of persons, 78439: parts and accessories for motor vehicles 84130: men's jacket, wowen, 84140: men's trousers, woven, 84230:women's jacket of wowen textile, 84270: blouses, shirts of woven textile, 85148:footwear of leather, 85190: parts of footwear

118
References
Alonso,A. [1993]: El sector exterior. in: Espaňa, Economía, Espasa Calpe, Madrid, p. 383-478.
Alonso,J.A.-Donoso,V.[1989]: La empresa exportadora espaňola: una caracterización. Papeles de Economía Espaňola no.39, p.311-334.
Amiti, M.[1997]: Specialization patterns in Europe. Centre for Economic Performance Discussion Paper no.363.
Amiti,M[1998]: New trade theories and industrial location in the EU: a survey of evidence. Oxford Review of Economic Policy, vol.14,no.2.p.45-54.
Antalóczy K.[1999]: Külgazdasági trendek Magyarországon 1995 és 1998 között (Foreign trade trends in Hungary between 1995 and 1998). Külgazdaság vol.XLIII.no.6.p.4-25.
Antalóczy, K.-Ludányi, A.-Salgó, I.-Sass, M[1996]: Kelet-Európa és Magyarország tőkevonzási képessége. (Capital attrecting capacity of Eastern Europe and Hungary) Európa Fórum no.2.
Argimón,I.- González-Páramo,J.- Martin,M.-Roldán,J.M.[1993]: Productivity and Infrastructure in the Spanish Economy. Banco de Espana Docummento de Trabajo no.9313.
Árva, L.[1995]: Külföldi tőkeberuházások Közép-Kelet-Európában (FDI in CEECs). Közgazdasági és Jogi Könyvkiadó, Budapest.
Aschauer, D.A.[1989]: Is public expenditure productive?. Journal of Monetary Economics vol23,no3. p.177-200.
Aturupane,C-Djankov,S-Hoekman,B.[1997]: Determinants of Intra-Industry Trade between East and West Europe. World Bank Working paper no.1850.
Audretsch,D.[1998]: Agglomeration and the location of innovative activity. Oxford Review of Economic Policy, vol.14,no.2.p.18-30.
Bagó E. [1996]: Iparpolitika az ipar versenyképességének növeléséért (Industrial policy for industrial competitiveness). Közgazdasági Szemle May p. 443-456.
Baghy E.[1999]: A külkereskedelmi termékforgalom 1998-ban (Foreign trade turnover in 1998). Gazdaság és Statisztika no.2. p.22-39.
Bajo,O.[1991]: Determinantes macro-economicos y sectoriales de la inversión extranjera directa en Espana. Información Comercial Espanola no.696-697 p. 53-74.
Bajo,O.-Torres,A.[1992]: El comercio exterior y la inversión extranjera directa tras la integración de Espana en la CE (1986-1990) in.: Vinals (ed.): La economia espanola ante el Mercado Unico Europeo Alianza Editorial, Madrid.
Bajo,O.-López,C.[1996]: La inversión extranjera directa en la industria manufacturera espaňola. Papeles de Economía Espaňola no.66, 176-191.

119
Bajo,O - Montero-Munoz, M.[1996]: Foreign direct investment and trade flows: the Spanish experience, 1977-1992. Documento de Trabajo, Universidad Publica de Navarra Departamento de Economia no.9604, May
Balassa B. [1965]: Trade Liberalization and Revealed Comparative Advantages. Manchester School 33, p.99-123.
Balassa B.[1986]: Intra-Industry Specialisation (A Cross-Country Analysis). European Economic Review no.30. 27-42 old.
Balassa,B.-Noland,M.[1987]: The Changing Comparative Advantage of Japan and the United States. manuscript, published in Hungarian in Balassa: Nemzetközi kereskedelem és gazdasági növekedés KJK, Budapest
Bandrés,E.[1993]: Las infraestructuras: políticas y realizaciones. in:Delgado [ed].: Espaňa, Economía, Espasa Calpe, Madrid, p.1051-1071.
Barrell R., Pain N.[1995] Trade Restraints and Japanese Investment Flows. European Economic Review.
Barrell,R.-Pain,N.[1997]: Foreign Direct Investment, Technological Change and Economic Growth within Europe. The Economic Journal, no.107 November, p.1770-1786.
Barry, F, and Bradley, J. [1993], FDI and Trade: the Irish Host-country Experience, paper presented at the Royal Economics Society Annual Conference, University of Staffordshire, March 24–6, ms.
Balasubramanyam,V.N.-Salisu,M.-Sapsford,D.[1999]: Foreign Direct Investment as an Engine of Growth. The Journal of International Trade and Economic Development, vol.8.no.1. p.27-40.
Bellak,C.[1997]: The contribution of the restructuring of (large "Western") MNCs to the catching up of (small "Eastern") countries. Development and International Cooperation vol XIII no. 24-25, p.181-216.
Bellak,C.[1998]: The measurement of foreign direct investment: a critical review. The International Trade Journal, vol.XII, No.2.p.227-257.
B.Horváth,L.[1999]: Tudásipar. Erősödő multihatás. (Stronger multi-effects in knowledge) Világgazdasági Évkönyv 1999.Budapest.
Blanes,V.-Martín,C.[2000]: The nature and causes of intra-industry trade: back to the comparative advantage explanation? The case of Spain. Weltwirtschaftliches Archiv, forthcoming.
Blomström,M.-Kokko,A.-Zejan,M.[1994]: Host Country Competition, Labour Skills and Technology Transfer by Multinationals. Weltwirtschaftliches Archiv Band 130, p.521-533.
Blomström, M.-Kokko,A [1996]: Multinational Corporations and Spillovers. CEPR Discussion Paper no. 1365, London.
Blomström,M.- Kokko, A. [1998]: Foreign investment as a Vehicle for International Technology Transfer. in: Navaretti, G.et.al.(eds): Creation and Transfer of Knowledge, Springer Verlag, Berlin, p. 279-311.
Borensztein,E.-de Gregorio,J.-Lee,J.W [1995]: How does foreign direct investment affect economic growth? NBER Working Paper no. 5057

120
Borsi,B.- Molnár P.- Papanek G.- Viszt E.[1998]: Structural Changes in the Hungarian Foreign Trade and Industry between 1993 and 1997. GKI Economic Research Co., Budapest
Brenton,P.- Gros,D. [1997]: Trade reorientation and recovery in transition economies. Oxford Review of Economic Policy, vol.13. no.2.p.65-76.
Brewer,T [1993]: Government Policies, Market Imperfections and Foreign Direct Investment. Journal of International Business Studies, vol.24,no.1.p.101-120.
Brülhart,M[1994]: Marginal Intra-Industry Trade: Measurement and Relevance for the Pattern of Industrial Adjustment. Weltwirtschaftliches Archiv no.3 p.600-613.
Brülhart,M[1998a]: Trading Places: Industrial Specialization in the European Union. Journal of Common Market Studies, vol.36,no.3.p.319-346.
Brülhart,M[1998b]: Economic Geography, Industry Location and Trade: The Evidence.The World Economy vol.21,no.6.p.775-802.
Buckley,P-Castro,F [1998]: The investment development path: the case of Portugal Transnational Corporations vol.7.no.1. p.1-15.
Buesa,M.-Molero,J.[1993]: Recursos tecnologicos in: Delgado, J (ed). Economía, Espaňa, Espasa Calpe, Madrid p. 785-805.
Buesa,M.-Molero,J.-Casado,M.[1995]: Factores de localización y comportamiento comercial de las multinacionales en Espaňa. Economía Industrial no.306. p.129-141.
Buiter,Willem.-Lago,Ricardo.-Stern,Nicholas.[1996]:Promoting an effective market economy in a changing world. CEPR Discussion Paper Series, no.1468.
Cantwell,J.-Dunning,J.[1991]: MNEs, Technology and the Competitiveness of European Industries. Außenwirtschaft, Jahrgang 46,Heft 1.p.45-65.
Campa,J.M.-Guillén,M.F: Spain- a boom from economic integration. in: Dunning-Narula (eds):Foreign Direct Investments and Governments, London, New York, 1996 p. 207-239.
Carrrascosa,M. [1991]: Estrategias gubernamentales y multinacionales globales. Información Comercial Espaňola no.696-697 p.167-180.
Carrera, M.T [1997]: Comercio intraindustrial en Espaňa: determinantes nacionales. ICE Revista de Economía no. 765 p. 95-114.
Castello,S.-Olienyk,J.-Ozawa,T [1997]: Nation size, outward orientation and structural adaptability: small versus large European economies. Development and International Cooperation, vol XIII.no.24-25. p.85-104.
Caves, R.[1996]: Multinational Enterprise and Economic Analysis. Cambridge University Press, New York.
Cheng,J.L.-Bolon,D.S.[1993]: The management of multinational R&D: A neglected topic in international business research. Journal of International Business Studies no.1. vol.24.p.1-18.

121
Coase, R.H.[1937]: The nature of the Firm. Economica no.4. p.386-405.
Corbalan,D.[1994]: L’investissement étranger en Espagne: une estimation de l’apport des entreprises étrangeres. Revue de l’économie méridionale vol.42, no.167,p.75-93.
Csányi,T. [1997]: A versenyképesség egyedi cégadatok elemzése tükrében (Competitiveness in the mirror of individual firm data analysis) mimeo. Budapest University of Economics "Competing the World" research project
Csernenszky L. [1997]: A feldolgozóipar versenyképessége nemzetközi összehasonlításban (Competitiveness of manufacturing industry in an international comparison). Ipari Szemle, no. 4.9-15.
Davis, D.[1995]: Intra-industry trade: A Heckscher-Ohlin-Ricardo approach Journal of International Economics no.39.p.201-226.
De la Fuente,A.-Vives,X.[1995]: Infrastructure and Education as instruments of regional policy - evidence from Spain. Economic Policy no. 20., 11-53.old
de Mello, L [1997]: Foreign Direct Investment in Developming Countries and Growth: A Selective Survey. Journal of Development Studies Vol. 34. no.1. p.1-33.
Diaz de Sarralde,S.-Martinez,A.[1996]: Factores explicativos de la inversión extranjera directa en Espaňa (1970-1992). Hacienda Pública Espaňola no.136. p.19-31.
Dicházi (ed.) [1996]: Jelentés a külföldi, zöldmezős ipari beruházások alakulásáról Magyarországon 1996 végéig (Report on foreign greenfield investments in Hungary until the end-1996). Research Report. Privatisation Research Institute, Budapest.
Dicházi, B. [1998]: A külföldi tőke szerepe a privatizációban (The role of foreign capital
in the privatisation). Számadás a Talentumról, ÁPV Rt., Budapest Djankov-Hoekman [1996]: Intra-Industry Trade, Foreign Direct Investment and the
Reorientation of East-European Exports. CEPR Discussion Paper No. 7377. Dorado,R-Rojo,J.[1991]: Ciencia, tecnología e industria en Espaňa, situación y
perspectivas. Fundesco, 1991.
Duce,M.[1995]: El impacto de la integración en la UE sobre la inversión internacional directa en Espaňa. Papeles de Economía Espaňola no.63, p. 192-208.
Dunning,J.H. [1981]: Explaining the International Direct Investment Position of Countries: Towards a Dynamic or Developmental Approach. Weltwirtschaftliches Archiv Band 117.Heft 1. p.30-64.
Dunning, J. H.: [1985]: Multinational Enterprises, Market Structure and International Competitiveness. New York.
Dunning, J.H. [1993]: Multinational Enterprises and the Global Europe.Addison-

122
Wesley, London.
Dunning,J.[1998]: Location and the multinational enterprise: a neglected factor? Journal of International Business Studies vol29.no.1.p.45-55.
Dunning,J.-Narula,R.[1996]: Foreign Direct Investment and Governments. Routledge, Vienna.
Dyker, D.A.[1997]: Learning the Game - Technological Factors of Economic Transformation. Europe-Asia Studies Vol.49.no.3. p.445-461.
Egea,P.-Lopez,C.[1991]: Un estudio sobre la distribución geográfica de la inversión extranjera directa en Espaňa. Información Comercial Espaňola no. 696-697, p.105-118.
Ehrlich É.[1997]: The infrastructure in Hungary: A description, analysis and assessment. Strategic Task Force Report, group 12, Institute for World Economics.
Eichengreen,B.-Kohl,R.[1998]: The External Sector, the state and Development in Eastern Europe. BRIE Working Paper no.125.
Éltető A. [1994]: Az Európai Unió korábbi kibővülésének tapasztalatai (Experiences of Former Enlargements of the EuropeanUnion). Struktúrák, Szervezetek, Stratégiák no.1-2.
Éltető A. [1994]: Kutatás-fejlesztés Spanyolországban (R&D in Spain). OMFB 25-9201/1, August.Budapest.
Éltető A.[1995]: Spanyolország és az Európai Unió (Spain and the EU). Európa Fórum, no.3. October: p.33-51.
Éltető A [1995]: What Spain would gain and lose by Hungary's entry into the EU. IWE Working Paper no 49.
Éltető A.[1996]: Spanyolország modernizációja az 1980-as és 1990-es években (Modernization of Spain in the 80s and the 90s). Külgazdaság, no.12.p.47-66.
Éltető A. [1998a]: Economic Policy Background to Foreign Direct Investment in Hungary. WIIW Research Report series no. 244, April.
Éltető A. [1998b]: The Economic Performance of Firms with Foreign Investment in Hungary. IWE Working Paper, no.94., July.
Éltető A[1998c]: Az iparágon belüli kereskedelem alakulása az Európai Unióban (Intra-industry trade in the European Union). Külgazdaság, May p.41-56.
Éltető A.[1999]: A külföldi működőtőke hatása a külkereskedelemre négy kis közép-európai országban. (The effect of FDI on the foreign trade of four small CEECs ).Közgazdasági Szemle, January p.66-80.

123
Éltető A [2000]: FDI and technology transfer - Hungarian experiences in international comparison /in: Eli, M.(ed): Ungarn in Transformationsprozess, Ifo Institut Dresden, Januar/
Éltető A [2000]: Az Európai Unióval folytatott magyar és spanyol feldolgozóipari kereskedelem szerkezete (Structure of manufacturing trade of Spain and Hungary with the EU) /Közgazdasági Szemle, március/
Éltető A [2000]: A külföldi működőtőke-befektetések hatása az export technológiai szerkezetére nemzetközi összehasonlításban (The effect of FDI on the technology structure in international comparison) / in: A működőtőke kivitele és a technikai fejlődés a 21. század küszöbén (FDI and technology development on the eve of the 21. Century) OM, Budapest p. 138-173/
Éltető A. - Gáspár P. - Sass M. [1995]: Foreign Direct Investment in East-Central Europe In Comparative Analysis With Spain and Portugal. IWE Working Paper No. 51.May.
Éltető A-Sass M. [1996]: Foreign Direct Investment - The Case of Hungary in:Wysokinska-Witkowska (eds.): Foreign Direct Investment - East and West, University of Lodz, 101-123.p.Lodz.
Éltető A. -Sass M. [1997]: Motivations of foreign investors - FDI and foreign trade :The Hungarian case. Results of an empirical survey. In: Wysokinska-Witkowska (eds.): Motivations of foreign direct investors and their propensity to exports in the context of the European integration process. University of Lodz,77-105. p.Lodz
Éltető A.-Sass M.[1998]: Motivations and Behaviour by Hungary's Foreign Investors in Relation to Exports. IWE Working Paper no. 88, January.
Engelhard,J.-Eckert,S.[1994]: Markteintrittsverhalten deutscher Unternehmen in osteuropaischen Landern. Bamberger Betriebswirtschaftliche Beitrage no.98, Abschlussbericht.
Espaňa en la Unión Europea - Diez aňos desde la firma del Tratado de Adhesión [1995] Secretaría General del Portavoz del Gobierno, Madrid.
Ethier,W.[1986]: The multinational firm. Quarterly Journal of Economics no.4.p.805-832.
European Commission [1994]: The Economic and Financial Situation in Spain. European Economy no.7.Brussels.
Falvey,R.[1981]: Commercial Policy and Intra-Industry Trade. Journal of International Economics, no.11.p.495-511.
Farinas, J.C.- Merino,F.-Moreno,L.-Rodriguez,D.[1999a]: Estructura de mercado y dinamica empresarial in: Farinas,J.C.-Jaumandreu,J.(eds): La empresa industrial en la década de los noventa. Fundación Argentaria, Visor Dis. Madrid. p.67-88.
Farinas,J.C.-Huergo,E.-Martin,A.-Suárez,C.[1999b]:Resultados. in:Farinas,J.C.-Jaumandreu,J.(eds): La empresa industrial en la década de los noventa Fundación Argentaria, Visor Dis., Madrid.p.195-216.
Farkas J.[1998]: Innovatív magyar vállalatok (Innovative Hungarian firms).

124
Magyar Tudomány no.10.p.1222-1233.
Farkas P.[1995]: A külföldi működőtőke beáramlás hatása a K+F-re és az innovációra Magyarországon (Effects of FDI inflow on R&D and innovation in Hungary). IWE Research Report, Budapest.
Fernández,Y.[1993]: Política de Financiación exterior. In: Gámir,L.(ed): Política económica de Espaňa, Alianza Editorial, Madrid, p. 79-98.
Ferreras, P.D.[1998]: Privatizaciones y Regulación para la Competencia. Economia Industrial vol II.no.320, p.29-40.
Fleischer, T.[1998]: A magyarországi infrastruktúra és az európai csatlakozás (Infrastructure in Hungary and European integration). Európa Fórum no.1.p.3-20.
Fontagné, L.-Freudenberg,M.- Ünal-Kesenci,D.[1995]: Régionalisation et échanges de biens intermediaires. CEPII Document de Travail no.95-11, décembre.
Fontagné,L.-Freudenberg,M.[1997]: Intra-Industry Trade Methodological Issues Reconsidered. CEPII Document de Travail no. 97-01.
Fuentes Quintana [1999]: Tres decenios largos de la economía espanola en perspectiva. in:Delgado(ed): Espaňa, Economía, Espasa Calpe, Madrid.
Füvesi M. [1997]: Ipari növekedés átalakuló szerkezetben 1-3 (Industrial growth in a changing structure) Ipari Szemle 1997/2,5,6 .
Gács, J. [1994], ‘Hungary’, in European Economy No. 6: (The Economic Interpenetration between the European Union and Eastern Europe), pp. 191–225.Brussels.
Gál P.-Simai M.[1994]: A műszaki fejlődés világgazdasági rendszere. BKE, Aula, Budapest.
Gálik É-Gyalókay Cs. [1997]: Az ipar és építőipar 1996. évi tevékenysége (The activity of the industry). Gazdaság és Statisztika, no.3. p.30-44.
Gáspár T.- Kacsirek L.[1997]: Az iparágon belüli kereskedelem - elméleti keretek és a magyar külkereskedelem szerkezetének jellemzői. Egy konkrét példa: a gépipar (Intra-industry trade, theoretical framework and the characteristics of Hungarian foreign trade, the example of the machinery industry) Versenyben a világgal Műhelytanulmányok, no.22.BKE, Budapest.
González,X [1997]: Capital Extranjero y Actividad Tecnológica: una aplicación a las empresas manufactureras espaňolas. Fundación Empresa Publica Documento de Trabajo no. 9711.
González,X.[1999]: Actividades Tecnológicas. in: Farinas,J.C.-Jaumandreu,J.(eds): La empresa industrial en la década de los noventa, Fundación Argentaria-Visor Dis., Madrid p. 115-141.
Gordo,E.-Martín,C.[1995]: El ajuste comercial de Espańa en el mercado de la UE: inferencias sobre su impacto en la convergencia real. Papeles de Economía Espaňola no.63, p. 164-178.
Gordo,E.-Martín,C.[1996]: Spain in the EU: Adjustments in Trade and Direct

125
Investment and Implications for Real Convergence. Fundación FIES Working Paper no. 127.
Gordo,E.: La apertura de los mercados internacionales y el deficit comercial espaňol. Papeles de Economía Espaňola 1996/66 p98-107.
Gray,H.P.[1972]: The Economics of Business Investment Abroad. Macmillan, London.
Greenaway,D.-Milner,C.[1994]: Country Specific Factors and the Pattern of Horizontal and Vertical Intra-Industry Trade in the UK. Weltwirtschaftliches Archiv, no. 1., p.76-97.
Grubel H.G., Lloyd P.J. [1975] Intra-industry Trade: The Theory and Measurement of International Trade in Differentiated Products. Macmillan, London.
Gual,J.-Martín,C.[1994]: Trade and Foreign Direct Investment with Central and Eastern Europe: Its Impact on Spain. CEPR Discussion Paper no.1006, August.
Guisinger S.E.,- Mason R.H.,-Hood N.- Young S.- Miller R.R.-Gray H.P.- Walter I. [1985] Investment Incentives and Performance Requirements Patterns of International Trade, Production and Investment. New York, Praeger.
Halpern L.[1997]: A nemzetközi versenyképesség és a külföldi működőtőke-beruházások kapcsolatának vizsgálata (Analysis of the relationship between international competitiveness and FDI). Institute of Economics Discussion Paper no. 45.
Hamar J.[1998]: A külkereskedelmi mérleg alakulását meghatározó főbb tényezők (Main factors determining foreign trade balance). Kopint Datorg Working Paper no.26.
Hamar J.[1999]: A külföldi működőtőke-beáramlás Magyarországon belüli területi jellemzői (Regional characteristics of FDI in Hungary). Külgazdaság vol.XLIII.no.3.p.47-69.
Hatzichronoglou,T.[1993]: Technological Innovation Factors in a Global Economy in.:Inzelt,A.(ed): Innovation, Competition, Competitiveness, IKU Innovation Research Centre, Budapest.
Hatzichronoglou,T.[1997]: Revision of the high-technology sector and product classification . STI Working Papers no.2., OECD, Paris.
Havlik,P.[1996]: CEEC's' Export Competitiveness in the Manufacturing Industry .WIIW, Vienna.
Hillman,A.[1980]: Observation on the relation between "Revealed Comparative Advantage" and comparative advantage as indicated by the pre-trade relative prices. Weltwirtschaftliches Archiv vol 116.
Holland,D.-Pain,N.[1998]: The Diffusion of Innovations in Central and Eastern Europe: A Study of the Determinants and impact of FDI. NIESR Discussion Paper no.137.
Hunya, G. [1997]: Foreign investment enterprises in the investment process of the Czech Republic Hungary and Poland. WIIW, mimeo.Vienna.

126
Hunya G.[1999]: Hungary: FDI, profit repatriation and the current account. WIIW Monthly Report no.3.
Hymer, S.[1960]: The international operations of national firms: a study of foreign direct investment. Ph.D Dissertation, published by The MIT Press, Cambridge, London, 1976.
Inzelt A.[1998]: A külföldi befektetők kutatás-fejlesztési ráfordításainak szerepe az átalakuló gazdaságban. Elemzés statisztikai adatok alapján (The role of R&D expenditures of foreign investors in the transition economy). Külgazdaság vol.XLII no.6. p.59-75.
Iparpolitika [1996] (Special number of Ipari Szemle, 1996, vol XVI.)
Kessides, C.[1993]: The contribution of infrastructure to economic development World Bank Discussion Paper no.213.
Kindleberger, C.P [1969]: American Business Abroad, Six lectures on Direct Investment. New Haven, Yale University Press.
Kogut,B.-Zander,I [1993]: Knowledge of the Firm and the Evolutionary Theory of the Multinational Corporation. Journal of International Business Studies, fourth quarter p.625-645.
Kojima,K.[1975]: International Trade and Foreign Investment: Substitutes or Complements. Hitotsubashi Journal of Economics, vol.16.,no.1.p.1-12.
Kovács Cs.-Pogácsás P. [1996]: Szépek és Erősek? A külföldi tőke és a piaci hatalom . (FDI and market power).Figyelő, June 13.
Kovács Z.Á.[1996]: Iparágon belüli kereskedelem Magyarország valamint néhány más közép- és kelet-európai ország és az Európai Unió között (Intra-industry trade between Hungary, certain other CEE countries and the EU) Kopint Datorg, November.Budapest.
Kozul-Wright,R-Rowthorn,R [1998]: Spoilt for choice: multinational corporations and the geography of international production. Oxford Review of Economic Policy, vol.14.no.2.p.74-93.
KPMG [1996]: Foreign investors in Hungary - survey. Budapest.
Krugman, P.[1983]: The "New Theories" of International Trade and the Multinational Enterprise. in: Kindleberger-Audretsch eds: The Multinational Corporation in the 1980s, The MIT Press, Cambridge, London.
Krugman,P. - Obstfeld,M.[1994]: Économie Internationale. De Boeck& Larcier, Bruxelles.
Krugman,P. [1990]: Rethinking the Causes of International Trade. MIT Press, Cambridge.
Krugman,P. [1991]: Geography and Trade. MIT Press, Cambridge.
Krugman,P - Venables,A [1995]: Globalization and the Inequality of Nations NBER Working Paper no.5098.
KSH [1996]: A külföldi működőtőke Magyarországon, 1994 (Foreign Direct Investment in Hungary).Central Statistical Office. Budapest.

127
KSH [1999]: A külföldi működőtőke Magyarországon 1995-1997 (Foreign Direct Investment in Hungary). Central Statistical Office. Budapest.
KSH [1999]: Kutatás és fejlesztés 1997 (Research and Development 1997). Central Statistical Office. Budapest.
Kuemmerle,W.[1999]: The drivers of foreign investment into research and development: an empirical investigation. Journal of International Business Studies, v.30., Spring.p.2-16.
Kumar, N.[1996]: Intellectual Property Protection, Market Orientation and Location of Overseas R&D Activities by Multinational Enterprises.World Development, vol.24, no.4. p.673-688.
Lall, S.[1983]: Multinationals and technology development in host LDCs. Paper for the 7th World Congress of the International Economic Association Madrid, 5-9 September.
Lall,S [1990]: Building industrial competitiveness in developing countries. OECD, Paris.
Landesmann, M. [1994], ‘Czechoslovakia’, in European Economy No. 6. (The Economic Interpretation between the European Union and Eastern Europe), pp. 191–225.
Landesmann M. - Burgstaller, J.[1995]: Vertical product differentiation in EU markets: the relative position of East-European producers. WIIW Research Report no.234.
Lankes H.P. - Venables A.J. [1996]: Foreign Direct Investment in Eastern Europe and the Former Soviet Union: results from a survey of investors. Working Paper, EBRD.London.
Lucas,F.M-Fumás,V.S.[1996]: Diferencias de eficiencia entre empresas nacionales y extranjeras en el sector manufacturero. Papeles de Economía Espaňola no.66 p.191-201.
Major Iván [1996]: A vállalati tulajdonosi szerkezet változásának hatása a versenyképességre (The effect of ownership changes on competitiveness) Research summary, Institute for Economics, HAS.
Mansfield,E.-Romeo,A.[1980]: Technology transfer to overseas subsidiaries by US-based firms. Quarterly Journal of Economics, no.95, p.735-750.
Markusen,J.[1983]: Factor movements and commodity trade as complements Journal of International Economics, no.14. p.341-356.
Markusen,J.[1995]: The Boundaries of Multinational Enterprises and the Theory of International Trade. Journal of Economic Perspectives vol.9.no.2.p.169-189.
Markusen,J[1998]: Multinational Firms, Location and Trade. The World Economy vol.21,no.6.p.733-756.
Martín,C.[1995]: La industria Espaňola: problemas estructurales y coyunctura actual. Papeles de Economía Espaňola, no. 62. p. 188-205.
Martín,C.[1997]: Espaňa en la nueva Europa. Fundación de las Cajas de Ahorros Confederadas, Alianza Economía, Madrid.

128
Martín,C.[1999]: La posición tecnológica de la economía espanola en Europa: una evaluación global. Papeles de Economía Espaňola no.81.,p.2-20.
Martin,C.[2000]: The Spanish Economy in the New Europe.Macmillan Press-St.Martin's Press, London.
Martín,C.-Sanz,I.[1999]: La política tecnológica europea y las empresas industriales espaňolas. Papeles de Economía Espaňola no.81., p. 260-275.
Martín,C.-Velázquez,F.J.[1996]: The Patterms of Foreign Direct Investment in Spain: Lessons for the CEEC's. in: Wysokinska-Witkovska (eds.): Foreign Direct Investment -East and West, University of Lodz, Lodz p.61-100.
Martín,C.-Velázquez,F.J.[1996a]: Una estimación de la presencia de capital extranjero en la economía Espaňola y de algunas de sus consecuencias. Papeles de Economía Espaňola no. 66.p.160-175.
Martín,C.-Velázquez,F.J.[1996b]: Factores determinantes de la inversión directa en los países de la OCDE: una especial referencia a Espaňa. Papeles de Economía Espaňola no. 66. p.209-219.
Mas,M.-Maudos,J.-Pérez,F.-Uriel,E.[1995]: Infrastructures and productivity in the Spanish regions. Working paper no.10. Instituto Valenciano de Investigaciones Económicas, Valencia.
Maté Rubio,J.M.[1995]: La productividad del trabajo en Espańa y en la UE. Papeles de Economía Espaňola no.63, p.112-126.
Meyer K. [1996]: Business Operations of British and German Companies with the Economies in Transition. Middle Europe Center, London Business School Discussion Paper Series no.19.
Ministry of Industry and Trade [IKIM,1996]: A feldolgozóipar növekedési térképe 1992-1995 (Map of growth in manufacturing) IKIM, Budapest.
Ministry of Industry, Trade [IKIM, 1996]: Beruházások a változó tulajdonviszonyok között (Investments during changing ownership patterns) IKIM, Budapest.
Moreno,L-Rodríguez,D [1998]: Efectos de la inversión extranjera directa en los flujos comerciales de las empresas. Investigaciones Económicas vol XXII. p. 170-199.
Moreno, L.- Rodriguez D.[1999]: Actividad Exterior p. 89-114 in: Farinas,J.C.-Jaumandreu,J.(eds.): La empresa industrial en la década de los noventa. Fundación Argentaria, Visor Dis.1999.p.89-114.
Mosoniné [1998]: Külföldi működőtőke, belföldi innováció (FDI and internal innovation). Magyar Tudomány no.8.p.960-967.
Motta,M.-Norman,G. [1996]: Does economic integrationcause foreign direct investment? International Economic Review, vol.37, no.4.,November, p.757-783.
Mundell, R.A. [1957]: International Trade and Factor Mobility. American Economic Review, vol.47. p.321-335.
Myro,R.[1996]: Crecimiento y cambio estructural 1960-1992. in:Delgado [ed].: Lecciones de Economía Espaňola, Editorial Civitas, Madrid, 41-61.old.

129
Myro,R.[1996b]: La industria, de la autarquía a la integración en la CE. in:Delgado [ed].Economía, Espaňa, Espasa Calpe, Madrid, p.297-338.
Nagy A. [1997]: A magyar exporttermékek versenyképessége - a feltárt komparatív előnyök vizsgálata alapján (Competitiveness of Hungarian export products based on revealed comparative advantages). Külgazdaság, no. 4. p. 60-75.
Narula, R. [1996], Multinational Investment and Economic Structure, London and New York: Routledge.
Narula,R.- Wakelin,K.[1996]: Technological Competitiveness, Trade and Foreign Direct Investment. NBER Research Paper.
Novák,T. - Szanyi,M. [1996]: A tevékenységleépítés szerepe a magyar gazdaság átalakításában (The role of downsizing in the transformation of the Hungarian economy) Struktúrák, Szervezetek, Stratégiák (Ipargazdasági Szemle) No. 1-3, pp. 110-119.
O'Sullivan, P.J.[1993]: An Assessment of Ireland's Export-Led Growth Strategy via Foreign Direct Investment: 1960-1980. Weltwirtschaftliches Archiv 1993/1 p. 139-158/October.
OECD [1993]: Industrial Policy in OECD Countries. Annual Review, Paris.
OECD [1998]: Internalisation of Industrial R&D: Patterns and Trends, Paris.
OECD Economic Survey: Spain, various numbers, Paris.
Oláh, A. [1998], ‘Van-e kapcsolat a bérmunka és a gépipar, mint húzóágazat között?’ (Is There a Link between Outward Processing and Engineering as a Growth Industry?), Ipari Szemle No. 2.
OMFB [1996]: Tanulmány a tudomány és a technológia legutóbbi fejlődéséről Magyarországon (Review of Recent Developments in Science and Technology in Hungary: A Summary).OMFB, OECD no.95/119 Paris, Budapest.
OMFB [1998]: Research and Development in Hungary.OMFB.Budapest.
Oporto del Olmo, A.[1997]: Comentarios acerca de la evolución de la industria y la política industrial de 1986 a 1996. Información Comercial Espaňola no. 766, Oct.-Nov.p.89-102.
Osman P. [1995]: A privatizációs törvény (Privatization Law). Bankszemle, no.7.
Ottaviano,G.-Puga,D.[1998]: Agglomeration in the Global Economy: A Survey of the New Economic Geography. The World Economy vol.21,no.6.p.707-732.
Ozawa, T. [1992]: Foreign Direct Investment and Economic Development Transnational Corporations 1. p. 27-54.
Ozawa, T.[1997]: Toward a hierarchical and Co-evolutionary Theory of Trade, FDI and Structural Upgrading. Paper presented at the 7th International Conference of the International Trade and Finance Association (ITFA) Porto, Portugal, May 21-24.1997.
Páldi K.[1998]: A külkereskedelem szerkezeti átalakulása, 1995-1997 (Structural
130
change in foreign trade). Közgazdasági Szemle vol.XLV.no.11.p.1004-1022.
Patel,P.-Pavitt,K.[1991]: Large firms in the production of the world’s technology: an important case of “non-globalisation”. Journal of International Business Studies vol.22.no.1. p.1-22.
Pavitt, K.[1971]: The multinational enterprise and the transfer of technology. in: Dunning, ed.:The Multinational Enterprise, Praeger Publishers, New York p.61-85.
Penrose, T.E [1959]: The theory of the growth of the firm.Oxford, Basil Blackwell.
Perez, T.[1998]: Multinational enterprises and technological spillovers. Harvard Academic Publishers, Amsterdam.
Penalosa,J.[1994]: Competitiveness shortcomings and the external constraint in Spain. European Commission: The Economic and Financial Situation in Spain, European Economy no.7.,73-109.old.
Pilat,D.[1996]: Competition, Productivity and Efficiency. OECD Economic Studies no.27.p.107-145.
Pitti, Z. [1997]: A külföldi érdekeltségű vállalkozások működésének 1996. évi jellemzői Magyarországon (Performancce characteristics of firms with foreign participation in Hungary, 1996) mimeo.
Porter,M [1990]: The competitive advantage of nations. The Free Press, New York.
Pula G.[1999]: Modernizáció és deficit (Modernization and deficit). Külgazdaság vol. XLIII,no.4.p.4-37/
Pye, B.K. [1996]: Foreign Direct Investment in Central Europe: Results from a Survey of Major Western Investors. Finance Working Paper A.97/1 April 1997, City University Business School, London.
Rus,G.-Román,C.-Trujillo,L.[1995]: Infreastructuras de transporte y convergencia real. Papeles de Economía Espańola no.63, p.234-252.
Sanchez-Robles [1998]: Infrastructure investment and growth - some empirical evidence. Contemporary Economic Policy, vol.16.January, p.98-108.
Sass M. [1997]: Közvetlen külföldi tőkebefektetések motivációinak változása és a magyar EU-tagság. Research Report.Instituite for Economics.Budapest.
Schmidt, K.D. [1995]: Motives of Large Multinationals Investing in Small Transition Countries: A Literature Review. Kiel Working Papers no. 668.
Segura,J.[1992]: La industria espaňola y la competitividad. Espasa Calpe, Madrid.
Simai M.[1996]: International Business Policy. Trends in World Economy no.79, Institute for World Economics, Budapest.
Sölvell,Ö.-Zander,I.[1998]: International Diffusion of Knowledge: Isolating Mechanisms and the Role of the MNE. in: Chandler, A.et.al.(eds): The Dynamic Firm - The Role of Technology, Strategy, Organization and Regions, Oxford University Press, p.402-416.

131
Streeten,P. [1971]: Costs and benefits of multinational enterprises in less developed countries. in: Dunning (ed.): The Multinational Enterprise. Praeger Publishers, New York.
Szalavetz A. [1999]: Technológia transzfer, innováció és modernizáció német tulajdonban levő feldolgozóipari cégek példáján (Technology transfer, innovation and modernization on the example of manufacturing companies in German ownership). OMFB TAN 98-56-05, Budapest.
Szanyi, M. [1994]: Experiences with foreign direct investment in Hungary. IWE Woring Paper no.32. Budapest.
Szanyi M. [1997]: Versenyképességi verseny-Piacgazdasági átalakulás Közép-Európában. (Market economy transformation in CEECs) Figyelő no. 27.November.
Szanyi, M [1998]: The role of foreign direct investment in restructuring and modernizing transition economies: an overview of literature on Hungary WIIW Research Report no.244. April.
Szentes T.[1995]: A világgazdaságtan elméleti és módszertani alapjai (Theoretical and methodological bases of the world economy). Aula, Budapest.
Szentes T.[1999]: Nemzeti fejlődés és "versenyképesség" a globalizálódás, transznacionalizálódás és integrációk korában (National development and competitiveness in the age of globalisation, transnationalisation and integration). Ezredforduló no.2. p.8-10.
Szentgyörgyi Zs. [1997]: Kutatás-fejlesztés-technológia: egy stratégia tézisei (R&D Strategy) Európai Tükör, August , p. 54-64.
Szilágyi I.[1995]:Spanyolország és az európaizálódás (Spain and Europanization) Társadalmi Szemle, no.3 p. 26-42.
Teece, D.J.[1977]: Technology transfer by multinational firms: the resource cost of transferring know-how.Economic Journal, vol.87, no.346, p.242-262.
Ternovszky F. [1997]: A termelékenység és a foglalkoztatás az átmenet korszakában Magyarországon. Munkaügyi Szemle, no.4.
Tóth J. [1997]: Az ipari parkokról - félreértések nélkül (Industrial parks).Ipari Szemle no.3.p.25-26.
Török Á.[1986]: Komparatív előnyök (Comparative advantages).KJK. Budapest.
Török Á. [1997]: A magyar iparfejlődés, a társulási szerződés és az Európai Unió fehér könyve (Development of Hungarian industry and the European Union's hite Book). Európa Fórum no.1. 45-66.p.
Török Á.-Petz R.[1999]: Kísérlet a K+F-intenzitás és az exportszerkezet közötti összefüggések vizsgálatára a magyar gazdaságban (An attempt to examine the relations between R&D-intensity band export structure). Közgazdasági Szemle, vol.XLVI, no.3.p.213-230.
Tsang,E.W.[1997]: Choice of International Technology Transfer Mode: A Resource Based View. Management International Review vol.37.no.2.p.151-168.
UN [1997]: Economic Bulletin for Europe vol.49.

132
UNCTAD [1994-1998] World Investment Report. New York.
Valero, F.J [1997]: La empresa espaňola desde la adhesión a las Comunidades Europeas. Economistas no.73. p 26-40.
Velázquez,F.J.[1995]: La convergencia desde la óptica de la eficiencia. Papeles de Economía Espaňola no.63, 126-146.old.
Velázquez,F.J.[1997]: Determinantes de la entrada de empresas extranjeras en la industria manufacturera espaňola. Doctoral Thesis, Universidad Complutense de Madrid Faculty of Economic and Enterprise Sciences.
Venables,A.J.[1996]: Equilibrium Locations of Vertically Linked Industries. International Economic Review, 37.341-359.
Vernon,R. [1966]: International investment and international trade in the product cycle. Quarterly Journal of Economics no.80. p.190-210.
Vernon,R.[1979]: The product cycle hypothesis in a new international environment. Oxford Bulletin of Economics and Statistics vol.41,no.4.p.255-267.
Vincze É. [1995]: A bér szerepe az ipar versenyképességének javításában Munkaügyi Szemle, October.
Vona, S. [1991]: On the Measurement of Intra-Industry Trade: Some Further Thoughts.Weltwirtschaftliches Archiv no.4. p.678-700.
Yeats,A.[1985]: On the appropriate interpretation of the revealed comparative advantage index: implications of a methodology based on industry sector analysis. Weltwirtschaftliches Archiv, no. 1 vol. 121.p.61-73.
Zaldívar,C.A.-Castells,M. ed.[1992]: Spain Beyond Myths. Alianza Editorial, Madrid.