foreign direct investment - un escap 3_26dec18.pdf · foreign direct investment chapter 3...
TRANSCRIPT

FOREIGN DIRECT INVESTMENT CHAPTER 3
Asia-Pacific Trade and Investment Report 2018 ◗ 49
CHAPTER
3Foreign direct
investmentA. GLOBAL AND REGIONAL TRENDS IN FOREIGN DIRECT
INVESTMENT
1. Global and regional Asia-Pacific FDI inflows continue toweaken
According to the United Nations Conference on Trade and Development(UNCTAD), global foreign direct investment (FDI) inflows continued theirdecline in 2018, following a 23% decrease in 2017 from the previous year,to $1.43 trillion, with a 41% estimated decrease in the first half of 2018(UNCTAD, 2018b). The decline was largely concentrated in developedcountries and was mainly due to large repatriations of foreign earnings fromaffiliates of foreign investors from the United States of America followingtax reforms implemented by the Government of the United States (UNCTAD,2018a). Structural changes also contributed to the downward spiral,including an increasing number of asset-light businesses such ase-commerce companies with less physical assets engaging in FDI, anda significant and continued decline in rates of return on FDI, thus loweringinvestors’ appetites for new investments abroad. Other factors accountingfor the decline were mega one-off deals and corporate restructuring.(UNCTAD, 2018a)
“The Asia-Pacific region stood firm as the largest recipient of FDI, despitea decline in the level of FDI inflows.”

FOREIGN DIRECT INVESTMENT CHAPTER 3
50 ◗ Asia-Pacific Trade and Investment Report 2018
According to the latest available annual data, FDIinflows to the Asia-Pacific region also stagnated, andcontracted by 2% to $558 billion in 2017 comparedwith the previous year (figure 3.1). However, Asia andthe Pacific remained the main destination for FDI;the region accounted for 39% of global FDI inflowsin 2017, a rise by 9 percentage points compared to2016. Developing Asia-Pacific economies werecollectively the largest recipient region for FDI inflows
worldwide in 2017. However, FDI was not evenlydistributed across all those economies. China andHong Kong, China remained the biggest FDIdestinations, together receiving 43% of total FDIinflows to the region. Other economies, such asIndonesia, the Islamic Republic of Iran, thePhilippines, Thailand, Turkey and Viet Nam, alsoattracted more FDI inflows.
Source: ESCAP calculations based on UNCTAD (2018a).
Note: China in this graph includes China, Hong Kong, China and Macao, China. A-P stands for Asia-Pacific.
Figure3.1
FDI inflows to the Asia-Pacific region and their global share, 2008-2017
15
20
25
30
35
40
45
50
300
400
500
600
700
0
5
10
0
100
200
Developing A-P (excl. China) China Developed A-P Share of A-P
Billi
ons
of U
nite
d St
ates
dol
lars
2008 2009 2010 2011 2012 2013 2014 2015 2016 2017
Perc
enta
ge
2. Asia-Pacific region expands itsoutward FDI
“FDI outflows from the Asia-Pacific regionincreased, despite a significant decline in FDIoutflows from China.”
The Asia-Pacific region also remained a major sourceof FDI worldwide. FDI outflows from the regionincreased by 2% in 2017 to $515 billion, accountingfor 36% of global FDI outflows (figure 3.2). Japan wasthe largest investor, followed by China and HongKong, China. China’s FDI outflows declinedsignificantly in 2017 for the first time since 2003 to$125 billion, a 36% decrease compared with the
previous year. Many other economies increased theirFDI outflows.
3. Uncertainties hampering greenfieldFDI
“A steeper decline in the announced FDIgreenfield could point to stagnancy in future FDIinflows to the region.”
In 2017, the value of announced global FDI greenfieldprojects declined by 13% to $806 billion, driven to alarge extent by the political uncertainty over globaltrade which could have deterred and delayedinvestment decisions (Financial Times, 2018). In the

FOREIGN DIRECT INVESTMENT CHAPTER 3
Asia-Pacific Trade and Investment Report 2018 ◗ 51
Asia-Pacific region, where trade and investment areclosely interlinked through a vast net of value chains,greenfield FDI inflows declined at an even steeperrate of 40% to $237 billion (figure 3.3). As the value
of announced FDI greenfield projects is an indicatorof future FDI trends, this decline could point tostagnation of future FDI inflows to the region (seesubsection 4 below).
Source: ESCAP calculations based on UNCTAD (2018a).
Note: China in this graph includes China, Hong Kong, China and Macao, China. A-P stands for Asia-Pacific.
Figure3.2
FDI outflows from the Asia-Pacific region and their global share, 2008-2017
10
15
20
25
30
35
40
45
50
200
300
400
500
600
700
0
5
0
100 Billi
ons
of U
nite
d St
ates
dol
lars
Developing A-P (excl. China) China Developed A-P Share of A-P
2008 2009 2010 2011 2012 2013 2014 2015 2016 2017
Perc
enta
ge
Source: ESCAP calculations based on fDi Intelligence data (accessed September 2018).
Figure3.3
Announced greenfield FDI flows in the Asia-Pacific region, 2008-2017
100
200
300
400
500
600
Inflows Outflows
0
Billi
ons
of U
nite
d St
ates
dol
lars
2008 2009 2010 2011 2012 2013 2014 2015 2016 2017
FOREIGN DIRECT INVESTMENT CHAPTER 3
52 ◗ Asia-Pacific Trade and Investment Report 2018
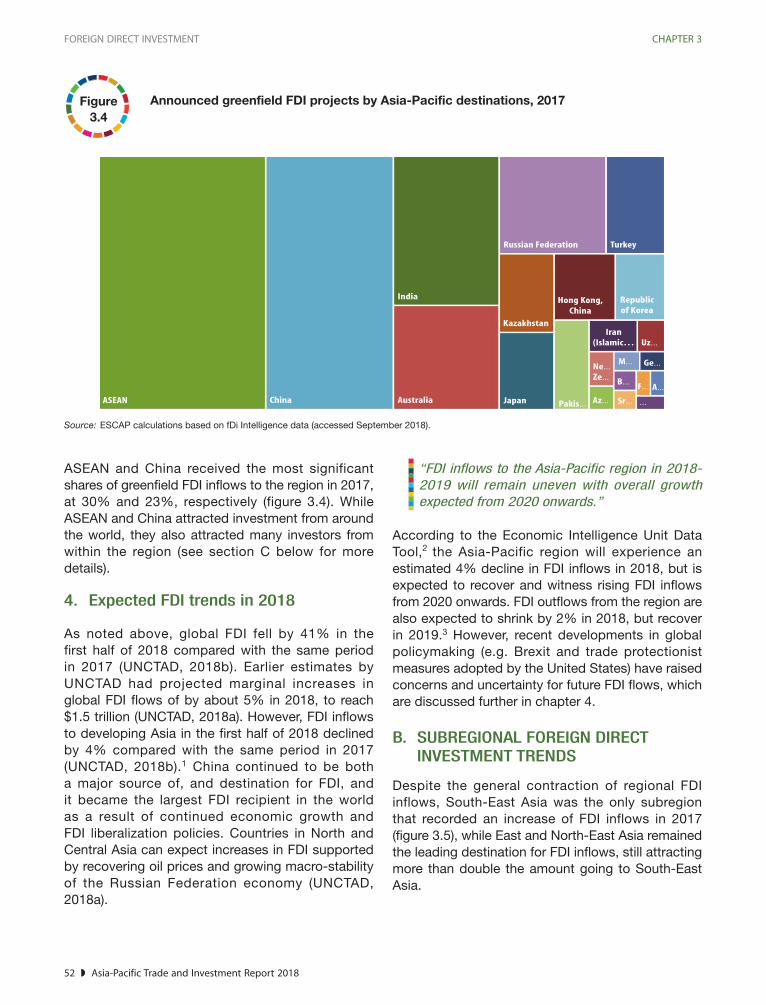
ASEAN and China received the most significantshares of greenfield FDI inflows to the region in 2017,at 30% and 23%, respectively (figure 3.4). WhileASEAN and China attracted investment from aroundthe world, they also attracted many investors fromwithin the region (see section C below for moredetails).
4. Expected FDI trends in 2018
As noted above, global FDI fell by 41% in thefirst half of 2018 compared with the same periodin 2017 (UNCTAD, 2018b). Earlier estimates byUNCTAD had projected marginal increases inglobal FDI flows of by about 5% in 2018, to reach$1.5 trillion (UNCTAD, 2018a). However, FDI inflowsto developing Asia in the first half of 2018 declinedby 4% compared with the same period in 2017(UNCTAD, 2018b).1 China continued to be botha major source of, and destination for FDI, andit became the largest FDI recipient in the worldas a result of continued economic growth andFDI liberalization policies. Countries in North andCentral Asia can expect increases in FDI supportedby recovering oil prices and growing macro-stabilityof the Russian Federation economy (UNCTAD,2018a).
“FDI inflows to the Asia-Pacific region in 2018-2019 will remain uneven with overall growthexpected from 2020 onwards.”
According to the Economic Intelligence Unit DataTool, the Asia-Pacific region will experience anestimated 4% decline in FDI inflows in 2018, but isexpected to recover and witness rising FDI inflowsfrom 2020 onwards. FDI outflows from the region arealso expected to shrink by 2% in 2018, but recoverin 2019.3 However, recent developments in globalpolicymaking (e.g. Brexit and trade protectionistmeasures adopted by the United States) have raisedconcerns and uncertainty for future FDI flows, whichare discussed further in chapter 4.
B. SUBREGIONAL FOREIGN DIRECTINVESTMENT TRENDS
Despite the general contraction of regional FDIinflows, South-East Asia was the only subregionthat recorded an increase of FDI inflows in 2017(figure 3.5), while East and North-East Asia remainedthe leading destination for FDI inflows, still attractingmore than double the amount going to South-EastAsia.
Figure3.4
Announced greenfield FDI projects by Asia-Pacific destinations, 2017
Source: ESCAP calculations based on fDi Intelligence data (accessed September 2018).
2
ASEAN China Australia Japan
Kazakhstan
India
Russian Federation Turkey
Hong Kong,China
Republic of Korea
Pakis…
Iran(Islamic… Uz…
M…
B… F…
Sr…
A…
…Az…
Ne…
Ze…
Ge…

FOREIGN DIRECT INVESTMENT CHAPTER 3
Asia-Pacific Trade and Investment Report 2018 ◗ 53
Figure3.5
FDI inflows to Asia-Pacific subregions, 2015-2017
Source: ESCAP calculations based on UNCTAD (2018a).
50
100
150
200
250
300
350
0
2015 2016 2017
Billi
ons
of U
nite
d St
ates
dol
lars
East and North-East
Asia
South-East Asia
South andSouth-West
Asia
North and Central Asia
Pacific
Source: ESCAP calculations based on UNCTAD (2018a).
Figure3.6
FDI outflows from Asia-Pacific subregions, 2015-2017
100
50
150
200
250
300
350
400
450
500
-50
0
Billi
ons
of U
nite
d St
ates
dol
lars
East and North-East
Asia
South-East Asia
South andSouth-West
Asia
North and Central Asia
Pacific
2015 2016 2017

FOREIGN DIRECT INVESTMENT CHAPTER 3
54 ◗ Asia-Pacific Trade and Investment Report 2018
East and North-East Asia also dominated FDIoutflows from the region in 2017, but with a smallershare than in the previous year (figure 3.6).
1. East and North-East Asia: China still aleading destination and source for FDI
“China and Hong Kong, China account for mostinward FDI to East and North-East Asia.”
China continued to be the leading destination for FDIin East and North-East Asia, and for the entire regionin 2017. While the subregion accounted for 49% ofFDI inflows to the Asia-Pacific region, China andHong Kong, China alone accounted for almost 90%of that share. China is expected to continue to attractsignificant FDI inflows as its economy is transitioningfrom labour-intensive, low value-added industries tohigher value-added industries. This transformationhas been supported by government initiatives suchas “Made in China 2025”, as discussed in lastyear’s Asia-Pacific Trade and investment Report(ESCAP, 2017, chapter 3).
It should be noted that FDI inflows to the high-techsector (e.g. manufacturing of electronics, medicaldevices, communications equipment, computers andpharmaceutical products) in China rose significantlyand accounted for 29% of total FDI inflows to Chinain 2017 (UNCTAD, 2018a). However, there are worriesresulting from the country’s multi-year trend ofdeclining GDP growth as well as from the increasinglyunstable global political and economic environment(Hu, 2017). Trade tensions between China and theUnited States, which deepened in 2018, not onlyhave implications for FDI between these twocountries, but also for FDI in the rest of the world.4
East and North-East Asia also continued to be theleading subregion for FDI outflows, both within theAsia-Pacific region and beyond. However, outwardFDI from China, the biggest source, declined by 36%to $125 billion in 2017 as a result of restrictivepolicies and regulations on outward FDI intended tostem capital flight, shore up reserves and prop up thevalue of the renminbi currency (Kotoski and Ng,2017). However, it is expected that FDI outflows fromChina will continue to grow, especially in view of thecontinued growing investment and trade linksbetween China and the Belt and Road Initiative (BRI)
participating countries (Huang and Xia, 2018). It hasbeen estimated that $900 billion in future investmentin roads, ports, pipelines and other infrastructure aspart of the BRI can be expected (Chatterjee andKumar 2017).
2. South-East Asia: Strong FDI rebound inleading economies
FDI inflows to South-East Asia, i.e. the members ofthe Association of Southeast Asian Nations (ASEAN)plus Timor-Leste, increased further in 2017 by 11%year-on-year to $134 billion. Most countries recordedan increase of FDI inflows; Indonesia and Thailand,in particular, witnessed a strong rebound, althoughFDI contracted in Indonesia in the second and thirdquarter of 2018 from one year earlier, according toofficial national data.
“South-East Asia continued to receive increasinglevels of FDI inflows, with CLMV countriesexpected to record the fastest growth.”
Significant growth in cross-border mergers andacquisitions, led by expansion of Chinese investmentin the subregion, played a vital role (UNCTAD, 2018a).For example, planned Chinese projects in Cambodiagrew almost threefold in the year up to September2017 (Economist Intelligence Unit, 2018a). Withgrowing subregional investment opportunities, theseeconomies are attracting increasing FDI inflows fromboth the world and from within the Asia-Pacificregion. It is noteworthy that economies which joinedASEAN last, namely Cambodia, Lao People’sDemocratic Republic, Myanmar, and Viet Nam(commonly known as CLMV countries) are expectedto be the fastest-growing in the subregion, reflectingadvantageous geographical locations, relatively lowlabour costs, and comparatively stable Governments(Economist Intelligence Unit, 2018a).
Thanks to the financial strength and desire forinternationalization of ASEAN-based multinationalenterprises, investment from South-East Asia isalso on the rise (ASEAN Secretariat and UNCTAD,2017). Thailand, for example, has witnessed a morethan 10-fold rise in its stock of outward FDI in thepast decade (Economist Intelligence Unit, 2017a).The importance of ASEAN in intraregional investmentis discussed further in section C below.

FOREIGN DIRECT INVESTMENT CHAPTER 3
Asia-Pacific Trade and Investment Report 2018 ◗ 55
3. South and South-West Asia: Strongerpresence of Chinese investors
FDI inflows to South and South-West Asia decreasedby 6% to $63 billion in 2017. This relatively modestperformance was due to a drop in FDI inflows inSouth-West Asia, including India and Turkey. WhileIndia remains the largest investment destination in thesubregion, largely due to its large and growing marketand attracted $22 billion FDI in the first half of 2018,the country slipped three notches to eleventh rankingin 2018, from eighth ranking in 2017 according to theAT Kearney FDI Confidence Index 2018. This is thefirst time it has fallen out of the top 10 since 2015.UNCTAD recorded a 9% drop in FDI in India in 2017(UNCTAD, 2018a), The Islamic Republic of Iran,Nepal, Pakistan and Sri Lanka, witnessed sharp risesof 49%, 87%, 13% and 53%, respectively. However,with the United States announcing the re-impositionof sanctions on the Islamic Republic of Iran in May2018 with implementation starting in August 2018,the country’s attractiveness to foreign investors isfalling (Salehi-Isfahani, 2018).
Intraregional foreign investors were prevalent in thesubregion in 2017, especially from China. Forexample, China dominated FDI inflows in the powerand construction sectors in Pakistan, led byinvestments in the China-Pakistan Economic Corridor(CPEC) (Gulf Times, 2018; UNCTAD, 2018a). In SriLanka, China accounted for 35% of total FDI inflowsto the country (up to September 2017) (Economynext,2018). While India’s FDI outflows more than doubledin 2017 to $11 billion in 2017, most was directed outof the subregion.
4. North and Central Asia: Poor businessenvironment continues to hamper FDI
FDI inflows to North and Central Asia continued tobe concentrated on oil and gas and other naturalresources. Due to continued policy uncertainty, linkedin part to geopolitical concerns, FDI inflows tothe countries of the subregion decreased by 32%in 2017 compared with the previous year, to reach$38 billion (UNCTAD, 2018a). Several countries in thesubregion, such as Azerbaijan, Kazakhstan and theRussian Federation, receive FDI inflows mainly incommodities, and are hence exposed to cyclical FDIflows. In the Russian Federation, which accounts formost of the FDI inflows to the subregion, the sale ofRosneft did not prevent a contraction of FDI inflows
by $25 billion in 2017, a decrease of 32% over theprevious year (Sudakov, 2017). In addition to thedeclining oil price, rising tensions between theRussian Federation and the United States leadingto new sanctions by the former country, as ofAugust 2018, are expected to negatively affect FDIto the latter country (Economist Intelligence Unit,2018b).
The North and Central Asia subregion has great FDIpotential, based on the availability of relatively cheapand reasonably skilled workforces and modestaverage corporate tax rates. However, the poorbusiness environment in the countries of thesubregion, exemplified by a relatively high corruptionindex, low ease of doing business ranking and highpolitical risk, continue to undermine the interest offoreign investors. However, it is expected that thebusiness environment in most countries of thesubregion will improve in the future. In particular,major economic reforms are underway in Uzbekistan,including a renewed interest in attracting FDI. Inflowsof FDI in the energy sector will also be boosted bythe completion of the Trans-Anatolian Pipeline in2019. In addition, various countries, particularlyKazakhstan, have been identified as majorinvestment targets under the Belt and Road Initiative.(Economist Intelligence Unit, 2018c).
5. Pacific: FDI remains limited andvolatile
Australia, which accounts for almost 90% of total FDIinflows to the Pacific, maintained a prominent levelof FDI inflows in 2017, but with a slight decline thatcontributed to a 2% overall decline of FDI inflows tothe subregion to $52 billion. This was the result ofchanges in FDI policies in Australia; ForeignInvestment Review Board (2017) approvals fell in2016/2017 because of the introduction of applicationfees in December 2015 as well as the implementationof a higher foreign investment screening thresholdfor Chinese investors under the China-AustraliaFree Trade Agreement (Economist Intelligence Unit,2018d).
For other countries, mainly small island developingcountries, FDI remains very limited due to the smallsize of their economies and remote geographiclocations. They also suffer from exposure to volatileflows, depending on one-off transactions ofmultinational enterprises (MNEs). For example, Papua

FOREIGN DIRECT INVESTMENT CHAPTER 3
56 ◗ Asia-Pacific Trade and Investment Report 2018
New Guinea experienced an accelerated divestmentof $201 million in 2017, which was a further decreasefrom $40 million in 2016. Despite ongoing effortstowards improving an enabling business environment,including the adoption of the revised Companies Actand the Business Names Act, and a new onlinebusiness registration system, that country suffersfrom policy uncertainties related mainly to theimplementation of large-scale mining and naturalgas projects, and an overall weak investmentenvironment, including but not limited to efficientinfrastructure, financial market and governmentpolicies (Oxford Business Group, 2017; Santander,2018). However, in Fiji, the investment climate hasimproved following the democratic elections in 2014,and FDI inflows reached $299 million in 2017.
C. CONTINUED SIGNIFICANCE OFINTRAREGIONAL FOREIGN DIRECTINVESTMENT FLOWS
“Intraregional greenfield FDI flows accounts fornearly half of the total greenfield FDI flows to theAsia-Pacific region.”
Intraregional greenfield FDI flows accounted fornearly half of the total greenfield FDI flows to theAsia-Pacific region in 2017 (figure 3.7). Countries
within Asia and the Pacific, especially the East andNorth-East Asia subregion, continued to besignificant investors in the region. Their increasingshare has been noticeable during the past few years,indicating a shift from FDI by traditional sources,mainly countries in the West. China’s total greenfieldinvestment in the region in 2017 accounted for 10%of total greenfield FDI inflows to the region – more thandoubling in a decade, even though it was a decreasealmost by 50% over the previous year – amountingto $24 billion. China continued to invest in Pakistan’sChina-Pakistan Economic Corridor, which is part of theBelt and Road Initiative. According to Pakistan’s Boardof Investment figures, inward FDI for the financial year2017-2018 (July-June) is expected to reach about$3.7 billion, with Chinese companies providing up to70% of the new investment (Jorgic, 2018).
Japan continued its position as a long-standinginvestor in Thailand (Creehan, 2017); it accounted for47% of the total FDI in Thailand in 2017, accordingto the Bank of Thailand. Japan and the Republic ofKorea were the biggest investors in Viet Nam,accounting for 60% of total FDI inflows to thatcountry in 2017 (VietNamNet, 2018). Singapore wasthe largest investor in Indonesia in 2017, at $8.4billion, followed by China, Japan as well as HongKong, China and the Republic of Korea, all countriesfrom the Asia-Pacific region. India is not a majorinvestor in the region except for Singapore.
Source: ESCAP calculations based on fDi Intelligence data (accessed September 2018).
Figure3.7
Destinations of intraregional greenfield FDI inflows and share of intraregional in totalgreenfield FDI inflows to the Asia-Pacific region, 2008-2017
20
30
40
50
60
60
80
100
120
140
160
180
200
0
10
0
20
40
China ASEAN Others Intraregional share in total greenfield FDI inflows
Billi
ons
of U
nite
d St
ates
dol
lars
Perc
enta
ge
2008 2009 2010 2011 2012 2013 2014 2015 2016 2017

FOREIGN DIRECT INVESTMENT CHAPTER 3
Asia-Pacific Trade and Investment Report 2018 ◗ 57
Inflows 5.9
Outflows 67.5
Inflows 8.4
Outflows 82.8
Inflows 222.6
Outflows 128.3
Inflows 60.7
Outflows 18.7
Inflows 70.2
Outflows 118.1
ASEAN
China
India
Australia
Japan
Republic of Korea
9.816.7
25.3
11.5
22.7
6.7
47.9
51.6
10.4
34.2
67.2
Inflows 23.1
Outflows 13.1
(Intra-ASEAN)
“South-East Asia is the leading destination forintraregional FDI reflecting sustained marketintegration efforts within the framework ofASEAN.”
ASEAN firmly positioned themselves as the leadingdestination in intraregional FDI flows from the Asia-Pacific region (figure 3.8). In 2017, ASEAN received$45 billion of greenfield FDI inflows from the region,which accounted for 40% of total intraregional FDIinflows. Moreover, intra-ASEAN investments are onthe increase (ASEAN Secretariat and UNCTAD, 2017).
Intra-ASEAN FDI has typically represented aroundone-fifth of total ASEAN FDI inflows but it increasedto one fourth in 2016 (OECD, 2018), supported bythe ASEAN Economic Community. Sustained marketintegration would contribute to making ASEAN aneven more attractive investment destination.ASEAN’s firm position would also contribute tosustained FDI flows into the Asia-Pacific region asa whole, partly compensating for slowed growth ofFDI inflows to China, as explained in last year’sAsia-Pacific Trade and Investment Report (ESCAP,2017).
Source: ESCAP calculations based on fDi Intelligence data (accessed September 2018).
Note: In order to even out volatile annual FDI flows, total FDI flows during 2015-2018 are used instead of annual flows.
Major intraregional greenfield FDI flows between selected Asia-Pacific economies, andtotal intraregional greenfield FDI inflows and outflows, 2015-2018
(Billions of United States dollars)
Figure3.8

FOREIGN DIRECT INVESTMENT CHAPTER 3
58 ◗ Asia-Pacific Trade and Investment Report 2018
Reviewing data only for greenfield FDI flows from2015 to 2018 shows that Malaysia, Singapore andThailand were the major intra-ASEAN investors, whileIndonesia and Viet Nam received the biggest shareof intra-ASEAN investment. The ASEAN subgroupCLMV (Cambodia, Lao People’s DemocraticRepublic, Myanmar and Viet Nam) benefited fromlower wage costs compared to the more developedASEAN countries with relatively advantageousgeographical locations and stable Governments. Inaddition, in Myanmar, intraregional FDI contributedto a significant increase of 45% in FDI inflow to thecountry, for example investment in a new tin canmanufacturing plant by Malaysia-based Kian JooGroup’s in the Thilawa Special Economic Zone(UNCTAD, 2018a).
D. SHIFT IN SECTORAL FOREIGN DIRECTINVESTMENT FLOWS5
Sectoral FDI inflows to the Asia-Pacific region haveevolved over time, with the services sector gaininga bigger share and the primary sector receivingdeclining FDI inflows (figure 3.9). The decline of theprimary sector is felt universally. A review of thecomposition of the global top 100 MNEs reveals thatover time extractive industries and trade corporationshave been replaced by digital-economy related MNEs(UNCTAD, 2018a). In 2017, FDI inflows to coal, oiland natural gas resources in the region declinedsignificantly to $19 billion, an 80% decrease from theprevious year. However, the primary sector remainsrelevant, especially for North and Central Asia.
Source: ESCAP calculations based on fDi Intelligence data (accessed September 2018).
Announced greenfield FDI inflows to the Asia-Pacific region, composition by sector,2008-2017
Figure3.9
30
40
50
60
70
80
90
100
0
10
20
Perc
enta
ge
Primary Manufacturing Services
2015 2016 2017
“The Asia-Pacific region continues to receivesignificant and continuing FDI inflows to themanufacturing sector.”
The Asia-Pacific region has received, and is expectedto continue receiving significant and continued FDIinflows to the manufacturing sector. Targetsubsectors vary by country and are evolving asseveral countries pursue structural reforms. China, asdiscussed in the previous editions of the Asia-Pacific
Trade and Investment Report, is pursuing a transitionto high value-added industries. Thailand, despiteconcerns about its domestic capacity andtechnological readiness, is making efforts to movetowards technology-based manufacturing andservices under its Thailand 4.0 policy and the EasternEconomic Corridor. New legislation came into forcein February 2017 incentivising foreign companiesin target industries in the corridor (see section E formore details) (Economist Intelligence Unit, 2017b).
FOREIGN DIRECT INVESTMENT CHAPTER 3
Asia-Pacific Trade and Investment Report 2018 ◗ 59
Developing countries in the region continue to attractinvestment in labour-intensive sectors, particularly thegarment industry. Traditional big players, such asBangladesh, Cambodia and Viet Nam have continuedto receive significant FDI inflows to this sector, withmost FDI coming from neighbouring economiessuch as China and Hong Kong, China as well asSingapore, Malaysia and the Republic of Korea, whiledomestic companies dominate in Bangladesh.Nevertheless, Bangladesh received $422 million inFDI for the textile and apparel sector in 2017, 1%higher compared with the previous year, accordingto Bangladesh Bank data (Textile Today, 2018). Thisupward trend was recorded despite lingeringconcerns about the sustainability of the country’sready-made garment sector. The ongoing trade warbetween China and the United States is expected toopen worldwide investment opportunities. In thisregard, major players in the garment industry in theAsia-Pacific region, such as Bangladesh and VietNam, are expected to benefit by acquiring a largershare in exports to the United States, and thusattracting more investment. Smaller but still
significant gains can also be expected for othercountries such as Cambodia, Myanmar and Sri Lanka(Economist Intelligence Unit, 2018e).
“The services sector accounts for a bigger shareof FDI inflows, with ASEAN and China inparticular witnessing significant increases.”
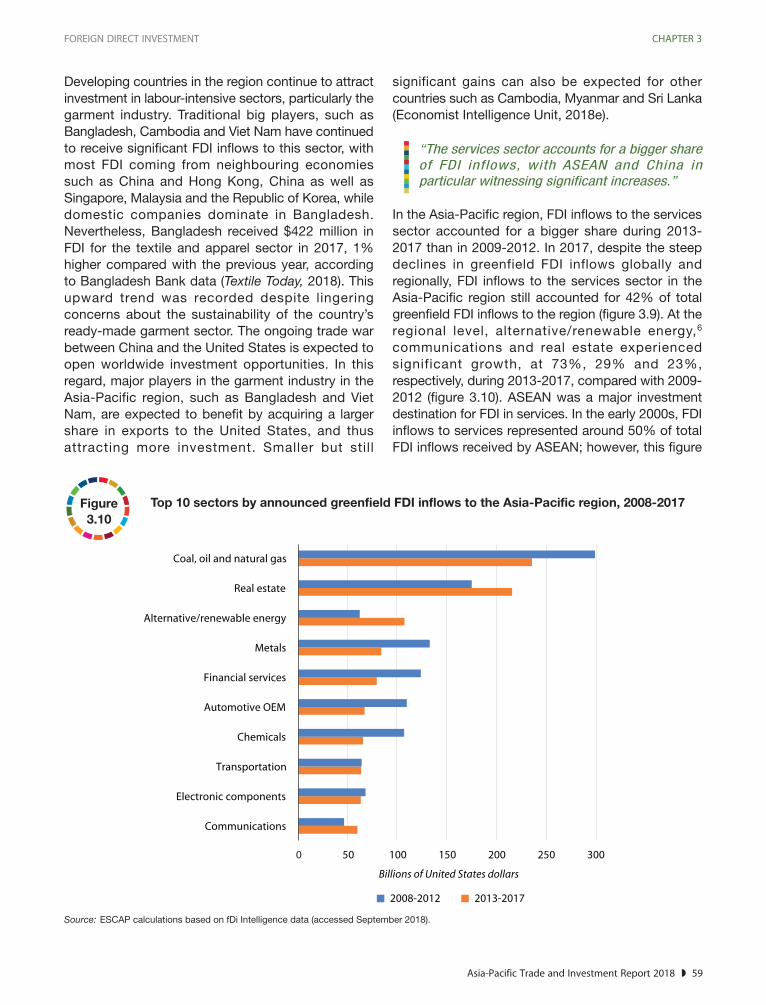
In the Asia-Pacific region, FDI inflows to the servicessector accounted for a bigger share during 2013-2017 than in 2009-2012. In 2017, despite the steepdeclines in greenfield FDI inflows globally andregionally, FDI inflows to the services sector in theAsia-Pacific region still accounted for 42% of totalgreenfield FDI inflows to the region (figure 3.9). At theregional level, alternative/renewable energy,6
communications and real estate experiencedsignificant growth, at 73%, 29% and 23%,respectively, during 2013-2017, compared with 2009-2012 (figure 3.10). ASEAN was a major investmentdestination for FDI in services. In the early 2000s, FDIinflows to services represented around 50% of totalFDI inflows received by ASEAN; however, this figure
Source: ESCAP calculations based on fDi Intelligence data (accessed September 2018).
Top 10 sectors by announced greenfield FDI inflows to the Asia-Pacific region, 2008-2017Figure3.10
Chemicals
Automotive OEM
Financial services
Metals
Alternative/renewable energy
Real estate
Coal, oil and natural gas
Communications
Electronic components
Transportation
2008-2012 2013-2017
Billions of United States dollars
0 50 100 150 200 250 300

FOREIGN DIRECT INVESTMENT CHAPTER 3
60 ◗ Asia-Pacific Trade and Investment Report 2018
rose to more than two thirds a decade later (2012-2016) (OECD, 2018). For China, a similar trend canbe seen with FDI in the services industry as a shareof total FDI rising from 41% in 2008 to 67% in 2016(KPMG, 2018a).
An evaluation of industries also supports the shiftingtrend. Whereas extraction of natural resources suchas coal, oil, natural gas and metals have attracted
less greenfield FDI inflows, sectors such as realestate, alternative/renewable energy and transportationhave attracted increasing greenfield FDI inflows(figure 3.10).
In 2017, most sectors received less greenfield FDIinflows. However, some major services subsectors,such as financial services, transportation, andcommunications suffered less (table 3.1).
Announced greenfield FDI inflows to the Asia-Pacific region, by industry, 2016-2017Table3.1
(Millions of United States dollars)
Sector/industry 2016 2017
Total 395 196 236 866
Primary 87 972 18 871
Coal, oil and natural gas 87 825 18 779
Manufacturing 130 106 119 596
Electronic components 24 607 11 278
Metals 14 871 9 089
Food and tobacco 11 884 10 936
Chemicals 11 321 14 762
Automotive OEM 9 643 10 827
Textiles 9 170 7 543
Semiconductors 3 041 11 602
Services 177 117 98 399
Real estate 76 361 25 247
Alternative/renewable energy 32 955 19 124
Financial services 13 757 10 947
Communications 13 712 10 686
Software and IT services 10 085 8 277
Transportation 8 803 10 615
Source: ESCAP calculations based on fDi Intelligence data (accessed September 2018).
E. NATIONAL POLICIES ON FOREIGNDIRECT INVESTMENT: LIBERALIZATIONCONTINUES BUT RESTRICTIONS ALSOINCREASE
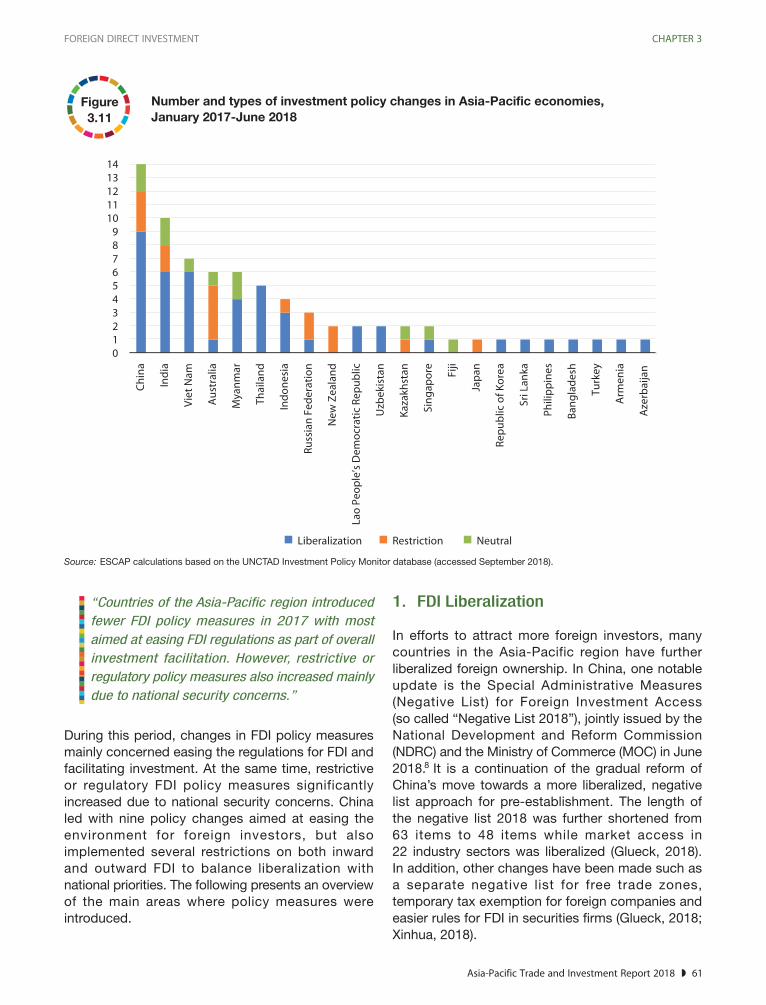
Countries in Asia and the Pacific continued to pursuepolicies to improve the environment for FDI. Duringthe observed period, from January 2017 to June2018, 163 policy changes were adopted globallywhile 22 countries in the Asia-Pacific region adopted
74 policy measures related to FDI, according to theUNCTAD Investment Policy Monitor Database.7
Forty-seven of these measures liberalized, promotedor facilitated investment while 16 new policymeasures introduced restrictions or regulations oninvestment, and 11 policies were neutral (figure 3.11).Compared with 124 policy measures introducedduring 2016, the number of policy measures in theregion from January 2017 to June 2018 showedsignificant declines.
FOREIGN DIRECT INVESTMENT CHAPTER 3
Asia-Pacific Trade and Investment Report 2018 ◗ 61
Source: ESCAP calculations based on the UNCTAD Investment Policy Monitor database (accessed September 2018).
Number and types of investment policy changes in Asia-Pacific economies,January 2017-June 2018
Figure3.11
Ind
ia
Vie
t N
am
Au
stra
lia
Mya
nm
ar
Thai
lan
d
Ind
on
esia
Ru
ssia
n F
eder
atio
n
New
Zea
lan
d
Lao
Peo
ple
’s D
emo
crat
ic R
epu
blic
Uzb
ekis
tan
Kaz
akh
stan
Sin
gap
ore Fiji
Jap
an
Rep
ub
lic o
f Ko
rea
Sri L
anka
Phili
pp
ines
Ban
gla
des
h
Turk
ey
Arm
enia
Aze
rbai
jan
0123456789
1011121314
Ch
ina
Liberalization Restriction Neutral
“Countries of the Asia-Pacific region introducedfewer FDI policy measures in 2017 with mostaimed at easing FDI regulations as part of overallinvestment facilitation. However, restrictive orregulatory policy measures also increased mainlydue to national security concerns.”
During this period, changes in FDI policy measuresmainly concerned easing the regulations for FDI andfacilitating investment. At the same time, restrictiveor regulatory FDI policy measures significantlyincreased due to national security concerns. Chinaled with nine policy changes aimed at easing theenvironment for foreign investors, but alsoimplemented several restrictions on both inwardand outward FDI to balance liberalization withnational priorities. The following presents an overviewof the main areas where policy measures wereintroduced.
1. FDI Liberalization
In efforts to attract more foreign investors, manycountries in the Asia-Pacific region have furtherliberalized foreign ownership. In China, one notableupdate is the Special Administrative Measures(Negative List) for Foreign Investment Access(so called “Negative List 2018”), jointly issued by theNational Development and Reform Commission(NDRC) and the Ministry of Commerce (MOC) in June2018. It is a continuation of the gradual reform ofChina’s move towards a more liberalized, negativelist approach for pre-establishment. The length ofthe negative list 2018 was further shortened from63 items to 48 items while market access in22 industry sectors was liberalized (Glueck, 2018).In addition, other changes have been made such asa separate negative list for free trade zones,temporary tax exemption for foreign companies andeasier rules for FDI in securities firms (Glueck, 2018;Xinhua, 2018).
8

FOREIGN DIRECT INVESTMENT CHAPTER 3
62 ◗ Asia-Pacific Trade and Investment Report 2018
Another country that has implemented significant FDIliberalization policies is Uzbekistan. Uzbekistan’sDevelopment Strategy for 2017-2021 indicates FDIliberalization as a policy priority together witheconomic development. A major step was taken withthe issuing of a Presidential Decree in September2017 on the liberalization of monetary policy, movingaway from strict control of the outflows of nationalcurrency. Another Decree issued in August 2018relaxed legal requirements for enterprises with foreignshareholders, expanded the authority of regionalauthorities to provide land for foreign investor, andthe relaxation of visa requirements (Uzbekistan, StateCommittee for Investments, 2018). These significantreforms are aimed at removing barriers to businessand proving that the country is moving away fromeconomic isolationism (Economist Intelligence Unit,2017c).
Myanmar is another country that is actively pursuingFDI liberalization. The Myanmar Companies Actsigned in December 2017, and which came intoeffect in August 2018, followed the enactment of theMyanmar Investment Law. Myanmar continues toencourage investment activity. The Ministry ofCommerce opened the country to wholly foreign-owned firms operating in the wholesale andretail sectors (Singh, A., 2018). In addition, foreigninvestors are allowed to hold up to 35% of shares ina domestic company without the company losing itscategorization as a local company (Aung, 2017).Moreover, foreigners were allowed to make full capitalinvestments in private schools (Thiha and Kang,2018). However, the country faces significantchallenges in addressing international imageproblems arising from its perceived treatment ofethnic minorities, which undermine investmentinflows from Western countries in particular.
Other countries in the region also continued toliberalize policies to attract FDI. For example, the LaoPeople’s Democratic Republic removed the minimumregistered capital requirements for certain foreigninvestors (Laotian Times, 2017), while Viet Namissued a new decree which allows foreign investorsto hold up to 49% ownership (Bizhub, 2018). Indiaalso liberalized FDI in selected sectors; 100% FDIunder the automatic route is now allowed for SingleBrand Retail Trading, and foreign airlines are allowedto hold up to 49% of ownership in Indian airlines,including Air India (Srivats, 2018).
2. Easing of investment facilitationprocesses
Various Asian and Pacific countries, especially South-East Asian countries, continued their efforts tofacilitate FDI by simplifying processes and usinginformation communications technology to reducered tape. For example, the Indonesian InvestmentCoordination Board simplified the process forobtaining investment licences and made theprocedures to obtain tax privileges easier (Sundaryaniand Singgih, 2017; KPMG, 2018b). Under aPresidential regulation, central and regionalGovernments are pushed to cooperate in a systemcalled “online single submission” that allowsinvestors to complete registration more easily. Thesystem was implemented in July 2018. TheGovernment of the Philippines launched a businessdata bank that allows businesses to renew permitsin a shorter time (Caraballo 2017). Singaporeintroduced an enhanced “EntrePass” to attract globalstart-up talents to build innovative businesses(Singapore, Ministry of Manpower, 2017). Thailandissued a regulation exempting certain businessactivities from the requirement for obtaining a foreignbusiness licence (Baker McKenzie, 2017). Myanmar’sDirectorate of Investment and Company Administration(2018) implemented an electronic registry, easing theregistration of businesses.
Countries from other subregions also improved theirinvestment facilitation processes. In India, the ForeignInvestment Promotion Board (FIPB) was abolished,and individual departments of the Government havebeen empowered to clear FDI proposals inconsultation with the Department of Industrial Policyand Promotion. This decision was made in order tosimplify the existing procedure for seeking clearanceof FDI proposals. Ensuring the alignment in theapproach of different ministries will be the key formaintaining consistency and continuity for investors(Mishra, 2017). In Central Asia, Azerbaijan establisheda single online portal for the issuance of businesslicences and permits that is operated by the Ministryof Economy (UNCTAD, 2018b). Uzbekistan alsolaunched a new platform for business registration aspart of its liberalization efforts (Economist IntelligenceUnit, 2018a). In the Pacific, Australia announcedchanges to the foreign investment framework, whichtook effect from July 2017, including streamlining andsimplifying of several regulations. Australia introduced
FOREIGN DIRECT INVESTMENT CHAPTER 3
Asia-Pacific Trade and Investment Report 2018 ◗ 63
new exemption certificates to streamline theprocessing of multiple transactions as well as astreamlined and simplified commercial feeframework9 (Australia, Foreign Investment ReviewBoard, 2017).
3. Expansion and refocusing of specialeconomic zones
“Asia-Pacific countries continue to establishspecial economic zones as a mechanism toattract FDI with mixed success rate.”
During the observed period, many special economiczones (SEZs) were established and developed invarious Asia-Pacific region countries. The empiricalevidence of the economic, social and environmentalimpacts of SEZs is mixed and needs to beconsidered with regard to factors such as: physical,strategic and financial links with the local economy;strategical location of SEZs; flexibility of SEZsregimes and systems; and other factors (ESCAP,2017). One clear benefit of SEZs, which has beensuccessfully utilized by China, is that they can beused as testing grounds for new policies andeconomic reforms, especially liberalization of FDI. Forthis reason, and in order to attract more investmentand establish linkages with regional and global valuechains, many countries in the region have establishedmore SEZs or expanded the privileges for companiesoperating in SEZs. For example, the Government ofBangladesh approved four new SEZs (Economist,2017). India issued a notification exempting all goodsimported by a unit or a developer in an SEZ forauthorised operations from the integrated goods andservices tax (PTI, 2018). Myanmar has renewedefforts to develop SEZs. The Thilawa SEZ, a Japan-Myanmar joint venture, is almost complete whereasprogress in the development of the Dawei SEZ, in themaking for almost a decade, is slow despite recentdiscussions between Thailand and Myanmar, andsupport from China and Japan. (Jagan, 2017).Sri Lanka is currently developing four investmentzones (Sri Lanka, Board of Investment, 2018). InUzbekistan, the President ordered legislation forcreating new economic zones, together with othereconomic reforms, and 16 new SEZs were createdby Presidential Decree (Uzbekistan, State Committeefor Investments, 2018).
Another noticeable trend is the change in the focusof SEZs. Many are moving away from general
purposes towards specific types of SEZs that reflecteconomic or competitive strengths of the locationsor the zones. Some examples are: tourism-linkedSEZs in Indonesia and the Lao People’s DemocraticRepublic; information technology and businessprocess outsourcing in the Philippines; aerospaceparks in Singapore; and the Rubber City IndustrialEstate in Thailand (ASEAN Secretariat and UNCTAD,2017). Quite often, focused SEZs offer specialtreatment for target industries. For example, Viet Namhas issued a decree providing preferential treatmentof companies operating in the Danang Hi-tech Park,including corporate income tax, import duty and landusage (Tilleke and Gibbins, 2018).
One noteworthy development is Thailand’sdevelopment of the Eastern Economic Corridor(EEC), and associated legal reforms aimed atboosting investment in EEC. EEC builds on strongconnectivity to neighbouring trade partners andestablished shipping routes, and links with China’sBelt and Road Initiative. EEC stands as a goodexample of pursuing strategic sectors withina focused area that facilitate foreign investment,based on competitive strengths of the location andcapacity. Thailand sees EEC playing an importantpart in implementing the Thailand 4.0 initiative, whichaims to transform the country’s manufacturing basefrom labour-intensive industries towards innovativeand digitalized production (Oxford Business Group,2018).
4. Increased restrictions on foreigninvestment
Due to rising concerns that foreign acquisitions ofstrategic domestic companies may give investorsaccess to critical infrastructure, technology orsensitive data, various countries have expandedrestrictions on FDI, often based on national security.However, blocking and screening FDI based onnational security is quite often subjective and nottransparent. In addition, it is sometimes a disguisedform of trade protectionism. In this context, othermeasures could be considered for addressingsecurity concern that are less trade and investmentdistorting, such as strengthened provisions inbilateral investment treaties that deter broadintellectual-property theft. While many of the policychanges in the region have been aimed towardsliberalization of FDI, 16 policy measures introducedrestrictions or tightened regulations on investmentsin the Asia-Pacific region between January 2017 and

FOREIGN DIRECT INVESTMENT CHAPTER 3
64 ◗ Asia-Pacific Trade and Investment Report 2018
June 2018. Such restrictions are often related to theprotection of strategic industries in host countries, orto controlling transactions with/from countries andentities that experience political tensions with thehost country. Some highlights of such policy changesare detailed below.
China has applied a new rule prohibiting outboundFDI to countries or regions that have no diplomaticties with China, are at war or face civil disturbance,or are subject to investment restrictions byinternational treaties or agreements of which Chinais a party (Reedsmith, 2018). In addition, the ChineseState Council Measures for the Overseas Transfersof Intellectual Property Rights sets out reviewprocedures for the transfer of intellectual propertyfrom China, in consideration of the country’s nationalsecurity and innovation and development capabilities(CMS, 2018). India prohibits direct outward investmentin countries identified as “non-cooperative countriesand territories” (Reserve Bank of India, 2017). Japanhas promulgated a rule that extends the reviewmechanism of acquisitions of non-listed companies,based on a consideration of threats to nationalsecurity, change to business environment and thespread of critical technologies (Japan, Ministry ofEconomy, Trade and Industry, 2017). The RussianFederation has amended foreign investment laws foroffshore companies and prohibits them fromestablishing control over Russian entities considered“strategic” under the Strategic Investments Law(Ostapets, Dmitrieva and Tyunik, 2017).
Various other countries have voiced concerns overinvestment, especially by state-owned enterprises(SOEs), particularly from China. In response, variouscountries have created or strengthened the regulatoryreview processes of incoming mergers andacquisitions, especially in critical infrastructureindustries (Sauvant, 2018). For example, Australia, asthe world’s second-largest recipient of Chineseinvestment since 2007, has tightened rules on foreigninvestment in electricity infrastructure and agriculturalland, amid concerns about growing Chineseinfluence (Smyth, 2018). Japan has also expandedits scrutiny based on a reconsideration of threats tonational security, changes to the businessenvironment and the spread of critical technologies,including dual-use technologies (OECD andUNCTAD, 2017). The Government of New Zealandissued a ministerial directive letter on tighteningthe screening procedures for sensitive land
acquisitions by foreign investors (Thomson andEdirisuriya, 2017).
With the rise of nationalism and protectionismglobally, leading to retaliatory actions by affectedcountries, it is anticipated that more Governments –particularly those of developed countries – mayintroduce new FDI restrictions in the immediatefuture. Examples are the recently approved billexpanding the scope of the Committee on ForeignInvestment in the United States, an inter-agencybody able to block deals that may threaten nationalsecurity. Germany intends new measures to blockFDI, while the European Union is developing anoverarching screening framework for its members(Economist, 2018).
F. INTERNATIONAL INVESTMENTAGREEMENTS
1. Slowdown of investment treatymaking
A slowdown in investment treaty-making in 2017 and2018 has been evident, with a record low in thenumber of new international investment agreements(IIAs) since 1983. According to the UNCTADInternational Investment Agreements Navigatordatabase,10 from January 2017 to June 2018,37 bilateral investment treaties (BITs) and 13 treatieswith investment provisions (TIPs) were either signedand/or entered into force globally, bringing the totalnumber of IIAs to 3,332. A total of 34 IIAs wereterminated during the same period. The number ofeffective treaty terminations outpaced the number ofnewly concluded IIAs for the first time, partly due tothe heightened need for review of the current IIAregime in terms of rebalancing investor and hostcountry rights and obligations (UNCTAD, 2018c).
“Despite a global trend towards the signing offewer investment treaties, countries in the Asia-Pacific region remain active in investment treatymaking.”
Despite the slowdown, countries in the Asia-Pacificregion have continued to be active in investmenttreaty-making, accounting for a significant proportionof new IIAs, with 25 BITs either signed and/or enteredinto force. Turkey was the most active country,

FOREIGN DIRECT INVESTMENT CHAPTER 3
Asia-Pacific Trade and Investment Report 2018 ◗ 65
followed by Japan and the Islamic Republic of Iran.One notable trend in the region, reflecting the globaltrend, is the high number of terminated IIAs. Duringthe observed period, 19 BITs were terminated11
by one or more countries in the region. Indiawas particularly active, having terminated 17 BITs.(figure 3.12.) The intention of the Government of Indiabehind the terminations is to replace all its existingBITs with a new set of treaties, based on its newModel BIT 2015, which is designed to strike abalance between investors’ rights and regulatoryspace of the host Government. This was promptedby recent arbitration claims from investors (Singh and
Ilge, 2016). The UNCTAD Investment PolicyFramework for Sustainable Development (UNCTAD,2015) has provided policy options to implementsustainable development objectives in IIAs.
For TIPs, 11 new TIPs were either signed and/orentered into force (table 3.2).
The Asia-Pacific region is already home to a few veryadvanced regional IIAs, such as the ASEANComprehensive Investment Agreement (ACIA) andthe ASEAN-China Agreement on Investment. A newmega-regional agreement in the region, the
Source: UNCTAD International Investment Agreements Navigator database (accessed on August 2018).
New and terminated bilateral investment treaties by countries in the Asia-Pacific region,January 2017-June 2018
Figure3.12
-4-202468
101214
Ind
ia
Ch
ina
-20-18-16-14-12-10
-8-6 Tu
rkey
Jap
an
Iran
(Isl
amic
Rep
. of)
Rep
ub
lic o
f Ko
rea
Mo
ng
olia
Ru
ssia
n F
eder
atio
n
Mal
div
es
Kyr
gyz
stan
Uzb
ekis
tan
Ind
on
esia
Au
stra
lia
Mal
aysi
aSigned Entered into force Signed and entered into force Terminated
Comprehensive and Progressive Agreement forTrans-Pacific Partnership (CPTPP), will come intoeffect on 30 December 2018, with 7 out of 11signatories from Asia-Pacific – Australia, BruneiDarussalam, Japan, Malaysia, New Zealand,Singapore and Viet Nam.12 Notwithstanding thewithdrawal of the United States from TPP in early2017, CPTPP represents a continued endeavourtowards forming closer trade and investment linkagesin the Asia-Pacific region, with the anticipation ofincreased FDI flows and opportunities to betterintegrated into global value chains.
Another noteworthy development is the “Free TradeAgreement between Hong Kong, China and theAssociation of Southeast Asian Nations”, which wassigned on 12 November 2017. With the removal ofbarriers on foreign capital participation and thenumber of foreign workers allowed to be employed,the Agreement aims to reduce the restrictions ondoing business and expand business opportunitiesbetween ASEAN countries and Hong Kong, China(Hong Kong, Government of Hong Kong SpecialAdministrative Region, 2017). Considering the factthat many Chinese investors use Hong Kong, China

FOREIGN DIRECT INVESTMENT CHAPTER 3
66 ◗ Asia-Pacific Trade and Investment Report 2018
New TIPs by countries from the Asia-Pacific region, January 2017-June 2018 based onUNCTAD classification
Table3.2
Treaties with Signatories from Signatories from Date of Date ofinvestment provisions Asia and the Pacific non-Asia and the Pacific signature entry into force
(short title)
Mainland and China, 28 June 2017 28 June 2017Hong Kong Closer Hong Kong, ChinaEconomic PartnershipArrangement (2017)
China-Georgia Free China, Georgia 13 May 2017Trade Agreement (FTA)
ASEAN – Hong Kong, ASEAN, 12 NovemberChina SAR Investment Hong Kong, China 2017Agreement (2017)
Comprehensive and Australia, Brunei Canada, Chile, 8 March 2018 30 DecemberProgressive Agreement Darussalam, Japan, Mexico, Peru 2018a
for Trans-Pacific Malaysia, New Zealand,Partnership (CPTPP) Singapore, Viet Nam
Republic of Korea – Republic of Korea Costa Rica, El Salvador, 21 FebruaryRepublics of Central Honduras, Nicaragua, 2018America FTA Panama
Chile-Indonesia Indonesia Chile 15 DecemberComprehensive 2017Economic PartnershipAgreement (CEPA)
Singapore – Turkey Singapore, Turkey 14 November 1 October 2017FTA (2015) 2015
EU-Armenia CEPA Armenia European Union 24 November2017
EFTA-Georgia FTA (2016) Georgia EFTA (European Free 27 June 2016 1 SeptemberTrade Association) 2017
Pacific Agreement on Australia, Cook Islands, 14 June 2017Closer Economic Kiribati, Marshall Islands,Relations (PACER) Plus Federated States of
Micronesia, Nauru,New Zealand, Niue,Palau, Samoa, SolomonIslands, Tonga, Tuvalu,Vanuatu
Australia-Peru FTA Australia Peru 12 February2018
Source: UNCTAD International Investment Agreements Navigator database (accessed on August 2018).a Australia became the sixth and final nation to complete the ratification in October 2018, and CPTPP will come into effect on 30 December 2018.
FOREIGN DIRECT INVESTMENT CHAPTER 3
Asia-Pacific Trade and Investment Report 2018 ◗ 67
as a strategic location to invest abroad, and thatmany investors from all over the region use HongKong, China as a financial hub for their investmentand operations, this FTA could potentially encouragefurther investment within the region and in ASEANspecifically. In addition, the “Mainland and HongKong Closer Economic Partnership Arrangement:Investment Agreement” was implemented on1 January 2018, broadening its scope to becomea comprehensive FTA. In the meantime, the Asia-Pacific Trade Agreement (APTA) members startednegotiations in 2018 to promote and facilitate FDIamong their countries, based on the implementation ofthe Framework Agreement on Promotion, Protectionand Liberalization of Investment.
2. Investment facilitation: Towardsa harmonized global investmentregime
Despite many failed attempts towards realizingmultilateral investment frameworks, the rapid growthof MNEs from emerging markets is creating renewedinterest in reviewing multilateral approaches toinvestment. With regard to recent negotiationsunder mega-regionals, such as the RegionalComprehensive Economic Partnership (RCEP) andCPTPP, these efforts could lead to enhancedharmonization of the substantive and proceduralaspects of international investment law (Sauvant,2018). Discussions have continued through the G20,especially during the Chinese presidency in 2016,with the “Guiding Principles for Global InvestmentPolicymaking” and the Trade and Investment WorkingGroup.
“Global discourse on harmonizing the globalinvestment regime, with specific focus oninvestment facilitation, is attracting renewedinterest.”
One discussion thread that warrants attention is theglobal discourse on harmonizing the globalinvestment regime, specifically with regard toinvestment facilitation. The definition of investmentfacilitation varies but can be scoped to refer toactivities that improve the overall investment climateand reduce the costs of doing business. It does notcover investment protection, investment liberalizationor investment promotion (Hamdani, 2018).Investment facilitation is considered to enhance the
investment environment by “improving transparencyand predictability of investment policies, streamliningadministrative procedures and adopting tools tohandle inquiries or complaints by investors” (Singh,K., 2018). Therefore, it is considered to be relativelynon-controversial and in the interests of everycountry.
Several initiatives have been put forward in thisregard. An international support programme forsustainable investment facilitation was put forward bythe E15 Task Force on Investment Policy.13 During theChinese presidency of the G20 in 2016, thegroundwork was laid together with support frominternational organizations,14 aimed at agreement ona non-binding investment facilitation package thatincluded the fostering of open and transparentbusiness climates and actions to promote inclusiveeconomic growth. However, the negotiationscollapsed and the final G20 Hamburg Summitdeclaration15 included only a vague reference (Berger,2018).
A multilateral investment agreement, even one thatfocuses on investment facilitation, is unlikely to berealized in the immediate future; however, withrenewed interest and pursuit from internationalorganizations and selected countries, improvementsand harmonization may materialize in the foreseeablefuture. The issue has now been taken up by theWorld Trade Organization (WTO), and emergingeconomies, including China and Brazil, are the maindrivers (Berger, 2018). However, there are concernsthat the current discussions may lead to actualnegotiations and that WTO may not be the bestforum for such negotiations, particularly as thenegotiation processes within the WTO frameworkhave not always been inclusive. While there are nocurrent intentions to start formal negotiations, theprincipal objective of any multilateral agreement oninvestment is that it should contribute to theachievement of the Sustainable Development Goals.In the meantime, India introduced the idea of an“Agreement on Trade Facilitation in Services” inWTO. As FDI is a mode of the delivery of a service,such an agreement could become, in the longer term,a stepping-stone for multilateral efforts towardsinvestment facilitation (Sauvant, 2018).
Recent protectionist measures adopted by severalcountries, including the United States, that imposetrade restrictions are prompting reciprocal measures
FOREIGN DIRECT INVESTMENT CHAPTER 3
68 ◗ Asia-Pacific Trade and Investment Report 2018
from its trading partners have raised investors’concerns. Notwithstanding the current trade war,efforts are continuing towards multilateralization ofinvestment commitments, including those byemerging economies.
G. CONCLUSIONS
Despite the decline in the level of FDI inflows, theAsia-Pacific region continued to stand firm in 2017as a major FDI destination, accounting for 39% ofglobal inflows amid significant decreases in FDIinflows worldwide. The region also remained a majorsource of FDI outflows worldwide, accounting for36% of global outflows.
Within the region, China continued to be both themain investment destination and the main source ofFDI within and outside the region. Despite the recentslowdown in FDI inflows due to its structural changefrom labour-intensive industries to high value-addedindustries, the country is expected to retain itsleading position as outward investor, especiallyexpanding its outward investment related to the Beltand Road Initiative partners. The shift to high value-added industries in China and American tradepolicies could help less developed countries attractFDI in manufacturing industries, provided theyimprove their domestic business and investmentenvironment.
One notable trend is the continuing and growingimportance of intraregional investment, whichaccounts for nearly half of total FDI inflow to theregion. Intraregional investment has already been onthe rise for the past few years, but large economiessuch as China, Japan and the Republic of Koreainvested heavily in the region in 2017, and ASEANwas the leading destination for intraregionalinvestment. Intraregional investment could furtherstrengthen economic linkages within the region andencourage the development of robust regional valuechains.
Another trend has been the rise of FDI in the servicessector. Against the backdrop of steep declines inglobal and regional greenfield FDI inflows, FDI in theservices sector in the region has remained relativelyintact and has on fact risen in a number of countries.ASEAN and China in particular have receivedincreasing FDI inflows in the services sector. Theregion also received increased FDI inflows in the
alternative/renewable energy, communications andreal estate subsectors in more recent years.
Countries in Asia and the Pacific continued toimplement policies to improve the environment forFDI. Changes in FDI policy measures from observedperiod of January 2017 to June 2018 were mainly oneasing the regulations for FDI and strengtheninginvestment facilitation. There was a significant pushin this direction by a number of countries, including:China with its gradual reform towards a moreliberalized, negative list approach; Uzbekistan with anumber of policy changes on relaxing regulations andrequirements for foreign investors; and Myanmar withthe enactment of relevant laws supporting FDIliberalization.
Countries have continued to adopt policies to eitherattract FDI that is strategically important to hostcountries or enhance the screening process forcertain types of investment. One modality widelyutilized in the region was SEZs, often used as testinggrounds for new policies and economic reforms,especially towards liberalization of FDI. Countrieshave been increasingly moving away from generalpurpose towards specific types of SEZs that reflecteconomic or competitive strengths of the locationsor zones. Another modality is restrictive or regulatoryinvestment policy measures, which significantlyincreased. National security was often used as thescreening criteria, despite being criticized for itssubjectivity. With the global rise of nationalism andprotectionism, it is anticipated that these restrictiveor regulatory investment policy measures will expandfurther.
During the observed period, a slowdown ofinternational investment treaty-signing was evident.The number of effective treaty terminations outpacedthe number of newly concluded IIAs for the first time,due to increasing concerns over the current IIAregime in terms of rebalancing investor and hostcountry rights and obligations. To overcomepersistent concerns, interest in the global discourseon harmonizing the global investment regime wasrenewed, specifically with regard to investmentfacilitation. Several initiatives have been put forward,such as (a) an international support programme forsustainable investment facilitation by the E15 TaskForce on Investment Policy, and (b) discussions ona non-binding investment facilitation package thatwere initiated at the G20 with the support frominternational organizations. Notwithstanding the

FOREIGN DIRECT INVESTMENT CHAPTER 3
Asia-Pacific Trade and Investment Report 2018 ◗ 69
current trade war, efforts are continuing towardsmultilateralization of investment commitments,including by emerging economies.
As global prospects for FDI remain unclear in thecurrent environment that is clouded by uncertainty
and volatility, including protectionist measuresadopted by a number of countries, FDI to and fromthe region is also expected to stagnate. However,with its strong fundamentals and structural change,it is anticipated that the Asia-Pacific region will retainits importance in the global investment environment.

FOREIGN DIRECT INVESTMENT CHAPTER 3
70 ◗ Asia-Pacific Trade and Investment Report 2018
Endnotes
1 Developing Asia is the approximate equivalent of East and North Asia, South-East Asia, and South-West Asia, and is takenas the best-estimate for the Asia-Pacific region as a whole (among available data).
2 Accessed on 12 September 2018.3 The estimate was based on the 21 economies of the Asia-Pacific region, which accounted for 97% of FDI inward stock of
the region as of 2017. The 21 economies are: Australia; Azerbaijan; Bangladesh; China; Hong Kong, China; India; Indonesia;Islamic Republic of Iran; Japan; Kazakhstan; Malaysia; New Zealand; Pakistan; Philippines; Republic of Korea; RussianFederation; Singapore; Sri Lanka; Thailand; Turkey; and Viet Nam.
4 Trade wars do not involve direct actions against FDI, but raise barriers to trade and, indirectly, to trade-related investmentlinked to global and regional value chains. Their impact on FDI is discussed further in chapter 4.
5 Data on sectoral flows are from fDi Intelligence data, and which provide a two-dimensional classification system recordingthe sector and activity. Efforts were made to best align this with official industry classifications, such as the InternationalStandard Industrial Classification, which is a hierarchical system. However, this proved to be problematic. In this report,aggregate sectors as defined in fDi Intelligence data were used to construct primary, manufacturing and services sectors.
6 Alternative/renewable energy is classified under Services on the basis that distribution is the major activity.7 UNCTAD Investment Policy Monitor Database available from http://investmentpolicyhub.unctad.org/IPM (accessed August
2018).8 Under a negative list approach, all foreign investments are to be liberalized unless otherwise specified in annexes containing
reservations or non-conforming measures. The Negative List in China is a list of industries in which foreign investment iseither prohibited or restricted. The Free Trade Zone Negative List follows the same logic but is less restrictive than the nationallist, and only applies to China’s free trade zones. For industries not included in the Negative List, foreign investors are givenequal treatment to domestic Chinese investments, except for record-filing requirements. Restricted industries are usuallyonly accessible to foreign investors through joint venture structures with Chinese companies or are restricted throughshareholding limits. In other cases, foreign investors might need prior approval from the Ministry of Commerce to invest in arestricted industry.
9 Foreign persons are required to pay a fee for each application made, or notice given, under the Foreign Acquisitions andTakeovers Fees Imposition Act 2015 (Fees Act) and Foreign Acquisitions and Takeovers Fees Imposition Regulation 2015(Fees Regulation).
10 UNCTAD International Investment Agreements Navigator database, available at http://investmentpolicyhub.unctad.org/IIA(accessed on August 2018).
11 Termination of IIAs refers to various types, including expired, replaced by a new treaty, terminated by consent or unilaterallydenounced.
12 Australia became the sixth and final nation to complete the ratification in October 2018, and CPTPP will come into effectfrom 30 December 2018.
13 The International Centre for Trade and Sustainable Development and the World Economic Forum established the E15 Initiativefor examining the challenges faced by the international trade and investment regime. The Task Force on Investment Policyreleased a policy option paper in January 2016, available at https://www.ictsd.org/sites/default/files/research/WEF_Investment_Law_Policy_regime_report_2015_1401.pdf.
14 UNCTAD published a discussion note on “Investment facilitation and promotion: A global action menu” and OECD alsocontributed to the discussion, and a working paper, “Towards an international framework for investment facilitation”, availableat http://investmentpolicyhub.unctad.org/Publications/Details/148 and https://www.oecd.org/investment/Towards-an-international-framework-for-investment-facilitation.pdf.
15 G20 Leaders’ Declaration: Shaping an Interconnected World, Hamburg, 7-8 July 2017. Available at https://www.g20germany.de/Content/EN/_Anlagen/G20/G20-leaders-declaration.pdf?__blob=publicationFile&v=11.

FOREIGN DIRECT INVESTMENT CHAPTER 3
Asia-Pacific Trade and Investment Report 2018 ◗ 71
REFERENCES
ASEAN Secretariat and UNCTAD (2017). ASEAN Investment Report 2017: Foreign Direct Investment and EconomicZones in ASEAN. Jakarta: ASEAN Secretariat and Geneva: UNCTAD. Available at https://asean.org/storage/2017/11/ASEAN-Investment-Report-2017.pdf.
Aung, Htin Lynn (2017). Myanmar Companies Act approved. Myanmar Times, 7 December. Available at www.mmtimes.com/news/myanmar-companies-act-approved.html.
Australia, Foreign Investment Review Board (2017). 1 July amendments to streamline and enhance Australia’sforeign investment framework. Available at http://firb.gov.au/slide/changes-to-the-foreign-investment-framework-announced-in-the-2017-18-budget-and-additional-technical-amendments-take-effect-from-1-july-2017/.
Baker McKenzie (2017). Restrictions eased for foreign investors in certain businesses. 14 June. Available atwww.bakermckenzie.com/en/insight/publications/2017/06/restrictions-eased-for-foreign-investors.
Berger, Axel (2018). What’s next for the investment facilitation agenda? Columbia FDI Perspectives, No. 224.Available at http://ccsi.columbia.edu/files/2016/10/No-224-Berger-FINAL.pdf.
Bizhub (2018). New regulations to improve Viet Nam commodity exchange. 15 May. Available at http://bizhub.vn/news/new-regulations-to-improve-viet-nam-commodity-exchange_294837.html.
Caraballo, Mayvelin U. (2017). Govt launches PH business databank. Manila Times, 5 December. Available atwww.manilatimes.net/govt-launches-ph-business-databank/366797/.
Chatterjee, Bipul, and Saurabh Kumar (2017). Promises and pitfalls of the Belt and Road Initiative. Asia PacificBulletin, No. 388. Washington, D.C.: East-West Center. Available at www.eastwestcenter.org/publications/promises-and-pitfalls-the-belt-and-road-initiative.
CMS (2018). New restrictions on the outbound transfer of intellectual property rights. 10 April. Available at www.cms-lawnow.com/ealerts/2018/04/new-restrictions-on-the-outbound-transfer-of-intellectual-property-rights?cc_lang=en.
Creehan, Sean (2017). Large Japanese capital flows pose risks to the Asia-Pacific. Federal Reserve Bank of SanFrancisco, 2 June. Available at www.frbsf.org/banking/asia-program/pacific-exchange-blog/large-japanese-capital-flows-pose-risks-to-asia-pacific/.
Economist (2017). Bangladesh – Government approves four special economic zones. 10 January. Available athttp://country.eiu.com/article.aspx?articleid=1024982286&Country=Bangladesh&topic=Economy&subtopic=Forecast&subsubtopic=Policy+trends&u=1&pid=325787416&oid=325787416&uid=1.
______ (2018). How to safeguard national security without scaring off investment. 11 August. Available atwww.economist.com/leaders/2018/08/11/how-to-safeguard-national-security-without-scaring-off-investment.
Economist Intelligence Unit (2017a). Thailand – Investors look elsewhere. 20 October. Available at http://country.eiu.com/article.aspx?articleid=1396009123.
______ (2017b). Thailand – Thailand 4.0: in sight but not in reach. 16 November. Available at http://country.eiu.com/article.aspx?articleid=1746126758.
______ (2017c) . Uzbekistan: Performance in global business rankings improves. 10 November. Available athttp://country.eiu.com/article.aspx?articleid=606107644&Country=Uzbekistan&topic=Economy.
______ (2018a). Vietnam – Another stellar year of growth expected in the CLMV. 31 January. Available at http://country.eiu.com/article.aspx?articleid=1536372337&Country=Vietnam&topic=Economy.
______ (2018b). Russia – US imposes new sanctions on Russia and proposes others. 16 August. Available athttp://country.eiu.com/article.aspx?articleid=977043681&Country=Russia&topic=Economy.
______ (2018c). Ukraine – Mixed prospects for FDI inflows in CIS countries. 24 May. Available at http://country.eiu.com/article.aspx?articleid=186764602&Country=Ukraine&topic=Economy&subtopic=Forecast&subsubtopic=Foreign+direct+investment.
FOREIGN DIRECT INVESTMENT CHAPTER 3
72 ◗ Asia-Pacific Trade and Investment Report 2018
______ (2018d). Australia – Foreign Investment Review Board approvals fall in 2016/17. Available at http://country.eiu.com/article.aspx?articleid=1086879492.
______ (2018e). Vietnam – Garment exporters to benefit from US-China trade war. 4 September. Available athttp://country.eiu.com/article.aspx?articleid=1847103368.
Economynext (2018). China leads in Sri Lanka’s FDI in 2017. 8 December. Available at https://economynext.com/China_leads_in_Sri_Lanka%E2%80%99s_FDI_in_2017-3-9328-.html.
Financial Times (2018). The fDi Report 2018: Global Greenfield Investment Trends. Available at http://report.fdiintelligence.com/.
Glueck, Ulrike (2018). China further opens market access for foreign investors. Lexology, 4 July. Available atwww.lexology.com/library/detail.aspx?g=da03a722-09f4-4793-bddb-591270152172.
Gulf Times (2018). Pakistan attracts $2.77 bn foreign direct investment in FY 2017-18. 18 July. Available atwww2.gulf-times.com/story/599950/Pakistan-attracts-2-77bn-foreign-direct-investment-in-FY-2017-18.
Hamdani, Khalil (2018). Investment facilitation at the WTO is not investment redux. Columbia FDI Perspectives,No. 226. Available at http://ccsi.columbia.edu/files/2016/10/No-226-Hamdani-FINAL.pdf.
Hong Kong, Government of Hong Kong Special Administrative Region (2017). Hong Kong and ASEAN sign FreeTrade Agreement and Related Investment Agreement. 12 November. Available at www.info.gov.hk/gia/general/201711/12/P2017111200313.htm.
Hu, Weining (2017). FDI in China during 2017 shows more cautious approach. China Briefing, 30 May. Availableat www.china-briefing.com/news/2017/05/30/fdi-trends-show-cautious-foreign-investment-china.html.
Huang, Betty, and Le Xia (2018). China – ODI from the Middle Kingdom: What’s next after the big turnaround?BBVA China Economic Watch, February. Available at www.bbvaresearch.com/wp-content/uploads/2018/02/201802_ChinaWatch_China-Outward-Investment_EDI.pdf.
Jagan, Larry (2017). Myanmar renews SEZ push. Bangkok Post, 2 October. Available at www.bangkokpost.com/business/news/1334979/myanmar-renews-sez-push.
Japan, Ministry of Economy, Trade and Industry (2017). Promulgation of the Cabinet and Ministerial Orders andthe Public Notices for the Enforcement of the Revised Foreign Exchange and Foreign Trade Act. Availableat www.meti.go.jp/english/press/2017/0714_003.html.
Jorgic, Drazen (2018). Pakistan FDI seen surging, but some Western investors fret over Chinese influence. Reuters,21 March. Available at www.reuters.com/article/us-pakistan-economy-investment/pakistan-fdi-seen-surging-but-some-western-investors-fret-over-chinese-influence-idUSKBN1GX0QO.
KPMG (2018a). China Outlook 2018. Available at https://assets.kpmg.com/content/dam/kpmg/cn/pdf/en/2018/03/china-outlook-2018.pdf.
______ (2018b). Revised tax holiday regulations more attractive for potential investors. 23 May. Available athttps://home.kpmg.com/id/en/home/insights/2018/05/id-tnf-may-2018-revised-tax-holiday-regulations.html.
Kotoski, Kali, and Brian Ng (2017). China’s squeeze on capital outflow felt in Cambodia. Phnom Penh Post,23 June. Available at www.phnompenhpost.com/business/chinas-squeeze-capital-outflow-felt-cambodia.
Mishra, Asit Ranjan (2017). FIPB abolished: what happens to foreign investors now? Livemint, 25 May. Availableat www.livemint.com/Politics/Cs8tkz7CqpiTGx4qnoDBQP/FIPB-abolished-What-happens-to-foreign-investors-now.html.
Myanmar, Directorate of Investment and Company Administration (2018). Evolving legal framework in Myanmarand implications for FDI. Background document of the Eighth Meeting of the Asia-Pacific Foreign DirectInvestment (FDI) Network, Bangkok, 25-26 September 2018. Available at www.unescap.org/sites/default/files/Evolving%20Legal%20Framework%20in%20Myanmar.pdf.
OECD (2018). OECD Investment Policy Reviews: Southeast Asia. Available at www.oecd.org/daf/inv/investment-policy/Southeast-Asia-Investment-Policy-Review-2018.pdf.
OECD and UNCTAD (2017). Eighteenth Report on G20 Investment Measures. Available at www.oecd.org/daf/inv/investment-policy/18th-Report-on-G20-Investment-Measures.pdf.

FOREIGN DIRECT INVESTMENT CHAPTER 3
Asia-Pacific Trade and Investment Report 2018 ◗ 73
Ostapets, Igor, Irina Dmitrieva, and Ksenia Tyunik (2017). Amendments to the Russian Strategic Investments Law:special regulation for transactions involving offshore companies. Moscow: White and Case LLC. Availableat www.whitecase.com/publications/alert/amendments-russian-strategic-investments-law-special-regulation-transactions.
Oxford Business Group (2017). The Report: Papua New Guinea. Available at https://oxfordbusinessgroup.com/papua-new-guinea-2018.
______ (2018). The Eastern Economic Corridor develops trade relations and investment opportunities in Thailand.Available at https://oxfordbusinessgroup.com/analysis/streamlining-routes-eastern-economic-corridor-eec-development-opens-trade-relations-and-investment.
PTI (2018). Irked over delay in payment to contractors, CVC seeks report from all CPSEs. Times of India, 16 August.Available at https://timesofindia.indiatimes.com/business/india-business/irked-over-delay-in-payment-to-contractors-cvc-seeks-report-from-all-cpses/articleshow/65423034.cms.
Reedsmith (2018). New requirements issued by NDRC on overseas investment by enterprises. 6 March. Availableat www.reedsmith.com/en/perspectives/2018/03/new-requirements-issued-by-ndrc-on-overseas-investment-by-enterprises.
Reserve Bank of India (2017). Prohibition on Indian Party from making direct investment in countries identified bythe Financial Action Task Force (FATF) as “Non-Cooperative countries and territories”. A.P. (DIR Series)Circular No. 28, 25 January. Available at www.rbi.org.in/scripts/NotificationUser.aspx?Id=10839&Mode=0.
Salehi-Isfahani, Djavad (2018). How Iran will respond to new sanctions. Brookings, 3 May. Available at www.brookings.edu/opinions/how-iran-will-respond-to-new-sanctions/.
Santander (2018). Papua New Guinea: foreign investment. Available at https://en.portal.santandertrade.com/establish-overseas/papua-new-guinea/investing-3.
Sauvant, Karl P. (2018). China moves the G20 toward an international investment framework and investmentfacilitation. In China’s Three-Prong Investment Strategy: Bilateral, Regional, and Global Tracks, Julien Chaisse,ed. London: Oxford University Press, 2018. Available at http://ccsi.columbia.edu/files/2018/04/KPS-China-the-G20-updated-March-2018.pdf.
Singapore, Ministry of Manpower (2017). Startup SG Talent: Enhanced EntrePass to attract global startup talentto build innovative businesses in Singapore. 2 August. Available at www.mom.gov.sg/newsroom/press-releases/2017/0803-enhanced-entrepass-to-attract-global-startup-talent-to-build-innovative-businesses-in-singapore.
Singh, Akanksha (2018). Myanmar allows wholesale and retail trading for foreign companies. Thailand BusinessNews, 16 May. Available at www.thailand-business-news.com/asean/myanmar/69155-myanmar-announces-liberalization-of-trading-for-foreign-owned-companies.html.
Singh, Kavaljit (2018). Investment facilitation: another fad in the offering? Columbia FDI Perspectives, No. 232.Available at http://ccsi.columbia.edu/files/2016/10/No-232-Singh-FINAL.pdf.
Singh, Kavaljit, and Burghard Ilge (2016). India’s new Model BIT is a major departure from its earlier models(of 1993 and 2003) as it provides protection to foreign investors in more limited circumstances. FinancialTimes, 15 July. Available at www.ft.com/content/53bd355c-8203-34af-9c27-7bf990a447dc.
Smyth, Jamie (2018). Australia to tighten foreign investment rules amid China concerns. Financial Times, 1 February.Available at www.ft.com/content/308ca8d6-06f6-11e8-9650-9c0ad2d7c5b5.
Sri Lanka, Board of Investment (2018). Changes and developments of Foreign Direct Investment Policy 2017/2018. Background document of the Eighth Meeting of the Asia-Pacific Foreign Direct Investment (FDI)Network, Bangkok, 25-26 September 2018. Available at www.unescap.org/sites/default/files/Investment%20Policy%20-%20Sri%20Lanka-%20Recent%20Changes%20%282017%2C%202018%29.pdf.
Srivats, K.R. (2018). Cabinet okays 100% FDI in single brand retail via automatic route. Hindu Business Line,10 January. Available at www.thehindubusinessline.com/economy/policy/cabinet-okays-100-fdi-in-single-brand-retail-via-automatic-route/article10023519.ece.
Sudakov, Dmitry (2017). Capital outflow from Russia: why do investors leave? Pravda, 3 July. Available at www.pravdareport.com/business/finance/03-07-2017/138088-capital_outflow-0/.

FOREIGN DIRECT INVESTMENT CHAPTER 3
74 ◗ Asia-Pacific Trade and Investment Report 2018
Sundaryani, Fedina S., and Viriya P. Singgih (2017). Speedy licensing pushed for energy. Jakarta Post, 31 January.Available at www.thejakartapost.com/news/2017/01/31/speedy-licensing-pushed-energy.html.
Textile Today (2018). FDI in Bangladesh textile and apparel sector rises 15.70%. 7 August. Available at www.textiletoday.com.bd/fdi-bangladesh-textile-apparel-sector-rise-15-70/.
Thailand, Board of Investment (2018). Thailand and Japan strengthen investment ties at recent investment roadshowin Fukuoka. Press release, 12 February. Available at www.boi.go.th/upload/content/Thailand_Japan_strengthen_investment_tie_5a8fcf4bcc58f.pdf.
Laotian Times (2017). Laos eliminates minimum registered capital requirement for foreign investment. 13 November.Available at https://laotiantimes.com/2017/11/13/laos-eliminates-minimum-registered-capital-foreign-investment-general-business/.
Thiha, Ko Ko, and Kang Wan Chern (2018). Myanmar permits full foreign capital investments in education sector.Myanmar Times, 23 April. Available at www.mmtimes.com/news/myanmar-permits-full-foreign-capital-investments-education-sector.html.
Thomson, Martin, and Pavanie Edirisuriya (2017). The Government’s new directive to the OIO. Dla Piper,1 December. Available at www.dlapiper.com/en/uk/insights/publications/2017/12/the-governments-new-directive-to-the-oio/.
Tilleke and Gibbins (2018). Vietnam’s third high-tech park offers incentives to investors. 2 April. Available athttp://tilleke.com/resources/vietnam%E2%80%99s-third-high-tech-park-offers-incentives-investors.
United Nations Conference on Trade and Development (2015). Investment Policy Framework for SustainableDevelopment. Geneva. UNCTAD/DIAE/PCB/2015/5. Available at https://unctad.org/en/PublicationsLibrary/diaepcb2015d5_en.pdf.
______ (2018a). World Investment Report 2018: Investment and New Industrial Policies. Sales No. E.18.II.D.4.Available at http://unctad.org/en/PublicationsLibrary/wir2018_en.pdf.
______ (2018b). Azerbaijan – Establishes a single online portal for the issuance of business licenses and permits.Investment Policy Monitor. Available at http://investmentpolicyhub.unctad.org/IPM/MeasureDetails?id=3059&hubc=null&rgn=&grp=&c=225&t=&s=&df=01%2F01%2F2017&dt=13%2F09%2F2018&pg=1&map=true&isSearch=true.
______ (2018c). Recent developments in the international investment regime. IIA Issues note, No. 1, May 2018.Available at http://unctad.org/en/PublicationsLibrary/diaepcbinf2018d1_en.pdf.
______ (2018d). Investment Trends Monitor, Issue 30. Available at https://unctad.org/en/PublicationsLibrary/diaeiainf2018d1_en.pdf.
United Nations, Economic and Social Commission for Asia and the Pacific (2017). Handbook on Policies, Promotionand Facilitation of Foreign Direct Investment for Sustainable Development in Asia and the Pacific. Bangkok.ST/ESCAP/2786. Available at www.unescap.org/resources/handbook-policies-promotion-and-facilitation-foreign-direct-investment-sustainable-0.
Uzbekistan, State Committee for Investments (2018). Main changes and developments in investment policy andregulatory framework in recent years in the Republic of Uzbekistan. Background document of the EighthMeeting of the Asia-Pacific Foreign Direct Investment (FDI) Network, Bangkok, 25-26 September 2018.Available at www.unescap.org/sites/default/files/Uzbekistan_Main%20changes%20in%20Investment%20Policy.pdf.
VietNamNet (2018). FDI in 2017: Japan exceeds South Korea, China emerges. 12 January. Available at http://english.vietnamnet.vn/fms/business/193422/fdi-in-2017--japan-exceeds-south-korea--china-emerges.html.
Xinhua (2018). China releases rules to open securities sector to foreign investors, 29 April. Available atwww.xinhuanet.com/english/2018-04/29/c_137145424.htm.

FOREIGN DIRECT INVESTMENT CHAPTER 3
Asia-Pacific Trade and Investment Report 2018 ◗ 75
ONLINE DATABASES
Economist Intelligence Unit. Data Tool. Available at http://data.eiu.com/.
Financial Times Ltd. FDi Intelligence, fDi Markets: Crossborder investment monitor. Available at www.fdimarkets.com.
UNCTAD. Investment Policy Monitor database. Available at http://investmentpolicyhub.unctad.org/IPM.
______. International Investment Agreements Navigator database available at http://investmentpolicyhub.unctad.org/IIA.