foreign direct investment policy in latin america 1980-2015
TRANSCRIPT

DEPARTAMENTO DE ECONOMÍA (*), FACULTAD DE CIENCIAS SOCIALES, UNIVERSIDAD DE LA REPÚBLICA, URUGUAY
Foreign Direct Investment Policy in
Latin America 1980-2015 Configurational Analysis with political,
structural and macroeconomic Fuzzy Sets
07/03/2019
Gustavo Bittencourt (**)
JEL: F23, F29
(*) Constituyente 1502, Montevideo, Uruguay, (598) 24106449
(**) [email protected]

1
Abstract
I am following the analysis of policies towards foreign capital in Latin America summarized
in Bittencourt (2016), covering, in this paper, 17 countries along the period 1980-2015. The
current work has two directions: on the one hand to identify the applied policy instruments
and analyze their configurations, and on the other hand, to explore what characteristics of the
countries are associated with such configurations. In the first direction, I adapted Dunning’s
and UNCTAD’s classifications, to elaborate a typology composed by three regulatory and
six promotional instruments, whose definition in Latin America’s countries is made through
an extensive literature review. Some determinant transitions occurred in the 1980s’: going
out from the introverted industrialization in the major countries, the end of the military
dictatorships in the Southern Cone and Brazil, while Central America was trying to exit from
a long period of civil wars. Public strategies regarding foreign capital were reoriented from
the regulatory stage between the middles 1960s-1970s decades, to the transition of 1980s,
arriving to a promotional predominance in the 1990s, until the present. The increase in the
presence of governments that the IDB Database of Political Institutions 2015 characterizes
as left implies a few cases of confrontation via expropriation in the period 2004-2015, but
the remaining left governments approach configurations of promotional predominance. The
second direction of the work offers an exploratory analysis of the conditions explaining why
some countries can apply certain instruments and others do not, regarding (or in spite of)
their political orientation. I selected variables suggested by the bargaining theory of the
relationship between governments and TNCs, and I use the configurational analysis
proposed by Ragin (2008), through the fsQCA 3.0 software, to explore some relations.
Among other conclusions, the truth tables shows that, in the context of this sample, every
“big” country and every country combining mineral exports and low political risk, apply at
least one FDI policy regulation. The absence of regulation is associated with center-right
governments in smaller and political risky countries. Small countries not inserted in FDI
circuits, mostly open and political un-risky, conducted Rules-Based competition for FDI.
Mexico after 2004 was the only big country applying RBC. All bigger countries applied
incentives competition for FDI (IBC). Relative small countries with low diversified FDI also
conducted IBC. Regarding privatizations, there is a clear political determination: only center
or right governments applied this instrument. After 1990, small, relative non-exporter and

2
low educated countries, and Mexico (in the other hand, big, open and relative educated),
resort to the application of free Export Processing Zones (EPZs). Big and non-exporter
countries, with low risk and diversified FDI, applied sectorial policies (SEC). Small open
and not risky countries, with no diversified FDI origins, also did. This exploratory results
support the hypothesis provided by the bargaining governments-TNCs theory.
JEL: F23, F29
1. Introduction
The Transnationalization Process (or productive globalization) refers to the international
expansion of Transnational Corporations (TNCs) as one of the most relevant aspects of the
globalization of the world economy since the second half of the 20th century. The global
expansion of TNCs had an important acceleration since 1990, which determined that the
current world is structurally much more transnational than three decades ago1, although the
pace of expansion of the process slowed down after the 2008-2009’s crisis. In addition,
developing countries become more important as recipients of FDI (receiving more than half
of the world's flows since 2009), which means that the presence of ET now reaches most of
the world's economies, including many of the poorest, who had been marginalized from this
process in the 20th century. The role of TNCs from developing countries as active agents of
the Transnationalization process in the world, also increases greatly. It is not possible to
understand the policies that governments apply to foreign capital, its link with the reception
of FDI and its performance, without taking into account these transformations of the global
economic system.
This paper attends questions in two directions. The first direction points to the types of
instruments applied for the treatment of foreign capital in Latin American countries from
1980 to 2015: promotional or restrictive, and how do both types of instruments combine in
the three decades. The second direction is to explain which policies can emerge according to
1 Taking one indicator, since the crisis of 2008-2009 the global FDI stock, a good proxy for capital of TNC
affiliates, is valued around one third of the world GDP, while it was less than one tenth in 1990.

3
the wishes and the strengths of the governments relative to TNCs, based in some structural
an macroeconomic characteristics suggested by the theoretical framework.
After this introduction, in section 2, I postulate an analytical framework and a typology of
instruments to explain the cases of Latin American countries. Section 3 reviews the broader
perspective of political evolution in the period, adapting the 2016 IDB Political Database,
including a broad view of evolution in FDI Policy. Then, the instruments applied in the
periods 1984-1989, 1991-2000 and 2004-2015 are described and synthesized, separating
them between instruments of regulatory or promotional policies. Section 4 carries out an
analysis aiming to identify configurations of instruments, linking them with the political
orientation of governments and with some structural and macroeconomic characteristics,
guided by the OLI paradigm. Finally, section 7 summarizes some conclusions.
2. General analytical framework of FDI Policy
2.1 FDI policy instruments at the national level according to Dunning
and Lundan’s bargaining model
Each national government defines a series of instruments for the treatment of investments
that may have specific chapters for FDI, as well as delimit other actions aimed at promoting
or modifying certain types of behaviors by the TNCs. This is the analytical object of this
paper. The set of possible national policy instruments is increasingly limited by international
treaties: multilateral agreements, Bilateral Investment Agreements (BITs), or Free Trade
Agreements with investment clauses.
I take the analytical framework proposed by Dunning and Lundan (2008) to study the way in
which Latin American countries organize their policies towards TNCs. According to these
authors, following the line of thought established by Dunning in his works since the early
1980s, the OLI paradigm (Ownership, Localization, Internalization) offers a theoretical
4
framework to understand the formulation of policies in a negotiation process2. Dunning
proposed this approach, in its original version, to understand why companies take the steps
of invest abroad, e.g., became TNCs and go into the transnationalization process. It indicates
that three conditions must happen simultaneously, for a company to choose making
international production through productive investments in another country:
i) Ownership advantages: the company must have a specific asset that differentiates
it from its competitors, generally referring to technology, marketing or
managerial skills;
ii) Localization advantages, host country must have some assets that make
investment attractive, ranging from characteristics of the domestic market to the
endowment of natural and human resources, through institutional and political
features (including specific policies such as those will be studied in this
document); and
iii) Internalization advantage, there must be characteristics that make it preferable to
carry out activities through the extension of the company's borders, instead of
carrying out transactions with independent agents (that is, making FDI instead of
exporting or selling production licenses).
Figure 1
2 As Dunning and Lundan (2008) states: “the OLI paradigm offers a useful framework for understanding both
the nature and outcome of government-MNE interaction”. Dunning’s contribution to this framework was to
make explicit the OLI paradigm in the bargaining process. I first read about it in Grosse (1989).

5
Source: Dunning and Lundan 2008
The O advantages developed by TNC versus the amount and quality of the L advantages of
the host countries, can be seen as the respective power factors. The confrontation of this set
of conditions determines both the scheme of policies, as well as the realization of
investments, and/or the adaptation of the TNC's behavior to the objectives set by the
country's development strategy. The greater (potential to generate value) and the unique
advantages of the TNCs, the greater their power relative to that of the states or governments.
The greater advantages L of the country, this is the greater and unique value generation
potential, the greater is the government´s capacity to obtain benefits in a negotiation process.
Therefore, a set of assets-attributes of the countries and the TNCs allow the appearance of
some governments’ policies preserving the realization of investments (without throwing FDI
out). The international context enters into the scenarios, affecting the relative strengths of
each party. Besides how much unique are the assets that both parties have, relative power
increases for governments that can resort to other sources of FDI, or for TNCs that can easily
find other locations.
This framework indicates a Bargaining Model that ends up generating certain type of
Investment policy measures, or FDI Policy instruments. According to Dunning and Lundan
(2008), policies towards inward FDI broadly fall into four groups:

6
i. Conditions of entry or setting up of a foreign affiliate. These conditions
usually contain five main criteria. Four of these criteria correspond to
restrictive instruments: allowed degree of foreign ownership, kinds of
value-added activities in which MNEs may participate, financing of the
inbound investment, and location of the investment within the recipient
countries according to regional development policies. The fifth criterion
“relates to the pre-entry conditions for FDI, and comes within the broad
heading of investment incentives”…”These include a broad range of fiscal
incentives, such as tax holidays or reduced rates of taxation, other financial
incentives, such as subsidised loans or loan guarantees, and other incentives,
which includes subsidised infrastructure and public services.” Dunning and
Lundan (2008) includes Investment Promotion Agencies (IPA) in this
category.
ii. Operating requirements demanded or expected of foreign-owned affiliates.
They include guides or recommendations for local purchases of inputs,
capital goods or services, training practices for managerial and professional
personnel, technology transfer, local content of exports, percentage of
exports in production, R & D carried out by the affiliate, etc. In general,
WTO rules had prohibited performance requirements in the chapters of the
agreement referencing measures affecting investments related to trade
(TRIMs). The limitation to the use of these mechanisms is also incorporated
in Bilateral Investment Agreements (BITs) or Free Trade Agreements.
iii. Conditions for the exit of foreign investors or divestment requirements.
“…they were quite common in the 1960s and 1970s, particularly among
developing countries which viewed the role of inward investment as that of a
tutor to indigenous firms and considered that as soon as the tutoring had been
successfully accomplished, the tutor should gracefully withdraw.”
iv. Cost-effective way of attracting inbound FDI. This fourth group
encompasses the other three.
2.2 UNCTAD´s FDI Policy Classification

7
UNCTAD publishes “The Investment Policy Monitor” since 2009, “in order to provide
policymakers and the international investment community with up-to-date information
about the latest developments and trends in investment policies at the national and
international level.” Looking for this purpose, UNCTAD classifies and describes FDI
policy changes3, taking into account liberalization-promotion and regulation-restriction.
Any instrument may improve (hinder) the conditions for TNC’s entry and operation, if
the same benefit (requirement) increases or it tends to disappear. The typology of
policies has been changing over time:
- In 2009 there were two broad classes: a) Investment-Specific measures4, where one
could find four types of instruments: Entry5, Facilitation-promotion, Operation-
taxation and Outward investment promotion; and b) Investment-related measures,
compounded by four types: international investment agreements (IIAs), General
legal framework, Stimulus package/state aid, and General taxation measures
- In 2011-2012 the Monitor simplified the typology, grouping investment policy
measures into 4 broad classes: Entry/establishment, operation (FDI specific and FDI
related, which includes the categories used previously: investment specific and
Business climate), Promotion and facilitation, and measures promoting or limiting
Outward FDI
- UNCTAD simplified the typology even more after 2016’s version, publishing
changes implying more restrictive or more promotional policies, in each of four
broad set of instruments: i) Entry, ii) Operational treatment, iii) Promotion and
3 “The policy measures mentioned in the Monitor are identified through a systematic review of government
and business intelligence sources. Measures are verified, to the fullest extent possible, by referencing
government sources. The compilation of measures is not exhaustive.” UNCTAD/IPM (2015) 4 Investment-specific measures address investment from domestic and foreign sources, such as measures to
protect, facilitate, promote, or regulate or restrict investment. In some editions of the Monitor, UNCTAD
separates FDI-specific measures: specifically addressing foreign investment, i.e. liberalize, regulate, protect
and/or facilitate/promote foreign investment, for instance, through the approbation of a Law on Foreign
Investment. 5 “Entry: policy measures relating to the entry and establishment of foreign investors. Impose or relax
restrictions on foreign ownership or open up new business opportunities; eases the approval requirements for
foreign investment, streamlines the registration process, removes restrictions for foreign private investment in
strategic sectors, and provides certain legal guarantees and incentives.” UNCTAD/IPM (2016)

8
facilitation (Countries grant tax incentives, facilitate investment procedures or
established new investment promotion agencies), and iv) General business climate
(BC). BC measures address general determinants of business climate attractiveness.
2.3 Adaptation of the typologies for Latin America
This section seeks to define an operational classification for the case of Latin American
countries between 1980 and 2015. In previous works we have applied typologies of policies
in the context of studies on FDI’s determinants (for example, Bittencourt 1995; Bittencourt
& Domingo, 2004). Dummy variables were defined, implying that the observation is worth 1
in the presence of the instrument and zero in other case. I recently carried out a typology like
the one presented here, but limited to the period 1990-2014 and to 13 countries (Bittencourt,
2016).
The proposed typology follows a conceptual line similar to that used by UNCTAD and by
Dunning. Unlike UNCTAD, which focuses on the changes indicating whether they imply an
increase or reduction of the defined attribute, be it regulation or promotion, in this case the
definition of each instrument corresponds univocally with regulation or promotion, and it
will be valued as 1 if the country applies in instrument during most of the period. Subsequent
exercises will apply a fuzzy set logic, grading the presence of the attribute, but in this work I
select a strict definition.
Regarding Dunning and Lundan's proposal, the last two categories are of little use to detect
instruments applied since 1980 in Latin America. In this paper a first major division will be
made between instruments aimed at restricting or modeling the activity of the TNCs with
respect to those oriented especially to the promotion of FDI. The "restrictive or regulatory"
instruments will be of 3 types, two of them (i and ii) follow some of the instruments named
in Dunning and Lundan's first two classes, to which is added a confrontation instrument
considered relevant for the Latin American case. The definition of Entry and Performance
requirements is similar to UNCTAD’s typology:
i. Restrictions for the entry of FDI (ENT): These are conditions that the TNC
must meet in order to enter and register legally to operate in the country. For
example: obligation of co-participation with national capital, limitation to the

9
activities or sectors in which the TNC can participate, mandatory location of
the investment in any region within the country, limits to the remittance of
profits and the repatriation of capital, either through prohibitions, specific
taxes, or exchange difficulties to access foreign currency to be remitted
abroad. It corresponds to Entry/establishment conditions of UNCTAD and
with the first four criteria included in the category i) from Dunning and
Lundan (2008).
ii. Performance requirements (PER): it may be local content requirements,
the obligation of some proportion of inputs must be purchased from local
providers, value added or local labor, some proportion of exports in total
sales, compensated external exchange. These performance requirements
maybe requested when the TNC processes entry authorization, or to obtain
some benefits from other sectoral policies, or to enter in trade external by
commercial agreements. It corresponds to category ii by Dunning and
Lundan (2008).
iii. Expropriations (EXPRO). It refers to the forced purchase of assets of the
TNCs by the national states, in general to form public capital companies.
This policy tends to coincide with an explicit government´s preference
towards national capital companies, in policies and public actions. It does not
appear differentiated as an instrument in Dunning and Lundan or in
UNCTAD.
On the other hand, we can find policies of a promotional nature, that is, those aimed at
attracting foreign capital, improving their conditions of access and operation. UNCTAD’s
typology separates promotion policies between investment specific measures (like tax
incentives, facilitate investment procedures or investment promotion agencies) and General
business climate. I prefer to break down into business climate related instruments and
incentives, remaining six classes:
iv. Business climate (CLI): concern and measures aimed at improving the
business environment, including fiscal, labor, environmental, intellectual
property measures, applied in general, but aimed at attracting investments.
Existence and type of investment laws in force, specific rules to guarantee

10
stability (such as investment contracts). These types of instruments are
intended to improve the treatment of investments in general (not only for
FDI), and to emphasize that TNCs will be subject to similar conditions and
requirements as national companies (National Treatment).
v. Privatizations (PRI): sale of public companies, which were providing
markets for public services or supplies of widespread use, from which the
state withdraws, in which TNCs can participate to access this internal
markets.
vi. Export Processing Zones (EPZ): Free Zones where tariffs and import
barriers are eliminated or reduced to facilitate the importation of inputs,
which usually include tailor-made tax exemptions, and in some cases
important public contributions in infrastructure.
vii. Specific incentives to sectors (SEC): important sectoral policies that can act
as conditioning or attractors of FDI; for example Hydrocarbons, Mining,
High Technology, Automotive, etc.
viii. Investment Promotion Agencies (IPA): existence of institutes
with the task of promoting and monitoring foreign investments, functions that
these agencies fulfill (known as Investment Promotion Agencies, IPAs) IED;
for example Hydrocarbons, Mining, High Technology, Automotive, etc.
ix. International Investment Agreements (IIA): Free Trade Agreements,
Agreements for the Promotion and Reciprocal Protection of Investments
(APPRIs)
Three promotional classes (v, vi and vii), along with other incentives that are more difficult
to identify, such as the benefits granted by the subnational states or provinces for the
installation of the subsidiaries, constitute what Oman 2000 called Incentives-based
Competition for FDI. The other three classes (v, viii and ix), are more related with changes in
the environment for FDI, and can be grouped as Rules-based Competition for attracting FDI
in the sense of Oman (2000).
3. Descriptive Summary of FDI Policies using Crispy Sets
3.1 A broad political outlook

11
A brief look at history shows us that policies towards foreign capital in the world, and in
particular in Latin America, have gone through "cycles". After the 1930’s crisis, nationalist
tendencies have manifested with confrontation against foreign capital, as in the Estado Novo
of Getulio Vargas in Brazil (1937-1945); and nationalizations in the Cárdenas’ government
in Mexico (1939), Perón in Argentina between 1945 and 1950, Bolivia, Guatemala and
Venezuela (Lichtensztejn and Trajtenberg, 1991:5). In the 1950’s decade, while Dunning
and Lundan (2008) characterize a world scaled "honeymoon" between states and ET, there
was a stage of liberalization in most of the Latin American countries. Frondizi (1958-1962)
and Onganía (1966-1968), both in Argentina, the Brazil of Kubistchek (1955-1960) and
Castello Branco (1964-1967), the Mexican "stabilizing development" of the López Mateos
and Díaz Ordaz’s governments between 1958 and 1970, and the formation of the Central
American Common Market, were examples of the rapid expansion of positions in favor of
receiving transnational capital (Lichtensztejn and Trajtenberg, 1991). It was followed by a
stage of confrontation between states and ET in the world between the late 1960's and
mid-1970's (Dunning & Lundan, 2008: 677), that showed a vigorous expression in Latin
America through the predominance of regulatory policies. Main expressions were Decision
24 of the Andean Community of Nations, Mexicanization laws promulgated in the early
1970s, as well as the heterodox policy of regulation applied by Brazil in the period.
Dunning & Lundan pointed out that after this brief divorce between States and ET in the
early 1970s, there was a long phase of reconciliation in the world, in which we still find
ourselves, right in the 21st century. In Latin America, this implied a generalized political
shift towards free market reforms (initiated prematurely in the Southern Cone in 1973) that
reached almost all countries in the 1990s. Brazil did not follow an identical trajectory. The
1988 constitution in that country still does not guarantee national treatment because it
establishes the figure of a foreign company with specific requirements for its action and a
series of limitations, but in practice, Brazilian Government did not apply any severe
restrictions since the mid-1980s. According to Sabbatini (2008) there was a process that
pointed to "deregulation, end of operation limitations, liberalization of funds transfers,
national treatment, protection of assets (including intellectuals), competition policy and
international arbitration for conflict resolution", which had its maximum expression in the
Government of Collor de Mello in 1992. Since the mid-1990s and especially after 2004,

12
governments implemented several productive development programs with emphasis in
sectoral policies, seeking behaviors of the ET aligned with the objectives of the programs. A
1995 constitutional amendment expressed the aim to boost the presence of foreign capital,
eliminating differences in treatment with respect to domestic companies, a principle that
continuous in the 21st century.
In the countries of the Andean Pact, the remnants of the regulatory regime that had its main
milestone in Decision 24 of 1970 were eliminated by Decision 291 of the Cartagena
Agreement issued in 1990 (Common Regime of Treatment of Foreign Capitals and
Trademarks, Patents, Licenses and Royalties). In Mexico, the 1973 Foreign Investment Law
(known as “Ley de Mexicanización”), implied that some economic activities were
completely restricted to foreign capital while other required a minority participation of FDI,
although its application was progressively left aside since the mid-1980s. Small countries
with weaker states, such as Bolivia or Paraguay, did not apply strong regulations, nor did the
small Central American economies, which with the exception of Costa Rica, were in
dictatorial regimes and/or in processes of civil war until 1990.
Table 1 shows a summary of the political evolution of the period, adapted from the Database
of Political Institutions of the IDB (Cruz et al 2016):
Table 1. Political orientation of the President
1984-1989 1990-1999 2004-2015
Argentina C R L
Bolivia R L-C-R L
Brazil (3) R R-C L
Chile MD R C-L L-C
Colombia (1) R C 0
Costa Rica L R-L R-L
Ecuador (4) R L L
Guatemala DM R R R-L-R
Honduras R R R
Mexico C C R-C
Nicaragua L C-R R-L
Panama (2) R R-C C-R
Peru R-L R L
Paraguay DM R R R-L-R
13
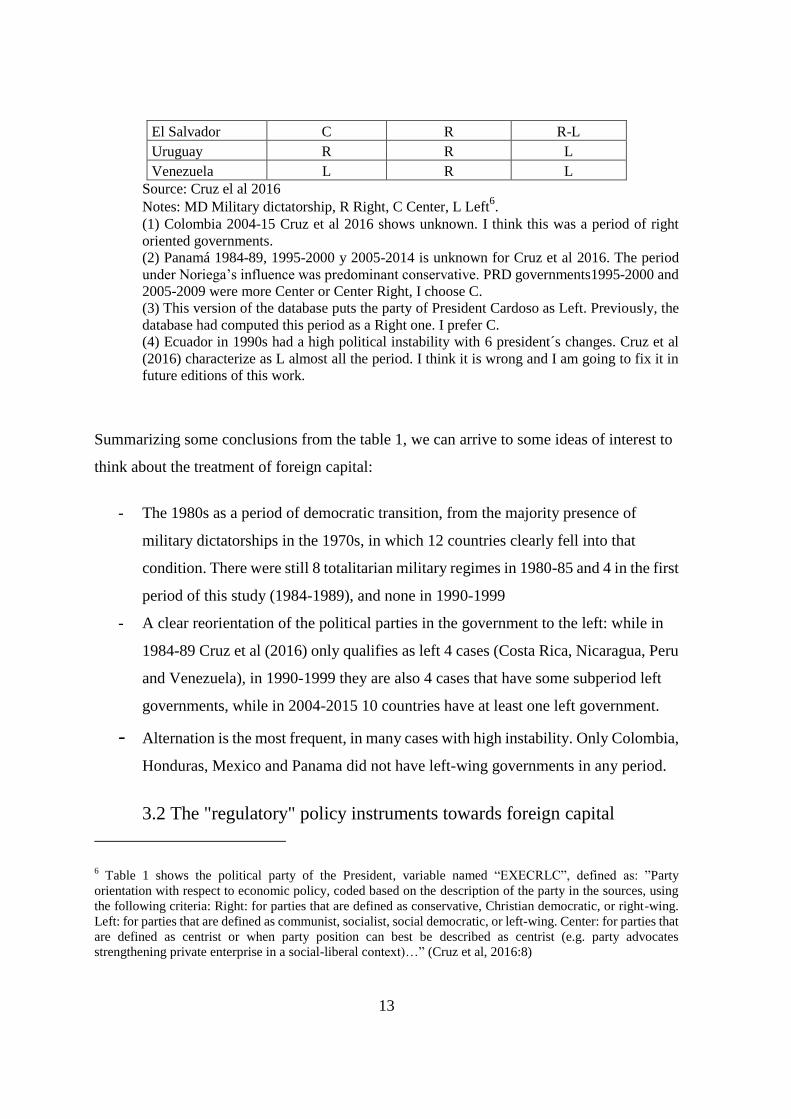
El Salvador C R R-L
Uruguay R R L
Venezuela L R L
Source: Cruz el al 2016
Notes: MD Military dictatorship, R Right, C Center, L Left6.
(1) Colombia 2004-15 Cruz et al 2016 shows unknown. I think this was a period of right
oriented governments.
(2) Panamá 1984-89, 1995-2000 y 2005-2014 is unknown for Cruz et al 2016. The period
under Noriega’s influence was predominant conservative. PRD governments1995-2000 and
2005-2009 were more Center or Center Right, I choose C.
(3) This version of the database puts the party of President Cardoso as Left. Previously, the
database had computed this period as a Right one. I prefer C.
(4) Ecuador in 1990s had a high political instability with 6 president´s changes. Cruz et al
(2016) characterize as L almost all the period. I think it is wrong and I am going to fix it in
future editions of this work.
Summarizing some conclusions from the table 1, we can arrive to some ideas of interest to
think about the treatment of foreign capital:
- The 1980s as a period of democratic transition, from the majority presence of
military dictatorships in the 1970s, in which 12 countries clearly fell into that
condition. There were still 8 totalitarian military regimes in 1980-85 and 4 in the first
period of this study (1984-1989), and none in 1990-1999
- A clear reorientation of the political parties in the government to the left: while in
1984-89 Cruz et al (2016) only qualifies as left 4 cases (Costa Rica, Nicaragua, Peru
and Venezuela), in 1990-1999 they are also 4 cases that have some subperiod left
governments, while in 2004-2015 10 countries have at least one left government.
- Alternation is the most frequent, in many cases with high instability. Only Colombia,
Honduras, Mexico and Panama did not have left-wing governments in any period.
3.2 The "regulatory" policy instruments towards foreign capital
6 Table 1 shows the political party of the President, variable named “EXECRLC”, defined as: ”Party
orientation with respect to economic policy, coded based on the description of the party in the sources, using
the following criteria: Right: for parties that are defined as conservative, Christian democratic, or right-wing.
Left: for parties that are defined as communist, socialist, social democratic, or left-wing. Center: for parties that
are defined as centrist or when party position can best be described as centrist (e.g. party advocates
strengthening private enterprise in a social-liberal context)…” (Cruz et al, 2016:8)

14
1980-20157
3.2.1 Restrictions for FDI’s entrance (ENT)
Unlike what happened in the cycle of regulatory policies of the late sixties and early
seventies, in the successive periods the number of countries that apply ENT, is reducing.
This variable is worth 1 if the country applies at least one of the following instruments:
obligation of co-participation with the national capital and/or technological transfer,
obligation not to rotate capital / profits in predetermined terms or with specific taxes, or
other measures aimed to modify the behavior of the subsidiaries by administrative
requirements in authorizations to establish. Table 2 reports the results of the bibliographic
study.
Table 2
Restrictions for the entry of FDI (ENT)
1984-89 1991-99 2004-15
Total
country
Argentina 1 0 0 1
Bolivia 0 0 1 1
Brasil 1 0 0 1
Chile 0 1 1 2
Colombia 1 0 0 1
Costa Rica 0 1 1 2
Ecuador 1 1 0 2
El Salvador 1 0 0 1
Guatemala 0 0 0 0
Honduras 0 0 0 0
México 1 1 1 3
Nicaragua 0 1 0 1
Panamá 0 0 0 0
Paraguay 0 0 0 0
Perú 1 0 0 1
Uruguay 0 0 0 0
Venezuela 1 1 1 3
Total
sub-period 8 6 5 20
7 I will present here a brief summary of the explanation of the variables. Reader can find more details in
Bittencourt (2016 and 2019).

15
Fuente: own elaboration
In South America, during the 1980s and 1900s, the following countries practiced ENT
restrictions to FDI:
Argentina applies restrictions to the remittance of utilities with exchange control
during the stabilization plans between 1984 and 1989.
Chile applies restrictions on the repatriation of capital before certain deadlines and
the remittance of profits is subject to additional aliquots of income tax according to
Decree 600 of 1974.
Brazil: Sarney’s government practiced some discriminatory treatment with
restrictions, in line with the Constitution approved in 1988. President Collor de
Mello eliminated restrictions in 1991-1922. The 1995 constitutional amendment
enshrines equal treatment, although FDI remained restricted for some sectors.
In the Andean Pact, Decision 24 of the Cartagena Agreement was in force in the
1980s, flexibilized by subsequent resolutions, until the abandon of restrictions by the
Decision 291. Bolivia, Colombia and Peru, accelerated the application of the new
Andean regulations. Ecuador regulated Decision 291 in the second half of the decade
(López et al., 2015, 28). Venezuela, mainly by means of exchange controls and other
economic emergency measures, maintained access restrictions (WTO, 1996) after
1994. During the 21st century, the arrival of "leftist" governments: Bolivia restricted
some sectors after the plebiscite for hydrocarbons in 2004 and Venezuela controlled
the remission of foreign currency by exchange control mechanisms in Venezuela8.
Mexico applied ENT in the whole period. Although the registration was still mandatory, the
Mexicanization Law was losing its validity during the decade of the 80s. The 1993 law
8 Ecuador applied a few sectorial restrictions, while the remittance of currencies is limited later in Argentina,
but for a short period. I decided to take as 0 the presence of ENT restrictions in these two cases, but if we were
in Fuzzy Sets logic, clearly the variable would be different from 0 and less than 1.

16
established the obligation to resolve the requests in 45 days, otherwise they would be
approved automatically. The 1993 law eliminated restrictions in the 85% of activities so far
closed to FDI, allowing a minority presence of FDI in 35 activities and only 37 excluding it
(Vazquez, 2011). Dussel (2007) indicates that despite the opening, Mexico was seen as one
of the countries with the greatest sectoral restrictions. The reforms initiated in 2013
liberalized some strategic sectors, such as telecommunications and hydrocarbons, opening
them to FDI (Vargas, 2014).
In Central America there were only two cases of ENT. Access authorization in Costa Rica’s
Free Zones regime requires investment only for some predefined sectors and subject to
compliance with certain parameters, this implies a special form of access conditions.
Duarte’s government (El Salvador, in 1984-1985) reinforces some interventionist measures,
like control of money exchange and interventions in foreign trade with nationalized banking.
3.2.2 Performance Requirements (PER)
I found 10 cases of fully application of performance requirements in the whole period. Table
3 shows them.
Table 3.
Performance Requirements (PER)
1984-89 1991-99 2004-15 Total
Argentina 0 1 1 2
Bolivia 0 0 0 0
Brasil 1 1 1 3
Chile 0 1 0 1
Colombia 0 0 0 0
Costa Rica 0 1 1 2
Ecuador 0 0 0 0
El Salvador 0 0 0 0
Guatemala 0 0 0 0
Honduras 0 0 0 0
México 1 0 0 1
Nicaragua 0 0 0 0
Panamá 0 0 0 0
Paraguay 0 0 0 0
Perú 0 0 0 0
Uruguay 0 0 0 0
Venezuela 0 1 0 1

17
Total 2 5 3 10
Fuente: own elaboration
Brazil applied this type of instruments in its automotive policy, in other manufacturing
activities, and in its oil policy since 1986, and after 2000, in the successive launches of
productive development strategies (2003 PITCE, 2008 PDP, 2011 Brasil Maior). Argentina
applied this type of regime since 1991 in its automotive sector, with a system of
compensated dollar exchanges by company (Arza and López, 2008). In the 21st century,
government continued the automotive regime, adding administrative management of the
import licenses linked to export objectives by companies, applied to a broad set of
manufacturing sectors. The Costa Rica’s Free Zones regime impose some requirements in
the settlement contracts: minimum investment amount, minimum level of local employment
and national value added. Chile maintained a special regime for the automotive industry
with national content and export requirements (WTO, 1997), abolished after 1998.
Venezuela applied this type of requirement in the 1990s in some sectoral regimes, such as
the automotive (OMC Venezuela 2006) and the petroleum industry. Mexico’s 1993 law
maintained authorization to FDI entry in some productive sectors. Evaluation criteria for
applications could include performance requirements. I did not find any reference in the
literature, of this instruments having used in that direction.
3.2.3 Expropiations (EXPRO)
Although with nuances regarding the pace and scope of liberalization, I did not find relevant
expropriations reported before 2004, while the tendency to treat foreign capital as national
was generalized. In Nicaragua, properties of Somoza and some of their relatives were
expropriated in the early 1980s, but no other expropriations were carried out after 1984
(Morris, 2010; Vilas, 1990). In the Andean Pact, Venezuela fully enshrined equality of
treatment until the 1999 Constitution. I did not classified these as expropriating cases and
therefore the corresponding variable assumes the value 0.

18
The only cases that carry out expropriation processes that can be classified as "hostile", to
the extent that they impose prices or valuations on the capital of the companies that are
nationalized, which, according to several reports, would be below market conditions. In
Argentina, especially during 2007 and 2008, the Government nationalized the pension
system and YPF. After 2006, the Bolivian government has nationalized most of the
companies privatized in the 1990s: all petroleum and most transportation and power sectors,
the largest telecommunications company, a foundry and a cement plant (USDC-ICS, Bolivia
2015). Venezuela promoted the process of nationalization, highlighting the cases of the
telephone CANTV, Electricidad de Caracas, cement companies and a steel company in
2008, negotiated with Verizon, AES and CMS (TNCs from the United States) and these
companies agreed to transfer their assets to the government, according to UNCTAD (2007).
3.3 "Promotional" policy instruments towards foreign capital 1980-2015
3.3.1 Business Climate (CLI)
S shown in Table 4, the countries of the Southern Cone carried out an opening up to FDI
process, accompanied by liberalization of markets and privatizations, continuing the
liberal experiences of the 70s, after the debt crisis in 1982-1984, and especially after
1990.
Table 4. Business climate (CLI)
Etiquetas de fila 1984-89 1991-99 2004-15
Total
general
Argentina 0 1 0 1
Bolivia 1 1 0 2
Brasil 0 1 0 1
Chile 1 1 1 3
Colombia 0 1 1 2
Costa Rica 0 0 1 1
Ecuador 0 1 0 1
El Salvador 0 1 1 1
Guatemala 0 0 1 1
Honduras 0 1 1 2
México 0 1 1 2
Nicaragua 0 0 1 1
Panamá 0 1 1 2
Paraguay 0 0 1 1
19
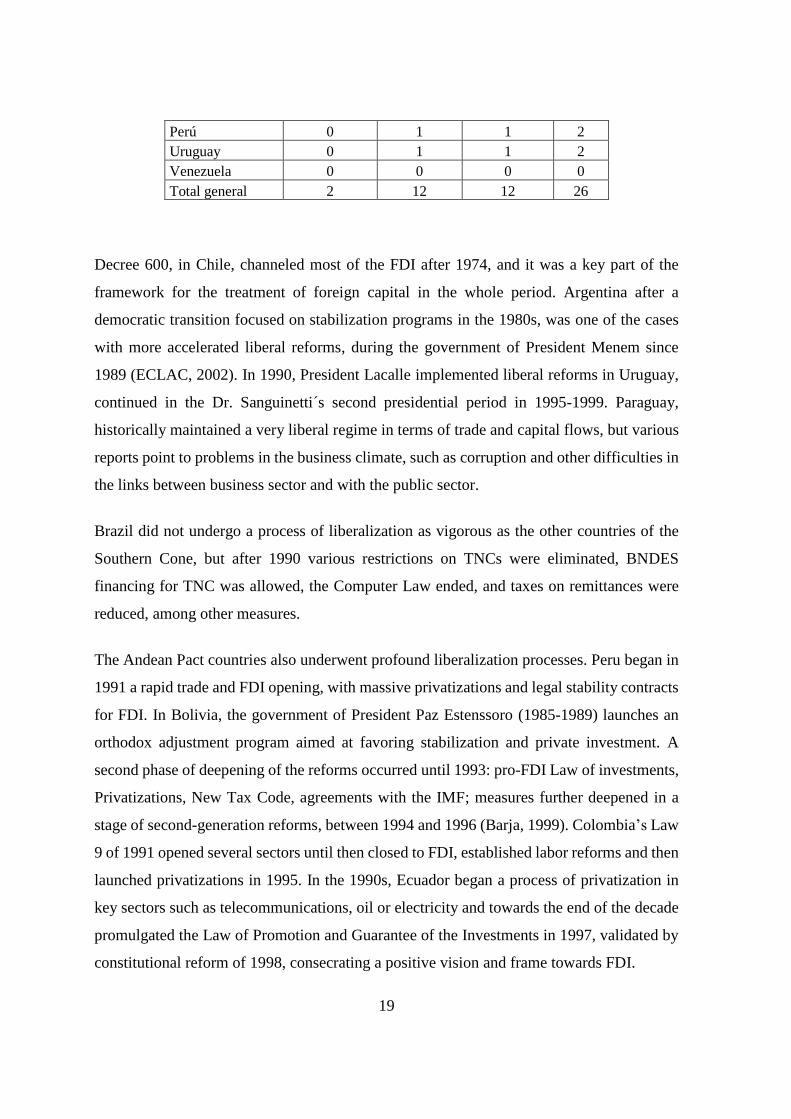
Perú 0 1 1 2
Uruguay 0 1 1 2
Venezuela 0 0 0 0
Total general 2 12 12 26
Decree 600, in Chile, channeled most of the FDI after 1974, and it was a key part of the
framework for the treatment of foreign capital in the whole period. Argentina after a
democratic transition focused on stabilization programs in the 1980s, was one of the cases
with more accelerated liberal reforms, during the government of President Menem since
1989 (ECLAC, 2002). In 1990, President Lacalle implemented liberal reforms in Uruguay,
continued in the Dr. Sanguinetti´s second presidential period in 1995-1999. Paraguay,
historically maintained a very liberal regime in terms of trade and capital flows, but various
reports point to problems in the business climate, such as corruption and other difficulties in
the links between business sector and with the public sector.
Brazil did not undergo a process of liberalization as vigorous as the other countries of the
Southern Cone, but after 1990 various restrictions on TNCs were eliminated, BNDES
financing for TNC was allowed, the Computer Law ended, and taxes on remittances were
reduced, among other measures.
The Andean Pact countries also underwent profound liberalization processes. Peru began in
1991 a rapid trade and FDI opening, with massive privatizations and legal stability contracts
for FDI. In Bolivia, the government of President Paz Estenssoro (1985-1989) launches an
orthodox adjustment program aimed at favoring stabilization and private investment. A
second phase of deepening of the reforms occurred until 1993: pro-FDI Law of investments,
Privatizations, New Tax Code, agreements with the IMF; measures further deepened in a
stage of second-generation reforms, between 1994 and 1996 (Barja, 1999). Colombia’s Law
9 of 1991 opened several sectors until then closed to FDI, established labor reforms and then
launched privatizations in 1995. In the 1990s, Ecuador began a process of privatization in
key sectors such as telecommunications, oil or electricity and towards the end of the decade
promulgated the Law of Promotion and Guarantee of the Investments in 1997, validated by
constitutional reform of 1998, consecrating a positive vision and frame towards FDI.
20
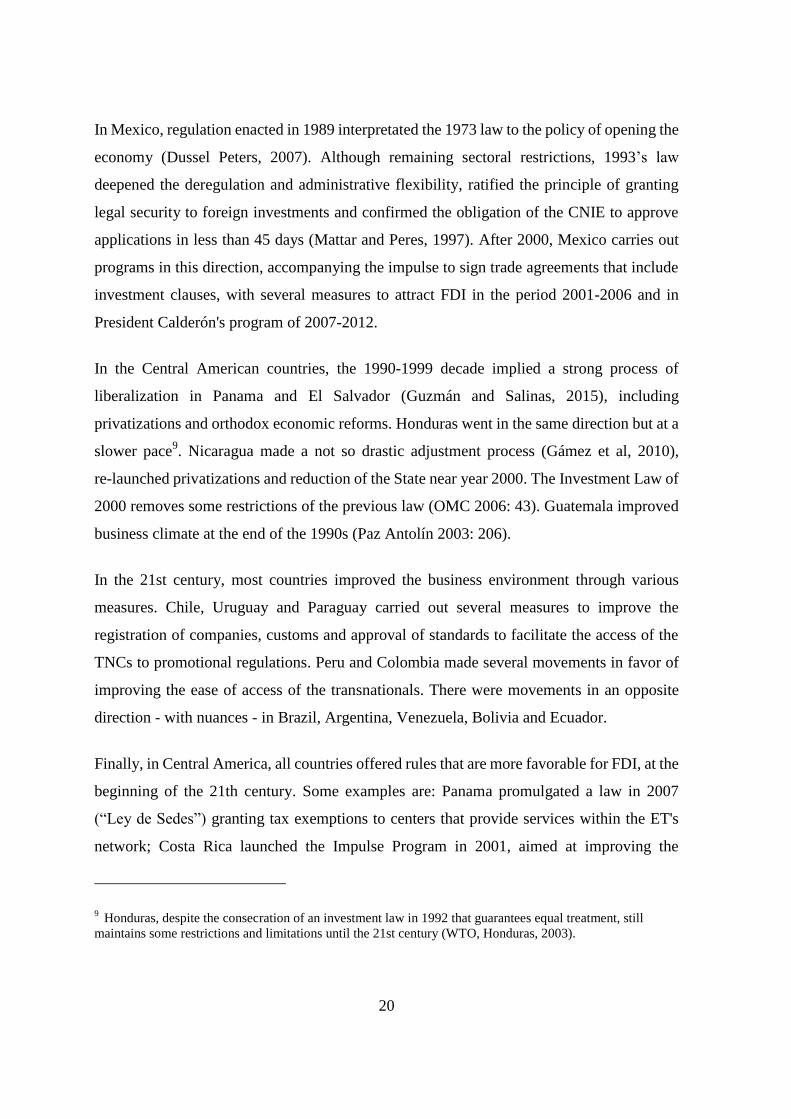
In Mexico, regulation enacted in 1989 interpretated the 1973 law to the policy of opening the
economy (Dussel Peters, 2007). Although remaining sectoral restrictions, 1993’s law
deepened the deregulation and administrative flexibility, ratified the principle of granting
legal security to foreign investments and confirmed the obligation of the CNIE to approve
applications in less than 45 days (Mattar and Peres, 1997). After 2000, Mexico carries out
programs in this direction, accompanying the impulse to sign trade agreements that include
investment clauses, with several measures to attract FDI in the period 2001-2006 and in
President Calderón's program of 2007-2012.
In the Central American countries, the 1990-1999 decade implied a strong process of
liberalization in Panama and El Salvador (Guzmán and Salinas, 2015), including
privatizations and orthodox economic reforms. Honduras went in the same direction but at a
slower pace9. Nicaragua made a not so drastic adjustment process (Gámez et al, 2010),
re-launched privatizations and reduction of the State near year 2000. The Investment Law of
2000 removes some restrictions of the previous law (OMC 2006: 43). Guatemala improved
business climate at the end of the 1990s (Paz Antolín 2003: 206).
In the 21st century, most countries improved the business environment through various
measures. Chile, Uruguay and Paraguay carried out several measures to improve the
registration of companies, customs and approval of standards to facilitate the access of the
TNCs to promotional regulations. Peru and Colombia made several movements in favor of
improving the ease of access of the transnationals. There were movements in an opposite
direction - with nuances - in Brazil, Argentina, Venezuela, Bolivia and Ecuador.
Finally, in Central America, all countries offered rules that are more favorable for FDI, at the
beginning of the 21th century. Some examples are: Panama promulgated a law in 2007
(“Ley de Sedes”) granting tax exemptions to centers that provide services within the ET's
network; Costa Rica launched the Impulse Program in 2001, aimed at improving the
9 Honduras, despite the consecration of an investment law in 1992 that guarantees equal treatment, still
maintains some restrictions and limitations until the 21st century (WTO, Honduras, 2003).

21
business climate, promulgated a Competition Law and promoted public works concessions.
Guatemala, Honduras, El Salvador and Nicaragua have made progress in their business
climate according to their respective US State Department, Investment Climate Statements
(USSD-ICS, 2015, for each country).
3.3.2 Privatizations (PRI)
In this section and in the next two, I summarize three types of incentives widely applied in
the period (especially after 1990) among Latin American countries, with specific orientation
for the attraction of FDI through incentives: Privatizations (PRI, Table 5), Free Zones or
Export Processing Zones (EPZ, Table 6) and sectorial policies in activities where TNCs are
dominant (SEC, Table 7).
Table 5. Privatizations (PRI)
1984-89 1991-99 2004-15 Total
Argentina 0 1 0 1
Bolivia 0 1 0 1
Brasil 0 1 0 1
Chile 1 0 0 1
Colombia 0 1 0 1
Costa Rica 1 0 0 1
Ecuador 0 1 0 1
El Salvador 0 1 0 1
Guatemala 1 1 0 2
Honduras 0 0 0 0
México 1 1 0 2
Nicaragua 0 1 0 1
Panamá 0 1 0 1
Paraguay 0 0 0 0
Perú 0 1 0 1
Uruguay 0 0 0 0
Venezuela 0 1 0 1
Total general 4 12 0 16
General Pinochet in Chile privatized a wide range of companies during the 1980s (and
previously) being the vanguard in these measures, although he maintained a dominant public
presence in copper mining. The Government of President Arias in Costa Rica privatized
telephony in 1988, acquired by Millicom. Since then, privatization policies have
22
encountered strong resistance: telephony returned to the public sector in 1995 (Segura, 2005;
21). Guatemala privatized Aviateca in 1988 (UNCTAD, 2011: 5). Mexico had important
deregulation policies in the 1980s, for example, 85% of public enterprises were privatized
between 1982 and 1992 (Alonso, Carrillo and Mortimore, 1998).
Several countries carried out massive privatizations after 1990, which implied that the state
abandoned industrial activities and most of services, from telecommunications to electricity;
standing out cases were those of Argentina, Brazil, Peru, Bolivia and Mexico. The
privatizations carried out by Ecuador (telecommunications, electricity, oil derivatives and
port management), Venezuela (Telecommunications, some electricity companies, a steel
company and a mining company), Panama (Ports, Telecommunications and Casinos) were
also important, although limited to some sectors. Colombia privatized energy and mining in
1995 (Estache and Trujillo, 2004, present a good summary of the privatization process in the
1990s). On the other hand, in Paraguay, Uruguay, Costa Rica and Honduras privatizations
were irrelevant or practically nonexistent.
Regarding the smaller Central American countries, Guatemala privatized power
distribution, telephone services, and grain storage, an important number of state-owned
asset, in the late 1990s (USDS ICS 2015). The process of privatization of El Salvador began
in 1989 and finished during the nineties, including banking system, telecommunications,
part of the electricity sector, and pensions. In the 1990s decade Nicaraguan sold state-owned
telecommunications and electricity generation and distribution companies10
(USSD-ICS
Nicaragua 2008). Honduras seems to be an exception, without a relevant privatization
process.
3.3.3 Export Processing Zones (EPZ)
Latin American countries applied very frequently a second type of incentives: the Free Trade
Zones or Export Processing Zones, defined as geographical areas where extensive tax
10 “Over the past 15 years, Nicaragua has privatized more than 350 state enterprises.” (USSD-ICS Nicaragua
2008)

23
exemptions and customs extraterritoriality apply, aimed especially at attracting foreign
capital to develop new export activities and new employments. I do not include Free Zones
producing for the internal market.
Table 6.
Export Processing Zones (EPZ)
1984-89 1991-99 2004-15
Total
general
Argentina 0 0 0 0
Bolivia 0 0 0 0
Brasil 0 0 0 0
Chile 0 0 0 0
Colombia 1 1 1 3
Costa Rica 1 1 1 3
Ecuador 0 0 0 0
El Salvador 0 1 1 2
Guatemala 0 1 1 2
Honduras 1 1 1 3
México 1 1 1 3
Nicaragua 0 1 1 2
Panamá 0 1 1 2
Paraguay 0 0 1 1
Perú 0 1 0 1
Uruguay 1 0 1 2
Venezuela 0 0 0 0
Total general 5 9 10 24
Traditionally, including the 1980s and 1990s, Argentina, Chile and Brazil used this type of
regimes as a mechanism of territorial development in areas with relative lag. Paraguay, with
its legislation on Maquilas in 1997, and Uruguay, had regimes of this type, but as they were
left out of trade liberalization within Mercosur, they were not successful in attracting FDI
oriented to the export of manufactured goods, and they were not relevant before 2000, to
attract foreign capital in other economic activities. Peru and Bolivia generated several zones
of this type in the 1990s, while Ecuador, Colombia and Venezuela did so to a lesser degree.
These mechanisms were more relevant in the case of the Central American countries,
including Mexico, where the “maquiladora” regime in force since the second half of the
1960s played a very significant role in attracting FDI from this country in subsequent
decades. After 2000, in addition to continuing with the use of its “maquiladora” system,

24
Mexico grants a series of incentives in a score of states, including in its promotion laws,
development plans and, in several cases, in explicit policies towards attracting FDI (Giglo,
2007).
“Zonas Francas” was the main regime in the case of Costa Rica, oriented to high technology
sectors and including complementary programs (such as “Costa Rica Provee”) aimed at
attracting networks of suppliers. Panama’s government created the EPZ regime in 1992
and impulse the City of Knowledge since 1998, several zones for the provision of services
related to logistics near the canal, and Panama Pacific Special Economic Area since 2004.
Other countries of Central America finished generalizing the use of these regimes in the last
stage 2004-2015. El Salvador created its Free Zones regime in 1986, and expanded it in 1998
and in 2013, seeking to diversify the production of those zones until the moment
concentrated in textiles. Nicaragua defined the legal body for the “maquila” industry in 1991
and updated in 2015. Guatemala started a “maquila” regime in 1984 and consolidated it in
1989, with a law for Promotion and Development of Export Activity and another for Free
Zones (Paz Antolín, 2003: 247).
In the Andean Pact only Colombia applied, since 2001, a regime of Special Economic
Export Zones, which together with the new Free Trade Zone regulations approved in 2005,
extend benefits, including admitting the possibility of a special free zone assigned to a single
company.
3.3.4 Sectorial incentives (SEC)
The detailed consideration of all the sectoral policies applied in the period by these countries
greatly exceeds the limits of this study. Therefore, I will mention those regimes that were
relevant within the set of policies aimed at the treatment of FDI.
Table 7. Sectorial incentives SEC
1984-89 1991-99 2004-15
Total
general
Argentina 0 1 1 2
Bolivia 0 0 0 0
Brasil 1 1 1 3
Chile 0 1 0 1
Colombia 0 0 1 1

25
Costa Rica 0 1 1 2
Ecuador 0 1 1 2
El Salvador 1 0 1 2
Guatemala 1 0 1 2
Honduras 0 0 1 1
México 1 1 0 2
Nicaragua 1 1 1 3
Panamá 0 0 0 0
Paraguay 0 1 0 1
Perú 1 0 0 1
Uruguay 0 1 1 2
Venezuela 1 1 0 2
Total general 7 10 10 27
Brazil was the case of greater continuity in the implementation of sectoral policies to modify
its productive structure with the help of subsidiaries of TNC. According to Guimarães et al
(2018), this was the case during import substitution until the late 1980s. In 1988 a New
Industrial Policy was established, left aside in the Collor’s government in 1990-1992. In the
1990s, the opening and liberalization of sectors were experienced simultaneity with some
active policies of productive development. Constitutional amendment of 1995 allowed
private and national private capital access to hydrocarbon activities, culminating Petrobras'
monopoly in 1997, exposing Petrobras to the competition and at the same time respecting its
power (Campodónico, 2004). Government also eliminated restrictions on foreign capital in
the mining sector, but with not great FDI income. According to Bonelli and Veiga (2004), in
the 90s no other industrial sector had explicit policy with such extensive incentives as the
automotive. After 2000, the Governments of PT deepened its line of sectoral policies11
, with
the Innovar-auto program within the “Plan Brasil Maior”, as well as a wide range of sectoral
programs aimed at attracting FDI, among others: semiconductors, digital TV, shipyards,
infrastructure, ICTs, oil and gas and aeronautics.
11 Ferraz et al 2014, summarize the main programs: “PITCE – Política Industrial, Tecnológica e de Comércio
Exterior (2004–07), when the institutional basis was reformed and modernized; y PDP – Política de
Desenvolvimento Produtivo (2008–10), aimed at fostering investment (which was quite functional in the face
of the international financial crisis; and y PBM – Plano Brasil Maior (2011–14), focused on the aggregation of
value through innovation.”

26
Mexico is the other great country in which sectoral policies established the framework in
which the TNs forged the industrial structure from the ISI until the opening. Bielchowsky &
Stumpo (1995: 160) point out that the industrial policy for different sectors -automotive,
petrochemical, computers, maquilas- still with control of imports, supported the industrial
transformation. According to Abelenda et al. (2011), after the commercial opening process
was completed in the 1990s, instruments were implemented to support production chains, in
sectors such as automotive, electronics, biotechnology, information technology and
aerospace, sometimes within regional plans (for example, the electronic cluster in
Chihuahua). The border industrialization program (export assembly industry, IME) was
born out of the need to implement an employment program for US deportees, officially
approved in 1965. In 1983, a new decree allowed the installation of the maquiladora plants in
almost all the Mexican territory. However, the political change of the 2000s implied the
abandonment of sectoral policies in Mexico: Giglo (2007) points out that it is an example of
a policy to promote FDI that does not focus on the sector. The absence of Industrial Policy is
one of the main problems of Mexican development strategy (see Ros 2015).
In spite of the general liberal sense and therefore with expectations of "neutrality", of the
prevailing policies in the Southern Cone, in these countries there were important sectorial
bets since the 1990s, as observed by Peres (2006). Argentina promoted at least three sectors
with strong incentives for investment, particularly foreign investment. Petroleum after the
privatization of YPF and subsequent acquisition by REPSOL; mining, with a law of 1993
granting contracts for 30 years and very favorable conditions in fiscal matters and legal
stability; and the automotive policy, which protected this industry from the liberalization of
Mercosur by offering tariff and tariff protection conditions, subject to certain conditions.
Chile highlighted three sectors: mining where CODELCO the state company occupied a
very significant place but the last decade’s opening promoted a large participation of TNC;
forest-cellulose, where subsidies and other instruments applied since the 70s, promoted the
formation of a large consolidated export sector in the 1990s; and financial services. In the
1990s, Paraguay and Uruguay had automotive and forestry regimes. In the Uruguayan case,
the promotion of investment in tourism in this decade was also significant. In the most recent
period, Argentina and Uruguay grant fiscal benefits (and some subsidies) to promote

27
investment, production, innovation and competitiveness in several sectors with expectations
of attracting FDI, therefore the variable is worth 1.
In the Andean Pact during the 1980s, only Peru and Venezuela remain attached to the
industrializing policy that advocated the framework of the Andean Pact. Once liberalization
entered after 1990, Peru, Bolivia and after Colombia, regulated the privatized sectors, that
were sectorial policies that do not enter in the class here exposed. Venezuela, as indicated by
its government in his report to the WTO (1996), tried to "encourage important national and
foreign private investments in 'leading activity groups'", redesigning policies in the oil, other
extractive industries, basic industries and tourism sectors. Finally, Ecuador was perhaps the
country among those of the Andean Pact that proposed more sectoral incentives, looking for
the entry of companies in hydrocarbons and petrochemicals, and also in mining, incentives
that did not promote FDI income due to lack of legal security. UNCTAD (2002).
In the last period 2004-2015, only Colombia and Ecuador show relevant sectoral incentives
for FDI. Colombia created the National Hydrocarbons Agency (ANH) in 2004, in charge of
regulating the sector (Garavito et al, 2010), and established sectoral policies in the form of
broad tax exemptions in several activities. Ecuador in the Presidency of Correa, the axes of
the development plans postulated since 2007 for the productive transformation of Ecuador
identified 14 priority productive sectors and 5 strategic sectors, considering a role of FDI
complementary to national investment in sectoral promotion (SENPLADES , 2012, cited in
López et al., 2015).
In Central America, Costa Rica allows better conditions for companies that belong to
strategic sectors within its Free Trade Zone regime, among which are those of high
technology, such as electronics, computers, pharmaceuticals or scientific-technological
research. “Costa Rica Provee” promoted value chains, since the middle of 1990s decade,
attracting suppliers from companies in those sectors. Government highlighted a clear
orientation of its FDI policy towards high technology sectors, among them pharmaceutical
and electronic, with interesting instruments, such as the CAATEC created in 2001.
Honduras initiated several new programs, while Guatemala, El Salvador and Nicaragua
resumed sectoral initiatives are that were present in the 1980s.

28
3.3.5 Investment Promotion Agencies (IPA)
In the countries surveyed, there are few cases of agencies with the specific and exclusive
tasks of promoting and monitoring foreign investments, that is, those known in the world as
Investment Promotion Agencies (IPAs). Table 8 shows what I think the cases of IPA in these
countries are.
Table 8. Investment Promotion Agencies (IPA)
1984-89 1991-99 2004-15
Total
general
Argentina 0 0 0 0
Bolivia 0 0 0 0
Brasil 0 0 0 0
Chile 1 1 1 3
Colombia 0 1 0 1
Costa Rica 1 1 1 3
Ecuador 0 0 0 0
El Salvador 0 0 0 0
Guatemala 0 0 0 0
Honduras 1 0 0 1
México 0 0 1 1
Nicaragua 0 0 1 1
Panamá 0 0 0 0
Paraguay 0 0 0 0
Perú 0 0 0 0
Uruguay 0 0 0 0
Venezuela 0 0 0 0
Total general 3 3 4 10
In South America two exceptional cases can be considered: Colombia in the 1990s and Chile
throughout the period. The Corporation Investing in Colombia (COINVERTIR), created in
1992 as a parastatal entity with public-private participation, operated with a small volume of
resources until 2002, and Proexport absorbed it in 2004. Chile created its Committee on
Foreign Investments in 1954, which gradually assumed the powers of IPA, administering
Decree Law 600 since 1974. After 2000, CIE took on more actively the FDI promotion
tasks, with an important effort to collect, generate and disseminate information about the
country that is relevant for foreign investors (ECLAC, 2007). For this, its budget and
personnel was located for the year 2007 among the most outstanding in Latin America.

29
Costa Rica presented the clearest case of IPA in the sample. The Costa Rican Coalition of
Development Initiatives (CINDE), a private agency founded in 1984, declared of national
interest in the 1990s, has a strong articulation with PROCOMER, public entity that manages,
among others, the Free Trade Zone and Maquiladora (legally called Active Improvement)
regimes. CINDE effectively assumed the functions of FDI promotion and after-care of
investors (Cormick et al, 2014)
Despite the crucial importance of FDI in the development of Mexico during the 1990s,
federal government did not have a solid and defined structure for the promotion of foreign
investment. ProMexico, created after 2007, supported the export activity and the attraction
of FDI. This agency designed a strategic plan that gave consistency to the IED promotion
policy (Vázquez, 2011). Another agency with well-established functions and interesting
resources is ProNicaragua, created in 2002. The objective of this entity is to direct, through
cooperation between the public and private sectors, the establishment of a national
promotion system capable of attracting significant direct investments from international
firms (WTO, 2006). Honduras, El Salvador and Guatemala have agencies to promote FDI.
These agencies combine FDI with export promotion, and they have limited size and
resources.
In general, South American countries did not have defined institutions (such as Brazil,
Paraguay, Peru, Ecuador, Venezuela, and Panama), or they defined the formation of
agencies that reached a small dimension (such as Argentina Invert-Ar Foundation in 1993)
and / or with such tasks that the promotion of exports tends to predominate. These are the
cases of Uruguay XXI created in 1996 and Center for the Promotion of Bolivia
(CEPROBOL) created in 1998 (and closed a decade later).
In the course of the 21st century almost all the countries created agencies that include among
their tasks the promotion of FDI, but very few of these agencies fulfilled the activities that
were very useful in successful cases such as those in Ireland or Singapore. Peru created an
agency very concentrated in administering privatizations and concessions of public works.
Panama and Ecuador created agencies at the end of the period. PRO ECUADOR, Institute of
Promotion of Exports and Investments of the Ministry of Foreign Trade, was created in
2010, with an investment area that provides specialized advice to companies interested in
30
investing in the country. Panama also created in 2010 PROINVEX, an agency for the
attraction of Investments and promotion of Exports in Panama, as an important part of the
2010-2014 Government Strategic Plan. Rediex (Investment and Exports Network) of
Paraguay began its tasks in 2005, but acquired certain dimensions after 2008, always with
the priority placed on the promotion of exports.
Argentina created the National Agency for Investment Development in 2006, an
autonomous agency that never had much weight, until the Ministry of Commerce and
International Relations absorbed it since 2010. Brazil had agencies with the specific
objective of promoting FDI but during short lapses, since they were subject to several
restructures that altered the continuity of the functions. Finally, a private agency with the
task of promoting investments exists in Venezuela since the 1980s, but has little developed
the promotion of FDI.
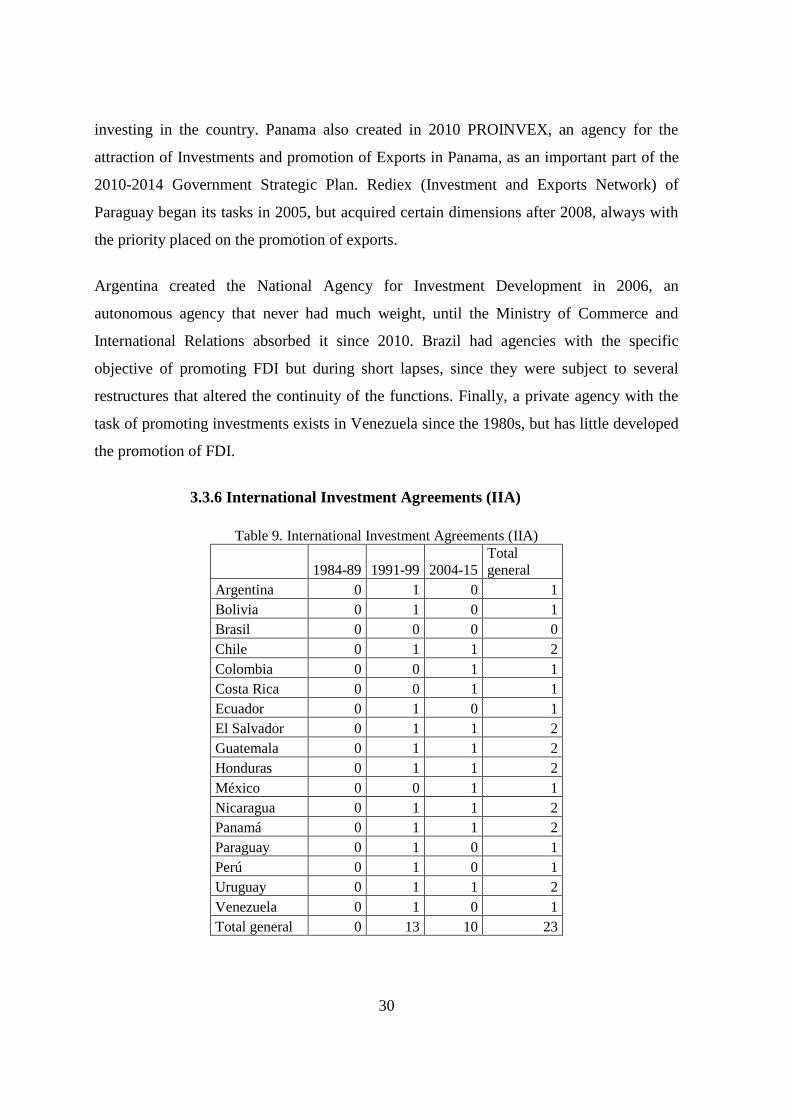
3.3.6 International Investment Agreements (IIA)
Table 9. International Investment Agreements (IIA)
1984-89 1991-99 2004-15
Total
general
Argentina 0 1 0 1
Bolivia 0 1 0 1
Brasil 0 0 0 0
Chile 0 1 1 2
Colombia 0 0 1 1
Costa Rica 0 0 1 1
Ecuador 0 1 0 1
El Salvador 0 1 1 2
Guatemala 0 1 1 2
Honduras 0 1 1 2
México 0 0 1 1
Nicaragua 0 1 1 2
Panamá 0 1 1 2
Paraguay 0 1 0 1
Perú 0 1 0 1
Uruguay 0 1 1 2
Venezuela 0 1 0 1
Total general 0 13 10 23

31
This section will emphasize the frequency with which countries use the Bilateral Investment
Treats (BITs) instrument, also known as Agreements for the Reciprocal Promotion and
Protection of Investments (APPRIs). This type of agreements had great development in the
world after 1990. It is usually included as a chapter in the Free Trade Agreements or in other
types of commercial agreements, which happened exceptionally for the Latin American
countries in 1990-1999 and more frequently after 2000, when the US signs several treaties
with Latin American countries. Table 9 show the variable IIA that takes the value 1 when the
country signed 10 or more (or ratified 9 or more signed in the period) investment protection
agreements, and cero in other case.
Some governments prioritized the management of this type of agreements within their
broader international insertion strategies. Among these: Argentina, Chile, Uruguay and Peru
put into effect 41, 25, 22 and 21 BITs respectively before 2000. Bolivia, Paraguay, Ecuador,
Venezuela and Panama signed a more limited number (maybe they were less successful or
they did not assign importance to the instrument), approving: 14, 14, 11, 15 and 10
agreements respectively. Nicaragua, Guatemala, Honduras and El Salvador were active in
signing these treaties, both in the 1990s and after 2000. The remaining countries did not
prioritize this instrument before 2000. Mexico signed only 3 ABI (plus NAFTA in 1994),
Colombia signed an agreement included in an FTA with Mexico, and Costa Rica put in vigor
only 4 BITs in the period. The extreme case is the explicit policy of Brazil against this type
of agreements.
After the year 2000, some countries showed great predisposition to sign investment
agreements: Mexico was the most active signing 26 BITs and 10 FTA, followed by Chile (12
BITs and 12 FTA) and Costa Rica (8 BITs and 10 FTA). A second group among the most
active can be made up of: Panama, which ratified 11 agreements distributed in the period,
Colombia with 9 BITs approved (plus a dozen in negotiation or signed but pending
parliamentary ratification) and Uruguay that ratified 9 agreements in the period.
The remaining countries show little guidance to use this type of instruments. Some countries
only continued some inertia from the 1990s, only signing investment agreements ratifying
the steps taken in the previous decade. Argentina ratified 9 agreements, but the last one was

32
in 2002; Paraguay ratified 7, the last one was signed in 2003, and Peru ratified only 3
agreements in the period.
Finally, among the less active countries are those that, together with Brazil, are in a critical
position regarding the IIAs: the constitutional reforms of Ecuador, Venezuela and Bolivia
forced the revision and renegotiation of the treaties signed previously, especially by the
non-acceptance of external jurisdiction and arbitration.
3.4 Summarizing FDI policies in Latin America 1980-2015
From a similar classification of policies towards FDI (Bittencourt 2016), I made a synthesis
based on instrument configurations observed in 13 Latin American countries 1990-2014.
The sum of the instruments outlined in previous sections can offer an idea about the
predominance of certain orientations in each period. It is clear that not in all cases the value
1 has the same meaning, because the magnitude of the application of a certain instrument
varies a lot between countries and between instruments. It seems convenient to observe them
in the context of historical evolution and in the articulation of regulations with promotional
policies. Table 11 summarizes the regulatory intent of each country by adding entry
restrictions (ENT), performance requirements (PER) and expropriations (EXP). The
business climate (CLI), promotion agency (IPA) and international agreements (IIA) are
added under the title of Rules-Based competition. The title Incentives-Based Competition
aggregates Privatizations (PRI), Export-processing Zones (EPZ) and Sectorial Policies
(SEC). For example, Argentina has regulations with value 1 in 1984-89 because it applies
ENT, also 1 in 1990-99 because it uses PER, and 2 in 2004-2015 because it maintains PER
and also had some confrontation with foreign capital applying EXPRO.
Table 11. Regulations, Rules-based competition and Incentives-based competition
Regulations
Rules-based competition
Incentives-based
competition
1984-
89
1991-9
9
2004-1
5
1984-8
9
1991-9
9
2004-1
5
1984-8
9
1991-9
9
2004-1
5
Argentina 1 1 2 0 2 0 0 2 1
Bolivia 0 0 2 1 2 0 0 1 0
Brasil 2 1 1 0 1 0 1 2 1
Chile 0 2 1 2 3 3 1 1 0
Colombia 1 0 0 0 2 2 1 2 2

33
Costa Rica 1 2 2 1 1 3 2 2 2
Ecuador 1 1 0 0 2 0 0 2 1
El Salvador 1 0 0 0 1 2 1 2 2
Guatemala 0 0 0 0 1 2 1 2 3
Honduras 0 0 0 1 1 2 1 1 3
México 2 1 1 0 1 3 3 3 1
Nicaragua 0 1 0 0 1 3 1 3 2
Panamá 0 0 0 0 2 2 0 2 1
Paraguay 0 0 0 0 1 1 0 1 1
Perú 1 0 0 0 2 1 1 2 0
Uruguay 0 0 0 0 2 2 1 1 2
Venezuela 1 2 2 0 1 0 1 2 0
Total 11 11 11 5 26 26 15 31 22
% /casos
posibles 0.22 0.22 0.22 0.10 0.51 0.51 0.29 0.61 0.43
The total sum of regulatory policies shows 11 cases in each period, which gives the broad
image that regulation remains constant. Actually the instruments change, in the 1980s most
were ENT (9 cases), derived from the continuity of regulatory policies in the framework of
the ISI and the regulatory boom of the early seventies. In the 1990s they are divided into
halves between ENT and PER, and in the last period were 5 ENT, 3 PER and 3 EXP. It is
important to note the absence of widely majority regulations, given that there are regulations
in only 22% of the total cases possible, only one in five observations regulates FDI.
The Policy instruments counted as Rules-Based Competition for FDI (RBC), were almost
non-existent in the 1980s, but reached half of the possible cases in the 1990s and 2000s.
Chile is the country that most applies these instruments, which is not surprising, followed by
Costa Rica and Honduras. Slightly behind are Colombia, Mexico, Nicaragua, Panama and
Uruguay. This seems to be a list of cases that, a priori, I would have mentioned as more
aligned with the "sound policies". Brazil and Venezuela, for their part, only applied one of
these instruments at the opening of the 1990s, when they tried to improve their business
climate.
Regarding the Incentives-Based Competition for FDI (IBC), there was a boom in the 1990s,
when privatizations are concentrated. A dozen countries apply two or more incentives in that
decade, which implies that they usually privatize, while they use at least other IBC
instrument. The Export Processing Zones (EPZ) developed along the whole period, with a
tendency to increase. This policy was very widespread in CA and in the smaller South
34
American countries. But it is the use of incentives for FDI in the framework of sectoral
policies (SEC), the most widespread instrument, applied fairly evenly between the decades
of the study (7, 10 and 10 cases) which implies that it is more or less half of the incentive
instruments in the 1980s and 2000s.
4. An explanation of FDI policies in Latin America1980 – 2015
using Fuzzy Sets
4.1 Method
As Ragin 2008 explains, when the number of observations is not sufficient for statistical or
econometric analysis, the Fuzzy Set QCA is an alternative method “based on the analysis of
set relations”, in a “middle path between quantitative and qualitative social research.” I use
the analysis of truth tables proposed by Ragin (2008), through its software fsQCA3.0, which
seeks to identify which combinations of instruments are consistent and which is the coverage
or scope of the explanation12
. It is important to note that I am using this type of analysis to
establish connections between variables to identify configurations, since explanatory
variables are almost not included, finding consistent combinations that say nothing about
causality.
4.2 Variables for qualitative analysis models (QCA) in the explanation of FDI
Policies
12 Consistency refers to the degree to which a subset of certain characteristics that produce a result (according
to a predefined logical connection) appears within the observed reality. Show how much reality is consistent
with the established argument. In strict sets (crispy set) where the property of the observation to the attribute is
worth 1 or 0, the consistency is the frequency with which the result Y occurs given the causes X, with respect to
all the cases where the causes X occur. If in the sample the frequency is 1, whenever the causes occur the result
occurs, if we wanted to observe a causal relationship between X and Y, then the X are sufficient causes to
produce the result Y. In Fuzzy Sets it will be more difficult than the frequency add 1, therefore Ragin 2008
suggests to consider as consistent all the cases superior to 0.75. Once verified the consistency, the analysis
needs to observe the coverage of the established consistent relationships, which measures the empirical
relevance that this consistent subset has in the occurrence of Y within the sample. It is the frequency of that
subset X and Y within the cases where Y occurs. X may be sufficient cause of Y but only explaining a low
percentage of the Y cases. With crisp sets the frequency is the sum of 1s, so it is the exact number of cases. In
Fuzzy Sets it is a sum of numbers less than one, so the total values are less than the frequency of the cases with
membership over the crossover value.

35
The negotiation scheme proposed by Dunning and Lundan suggests some variables that may
explain the occurrence of regulatory or promotional policies, related to the attraction
capacity of FDI and the supply of investments for the country. The theoretical model
(section d2) suggests some variables that could influence the definition of policies,
characteristics of the economy and society, as well as government preferences. Therefore,
the empirical investigation of the factors that determine the policies towards FDI in LA will
follow the following form, where F represents more logical connections than a mathematical
function:
POLit = F (FDI DETERMINANTS, FDI STOCKS, GOVERNMENT PREFERENCES)
VARIABLE TO EXPLAIN
POL: the different policies towards FDI applied by each country of LA (i) in the selected
periods (t): 1980s, 1990s and the 21st century. The questions, therefore, would be: ¿What
characteristics of the countries in each period are associated with promotional policies
(RBC: business climate, signing of international agreements, installation of specific
agencies; or IBC: sectoral, privatizations, EPZs) or restrictive policies (restrictions on entry,
performance requirements and expropriation)?
EXPLANATORY VARIABLES
DETERMINANTS OF FDI. In previous works we have used econometric models to study
the determinants of FDI with panels (Bittencourt and Domingo, 2004) and with bilateral data
(gravity-type models in Bittencourt (coord.), 2012, and Bittencourt, Domingo and Reig,
2006). To think about how FDI policies emerge, the idea suggested by Dunning's scheme is
that the more capacity to attract FDI, the more likely it is to have regulatory policies and the
less need for promotional policies. These variables will include the classical variables that
determine horizontal or market-oriented FDI: size, macro stability, trade protection; as well
as those usually associated with open / vertical or resource-oriented forms, such as relative
salary (skilled and non-skilled labor force), natural resources, and trade openness. Political
risk is an important determinant in both FDI types. Political Risk Index (PRI-ICRG)

36
contains more structural (institutional) indicators13
than the political orientation of the
current government. For size I use GDP in 2010 US$ and for stability I use average inflation
rate of the period. As variables for vertical FDI determinants I use exports over GDP, and
proportion of mining and petroleum exports in total good exports. For human capital I use
the Years of Schooling in population over 25 years old, from Barro and Lee database. Main
sources: World Development Indicators of the World Bank, UNCTAD and OECD for FDI,
International Country Risk Guide (ICRG) from PRS Group, acquired by the group TyDE for
1984-2016.
ACCUMULATED FDI AND DIVERSIFICATION OF FDI ENTRANCE. This is an
important dimension in the Dunning and Lundan´s framework. Various studies on
determinants of FDI show that there is path dependence. To think about the relative power of
TNCs vis-à-vis governments, more accumulated FDI previously gives more power to the
host country, so it should be a positive effect on regulatory policies or a negative effect on
promotional policies. Asiedu and Eshafani (2008) point out that the presence of TNCs may
be generating "lobbying" activity that drives the preference of the government in favor of
these companies, therefore the effect of previously accumulated FDI on regulatory policies
may be theoretically ambiguous, to be determined empirically. However, the diversification
of origins of FDI can break: there is no doubt that more diversification implies more
government power, therefore more regulatory potential and less need for incentives.
Sources: UNCTAD Stock of total FDI in each country and Bilateral FDI OECD Database.
CALIBRATION. I calibrated all the quantitative variables according to Ragin (2008,
Chapter 5). The first step is defining three thresholds: a crossover point that corresponds to
the 0.5 in the range 0-1, a point of full pertinence to the attribute that implies more than 0.95
in the 0-1 space, and a point of full non-membership bellow which the case is totally out of
the attribute. The selection of these three points is not trivial, and they are determinant of the
results, as much as it is to assign values 0 or 1 for the FDI Policies, or for the political
13 It sums 100 in the maximum, which means no risk, in the following dimensions: Government Stability12,
Socioeconomic Conditions 12, Investment Profile 12, Internal Conflict 12, External Conflict 12, Corruption 6,
Military in Politics 6, Religious Tensions 6, Law and Order 6, Ethnic Tensions 6, Democratic Accountability 6,
Bureaucracy Quality 4.

37
orientation. Second, using the distance between this three points in the variable range, Ragin
propose an algorithm to translate it to a range of 5 to -5. Finally this transformation is
expressed in the 0-1 space through the equation Var0-1= exp(var5,-5)/(1+exp(var5,-5)).
Variable name Bigsize Inf No-risk FDIori openX Xmin Educ
Original
variable
First year (FY)
or Simple
average of the
period (SA)
GDP
(2010
US$
million)
FY
Infla-
tion
%
SA
Political
Risk
Index
(PRI) SA
Number
country
origins
of FDI
FY
%
Exports
goods
over
GDP
FY
% Mining&
petroleum
exports/tota
l good
exports
FY
Years of
schooling in
population
25-60 years
old
SA
Source WDI WDI PRS
Group
OECD
Bilateral
FDI
database
WDI WDI Barro and
Lee 2016
database
Crossover
threshold 300.000 200 65 20 35 60 9
Full
membership 700.000 50 75 10 18 30 7
Full non-
membership 10.000 5 55 4 10 10 4.5
GOVERNMENT PREFERENCES. The dimension that interests is the political orientation
of the governments. In particular, which type of instrument configurations are consistent
with leftist or center/right governments. Then, I define two variables: L1 that is worth 1
when there is at least one leftist government within the considered sub-period and Lmay is 1
when the left governs for most of the period clearly (until 6 years LEFT and 4 NO LEFT is
considered L1, 7 of 10 years Left is LMay).
4.3 Main results
The configurations presented in this section are those that passed the consistency threshold
of 0.8 or some very close (always over 0.75) considered of interest. Tables 12 to 15
summarize the analysis of a large number of configurations, based on the broad Dunning’s
theoretical framework, previous knowledge, and the descriptive observation of the data. The
variables to explain are those expressing FDI Policies synthetically. A first variable pretends
to take account of regulations (REG1), which indicates if the country applied any regulatory
policy in the period. A second variable intends to represent if the country looks to attract FDI
through the change of rules, that is, if it applies any of the policies that I previously grouped
as rules based competition (RBC1). A third variable takes the value 1 when the country

38
appears as competing to attract FDI using at least one incentive (IBC1). Last, I observe the
combination of applying some regulation and incentives, in particular sectorial policies and
performance requirements.
4.3.1 Regulations
Table 12. EXPLAINING FDI REGULATION WITH FSQCA
BEST SOLUTIONS SELECTED BY TRUTH TABLE ANALYSIS
MODEL SOLUTION Con
siste
ncy
Cov
erag
e
Cases with greater than
0.5 membership in
condition and output
Cases
member
ship in
conditio
n not
output
Tot
al
cas
es
1. REG = f(L1,
bigsize, no-risk)
bigsize*no-risk 0.84 0.25 Mex00, Mex90, Bra00,
Bra90, Bra80, Arg00
6
2. REG = f(bigsize,
no-risk, inf, fdiori)
bigsize*no-risk*fdiori 0.85 0.24 Mex00, Mex90, Bra00,
Bra90, Bra80, Arg00
6
3. REG = f(L1,
Xmin, no-risk)
Xmin*no-risk 0.82 0.22 Chi00, Chi90, Mex90,
Ven80, Ven90
5
4. ~REG = f(L1,
bigsize, no-risk,
Xmin, fdiori)
~L1*~bigsize*~Xmin*
~fdiori OR
0.74 0.45 Gua80, Hon80, Pan80,
Par80, Uru80, ElS90,
Gua90, Hon90, Pan90,
Uru90, Hon00, Par90,
Pan00
ElS80,
Nic90,
Col80,
Arg80,
Arg90
18
OR
~L1*~bigsize*~no-risk
*~fdiori
0.73 0.43 Gua80, Hon80, Pan80,
Par80, Hon90, Gua90,
Pan90, Uru80, Hon00,
Chi80, Bol80
Nic90,
ElS80,
Col80,
Arg80
15
Joint solution 0.74 0.51 REG1: REGULATIONS (REG1=1 IF ENT, PER OR EXPRO =1; REG1=0 IF ENT=PER=EXPRO=0)
Model 1 and 3 shows that there is no consistent association between Left and regulation,
given that L1 does not appear in the solutions. Models 1 and 2 solutions show that big size,
low political risk and diversified FDI incomes, explain sufficiently the occurrence of
regulations. This is the idea suggested by the cited Dunning´s bargaining framework. In
these solutions, the six “bigger” countries in the region during this period appear. Every case
that complies that combination of attributes (a configuration), also complies the output, so
the consistency is perfect. The coverage is low: these big countries explain a fourth of the
whole regulation cases. Model 3 emphasizes the vertical FDI attraction, and shows that, in
any political orientation, countries with mining and petroleum exports (and low political

39
risk) also apply regulations to FDI. They explain another fifth of the regulation in the period,
closing the consistent explanations. Therefore, the models can explain less than a half of the
regulations. One must be aware that the method found two sufficient causes: in the context
of this sample every “big” country14
and every country combining mineral exports15
and
low political risk16
, apply at least one FDI policy regulation.
Explaining the non-regulation situations (~REG) may offer another way to observe the
negotiating hypothesis. The complex solution for model 4 shows that a major proportion of
little countries with center o right governments (~L1 means negated L1) and concentrated
origins for FDI17
explain consistently a half of the non-regulation cases. This appears in two
variants: high risk or no mineral exports (most cases complying both characteristics).
4.3.2 Rules-Based Competition for FDI
Rules-Based Competition for FDI implies at least one of the following policies: improving
general business climate (CLI) looking for a more attractive environment, or the more
specific activities of signing international investment protection agreements (IIAs) or
implementing a promotion agency (IPA). These policies reduce direct costs for TNCs (for
example by more efficient public services or less real wages) and attempt to reduce indirect
costs, through improving credibility.
It seems that center or right governments usually applied this type of competition for FDI.
Model 8 shows that negated majority Left (~LMAY) enters in every component of the
complex solution. But taking into account the presence of Leftist Governments for shorter
sub-periods (L1, in model 7) the complex solution is different, there is a solution including
one observation with L1 (option 7.5 found that Nicaragua in 2000s competed by rules with
the IPA ProNicaragua) and the 7.1 option that includes several cases of L1.
14 With a GDP over 300.000 million of 2010 US$ at the beginning of the period (1985, 1990 and 2004)
15 Exports of mining and petroleum over 30% of the total export of goods at the beginning of the period.
16 Political Risk Index (PRI) from the PRS International Country Risk Guide (ICRG) over 65 in the simple
average of the period. 17
Less than four bilateral positive FDI flows at the beginning of the period, means investors coming from a
very limited set of origins.

40
Table 13. EXPLAINING RULES-BASED COMPETITION FOR FDI (RBC) USING FSQCA
BEST SOLUTIONS SELECTED BY TRUTH TABLE ANALYSIS
MODEL SOLUTION Con
siste
ncy
Cov
erag
e
Cases with greater than 0.5
membership in condition and
output
Tot
ca-
ses
7. RBC = f(L1,
bigsize, no-risk,
inf, openX,
fdiori)
7.1~bigsize*no-risk*~inf*open
X
0.84 0.25 Cos00, Chi00, Chi90, Uru00,
ElS00, Cos90,Ven90, Uru90
Ven80 not output
9
7.2 ~L1*~bigsize*~fdiori
*no-risk*~openX
0.87 0.12 ElS90, Arg90, Pan00, Par90 4
7.3 ~L1*~bigsize*~fdiori
*~inf*openX
0.81 0.13 Hon90, Chi80, Hon80,
Uru90
4
7.4 ~L1*bigsize*no-risk*
~inf*fdiori
0.84 0.08 Mex00, Mex90
2
7.5 L1*~bigsize*~no-risk*
~inf*~openX*~fdiori
0.78 0.11 Nic00
1
Joint solution 0.84 0.47 Complying conditions and
output 18
8. RBC =
f(LMAY,
bigsize, no-risk,
inf, openX,
fdiori)
8.1~LMAY*~bigsize*no-risk*
~openX*~fdiori
0.9 0.17 ElS90, Arg90, Pan00, Par90
4
8.2 ~LMAY*~bigsize*~inf*
openX*~fdiori
0.88 0.22 Hon90, Gua00, ElS00,
Chi80, Par00, Hon80,
Cos90, Bol90, Uru90 9
8.3 ~LMAY*~bigsize*
~no-risk*~inf*~openX*fdiori
0.8 0.1 Col00, Ecu80, Col90
3
8.4 ~LMAY*~bigsize*
no-risk*~inf*openX
0.92 0.14 Chi90, ElS00, Cos90,
Ven90, Uru90 5
8.5 ~LMAY*bigsize*
no-risk*~inf*fdiori
0.86 0.09 Mex00, Mex90
2
Joint solution
0.87 0.39 Complying conditions and
output 22 RBC1: RULES BASED COMPETITION FOR FDI (RBC1=1 IF CLI, IPA OR AII=1, =0 IF CLI=IPA=AII=0)
Model 7 shows a complex solution compound by 5 options that make up disjoint sets, there
is only one repeated case between two sets (Uruguay in the 1990s belongs to 7.1 and 7.3
solutions). Little size appears in almost all solutions. These are observations with less than
the GDP threshold, including some cases not usually called as small countries. Subset 7.1
implies that little size, combined with low political risk, macro stability represented by the

41
non-existence of episodes of hyperinflation18
, and export openness19
is the solution with the
best coverage, so this subset is the best sufficient cause of RBC. Solutions 7.2 and 7.3
combines no left oriented governments with little size and concentrated origins of FDI, and
low political risk (7.2) or high macro stability (7.3), that are more or less of the same sign.
Both solutions differs with respect to openness, 7.2 includes more closed good’s exporters
than solution 7.3. Trying to summarize (fsQCA 3.0 did not provide a parsimonious solution)
one can say that the common factors in the solutions are small size, concentrated FDI,
openness, low risk and stability, although some cases in the solutions show high risk,
instability and low exports to GDP’s proportion.
The solutions “Mexico alone” (7.4 and 8.5) are the exceptions, and they combine big size
and center or right government, with low risk, macro stability, and diversified origins of
FDI.
4.3.3 Incentives-Based Competition for FDI
IBC is the application of one of the policy instruments that affect FDI through giving
specific benefits, mostly in the form of direct subsidies or fiscal exonerations. In this paper I
emphasize three policies: Privatizations (PRI), Export Processing Zones (EPZ) and Sectorial
Productive Policies (SEC) in economic activities where ETNs are dominant or protagonist.
In this section, I will apply the method to analyze the “causes” of the variable IBC and each
one of its components.
I could not find a good summarizing expression for the solutions of models trying to explain
IBC. The best one, looking at the joint consistency and coverage, is formed by the union of 9
alternatives sets, in table 14.
18Countries that had annual inflation average of the period less than 50%. All the countries suffering
hyperinflation processes in some sub-period had an average annual inflation over 200%. I fixed the threshold
for full membership in the non-inflation club at an annual average of 5%. 19
Export of goods more than 18% of GDP at the beginning of the period, which is the arithmetic mean of the
sample.

42
Table 14. EXPLAINING INCENTIVES-BASED COMPETITION FOR FDI (IBC) USING FSQCA
BEST SOLUTIONS SELECTED BY TRUTH TABLE ANALYSIS
MODEL SOLUTION Consi
stency
Cov
erag
e
Cases with greater than 0.5
membership in condition
and output
Tot
case
s
9. IBC = f(L1,
fdiori, bigsize,
no-risk,
openX)
9.1 fdiori*bigsize*no-risk 0.92 0.15 Mex00, Mex90, Bra00,
Bra90, Bra80, Arg00
6
9.2 fdiori*~bigsize*~no-risk
*~openX
0.81 0.16 Per90, Ecu80, Col00,
Col90, Ecu90
5
9.3 ~fdiori*~bigsize*no-risk
*openX
0.88 0.17 Cos00, Uru00, ElS00,
Cos90, Ven80, Uru90
6
9.4 ~L1*~fdiori*~bigsize
*no-risk
0.93 0.11 ElS90, Arg90, Uru90,
Pan00, Par90
5
9.5 ~L1*~fdiori*~bigsize
*openX
0.92 0.14 Hon90, Chi80, Hon80,
Uru80, ElS80, Uru90
6
9.6 ~L1*~bigsize*no-risk
*openX
0.94 0.06 Ven90, Uru90 2
9.7 ~L1*fdiori*no-risk*openX 0.95 0.06 Mex00, Ven90 2
9.8 L1*~bigsize*~no-risk*
~openX
0.88 0.13 Nic80, Nic00, Ecu90 3
9.9 L1*fdiori*~bigsize*
~no-risk
0.82 0.1 Per80, Ecu00, Ecu90 3
Joint solution 0.9 0.56 31
10. PRI =
f(LMAY,
fdiori, bigsize,
no-risk,
openX, 1990s)
~LMAY*~bigsize*~no-risk*~o
penX*1990s
0.81 0.28 Per90, Pan90, Nic90,
Gua90, Col90 5
~LMAY*fdiori*bigsize*no-risk
*~openX*1990s
0.9 0.1 Mex90, Bra90
2
Joint solution 0.86 0.38 7
11. EPZ =
f(L1, bigsize,
openX, edu,
1980s)
~L1*~bigsize*~openX*~edu01
*~1980s
0.8 0.31 Pan90, Pan00, ElS90,
Per90, Hon00, Nic90,
Gua90, Col00, Col90,
Par90
Arg90 not complying
output 10
~L1*bigsize*openX*edu01*~1
980s
0.87 0.07 Mex00
1
Joint solution 0.81 0.35 11
12. SEC =
f(L1, bigsize,
no-risk,
openX, fdiori,
1980s)
12.1 bigsize*no-risk
*~openX*fdiori*~1980s
0.79 0.12 Mex90, Bra00, Bra90
3
12.2 ~L1*bigsize*no-risk*
~openX*fdiori
0.8 0.1 Mex90, Bra90, Bra80
3
12.3 ~bigsize*no-risk
*openX*~fdiori*~1980s
0.79 0.2 Cos00, Uru00, ElS00,
Cos90, Uru90 4
12.4 ~L1*~bigsize*no-risk
*openX*~1980s
0.85 0.07 Ven90, Uru90
2

43
12.5 L1*~bigsize*~no-risk
*openX*fdiori*1980s
0.99 0.03 Per80
1
Joint solution 0.83 0.36 11 IBC1: INCENTIVES BASES COMPETITION FOR FDI (IBC1=1 IF PRI, EPZ OR SEC=1, =0 IF
PRI=EPZ=SEC=0)
It is not possible to find political orientation as a “cause” for IBC. The solutions in the sets
9.1 to 9.3 do not include L1, solutions 9.4 to 9.7 include center or right governments, and the
last two sets (9.8 and 9.9) include L1.
Solution 9.1 shows that the big countries (that also had diversified FDI and low political risk
at the beginning of each period) applied incentives competition. The second solution (9.2) is
a set compound by Andean countries, with diversified FDI, relative small size (not the
smallest), high political risk and relative closed in exports of goods. Solution 9.3 is a group
of 6 relative small open economies with low risk and low FDI’s diversification, so trying to
enter in world FDI’s circuit by means of IBC (mainly by means of EPZs, as the Costa Rica,
El Salvador and Uruguay cases in the mentioned periods). Solutions 9.4 to 9.6 have in
common that they include relative small countries with center or right governments, most of
them (9.4 and 9.5) with concentrated origins of FDI. They combine this attributes with low
political risk (9.4) and export openness (9.5) or with both characteristics (9.6). The last two
solutions (9.8 and 9.9) are smaller and risky cases with at least one leftist government in the
respective period20
, with variations: the 9.8 set is exporter, and the 9.9 set has diversified
FDI, in the mineral and petroleum sectors. The union set of these 9 groups (containing 31
cases21
) explains the 56% of the IBC´s presence. Looking for sufficient conditions to
summarize, the first conclusion is that all bigger countries applied incentives. These bigger
countries also show diversified FDI and low political risk. Being a relative small country
20 I think that Ecuador in the 1990s is wrongly included in this group, but this is the Cruz et al (2016)’s election.
I will fix it in future edition. The broad results will not change, but including this re-classification requires
repeating the whole processing with fsQCA 3.0. 21
Total IBC1 cases reaches 42 in the sample. The coverage indicator 56% is computed using the sum of values
over the crossover threshold 0.5 (in general less than one) divided by 42. Therefore it is less than 31/42=
73.8%, which would be the coverage in the crispy set world.

44
with low diversified FDI seems to be an alternative second important condition, as a
common factor in most of the solutions.
Regarding the incentives applied, Table 13 shows Model 10 explaining privatizations. I use
a variable linking to the 1990s decade, when privatizations are concentrated. There is a clear
political determination; the complex solution includes center or right orientation (~LMAY)
in both conditions. All of them were relative closed economies in the year 1990. The first
solution group includes five small and risky economies; the second solution includes the big
countries. The complex solution explains 38% of the privatization observations, 7 of 17
cases.
A second question regarding competition via incentives refers to the application of free
export zones (EPZ). Model 11 includes a variable signaling the 1980s decade, because EPZs
mostly developed after 1990. I also include education in the model, looking for conditions
affecting production quality in these zones. The complex solution shows two groups; both
leave out the period of the 1980s and are composed of cases with center or right
governments. The first sub-set solution is formed with small and relative not exporter
countries, presenting population attaching low educational level (average bellow the seven
years crossover threshold). The solution has an interesting coverage, almost a third of the
whole ZPEs cases in the sample. The second solution includes only Mexico in the 2000s, in
the opposite side: a big open country, with educational levels above the crossover point.
Closing IBC section, Model 12 displays configurations explaining the application of
sectorial policies in order to attract the participation of TNCs. The complex solution displays
5 conditions. They show that there is not a strong link between political orientation and
sectorial policies. Conditions 12.1 and 12.2 indicate that big countries with export to GDP
coefficients under the crossover point in the beginning year of the period, low risk and
diversified FDI, in general with center or right governments (excepting Brazil in the 2000s
included in 12.1), applied sectorial policies. Conditions 12.3 to 12.4 includes relative small
open countries, with low political risk, and no diversified FDI origins (except Venezuela in
the 1990s), after 1990 applied sectorial policies. The union set of these two conditions
explain 27% of the whole SEC in the sample. The last solution refers to only one case: Perú

45
in the 1980s, which had a left government in a sub-period, and diversified FDI attracted by
the mining sector.
4.3.4 ¿Are there attempts for “FDI-Assisted Development Strategies” (Lall, Narula
and Dunning)?
Lall´s studies on industrial development in Asia (Lall 1992, 2000) distinguished three basic
strategies regarding how FDI participated. These are: i) Autonomous, based in national
groups without FDI dependence (like Korea); ii) FDI dependent, with promotion but
otherwise passive: most South East Asia e.g. Malaysia, Thailand, Philippines, Indonesia;
and iii) FDI dependent and targeted: Singapore, and, with not so targeted or promotion, but
very successful, the case of China22
. Narula and Dunning (2000, 2004, 2009) states that
FDI-based development strategies were widespread “a commonplace among less developed
countries”, with increased competition for “right” kind of investment, which in turn implied
the creation of assets to attach and maintain a successful FDI-Tarjeting, what they call
FDI-assisted development strategy.
I think this kind of strategy requires some combination of incentives and regulation. To
explore this, I design a variable REG&IBC worth 1 when the country applied REG and IBC
at the same time (it occurred in 19 cases within the sample). Table 15 displays some
explanations for this variable.
Table 15. EXPLAINING REGULATION AND INCENTIVES FOR FDI (IBC) USING FSQCA
BEST SOLUTIONS SELECTED BY TRUTH TABLE ANALYSIS
MODEL SOLUTION Con
siste
ncy
Cov
erag
e
Cases with greater than
0.5 membership in
condition and output
13.
REG&IBC
= f(L1,
bigsize,
13.1
L1*~bigsize*no-risk*openX*~fdiori*~2000
s
0.89 0.12 Cos90, Ven80
13.2 0.85 0.13 Mex90, Bra90, Bra80
22 Lall opened a fourth type of FDI-targeted strategies including the Chinese case.

46
no-risk,
openX,
Xmin,
fdiori,
2000s)
~L1*bigsize*no-risk*~openX*fdiori*~2000
s
13.3
L1*~bigsize*~no-risk*Xmin*fdiori*~2000s
0.92 0.11 Per80, Ecu90
13.4
L1*~bigsize*no-risk*openX*Xmin*~2000s
0.88 0.08 Chi90, Ven80
13.5
L1*~bigsize*openX*Xmin*fdiori*~2000s
0.91 0.11 Chi90, Per80
13.6
~L1*bigsize*no-risk*openX*~Xmin*fdiori*
2000s
0.8 0.04 Mex00
Joint solution 0.89 0.39 7 cases
14.
REG&IBC
= f(SEC,
L1, bigsize,
openX,
2000s)
14.1 SEC*~L1*bigsize*~openX*~2000s 0.96 0.19 Bra90, Bra80, Mex90,
Mex80
14.2 SEC*L1*~bigsize*openX*~2000s 0.92 0.16 Chi90, Ven80, Cos90,
Per80
14.3 SEC*L1*bigsize*~openX*2000s 0.81 0.06 Bra00
14.4 ~SEC*~L1*bigsize*openX*2000s 0.99 0.04 Mex00
Joint Solution 0.92 0.46 10 cases
15.
REG&IBC
= f(PER,
L1, bigsize,
openX,
2000s)
15.1 PER*~L1*~openX*~2000s 1 0.19 Bra90, Arg90, Bra80,
Mex80
15.2 PER*~bigsize*openX*~2000s 1 0.11 Chi90, Ven90, Cos90
15.3 PER*L1*~bigsize*openX 1 0.14 Cos00, Chi90, Cos90
15.4 PER*L1*bigsize*2000s 1 0.08 Bra00, Arg00
Joint solution 10 cases REGU&INC: REG1 AND IBC1 OCCURRING SIMULTANEOUSLY (REGU&INC=1 IF REG1=IBC1=1,
EGU&INC=0 IN OTHER CASE)
The explanatory model (13) includes a variable signaling 2000s, regarding a possible change
of conditions with the expansion of left wing governments in the last period. The complex
solution for the model 13 has 6 configurations, 5 of them refers to the periods before 2000.
Mexico was the only big, open, low risky and FDI diversified case, that combined incentives
and regulation in the last period. Before 2000, 13.2 shows that big, not exporter and not risky
countries denoting diversified FDI reception, with center or right governments, applied a
combination of incentives and regulation. Solutions 13.1, 13.3, 13.4 and 13.5 have in
common that are sets containing small countries, which had one leftist government in the
period, and low risk (except 13.3 with Peru in 1980s). These small countries´ solutions differ
in openness, mineral exports, and FDI diversification. One can think that supported on low
risk and exports, Costa Rica in the 1990s and Venezuela in the 1980s (solution 13.1) in the
aim to enter in FDI circuits, gave some incentives while trying to induce same TNCs

47
behaviors. Chile in 1990s and Peru in the 1980s did so, but supported on mining-petroleum
sectors that were already receiving diversified FDI (13.5).
Model 14 explores the relation between making REG&INC and sectorial policies. Solutions
show that SEC enter in most of the REG&INC explanations. Only Mexico 2000 was not the
case (14.4). Brazil in 2000s appears in the 14.3 solution as a big close country with a leftist
government applying sectorial policy. Before 2000, right or center governments in big
closed countries also used REG&INC by means of SEC. Some left governments in relative
small and open countries also did before 2000.
Performance requirements are usually part of sectorial policies. In fact, the 10th observations
of PER correspond to SEC observations, although there are some SEC observations that not
correspond with PER. After 2000, two leftist presidents in big countries applied this
combination, Brazil and Argentina, as found by solution 15.4. Before 2000, all the big
countries (that were also relative low exporters), with center or right governments, used PER
as an instrument in the combination of incentives plus regulation. Costa Rica appears as the
unique case of a small country applying this kind of combination with continuity in the last
two periods. Chile in the 1990s use this instrument in the context of an automotive regime
that ended in 1998, Venezuela in the petroleum industries, with sectorial policies that
changed before 2000.
5. Conclusions
The above shows that the application of typologies of instruments for the analysis of policies
towards foreign capital, an analytical resource little used in the literature, is useful to
characterize different situations and their nuances. The strategies towards foreign capital in
the region seem to maintain the weight of the regulatory instruments in aggregate terms,
which were one fifth of the possible situations in the 1980s, and maintain the same
proportion between 1990 and 2015. This means that only one in five countries applied at
least one regulation for FDI in the whole period, including some notably known pro-FDI
regimes, as the Chilean one. Regulation changes its composition: from the predominance of
restrictions on entry, inherited from the regulatory models of the early 1970s, towards

48
greater presence of performance requirements in 1990s and the appearance of three cases of
expropriation in 2004-2015.
On the other hand, the promotional instruments advance significantly from a scarce presence
in the 1980s, to mark its predominance in 1990s, and maintain it after 2004. Rules-Based
Competition for FDI (RBC), were almost non-existent initially, and it reaches half of the
possible cases in the 1990s and 2000s, that is, half of the countries promotes FDI with at
least one of the RBC´s policy instruments in the last two sub-periods. Very few countries
manage to generate promotion agencies, but many of them embark on signing numerous
bilateral protection agreements after 1990, until 2015. The attempt to improve the business
climate in the last two periods is also quite widespread. The Incentives based Competition to
attract FDI shows a boom in the 1990s, when privatizations are concentrated. The increase in
the number of EPZ cases is also permanent, given that, once launched the policy, it usually
does not have a reversal. Several countries apply sectoral policies, increasing in the 1990s
and thereafter 2000. Sectoral policies and EPZs compensate for the fact that, after the 1990s,
privatizations were very limited.
Few countries maintain coherence in their regulatory scheme over time, which makes it
difficult to summarize the situations, given the variability over time in each country, often
related to the change in the general political orientation of the government. With the IDB's
policy database (Cruz et al 2015), I designed two variables to capture the presence of Left's
parties in the government, or their absence. This may explain the “wishes”. Regarding the
bargaining theoretical framework briefly exposed, structural and short run conditions may
impose restrictions for the results of certain instruments in relative “weak” countries. Some
political parties may declare or express in their programs the intention to extract some
development benefits from TNCs by means of restrictive regulations or performance
requirements, in a sectorial incentives framework or not. Some structural or macroeconomic
conditions may limit the use of these instruments if the country wishes to preserve the
investment.
The exercise of configurational analysis linking political orientation, structural and macro
conditions, and FDI policy, made from the truth tables provided by the software fsQCA3.0,
allows extracting some ideas:

49
In the context of this sample, every “big” country and every country combining
mineral exports and low political risk, apply at least one FDI policy regulation.
While the total absence of regulation is associated with center-right governments in
smaller and political risky countries, or in smaller mining exporters.
Small countries not inserted in FDI circuits, in general open and low political risky,
conducted Rules-Based competition for FDI. The only big country conducting RBC
is Mexico recently.
All bigger countries applied incentives. Relative small countries with low diversified
FDI also conducted IBC. Regarding privatizations, there is a clear political
determination: only center or right governments applied this instrument. After 1990,
small and relative not exporter countries, presenting population attaching low
educational level, and Mexico (in the opposite side) applied EPZs. Big and no great
exporter countries, with low risk and diversified FDI, applied sectorial policies. Also
did small open countries, with low political risk, and no diversified FDI origins.
Looking for FDI-assisted development strategies, I revised a combined
regulation-incentives variable. Right governments in big and closed countries with
diversified FDI reception, applied a combination of incentives and regulation before
2000, as did Mexico after 2000. Before 2000, all the big countries applied
performance requirements in the context of sectorial policies. Some small countries
also applied these instruments, but Costa Rica is the unique case with long term
permanence of these regimes, as belonging to a strategy.
Using more specific theoretical models would be helpful to understand better some
particular instruments (as the performance requirements or the export processing zones)
identifying variables and functional forms, that represent more precisely the relative power
of TNCs and governments. Asiedu and Eshaffani (2004, 2008) provide an interesting model
I am working with. This is the next step to understand why there are only a few cases using
instruments looking for the alignment of FDI in the direction of development strategies.
QCA methods may be useful to study specific configurational characteristics, with new
variables supported by a better theoretical explanation.

50
The next step will include a Fuzzy Set mode to identify FDI policies. This may produce
some improvements: in one hand, a better understanding of graduation for instruments, for
example: it is not the same a Chilean entry restriction than a Brazilian one, but both are 1;
some countries have institutions like IPAs that deserves some number below 1 but not 0. In
the other hand, this will improve the identification of causal configurations, increasing the
number of observations that are not zero, implying better variability of the dependent
variable.
Bibliographic References
Abelenda, L., Buenrostro, E., Casalet, M., Oliver, R. y Stezano, F. (2011). Evolución y complejidad
en el desarrollo de encadenamientos productivos en México: Los desafíos de la construcción
del cluster aeroespacial en Querétaro. Cepal.
Alonso, J., Carrillo, J. y Mortimore, M., 1998. El impacto de las empresas transnacionales en la
reestructuración industrial de México, el caso de las industrias de partes para vehículos y
televisores. Serie Desarrollo Productivo n°50. CEPAL. Asiedu E., Esfahani H. S. (2008). Is the world flat? Differential regulation of domestic and
foreign-owned firms. The Quarterly Review of Economics and Finance 48 p.389–411
Barja (1999). Bolivian structural reforms and their impact on investment. Bielschowsky, R. and Stumpo, G. (1995). Transnational corporations and structural changes in
industry in Argentina, Brazil, Chile y México CEPAL Review 55 CEPAL (2002) - Inversión extranjera y empresas transnacionales en la economía argentina.
Bittencourt, G. (1995). Inversión extranjera en manufacturas en América Latina. Un estudio de sus
determinantes. Decon-FCS- Documento No. 02/95
Bittencourt, G. (2016). Políticas hacia el capital extranjero en América Latina 1990-2014.
Documento de trabajo dECON # 11/16, Departamento de Economía, FCS, UDELAR. ISSN
0797-7484 Bittencourt, G. (2019). Foreign Direct Investment Policy in Latin America 1980-2015.
Configurational Analysis Using Crispy Sets. RIDGE Public Policies Medellín may 2019. On
demand in Research Gate.
Bittencourt, Gustavo & Domingo, Rosario, 2004. "Los determinantes de la IED y el efecto del
MERCOSUR," El Trimestre Económico, Fondo de Cultura Económica, vol. 0 (281), pages
73-128, enero-mar. Bonelli, R. y Motta Veiga, P. (2004). A Dinâmica das Políticas Setoriais no Brasil na Década de
1990: Continuidade e Mudança. Cepal. Santiago de Chile, Chile.
Campodónico, Humberto (1999). Las reformas estructurales en el sector minero peruano y las
características de la inversión 1992-2008. Serie reformas económicas nº 24. CEPAL Campodónico, Humberto (2004). Reforma e inversión en la indústria de hidrocarburos de
América Latina. Serie Recursos Naturales e Infraestructura. CEPAL. Chudnovsky y López (2001) – El boom de Inversión Extranjera Directa en el Mercosur. El caso
argentino. Serie Red Mercosur N°1 (redmercosur.org/el-boom-de-IED-en-el-Mercosur).
Cubillos, M. y Navas, V. (2000). Inversión Extranjera Directa en Colombia: Características y
Tendencias. Inversión Extranjera. Boletines de divulgación económica. Unidad de
Análisis Macroeconómico-Departamento Nacional de Planeación. Santa Fe, Bogotá.
Cruz, Cesi, Philip Keefer and Carlos Scartascini (2016). "Database of Political Institutions
Codebook, 2015 Update (DPI2015)." Inter-American Development Bank. Updated

51
version of Thorsten Beck, George Clarke, Alberto Groff, Philip Keefer, and Patrick
Walsh, 2001. "New tools in comparative political economy: The Database of Political
Institutions." 15:1, 165-176 (September), World Bank Economic Review.
Dunning, John H. and Sarianna M. Lundan (2008). Multinational Enterprises and the Global
Economy, Second Edition. Edward Elgar Publishing Limited, Cheltenham, UK.
Dussel Peters, Enrique (coordinador), (2007). Inversión extranjera directa en México: desempeño y
potencial. Una perspectiva macro, meso, micro y territorial. México Siglo XXI editores,
Unam-Facultad de Economía, Secretaría de Economía.
Dussel Peters, Enrique (2000). La inversión extranjera en México. Serie Desarrollo Productivo n°80.
CEPAL.
Estache, A. y Trujillo, L. (2004). La privatización en América Latina en la década de los años 90:
aciertos y errores. Revista Asturiana de Economía - RAE Nº 31
Ferraz, João Carlos; David Kupfer y Felipe Silveira Marques (2014). Chapter 10. Industrial policy as
an effective development tool: Lessons from Brazil. Transforming Economies: Making
industrial policy work for growth, jobs and development. ILO/OIT. 978-92-2-128565-6
[ISBN]. Gámez, Oscar; Erick Cerpas; Luz Sequeira; Octavio Zeledón, Leonel Pérez (2010). Implicaciones de
la política macroeconómica, los choques externos y los sistemas de protección social en la
pobreza, la desigualdad y la vulnerabilidad en América Latina y el Caribe. Nicaragua.
CEPAL – Colección Documentos de proyectos.
Garavito, A., Iregui, A., Ramírez, M.T. (2012). Inversión Extranjera Directa en Colombia:
Evolución reciente y marco normativo. Borradores de Economía nº713. Banco de la
República de Colombia. Bogotá, Colombia.
Gligo S., Nicolo (2007). Políticas activas para atraer inversión extranjera directa en América Latina y
el Caribe, Serie Desarrollo Productivo N°175, CEPAL, Santiago de Chile. Guimarães, E., da Motta Veiga, P. e Polónia S. (2018). A experiência brasileira de política industrial:
uma avaliação. RBCE Nº 134, FUNCEX
Grosse, Robert (1989): Multinationals in Latin America, Routledge, London and New York. Guzman y Salinas 2015. Papel y evolución de las instituciones en la dinámica económica
salvadoreña 1979-2008: Una mirada evolucionista e histórica
Lall, Sanjaya (1992). Technological Capabilities and Industrialization.World Development, Vol. 20,
No. 2, pp. 165-186. Pergamon Press plc. Lall, Sanjaya (2000). The Technological Structure and Performance of Developing Country
Manufactured Exports, 1985-1998. QEH Working Paper Series #44, Queen Elizabeth
House, University of Oxford.
Lichtensztejn, S. y R. Trajtenberg (1991). La liberalización de la política económica hacia las
empresas transnacionales en América Latina: décadas del 50 y 60, Documento de Trabajo
Decon No. 13/91 Diciembre, 1991
López, Andrés y Valeria Arza (2008) - La industria automotriz en el Mercosur. El caso argentino.
Serie Red Mercosur N°10 (redmercosur.org/la-industria-automotriz-en-el-Mercosur).
López, Andrés; Verónica Gutman y Daniela Ramos (2015). Análisis de los mecanismos de
regulación y promoción de la Inversión Extranjera Directa (IED) en Ecuador Versión Final
para Discusión Interna, BID, Washington DC, Agosto 2015
Máttar, J. y Wilson Peres (1997). La política industrial y el comercio exterior en México. En
Peres, W. (coord), Políticas de competitividad industrial: América Latina y el Caribe en
los años noventa (pp 219-261). Morris, Kenneth (2010). Unfinished revolution: Daniel Ortega and Nicaragua’s struggle for
liberation. Lawrence Hill Books, an imprint of Chicago Review Press ISBN
978-1-55652-808-8

52
Narula, Rajneesh and John H. Dunning (2009) Multinational enterprises, development and
globalisation: Some clarifications and a research agenda ONU Merit Working Paper
Series #2009-023 Ngoason, Michael Zisuh (2014). How international oil and gas companies respond to local content
policies in petroleum-producing developing countries: A narrative enquiry. Energy Policy,
2014, vol. 73, issue C, pages 471-479
Oman, Charles, 2000. Policy competition for foreign direct investment: A study of competition
among governments to attract FDI. Development Centre Studies. OECD.
Ons, Alvaro (2015). Análisis de los instrumentos de promoción de inversiones el caso de Uruguay.
Versión Preliminar para Discusión Interna. Estudio regional sobre mecanismos de
promoción de la IED en América Latina, Unidad de Comercio e Inversiones del BID.
Washington DC.
Paz Antolin, Ma. José (2003). Efectos de las Empresas Transnacionales en la economía
guatemalteca: el sector confección y el sector eléctrico. Tesis doctoral. Universidad
Complutense de Madrid. ISBN: 84-669-2269-5
Peres, Wilson (2006). El lento retorno de las políticas industriales en América Latina y el Caribe.
Revista de la CEPAL, Nº. 88, 2006, págs. 71-88, ISSN-e 1682-0908.
OMC (Varios años). Examen de las Políticas Comerciales. Revised for almost every countries.
Ragin, Charles (2008). Redesigning Social Inquiry. Fuzzy Sets and Beyond. The University of
Chicago Press
Vargas, José (2014). Las reformas del gobierno de Peña Nieto y la dimensión de las exigencias de la
economía mexicana. Revista crítica de investigación y análisis económico, vol. 1, nº1.
UNCTAD (2009 a 2016): Investment Policy Monitor
Sabbatini, Rodrigo Coelho (2008). Investimento direto estrangeiro: reflexões sobre políticas de
apoio e seus determinantes. (Tesis doctoral) – Universidade Estadual de Campinas, Instituto
de Economía.
Segura, R. (2005). Costa Rica. Luchas contra las políticas de privatización y el tratado de libre
comercio Centroamérica-EEUU. Rev. Ciencias Sociales 2005 (I) / 15-34
Rodrik D. (2005). Policies for economic diversification. CEPAL REVIEW 87
Ros Bosch, Jaime (2015): ¿Cómo salir de la trampa del lento crecimiento y alta desigualdad?, El
Colegio de México y UNAM
US DC-ICS (2015). Investment Climate Statement: Argentina,Venezuela, Ecuador, Bolivia,
Colombia, Uruguay, México, Costa Rica, Nicaragua, Guatemala, Honduras, El Salvador. US Department of Commerce.
UNCTAD (2011). Análisis de la Política de Inversión de Guatemala.
Vázquez, Jesús, 2011. La promoción de la inversión extranjera directa (IED), desde una perspectiva
comparada entre los casos de México y Chile. Tesis Maestría. Flacso. México.
Vilas, Carlos (1990). La contribución de la política económica y la negociación internacional a la
caída del gobierno sandinista. Revista Mexicana de Sociología, Vol. 52, No. 4, Procesos
Electorales en América Latina (Oct. - Dec., 1990), pp. 329-351. WTO El Salvador (2003). Trade Policy Review of El Salvador, WTO Secretariat WT / TPR / S / 111