foreign direct investment - mt. san antonio...
TRANSCRIPT
Chapter 8
Foreign Direct Investment
What is FDI
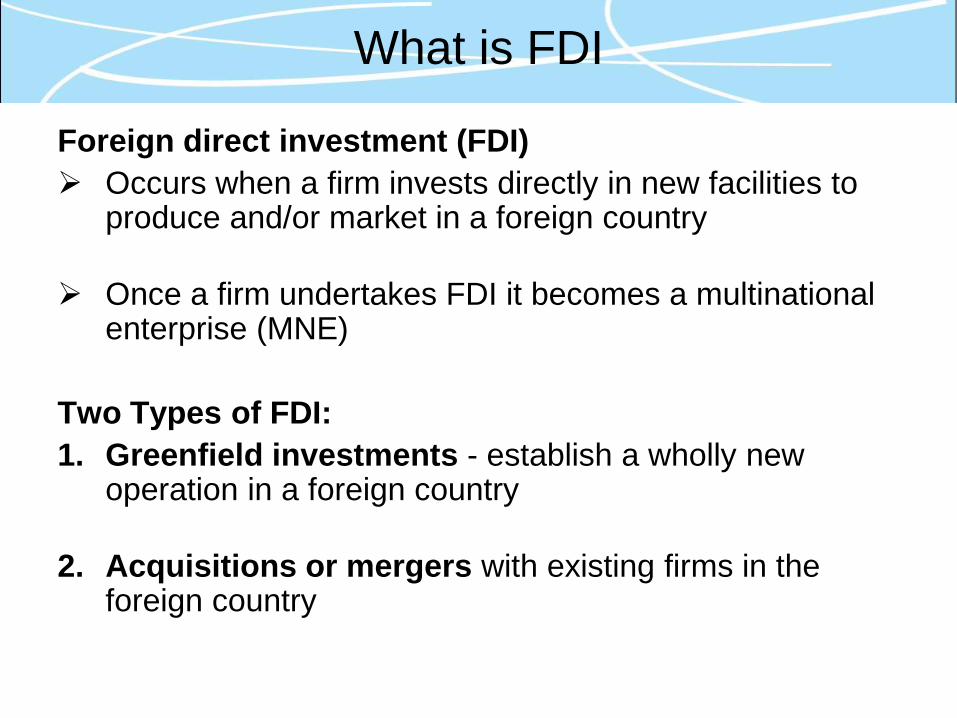
Foreign direct investment (FDI) Occurs when a firm invests directly in new facilities to
produce and/or market in a foreign country
Once a firm undertakes FDI it becomes a multinational enterprise (MNE)
Two Types of FDI: 1. Greenfield investments - establish a wholly new
operation in a foreign country
2. Acquisitions or mergers with existing firms in the foreign country
M&A FDI (2016)
3 Top Countries = Netherlands, Belgium, China - 36% of World Total
Source: UNCTAD – World Investment Report 2017 http://unctad.org/en/Pages/DIAE/World%20Investment%20Report/Annex-Tables.aspx
Which are the Top 3 countries for M&A (as purchasers) in 2016?
Greenfield FDI (2016)
3 Top Countries = U.S., China, Germany - 38.2% of World Total
Source: UNCTAD – World Investment Report 2017 http://unctad.org/en/Pages/DIAE/World%20Investment%20Report/Annex-Tables.aspx
Which are the Top 3 countries for Greenfield Investment Projects (as
source) in 2016?
The Form Of FDI: Acquisitions Versus Greenfield Investments
Most FDI is mergers & acquisitions (not greenfield investments) But … since financial crisis Greenfield has been higher in developing countries (fewer target companies)
Acquisition preferred because: Quicker to execute (than greenfield investments) Easier and Less risky for a firm to acquire desired assets
(than build them from the ground up) By transferring capital, technology, or management skills
Most firms can increase efficiency of an acquired unit Be careful what you wish for . . . FILM CLIP it may be more than you bargained for Country Selection is VITAL
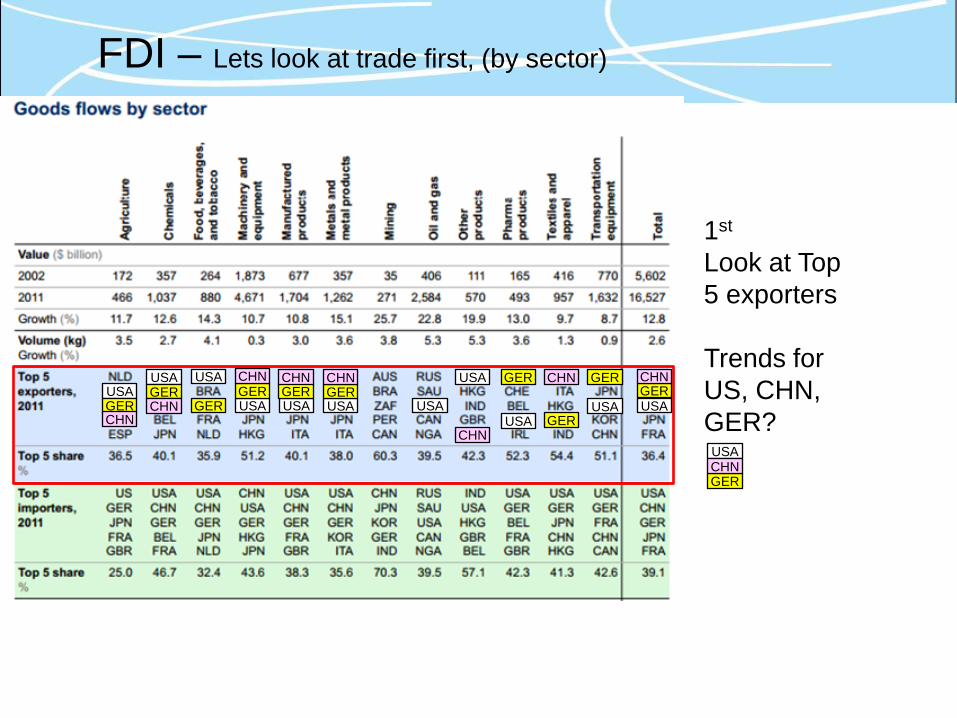
FDI – Lets look at trade first, (by sector)
USA USA USA
USA USA USA USA
USA
USA USA GER
CHN
GER GER
GER GER GER GER
GER
GER
CHN
CHN CHN CHN
CHN
CHN
1st Look at Top 5 exporters Trends for US, CHN, GER?
USA GER CHN
USA
GER CHN
USA USA USA USA
USA USA
USA USA
USA USA GER CHN
GER GER GER GER GER GER
GER GER CHN CHN
CHN CHN CHN
CHN
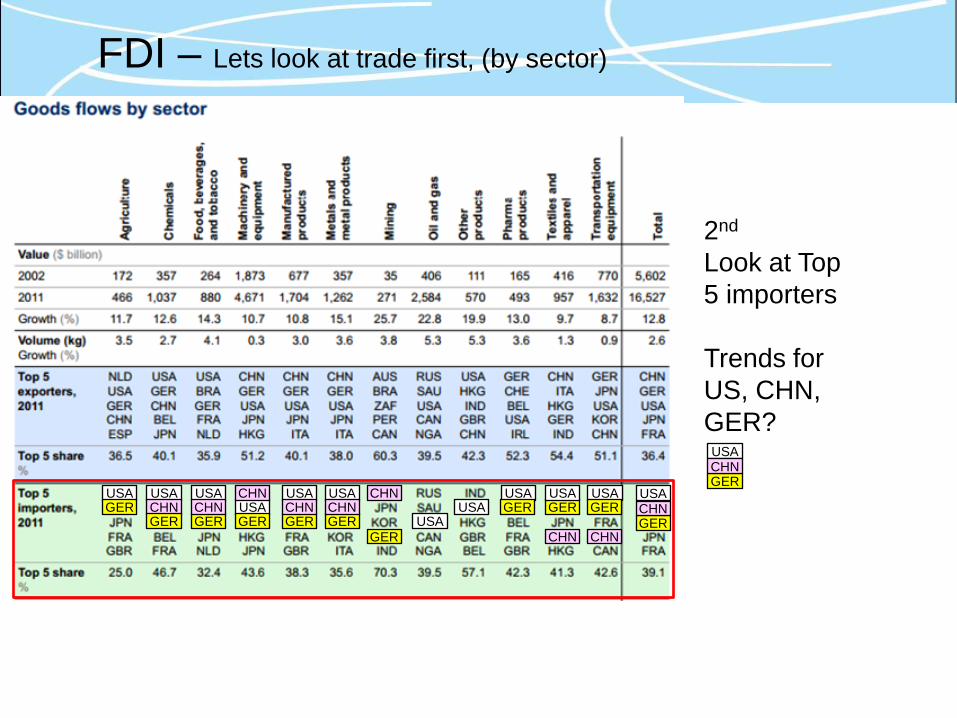
2nd Look at Top 5 importers Trends for US, CHN, GER?
USA GER
CHN
FDI – Lets look at trade first, (by sector)
USA
GER CHN
USA
GER CHN
USA USA USA USA
USA USA
USA USA
USA USA GER CHN
GER GER GER GER GER GER
GER GER CHN CHN
CHN CHN CHN
CHN
USA GER CHN
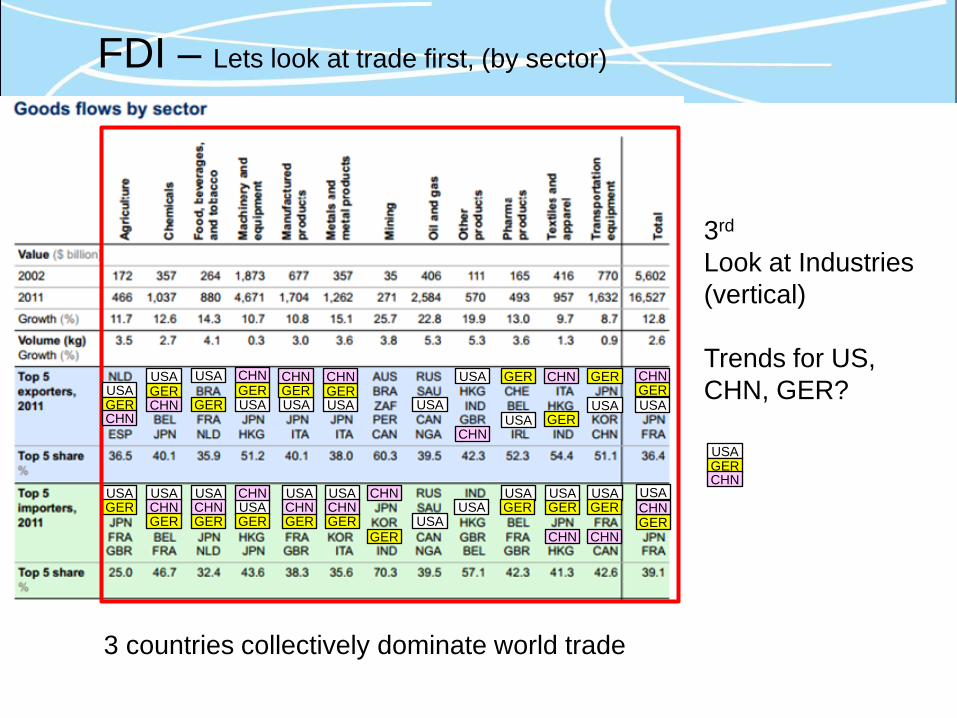
3rd Look at Industries (vertical) Trends for US, CHN, GER?
USA GER
CHN
USA USA USA
USA USA USA USA
USA
USA USA GER
CHN
GER GER
GER GER GER GER
GER
GER
CHN
CHN CHN CHN
CHN
CHN
FDI – Lets look at trade first, (by sector)
3 countries collectively dominate world trade
USA GER CHN
USA
GER CHN
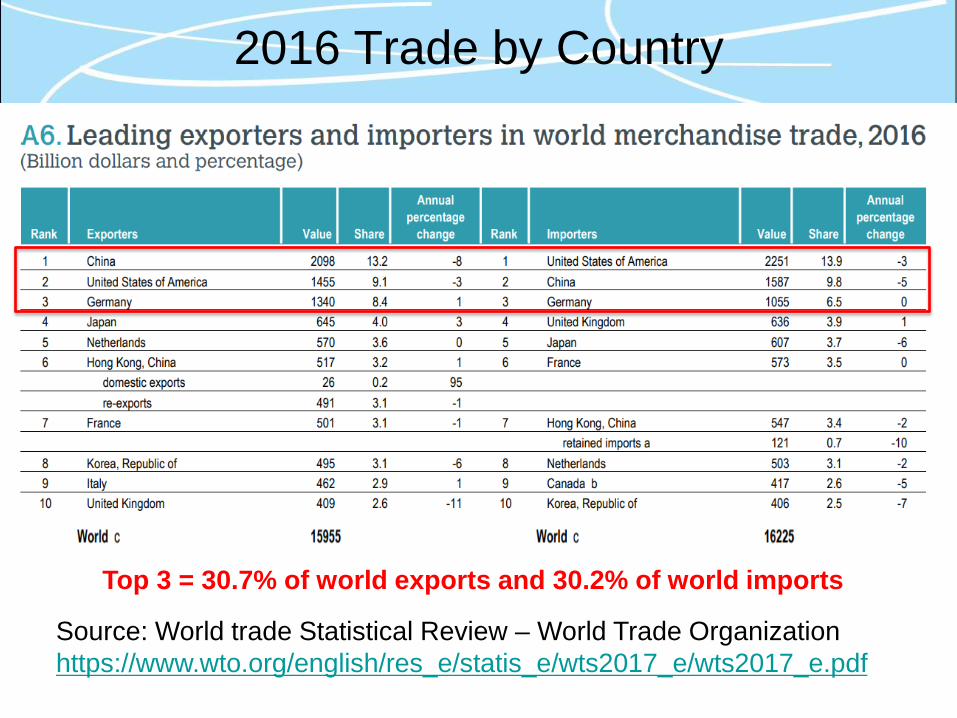
2016 Trade by Country
Top 3 = 30.7% of world exports and 30.2% of world imports
Source: World trade Statistical Review – World Trade Organization https://www.wto.org/english/res_e/statis_e/wts2017_e/wts2017_e.pdf
FDI – Country Selection Practical Advice: When first starting to expand internationally: 1. Select the “easiest” market to enter 1st 2. Gain experience 3. Later go after the “best” markets
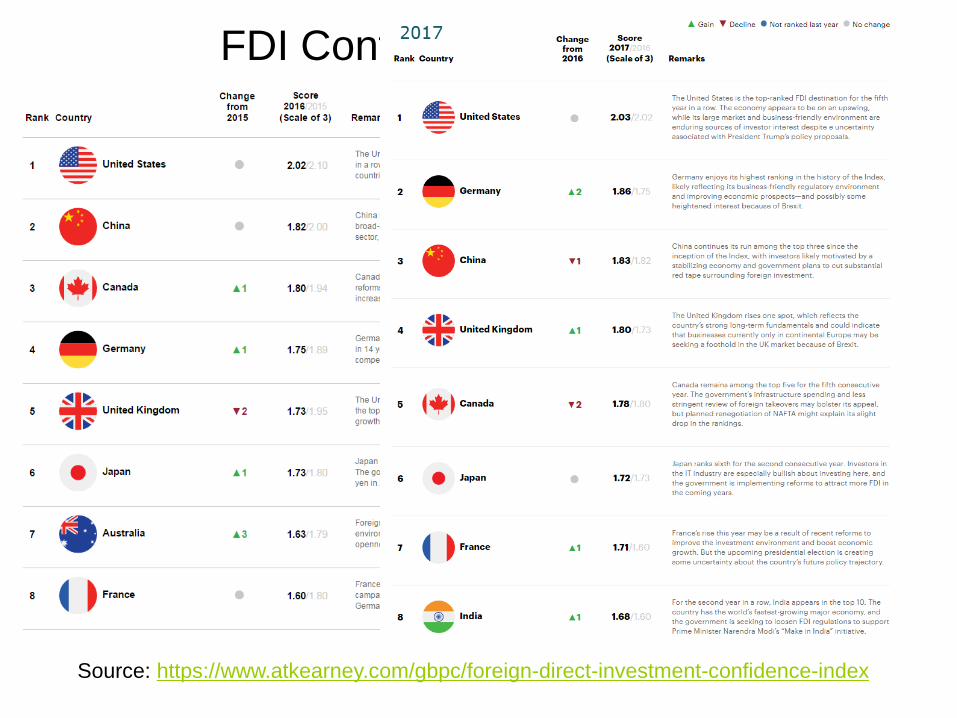
FDI Confidence Index 2016
Developed markets Seven of the top 8 U.S. tops index (4 yrs in a row) China is #2 (4 yrs in a row)
Source: https://www.atkearney.com/gbpc/foreign-direct-investment-confidence-index
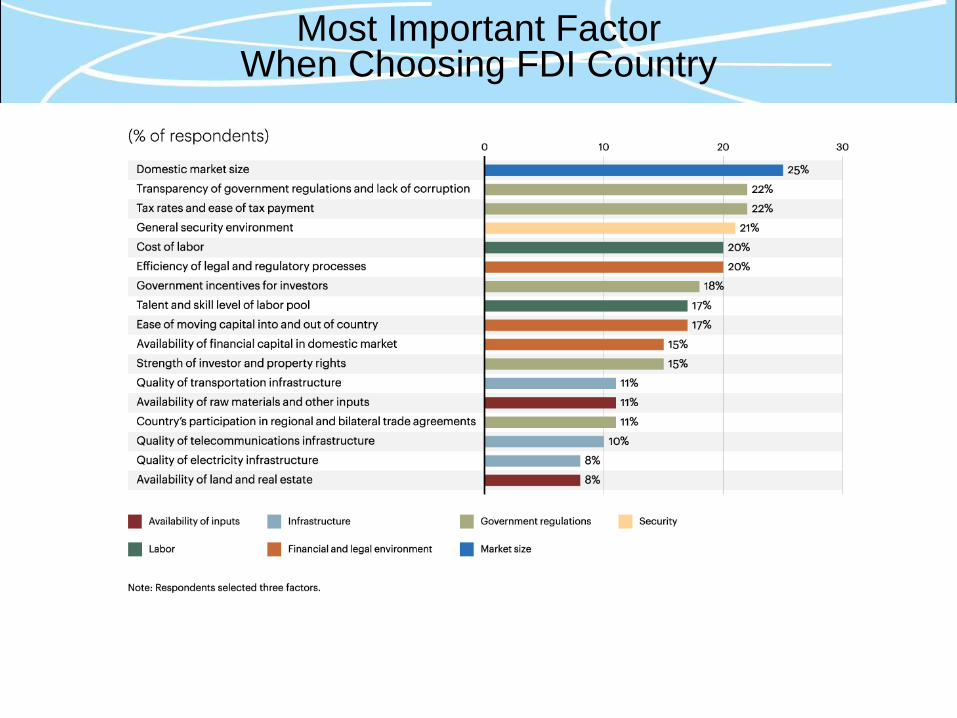
Most Important Factor When Choosing FDI Country
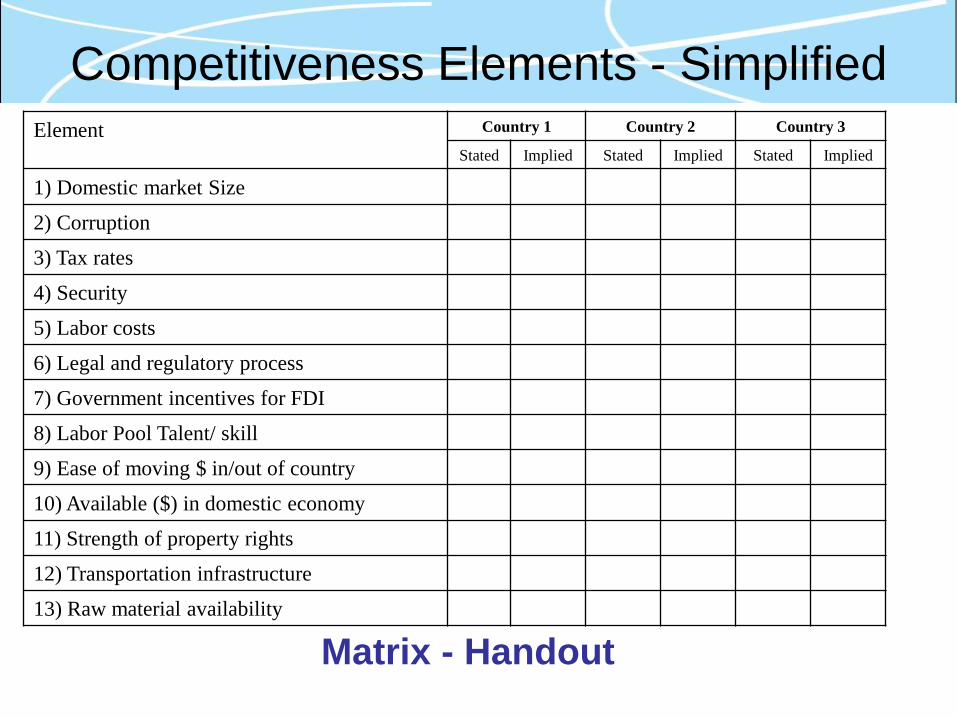
Competitiveness Elements - Simplified Element Country 1 Country 2 Country 3
Stated Implied Stated Implied Stated Implied
1) Domestic market Size
2) Corruption
3) Tax rates
4) Security
5) Labor costs
6) Legal and regulatory process
7) Government incentives for FDI
8) Labor Pool Talent/ skill
9) Ease of moving $ in/out of country
10) Available ($) in domestic economy
11) Strength of property rights
12) Transportation infrastructure
13) Raw material availability
Matrix - Handout
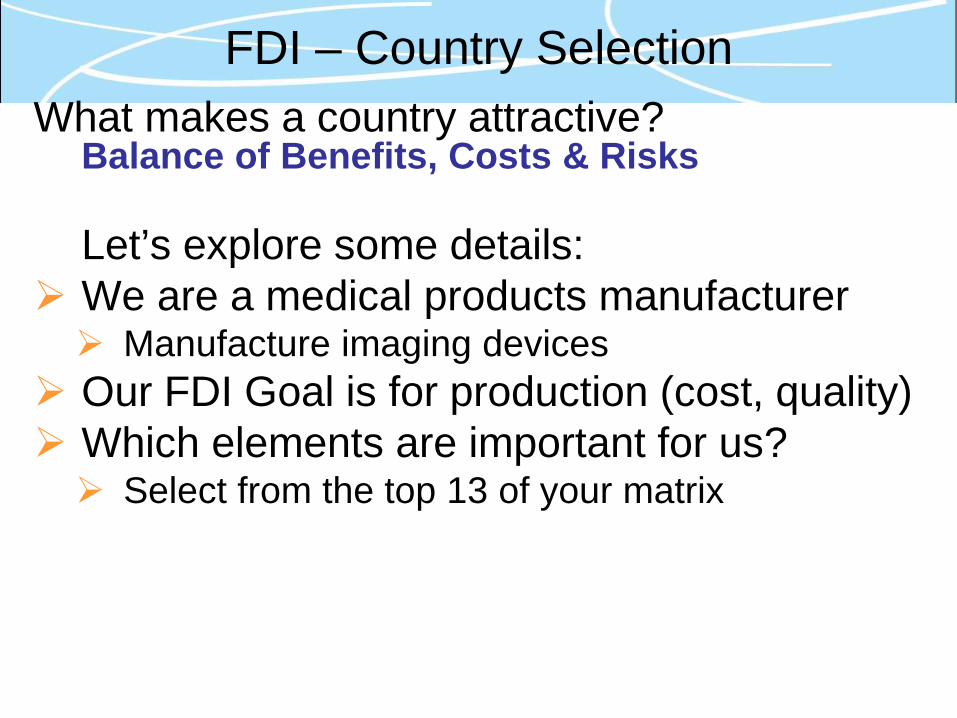
FDI – Country Selection What makes a country attractive?
Balance of Benefits, Costs & Risks
Let’s explore some details: We are a medical products manufacturer Manufacture imaging devices
Our FDI Goal is for production (cost, quality) Which elements are important for us? Select from the top 13 of your matrix
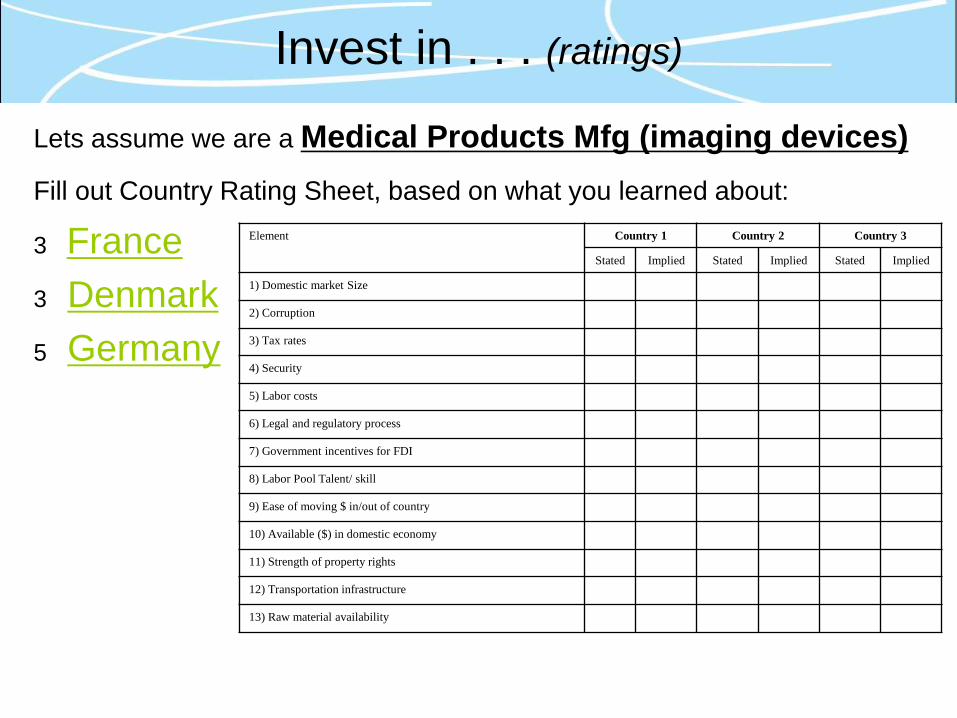
Invest in . . . (ratings)
Lets assume we are a Medical Products Mfg (imaging devices) Fill out Country Rating Sheet, based on what you learned about: 3 France 3 Denmark
5 Germany
Element Country 1 Country 2 Country 3
Stated Implied Stated Implied Stated Implied
1) Domestic market Size
2) Corruption
3) Tax rates
4) Security
5) Labor costs
6) Legal and regulatory process
7) Government incentives for FDI
8) Labor Pool Talent/ skill
9) Ease of moving $ in/out of country
10) Available ($) in domestic economy
11) Strength of property rights
12) Transportation infrastructure
13) Raw material availability
Made in … Perceptions
Which Top 20 countries have the best “Made In” reputation?
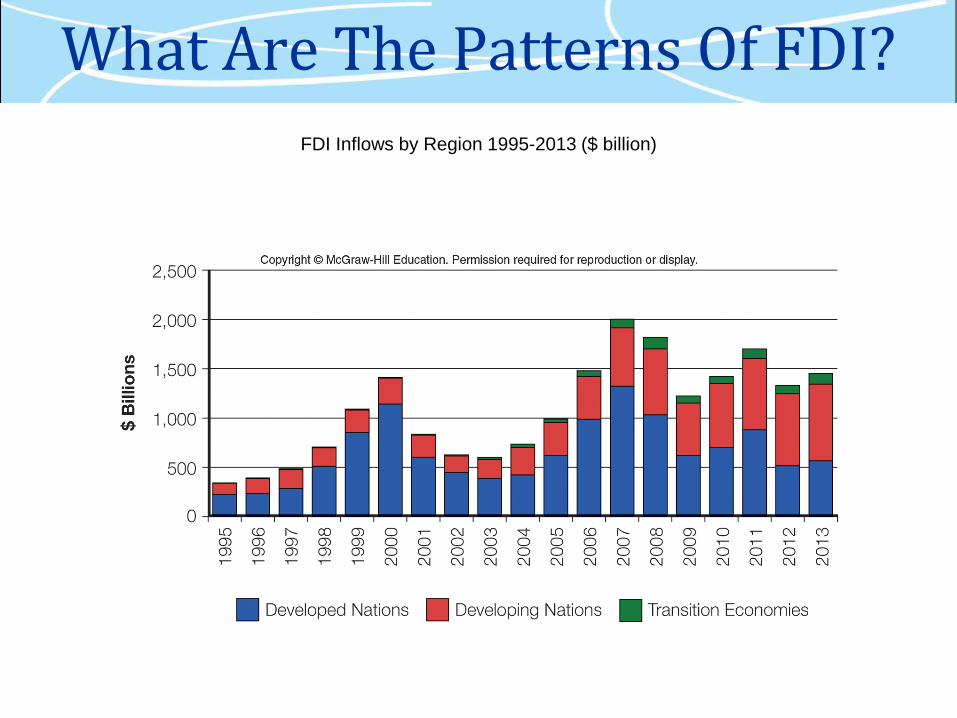
What Are The Patterns Of FDI? FDI Inflows by Region 1995-2013 ($ billion)
FDI Inflows ($ billion), 1990-2014
Historic Flow Toward Developed Nations
FDI inward stock, by region and economy, 1990-2014 (Millions of dollars)
Region/economy 1990 2000 2010 2014
World 2 197 767.7 7 202 348.3 19 607 406.5 26 038 824.1
Developed economies 1 687 651.6 5 476 613.0 12 789 149.6 17 003 802.2
Developing economies 510 107.4 1 669 811.7 6 088 657.4 8 310 054.6 1 - United States 539 601.0 2 783 235.0 3 422 293.0 5 409 884.0 2 - United Kingdom 203 905.4 463 134.4 1 094 833.2 1 662 857.8 3 - Hong Kong, China 201 652.9 435 417.1 1 067 520.0 1 549 848.8 4 - China 20 690.6 193 348.0 587 817.0 1 085 293.0 5 - Singapore 30 468.0 110 570.3 632 766.2 912 355.4 6 - Brazil 37 143.4 122 250.3 682 345.9 754 768.9 7 - Germany 226 551.8 271 613.2 716 704.2 743 511.5 8 - France 104 267.9 184 215.0 630 710.4 729 147.2 9 - Spain 65 916.4 156 348.2 628 341.0 721 879.4 10 - Switzerland 34 244.8 86 804.2 610 851.9 681 849.2 11 - Netherlands 71 827.8 243 732.9 647 722.8 664 441.9 12 - Canada 112 843.2 212 715.6 591 873.3 631 315.6 13 - Australia 80 364.4 121 685.8 527 063.6 564 608.2 14 - Belgium - - 950 885.3 525 612.1 15 - Russian Federation - 32 204.0 490 560.0 378 543.0 16 - Italy 59 997.6 122 533.0 328 058.5 373 737.9 17 - Ireland 37 988.9 127 088.7 285 575.3 369 167.9 18 - Mexico 22 424.0 121 691.0 363 768.7 337 973.6 19 - Sweden 12 636.0 93 791.2 347 163.4 321 103.3 20 - Indonesia 8 732.5 25 060.5 160 735.1 253 081.7 Source: UNCTAD, FDI/TNC database (www.unctad.org/fdistatistics).
FDI inflows, by region and economy, 1990-2013 (Millions of dollars)
Region/economy 1990 2000 2010 2013
World 207 618.3 1 415 016.9 1 422 254.8 1 451 965.4 Developing economies 35 033.0 266 646.1 648 207.6 778 372.4 Developed economies 172 514.4 1 142 383.2 703 474.1 565 626.5
1 - United States 48 422.0 314 007.0 198 049.0 187 528.0 2 - China 3 487.1 40 714.8 114 734.0 123 911.0 3 - British Virgin Islands 18.4 9 877.3 50 142.0 92 300.0 4 - Russian Federation - 2 714.2 43 167.8 79 262.0 5 - Hong Kong, China 3 275.1 70 507.6 82 707.7 76 632.8 6 - Brazil 988.8 32 779.2 48 506.5 64 045.3 7 - Singapore 5 574.7 15 515.3 55 075.8 63 772.3 8 - Canada 7 582.3 66 795.1 28 400.4 62 324.7 9 - Australia 8 478.9 15 358.0 35 799.3 49 826.2 10 - Spain 13 294.3 39 575.1 39 872.5 39 166.6 11 - Mexico 2 633.2 18 301.6 23 352.8 38 285.7 12 - United Kingdom 30 461.1 121 897.7 49 616.9 37 100.9 13 - Ireland 621.9 25 779.4 42 804.1 35 519.7 14 - Luxembourg - - 39 730.8 30 075.4 15 - India 236.7 3 588.0 27 431.2 28 199.4 16 - Germany 2 962.4 198 276.5 65 619.9 26 720.8 17 - Netherlands 10 514.0 63 855.0 - 7 324.3 24 388.9 18 - Chile 661.2 4 860.0 15 725.2 20 258.2 19 - Indonesia 1 092.0 - 4 550.0 13 770.6 18 444.0 20 - Colombia 500.0 2 436.5 6 746.2 16 771.7
Source: UNCTAD, FDI/TNC database (www.unctad.org/fdistatistics).
What happened in the British Virgin Islands to spur FDI inflow? Tax Haven - most of the money is transferred quickly in and out of BVI, or cash moved through the treasury accounts of large firms
Which countries have received the most investment?
(Inward FDI stock)
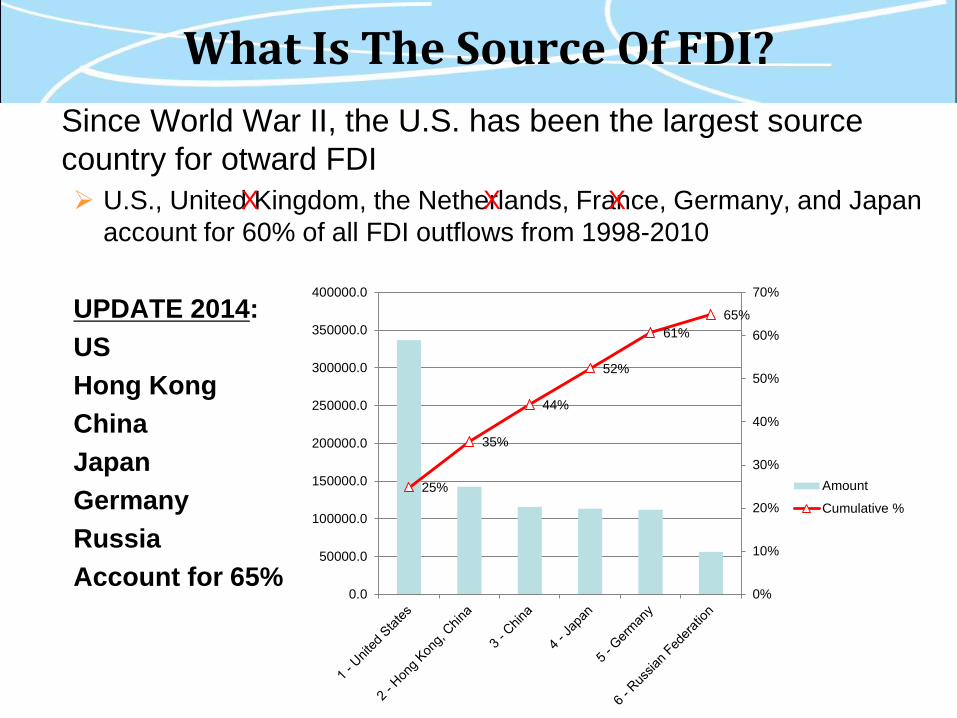
What Is The Source Of FDI? Since World War II, the U.S. has been the largest source
country for otward FDI U.S., United Kingdom, the Netherlands, France, Germany, and Japan
account for 60% of all FDI outflows from 1998-2010 UPDATE 2014: US Hong Kong China Japan Germany Russia Account for 65%
25%
35%
44%
52%
61% 65%
0%
10%
20%
30%
40%
50%
60%
70%
0.0
50000.0
100000.0
150000.0
200000.0
250000.0
300000.0
350000.0
400000.0
Amount
Cumulative %
X X X
FDI Outflows ($ billion), 1990-2014 FDI outward stock, by region and economy, 1990-2014
(Millions of dollars) Region/economy 1990 2000 2010 2014
World 2 253 943.8 7 298 188.2 20 414 081.3 25 874 756.8 Developed economies 2 114 507.8 6 535 722.3 16 978 445.1 20 554 819.2
1 - United States 731 762.0 2 694 014.0 4 809 587.0 6 318 640.0 Developing economies 139 436.0 741 924.5 3 033 712.5 4 833 045.7
2 - United Kingdom 229 306.8 923 366.5 1 635 791.4 1 584 146.6 3 - Germany 308 735.6 541 866.0 1 463 065.4 1 583 279.4 4 - Hong Kong, China 11 920.4 379 284.8 943 937.7 1 459 947.4 5 - France 119 860.0 365 871.1 1 172 993.8 1 279 089.3 6 - Japan 201 441.0 278 442.1 831 075.7 1 193 136.6 7 - Switzerland 66 087.1 232 160.9 1 041 312.9 1 130 614.7 8 - Netherlands 109 869.8 305 461.4 1 004 454.2 985 255.6 9 - China 4 455.0 27 768.4 317 210.6 729 584.7 10 - Canada 84 807.4 237 639.0 636 712.0 714 554.7 11 - Spain 15 651.5 129 193.6 653 235.5 673 988.7 12 - Ireland 14 941.6 27 925.3 340 113.7 628 026.3 13 - Singapore 7 808.4 56 755.2 458 649.9 576 395.8 14 - Italy 60 184.3 169 956.9 489 659.8 548 416.3 15 - Belgium - - 873 314.9 450 177.6 16 - Australia 37 505.0 92 508.2 449 740.4 443 519.2 17 - Russian Federation - 20 141.0 366 301.0 431 865.0 18 - Sweden 50 719.6 123 618.5 374 398.6 379 527.7 19 - Brazil 41 044.1 51 946.2 191 349.2 316 339.5 20 - Taiwan Province of China 30 356.0 66 655.0 190 803.0 258 829.0
Source: UNCTAD, FDI/TNC database (www.unctad.org/fdistatistics).
FDI outflows, by region and economy, 1990-2014 (Millions of dollars)
Region/economy 1990 2000 2010 2014
World 243 887.2 1 166 144.6 1 366 069.5 1 354 046.2 Developed economies 230 766.8 1 073 909.5 963 209.7 822 826.3 Developing economies 13 120.4 89 042.7 340 875.9 468 147.8 1 - United States 30 982.0 142 626.0 277 779.0 336 943.0 2 - Hong Kong, China 2 448.0 54 078.8 86 247.2 142 700.5 3 - China 830.0 915.8 68 811.0 116 000.0 4 - Japan 50 774.9 31 557.4 56 263.4 113 628.8 5 - Germany 24 234.8 56 557.0 125 450.8 112 227.0 6 - Russian Federation - 3 176.8 52 616.3 56 438.0 7 - Canada 5 236.5 44 678.2 34 722.8 52 620.0 8 - France 38 302.2 161 947.7 48 156.1 42 869.1 9 - Netherlands 14 371.9 75 634.4 68 358.0 40 808.7 10 - Singapore 2 033.8 6 650.3 33 377.4 40 659.9 11 - Ireland 363.9 4 628.7 22 348.3 31 795.2 12 - Spain 2 685.3 58 213.3 37 843.8 30 688.2 13 - Korea, Republic of 1 133.2 4 842.1 28 279.9 30 558.0 14 - Italy 7 613.5 6 685.9 32 655.0 23 450.8 15 - Norway 1 583.3 9 504.8 23 238.9 19 246.6 16 - Switzerland 7 175.6 44 673.0 85 700.7 16 797.6 17 - Malaysia 129.0 2 026.1 13 399.1 16 445.5 18 - Kuwait - 239.2 - 303.2 5 889.8 13 108.4 19 - Chile 7.5 3 986.6 10 524.2 12 999.0 20 - Taiwan Province of China 5 243.0 6 701.0 11 574.0 12 697.0
Source: UNCTAD, FDI/TNC database (www.unctad.org/fdistatistics).
Which countries have invested the most overseas?
(Outward FDI stock)
Trans National Corporations -TNC (ranked by foreign assets 2013)
Source: http://www.unctad.org
These “Top 20” had: - Over $3.5 trillion in foreign assets (2013) - Over $2.5 trillion in foreign sales (2013) What is “intrafirm trade”?
Web table 28. The world's top 100 non-financial TNCs, ranked by foreign assets, 2013 a (Millions of dollars and number of employees)
Ranking by: Assets Sales Employment
Foreign assets TNI b Corporation Home economy Industry c Foreign Total Foreign Total Foreign d Total TNI b
(Per cent)
1 81 General Electric Co United States Electrical & electronic equipment 331 160 656 560 74 382 142 937 135 000 307 000 48.8 2 34 Royal Dutch Shell plc United Kingdom Petroleum expl./ref./distr. 301 898 357 512 275 651 451 235 67 000 92 000 72.8 3 67 Toyota Motor Corporation Japan Motor vehicles 274 380 403 088 171 231 256 381 137 000 333 498 e 58.6 4 56 Exxon Mobil Corporation United States Petroleum expl./ref./distr. 231 033 346 808 237 438 390 247 45 216 75 000 62.6 5 21 Total SA France Petroleum expl./ref./distr. 226 717 238 870 175 703 227 901 65 602 98 799 79.5 6 38 BP plc United Kingdom Petroleum expl./ref./distr. 202 899 305 690 250 372 379 136 64 300 83 900 69.7 7 9 Vodafone Group Plc United Kingdom Telecommunications 182 837 202 763 59 059 69 276 83 422 91 272 e 88.9 8 68 Volkswagen Group Germany Motor vehicles 176 656 446 555 211 488 261 560 317 800 572 800 58.6 9 66 Chevron Corporation United States Petroleum expl./ref./distr. 175 736 253 753 122 982 211 664 32 600 64 600 59.3 10 36 Eni SpA Italy Petroleum expl./ref./distr. 141 021 190 125 109 886 152 313 56 509 83 887 71.2 11 73 Enel SpA Italy Electricity, gas and water 140 396 226 006 61 867 106 924 37 125 71 394 57.3 12 17 Glencore Xstrata PLC Switzerland Mining & quarrying 135 080 154 932 153 912 232 694 180 527 190 000 82.8 13 3 Anheuser-Busch InBev NV Belgium Food, beverages and tobacco 134 549 141 666 39 414 43 195 144 887 154 587 93.3
14 97 EDF SA France
Utilities (Electricity, gas and water)
130 161 353 574 46 978 100 364 28 975 158 467 34.0
15 1 Nestlé SA Switzerland Food, beverages and tobacco 124 730 129 969 98 034 99 669 322 996 333 000 97.1
16 33 E.ON AG Germany
Utilities (Electricity, gas and water)
124 429 179 988 115 072 162 573 49 809 62 239 73.3
17 75 GDF Suez France
Utilities (Electricity, gas and water)
121 402 219 759 72 133 118 561 73 000 147 199 55.2
18 59 Deutsche Telekom AG Germany Telecommunications 120 350 162 671 50 049 79 835 111 953 228 596 61.9 19 64 Apple Computer Inc United States Electrical & electronic equipment 119 918 207 000 104 713 170 910 50 322 84 400 59.6 20 31 Honda Motor Co Ltd Japan Motor vehicles 118 476 151 965 96 055 118 176 120 985 190 338 e 74.3
Which do you think are the largest TNCs in the world (2013)?
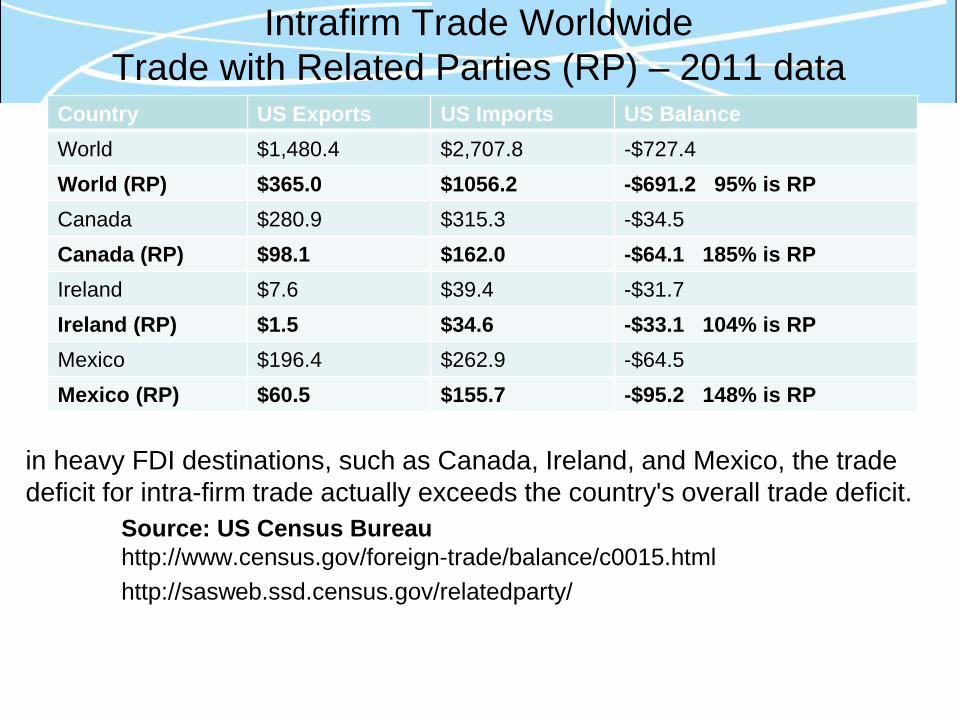
Intrafirm Trade Worldwide Trade with Related Parties (RP) – 2011 data
in heavy FDI destinations, such as Canada, Ireland, and Mexico, the trade deficit for intra-firm trade actually exceeds the country's overall trade deficit. Source: US Census Bureau http://www.census.gov/foreign-trade/balance/c0015.html http://sasweb.ssd.census.gov/relatedparty/
Country US Exports US Imports US Balance World $1,480.4 $2,707.8 -$727.4 World (RP) $365.0 $1056.2 -$691.2 95% is RP Canada $280.9 $315.3 -$34.5 Canada (RP) $98.1 $162.0 -$64.1 185% is RP Ireland $7.6 $39.4 -$31.7 Ireland (RP) $1.5 $34.6 -$33.1 104% is RP Mexico $196.4 $262.9 -$64.5 Mexico (RP) $60.5 $155.7 -$95.2 148% is RP
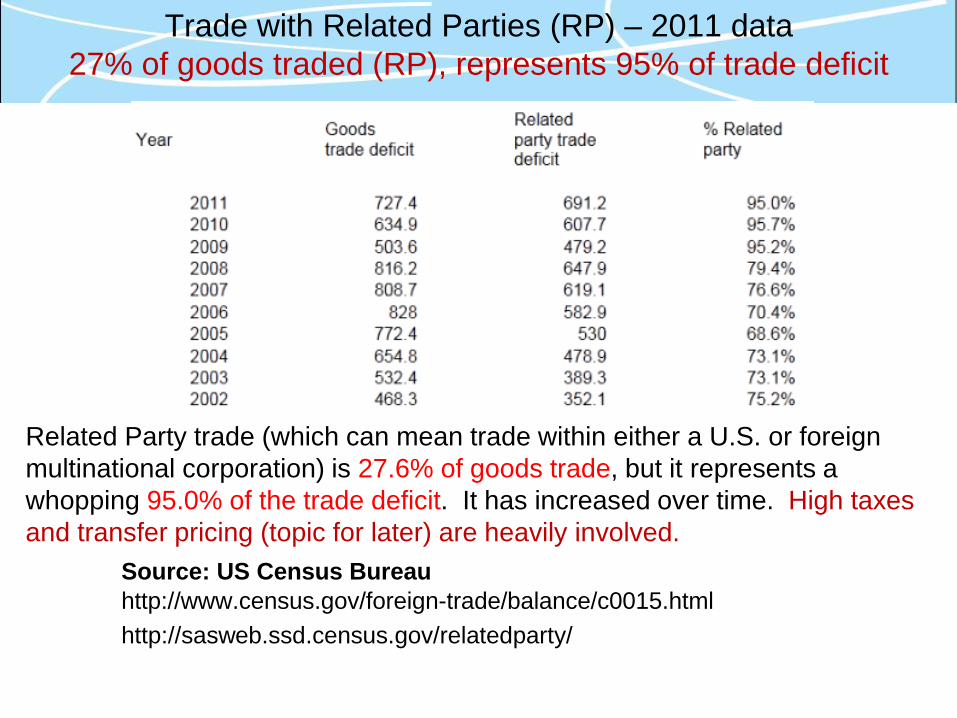
Trade with Related Parties (RP) – 2011 data 27% of goods traded (RP), represents 95% of trade deficit
Related Party trade (which can mean trade within either a U.S. or foreign multinational corporation) is 27.6% of goods trade, but it represents a whopping 95.0% of the trade deficit. It has increased over time. High taxes and transfer pricing (topic for later) are heavily involved.
Source: US Census Bureau http://www.census.gov/foreign-trade/balance/c0015.html http://sasweb.ssd.census.gov/relatedparty/
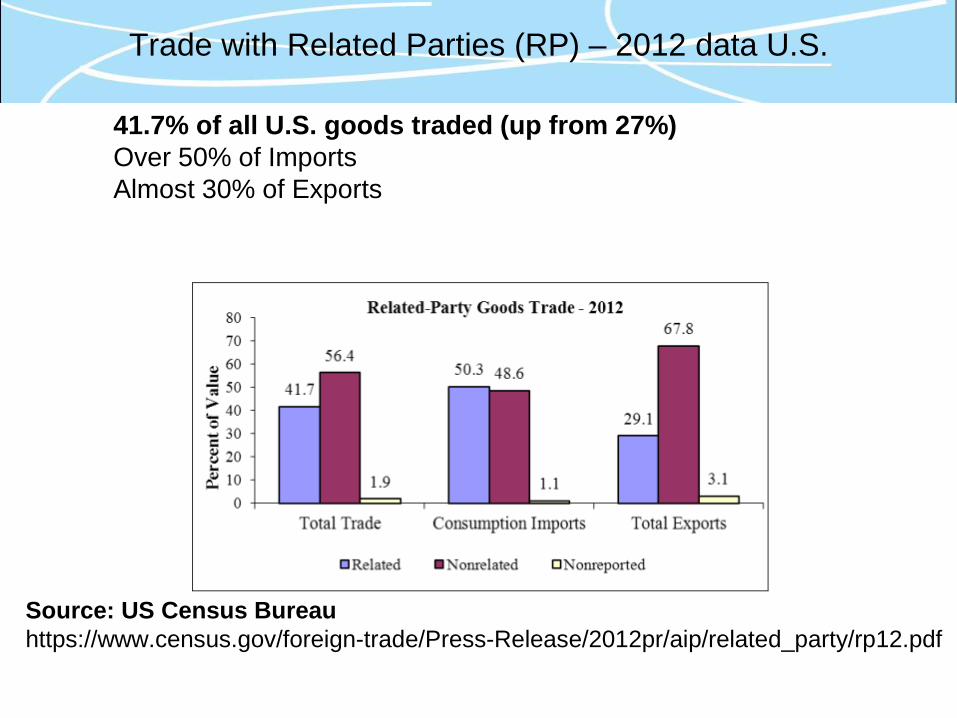
Trade with Related Parties (RP) – 2012 data U.S.
Source: US Census Bureau https://www.census.gov/foreign-trade/Press-Release/2012pr/aip/related_party/rp12.pdf
41.7% of all U.S. goods traded (up from 27%) Over 50% of Imports Almost 30% of Exports
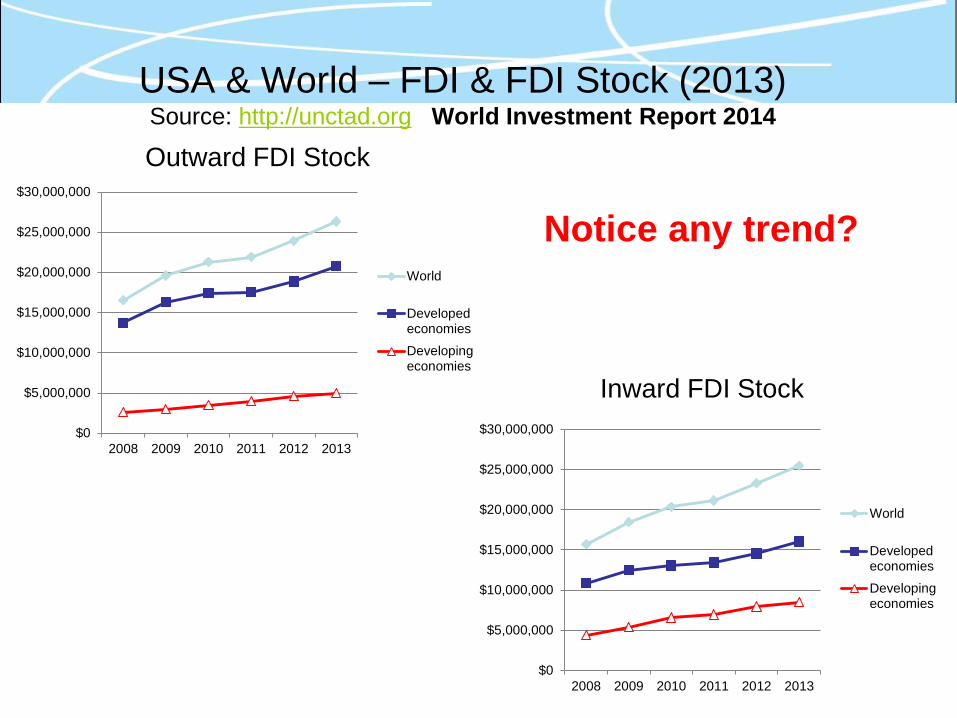
USA & World – FDI & FDI Stock (2013) Source: http://unctad.org World Investment Report 2014
$0
$5,000,000
$10,000,000
$15,000,000
$20,000,000
$25,000,000
$30,000,000
2008 2009 2010 2011 2012 2013
World
Developedeconomies
Developingeconomies
Outward FDI Stock
$0
$5,000,000
$10,000,000
$15,000,000
$20,000,000
$25,000,000
$30,000,000
2008 2009 2010 2011 2012 2013
World
Developedeconomies
Developingeconomies
Inward FDI Stock
Notice any trend?
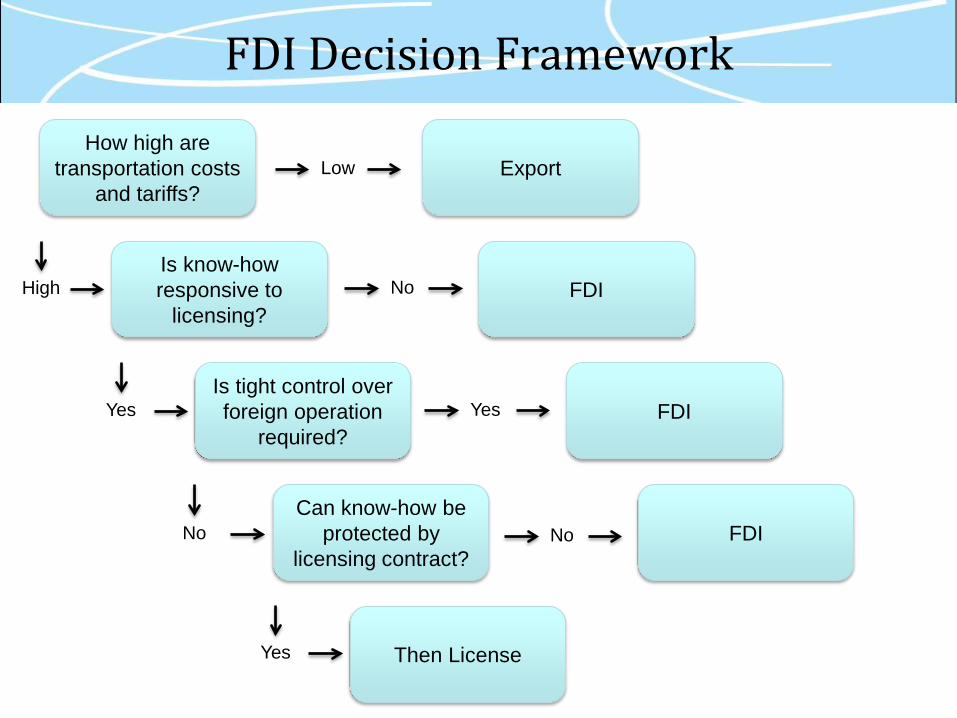
FDI Decision Framework
How high are transportation costs
and tariffs? Export
Is know-how responsive to
licensing? FDI
FDI
FDI Is tight control over foreign operation
required?
Can know-how be protected by
licensing contract?
Then License
High
Low
Yes
Yes
No
No
No
Yes
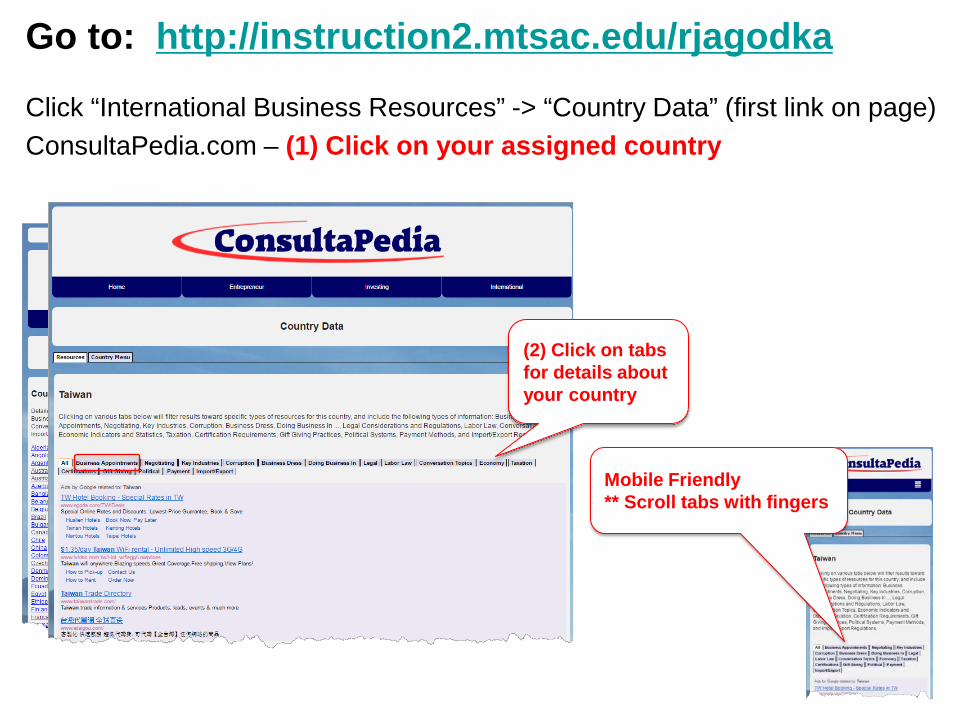
Go to: http://instruction2.mtsac.edu/rjagodka
Click “International Business Resources” -> “Country Data” (first link on page) ConsultaPedia.com – (1) Click on your assigned country
(2) Click on tabs for details about your country
Mobile Friendly ** Scroll tabs with fingers