forefront - india hedge fund 2012
DESCRIPTION
Study of Hedge Fund Industry in India 2012TRANSCRIPT

India Hedge Fund 2012 Global Ideas. Local Opportunities.
CAPITAL MANAGEMENT

2 | P a g e
Table of Contents
CAPITAL MANAGEMENT
Introduction About India Hedge Fund 2012
Globally hedge funds are an important pillar of the alternative asset management industry and a key
component of a sophisticated investor’s asset allocation. In India however, this asset class has been
virtually absent, partially because of the focus on long only investing and partially because of the lack of a
clean regulated hedge fund structure. SEBI’s proposed AIF regulations however are poised to change this
and give the hedge fund industry a real chance to provide something new to investors and wealth
managers.
No financial asset class can grow without support from the entire ecosystem – regulators, wealth
managers and investors – and meaningful guidance on how to understand, evaluate and participate in this
asset class. India Hedge Fund 2012: Global Ideas, Local Opportunities is Forefront’s small contribution
towards investor education on alternative investments. A focal point of this report is a detailed
breakdown of global hedge fund strategies that will find their way into the Indian markets. We hope this
makes for valuable reference material and great reading!
About Forefront Capital Management
Forefront Capital Management is a SEBI registered portfolio management firm focused on alternative
investing in the Indian public markets. Forefront was founded in 2009 by three Wharton graduates who
were hedge fund managers at two of the largest global funds – Goldman Sachs Asset Management (New
York) and AQR Capital Management (Greenwich). Forefront was founded with the goal of bringing
innovative and best in class global investment strategies to the Indian market. The firm has focused on
providing investment innovation in scalable and transparent products that fit into India’s regulatory
framework. Since 2009 Forefront has created a range of unique strategies for the Indian markets and has a
diverse pan-India client base of high net worth individuals, family offices and institutions.

3 | P a g e
Table of Contents
CAPITAL MANAGEMENT
Hedge Fund Strategy Basics .................................................. 4
Evaluating a Hedge Fund ........................................................ 7
Strategy Drilldown .............................................................. 10
Equity Futures ...................................................................................... 11
Equity Options ..................................................................................... 17
Arbitrage .............................................................................................. 21
Commodities and Currencies ............................................................... 26
Multi Asset Class .................................................................................. 28
Multi Strategy Funds ............................................................ 29
References and Disclosures................................................... 30

4 | P a g e
Hedge Fund Strategy Basics
CAPITAL MANAGEMENT
Demystifying Hedge Fund Strategies
Hedge funds have always had something exotic about them. But in reality their goals are very simple:
positive annual returns, low volatility and capital preservation. Hedge funds achieve this by trading a range
of strategies across available asset classes – equities, commodities, currencies, debt and a range of
financial instruments – futures, options, swaps, forwards and other derivatives. Different hedge funds
have different investment styles (fundamental, systematic, quantitative) and run different investment
strategies, some of which we cover in this publication. Globally the number of hedge funds has grown from
under 3,000 in 1995 to more than 9,000 today, and the hedge fund industry manages over USD 1 trillion in
assets.
What’s Different?
Because of India’s regulatory structure domestic investors have typically seen only long only equities either
through a mutual fund, direct equity or PMS route. These strategies hold only cash equities typically for
the long term. Regardless of the investment process which can vary from bottom up stock picking to
purely system driven, these strategies are long only relative return strategies. Over the long term they
have done very well, and in general buy and hold strategies do well particularly in a growing equity market.
The issue, as many investors are discovering is, is the length of time and starting point. Market timing –
when you buy – is critical. Investors who bought in December 2007 at the peak of the markets vs.
investors who bought in October 2008 at the absolute low, will have a very different 5 year return on their
portfolios. Standing in December 2011, the annualized five year return on the NIFTY was 3.1%, a
depressing number for long term investors. As for the manager, the best they can do in a long only setting
is outperform the index – if the fund declines, their portfolios will decline less than the benchmark.
Contrary to long only managers, hedge fund managers focus on risk adjusted absolute returns – the
objective is to increase capital value rather than to beat a benchmark. Globally as a result hedge fund
managers charge performance fees on the absolute returns generated, whereas long only managers
charge only fixed fees. The heavy performance fee component keeps hedge fund manager incentives
aligned to investor incentives.
Hedging and leverage are two key tools used by hedge fund managers to generate positive absolute
returns. Hedging focuses on protecting the portfolio against sharp movements in markets. On the long
side the manager will buy assets that have good long term prospects and on the short side sell assets with
poor prospects. The latter can be implemented with futures and options in the Indian market. Hedging is
essential to keep the absolute return characteristics of the portfolio intact and generate absolute returns in
poor markets.
Since a hedge fund manager focuses on hedged opportunities that are immune to market returns, these
opportunities involve small trading margins. In themselves the small trading margins do not generate
5 | P a g e
Hedge Fund Strategy Basics
CAPITAL MANAGEMENT
meaningful absolute returns, but when leveraged they do. Leverage is essentially taking on positions
larger than the capital deployed. For instance, a typically mutual fund manager takes Rs. 1 crore of
positions for every Rs. 1 crore of capital he is given. A hedge fund manager on the other hand may take Rs.
2 crores of positions, resulting in two times the leverage. Higher positions or leverage comes with higher
risk and risk management is the hallmark of a good hedge fund manager. In fact risk adjusted returns are
the most meaningful metric of hedge fund manager performance.
Do hedge funds create negative externalities?
While hedge funds have always been cited as a cause for market crashes and associated with negative
externalities, much of this is myth. The U.S. Securities and Exchange Commission (SEC) recently determined
that there is little evidence that hedge funds can move markets, and several research studies have found
no evidence that hedge funds were a cause of the Asian crisis or other world economic turmoil.
A counterpoint is that hedge fund activity makes financial markets more efficient and, in many cases, more
liquid. Not only do hedge funds contribute to the adjustments of markets when they overshoot, they also
help banks and other creditors unbundle risks related to real economic activity by actively participating in
the market of securitized financial instruments. And because hedge fund returns in many cases are less
correlated with broader debt and equity markets, hedge funds offer more traditional investment
institutions a way to reduce risk by providing portfolio diversification.
Where do these strategies fit into my asset allocation?
A natural question to ask with a new investment class is where does this fit into my or my client’s asset
allocation. For many strategies, the answer is it is a new category of absolute return strategies that falls in
the alternatives bucket. These strategies cannot be classified as fixed income because they are risk taking
strategies (with the exception of arbitrage). Nor do they fall into the equity category even if the risk is
comparable because they have no correlation to equities (with the exception of strategies such as 130/30
Equity and Buy-Write Equity which explicitly have equity beta). In fact, bucketing them with equities will
confuse clients because they will compare the returns to the market and wonder why they are down in a
month when the market is up 10%!
How do such strategies make a difference to my portfolio?
While each hedge fund strategy has a different risk / return / beta profile as discussed in the strategy
drilldown, adding a hedge fund strategy to your portfolio can improve diversification, reduce portfolio risk
and increase the risk adjusted return of your portfolio. The basic portfolio example below illustrates this.

6 | P a g e
Hedge Fund Strategy Basics
CAPITAL MANAGEMENT
Assume a client has a basic portfolio of equities (NIFTY) and debt (one year fixed deposits), with a 70% and
30% allocation respectively. The return, risk and risk adjusted return of the individual assets as well as the
portfolio is below (assuming asset returns since 1998).
Equities Debt Portfolio
Weight 70% 30% 100% Return 18% 8% 15%
Risk 27% 1% 19%
Sharpe Ratio 0.66 12.80 0.79
Equities and debt are uncorrelated assets so combining them together in a portfolio yields a portfolio with
lower risk than equities, and higher risk adjusted return than equities. Now assume the client shifts 25% of
his portfolio to two hedge fund strategies – for the sake of argument Strategy 1 (Long Short Equities) and
Strategy 2 (Long Short Commodities). Both these strategies deliver a risk adjusted return of 1.0 in the long
term, are uncorrelated to each other as well as to other asset classes like debt, equity and gold. The new
portfolio characteristics are as below.
Equities Debt Strategy 1 Strategy 2 Portfolio
Weight 52% 22% 12.5% 12.5% 100% Return 18% 8% 14% 16% 15%
Risk 27% 1% 14% 16% 14%
Sharpe Ratio 0.66 12.80 1.00 1.00 1.04
By adding two new uncorrelated sources of risk, the overall portfolio risk has fallen from 19% to 14%, and
risk adjusted return has gone up from 0.79 to 1.04. Globally institutions enhance this simple example by
building a portfolio of many uncorrelated strategies, thereby maximizing risk adjusted returns.

7 | P a g e
CAPITAL MANAGEMENT
Evaluating A Hedge Fund
Why is hedge fund evaluation important?
Since hedge funds are a new investment class trading both asset classes and instruments that clients,
wealth managers, and sometimes even managers may not completely understand, evaluating hedge funds
thoroughly is important. The metrics for evaluating a hedge fund are different from those for a long only
investment, with manager skill and risk management being a much bigger part of the evaluation process.
The guide below lists the basic parameters that should be understood in any hedge fund like product.
Target returns
Clients invest for absolute returns so returns are one of the first parameters that should be evaluated. It’s
important to understand the level of absolute return the strategy can generate and whether it is
meaningful to you as an investor. Because hedge fund strategies involve small trading margins they can
generate positive absolute returns, but the level of those returns may not be meaningful (for instance,
some arbitrage strategies consistently generate positive absolute returns but often in line with fixed
income rates). It’s also important to understand the investment period over which those returns can be
expected because hedge fund strategies vary from very high frequency to much longer term. A poor
understanding of the time horizon only leads to frustration among investors and wealth managers. Finally
it’s important to understand what the returns will look like in different markets – when the strategy will
perform and when it will not. No risk taking strategy is always up, and a prior understanding of when the
strategy doesn’t work will make for a much more peaceful experience.
Risk
The importance of understanding risk in hedge fund strategies cannot be overemphasized enough. Risk is
best measured by the annualized standard deviation of the realized returns. As an example, a fixed
deposit has a risk of nearly zero and the NIFTY over 15 years has a realized risk of over 25%. By comparing
the risk of your strategy to asset classes like NIFTY, gold, as well as balance funds / monthly income plans,
you will have a good sense of what to expect as far as monthly and annual returns and drawdown
expectations. Quantitative or systematic managers will be able to give you an assessment of risk from
their backtest and fundamental managers should also be able to give you a target risk number. Hedge
funds often make investments with asymmetric payoffs, hence analyzing worst case drawdowns, value-at-
risk and higher moments such as skewness and kurtosis are also important.
Leverage
Leverage and risk go hand in hand but they are not the same thing. A strategy can be very risky but involve
no leverage and vice-versa. Leverage is important to understand because in a leveraged strategy, one can
lose more capital than initially deployed. This will result in margin calls, which if not met can lead to
8 | P a g e
CAPITAL MANAGEMENT
Evaluating A Hedge Fund
positions being shut down. In hedge fund strategies, there is a great temptation to keep scaling up
leverage to scale up returns, but a good hedge fund manager will push back and maintain a reasonable
level of leverage. One way to evaluate leverage is to ask a manager what kind of loss on a daily or monthly
basis it would take to get a margin call, and then see if there is enough of a safety margin built in.
In our analysis of different hedge fund strategies we look at the gross leverage of each strategy. For our
purpose, every instrument contributes to gross leverage regardless of how similar other instruments in the
portfolio are. So for example, a long position in Reliance and a corresponding short position in Reliance
Futures would have a gross leverage of 200% even though the position is perfectly hedged.
Leverage is also a robust risk metric because it is easy to calculate and does not make any assumptions on
the distribution of returns.
Risk adjusted returns
Risk adjusted returns or Sharpe ratio (the average annual return divided by the average annual risk) is a
good measure of manager skill and performance in a hedge fund context. The risk adjusted returns
measure the value a manager has added for each unit of risk taken. Sharpe ratios can vary from 0.5 to 1
for low frequency strategies to much higher for higher frequency strategies. Two managers can generate
15% returns but if one is taking half the risk of the other, he has done a far superior job. While a backtest
can give you an idea of the Sharpe ratio a strategy can generate, the proof here is really in the pudding.
When working with a manager it’s very important to a sanity check on the expectedly Sharpe ratio to see if
they are reasonable. For low frequency funds for instance, a range between 0.6 to 1 is what a manager
can reasonably deliver over the long term.
Given the asymmetric nature of some hedge fund strategies, alternative measures of risk adjusted returns
should also be used. These include the Sortino ratio (return per unit of downside volatility) and the Sterling
ratio (average return / maximum drawdown).
Beta and correlation to existing asset classes
Both beta and correlation measure the strategy’s sensitivity to existing asset classes such as equities, debt,
commodities and currencies. Since hedge funds are at least partially (if not fully) hedged strategies to
respective asset classes, they should have low betas / correlations to other asset classes. For instance long
short equity funds depending on whether they are pure market neutral or slightly long biased funds should
have a very low beta to equities. It’s important to measure beta relative to the right asset class. For a
commodity long short fund for instance, the beta to gold, crude and copper as well as a major commodity
index should be low. Measuring beta gives you a sense of whether a manager is sticking to the hedge fund
mandate and what kind of hidden risks there are. For instance, an equity market neutral fund with a beta

9 | P a g e
CAPITAL MANAGEMENT
Evaluating A Hedge Fund
of 0.7 to the NIFTY is doing something deeply wrong. Again a back test can give you an idea of what to
expect here and realized returns can do a check on whether the manager is following the strategy.
Liquidity and trading implementation
Since hedge fund strategies trade exotic asset classes and instruments understanding the liquidity and
trading costs of these instruments is important. Ideally for an open ended fund asset classes and
instruments should be liquid enough that the portfolio can be exited in 3-5 days without impacting the
portfolio adversely. Hedge funds are often not locked in vehicles and can see redemptions, and
redemptions from one investor should not hurt existing investors because of liquidity.
Tail risk
Tail risk was an alien concept to investors until the financial crisis of 2008 when strategies with heavy tail
risks cost clients a fortune. Tail risk is the risk of a strategy losing large amounts of money when an
extremely unexpected event happens. The probability of the loss is very low but the magnitude is usually
very high. A number of strategies for instance appear innocuous but have large hidden tail risks. For
instance, options writing is a strategy that generates a very innocuous constant return but loses large
amounts of money when the market has a significant directional move. A manager should be asked if
strategies are insulated for tail risk.
Experience
While every strategy can be evaluated on quantitative and qualitative parameters, ultimately a strategy is
run by a manager. More so than other fields, genuine asset management experience in running the
strategy and trading it with client money will distinguish a manager in the long run. Experience will help a
manager focus on measuring risks correctly, giving realistic return expectations, protecting tail risk, and
picking up after a drawdown, which is inevitable in every strategy. Hedge fund experience is also very
different from long only experience because of the important role of risk management and the exotic and
complex nature of the instruments used. Similarly buy side experience will outperform sell side
experience because hedge fund asset management raises complex issues that are difficult to see on a
brokerage desk.

10 | P a g e
Strategy Drilldown
CAPITAL MANAGEMENT
Overview
The list of existing hedge fund strategies are countless and one edition of this publication cannot do justice
to them. What we have attempted to do is to look at the major global hedge fund strategies that could be
applied to the Indian markets in light of the new Alternative Investment Fund regulations. Given the
regulations are yet to take complete shape, we have not attempted to answer what is regulatory
permissible and what is not.
Our goal is to give investors and wealth managers a flavour of what can and may be done. We have also
evaluated these strategies on the basic hedge fund evaluation parameters so that clients and wealth
managers know what to look out for. The classes of strategies covered are:
Strategy Risk Asset Allocation
Category Beta Leverage
Time
Horizon
Equity Futures
130-30 Equities High Equities 0.9 – 1.0 1.6 x 3 yrs.
Long Short Equities Med – High Absolute Return 0.0 – 0.6 1x – 2.5x 18 mo.
Short Biased Equities High Equities -1.0 – 0.0 Max: 2x 3 yrs.
Directional Equities High Absolute Return 0.0 Max: 1x 1-2 yrs.
Pairs Trading Med Absolute Return 0.0 Depends 18 mo.
Managed Futures High Absolute Return 0.0 1x – 2.5x 18 mo.
Equity Options
Buy-Write Equities Med – High Equities 0.6 – 1.0 1x - 2x 3 yrs.
Volatility Trading High Absolute Return 0.0 1x – 1.5x 18 mo.
Correlation Trading High Absolute Return 0.0 1x – 1.5x 18 mo.
Black Swan Protection Limited Insurance Negative Max: 1x 3 yrs.
Arbitrage
Cash Futures Arbitrage Low Fixed Income 0.0 Max: 2x 3-6 mo.
Pure Arbitrage Low Fixed Income 0.0 Depends 3-6 mo.
Commodity Arbitrage Low Fixed Income 0.0 Max: 2x 3-6 mo.
Statistical Arbitrage Med – High Absolute Return 0.0 Depends 18 mo.
Event Arbitrage Med – High Absolute Return 0.0 Max: 1x 18 mo.
Commodities and Currencies
Long Short Commodities Med – High Absolute Return 0.0 1x – 1.5x 18 mo.
Long Short Currencies Med – High Absolute Return 0.0 2x – 5x 18 mo.
Multi Class
Tactical Asset Allocation Med Absolute Return 0.0 – 0.5 1x – 2x 18 mo.

11 | P a g e
Equity Futures
CAPITAL MANAGEMENT
130-30 Equities
Characteristic Description
Strategy
Description
A mutual fund is limited to holding no more than 10% in a single stock and not taking
net short positions in stocks. 130/30 Equity relaxes these constraints by allowing
managers to invest more than 10% in high conviction ideas and create additional
alpha by shorting stocks that they are bearish on.
Economic
Rationale
If a long-only manager has skill in beating his benchmark, then giving him more
freedom to express his views on high conviction ideas and short side ideas should
lead to higher outperformance.
Assets Held Long: Single stock futures or cash equities
Short: Single stock futures
Sample
Position
Long a diversified portfolio of fundamentally strong stocks, short stocks that are
overvalued or that have weak fundamentals.
Target Beta 0.9 – 1.0
Unique Risks Cash management is important especially if a large portion of the portfolio’s long
positions are held in cash equities.
Performs
Well In...
Rising equity markets (in absolute terms) and when the manager’s stock and sector
picks are correct (relative to the benchmark).
Performs
Poorly In...
Falling equity markets (in absolute terms) and when the manager’s stock and sector
picks go wrong (relative to the benchmark).
Client Profile Equity like product for moderate to aggressive clients.
Asset
Allocation
Fits into the equity portion of a client’s asset allocation along with mutual funds.
Trading
Frequency
Portfolios are rebalanced at least once a month to coincide with the futures roll.
Since the portfolio views are of an intermediate term, portfolios will be similar
month-to-month.
Is the strategy
opportunistic?
No
Leverage
Taken
Gross Leverage = 1.6x
Risk / Return
Profile
Has a similar risk / return profile to the NIFTY or a traditional diversified equity
mutual fund. Should aim to outperform the benchmark over long periods.
Investment
Horizon
3 Years
Points to
consider
The manager’s stock picking ability and cash management are important.
Strategy Drilldown
Strategy Drilldown
Strategy Drilldown

12 | P a g e
Equity Futures
CAPITAL MANAGEMENT
Long Short Equities / Equity Market Neutral
Characteristic Description
Strategy
Description
Long a portfolio of stocks that are undervalued and/or have strong fundamentals and
short a portfolio of stocks that are overvalued and/or have weak fundamentals.
Focuses purely on a manager’s stock selection and sector rotation abilities rather
than mixing it with market beta like in a long-only mutual fund.
Economic
Rationale
Undervalued stocks with strong fundamentals will outperform overvalued stocks
with weak fundamentals over a market cycle.
Assets Held Long: Single stock futures or cash equities.
Short side: Single stock futures or index futures/options to hedge the equity beta.
Sample
Position
Rank PSU Banks based on their Price / Book ratios. Take long positions in banks with
low Price / Book values and short positions in banks with high Price / Book values.
Target Beta Long-Short Equity portfolios are often run with a long-equity bias (i.e. Beta between
0 and 0.6). Equity market neutral is a special case of Long-Short Equities where the
manager targets a beta of 0 at all times.
Unique Risks The strategy presents operational risks because managing a book of 40+ futures
positions can be challenging if the manager’s systems are not up to par.
Performs
Well In...
In fundamental driven markets, when there are flights to quality stocks and during
earnings if the positions are related to fundamental factors.
Performs
Poorly In...
In speculative or junk led rallies. The strategy will also do poorly if there is a rapid
shift in a company’s fundamental prospects.
Client Profile Moderate (low-leverage) to aggressive (high-leverage) clients
Asset
Allocation
Absolute return allocation.
Trading
Frequency
Portfolios are rebalanced at least once a month to coincide with the futures roll.
Since the views are intermediate term, portfolios are similar month-to-month.
Is the strategy
opportunistic?
No.
Leverage
Taken
Leverage can be varied based on a client’s risk profile. A long-short portfolio with
gross leverage of 1x has an annualized risk of 5% (similar to an aggressive monthly
income plan). A portfolio with gross leverage of 2.5x has an annualized risk of 12.5%
(similar to a balanced fund).
Risk / Return
Profile
Should deliver 15%-20% with leverage over an 18 month period regardless of what
the NIFTY does. The strategy could be down in a given month or quarter.
Investment
Horizon
18 months.
Points to
consider
Investment process, portfolio construction and implementation are very important
points to consider when evaluating an equity long-short manager.
Strategy Drilldown
Strategy Drilldown
Strategy Drilldown

13 | P a g e
Equity Futures
CAPITAL MANAGEMENT
Short Biased Equities
Characteristic Description
Strategy
Description
Short overvalued and fundamentally weak companies.
Economic
Rationale
The market is structurally biased to be long equities. The strategy attempts to profit
from companies that are overvalued, highly levered, have large pledged promoter
holdings, faulty accounting, weak management or unsound business models.
Assets Held Single stock options and futures, index futures.
Sample
Position
Short a diversified portfolio of stocks, long NIFTY futures.
Target Beta -1.0 to 0.
Unique Risks Cash management is important because futures positions could suffer mark-to-
market losses if stocks remain irrationally priced longer than expected. Stocks could
also be propped up by unscrupulous management.
Performs
Well In...
Bear markets, rising interest rate environments and when liquidity is tight.
Performs
Poorly In...
Bull markets and speculative rallies.
Client Profile Aggressive clients.
Asset
Allocation
Equity allocation.
Trading
Frequency
Monthly or whenever there are market opportunities.
Is the strategy
opportunistic?
Partially – Segments of the market are always overvalued but stock specific
opportunities appear from time to time.
Leverage
Taken
Max Gross Leverage = 2x
Risk / Return
Profile
Similar to a short NIFTY position.
Investment
Horizon
3 years.
Points to
consider
The manager’s forensic accounting, stock picking ability and cash management are
important.
14 | P a g e
Equity Futures
CAPITAL MANAGEMENT
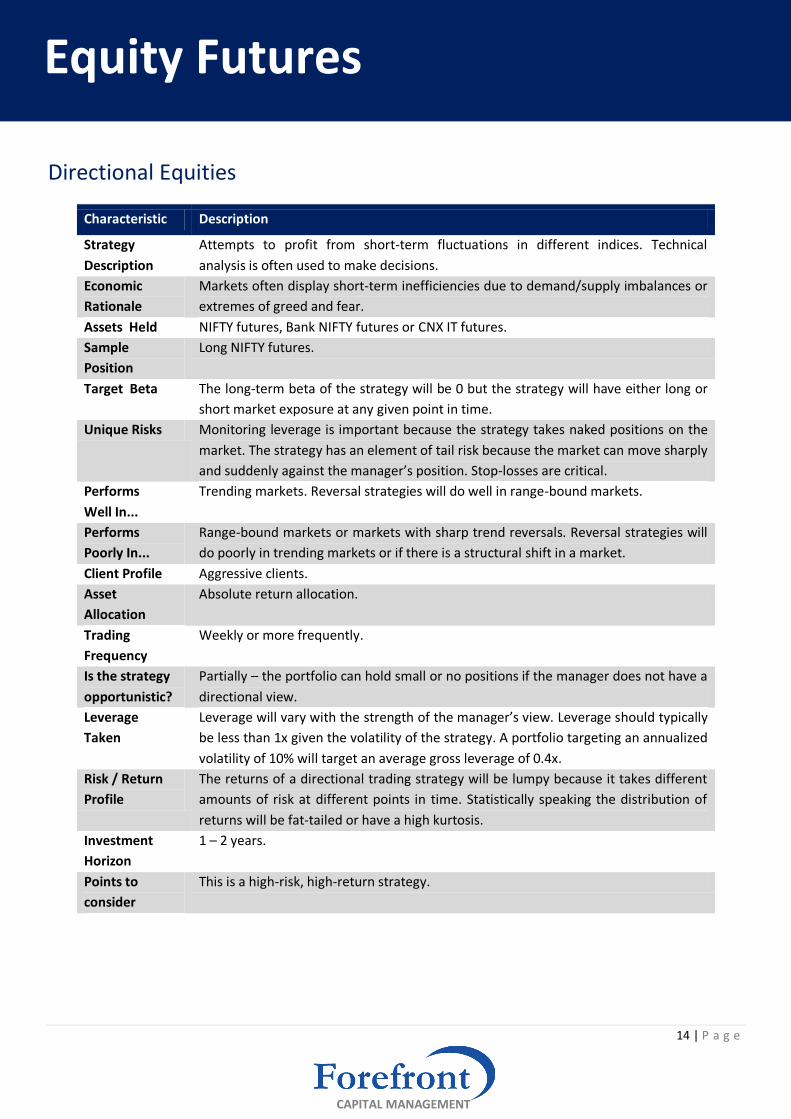
Directional Equities
Characteristic Description
Strategy
Description
Attempts to profit from short-term fluctuations in different indices. Technical
analysis is often used to make decisions.
Economic
Rationale
Markets often display short-term inefficiencies due to demand/supply imbalances or
extremes of greed and fear.
Assets Held NIFTY futures, Bank NIFTY futures or CNX IT futures.
Sample
Position
Long NIFTY futures.
Target Beta The long-term beta of the strategy will be 0 but the strategy will have either long or
short market exposure at any given point in time.
Unique Risks Monitoring leverage is important because the strategy takes naked positions on the
market. The strategy has an element of tail risk because the market can move sharply
and suddenly against the manager’s position. Stop-losses are critical.
Performs
Well In...
Trending markets. Reversal strategies will do well in range-bound markets.
Performs
Poorly In...
Range-bound markets or markets with sharp trend reversals. Reversal strategies will
do poorly in trending markets or if there is a structural shift in a market.
Client Profile Aggressive clients.
Asset
Allocation
Absolute return allocation.
Trading
Frequency
Weekly or more frequently.
Is the strategy
opportunistic?
Partially – the portfolio can hold small or no positions if the manager does not have a
directional view.
Leverage
Taken
Leverage will vary with the strength of the manager’s view. Leverage should typically
be less than 1x given the volatility of the strategy. A portfolio targeting an annualized
volatility of 10% will target an average gross leverage of 0.4x.
Risk / Return
Profile
The returns of a directional trading strategy will be lumpy because it takes different
amounts of risk at different points in time. Statistically speaking the distribution of
returns will be fat-tailed or have a high kurtosis.
Investment
Horizon
1 – 2 years.
Points to
consider
This is a high-risk, high-return strategy.

15 | P a g e
Equity Futures
CAPITAL MANAGEMENT
Pairs Trading
Characteristic Description
Strategy
Description
When the prices of two highly correlated stocks diverge, a pairs trading strategy
attempts to profit from their convergence.
Economic
Rationale
Highly correlated stocks that are in the same sector and have similar businesses must
move together. Prices can diverge temporarily because of demand/supply
imbalances but they must converge back eventually.
Assets Held Single stock futures.
Sample
Position
Long HEROMOTOCO and Short BAJAJ-AUTO in the ratio of 1.3:1
Target Beta Zero.
Unique Risks Pairs Trading is exposed to event risk because the correlation between two stocks
can breakdown if one of them undergoes a structural change due to a change in
business, management or regulation.
Performs
Well In...
Benign markets and when the correlations between stocks are stable.
Performs
Poorly In...
Periods when there is stock specific news, event risk and when correlations break
down.
Client Profile Moderate risk clients.
Asset
Allocation
Absolute return allocation.
Trading
Frequency
As and when opportunities arise. Positions are rolled monthly.
Is the strategy
opportunistic?
Yes.
Leverage
Taken
Depends on the number of pairs.
Risk / Return
Profile
A single pair trade position can have 75% of the volatility of the equity market. But a
portfolio of 5 pairs will have an annualized standard deviation of 8%-10% (similar to
the volatility of a portfolio of 1/3rd equities, 1/3rd gold and 1/3rd debt).
Investment
Horizon
18 months.
Points to
consider
Risk management including stop-losses and a qualitative filter to identify structural
breaks are important. How the hedge ratios are determined whether on a value-
neutral, beta-neutral or volatility-neutral basis are also important.

16 | P a g e
Equity Futures
CAPITAL MANAGEMENT
Managed Futures
Characteristic Description
Strategy
Description
Long stocks with positive price momentum, short stocks with negative price
momentum. The strategy can also be applied to commodities and currencies.
Economic
Rationale
Individual stocks display price momentum because of sustained buying or selling, a
tendency for investors to hold on to losers and sell winners too early and the
tendency for market participants to under react to market news.
Assets Held Single stock futures.
Sample
Position
Long stocks that have risen in the last 3 months, short stocks that have fallen in the
last 3 months.
Target Beta Zero. The strategy could have positive or negative market exposure at any point in
time.
Unique Risks In India, managed futures runs the risk of being the last man holding if a stock is
being manipulated.
Performs
Well In...
Trending markets and in periods of volatility.
Performs
Poorly In...
Range bound markets and tranquil periods.
Client Profile Aggressive clients.
Asset
Allocation
Absolute return allocation.
Trading
Frequency
Weekly or more frequently.
Is the strategy
opportunistic?
No.
Leverage
Taken
Leverage can be varied based on a client’s risk profile. A managed futures book with
gross leverage of 1x has an annualized risk of 5% (similar to an aggressive monthly
income plan). A portfolio with gross leverage of 2.5x has an annualized risk of 12.5%
(similar to a balanced fund).
Risk / Return
Profile
Should return 15%-20% over a 12-18 month period with leverage regardless of what
the NIFTY does. The strategy could be down in a given month or quarter.
Investment
Horizon
18 months.
Points to
consider
Risk management including position sizing and stop losses are important for a
managed futures book.

17 | P a g e
Equity Options
CAPITAL MANAGEMENT
Buy-Write Equities
Characteristic Description
Strategy
Description
Buy a portfolio of stocks and sell out-of-the-money NIFTY call options.
Economic
Rationale
Selling out-of-the-money index call options generates income that helps a long-only manager outperform his benchmark.
Assets Held Cash Equities, Index Call Options.
Sample
Position
Long a diversified portfolio of stocks, short NIFTY call options.
Target Beta 0.6 – 1.0.
Unique Risks Cash management is important because short call option positions could suffer mark-to-market losses.
Performs
Well In...
Moderate bull markets and when implied volatilities are high.
Performs
Poorly In...
Falling equity markets (in absolute terms), in sudden market rallies (relative to the benchmark) and when the manager’s stock and sector picks go wrong (relative to the benchmark).
Client Profile Moderate to aggressive clients.
Asset
Allocation
Equity portion of a client’s asset allocation along with traditional mutual funds.
Trading
Frequency
The cash equity portion of the portfolio is rebalanced whenever there is a change in the manager’s view. The index options are rolled monthly.
Is the strategy
opportunistic?
No.
Leverage
Taken
Max Gross Leverage = 2x but lower levels of leverage can also be taken.
Risk / Return
Profile
Buy-Write Equity has a similar risk / return profile to the NIFTY or a traditional diversified equity mutual fund.
Investment
Horizon
3 years.
Points to
consider
The manager’s stock picking ability and cash management are important.
18 | P a g e
Equity Options
CAPITAL MANAGEMENT
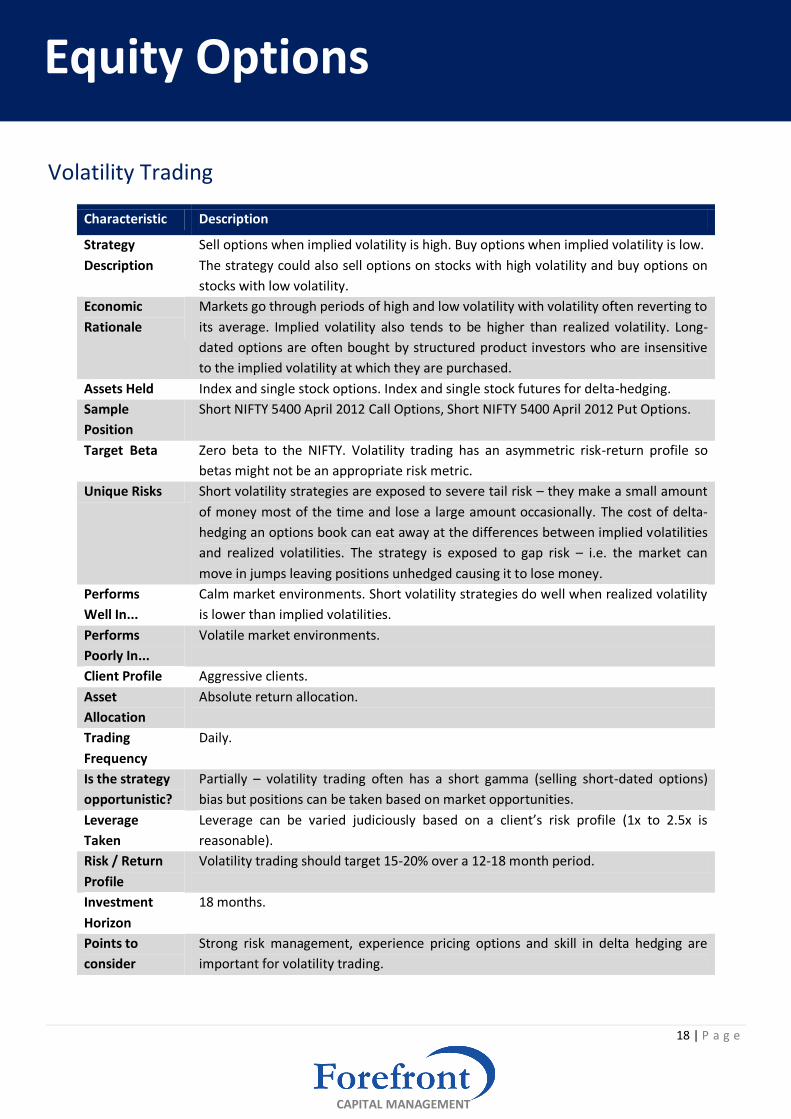
Volatility Trading
Characteristic Description
Strategy
Description
Sell options when implied volatility is high. Buy options when implied volatility is low.
The strategy could also sell options on stocks with high volatility and buy options on
stocks with low volatility.
Economic
Rationale
Markets go through periods of high and low volatility with volatility often reverting to
its average. Implied volatility also tends to be higher than realized volatility. Long-
dated options are often bought by structured product investors who are insensitive
to the implied volatility at which they are purchased.
Assets Held Index and single stock options. Index and single stock futures for delta-hedging.
Sample
Position
Short NIFTY 5400 April 2012 Call Options, Short NIFTY 5400 April 2012 Put Options.
Target Beta Zero beta to the NIFTY. Volatility trading has an asymmetric risk-return profile so
betas might not be an appropriate risk metric.
Unique Risks Short volatility strategies are exposed to severe tail risk – they make a small amount
of money most of the time and lose a large amount occasionally. The cost of delta-
hedging an options book can eat away at the differences between implied volatilities
and realized volatilities. The strategy is exposed to gap risk – i.e. the market can
move in jumps leaving positions unhedged causing it to lose money.
Performs
Well In...
Calm market environments. Short volatility strategies do well when realized volatility
is lower than implied volatilities.
Performs
Poorly In...
Volatile market environments.
Client Profile Aggressive clients.
Asset
Allocation
Absolute return allocation.
Trading
Frequency
Daily.
Is the strategy
opportunistic?
Partially – volatility trading often has a short gamma (selling short-dated options)
bias but positions can be taken based on market opportunities.
Leverage
Taken
Leverage can be varied judiciously based on a client’s risk profile (1x to 2.5x is
reasonable).
Risk / Return
Profile
Volatility trading should target 15-20% over a 12-18 month period.
Investment
Horizon
18 months.
Points to
consider
Strong risk management, experience pricing options and skill in delta hedging are
important for volatility trading.
19 | P a g e
Equity Options
CAPITAL MANAGEMENT
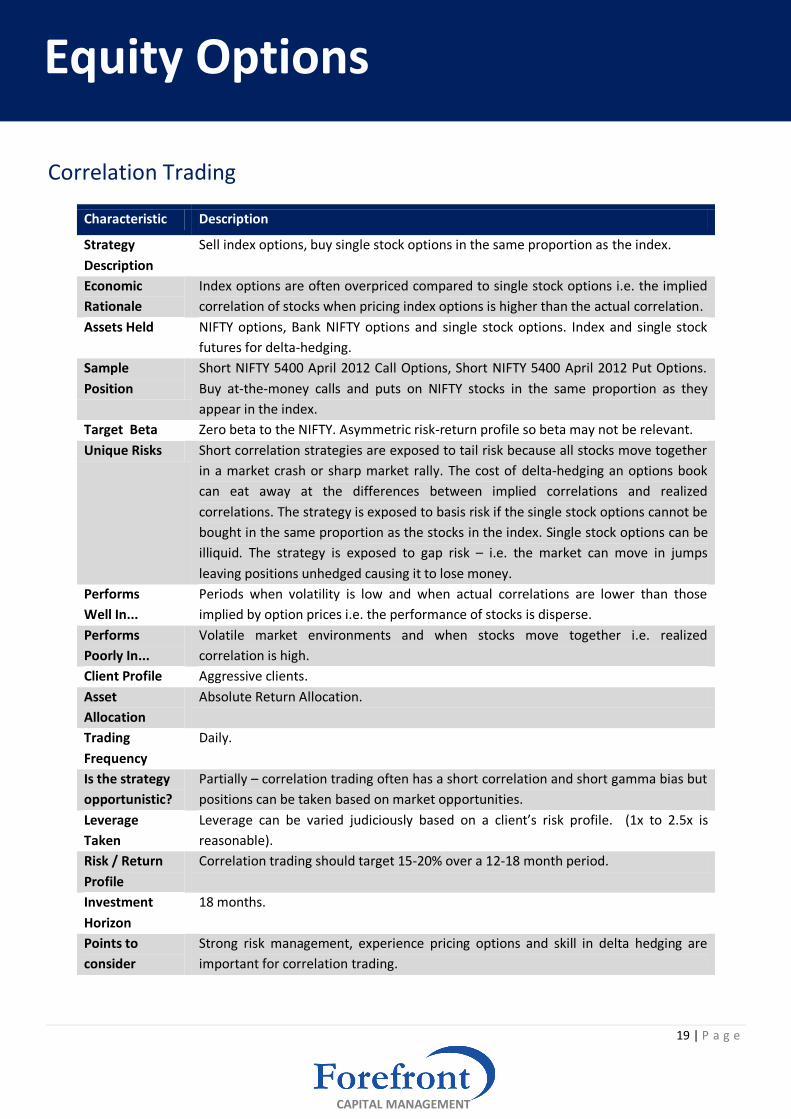
Correlation Trading
Characteristic Description
Strategy
Description
Sell index options, buy single stock options in the same proportion as the index.
Economic
Rationale
Index options are often overpriced compared to single stock options i.e. the implied
correlation of stocks when pricing index options is higher than the actual correlation.
Assets Held NIFTY options, Bank NIFTY options and single stock options. Index and single stock
futures for delta-hedging.
Sample
Position
Short NIFTY 5400 April 2012 Call Options, Short NIFTY 5400 April 2012 Put Options.
Buy at-the-money calls and puts on NIFTY stocks in the same proportion as they
appear in the index.
Target Beta Zero beta to the NIFTY. Asymmetric risk-return profile so beta may not be relevant.
Unique Risks Short correlation strategies are exposed to tail risk because all stocks move together
in a market crash or sharp market rally. The cost of delta-hedging an options book
can eat away at the differences between implied correlations and realized
correlations. The strategy is exposed to basis risk if the single stock options cannot be
bought in the same proportion as the stocks in the index. Single stock options can be
illiquid. The strategy is exposed to gap risk – i.e. the market can move in jumps
leaving positions unhedged causing it to lose money.
Performs
Well In...
Periods when volatility is low and when actual correlations are lower than those
implied by option prices i.e. the performance of stocks is disperse.
Performs
Poorly In...
Volatile market environments and when stocks move together i.e. realized
correlation is high.
Client Profile Aggressive clients.
Asset
Allocation
Absolute Return Allocation.
Trading
Frequency
Daily.
Is the strategy
opportunistic?
Partially – correlation trading often has a short correlation and short gamma bias but
positions can be taken based on market opportunities.
Leverage
Taken
Leverage can be varied judiciously based on a client’s risk profile. (1x to 2.5x is
reasonable).
Risk / Return
Profile
Correlation trading should target 15-20% over a 12-18 month period.
Investment
Horizon
18 months.
Points to
consider
Strong risk management, experience pricing options and skill in delta hedging are
important for correlation trading.
20 | P a g e
Equity Options
CAPITAL MANAGEMENT
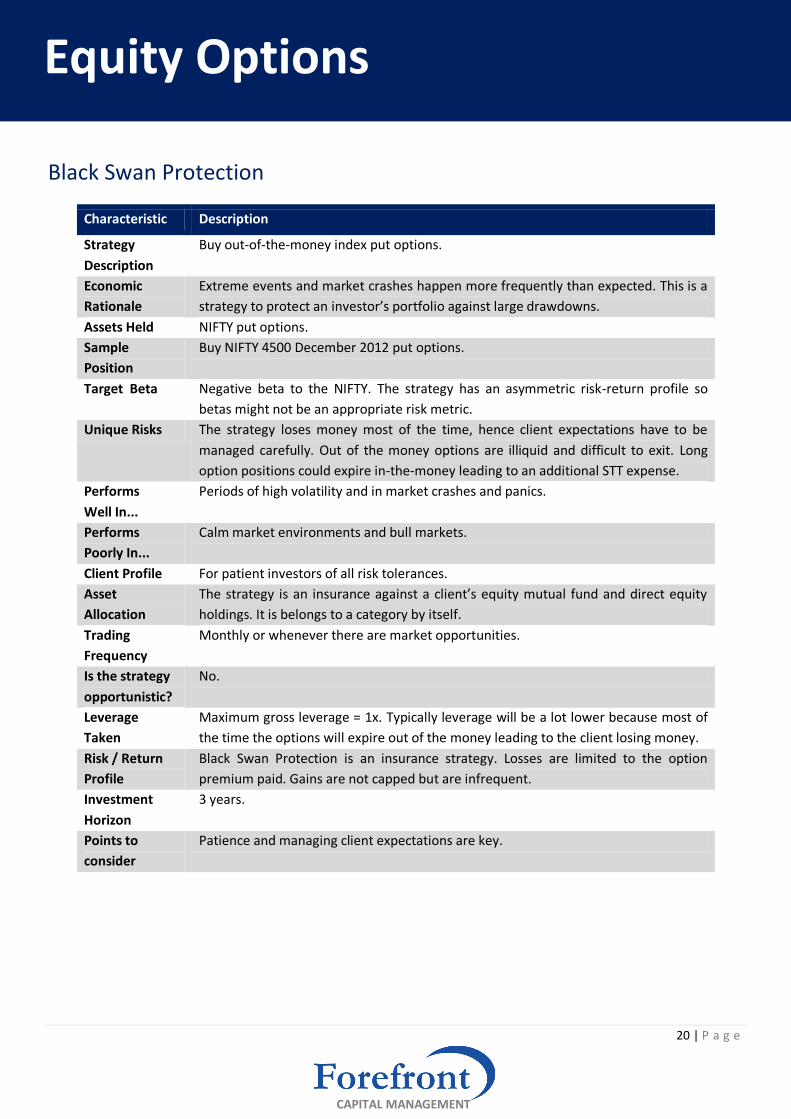
Black Swan Protection
Characteristic Description
Strategy
Description
Buy out-of-the-money index put options.
Economic
Rationale
Extreme events and market crashes happen more frequently than expected. This is a
strategy to protect an investor’s portfolio against large drawdowns.
Assets Held NIFTY put options.
Sample
Position
Buy NIFTY 4500 December 2012 put options.
Target Beta Negative beta to the NIFTY. The strategy has an asymmetric risk-return profile so
betas might not be an appropriate risk metric.
Unique Risks The strategy loses money most of the time, hence client expectations have to be
managed carefully. Out of the money options are illiquid and difficult to exit. Long
option positions could expire in-the-money leading to an additional STT expense.
Performs
Well In...
Periods of high volatility and in market crashes and panics.
Performs
Poorly In...
Calm market environments and bull markets.
Client Profile For patient investors of all risk tolerances.
Asset
Allocation
The strategy is an insurance against a client’s equity mutual fund and direct equity
holdings. It is belongs to a category by itself.
Trading
Frequency
Monthly or whenever there are market opportunities.
Is the strategy
opportunistic?
No.
Leverage
Taken
Maximum gross leverage = 1x. Typically leverage will be a lot lower because most of
the time the options will expire out of the money leading to the client losing money.
Risk / Return
Profile
Black Swan Protection is an insurance strategy. Losses are limited to the option
premium paid. Gains are not capped but are infrequent.
Investment
Horizon
3 years.
Points to
consider
Patience and managing client expectations are key.

21 | P a g e
Arbitrage
CAPITAL MANAGEMENT
Cash Futures Arbitrage
Characteristic Description
Strategy
Description
Profiting from differences between the cash and futures prices of the same security.
Economic
Rationale
Typically: Future Price = Cash Price x (1 + Short Term Interest Rate). However, the
futures price can occasionally trade at a premium to the price implied by short term
interest rates because of demand/supply imbalances.
Assets Held Long: Cash Equities. Short: Single Stock Futures.
Sample
Position
Buy Pantaloon in the cash market, Sell Pantaloon April 2012 futures.
Target Beta Zero.
Unique Risks In a sharp rally the portfolio might run out of cash due to mark-to-market losses on
futures. This might force the manager to unwind positions before arbitrage spreads
have converged. If the futures position cannot be rolled over and the cash positions
cannot be exited, portfolio can be left with a directional exposure to a given stock.
Performs
Well In...
Periods when rates on non-deliverable currency forwards are high because the cost
of FII’s hedging their arbitrage books becomes expensive. The strategy also does well
when stocks hit their FII ownership limits or when short term interest rates are high.
Performs
Poorly In...
Periods when NDF spreads are low, when there are no frictions between the cash
and futures market or when short term interest rates are low.
Client Profile Conservative clients.
Asset
Allocation
Fixed income allocation.
Trading
Frequency
Monthly or whenever there are opportunities.
Is the strategy
opportunistic?
Partially – positions taken whenever there are arbitrage opportunities available.
Futures positions can be rolled monthly to continue to generate debt like returns.
Leverage
Taken
Maximum possible gross leverage (Cash + Futures)= 2x. Gross leverage will likely be
lower because a cash buffer has to be maintained for initial margin and mark-to-
market losses on the futures positions.
Risk / Return
Profile
Cash-futures arbitrage is an interest generating strategy that has the risk / return
profile of a liquid fund.
Investment
Horizon
3-6 months.
Points to
consider
Cash management, portfolio concentration and trading implementation is important.
22 | P a g e
Arbitrage
CAPITAL MANAGEMENT
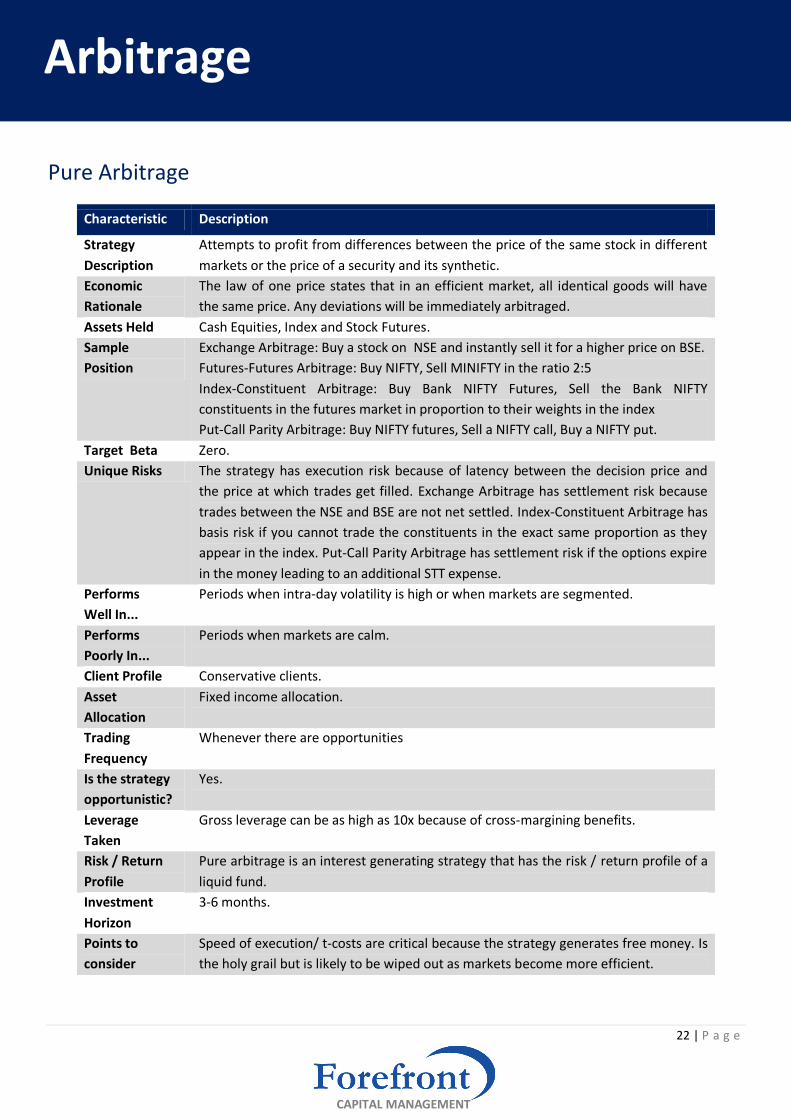
Pure Arbitrage
Characteristic Description
Strategy
Description
Attempts to profit from differences between the price of the same stock in different
markets or the price of a security and its synthetic.
Economic
Rationale
The law of one price states that in an efficient market, all identical goods will have
the same price. Any deviations will be immediately arbitraged.
Assets Held Cash Equities, Index and Stock Futures.
Sample
Position
Exchange Arbitrage: Buy a stock on NSE and instantly sell it for a higher price on BSE.
Futures-Futures Arbitrage: Buy NIFTY, Sell MINIFTY in the ratio 2:5
Index-Constituent Arbitrage: Buy Bank NIFTY Futures, Sell the Bank NIFTY
constituents in the futures market in proportion to their weights in the index
Put-Call Parity Arbitrage: Buy NIFTY futures, Sell a NIFTY call, Buy a NIFTY put.
Target Beta Zero.
Unique Risks The strategy has execution risk because of latency between the decision price and
the price at which trades get filled. Exchange Arbitrage has settlement risk because
trades between the NSE and BSE are not net settled. Index-Constituent Arbitrage has
basis risk if you cannot trade the constituents in the exact same proportion as they
appear in the index. Put-Call Parity Arbitrage has settlement risk if the options expire
in the money leading to an additional STT expense.
Performs
Well In...
Periods when intra-day volatility is high or when markets are segmented.
Performs
Poorly In...
Periods when markets are calm.
Client Profile Conservative clients.
Asset
Allocation
Fixed income allocation.
Trading
Frequency
Whenever there are opportunities
Is the strategy
opportunistic?
Yes.
Leverage
Taken
Gross leverage can be as high as 10x because of cross-margining benefits.
Risk / Return
Profile
Pure arbitrage is an interest generating strategy that has the risk / return profile of a
liquid fund.
Investment
Horizon
3-6 months.
Points to
consider
Speed of execution/ t-costs are critical because the strategy generates free money. Is
the holy grail but is likely to be wiped out as markets become more efficient.
23 | P a g e
Arbitrage
CAPITAL MANAGEMENT
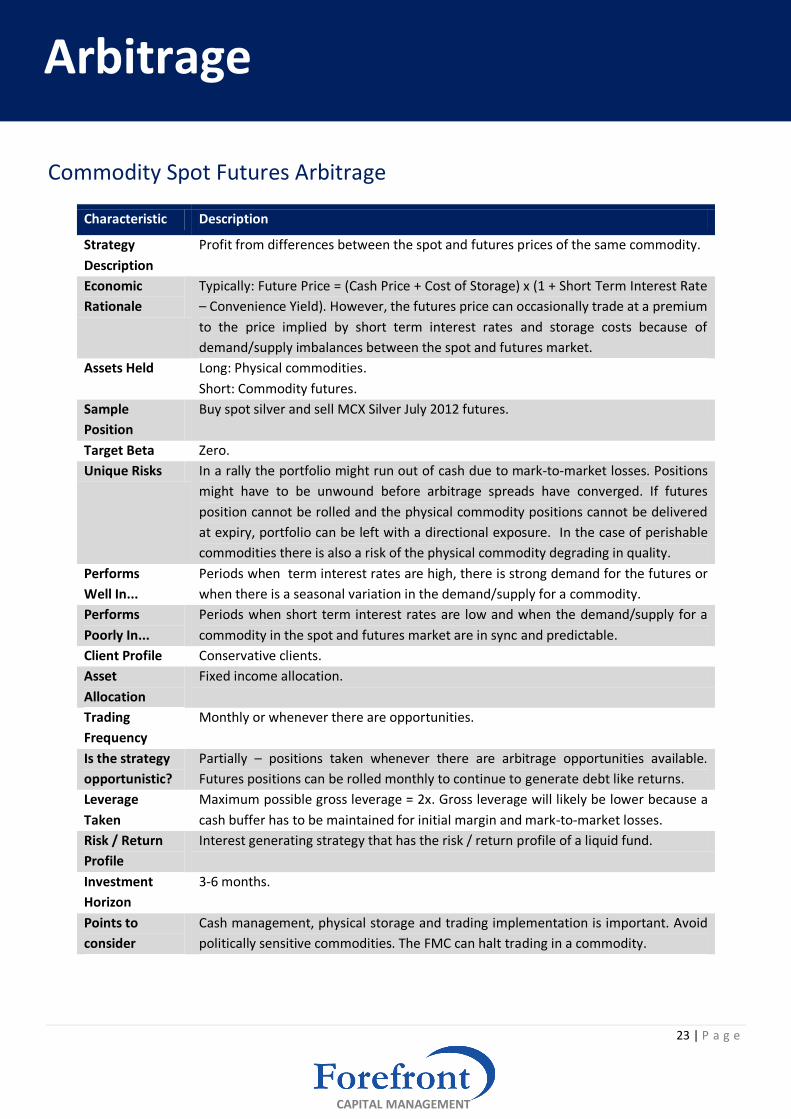
Commodity Spot Futures Arbitrage
Characteristic Description
Strategy
Description
Profit from differences between the spot and futures prices of the same commodity.
Economic
Rationale
Typically: Future Price = (Cash Price + Cost of Storage) x (1 + Short Term Interest Rate
– Convenience Yield). However, the futures price can occasionally trade at a premium
to the price implied by short term interest rates and storage costs because of
demand/supply imbalances between the spot and futures market.
Assets Held Long: Physical commodities.
Short: Commodity futures.
Sample
Position
Buy spot silver and sell MCX Silver July 2012 futures.
Target Beta Zero.
Unique Risks In a rally the portfolio might run out of cash due to mark-to-market losses. Positions
might have to be unwound before arbitrage spreads have converged. If futures
position cannot be rolled and the physical commodity positions cannot be delivered
at expiry, portfolio can be left with a directional exposure. In the case of perishable
commodities there is also a risk of the physical commodity degrading in quality.
Performs
Well In...
Periods when term interest rates are high, there is strong demand for the futures or
when there is a seasonal variation in the demand/supply for a commodity.
Performs
Poorly In...
Periods when short term interest rates are low and when the demand/supply for a
commodity in the spot and futures market are in sync and predictable.
Client Profile Conservative clients.
Asset
Allocation
Fixed income allocation.
Trading
Frequency
Monthly or whenever there are opportunities.
Is the strategy
opportunistic?
Partially – positions taken whenever there are arbitrage opportunities available.
Futures positions can be rolled monthly to continue to generate debt like returns.
Leverage
Taken
Maximum possible gross leverage = 2x. Gross leverage will likely be lower because a
cash buffer has to be maintained for initial margin and mark-to-market losses.
Risk / Return
Profile
Interest generating strategy that has the risk / return profile of a liquid fund.
Investment
Horizon
3-6 months.
Points to
consider
Cash management, physical storage and trading implementation is important. Avoid
politically sensitive commodities. The FMC can halt trading in a commodity.

24 | P a g e
Arbitrage
CAPITAL MANAGEMENT
Statistical Arbitrage / High Frequency Trading
Characteristic Description
Strategy
Description
Attempt to profit from intra-day patterns in market microstructure and high
frequency technical patterns.
Economic
Rationale
Market participants are pre-disposed to certain patterns e.g. buying according to a
volume weighted average price (VWAP) pattern or selling in the last half hour to
target the close price. This leads to intra-day efficiencies.
Assets Held Single stock futures, Index futures, Cash Equities
Sample
Position
Buy NIFTY futures because the market has gapped up, unwind position at the end of
the day.
Target Beta Zero.
Unique Risks Positions might not be able to be unwound at the end of the day leading to overnight
risk. There could be slippage between decision prices and executed prices.
Performs
Well In...
Periods when there are large price-insensitive players in the market. For example, if
all ETFs have to buy the same stock on the close to match their index. The strategy
also does well when intra-day volatility is high.
Performs
Poorly In...
Periods when markets are illiquid or when intra-day volatility is low.
Client Profile Moderate to Aggressive clients.
Asset
Allocation
Absolute return allocation.
Trading
Frequency
Intra-day. Portfolio turnover is high.
Is the strategy
opportunistic?
Can be. Strategies can be event driven i.e. take advantage of ETF trading around an
index reconstitution or always on: Buy the NIFTY if it opens up / Short the NIFTY if it
opens down.
Leverage
Taken
Gross leverage depends on the strength of the manager’s view. Leverage should be
moderate if the manager is taking directional positions intra-day.
Risk / Return
Profile
At 1x gross leverage, the strategy has the risk / return profile of an aggressive
monthly income plan. Individual months or quarters could be negative.
Investment
Horizon
18 months.
Points to
consider
Trading costs and quality of execution are critical for intra-day strategies. Wealth
managers’ reporting systems might misestimate these strategies because end-of-day
reports do not capture the risks of strategies that end each day without any
positions.
25 | P a g e
Arbitrage
CAPITAL MANAGEMENT
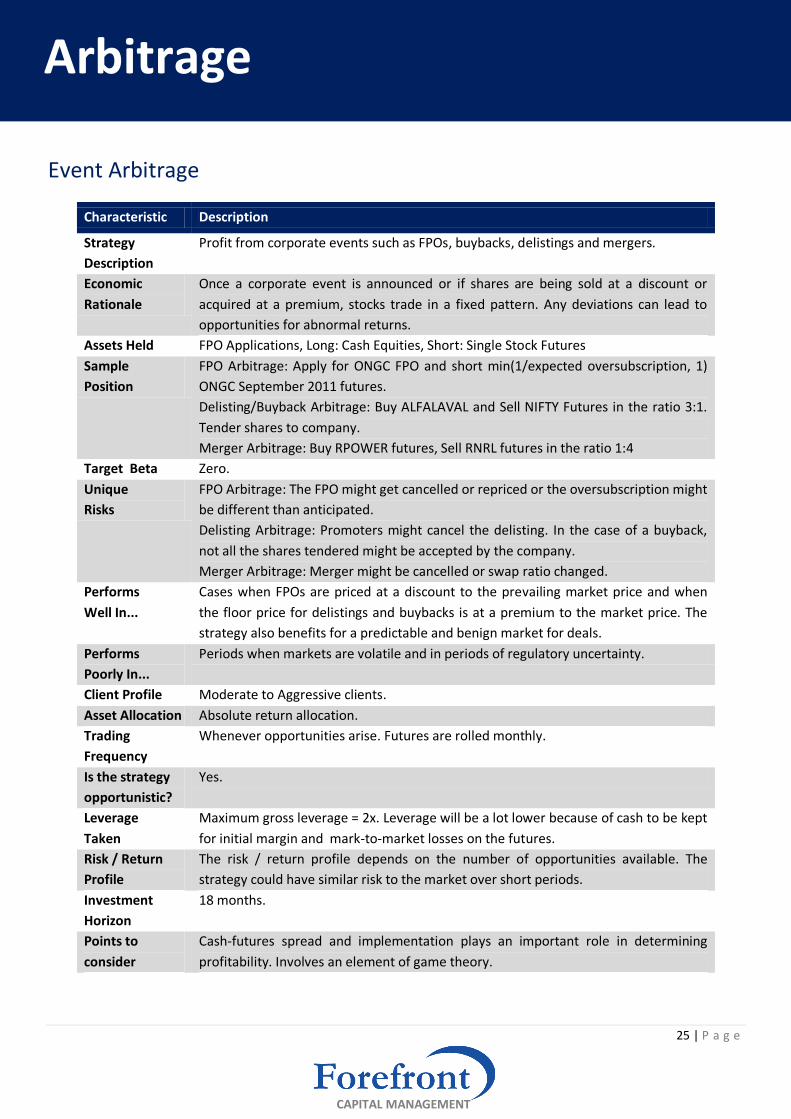
Event Arbitrage
Characteristic Description
Strategy
Description
Profit from corporate events such as FPOs, buybacks, delistings and mergers.
Economic
Rationale
Once a corporate event is announced or if shares are being sold at a discount or
acquired at a premium, stocks trade in a fixed pattern. Any deviations can lead to
opportunities for abnormal returns.
Assets Held FPO Applications, Long: Cash Equities, Short: Single Stock Futures
Sample
Position
FPO Arbitrage: Apply for ONGC FPO and short min(1/expected oversubscription, 1)
ONGC September 2011 futures.
Delisting/Buyback Arbitrage: Buy ALFALAVAL and Sell NIFTY Futures in the ratio 3:1.
Tender shares to company.
Merger Arbitrage: Buy RPOWER futures, Sell RNRL futures in the ratio 1:4
Target Beta Zero.
Unique
Risks
FPO Arbitrage: The FPO might get cancelled or repriced or the oversubscription might
be different than anticipated.
Delisting Arbitrage: Promoters might cancel the delisting. In the case of a buyback,
not all the shares tendered might be accepted by the company.
Merger Arbitrage: Merger might be cancelled or swap ratio changed.
Performs
Well In...
Cases when FPOs are priced at a discount to the prevailing market price and when
the floor price for delistings and buybacks is at a premium to the market price. The
strategy also benefits for a predictable and benign market for deals.
Performs
Poorly In...
Periods when markets are volatile and in periods of regulatory uncertainty.
Client Profile Moderate to Aggressive clients.
Asset Allocation Absolute return allocation.
Trading
Frequency
Whenever opportunities arise. Futures are rolled monthly.
Is the strategy
opportunistic?
Yes.
Leverage
Taken
Maximum gross leverage = 2x. Leverage will be a lot lower because of cash to be kept
for initial margin and mark-to-market losses on the futures.
Risk / Return
Profile
The risk / return profile depends on the number of opportunities available. The
strategy could have similar risk to the market over short periods.
Investment
Horizon
18 months.
Points to
consider
Cash-futures spread and implementation plays an important role in determining
profitability. Involves an element of game theory.

26 | P a g e
CAPITAL MANAGEMENT
Commodities and Currencies
Long Short Commodities
Characteristic Description
Strategy
Description
Long commodities that have are undervalued and/or have strong fundamentals and
short commodities that are overvalued and/or have weak fundamentals.
Economic
Rationale
Commodities for which demand is strong or supply is scarce will outperform
commodities for which demand is weak or supply is abundant.
Assets Held MCX Futures, NCDEX Futures.
Sample
Position
Rank commodities based on their inventory levels. Long commodities that have
falling inventories and short commodities that have rising inventories.
Target Beta Zero beta to the NIFTY, Gold, Oil, Copper or any individual commodity. Portfolios
could have directional exposure to commodities at a given point in time.
Unique
Risks
Agricultural commodities can be politically sensitive. Illiquid markets could be frozen
in an upper or lower circuit for a number of days. The FMC or exchanges could raise
margins forcing levered positions to be cut. Futures positions might not be able to be
rolled over leading to delivery of physical commodities. The cost of carry can be very
high due to commodities being in extreme contango. Net Rupee Exposure can leave
the portfolio exposed to fluctuations in the USD-INR exchange rate because the
prices of many commodities are determined in US Dollars.
Performs
Well In...
Fundamental driven markets.
Performs
Poorly In...
Periods when there is a structural change in a commodity market’s fundamentals.
Client Profile Moderate (low-leverage) to aggressive (high-leverage) clients.
Asset
Allocation
Absolute return allocation. Long Short Commodities cannot be bucketed with gold in
a client’s asset allocation.
Trading
Frequency
Weekly.
Is the strategy
opportunistic?
No.
Leverage
Taken
Leverage can be varied judiciously based on a client’s risk profile. A long-short
portfolio with gross leverage = 1x has an annualized standard deviation of 10%.
Risk / Return
Profile
Should look to deliver 15%-20% with leverage over a 12-18 month period regardless
of what the NIFTY, Gold or any other commodity does. Could be down in a given
month or quarter.
Investment
Horizon
18 months.
Points to
consider
Past experience trading commodities, risk management and implementation are very
important points to consider when evaluating a commodity manager.

27 | P a g e
CAPITAL MANAGEMENT
Commodities and Currencies
Long Short Currencies
Characteristic Description
Strategy
Description
Invest in undervalued currencies, countries with strong macro-economic
fundamentals and those with high interest rates.
Economic
Rationale
Currencies which are undervalued on a purchasing power parity (PPP) basis will
appreciate. Countries with high interest rates and strong economic fundamentals will
attract capital flows leading to an appreciation of their currencies.
Assets Held NSE Currency Futures, MCX Currency Futures.
Sample
Position
Long USD-INR and JPY-INR futures and Short EUR-INR and GBP-INR futures.
Target Beta Zero beta to the NIFTY. Can be managed with a net INR exposure or INR-neutral.
Unique Risks Portfolios with a net INR exposure will be exposed to flows between emerging and
developed markets and sudden flights to safety. Central banks could intervene in
currency markets. Currencies could deviate from PPP for a long periods of time.
Performs
Well In...
Calm market environments for carry based strategies (long high rate currencies, short low rate currencies). Macro/momentum strategies do well in volatile markets.
Performs
Poorly In...
Carry strategies do poorly when volatility is high. Momentum strategies do poorly in
range bound markets.
Client Profile Moderate (low-leverage) to Aggressive (high-leverage) clients.
Asset
Allocation
Absolute return allocation.
Trading
Frequency
Weekly.
Is the strategy
opportunistic?
No.
Leverage
Taken
Leverage can be varied judiciously based on a client’s risk profile. A long-short
currency portfolio with gross leverage = 2x has an annualized standard deviation of
10%.
Risk / Return
Profile
Should look to deliver 15%-20% with leverage over a 12-18 month period regardless
of what the NIFTY does. Could be down in a given month or quarter.
Investment
Horizon
18 months.
Points to
consider
Past experience trading currencies, an understanding of fixed income and risk
management are important for a currency strategy.

28 | P a g e
Multi Asset Class
CAPITAL MANAGEMENT
Tactical Asset Allocation
Characteristic Description
Strategy
Description
Build a long-only portfolio of uncorrelated sources of beta and allocate more to
undervalued asset classes with stronger fundamentals.
Economic
Rationale
Different asset classes perform at different points in time. Combining multiple
uncorrelated asset classes leads to lower risk and more consistent returns.
Assets Held Equities: NIFTY ETFs, NIFTY futures and Mid Cap ETFs.
Global Markets: International Equity funds.
Commodities: Gold ETFs and futures, eSilver and Silver futures, eCopper and Copper
futures, Crude Oil futures
Debt: Liquid funds, Income funds.
Currencies: Currency futures.
Sample
Position
Long 60% NIFTY futures, long 60% gold futures.
Target Beta NIFTY beta: 0 – 0.5.
Unique Risks Cash management is important for levered positions.
Performs
Well In...
Periods when the underlying asset classes do well. Depends on the managers
judgement of asset class performance.
Performs
Poorly In...
Periods when the underlying asset classes do poorly. Depends on the managers
judgement of asset class performance.
Client Profile Moderate risk taking clients.
Asset
Allocation
Absolute return allocation.
Trading
Frequency
Monthly.
Is the strategy
opportunistic?
No.
Leverage
Taken
Gross leverage ranges between 1x and 2x.
Risk / Return
Profile
A diversified portfolio with gross leverage of 1x will have an annualized risk of about
10%. Returns depend on the performance of underlying asset classes but without
leverage such a strategy can generate 12-15% over the long term.
Investment
Horizon
18 months.
Points to
consider
Comparisons between asset classes can be difficult to make. A manager should have
an understanding of asset management issues across asset classes.

29 | P a g e
Multi Strategy Funds
CAPITAL MANAGEMENT
Combining Multiple Strategies
While hedge fund strategies are interesting in themselves, they can be packaged into a more robust and
diversified investment in the form of a multi strategy fund. A multi strategy fund is a combination of two
or more unrelated strategies packaged as a single investment fund. When such a fund combines multiple
absolute return strategies which are uncorrelated (as many of the strategies presented are), the net
outcome is a fund with lower risk than the individual strategies and superior risk adjusted returns. From a
clients and wealth manager’s perspective, since strategies perform differently at different times, this
means more consistent monthly and quarterly performance patterns.
Strategies can be combined into theme based groups such as a collective arbitrage strategy or a collective
long short strategy, or strategies can be combined in a single asset class (a multi strategy equity futures
fund). The focus should be on combining uncorrelated strategies but ones with a similar client profile. For
instance combining a 130-30 equities strategy with a tactical asset allocation strategy is not a great idea
because both have long only equity exposure which overlaps. Of the range of options available, Forefront
has identified a few multi strategy fund examples that sensibly combine the above strategies.
Fund Summary Sub Strategies
Equity Futures Fund
A combination of absolute return oriented
equity futures strategies
1. Long Short Equities
2. Directional Equities
3. Pairs Trading
4. Managed Futures
5. Statistical Arbitrage
6. Event Arbitrage
Equity Options Fund
A combination of absolute return oriented
options trading strategies
1. Volatility Trading
2. Correlation Trading
3. Black Swan Protection
Arbitrage Fund
A combination of low risk arbitrage oriented
strategies with a fixed income profile
1. Cash Futures Arbitrage
2. Pure Arbitrage
3. Commodity Spot Futures Arbitrage
Commodities Fund
A combination of absolute return oriented
commodities strategies
1. Long Short Commodities
2. Commodity Spot Futures Arbitrage
Multi Asset Class Long Short Fund
A combination of absolute return long short
strategies across asset classes
1. Long Short Equities
2. Long Short Commodities
3. Long Short Currencies

30 | P a g e
CAPITAL MANAGEMENT
References and Disclosures
References
Allen S., Financial Risk Management – A Practioner’s Guide to Managing Market and Credit Risk, John
Wiley 2003
Andrade S., di Pietro V. and Seasholes M. “Understanding the Profitability of Pairs Trading”, Working
Paper, University of California, Berkeley and Northwestern University.
Asness C., Krail R. and Liew J. “Do Hedge Funds Hedge?”, AQR Capital Management LLC
Baillie R. and Bollerslev T., 2000, “The Forward Premium Anomaly is Not as Bad as You Think”, Journal of
International Money and Finance, 19(4), 471-488.
Bakshi G. and Kapadia N., 2003, “Delta-Hedged Gains and the Negative Market Volatility Risk Premium”,
Review of Financial Studies, 16(2), 527-566.
Bakshi G., Kapadia N. and Madan D., 2003, “Stock Return Characteristics, Skew Laws and the Differential
Pricing of Individual Equity Options”, Review of Financial Studies, 16(1), 101-143.
Balassa B., 1964, “The Purchasing-Power-Parity Doctrine: A Reappraisal”, Journal of Political Economy, Vol.
72. No 6., December, 584-596.
Bansal R. and Dahlquist M., 2000, “The Forward Premium Puzzle: Different Tales from Developed and
Emerging Economies”, Journal of International Economics, 51, 115-144.
Bhansali V., 2007, “Volatility and the Carry Trade”, The Journal of Fixed Income, 72-84.
Britten-Jones M. and Neuberger A., 2000, “Option Prices, Implied Price Processes, and Stochastic
Volatility”, Journal of Finance, 55, 839-866.
Brown S. and Goetzmann W. “Hedge Funds with Style”, Yale ICF Working Paper No. 00-29
Brown S., Fraser T. And Liang B., “Hedge Fund Due Diligence: A Source of Alpha in a Hedge Fund Portfolio
Strategy”, Working Paper
Burnside C., Eichenbaum M., Kleshchelski I. and Rebelo S., 2006, “The Returns to Currency Speculation”,
NBER working paper.
Carhart M., 1997, “On Persistence in Mutual Fund Performance”, Journal of Finance, vol. 52, no. 1 (March):
57-82
Chan N., Getmansky M., Haas S. and Lo A., “Systemic Risk and Hedge Funds”, MIT Sloan Research Paper No.
4535-05

31 | P a g e
CAPITAL MANAGEMENT
References and Disclosures
References
Chinn M., 2006, “The (Partial) Rehabilitation of Interest Rate Parity: Longer Horizons, Alternative
Expectations and Emerging Markets”, Journal of International Money and Finance, 25(1), 7-21.
Clark K., “Managing a Portfolio of Hedge Funds”, Modern Investment Management – An Equilibrium
Approach, Chapter 27
Connor G. and Korajczyk R., 1993, “A Test for the Number of Factors in an Approximate Factor Model”,
Journal of Finance, Volume 48, 1263-1291.
Conrad J. and Kaul G., 1989, “Mean Reversion in Short-horizon Expected Returns”, Review of Financial
Studies, 2, 225-240.
Daniel K., Hirshleifer D. and Subrahmanyam A. 1998 “Investor Psychology and Security Market Under and
Overreactions”, Journal of Finance, Volume 53, Issue 6, 1839–1885.
Dash M., Kodagi M., Babu N. and Vivekanand B.Y., 2008, “An Empirical Study of FOREX Risk Management
Strategies”, Indian Journal of Finance, Vol.2, No. 8
De Long J., Shleifer A., Summers L. and Waldmann R. 1990, “Noise Trader Risk in Financial Markets”,
Journal of Political Economy, vol. 98, no. 4 (August):703-738
Erb C. and Harvey C., 2006, “The Strategic and Tactical Value of Commodity Futures”, Financial Analysts
Journal, vol 62, no. 2 March / April: 69-97
Engelberg J., Gao P. and Jagannathan R. 2009, “An Anatomy of Pairs Trading: The Role of Idiosyncratic
News, Common Information and Liquidity”, Working paper, University of North Carolina at Chapel Hill,
University of Notre Dame and Northwestern University.
Fama E., 1984, “Forward and Spot Exchange Rates”, Journal of Monetary Economics, 14, 319-338.
Fama E., “The Behavior of Stock-Market Prices”, Journal of Business, vol. 38, no. 1 (January): 34-105.
Fama E. and French K., 1993, “Common Risk Factors in the Returns on Stocks and Bonds”, Journal of
Financial Economics, vol. 33, no. 1 (February): 3-56
Fama E. and French K., 1996, “Multifactor Explanations of Asset Pricing Anomalies,” Journal of Finance, 51,
131-155.
32 | P a g e
CAPITAL MANAGEMENT
References and Disclosures
References
Froot K. A. and Rogoff K., 1995, “Perspectives on PPP and Long-Run Real Exchange Rates”, NBER Working
Paper No. 4952, December, Cambridge, Massachusetts
Fung W. and Hsieh D., “Empirical Characteristics of Dynamic Trading Strategies: The Case of Hedge Funds”,
The Review of Financial Studies Summer 1997 Vol. 10, No. 2, 275–302.
Fung W., Hsieh D., Ramadorai T. and Naik N. 2008 “Hedge Funds: Performance, Risk, and Capital
Formation”, The Journal of Finance, Vol. 63, No. 4.
Gatev E., Goetzmann, W. and Rouwenhorst K., 2006, “Pairs Trading: Performance of Relative Value Rule”,
Yale ICF Working Paper No. 08-03.
Gorton G. and Rouwenhorst K., 2006, “Facts and Fantasies about Commodity Futures”, Financial Analysts
Journal, vol. 62, no. 2 (March/April): 47-68
Graham B., The Intelligent Investor, edited by Jason Zweig, Harper Collins 2003
Graham B. and Dodd D., Security Analysis, 6th edition, McGraw-Hill 2009
Greenblatt J., You Can Be a Stock Market Genius, Simon & Schuster 1997
Klarman S., Margin of Safety: Risk-Averse Value Investing Strategies for the Thoughtful Investor.
HarperCollins 1991
Hansell S., 1989, “Inside Morgan Stanley's Black Box”, Institutional Investor, (May) 204-216
Harvey C., Liechty J., Liecthy M. and Muller P. “Portfolio Selection with Higher Moments”, Quantitative
Finance, vol. 10, no. 5 (May): 469-485.
Hautsch N. and Inkmann, J., 2003, “Optimal Hedging of the Currency Exchange Risk Exposure of
Dynamically Balanced Strategic Asset Allocations”, Journal of Asset Management, 4(3).
Hogan S., Jarrow R., Teo M. and Warachka M., 2004. “Testing Market Efficiency Using Statistical Arbitrage
with Applications to Momentum and Value Strategies” Journal of Financial Economics, vol. 73, no. 3
(September): 525-565
Hong H. and Stein J., 1999, “A Unified Theory of Underreaction, Momentum Trading, and Overreaction in
Asset Markets”, Journal of Finance, Volume 54, Issue 6, 2143–2184
Ibbotson R. and Chen P. “The A,B,Cs of Hedge Funds: Alphas, Betas, and Costs”, Yale ICF Working Paper No.
06-10

33 | P a g e
CAPITAL MANAGEMENT
References and Disclosures
References
Idzorek T., 2006, “Strategic Asset Allocation and Commodities”, Ibbotson Associates.
Jegadeesh N. and Titman S., 1993, “Returns to Buying Winners and Selling Losers: Implications for Stock
Market Efficiency”, Journal of Finance, 48, 65-91.
Jegadeesh N. and Titman S., 1995, “Overreaction, Delayed Reaction, and Contrarian Profits”, Review of
Financial Studies, 8, 973-93.
Liang B., “On the Performance of Hedge Funds”, University of Massachusetts at Amherst Working Paper
Lioui A. and Poncet P., 2005, Dynamic Asset Allocation with Forwards and Futures, Springer
Lo, A., “Risk Management for Hedge Funds: Introduction and Overview”, MIT Working Paper Series.
Lopez de Prado M. and Peijan A., 2004, “Measuring Loss Potential of Hedge Fund Strategies”, Journal of
Alternative Investments, Vol. 7, No. 1, pp. 7-31.
Lustig H., Roussanov N. and Verdelhan A., 2008, “Common Risk Factors in Currency Markets”, working
paper.
Mitchell M., Pulvino T. And Stafford E., 2002, “Limited Arbitrage in Equity Markets”, Journal of Finance, vol.
57, no. 2 (April): 551-584.
Obstfeld M. and Rogoff K., Foundations of International Macroeconomics, Cambridge, Massachusetts: MIT
Press 1998
Patton A., 2004, “On the Out-of-Sample Importance of Skewness and Asymmetric Dependence for Asset
Allocation”, Journal of Financial Econometrics, vol. 2, no. 1 (January):130-168.
Rogoff K., 1996, “The Purchasing Power Parity Puzzle”, Journal of Economic Literature, Vol. 34, No. 2, June,
647-668
Still G., 2009, “Crowd Dynamics in the Foreign Exchange Market,” Working Paper
Swensen, D. Unconventional Success: A Fundamental Approach to Personal Investment. New York: Free
Press 2005
Taleb N. The Black Swan: The Impact of the Highly Improbable, Penguin 2007

34 | P a g e
CAPITAL MANAGEMENT
References and Disclosures
References
Taleb N. Fooled by Randomness: The Hidden Role of Chance in Life and in the Markets, Penguin 2001.
Ubide A., 2006, “Back to Basics”, Finance and Development, Volume 43, Number 2
Walmsley J., International Money and Foreign Exchange Markets: An Introduction, John Wiley and Sons
1996.
Winkelmann K., Clark K., Rosengarten J. and Tyagi T., “Strategic Asset Allocation and Hedge Funds”,
Modern Investment Management – An Equilibrium Approach, Chapter 26

35 | P a g e
CAPITAL MANAGEMENT
References and Disclosures
Disclosures
The document is delivered solely as reference material and is not related to any product of Forefront Capital Management. It does not constitute an offer to sell or a solicitation of an offer to buy interests in any product. Any such offering will occur only in accordance with the terms and conditions set forth in the client agreement if and when offered. Investors are urged to review the relevant documents including the risk considerations described in them and to ask additional questions of Forefront as deemed appropriate, as well as discuss any prospective investment with their legal and tax advisers prior to investing. This document is intended for the use of the person to whom it has been discussed with by Forefront and is not to be reproduced or redistributed to any other person. The information set forth has been obtained from sources believed by Forefront to be reliable. However, Forefront does not make any warranty as to the information’s accuracy or completeness nor does Forefront recommend that the attached information serve as the basis of an investment decision. This document is subject to further review and revision. Forefront is not making any statement about offering any of these strategies or whether any of these strategies can be offered on any regulatory platform in India (AIF, PMS, Mutual Funds or others). The strategies presented are merely hypothetical strategies that are run globally by hedge funds. Past performance is not an indication of future performance. Hypothetical performance results (e.g. quantitative back tests) where presented have many inherent limitations some of which, but not all, are described herein. No representation is being made that any account will or is likely to achieve profits or losses similar to those shown herein. In fact there are frequently differences between hypothetical performance results and the actual results subsequently realized by any trading program. One of the limitations of hypothetical performance results is that they are prepared with the benefit of hindsight. In addition, hypothetical trading does not involve financial risk and no trading record can completely account for the impact of financial risk in actual trading. There are numerous other factors related to the markets in general or to the implementation of any specific trading program which cannot be fully accounted for in the preparation of hypothetical performance results, all of which can adversely affect actual trading results. Hypothetical results are presented for illustrative purposes only. There is a risk of loss associated with trading futures and leverage. Before investing carefully consider your financial position and risk tolerance to determine if the proposed trading style is appropriate. All funds committed should be purely risk capital. The portfolio risk management process includes an effort to monitor and manage risk but should not be confused with and does not imply low risk. This material is confidential and cannot be shared or reproduced without the prior written permission of Forefront Capital Management Private Limited. For any questions or feedback on this publication please contact: Radhika Gupta, Director and Head of Business Development Forefront Capital Management Private Limited Address: 111 TV Industrial Estate, S K Ahire Marg, Worli, Mumbai 400030, India Tel: +91-22-2494807 E-mail: [email protected] Web: www.forefrontcap.com