forecasting the impact of the egyptian exchange rate on ...pdf.usaid.gov/pdf_docs/pnach416.pdf ·...
TRANSCRIPT

Development Economic Policy Reform Analysis Project (DEPRA)
Final Report
Forecasting the Impact of the
Egyptian Exchange Rate on Exports
Prepared for
The Ministry of Economyand Foreign Trade
Submitted to
USAIDEconomic Growth/Sector PolicyCairo, Egypt
Submitted by
Nathan Associates Inc.
Under
Contract #263-C-00-96-00001-00
October 1999

Center for Economic and Financial Research and Studies
in association with
the DEPRA Project*
Forecasting the Impact of the Egyptian
Exchange Rate on Exports
Sherine Al-Shawarby, Ph.D.
Assistant Professor
Department of Economics
Faculty of Economics and Political Science
Cairo University
October 1999
*Funded by USAID under Contract #263-C-00-96-00001-00

i
Preface
This study is conducted jointly by the Center for Economic and Financial Research andStudy (CEFRS) and the Development Economic Policy Reform Analysis (DEPRA)Project, under contract to the United States Agency for International Development(USAID)/Egypt (Contract no. 263-C-00-96-00001-00). The DEPRA Project isintended to encourage and support macroeconomic reform in Egypt through theprovision of technical assistance and services to the Ministry of Economy and ForeignTrade (MEFT), with substantive focus on the areas of international trade andinvestment liberalization, deregulation of the economy, and financial sectorstrengthening.
The study was carried out by Dr. Sherine Al-Shawarby, Assistant Professor in Facultyof Economics and Political Science, Cairo University, as the principal investigator fromCEFRS. The views expressed herein are solely those of the author, and they should notbe interpreted as statements of policy or opinion of CEFRS, the Ministry of Economyand Foreign Trade, USAID, or of the DEPRA Project and its parent institutions.
The author would like to thank the many people who generously gave of their time toprovide her with insightful suggestions: Prof. Tarek Moursi (Cairo University) for hisassistance in putting together the monthly data series and in carrying out the policyanalysis articulated in section 5 of this study; Dr. James L. Walker, Chief of Party forthe DEPRA Project, and the rest of his staff and visiting consultants, especially Dr.Montague J. Lord and Dr John W. Suomela, for their valuable and continuousdiscussions, and for their careful review, comments, and suggestions, as well as Dr. C.Stuart Callison who gave generously of his considerable resources and for his finalediting of the last version.
Thanks are also due to Dr. Heba Nassar, Director of CEFRS, Cairo University, for herunfailing professional and moral support, and to Dr. Farouk Shakweer, FirstUndersecretary, MEFT/Economic Policy Research and Information Sector (EPRIS),and Mr. Mohamed Alyan, General Manager for the Department of Economic Analysisand Forecasting, MEFT/EPRIS, for their support during the conduct of this study,beginning at its earliest stages. Among others, thanks are extended also to Ms. SehamRashad, Ms. Zeinab Farouk, Mr. Mussa Abd El-Monem, and Mr. Nasser Abd El-Mohimen from MEFT/EPRIS for helping to construct the data set used in this paper.
ii
Table of Contents
Section Page
Preface i
Executive Summary ` iii
1.0 Introduction 1
2.0 Evolution of Total and Disaggregated Egyptian Exports 4
3.0 Evolution of the Egyptian Exchange Rate 8
3.1 What is the Real Exchange Rate? 11
3.2 Does RER appreciation always endanger competitiveness? 13
3.3 Can devaluation work? 15
4.0 The Model 17
4.1 Data Sources and Definitions 17
4.2 Monthly Data Series 19
4.3 Annual Data Series 23
5.0 Exchange Rate and Exports: Articulating the Evidence 27
6.0 Summary and Conclusion 30
References 34
Appendices 40
A. Technical Appendix
B. Figures Appendix
C. Statistical Appendix

iii
Forecasting the Impact of the Egyptian Exchange Rate on Exports
Executive Summary
Egypt now is at a turning point. Oil and gas exports, Suez Canal, tourism receipts and workers
remittances, which financed more than half of all imports in 1996, have a limited outlook. In
addition, the multilateral liberalization after the Uruguay Round and the new regional
initiatives in other parts of the world are likely to erode the preferential access of Egyptian
exports to European markets. Hence, recent years have witnessed a surge of interest in the
measures to increase as well as diversify exports of goods and services to encourage and
sustain Egypt’s ambitious economic rehabilitation and structural adjustment program.
In fact, Egypt’s external sector faces a number of major challenges that may contribute to
slower economic growth. First, the relative importance of exports of goods and services to
GDP fell from an average of 28% to 22.6% from 1991-93 to 1994-96. This suggests that the
contribution of exports to national welfare has been declining since 1991, and emphasizes the
fact that international trade is much less important relative to GDP in Egypt than in other
countries with similar characteristics.
Second, the ratio of merchandise exports to total exports declined from an average of 40
percent during the 1980s to 27 percent in 1990s, and from 28.3 percent to 26.2 percent from
1991-93 to 1994-96. Likewise, the contribution of merchandise exports to growth of the
Egyptian economy has been below the 1980s level. This suggests that Egypt’s international
competitiveness in traded goods has diminished in recent years and should be, therefore, given
greater priority in the coming years.
Third, the ratio of manufactured to merchandise exports, although higher in the 1990s relative
to the 1980s, was still only around 32%, which is low in comparison with other emerging
markets. Finally, the growth rates of the exports selected for study reveal relatively high
fluctuations. This can be attributed—among other things—to the structure of Egyptian
exports, which is still dominated by a relatively small number of primary commodities, and to

iv
the inability of Egyptian exporters and exports to maintain a stable share in international
markets.
It is therefore essential to give priority to the development of the export sector. An exchange
rate adjustment is often at the core of policy reforms recommended for the export sector.
Since the 1991 exchange reform, the Egyptian-pound real exchange rate (RER) has been
steadily appreciating. It is worth noting two aspects of this reform. The first is the option to
use the nominal exchange rate (NER) as an anchor in support of the stabilization effort. The
NER, being considered by the Government of Egypt as a symbol of stability, has been pursued
as an end in itself as much as a means to disinflation. The second is the pegging of the
domestic currency to the US dollar, although the European Union (EU) countries, taken
together, outrank the United States on the list of Egypt’s trading partners. These two factors
together have resulted in a real, trade-weighted, appreciation. The real exchange rate fell,
between 1991 and 1997, by about 37% as measured by the export-weighted real exchange rate
index. Of this decline, about 12% is due to the rise in the value of the dollar relative to
European currencies, which mostly compensated for their inflation, taken as a group, while the
Egyptian pound has remained constant against the dollar in nominal terms. The rest is
accounted for by the differential in inflation rates between Egypt and its trading partner
countries.
However, the relationship between changes in the competitive position of a country and
movements in its RER is not straightforward. The RER may or may not compromise the
competitive stance of a country depending on the RER misalignment situation. A recent study
shows that the RER has moved closer to the equilibrium rate since 1991. Moreover, until
recently, the real appreciation was not tantamount to overvaluation and did not suggest a
problem at all. Egyptian authorities were adamant that the LE was not overvalued and
reaffirmed this belief at every opportunity. However, given the reversal of the situation since
1998, when the Central Bank started drawing from its foreign reserves to keep the NER from
depreciating, the possible overvaluation of the Egyptian pound is again being questioned.
Whether a real devaluation can help net exports is controversial. While trade theory establishes
a direct link between the exchange rate and export performance, the relationship between
v
exchange rate changes and actual exports is not always clear-cut. Moreover, the recent
literature is divided on the ability of a real devaluation to affect imports and exports. Besides,
studies that have discussed the LE devaluation effect on exports have expressed doubts about
the various channels through which the expansionary effects of expenditure-switching and
expenditure-reduction resulting from a devaluation are achieved. They show that the
contractionary effects of a devaluation on the supply side are more damaging than those on
aggregate demand and that special attention should, therefore, be paid to compensate for the
negative effects on aggregate supply. They argue that the devaluation of the LE may hardly
improve the trade balance or boost output. It may even, in the long run, reduce output, if
investment falls. With regard to exports, perhaps the positive impact of devaluation will
benefit mostly those non-traditional manufactured industries in which the share of imported
inputs in the total cost of production is very low.
In trying to resolve the prolonged dispute about the likely impact and the effectiveness of a
devaluation on exports in the Egyptian case, this study aims to offer new evidence on this
issue by examining the relationship between exports and their determinants, mainly the RER.
The study presents an empirical analysis of the role of the Egyptian pound exchange rate in
increasing exports. We ask the following questions: Does the exchange rate play an important
role in increasing exports? Should the Egyptian authorities devalue the nominal exchange rate
in order to improve export performance? In order to answer these questions, both theoretical
and quantitative analyses are carried out. The methodological framework includes examining
the relationship between Egyptian exports and their determinants, especially the Egyptian
pound exchange rate, as well as the robustness of the results. This is done first by estimating a
Vector Autoregressive (VAR) model using monthly data, and second with the help of Error
Correction Mechanism (ECM) using annual data. The merchandise exports are divided into
five categories: fuel, cotton, primary products, semi-finished products and finished products.
The export equations may be used for forecasting and may therefore be useful for formulating,
implementing and evaluating macroeconomic policies.
The empirical results suggest the following observations. First, in general, assessment of the
VAR model shows that Egyptian exports appear to have strong autonomous components; and
that while influence of real exchange rate on exports cannot be entirely denied, the percentage

vi
contribution of RER shocks in the forecast error variance of exports is very low. Second, from
the annual series data, the cointegration approach indicates, in general, the independence of
Egyptian exports from the movements in the Egyptian pound RER. Third, since the results
derived from the two methods, applied with different frequencies of data, are qualitatively
equivalent, it may be deduced that the estimates obtained are robust and that they provide
strong statistical evidence of the weak impact exchange rate variations have had on Egyptian
export performance. Neither method provides more than marginal support for the argument in
favor of devaluing Egyptian pound to promote export growth in the present context.
In general, these findings imply that the Egyptian economy, despite a substantial record of
policy reform over the last ten years, still suffers from some discrepancies and difficulties that
make variations in exports attributable to variables other than those suggested by economic
theory and by empirical evidence from other developing countries with similar characteristics.
Obviously, more research is needed to interpret this striking feature of Egyptian exports.
However, one may surmise that this relative independence of Egyptian exports from the
variables which should determine them, according to standard theory, is the consequence of
difficulties the Egyptian exporters face besides those related to the exchange-rate. There are
three main sources of these difficulties: 1) the limited capacity of Egyptian export firms,
especially the state-owned enterprises, to respond to market signals, 2) the government and its
policies, and 3) external factors.
While one of the main characteristics of the global market for exports is rapidly changing
tastes and preferences, most Egyptian exporters lack the readiness to adopt their production
techniques to such changes and fail, therefore, to penetrate new markets and, further, lose
even existing market shares. Egyptian exporters suffer also from marketing problems,
especially those related to quality assurances, including those associated with ISO 9000
standards and guarantees in the form of both product warranties and compliance with
environmental standards.
The government is responsible for some policies and factors that impede export expansion and
needs to adopt major reforms. The current tariff structure and the limited competition of
shipment services, for instance, impose additional costs on exports, hitting non-traditional
exports especially hard. Financial services, such as pre- and post-shipment finance, insurance
against exporters/importers’ default, and soft loans for export activities also need solid

vii
improvements. In addition, bureaucracy, import red tape and non-tariff barriers to trade cost
the exporter large indirect expenses. A recent study indicates that current GOE policies
impose an implicit tax of roughly over 30% on exports, which is inconsistent with the GOE
strategy of export-led growth.
Among the external difficulties that are not within Egypt’s ability to control, non-tariff and
tariff barriers imposed by other countries are an example. Usually, barriers implied by Custom
Unions (CU) and Free Trade Areas (FTA) hurt outside parties: Egyptian exporters in our
case.
In view of the aforementioned, it is apparent that export promotion in Egypt is not entirely an
exchange rate problem, but rather more a behavioral and institutional one. A continued policy
and institutional reform effort, including the privatization of state-owned enterprises, is crucial
to resolve the weak export performance and improve Egypt’s economic responsiveness to
normal economic price signals like the exchange rate. It appears that, unless these problems
are effectively tackled, devaluation, although needed to improve the long-term economic
prospects of Egypt and to secure the benefits of economic reform, will not help much, per se,
in enhancing Egyptian exports. Notwithstanding the appearances, it is important to interpret
these results with caution and not to attach a structural interpretation to them before further
testing and analysis within the context of a formal structural macroeconomic framework.

1
Forecasting the Impact of the EgyptianExchange Rate on Exports
1.0 Introduction
Egypt now is at a turning point. Oil and gas exports, Suez Canal revenue, tourism
receipts and workers remittances, which financed more than half of imports in 1996,
have a limited outlook (World Bank, 1997). In addition, the multilateral liberalization
after the Uruguay Round and the new regional initiatives in other parts of the world
are likely to erode the preferential access of Egyptian exports to European markets
(Hoekman and Subramanian, 1996). Hence, increasing as well as diversifying exports
of goods is an issue of major importance for the Egyptian economy’s long-term
growth.
The steady appreciation of the Egyptian pound real exchange rate (RER) since late
1991 has raised concerns about the country’s competitiveness with respect to its
foreign exports sector. By reviewing the performance of Egyptian exports and the
evolution of the nominal and real exchange rates and the relationship between them,
this study presents an empirical analysis of the role of the Egyptian pound exchange
rate in increasing exports. We ask the following questions: Does the exchange rate
play an important role in increasing exports? Should the Egyptian authorities devalue
the nominal exchange rate in order to improve export performance?
Motivation for the study comes from the increasing concern of the Government of
Egypt (GOE) about improving the limited growth of exports in the context of a
strategy aiming at accelerating the Egyptian economic growth rate. In addition, other
studies that have addressed the specific question of whether exchange rate adjustments
can contribute to Egypt’s exports present conflicting views, varying from complete
pessimism (Abdel-Khalekh, 1995 and 1997, and Korayem 1993, 1996 and 1997), to
cautious and limited optimism (Al-Shawarby, 1997), to total optimism (Kheir-El-Din
et al., 1997).
Trade theory establishes a direct link between the exchange rate and export
performance. However, the relationship between exchange rate and actual exports is

2
not always clear-cut. This may be seen in at least three situations. Protectionist policies
in the developed countries reduce the scope for exchange rate policy. In addition, for
manufactured goods, the role of non-price factors such as brand names and quality can
be crucial. Finally, technological change reflected in cost reductions as well as quality
improvement can be important (Gupta and Ray, 1998). It is evident that a market-
determined exchange rate regime is not going to affect trade flows of all items equally.
Our main interest in this paper is to examine the relationship between the exchange
rate (ER) and exports of disaggregated product groups.
In order to achieve this objective, both theoretical and quantitative analyses are carried
out. The methodological framework includes presenting the evolution of Egyptian
exports as well as the evolution of the nominal exchange rate (NER) and RER and the
link to competitiveness. The study also examines the relationship between Egyptian
exports and their determinants, especially the Egyptian pound exchange rate, as well as
the robustness of the results, first by estimating a Vector Autoregressive (VAR)
model using monthly data, and second with the help of Error Correction Mechanism
(ECM) using annual data. The merchandise exports are divided into five categories:
fuel, cotton, primary products, semi-finished products and finished products1. These
export equations may be used for forecasting and may therefore be useful for
formulating, implementing and evaluating macroeconomic policies.
The remainder of the paper is organized as follows:
§ Section II examines the evolution of the total and disaggregated Egyptian
exports and presents the challenges they face.
§ Section III analyzes the behavior of nominal and real Egyptian exchange
rates and discusses the likely economic implications of a real appreciation and the
effectiveness of a devaluation.
§ Section IV presents the data and models used to examine the relationship
between Egyptian exports and the Egyptian pound exchange rate, and displays the
estimation results.
1 The categories are selected in accordance with the CAPMAS classification of Egyptian exportsaccording to degree of process.

3
§ Section V analyzes the estimation results and presents a brief qualitative
policy-oriented analysis of the implications of the results in relation to defining the
stylized picture of export problems in Egypt.
§ Section VI summarizes and closes with the overall findings of the paper.
§ The Technical Appendix presents the details of the quantitative
methodologies used in the study.
§ The Statistical Appendix contains basic statistics.
§ The Figure’s Appendix includes the impulse response functions’ graphs of
the different export categories.
§ The References at the end of the paper list the documents and studies used in
the preparation of the study.

4
2.0 Evolution of Total and Disaggragated Egyptian Exports
In the second half of the 1990s Egypt has come to be viewed as a showcase of
successful stabilization and economic reform, institutional stability, and financial
predictability. However, growth remains a major challenge to the Egyptian economy.
Since 1992, the real growth rate has been increasing, reaching 5 percent in 1997/98.2
It is targeted to reach 7 percent in 2000.
In many developing countries with relatively limited access to international financial
markets, exports play an important role in their growth process by generating the
scarce foreign exchange necessary to finance the imports that are crucial to their
capital formation. Thereby, in recent years, export-promotion policies have been
strongly advocated as a superior development strategy for semi-industrialized
countries. Part of the empirical support for this policy has been provided by the
statistically significant correlation found between export expansion and output
growth3.
Moreover, empirical results (DEPRA, 1998a) reveal high correlation between growth
in manufacturing and economy-wide growth in developing countries. They also show
that particular attention must be paid to production of manufactured goods because
they are widely viewed as the core of any successful export-led growth strategy.
Hence, achieving higher sustainable growth must be through a dynamic export sector
founded on a robust manufacturing base. There is strong evidence indicating that the
countries that have been the most successful in expanding manufactured exports are,
with very few exceptions, the same countries that have achieved the highest rates of
economic growth during the past thirty years (Radelet, 1999). Manufactured goods
are considered to be dynamic, not only in terms of a growing foreign demand but also
because they may result in productivity externalities (Sachs and Warner, 1995).
2 Figures are based on Ministry of Planning statistics.3 See Balasaa (1978 and 1985), Chow (1987), Emery (1967), Fajana (1979), Feder (1982), Hellerand Porter (1978), Michaely (1977 and 1979), Tyler (1981), and Esfahani (1991).

5
However, the Egyptian economy has been relying on sources of foreign exchange that
are broadly considered as exogenous or risky4 rather than on exports of manufactured
goods. This has been indeed a significant factor explaining Egypt’s weak trade
dynamism (Petri, 1997), which has isolated Egypt from globalization and its associated
potential for growth (Dessus and Eisenmann, 1998).
With this in mind, one could argue that Egypt’s external sector faces a number of
major challenges that may contribute to slower economic growth. First, the relative
importance of exports of goods and services to GDP—depicted in Figure (1)—fell
from an average of 28% to 22.6% from 1991-93 to 1994-965. This suggests that the
contribution of exports to national welfare has been declining since 1991. International
trade is much less important relative to GDP in Egypt than in other countries with
similar characteristics6 (Stryker and Pandolfi, 1999).
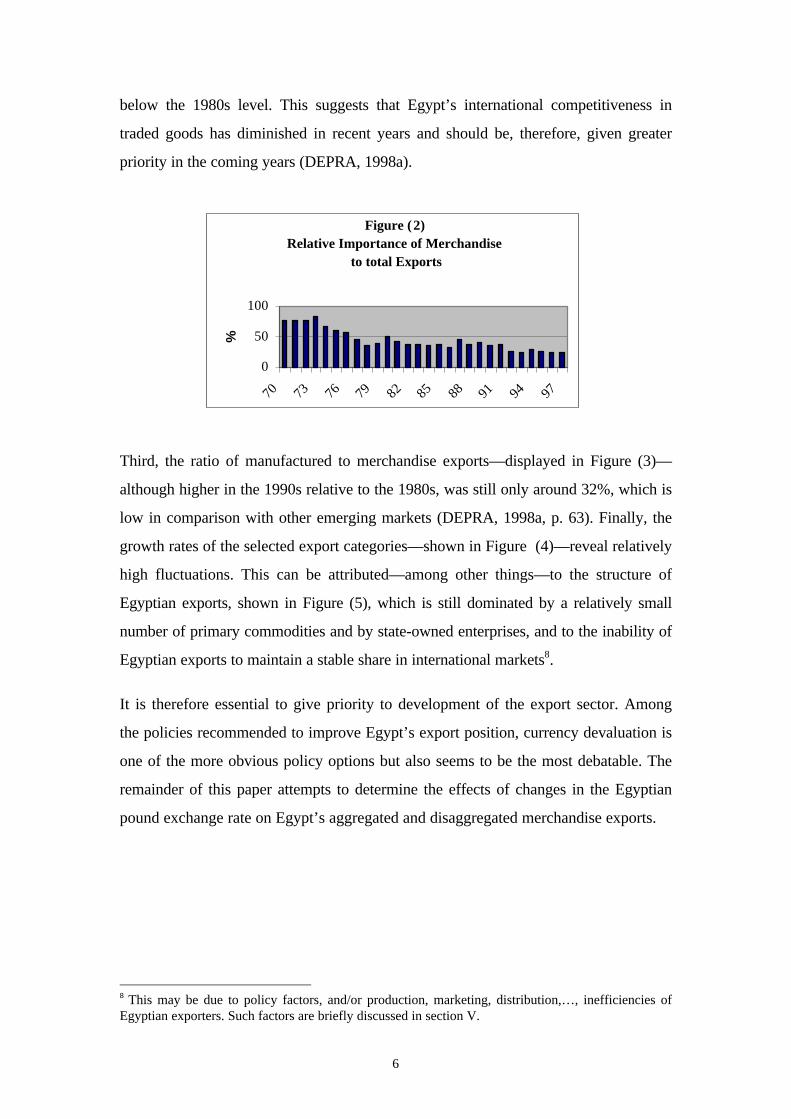
Second, the ratio of merchandise exports to total exports—illustrated in Figure (2)—
declined from an average of 40 percent during the 1980s to 27 percent in 1990s, and
from 28.3 percent to 26.2 percent from 1991-93 to 1994-967. Likewise, the
contribution of merchandise exports to growth of the Egyptian economy has been
4 Oil and gas supply is determined by the amount of reserves discovered in the long run, for whichpredictions are quite pessimistic. Suez Canal revenue will slow down (World Bank , 1997). Workersremittances are indexed to oil revenue in the Gulf zone (which is the main destination of Egyptianexpatriates), and much of the foreign direct investment in Egypt is made in the oil sector (Dessus andEisenmann, 1998).5 Calculated from Appendix Table 1.6 This appears to be because years of incentives biased towards import substitution have wreakedhavoc on the export sector.7 Calculated from Appendix Table 1.
Figure ( 1)Relative Importance of Exports of Goods and
Services to GDP
0
5
10
15
20
25
30
35
70 72 74 76 78 80 82 84 86 88 90 92 94 96
%
6
below the 1980s level. This suggests that Egypt’s international competitiveness in
traded goods has diminished in recent years and should be, therefore, given greater
priority in the coming years (DEPRA, 1998a).
Third, the ratio of manufactured to merchandise exports—displayed in Figure (3)—
although higher in the 1990s relative to the 1980s, was still only around 32%, which is
low in comparison with other emerging markets (DEPRA, 1998a, p. 63). Finally, the
growth rates of the selected export categories—shown in Figure (4)—reveal relatively
high fluctuations. This can be attributed—among other things—to the structure of
Egyptian exports, shown in Figure (5), which is still dominated by a relatively small
number of primary commodities and by state-owned enterprises, and to the inability of
Egyptian exports to maintain a stable share in international markets8.
It is therefore essential to give priority to development of the export sector. Among
the policies recommended to improve Egypt’s export position, currency devaluation is
one of the more obvious policy options but also seems to be the most debatable. The
remainder of this paper attempts to determine the effects of changes in the Egyptian
pound exchange rate on Egypt’s aggregated and disaggregated merchandise exports.
8 This may be due to policy factors, and/or production, marketing, distribution,…, inefficiencies ofEgyptian exporters. Such factors are briefly discussed in section V.
Figure (2) Relative Importance of Merchandise
to total Exports
0
50
100
70 73 76 79 82 85 88 91 94 97
%

7
Figure ( 3)Relative Importance of Manufactured
to Merchandise Exports
010203040
70 73 76 79 82 85 88 91 94 97
Figure ( 4)Growth Rate of Merchandise Exports
-50
0
50
100
70 73 76 79 82 85 88 91 94 97
Figure( 5 )
The Structure of Merchandise Exports
During 1990 -97
0.0
20.0
40.0
60.0
1990 1991 1992 1993 1994 1995 1996 1997
Finished Semi Primary Fuel Cotton

8
3.0 Evolution of the Egyptian Exchange Rate9
The Economic Reform and Structural Adjustment Program (ERSAP) was launched in
Egypt in 1991. The policy reform package included tight fiscal and monetary policy,
and public enterprise and foreign exchange reform measures. According to the latter
measures, the old multiple fixed parity exchange system was abolished in February
1991, and replaced temporarily by a dual flexible peg exchange rate system (Abdel-
Khalek, 1995). In October 1991, for the first time in decades, the exchange rate system
was unified in Egypt at a value guided by the market forces. The nominal exchange
rate (NER) was devalued by 23%10 and became fully convertible, and buying and
selling foreign currencies, upon obtaining proper licensing, was allowed outside the
banking system. Since then, NER of the Egyptian pound vis-à-vis the US dollar, being
used as a nominal anchor, has been roughly constant as depicted in Figure (6).
It is worth noting two aspects of this exchange reform. First is the option to use the
nominal exchange rate as an anchor in support of the stabilization effort. The NER,
being considered by the Government of Egypt as a symbol of stability, has been an end
to be pursued as much as a means to disinflation. Therefore, the Central Bank of Egypt
(CBE) has intervened in the exchange market to keep a fairly stable NER, which has
been virtually unchanged since the unification, thereby eliminating foreign exchange
risk. This policy, in fact, has proven successful in helping to contain inflation, thanks to
the two prerequisites for the maintenance of a successful anchor noted by Begg
(1996), namely a tight fiscal policy and adequate foreign exchange reserves which were
resoundingly delivered in the Egyptian case. Nevertheless, when the capital market is
sufficiently liberal, macroeconomic stabilization with an NER peg will usually induce
upward pressure on the real exchange rate. This has been the case for most Asian and
Latin American economies in 1980s and 1990s, most notably Chile, Malaysia, Mexico,
and Argentina (Quirk and Evans, 1995), as well as for Egypt over the last six years
(see Figure (6)). Hence, the success in containing inflation was at the cost of a
cumulative real appreciation. In these circumstances, the policy maker is faced with the
option of intervening in the exchange market and tightening of monetary and fiscal
9 Exchange rate is defined here as the price of US dollar in terms of Egyptian pound.

9
policy to counteract the currency appreciation and maintain the competitiveness of the
tradable sector or, alternatively, of leaving the policy unchanged, thereby raising the
specter of an unsustainable current account deficit down the road. In the case of
Egypt, this policy dilemma translates into a choice between keeping the current peg or
introducing (limited) flexibility in the exchange rate, hoping for a market driven
correction to follow in the medium term. (IMF, 1998).
In this regard, it should be noted that a fixed exchange rate will not by itself result in
zero inflation. After a devaluation and the resulting initial rise in the prices of tradable
commodities, a fixed or pegged exchange rate will limit the future rise in import prices
to that occurring abroad. However, if the domestic money supply and/or the velocity
of money continues to rise faster than real GDP, due to domestic fiscal and monetary
policies, the domestic inflationary pressures will be primarily confined to the non-
tradable sector of the economy. If prices for non-tradable goods and services rise
faster than tradables, the demand for imports will increase and the relative profitability
of exports will decline, eventually causing a deterioration in the current account.
Accordingly it is necessary to reassess very quickly when to abandon the fixed
exchange rate and use other policies to reduce inflation. The experience of diverse
Latin American countries demonstrates that mere application of an exchange rate
policy alone is not an adequate substitute for an effective, comprehensive anti-inflation
policy. Stabilizing price levels is certainly an essential step in any policy attempting to
10 From US$ 1 = LE 2.708 at the end of June 1990, to LE 3.342 by February 1991.
Figure (6) Egyptian Pound Nominal and Real Exchange
Rate during 1990-97
0 00
0 50
1 00
1 50
2 00
2 50
3 00
3 50
4 00
1990 1991 1992 1993 1994 1995 1996 1997
LE NER
RER
10
bring about a permanent change in relative prices, but this cannot be achieved simply
by fixing the NER. Except in the short run, when it is used as a means of changing
expectations, the exchange rate anchor for domestic prices has proven to be extremely
flimsy, particularly in high-inflation countries. On the contrary, one of the messages of
the East Asian success experience is that the exchange rate is an indispensable tool for
changing production patterns while maintaining an external equilibrium (Agosin and
Ffrench-Davis, 1995).
Given the above considerations, one may conclude that the choice of the NER as a
nominal anchor should only relate to the initial phase of stabilization. The main
question is, therefore, not whether stabilization by means of the NER is a good or bad
policy, per se, but what is the optimal timing for an exit. Determining this is more of an
art than an exact science (Bruno, 1995).
The second aspect of the exchange reform is the pegging of the domestic currency to
the US dollar to facilitate the management of the exchange rate for the Central Bank of
Egypt. However, according to IMF data on the geographic distribution of Egypt’s
merchandise trade, the European Union (EU) countries come before the United States
in the rank order of Egypt’s main trading partners [see Appendix Table (3)]. It has
been argued that pegging a country’s domestic currency to the currency of a foreign
country which is not the main trading partner will lead to a trade deficit when that
foreign currency appreciates (Korayem, 1997). In the case of Egypt, this risk could be
more profound in light of the likely increasing importance of Europe in Egypt’s trade
after the imminent agreement with the European Union to establish a free trade area.
The conclusion we can safely draw from the aforementioned is that the period after
1991 has witnessed real appreciation of the Egyptian pound. To have a complete
picture, the following questions have to be answered. What is the real exchange rate?
Is its appreciation a problem? And if it is so, is devaluation an appropriate policy to
solve it?

11
3.1 What Is the Real Exchange Rate?
Changes in the exchange rate affect the domestic price of foreign goods, but
adjustments that merely offset existing inflation differentials do not alter a nation’s
competitive position. For analytical purposes, economists construct real exchange rate
(RER) indices which remove changes in relative price levels from NER movements.
The most theoretically appealing definition of the RER is as the summary price ratio of
tradable to nontradable goods, which provides a summary measure of the real financial
incentives guiding resource allocation between these two key sectors of the economy.
If the domestic price of tradables rises relative to the price of nontradables, resources
will be reallocated toward the tradable goods sector and the trade balance will improve
accordingly. In this vein, the equilibrium RER corresponds to the relative price of
tradable to nontradable goods that is consistent with equilibrium in the nontradable
market in every period and with intertemporal solvency of the current account
(Guerguil and Kaufman, 1998).
An alternative definition of the real exchange rate between two countries’ currencies
has been recognized as an index of the prices of foreign goods relative to domestic
goods in those countries. This index has been used in studies where price data on
traded and nontraded goods are not available.11 The international competitiveness of a
country’s exports is generally reflected in its real exchange rate, which takes into
account both general price movements in this country relative to that of its trading
partners, and the cross exchange rate between this country and each of its trading
partners.
The RER is a key relative price. When it becomes too high it hurts growth, leads to a
buildup of a large external deficit, and endangers financial stability (Dornbusch and
Goldfajn, 1995). It is also a decisive factor in determining the response of production
of both exportables and importables (Agosin and Ffrench-Davis, 1995). In addition,
11 See for example, Edwards (1988) and (1989).
12
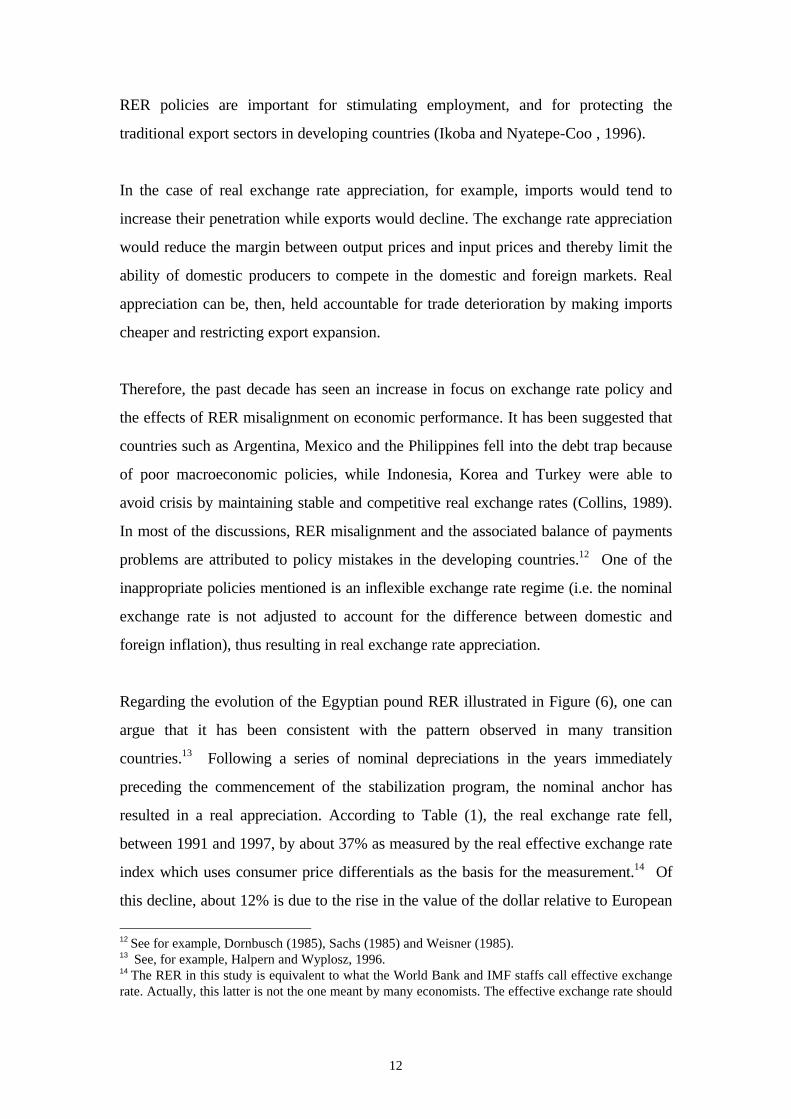
RER policies are important for stimulating employment, and for protecting the
traditional export sectors in developing countries (Ikoba and Nyatepe-Coo , 1996).
In the case of real exchange rate appreciation, for example, imports would tend to
increase their penetration while exports would decline. The exchange rate appreciation
would reduce the margin between output prices and input prices and thereby limit the
ability of domestic producers to compete in the domestic and foreign markets. Real
appreciation can be, then, held accountable for trade deterioration by making imports
cheaper and restricting export expansion.
Therefore, the past decade has seen an increase in focus on exchange rate policy and
the effects of RER misalignment on economic performance. It has been suggested that
countries such as Argentina, Mexico and the Philippines fell into the debt trap because
of poor macroeconomic policies, while Indonesia, Korea and Turkey were able to
avoid crisis by maintaining stable and competitive real exchange rates (Collins, 1989).
In most of the discussions, RER misalignment and the associated balance of payments
problems are attributed to policy mistakes in the developing countries.12 One of the
inappropriate policies mentioned is an inflexible exchange rate regime (i.e. the nominal
exchange rate is not adjusted to account for the difference between domestic and
foreign inflation), thus resulting in real exchange rate appreciation.
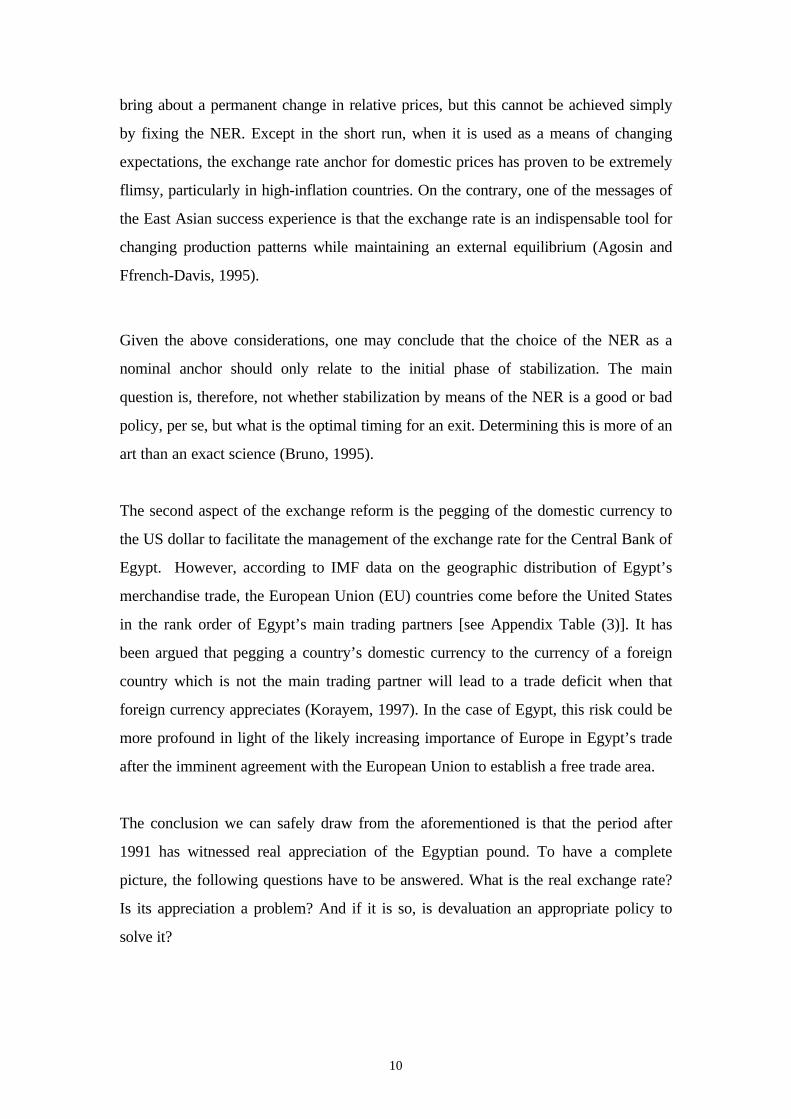
Regarding the evolution of the Egyptian pound RER illustrated in Figure (6), one can
argue that it has been consistent with the pattern observed in many transition
countries.13 Following a series of nominal depreciations in the years immediately
preceding the commencement of the stabilization program, the nominal anchor has
resulted in a real appreciation. According to Table (1), the real exchange rate fell,
between 1991 and 1997, by about 37% as measured by the real effective exchange rate
index which uses consumer price differentials as the basis for the measurement.14 Of
this decline, about 12% is due to the rise in the value of the dollar relative to European
12 See for example, Dornbusch (1985), Sachs (1985) and Weisner (1985).13 See, for example, Halpern and Wyplosz, 1996.14 The RER in this study is equivalent to what the World Bank and IMF staffs call effective exchangerate. Actually, this latter is not the one meant by many economists. The effective exchange rate should

13
currencies, which mostly compensated for their inflation, taken as a group, while the
Egyptian pound has remained constant against the dollar in nominal terms. The rest is
accounted for by the differential in inflation rates between Egypt and its trading partner
countries.
Table 1EGYPT: Nominal, and Real Export-Weighted Foreign Exchange Rate Indices, 1990-98 RatioYear
1990 1991 1992 1993 1994 1995 1996 1997 June 1998
NER (LE/US$) 60.06 100 100.01 101.21 101.70 101.80 101.74 101.74 110.68 NER (LE/FC) 61.43 100 101.73 90.17 90.31 92.80 93.91 87.79 89.14 RER (LE/FC) 69.98 100 93.16 76.25 72.74 71.45 69.45 63.38 57.72Source: Calculated (See Appendix Table 2)
The RER appreciation, by making tradables cheaper, will create incentives for the
reallocation of factors from the production of tradables to the production of
nontradables, and for a switching of consumers expenditures from nontradable towards
tradable goods. This will finally result in a larger nontradable sector, a smaller tradable
sector, and a larger trade balance deficit (Corbo and Hernandez, 1994 and 1996;
Calvo, et al., 1996).
However, caution should be observed when interpreting these results. At their face,
they may imply that the country is loosing its international competitiveness. This
however, should be qualified in an important respect, vis-à-vis the behavior of
fundamental factors determining the real equilibrium exchange rate (REER), which are
discussed below.
3.2 Does RER appreciation always endanger competitiveness?
In today’s world, economies must achieve international competitiveness and a more
dynamic position in world markets if they are to secure sustained development. In the
light of this, the question arises as to whether the existing exchange rate regime is still
consistent with external competitiveness and more generally, with the evolving
structural framework of the Egyptian economy (IMF, 1998).
incorporate the effects of all the various incentives offered (tariffs, subsidies, etc…,) (Agosin andFfrench-Davis, 1995).

14
Real appreciation of a currency is often interpreted as a loss in competitiveness of the
economy. However, the relationship between changes in the competitive position of a
country and movements in its RER is not straightforward. The RER appreciation is a
natural, and not necessarily negative, consequence of the reform process (Ortiz, 1994).
It may or may not compromise the competitive stance of a country. In fact, an
appreciation may reflect either a loss of competitiveness, when a misalignment
situation originates; or an improvement in competitiveness, when the movement in the
RER is due to fundamental factors15 (Guerguil and Kaufman, 1998). Each has different
implications for the conduct of policy. In the former, expeditious action would be
warranted to arrest or reverse the loss in competitiveness, whereas in the latter it
would be necessary to adopt more sanguine approach (Subramanian, 1997).
RER misalignment refers to a deviation of the actual RER from an equilibrium or long-
run value. The equilibrium RER (ERER) is not fixed. It changes over time in response
to the aforementioned real factors. The RER may deviate from the equilibrium level in
the short-run due to unsustainable fiscal and monetary policies. In the long-run it is
expected that the RER will move toward the equilibrium level consistent with internal
and external balance. (Ikoba and Nyatepe-Coo , 1996).
A recent study (Mongardini, 1998) shows that the RER has moved closer to the
equilibrium rate since 1991, and in spite of a subsequent overvaluation in the second
half of 1995 and the beginning of 1996, the difference between the two rates declined
from 20% at 1991 to about 7% at the end of 1996. This suggests that Egypt’s RER
has on average moved closer to its equilibrium rate in the past six years. The source of
this new relationship is due to the large appreciation of the ERER in the period
1991-1995 that may be attributed to the reduction in the debt-service ratio,16
technological innovation, and reduced tensions in the Middle-East conflict.17
However, as the study emphasized, the results should not be taken as a conclusive
15 Such as terms of trade, real interest rates abroad, expected capital flows, exchange and capitalcontrols, technological changes, and the composition of government spending (Edwards, 1989 and1994).16 In the period 1991-96 the rescheduling of Paris Club debt implied a cumulative reduction in the netpresent value of the outstanding foreign debt stock of 55%, thus reducing the debt-service ratio from33% in 1991 to below 10% in 1996.17 According to Mongardini (1998), they contributed by 122%, 27% and 8% respectively.
15
determination of Egypt’s ERER because more recent developments that were not
covered could clearly alter these conclusions.
Although the stabilization strategy has led, of course, to an appreciation of the
Egyptian pound RER, whether an overvaluation exists is controversial. Until recently,
the real appreciation was not tantamount to overvaluation and did not suggest a
problem at all. On the contrary, if allowed to float freely the Egyptian pound would
probably have appreciated in nominal terms against the dollar. The Central Bank had
been buying dollars up until 1998 to prevent an even more rapid real appreciation. This
is why Egyptian authorities were adamant that the LE was not overvalued and
reaffirmed this belief at every opportunity.
However, given the reversal of the situation since 1998, when the Central Bank started
drawing down its foreign reserves to keep the NER from depreciating, the possible
overvaluation of the Egyptian pound is again being questioned. The importance of the
issue stems from the fact that an overvaluation inhibits strong economic growth and,
more often than not, leads to a speculative siege on the currency in question which
ultimately forces a traumatic currency realignment. It is, therefore, considered a deeply
unstable situation, especially in a deregulated financial environment, which creates
mechanisms that amplify the excesses and can exacerbate the subsequent financial
distress and decline in real economic activity (Dornbusch and Goldfajn, 1995). That
sequence occurred in Europe a few years ago and has been repeated numerous times in
Latin America. The lesson should have been understood in Egypt. Regrettably,
however, Egyptian policy makers opted to overemphasize the disinflationary role of a
stable NER. This may be understood in a political context, where a devaluation may
be troublesome, and where it is much easier to allow high interest rates to prevail (e.g.,
September 1999) until some more convenient time comes to devalue.
3.3 Can Devaluation Work?
Whether a real depreciation can help increase net exports is controversial. The recent
literature is divided on the ability of a real devaluation to affect imports and exports.
Rose (1990,1991) and Ostry and Rose (1992) find that a real devaluation has generally

16
no significant impact on the trade balance, while Reinhart (1995) finds that a real
devaluation does affect the trade balance.
Studies that have discussed the LE devaluation effect on exports have expressed
doubts about the various channels through which expansionary effects of the
expenditure-switching and expenditure-reduction resulting from a devaluation are
achieved (Abdel-Khalek 1995 and 1997, Korayem 1993 and 1996, and Al-Shawarby,
1990 and 1997). They show that the contractionary effects of a devaluation on the
supply side are more damaging than those on aggregate demand and that special
attention should, therefore, be paid to compensate for the negative effects on
aggregate supply. They argue that a devaluation of the LE may hardly improve the
trade balance or boost output. It may even, in the long run, reduce output, if
investment falls. This could happen since a devaluation causes the cost of capital to
rise, which, in turn, discourages investment, depresses real incomes, and thereby
reflects negatively on the competitiveness of domestic production. With regard to
exports, perhaps the positive impact of devaluation will benefit mostly those non-
traditional manufactured industries in which the share of imported inputs in the total
cost of production is very low.
In trying to resolve the prolonged dispute about the likely impact and the effectiveness
of a devaluation on exports in the Egyptian case, this study aims to offer new evidence
on this issue by examining the relationship between exports and their determinants,
mainly the RER.

17
4.0 The Model
Increasing Egyptian exports can be achieved through expanding domestic supply
and/or increasing foreign demand. The ability and willingness to expand domestic
supply can be measured using general unrestricted equations that relate each of the
export categories to its price ( RER), and to a domestic capacity measure based on the
real gross domestic product (GDPR). The traditional export demand function includes
the real exchange rate and an activity variable, generally the world GDP. Because of
data constraints and the empirical success of this specification, it has dominated the
empirical literature for more than a quarter century (Senhadji and Montenegro, 1998).
A problem that has been largely ignored in the literature is that of nonstationarity,
which is present in most macroeconomic variables, invalidates classical statistical
inference. Thus, if the variables that enter the export equations are found to contain a
unit root, ignoring nonstationarity in these variables may lead to incorrect inferences.
This paper tackles this problem by deriving tractable export equations that can be
estimated, within the data constraints, using recent time series techniques that address
the nonstationarity of the data.
4.1 Data Sources and Definitions
Since reliable and consistent systematic data for Egypt are difficult to come across
through local sources, the primary source on which this study relies is the International
Monetary Fund’s International Financial Statistics (IFS), CD-ROM 02/97. The
exchange rate, consumer price indices and total world imports (as a proxy for world
income) are available on a yearly as well as on a monthly basis. Fairly disaggregated
merchandise export data and the “Egyptian Merchandise Exports’ Geographical
Distribution” are available from the CAPMAS18 Monthly Bulletin of Foreign Trade19
and Yearly Bulletin of Foreign Trade, and from the IMF Direction of Trade.
18 CAPMAS (Central Agency of Public Mobilization and Statistics) is the national statistical office ofthe Egyptian Government.19 In Arabic.

18
The needed data set was available at low and high frequencies: annual and monthly
respectively. The annual series, which cover the period 1970 to 1997, has the
advantage of providing actual data on all the needed variables and of giving insights
about the fundamental dynamics, but it includes a number of structural breaks. On the
other hand, the monthly series used (from January 1990 to October 1998) allows
reliable estimates during a structurally consistent period (1990-1998), and captures the
short-term impact of devaluation which may not be captured by the cointegration tests
on annual series. But monthly data are not available from any source for GDP or
indices of GDP and export prices, and while they can be generated from annual series,
as explained on the next page, generated data are not as accurate as actual data.
In order to capture the different dynamic properties of export behavior, the study uses
the data set at the two frequencies applying an appropriate estimation technique for
each. The following are the definitions of the symbols used in this study:
Xt total exports of goods and services.Xg Exports of goods (merchandise).Xm Finished exports (Manufactured).Xs Semi-finished exports.Xp Primary products (other than fuel and cotton) exports.Xf Fuel exports.Xc Raw cotton exports .Xgnof Exports of goods excluding fuel.GDPR Egypt Gross domestic product.GDPRW World Gross domestic product.IMPW World imports.RER Real exchange rate
The study used the following sequence of steps in the estimation of export equations
for both data series: 1) identify the characteristics of each series using unit root tests,
2) examine the causal relationships among and within the series, 3) specify the
appropriate parsimonious model used to characterize the relationship of these series to
one another, and then, 4) estimate the model.
19
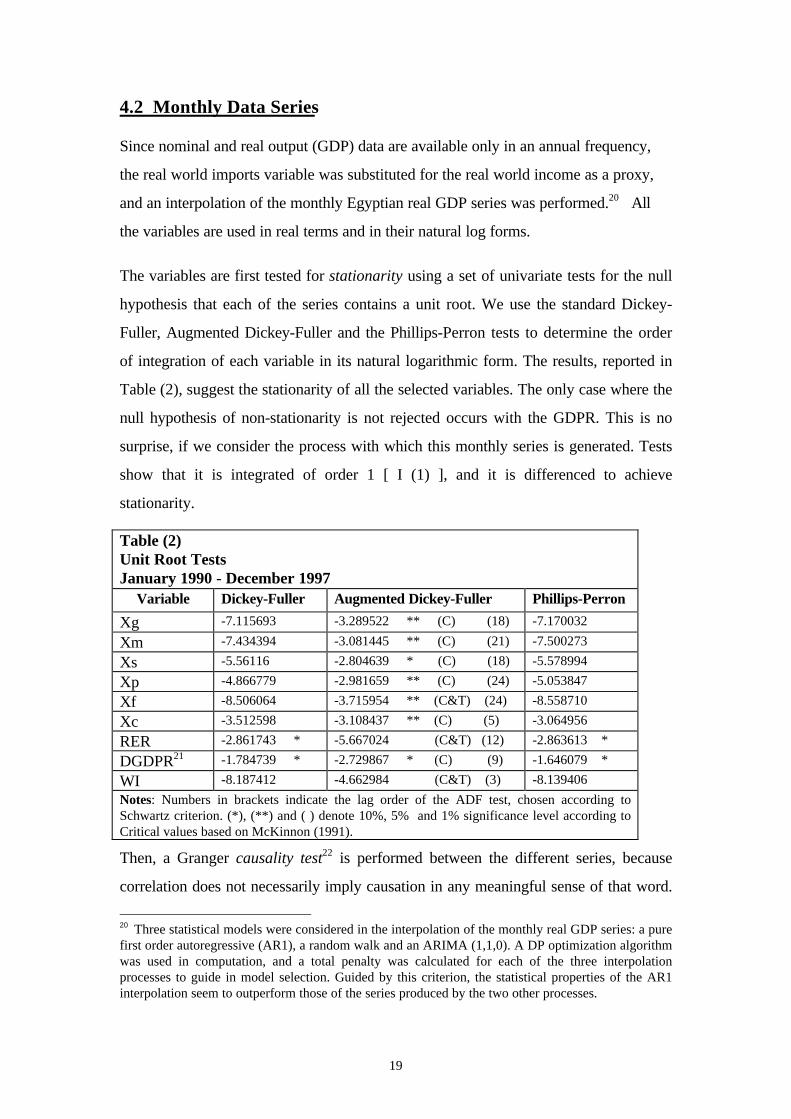
4.2 Monthly Data Series
Since nominal and real output (GDP) data are available only in an annual frequency,
the real world imports variable was substituted for the real world income as a proxy,
and an interpolation of the monthly Egyptian real GDP series was performed.20 All
the variables are used in real terms and in their natural log forms.
The variables are first tested for stationarity using a set of univariate tests for the null
hypothesis that each of the series contains a unit root. We use the standard Dickey-
Fuller, Augmented Dickey-Fuller and the Phillips-Perron tests to determine the order
of integration of each variable in its natural logarithmic form. The results, reported in
Table (2), suggest the stationarity of all the selected variables. The only case where the
null hypothesis of non-stationarity is not rejected occurs with the GDPR. This is no
surprise, if we consider the process with which this monthly series is generated. Tests
show that it is integrated of order 1 [ I (1) ], and it is differenced to achieve
stationarity.
Table (2)Unit Root TestsJanuary 1990 - December 1997
Variable Dickey-Fuller Augmented Dickey-Fuller Phillips-Perron
Xg -7.115693 -3.289522 ** (C) (18) -7.170032
Xm -7.434394 -3.081445 ** (C) (21) -7.500273
Xs -5.56116 -2.804639 * (C) (18) -5.578994
Xp -4.866779 -2.981659 ** (C) (24) -5.053847
Xf -8.506064 -3.715954 ** (C&T) (24) -8.558710
Xc -3.512598 -3.108437 ** (C) (5) -3.064956
RER -2.861743 * -5.667024 (C&T) (12) -2.863613 *
DGDPR21 -1.784739 * -2.729867 * (C) (9) -1.646079 *
WI -8.187412 -4.662984 (C&T) (3) -8.139406
Notes: Numbers in brackets indicate the lag order of the ADF test, chosen according toSchwartz criterion. (*), (**) and ( ) denote 10%, 5% and 1% significance level according toCritical values based on McKinnon (1991).
Then, a Granger causality test22 is performed between the different series, because
correlation does not necessarily imply causation in any meaningful sense of that word.
20 Three statistical models were considered in the interpolation of the monthly real GDP series: a purefirst order autoregressive (AR1), a random walk and an ARIMA (1,1,0). A DP optimization algorithmwas used in computation, and a total penalty was calculated for each of the three interpolationprocesses to guide in model selection. Guided by this criterion, the statistical properties of the AR1interpolation seem to outperform those of the series produced by the two other processes.
20
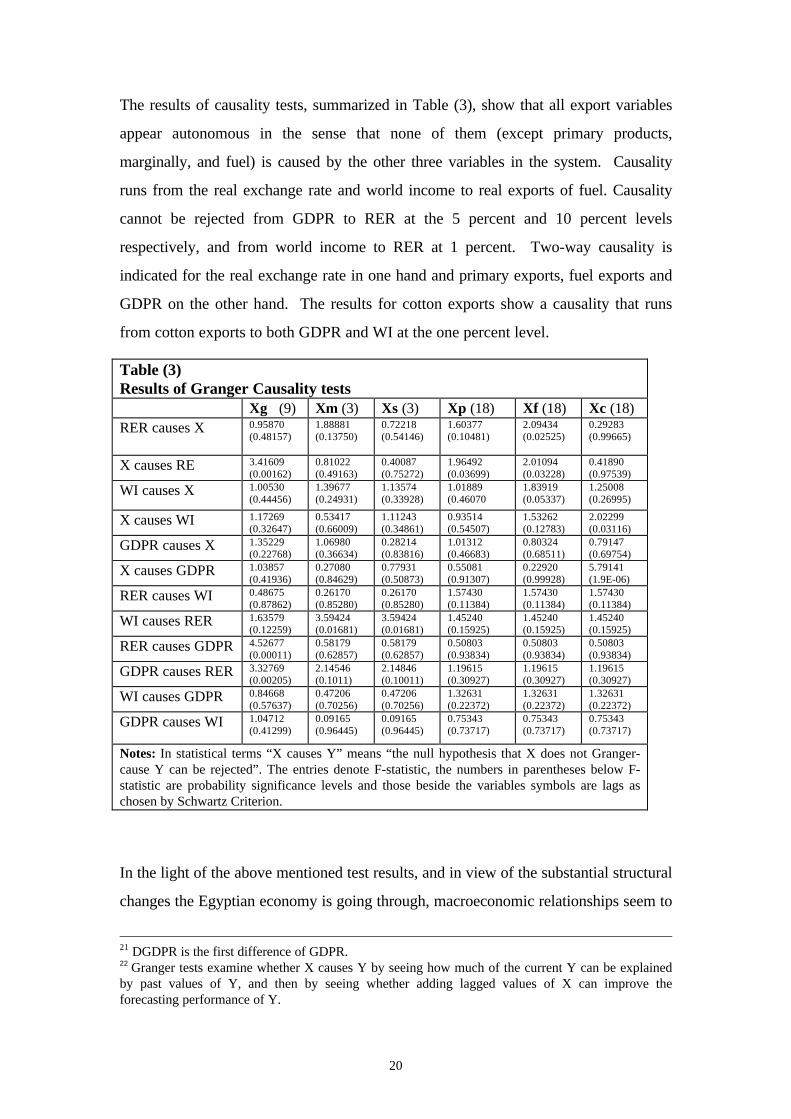
The results of causality tests, summarized in Table (3), show that all export variables
appear autonomous in the sense that none of them (except primary products,
marginally, and fuel) is caused by the other three variables in the system. Causality
runs from the real exchange rate and world income to real exports of fuel. Causality
cannot be rejected from GDPR to RER at the 5 percent and 10 percent levels
respectively, and from world income to RER at 1 percent. Two-way causality is
indicated for the real exchange rate in one hand and primary exports, fuel exports and
GDPR on the other hand. The results for cotton exports show a causality that runs
from cotton exports to both GDPR and WI at the one percent level.
Table (3)Results of Granger Causality tests
Xg (9) Xm (3) Xs (3) Xp (18) Xf (18) Xc (18)RER causes X 0.95870
(0.48157)1.88881(0.13750)
0.72218(0.54146)
1.60377(0.10481)
2.09434(0.02525)
0.29283(0.99665)
X causes RE 3.41609(0.00162)
0.81022(0.49163)
0.40087(0.75272)
1.96492(0.03699)
2.01094(0.03228)
0.41890(0.97539)
WI causes X 1.00530(0.44456)
1.39677(0.24931)
1.13574(0.33928)
1.01889(0.46070
1.83919(0.05337)
1.25008(0.26995)
X causes WI 1.17269(0.32647)
0.53417(0.66009)
1.11243(0.34861)
0.93514(0.54507)
1.53262(0.12783)
2.02299(0.03116)
GDPR causes X 1.35229(0.22768)
1.06980(0.36634)
0.28214(0.83816)
1.01312(0.46683)
0.80324(0.68511)
0.79147(0.69754)
X causes GDPR 1.03857(0.41936)
0.27080(0.84629)
0.77931(0.50873)
0.55081(0.91307)
0.22920(0.99928)
5.79141(1.9E-06)
RER causes WI 0.48675(0.87862)
0.26170(0.85280)
0.26170(0.85280)
1.57430(0.11384)
1.57430(0.11384)
1.57430(0.11384)
WI causes RER 1.63579(0.12259)
3.59424(0.01681)
3.59424(0.01681)
1.45240(0.15925)
1.45240(0.15925)
1.45240(0.15925)
RER causes GDPR 4.52677(0.00011)
0.58179(0.62857)
0.58179(0.62857)
0.50803(0.93834)
0.50803(0.93834)
0.50803(0.93834)
GDPR causes RER 3.32769(0.00205)
2.14546(0.1011)
2.14846(0.10011)
1.19615(0.30927)
1.19615(0.30927)
1.19615(0.30927)
WI causes GDPR 0.84668(0.57637)
0.47206(0.70256)
0.47206(0.70256)
1.32631(0.22372)
1.32631(0.22372)
1.32631(0.22372)
GDPR causes WI 1.04712(0.41299)
0.09165(0.96445)
0.09165(0.96445)
0.75343(0.73717)
0.75343(0.73717)
0.75343(0.73717)
Notes: In statistical terms “X causes Y” means “the null hypothesis that X does not Granger-cause Y can be rejected”. The entries denote F-statistic, the numbers in parentheses below F-statistic are probability significance levels and those beside the variables symbols are lags aschosen by Schwartz Criterion.
In the light of the above mentioned test results, and in view of the substantial structural
changes the Egyptian economy is going through, macroeconomic relationships seem to
21 DGDPR is the first difference of GDPR.22 Granger tests examine whether X causes Y by seeing how much of the current Y can be explainedby past values of Y, and then by seeing whether adding lagged values of X can improve theforecasting performance of Y.

21
be still unstable over time. In these circumstances, vector autoregressive (VAR)
modeling is a reasonable alternative to standard macroeconomic structural models
(Rusek, 1996).23 The VAR model, often interpreted as a generalized reduced form,
examines statistical relationships which may exist among observed variables and
provides an alternative structure to test hypotheses regarding the impact of changes of
each variable on the dynamics of other variables in the system.
In accordance with several previous studies (see, for example, Senhadji and
Montenegro, 1998, De Castro and Cavalcanti, 1997, Lukonga, 1994 and IMF 1989),
the behavior of exports is often explained by three explanatory variables: real exchange
rate, world income and gross domestic product. Increases in any of them should have
positive effects on a country’s exports. The responsiveness of the major export
categories in Egypt can be measured using general unrestricted equations that relate
exports to these three variables, all measured in constant 1991 LE.
Before turning to the estimation results, it is worth noting three points. The first is that
the number of lags in the estimation procedure is determined using the Akaike
Information Criterion (AIC) and the Schwartz Bayesian Criterion (SBC).24 The
second is that inferences from the Granger Causality F-tests, although indicative of the
structure of relationships among variables, have only limited validity. Therefore, the
study attempted to estimate a VAR containing all of the four variables; but the results
were very unsatisfactory, as almost all the RER estimated coefficients in the three
other variables’ equations appeared insignificant. Since the objective of the study is to
forecast the impact of the exchange rate on exports, it focuses on the export and
exchange rate variables at the expense of dropping the GDPR and WI variables from
the VAR model. Finally, a dummy variable was used to examine the likely impact of
ERSAP on the different equations’ intercepts and slopes.
The estimates of VAR models themselves are theoretically difficult to interpret. In an
attempt to make interpretations for policy analysis in a VAR model more straight-
forward, it has become common practice to look at the impulse response functions
(IRFs) and variance decomposition (VD) of the system to draw conclusions about a
23 For more details, see the Technical Appendix.

22
VAR.25 Care should be given to interpreting the IRFs and the VD as changing the
order of equations can dramatically change the impulse responses. However, changing
the order made no substantial qualitative differences in the results. The results reported
in this paper correspond to the following order: RER and then exports. The IRFs and
the VD are estimated over a 24-step horizon. A fairly long forecasting horizon is
chosen in order to account for the delayed response of each of the two variables to
innovations in the other variable and to his own innovations.
The full IRFs of RER and exports, with upper and lower standard errors bands, are
displayed graphically in Appendix Figures (1) to (5). The top diagrams always show
the corresponding effects of shocks to both variables on RER, while the bottom ones
illustrate those on real exports.26 It appears from these figures that, all the export time
paths resulting from the impulse response coefficients converge to zero. The absence
of explosive responses to unitary shocks reflects the stability of the estimated model.
For the individual variables, however, the way in which the convergence is attained is
quite different. In addition, tightness of the standard error bands around the IRFs gives
a good indication that model parameters and innovations are well estimated.
Table (4) presents a summary of the VD of the forecast errors for the different
categories of exports at the lags 1,3,6, 9, 12, 18, 24.27 The results indicate that more
than 90 percent of the forecast error of exports28 is explained by their own innovation.
For short lags, changes in RER do not explain much of the variation in export forecast
errors. After 3 lags, RER shocks accounts for 3% of the forecast error variance for
total exports as well as primary and semi-finished exports. While this percentage rises
toward the end of the forecasting horizon, it does not exceed 10% for both. Moreover,
RER innovation is responsible for less than 6% of the forecast error variance of
finished (manufactured) exports, which should be at the core of the export expansion
strategy.
24 Both are guides to the selection of the number of terms in an equation. Smaller values of thesecriteria are better.25 For more technical details, see Technical Appendix.26 There is no IRF for the cotton equation, as all the RER coefficients were insignificant.27 The complete set of VD and IRs results are available upon request.28 Except fuel exports whose figure is around 87% at different lags along the considered time path.

23
Table (4)Variance Decompositions for Export Categories(Percentage of the variance of the forecast error of Exportsexplained by RER)Period Xg Xm Xs Xp Xf
1 0.22 2.99 0.11 2.82 11.31
3 3.07 4.90 2.77 2.49 11.31
6 9.15 5.14 8.10 5.29 12.98
9 8.91 5.63 8.38 8.08 13.05
12 8.95 5.79 8.62 10.08 12.96
18 8.95 5.91 8.67 9.14 13.06
24 8.95 5.99 8.67 10.20 12.91
4.3 Annual Data Series
Using the annual series, export demand and supply functions are estimated for the total
exports of goods and services (Xt), total exports of goods (with and without fuel,
(Xg) and (Xgnof)), exports of cotton (Xc), and exports of primary (Xp), semi-finished
(Xs) and finished products (Xm).
Following the same sequence of steps, the variables are first tested for stationarity
using the same set of univariate tests used with monthly series. The different tests
suggest the non-stationarity of all the variables. The results, reported in Table (5),
show that all the selected variables are integrated of order 1 [ I (1) ].
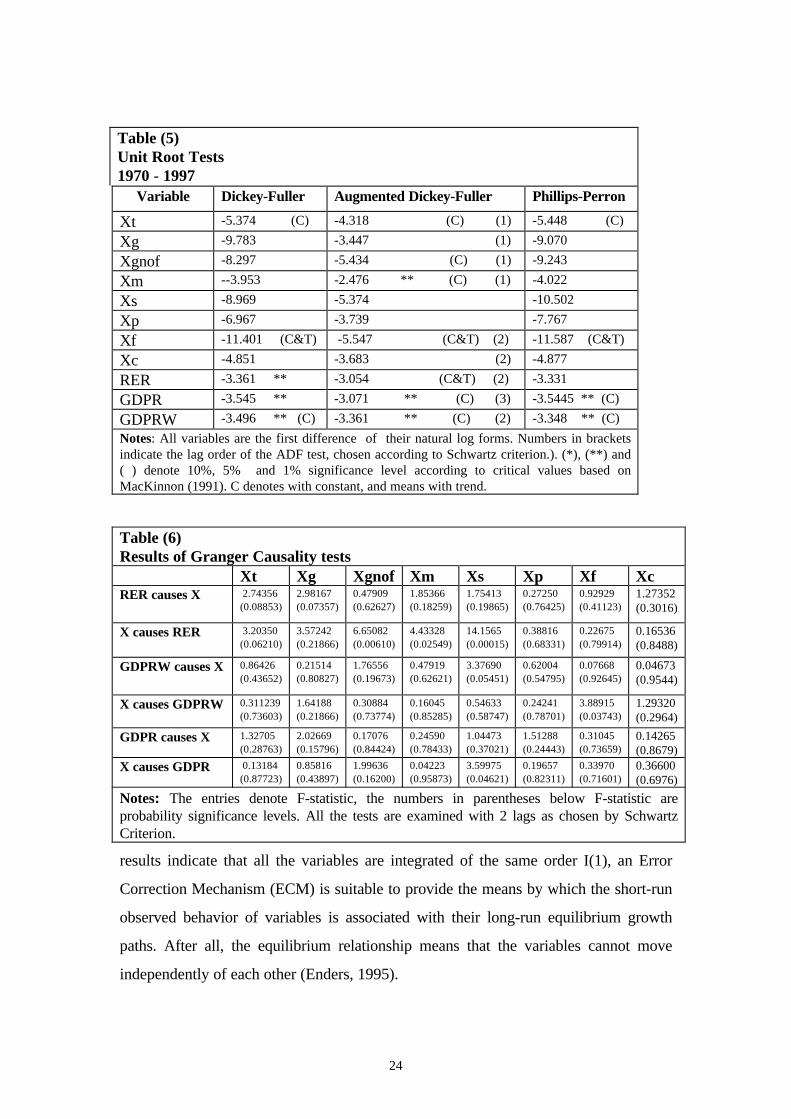
The results of Granger causality test are summarized in Table (6). They indicate almost
the same results as in the case of the monthly series. Namely, all export variables
appear relatively autonomous. RER causes changes only in Xt and Xg, and GDPRW
causes changes only in Xs. Surprisingly, causality runs from all export categories
(except Xp) to RER.29
In addition, since international commodity trade series are assumed to have long-term
relationships with one or more other series (Lord, 1991), and since the aforementioned
29 Devaluation has never been undertaken in Egypt, unless export performance becomes a majorproblem. This means that NER, and consequently RER, changes are caused by export variations.
24
Table (5)Unit Root Tests1970 - 1997
Variable Dickey-Fuller Augmented Dickey-Fuller Phillips-Perron
Xt -5.374 (C) -4.318 (C) (1) -5.448 (C)
Xg -9.783 -3.447 (1) -9.070
Xgnof -8.297 -5.434 (C) (1) -9.243
Xm --3.953 -2.476 ** (C) (1) -4.022
Xs -8.969 -5.374 -10.502
Xp -6.967 -3.739 -7.767
Xf -11.401 (C&T) -5.547 (C&T) (2) -11.587 (C&T)
Xc -4.851 -3.683 (2) -4.877
RER -3.361 ** -3.054 (C&T) (2) -3.331
GDPR -3.545 ** -3.071 ** (C) (3) -3.5445 ** (C)
GDPRW -3.496 ** (C) -3.361 ** (C) (2) -3.348 ** (C)
Notes: All variables are the first difference of their natural log forms. Numbers in bracketsindicate the lag order of the ADF test, chosen according to Schwartz criterion.). (*), (**) and( ) denote 10%, 5% and 1% significance level according to critical values based onMacKinnon (1991). C denotes with constant, and means with trend.
Table (6)Results of Granger Causality tests
Xt Xg Xgnof Xm Xs Xp Xf XcRER causes X 2.74356
(0.08853)2.98167(0.07357)
0.47909(0.62627)
1.85366(0.18259)
1.75413(0.19865)
0.27250(0.76425)
0.92929(0.41123)
1.27352(0.3016)
X causes RER 3.20350(0.06210)
3.57242(0.21866)
6.65082(0.00610)
4.43328(0.02549)
14.1565(0.00015)
0.38816(0.68331)
0.22675(0.79914)
0.16536(0.8488)
GDPRW causes X 0.86426(0.43652)
0.21514(0.80827)
1.76556(0.19673)
0.47919(0.62621)
3.37690(0.05451)
0.62004(0.54795)
0.07668(0.92645)
0.04673(0.9544)
X causes GDPRW 0.311239(0.73603)
1.64188(0.21866)
0.30884(0.73774)
0.16045(0.85285)
0.54633(0.58747)
0.24241(0.78701)
3.88915(0.03743)
1.29320(0.2964)
GDPR causes X 1.32705(0.28763)
2.02669(0.15796)
0.17076(0.84424)
0.24590(0.78433)
1.04473(0.37021)
1.51288(0.24443)
0.31045(0.73659)
0.14265(0.8679)
X causes GDPR 0.13184(0.87723)
0.85816(0.43897)
1.99636(0.16200)
0.04223(0.95873)
3.59975(0.04621)
0.19657(0.82311)
0.33970(0.71601)
0.36600(0.6976)
Notes: The entries denote F-statistic, the numbers in parentheses below F-statistic areprobability significance levels. All the tests are examined with 2 lags as chosen by SchwartzCriterion.
results indicate that all the variables are integrated of the same order I(1), an Error
Correction Mechanism (ECM) is suitable to provide the means by which the short-run
observed behavior of variables is associated with their long-run equilibrium growth
paths. After all, the equilibrium relationship means that the variables cannot move
independently of each other (Enders, 1995).
25
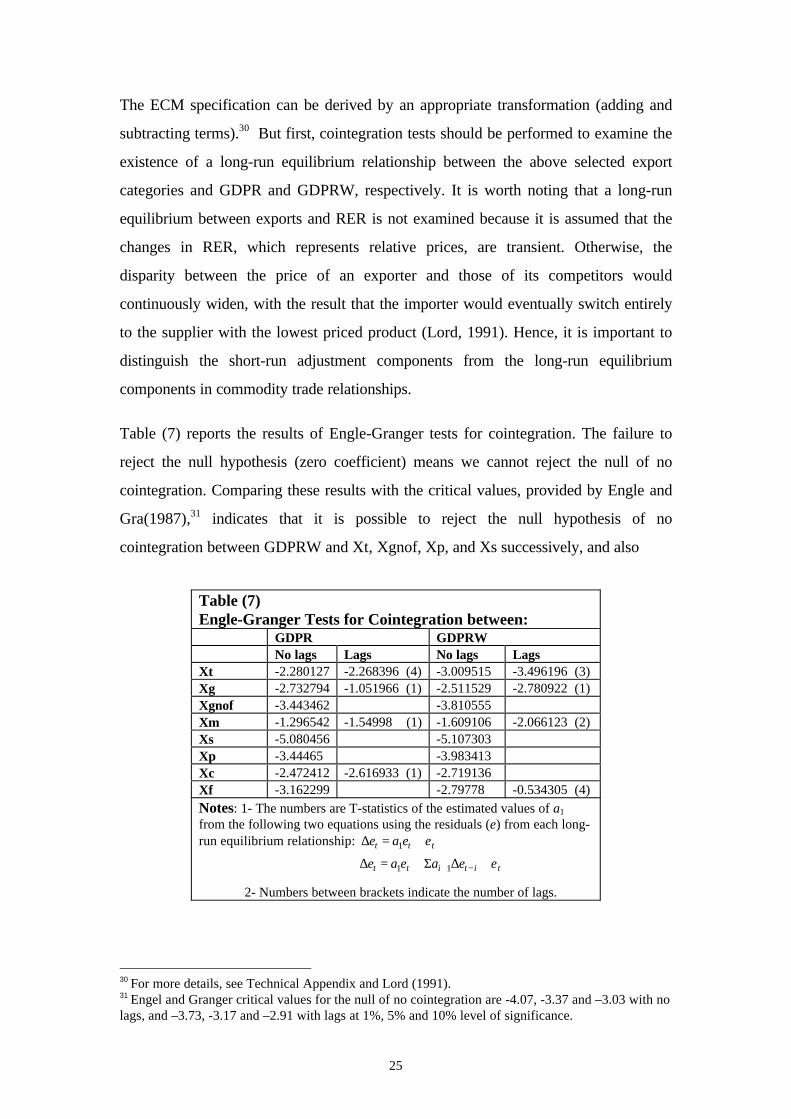
The ECM specification can be derived by an appropriate transformation (adding and
subtracting terms).30 But first, cointegration tests should be performed to examine the
existence of a long-run equilibrium relationship between the above selected export
categories and GDPR and GDPRW, respectively. It is worth noting that a long-run
equilibrium between exports and RER is not examined because it is assumed that the
changes in RER, which represents relative prices, are transient. Otherwise, the
disparity between the price of an exporter and those of its competitors would
continuously widen, with the result that the importer would eventually switch entirely
to the supplier with the lowest priced product (Lord, 1991). Hence, it is important to
distinguish the short-run adjustment components from the long-run equilibrium
components in commodity trade relationships.
Table (7) reports the results of Engle-Granger tests for cointegration. The failure to
reject the null hypothesis (zero coefficient) means we cannot reject the null of no
cointegration. Comparing these results with the critical values, provided by Engle and
Gra(1987),31 indicates that it is possible to reject the null hypothesis of no
cointegration between GDPRW and Xt, Xgnof, Xp, and Xs successively, and also
Table (7)Engle-Granger Tests for Cointegration between:
GDPR GDPRWNo lags Lags No lags Lags
Xt -2.280127 -2.268396 (4) -3.009515 -3.496196 (3)Xg -2.732794 -1.051966 (1) -2.511529 -2.780922 (1)Xgnof -3.443462 -3.810555Xm -1.296542 -1.54998 (1) -1.609106 -2.066123 (2)Xs -5.080456 -5.107303Xp -3.44465 -3.983413Xc -2.472412 -2.616933 (1) -2.719136Xf -3.162299 -2.79778 -0.534305 (4)Notes: 1- The numbers are T-statistics of the estimated values of a1
from the following two equations using the residuals (e) from each long-run equilibrium relationship: ttt eae ε+=∆ 1
2- Numbers between brackets indicate the number of lags.
30 For more details, see Technical Appendix and Lord (1991).31 Engel and Granger critical values for the null of no cointegration are -4.07, -3.37 and –3.03 with nolags, and –3.73, -3.17 and –2.91 with lags at 1%, 5% and 10% level of significance.
tititt eaeae ε+∆Σ+=∆ −+11

26
between GDPR and the three latter export variables and Xf. The results do not allow
the rejection of no cointegration, indicating the independence of the variables with each
other.
Table (8) depicts the estimates of the demand for export categories that are
cointegrated. Details of the specification of the export demand relationship are
discussed in the Technical Appendix. The estimates show that apart from total exports
of goods and services (Xt), all the price (RER) and income (GDPR) elasticities of
demand for the different export categories are statistically insignificant. Moreover, in
spite of the significance of Xt’s price and income elasticity estimates, they are very
low in magnitude: 0.16 and 0.57, respectively.
Table (8)Long-Run Elasticities of Demand for Egyptian Exports
Xt Xgnof XS XpRER 0.161313
(0.077970)0.132747(0.183504)
-0.346168(0.361411)
0.231095(0.163389)
GDPRW 0.574906(0.161945)
-0.353452(0.239555)
0.152872(0.436548)
-0.146669(0.195477)
The estimates of the price and capacity elasticities of the supply of Egyptian exports
are shown in Table (9). The long-run price elasticity of supply for exports is not
statistically significant for any of the four cointegrated export categories. In addition,
in spite of the significance of the capacity elasticity of supply in the three first
equations, its magnitude is less than unity and it has a negative sign.32
Table (9)Long-Run Elasticities of Egyptian Exports Supply
Xgnof XS Xp XfRER 0.134803
(0.181383)-0.078875(0.320990)
0.242395(0.171223)
0.237974(0.402394)
GDPR -0.538657(0.209674)
-0.448688(0.213629)
-0.452055(0.157183)
0.296961(0.298315)
32 This may be due to the fact that Egyptian economy exports primary and semi-finished productswhich are in excess of the needs of domestic industries (Al-Garf, 1995).
27
5.0 Exchange Rate and Exports: Articulating the Evidence
The empirical results suggest the following observations. First, the VAR model,
estimated with monthly series data, shows that Egyptian exports appear to have strong
autonomous components; and that while the influence of the real exchange rate on
exports cannot be entirely denied, the percentage contribution of RER shocks in the
forecast error variance of exports is very low. Second, from the annual series data, the
cointegration approach indicates the independence of Egyptian exports from the
movements in the Egyptian pound RER. Third, since the results derived from the two
methods, applied with different frequencies of data, are qualitatively equivalent, it may
be deduced that the estimates obtained are robust and that they provide strong
statistical evidence of the weak impact exchange rate variations have had on Egyptian
export performance. Neither method provides more than marginal support for the
argument in favor of devaluing Egyptian pound to promote export growth in the
current context.
Although the empirical evidence for developing countries largely supports the
theoretical argument concerning the favorable impact of a devaluation on exports,33
there are some studies [Rose (1990,1991) and Ostry and Rose (1992)] that find a real
devaluation has generally no significant impact on the trade balance. Nevertheless, in
view of the findings reported here, the experience of Egypt has been disappointing.
The results, in general, show little evidence to support a positive relation between RER
and exports, especially over a medium-term forecasting horizon. These findings imply
that the Egyptian economy, despite a substantial record of policy reform over the last
ten years, still suffers from some discrepancies and difficulties that make variations in
exports attributable to variables other than those suggested by economic theory and by
empirical evidence from other developing countries with similar characteristics.
33 A recent study (Senhadji and Montenegro, 1998) indicates that the average price elasticity is closeto zero in the short run but reaches about one in the long run. Twenty-two of the 53 industrial anddeveloping countries in the sample have point estimates of long-run elasticity larger than one, and for33 countries the unit-price elasticity cannot be rejected. It takes six years for the average priceelasticity to achieve 90% of its long-run level. A similar pattern holds for income elasticity.

28
Obviously, more research is needed to interpret this striking feature of Egyptian
exports. However, one may surmise that this relative independence of Egyptian
exports from the variables which should determine them, according to standard theory,
is the consequence of difficulties the Egyptian exporters face besides those related to
the exchange rate. There are three main sources of these difficulties: the business
sector itself, the government and its policies, and external factors.
While one of the main characteristics of the global market for exports is rapidly
changing tastes and preferences, most Egyptian exporters lack the readiness to adopt
their production techniques to these rapid changes and fail, therefore, to penetrate new
markets and, further, lose existing market shares. Egyptian exporters suffer also from
marketing problems, especially those related to quality assurances, including those
associated with ISO 9000 standards and guarantees in the form of both product
warranties and compliance with environmental standards.34 In addition, a high
proportion of commodity exports are produced by state-owned enterprises with limited
capacity to respond to market signals such as a change in the RER.
The government is responsible for some policies and factors that impede export
expansion and needs to adopt major reforms. The current tariff structure and the
limited competition of shipment services, for instance, impose additional costs on
exports, hitting non-traditional exports especially hard.35 Financial services, such as
pre- and post-shipment finance, insurance against exporters/importers’ default, and soft
loans for export activities also need solid improvements. In addition, bureaucracy,
import red tape and non-tariff barriers to trade cost the exporter large indirect
expenses. A recent study (DEPRA, 1998b) indicates that current GOE policies impose
an implicit tax of roughly over 30% on exports, which is inconsistent with the GOE
strategy of export-led growth.
34 For more details, see Al-Garf (1995).35 However, the positive effect of lower export production costs due to the reduction of tariffs and non-tariff barriers to trade in the 1990s may have counteracted the negative effects of real exchange rateappreciation and contributed to the lack of statistical correlation between the RER and export growthor contraction during this period.

29
Among the external difficulties that are not within Egypt’s ability to control, non-tariff
and tariff barriers imposed by other countries are an example. Usually, the internal
preferences implied by Custom Unions (CU) and Free Trade Areas (FTA) hurt outside
parties: Egyptian exporters in our case.
In view of the aforementioned, it is apparent that export promotion in Egypt is not
entirely an exchange rate problem, but rather more a behavioral and institutional one.
A continued policy and institutional reform effort, including the privatization of state-
owned enterprises, is crucial to resolve the weak export performance and improve
Egypt’s economic responsiveness to normal economic price signals like the exchange
rate. It appears that, unless these problems are effectively tackled, devaluation,
although needed to improve the long-term economic prospects of Egypt and to secure
the benefits of economic reform, will not help much, per se, in enhancing Egyptian
exports. Notwithstanding the appearances, it is important to interpret these results with
caution and not to attach a structural interpretation to them before further testing and
analysis within the context of a formal structural macroeconomic framework.

30
6.0 Summary and Conclusion
In the second half of the 1990s, after strenuous efforts, Egypt has come to be viewed
as a showcase of successful stabilization and economic reform. Nevertheless, growth
remains the major challenge to the Egyptian economy. In recent years, export-
promotion policies have been strongly advocated as a superior development strategy.
They have emphasized the role of manufactured goods as the core of any successful
export-led growth strategy. Hence, achieving higher sustainable growth must be
through a dynamic export sector founded on a robust manufacturing base. However,
Egypt’s external sector faces a number of major challenges that may contribute to
slower economic growth. This necessitates giving priority to development of the
export sector. Among the policies recommended to improve Egypt’s export position,
currency devaluation is a prominent candidate.
Since 1991, the NER, being considered by the Government of Egypt as a symbol of
stability, has been roughly constant. This has resulted in a real appreciation, between
1991 and 1997, by about 37% as measured by the export-weighted real exchange rate
index. However, the relationship between changes in the competitive position of a
country and movements in its RER is not straightforward. Changes in the RER may or
may not compromise the competitive stance of a country depending on whether the
RER is misaligned. A recent study shows that the RER has moved closer to the
equilibrium rate since 1991. Moreover, until recently, the real appreciation was not
seen as indicating overvaluation. Egyptian authorities were adamant that the LE was
not overvalued and reaffirmed this belief at every opportunity. But, the situation has
been reversed since 1998, when the Central Bank started drawing down its foreign
reserves to keep the NER from depreciating, and the possible overvaluation of the
Egyptian pound has become an issue.
Whether a real depreciation can help net exports is controversial. In trying to resolve
the prolonged dispute about the likely impact and the effectiveness of a devaluation on
exports in the Egyptian case, this study aims to offer new evidence on the issue by
estimating the relationship between exports and their determinants, mainly the RER.

31
Merchandise exports are divided into five categories: fuel, cotton, primary products,
semi-finished products and finished products.
The traditional export demand (supply) function is determined by two variables: the
real exchange rate, and an activity variable, generally the world GDP (the country’s
GDP). Because of data constraints and the empirical success of this specification, it has
dominated the empirical literature for more than a quarter century. A problem that has
been largely ignored in the literature is nonstationarity. It is present in most
macroeconomic variables and invalidates classical statistical inference. This paper
tackles this problem by deriving tractable export equations that can be estimated, using
recent time series techniques that address the nonstationarity of the data.
The needed data set are available at low and high frequencies: annual and monthly
respectively. The annual series covers the period 1970 to 1997, and the monthly series
used covers the period from January 1990 to December 1997. In order to capture the
different dynamic properties of export behavior, the study uses the two data sets. The
study uses the following sequence of steps in the estimation of export equations in both
of the data series: 1) identify the characteristics of each series using unit root tests; 2)
examine the causal relationships among and within the series; 3) specify the
appropriate parsimonious model used to characterize the relationships of these series
to one another; and 4) estimate the model.
With monthly data series, a Vector Autoregressive (AER) model represents an
alternative to a standard macroeconomic structural model. It has become common
practice to look at the impulse response functions (IRFs) and variance decomposition
(VD) of the system to draw conclusions about a VAR. The absence of explosive
responses to unitary shocks in the IRFs reflects the stability of the estimated model.
Also, tightness of the standard error band around the IRFs gives reasonable indication
that the model parameters and innovations are well estimated.
In addition, the VD of the forecast errors for the different categories of exports
indicates that at least 90 percent of the forecast error in the total merchandise exports,
as well as in the different export categories, is explained by their own innovation. At
short lags, changes in RER explain very little of the variations in export forecast errors.
32
In general, review of the VAR model shows that Egyptian exports appear to have
strong autonomous components; and that the influence of real exchange rate on
exports is almost always weak.
On the other hand, since the annual series are assumed to have a long-term relationship
with one or more other series, and since the unit-root test results indicate that all the
variables are integrated of order one, an Error Correction Mechanism (ECM) is
suitable to estimate how the short-run observed behavior of variables is associated with
their long-run equilibrium growth paths. Engle-Granger tests for cointegration indicate
that a long-run equilibrium relationship exists only between GDPRW and Xt, Xgnof,
Xp, and Xs, and between GDPR and Xgnof, Xp, Xs and Xf.
The estimates of the demand for exports that are cointegrated show that, apart from
total exports of goods and services (Xt), all the price (RER) and income (GDPR)
elasticities for the different export categories are statistically insignificant. Nonetheless,
in spite of the significance of Xt’s price and income elasticity estimates, they are very
low in magnitude: 0.16 and 0.57, respectively.
The long-run price elasticity of supply of exports is not statistically significant for any
of the four cointegrated export categories. In addition, in spite of the significance of
the capacity elasticity of supply in the three first equations, its magnitude is less than
unity and it has a negative sign. The cointegration approach indicates, in general, the
independence of Egyptian exports from the movements in the Egyptian pound RER.
Both methods corroborate each other and provide strong statistical evidence on the
weak role of exchange rate variations in determining Egyptian export performance, and
only marginal support for the argument in favor of devaluing Egyptian pound. These
findings imply that the Egyptian economy, despite a substantial record of policy reform
over the last ten years, still suffers from discrepancies and difficulties which make
variations in exports attributable to variables other than those provided by economic
theory and empirical evidence from other developing countries with similar
characteristics. There are three main sources for these difficulties: the limited capacity
of Egyptian export firms, especially the state-owned enterprises, to respond to market
signals, the government and its policies, and external factors.

33
Unless these problems are tackled efficiently, a devaluation, although needed to
improve the long-term economic prospects of Egypt and secure the benefits of
economic reform, may not significantly enhance Egyptian exports.

34
References
Abdel-Khalek, Gouda. (1995). “Economic Reform or Dutch Disease? On the Macroeconomic Effects of ERSAP” Economic Papers 7. Center for Economic and Financial Research & Studies, Cairo University, April.
__________. (1997). Stabilization and Structural Adjustment Policies in Egypt: Economic Reform or Dutch Disease? , Paper presented to the 4th Conference of the Arab Association for Economic Researches. Cairo. (December, 2-3). (Arabic)
Agosin, Manuel R. and Ricardo Ffrench-Davis. (1995).”Trade Liberalization and Growth: Recent Experiences in Latin America.” Journal of Interamerican Studies and World Affairs, Fall, Vol. 37, Issue 3, pp: 9-59.
Al-Shawarby, S. (1990). The Impact of the Egyptian Pound Devaluation on the Industrial Sector Current Activity during 1981/82-1986/87”. Unpublished MA. Thesis, Department of Economics, Faculty of Economics and Political Science, Cairo University.
___________(1997). ‘the Macroeconomic Effects of the Economic Reform and Structural Adjustment Program in Egypt: Analysis Using an Econometric Model.” Unpublished Ph.D. Thesis, Department of Economics, Faculty of Economics and Political Science, Cairo University.
Balassa, Bela. (1978). “Exports and Economic Growth: Further Evidence,” Journal of Development Economics 5: 181-89.
Begg, David. (1996). “Monetary Policy in Central and Eastern Europe : Lessons after a Decade of Transition,” IMF Working Paper, No. 96/108.
Bruno, Michael. (1995). “Comment on Dornbusch and Goldfajn: Currency Crises and Collapses,” Brooking Papers on Economic Activity, pp. 219-93.
Calvo, G., E. Leiderman and C. Reinhart (1993) “Capital Inflows and Real Exchange Rate Appreciation in Latin America : The Role of External Factors.” IMF Staff Papers, 40, 1 (March). Washington, D.C., International Monetary Fund (IMF).
Chow, Peter C. Y. (1987). “Causality between Export Growth and Industrial Development: Empirical Evidence from the NICs,” Journal of Development Economics 26, June: 55-63.
Collins, S. (1989). “Debt, Policy and Performance: An Introduction,” in J. Sachs and S. Collins (Eds.) , Developing Country Debt and Economic Performance, Vol. 3, Chicago: University of Chicago Press: pp. 1-16.

35
Corbo, Vittorio and Leonardo Hernandez. (1994).”Macroeconomic Adjustment to Capital Inflows: Latin American Style Versus East Asian Style”. World Bank Research Working Paper, No. 1377.
______________________. (1996), “Macroeconomic Adjustment to Capital Inflows: Lessons from Recent Latin American and East Asian Experience”, The World Bank Research Observer, 11(1): 61-85.
Davidson, et al. (1978). “Econometric Modeling of the Aggregate Time-Series Relationship Between Consumers’ Expenditure and Income in the United Kingdom”. Economic Journal 88: 661-92.
De Castro, A. S. and Marco Antonio F. De H. Cavalcanti. (1997). “Trade Equations for the Brazilian Economy: 1995/1995”. IMF Working Paper .
Dessus, Sebastian and Akiko Suwa-Eisenmann. (1998). “Trade Integration with Europe, Export Diversification and Economic Growth.” A paper presented to the Conference of Economics Department, May 4-6. “Challenges of Growth and Development in Egypt and Arab Countries”. Faculty of Economics and Political Science. Cairo.
Development Economic Policy Reform Analysis Project (DEPRA). (1998a). “TheInternational Competitiveness of Egypt in Perspective: First Report 1998.”Report funded by USAID/Egypt. Cairo, Egypt.
Development Economic Policy Reform Analysis Project (DEPRA). (1998b).Enhancing Egypt’s Exports. Report submitted to U.S. Agency forInternational Development (USAID), Economic Growth/Sector Policy(EG/SP). Cairo, Egypt.
Development Economic Policy Reform Analysis Project (DEPRA). (1999). AnEgyptian Furniture Industry Assessment, Part II: Trade Policy and MarketOpportunities. Report submitted to USAID/EG/SP. Cairo, Egypt.
Dornbusch, R., (1985) “Stabilization Policies in Developing Countries : What have we learned?” World Development, 10, September: 701-708.
Dornbusch, Rudiger. (1994). “ Mexico : Stabilization, Reform, and No Growth,” Brooking Papers on Economic Activity, pp. 253-315.
___________ and Ilan Goldfajn. (1995). Currency Crises and Collapses,” Brooking Papers on Economic Activity, Issue 2: 219-294.
__________ and William R. Cline. (1997). “Brazil’s incomplete stabilization and Reform,” Brooking Papers on Economic Activity, pp. 367-404.
Edwards, S. (1988). “Exchange Rate Misalignment in Developing Countries,” World Bank Occasional Paper, No. 2. New Series, Baltimore, MD: John Hopkins University Press.

36
_________(1989). “Real and Monetary Determinants of Real Exchange Rate Behavior,” Journal of Development Economics, 29, November: 311-341.
_________. (1994). Real and Monetary Determinants of Real Exchange Rate Behavior: Theory and Evidence from Developing Countries”, published in Williamson, John ed. (1994), Ch. 5.
Emery, Robert F. (1967). “The Relation of Exports and Economic Growth.” Kyklos 20: 470-86.
Enders, Walter.(1995). Applied Econometric Time Series. New York: John Wiley & Sons, Inc..
Engle, Robert E. and Clive W. J. Granger. (1987). “Cointegration and Error- Correction: Representation, Estimation, and Testing”. Econometrica 55 (March), 251-76.
Esfahani, Hadi S. (1991). “Exports, Imports, and Economic Growth in Semi- Industrialized Countries,” Journal of Development Economics 35: 93- 116.
Fair, Ray C. (1984), Specification, Estimation, and Analysis of Macroeconometric Models, Harvard University Press, Cambridge, Massachusetts.
Fajana, Olufemi. (1979). “Trade and Growth: The Nigerian Experience,” World Development 7, January: 73-78.
Feder, Gershon. (1982). “On Exports and Economic Growth,” Journal of Development Economics 12, February/April pp. 59-73.
Guerguil, Martine and Martin Kaufman (1998). “Competitiveness and the Evolution ofthe Real Exchange Rate in Chile,” IMF Working Paper, No. 58, April,International Monetary Fund.
Gupta, Bishnupriya and Amit S. Ray. (1998). “Real Exchange Rates and Manufactured Exports : A Study of India’s Potential Exports to the U.S.A.,” Journal of Asian Economics, Summer, Vol. 9, Issue 2, pp. 333-344.
Halpern, Laszlo and Charles Wyplosz. (1966). “Equilibrium Exchange Rates in Transition Economies,” IMF Working Paper, No. 96/125.
Heller, Peter S. and Richard C. Porter. (1978). “Exports and Growth : An Empirical Reinvestigation,” Journal of Development Economics 5, June: 191-93.
Hoekman, B. and A. Subramanian. (1996). “Egypt and Uruguay Round,” Policy Research Working Paper 1597. The World Bank.
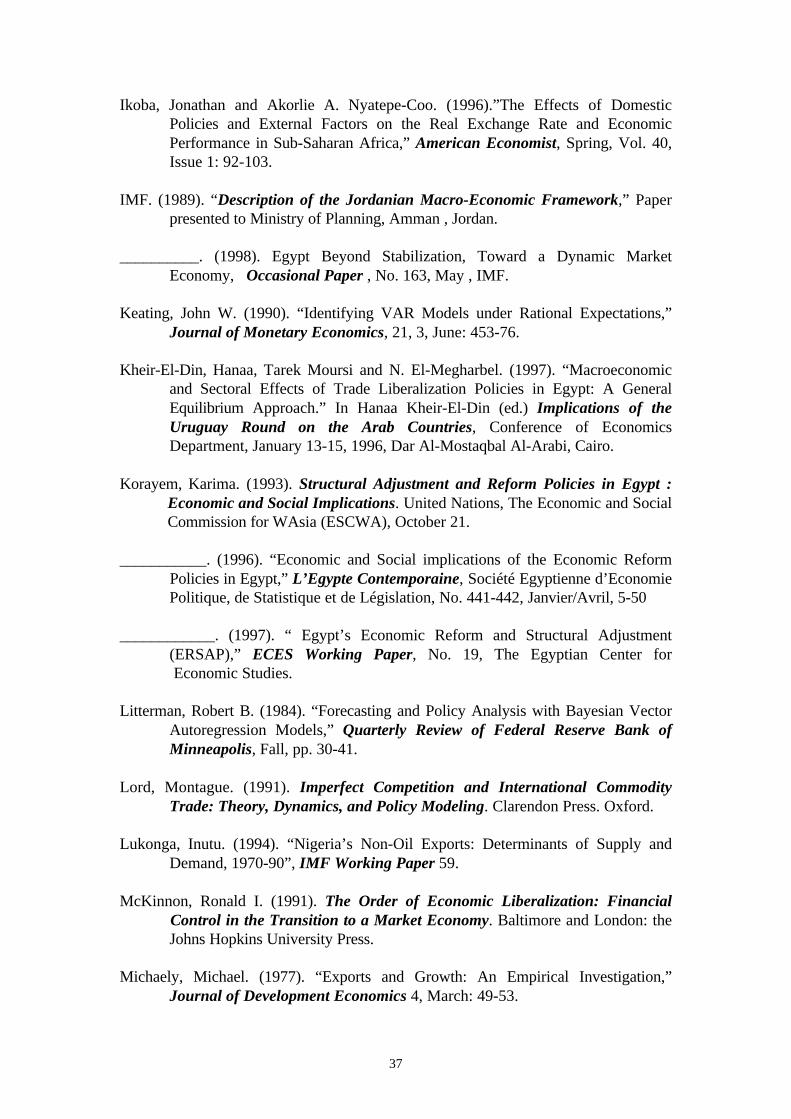
37
Ikoba, Jonathan and Akorlie A. Nyatepe-Coo. (1996).”The Effects of Domestic Policies and External Factors on the Real Exchange Rate and Economic Performance in Sub-Saharan Africa,” American Economist, Spring, Vol. 40, Issue 1: 92-103.
IMF. (1989). “Description of the Jordanian Macro-Economic Framework,” Paper presented to Ministry of Planning, Amman , Jordan.
__________. (1998). Egypt Beyond Stabilization, Toward a Dynamic Market Economy, Occasional Paper , No. 163, May , IMF.
Keating, John W. (1990). “Identifying VAR Models under Rational Expectations,” Journal of Monetary Economics, 21, 3, June: 453-76.
Kheir-El-Din, Hanaa, Tarek Moursi and N. El-Megharbel. (1997). “Macroeconomic and Sectoral Effects of Trade Liberalization Policies in Egypt: A General Equilibrium Approach.” In Hanaa Kheir-El-Din (ed.) Implications of the Uruguay Round on the Arab Countries, Conference of Economics Department, January 13-15, 1996, Dar Al-Mostaqbal Al-Arabi, Cairo.
Korayem, Karima. (1993). Structural Adjustment and Reform Policies in Egypt :Economic and Social Implications. United Nations, The Economic and SocialCommission for WAsia (ESCWA), October 21.
___________. (1996). “Economic and Social implications of the Economic Reform Policies in Egypt,” L’Egypte Contemporaine, Société Egyptienne d’Economie Politique, de Statistique et de Législation, No. 441-442, Janvier/Avril, 5-50
____________. (1997). “ Egypt’s Economic Reform and Structural Adjustment (ERSAP),” ECES Working Paper, No. 19, The Egyptian Center for Economic Studies.
Litterman, Robert B. (1984). “Forecasting and Policy Analysis with Bayesian Vector Autoregression Models,” Quarterly Review of Federal Reserve Bank of Minneapolis, Fall, pp. 30-41.
Lord, Montague. (1991). Imperfect Competition and International Commodity Trade: Theory, Dynamics, and Policy Modeling. Clarendon Press. Oxford.
Lukonga, Inutu. (1994). “Nigeria’s Non-Oil Exports: Determinants of Supply and Demand, 1970-90”, IMF Working Paper 59.
McKinnon, Ronald I. (1991). The Order of Economic Liberalization: Financial Control in the Transition to a Market Economy. Baltimore and London: the Johns Hopkins University Press.
Michaely, Michael. (1977). “Exports and Growth: An Empirical Investigation,” Journal of Development Economics 4, March: 49-53.

38
_______________. (1979). “Exports and Growth: A Reply,” Journal of Development Economics 6, March: 141-43.
______________ et.al., (1991), Lessons of Experience in the Developing World, Vol.7 in Demetris Papageorgiou et al., eds., Liberalizing Foreign Trade . Cambridge, Mass.:Basil Blackwell.
Mongardini, Joannes. (1998). “Estimating Egypt’s Equilibrium Real Exchange Rate,” IMF Working Paper, No. 5, May 1998, IMF.
Moursi, Tarek A. (1998). “The Cyclical Behavior of Prices in Egypt,” Paper presented to the Conference of Economics Department, May 4-6 May, Faculty of Economic and Political Science, Cairo.
Ortiz, Guillermo. (1994). “Comment on Rudiger Dornbusch: Stabilization and Monetary Reform in Latin America.” In A Framework for Monetary Stability, edited by J. Beaufort Wijnholds, Sylvester Eijffinger, and Lex H. Hoogduin. Boston: Kluwer Academic Publishers.
Ostry, J., and A. Rose. (1992). “An Empirical Evaluation of the Macroeconomic Effects of Tariffs.” Journal of International Money and Finance 11, 63-79. Petri, P. (1997). “Trade Strategies for the Southern Mediterranean”. OECD Development Center Technical Paper. Paris.
Quirk, Peter and Owen Evans (1995). Capital Account Convertibility: Review of Experience and Implications for IMF Policies, IMF Occasional Paper, No. 131, Washington: International Monetary Fund.
Radelet, Steven. (1999). “Manufactured Exports, Export Platforms, and Economic Growth, ” a Paper presented to ECES Conference “Growth Beyond Stabilization: Prospects for Egypt”. The Egyptian Center for Economic Studies. Cairo. February 3rd- 4th.
Reinhart, C. (1995). “Devaluation, Relative Prices, and International Trade”. IMF Staff Papers 42, No. 2.
Rose, A. (1990). “Exchange Rates and the Trade Balance: Some Evidence from Developing Countries”. Economic Letters 34, 271-75.
_______ (1991). “The Role of Exchange Rates in Popular Models of International Trade: Does the Marshall-Lerener Condition Hold?” Journal of International Economics 30: 301-16.
Rusek, Antonin. (1996). “Real Exchange Rates, Economic Performance, and Trade Balances in the Central European Free Trade Association,” International Advances in Economic Research, November, Vol. 2, Issue 4: 386-393)

39
Sachs, J. (1985). “ External Debt and Macroeconomic Performance in Latin America and East Asia,” Brooking Papers on Economic Activity, 2: 523-564.
_______ and A. Warner (1995). “Natural Resource Abundance and Economic Growth”. Development Discussion Papers No. 517, Harvard Institute for International Development.
Sargent, Thomas J. (1979). “Estimating Vector Autoregressions Using Methods not Based on Explicit Economic Theories,” Quarterly Review, Federal Reserve Bank of Minneapolis, Summer: 8-14.
Schadler, Susan, Maria Carkovic, Adam Bennet and Robert Khan, 1993, “Recent Experiences with Surges in Capital Inflows”, IMF Occasional Paper, no. 108, Washington, D.C., December.
Sendhaji, Abdelhak and Claudio Montenegro. (1998). “Time Series Analysis of Export Demand Equations: A Cross-Country Analysis,” International Monetary Fund Working Paper , IMF, Washington, DC., October.
Sims, C. (1982). “Policy Analysis with Econometric Models,” Brooking Papers on Economic Activity, pp. 107-152.
Stryker, Dirck and Selina Pandolfi. (1999). “Investment, Trade, Growth and Poverty,” a Paper presented to ECES Conference “Growth Beyond Stabilization: Prospects for Egypt”. The Egyptian Center for Economic Studies. Cairo. February 3rd- 4th.
Subramanian, Arvind (1977). ”The Egyptian Stabilization Experience: An Analytical Retrospective,” ECES Working Paper, no. 18, The Egyptian Center for Economic Studies, Cairo, October.
Tyler, William. (1981). “Growth and Export Expansion in Developing Countries: Evidence from Time-Series and Cross-Section Data,” Journal of Development Economics 9, August: 121-30.
Weisner, Eduardo, (1985). “Latin American Debt: Lessons and Pending Issues,” American Economic Review, 75, May, pp. 191-195.
World Bank. (1997). “Egypt: Issues in Sustaining Economic Growth”, Arab Republic of Egypt Country Economic Memorandum, Washington, March.

A-1
Technical Appendix
This appendix presents the technical details of this study that are not readily available
in other DEPRA studies. An earlier work (DEPRA, 1999) has shown the techniques
used to identify the characteristics of each series, and to model the supply and demand
relationships of exports, as well as the exchange rate effects. This technical Appendix
describes, therefore, VAR model only.
VAR Model
The VAR technique was developed in the late 1970s and has been recommended by
Sims (1982) as a reliable alternative to the estimation of large structural models. Since
one of the major advantages of the VAR approach is that it does not often postulate ad
hoc formulated restrictions of structural models, it is used , in this particular study, to
eliminate the need to impose a priori restrictions on dynamic interrelationships between
variables. Thus it is possible to distinguish between the different determinants of the
volume of exports, and also the extent to which the real exchange rate contributed to
changes in this volume. The main hypothesis that will be tested from the theoretical
analysis is whether changes in the real exchange rate cause changes in real export (by
export category).
Technically speaking, the VAR model is the set of linear dynamic equations in which
each variable is specified as a function of equal number of lags of itself and all other
variables in the system. The lag structure is considered a proxy designed to account for
the role of expectational dynamics, adjustment and transaction costs, and persistent
random shock disturbances (Keating, 1990).
The VAR approach is frequently used to analyze the response of the system to a
particular initial shock and to infer from there the impact of the dynamics of individual
variables on the historical evolution of the system, using variance decomposition and
impulse response functions (discussed later).
VARs have also proven, although with considerable controversy, successful for
conditional forecasting. Sargent (1979) points out that the problem with the character

A-2
of the model is that the parameters, which are taken to be constant, are not generally
invariant to changes in the time path of one or more of the variables. If so, then it is
inappropriate to use the estimated coefficients to examine the effects of changing one
of the variables on other variables. This problem is generally known as the so-called
Lucas critique (Lucas, 1976).
Although the Lucas point is a logical one, the key question for any given experiment
with an econometric model is the likely size of this error. It is argued that the errors in
the multipliers that result from not accounting for the parameter changes may be much
smaller than, say, the errors that result from aggregation (Fair, 1984). However, the
quantitative importance of Lucas critique is still an open question.
Litterman (1984) argues that this problem is common to practically all models used for
the evaluation of policy alternatives. Hence, there is no reason in principle why policy
responses predicted by a model would not be correct when the policy actions
considered are similar to those observed in the historical period over which the model
is estimated. Fair (1984) emphasizes the likely size of this error in an econometric
model. According to Fair, the errors in the multipliers that result from not accounting
for the parameter changes may be significantly smaller than, say, the errors that result
from aggregation. Therefore, it is argued that conditional forecasting should not be
dismissed out of hand, but one has to keep in mind the large degree of uncertainty
present when using conditional forecasts to assess the impact of alternative policy
options (Rusek, 1996).
The purpose of this study is to model relationships between real exports and their
determinants in the Egyptian economy. With n lags, the four variables in the VAR
model are specified as follows:
RERtit
i
n
RERiit
i
n
RERiit
i
n
RERiit
i
n
RERi
RERt uWIGDPRRERRXcRER +++++= −
=−
=−
=−
=∑∑∑∑
11111 γδβα
GDPRtit
i
n
GDPRiit
i
n
GDPRiit
i
n
GDPRiit
i
n
GDPRi
GDPRt uWIGDPRRERRXcGDPR +∑+∑+∑+∑+= −
=−
=−
=−
= 11111 γδβα
jjjjjj
t
RX
tit
i
n
RX
iit
i
n
RX
iit
i
n
RX
iit
i
n
RX
i
RX
j uWIGDPRRERRXcRX +++++= −=
−=
−=
−=
∑∑∑∑1111
1 γδβα

A-3
Where RXJ stands for the real export of the category j (=total exports and finished,
semi-finished, primary products, fuel and cotton exports), RER stands for the real
exchange rate calculated as the nominal exchange rate (number of units of LE per U.S.
dollar) multiplied by the ratio of trade-weighted consumer price index (CPI) of the
key currencies of major importing countries to the domestic CPI. GDPR is the
Egyptian real GDP, and WI is the real world income. The u’s are the stochastic error
terms, called impulse or innovations in the language of VAR.
Two tools of the VAR model—the impulse response functions and the decomposition
of the forecast error variance—are used to analyze the interrelationships between
variables. An impulse response function in the VAR model describes the response of
an endogenous variable to one of the innovations. Specifically, it traces the effect on
current and future values of the endogenous variable of a one standard deviation shock
of the innovation, while the variance decompositions in the VAR model breaks down
the variance of the forecast error for each variable into components that can be
attributed to each of the explanatory variables illustrating the relative importance of the
random innovations (Enders, 1995).
1. Impulse Response Function
Analyzing the responses of the system to particular initial shocks using the impulse
response functions (IRFs) allows better insight into the dynamic properties of the
estimated VARs. The ambiguity in interpreting IRFs arises from the fact that the errors
are never totally uncorrelated. The least contemporaneous correlations among the
innovations could distort the true impact of shocks in one variable on the others. Thus,
a triangularization of variance-covariance matrix of residuals is required (Sims, 1980).
This is achieved by a Cholesky decomposition so that the covariance matrix of the
resulting innovations is diagonal. However, care should be given to interpreting the
IRFs, as changing the order of equations can dramatically change the impulse
responses.
WItit
i
n
WIiit
i
n
WIiit
i
n
WIiit
i
n
WIi
WIt uWIGDPRRERRXcWI +++++= −
=−
=−
=−
=∑∑∑∑
11111 γδβα

A-4
Plotting the IRFs is a practical way to visually represent the behavior of the variables’
series in response to the various shocks, and to trace out the time paths of the effects
of pure innovations’ shocks.
2. Variance Decomposition
Understanding the properties of the forecast errors is exceedingly helpful in uncovering
interrelationships among the variables in the system. Suppose that we knew the
coefficients of A and B in (A.1.2 ) and wanted to forecast the various values of Xt+i
conditional on the observed values of Xt . Updating (A.1.2) one period and taking the
conditional expectation of Xt+i , we obtain(A.1.3)
(A.1.2)
(A.1.3)
Note that the one-step ahead forecast error is . More generally, it is
easily verified that the n–step ahead forecast error is:
(A.1.4)
The forecast error variance decomposition tells us the percentage share of each
particular shock to one-step ahead forecast errors variance of dependent variable. If,
in the case of our study, shocks explain none of the forecast error variance of
{ } at all forecast horizons, we can say that the { } sequence is exogenous. In
such a circumstance, the { } sequence would evolve independently of the
shocks and { } sequence. At the other extreme, shocks could
explain all the forecast error variance in the { } sequence at all forecast horizons,
so that { } would be entirely endogenous. Hence, VD provides an indication of
how relatively important individual shocks are in determining the variations of a
variable.
ttt uBXAX ++= −1
ttt BXAXE +=+1
11
22
1 ......... +−
−+−++ ++++ tn
ntntnt eBeBBee
111 +++ =− ttt eEXX
RERtu
tRX tRX
tRX
RERtu tRER
RERtu
tRX
tRX

Figures Appendix
Appendix Figure 1: Merchandise Exports’ Impulse Responses 1990:1—1997:12
Appendix Figure 2: Finished Exports’ Impulse Responses 1990:1—1997:12
Appendix Figure 3: Semi-Finished Exports’ Impulse Responses 1990:1—1997:12
Appendix Figure 4: Primary Products Exports’ Impulse Responses 1990:1—1997:12
Appendix Figure 5: Fuel Exports’ Impulse Responses 1990:1—1997:12


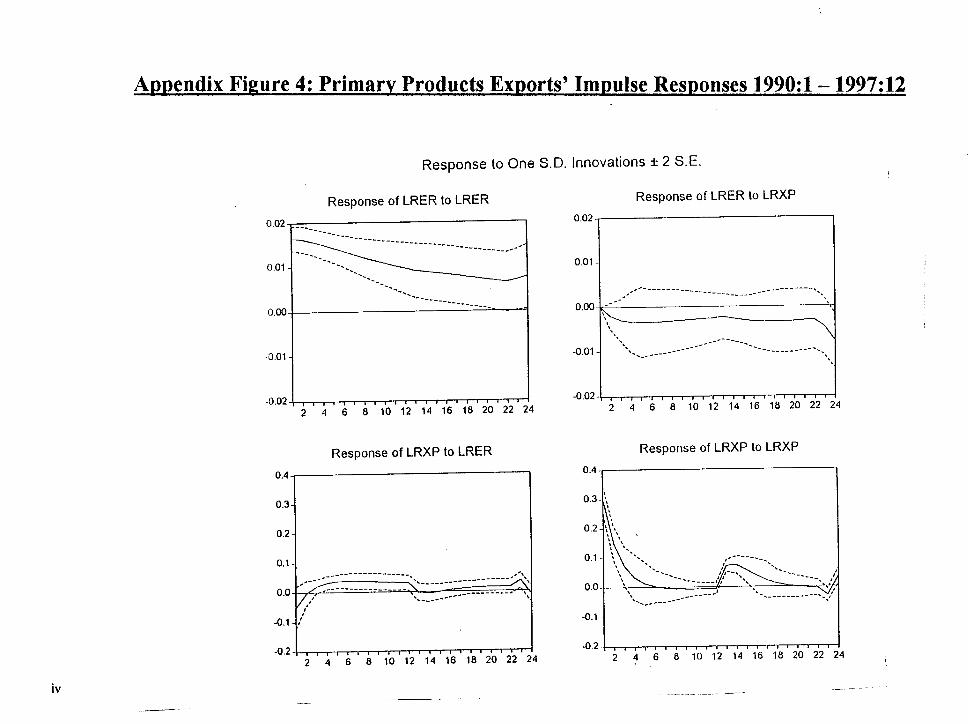


Statistical Appendix
Appendix Table 1: Basic Database
Appendix Table 2: EGYPT: Real Export-Weighted Foreign Exchange RateCalculation, 1970-98
Appendix Table 3: EGYPT: Geographical Distribution of Exports, 1990-94

Appendix Table (1)Basic Database
Groos Domestic Product
Real World Gross Dom.
Product
Total Exports of Goods and
Services
Total Merchandise Exports
Exports of Fuel
Exports of Cotton
Exports of Promary Products
Exports of Semi-
Finished Goods
Exports of Finished
Goods
Gross Domestic Product Deflator
Total Exports
Price Index
Merchand.Export
Price Index
Fuel Export
Price Index
Cotton Export
Price Index
Primary Product Export
Price Index
Semi-Finished Export
Price Index
Finished Export
Price Index
Merchand. (no fuel)
Export Price Index
Nominal Exchange
Rate
Mil LE % Mil LE Mil LE Mil LE Mil LE Mil LE Mil LE Mil LE % % % % % % % % % LE(1) (2) (3) (4) (5) (6) (7) (8) (9) (10) (11) (12) (13) (14) (15) (16) (17) (18) (19)
1970 2971 49.4 439 331.0 15.8 147.9 26.4 44.8 96.1 11.0 5.2 9.0 6.2 5.9 7.1 9.9 13.9 9.6 0.41971 3203 51.2 447 343.1 2.9 175.0 25.3 44.2 95.7 11.1 5.4 9.1 6.3 6.0 7.2 10.0 14.1 9.6 0.41972 3417 53.6 457 358.6 23.4 162.0 23.4 51.8 98.1 11.2 5.2 9.2 6.3 6.0 7.2 10.1 14.2 9.8 0.41973 3663 56.7 531 444.1 44.7 191.9 45.1 59.0 103.4 12.0 6.4 9.9 6.8 6.4 7.8 10.8 15.2 10.4 0.41974 4197 58.1 890 593.3 50.4 279.1 39.0 85.7 139.1 13.7 10.4 11.3 7.7 7.4 8.9 12.4 17.4 11.8 0.41975 4886 58.8 894 548.6 51.8 201.8 46.4 88.8 159.8 14.8 9.9 12.1 8.3 7.9 9.5 13.3 18.6 13.2 0.41976 6276 61.9 1034 595.4 149.1 154.8 72.1 77.1 142.4 15.9 11.1 12.5 9.2 8.4 10.8 11.2 17.1 12.7 0.41977 8210 64.6 1470 668.4 161.8 182.3 78.5 90.5 155.3 17.4 12.7 12.9 10.1 8.9 11.4 1.5 15.0 7.6 0.41978 9783 67.3 1945 679.8 188.6 131.5 67.3 147.5 144.9 19.9 14.4 13.5 10.8 6.7 13.3 17.6 17.8 14.1 0.41979 12475 70.0 3251 1287.8 535.4 267.3 82.6 209.2 193.3 21.9 26.4 25.2 24.6 13.0 19.7 23.8 27.0 21.4 0.71980 15470 71.8 4322 2132.2 1370.6 296.4 104.6 208.8 151.8 26.6 30.1 41.7 49.4 13.0 22.1 28.7 28.4 22.7 0.71981 17150 73.0 5307 2262.9 1457.3 320.0 104.4 225.9 155.3 28.7 35.0 32.2 55.5 12.7 25.4 27.1 32.7 23.8 0.71982 20753 73.3 5810 2184.1 1446.7 286.0 134.8 168.5 148.1 32.4 38.0 41.9 50.4 10.6 27.6 20.7 25.6 19.7 0.71983 25895 75.2 6159 2250.3 1400.7 308.8 155.4 176.7 208.7 38.0 37.6 39.2 45.5 11.0 25.6 20.9 35.0 22.8 0.71984 31547 78.8 6387 2197.9 1264.0 340.1 140.0 200.0 253.8 43.7 36.7 39.2 46.1 14.4 27.2 24.8 35.4 25.7 0.71985 37240 81.9 6898 2599.9 1767.7 299.0 132.2 177.3 223.7 45.9 36.5 42.1 44.0 15.0 26.4 21.2 35.1 25.1 0.71986 42563 84.7 6034 2053.9 1048.4 308.4 117.5 274.1 305.5 48.1 33.2 38.3 36.6 15.6 27.4 35.5 47.2 32.8 0.71987 51500 88.0 6500 3046.0 1083.8 272.1 334.1 749.4 606.6 54.8 41.5 42.6 27.6 15.2 56.4 62.0 65.9 52.0 0.71988 61600 92.0 10700 3994.5 1298.2 318.6 328.9 855.5 1193.4 62.1 52.3 56.3 36.1 27.7 57.3 89.0 97.2 77.9 0.71989 76800 95.0 13800 5734.7 1733.2 594.2 410.8 1168.9 1827.6 73.8 59.0 49.6 62.3 70.3 58.4 44.0 59.2 55.4 1.11990 96100 97.8 19400 6953.8 2031.2 562.3 523.8 1261.8 2574.7 87.3 83.4 33.8 84.3 94.8 74.2 107.1 83.4 88.4 2.01991 111200 100.0 31000 11764.7 6325.5 193.4 650.1 1289.5 3306.2 100.0 100.0 100.0 100.0 100.0 100.0 100.0 100.0 100.0 3.31992 139100 103.2 40400 10171.2 4411.3 175.2 779.2 1263.2 3542.3 119.7 111.0 92.0 115.5 75.6 59.3 101.5 105.3 95.7 3.31993 157300 106.2 43500 10464.5 5178.7 146.7 703.5 1086.8 3348.8 131.6 111.8 99.9 102.5 55.8 89.6 120.4 103.2 102.8 3.41994 175000 110.8 40100 11757.5 4516.7 791.1 550.0 1809.4 4090.3 140.9 115.1 92.5 92.7 50.9 82.9 121.1 102.6 98.3 3.41995 205000 114.6 45100 11703.8 4303.8 517.3 840.2 2065.1 3977.4 157.8 121.1 94.6 89.8 55.2 89.9 156.8 104.3 109.4 3.41996 228300 119.1 48450 12004.1 5684.9 311.9 744.2 1753.9 3509.2 167.2 129.7 115.2 122.8 82.6 67.1 152.4 123.2 118.5 3.41997 255800 124.4 52700 13104.9 5837.7 374.7 647.9 2056.1 4188.5 176.9 133.6 119.1 124.1 85.3 66.5 148.7 126.6 121.1 3.4Source: Columns (1)-(3), (10) and (19) from International Financial Statistics Yearbook , 1998 Columns (4)-(9) and (11)-(17) from CAPMAS: Annual Bulletin For Foreign Trade, various issues. Column (18) is Calculated with Fisher Price Index.

Appendix Table 2. EGYPT: Calculation of Real, Export-Weighted Foreign Exchange Rate, 1970-98(1991 = 100)
Ratio Year: 1970 1971 1972 1973 1974 1975 1976 1977 1978 1979 1980 1981 1982 1983 1984 1985 1986 1987------- ----- ----- ----- ----- ----- ----- ----- ----- ----- ----- ----- ----- ----- ----- ----- ----- ----- ----- 1.a.NER(LE/US$) 0.43 0.43 0.43 0.39 0.39 0.39 0.39 0.39 0.39 0.70 0.70 0.70 0.70 0.70 0.70 0.70 0.70 0.701.b.NER(LE/US$)% 13.06 13.06 13.06 11.75 11.75 11.75 11.75 11.75 11.75 21.02 21.02 21.02 21.02 21.02 21.02 21.02 21.02 21.02
2.NER(FC/US$)% 80.04 78.95 75.31 72.84 76.97 76.03 87.26 89.15 84.51 81.41 81.45 98.13 110.43 120.42 133.41 139.51 116.37 104.41
3. NEER(LE/FC) % 16.31 16.54 17.34 16.13 15.27 15.46 13.47 13.18 13.90 25.82 25.81 21.42 19.04 17.46 15.76 15.07 18.06 20.13
4. Egypt CPI % 7.17 7.41 7.54 7.95 8.73 9.57 10.55 11.91 13.22 14.54 17.52 19.35 22.22 25.77 30.17 33.82 41.91 50.16
5. FC CPI % 17.48 18.41 19.43 21.11 24.14 27.48 30.71 34.45 37.56 42.07 48.85 55.71 61.90 67.25 72.09 76.54 79.20 82.14
6. FC CPI /Egypt CPI 243.79 248.59 257.58 265.64 276.60 287.11 291.00 289.34 284.02 289.30 278.82 287.94 278.54 260.95 238.94 226.29 188.99 163.76
7. REER (LE/FC)% 39.77 41.11 44.66 42.85 42.23 44.37 39.19 38.14 39.49 74.70 71.96 61.68 53.02 45.55 37.65 34.10 34.14 32.97
8. REER LE/FC 1.32 1.37 1.49 1.43 1.41 1.48 1.30 1.27 1.31 2.49 2.40 2.05 1.77 1.52 1.25 1.14 1.14 1.10
NOTES: (1) Source: IMF, International Financial Statistics (IFS) (2) Export-weighted foreign currency (FC)/US$ index calculated as geometric average from dollar exchange rates of 5 major trading partners of Egypt, which together accounted for 39.3% of reported trade between 1990-94. Source: IMF Direction of Trade Statistics and International Financial Statistics (IFS) (3) Nominal Effective Exchange Rate or Nominal LE /FC Index , line (1) / line (2) (4) Egypt Consumer Price Index, IMF, International Financial Statistics. Egypt CPI for 1995 and subsequent years has been divided by 1.067 to adjust for an uncorrected discontinuity in the time series, as reported to the IMF, when new household budget weights were introduced. (5) Export-weighted consumer price index of 5 key currencies of major trading partners of Egypt, accounting for 39.3% of reported trade between 1990-94, calculated as geometric averages. Source: IMF, International Financial Statistics (IFS) (6) Ratio of Egypt's trading partners' CPI to its CPI, line (4) / line(5) (7) Egypt's real, export-weighted foreign exchange rate index, line (3) x line (6) (8) Egypt's real, export-weighted foreign exchange rate (LE), line (7) x NER in 1991 (=3.33/100)
Page 1 of 2
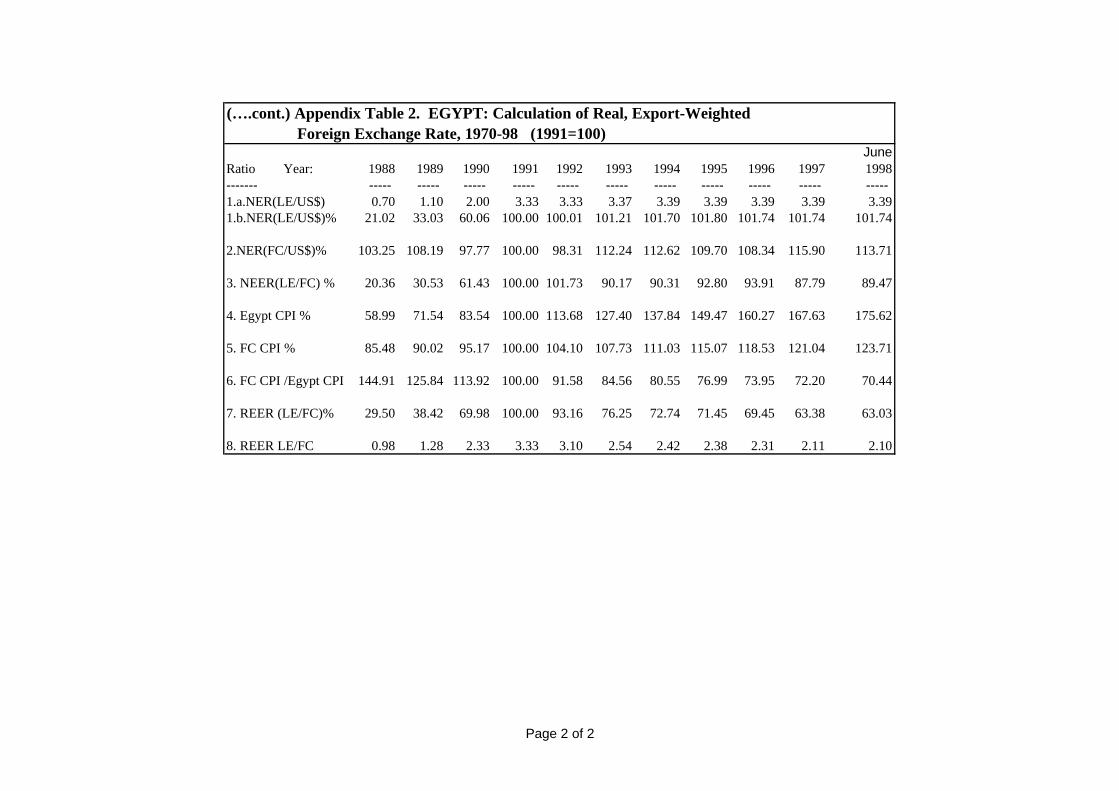
(….cont.) Appendix Table 2. EGYPT: Calculation of Real, Export-Weighted Foreign Exchange Rate, 1970-98 (1991=100)
JuneRatio Year: 1988 1989 1990 1991 1992 1993 1994 1995 1996 1997 1998------- ----- ----- ----- ----- ----- ----- ----- ----- ----- ----- ----- 1.a.NER(LE/US$) 0.70 1.10 2.00 3.33 3.33 3.37 3.39 3.39 3.39 3.39 3.391.b.NER(LE/US$)% 21.02 33.03 60.06 100.00 100.01 101.21 101.70 101.80 101.74 101.74 101.74
2.NER(FC/US$)% 103.25 108.19 97.77 100.00 98.31 112.24 112.62 109.70 108.34 115.90 113.71
3. NEER(LE/FC) % 20.36 30.53 61.43 100.00 101.73 90.17 90.31 92.80 93.91 87.79 89.47
4. Egypt CPI % 58.99 71.54 83.54 100.00 113.68 127.40 137.84 149.47 160.27 167.63 175.62
5. FC CPI % 85.48 90.02 95.17 100.00 104.10 107.73 111.03 115.07 118.53 121.04 123.71
6. FC CPI /Egypt CPI 144.91 125.84 113.92 100.00 91.58 84.56 80.55 76.99 73.95 72.20 70.44
7. REER (LE/FC)% 29.50 38.42 69.98 100.00 93.16 76.25 72.74 71.45 69.45 63.38 63.03
8. REER LE/FC 0.98 1.28 2.33 3.33 3.10 2.54 2.42 2.38 2.31 2.11 2.10
Page 2 of 2
Appendix Table 3EGYPT: Geographical Distribution of Exports, 1990-94(million U.S. dollars)Country / Year 1990 1991 1992 1993 1994 Export
(%)France 104 216 129 268 204 4.6Germany 156 137 127 242 264 4.6Italy 316 542 433 832 1101 16.1United Kingdom 77 79 102 258 349 4.3United States 222 278 286 603 540 9.6Subtotal 875 1252 1077 2203 2458 39.3World Total 2585 3659 3050 5137 5562 100.0Source: IMF, Direction of Trade Statistics, Yearbook 1995, International Monetary Fund.


