forecasting system of office supplies demand using simple
TRANSCRIPT

Forecasting System of Office Supplies Demand Using Simple Moving Average and Simple Exponential
Smoothing (Case Study: Regional Office of The Ministry of
Religious Affairs of Jakarta)
Elvi Fetrinaa*, Meinarini Catur Utamib, Anita Permatasaric
a,b,cDepartment of Information Systems, Faculty of Science and Technology Syarif Hidayatullah State Islamic University (UIN)
Jakarta, Indonesia *E-mail: [email protected]
Abstract
The focus of this paper is to calculate the forecast of office supplies demand in the Regional Office of The Ministry of Religious Affairs of Jakarta. The major research is to compare two techniques of forecasting, namely simple moving average (MA) and simple exponential smoothing (SES) with the least of forecasting error of Mean Absolute Deviation (MAD) in order to get high accuracy of future office supplies demand. Every year, the Regional Office has to purchase and provide office supplies to its employees. However, the management still has difficulties to determine the quantity of office supplies that have to be stored in the inventory to avoid the stock-out. It happens because the management does not have an accurate prediction of office supplies that are required by the employees. Therefore, to get more accurate forecast, the future demand will be calculated based on last three years data of demand using the above methods. Then, the forecast value with the least of error will be used. It is expected that once the management has an accurate demand predicted then the insufficiency as well as excess of inventory would be minimized. Keywords: MAD, Forecasting, SES, MA, Inventory 1. Introduction
Inventory control aims to monitor and keep what has been planned before in accordance with the reality. The inventory control system can help to control the number of stock of goods in the warehouse. It is important because if the number of excess stock is high then it will affect the cost of storage in the warehouse. In addition, it will affect the latent capital and will minimize the availability of spaces for other supplies. Meanwhile, if the stock is too small, it will increase the possibility of stock out or stock shortages, that can disrupt the distribution of the company's activities [1].
In terms of inventory management, the Regional Office of the Ministry of Religious Affairs still uses a simple system to manage incoming and outgoing inventory data. This office does not calculate and predict the number of future demand of office supplies for the next order so that it often stockouts or even has some excess stocks.
1.1. Problem Summary
Based on the background described above, then the underlying problems are: How to compare and choose the most effective forecasting methods to calculate and predict the demand in order to determine the number of quantity to order. All of these are required to avoid the the inventory problems of stock out. 1.2. Scope Of Problems
This research is limited only on : 1. the Regional Office of the Ministry of Religious
Affairs of DKI Jakarta in the Division of Maintenance and Management of State Property (BMN) or State Property.
2. Comparing only two types of forecasting methods which are imple Moving Average and Simple Exponential Smoothing with Mean Absolute Deaviation to calculate the forecsting error.
3. In this study only discusses stationery consumables, do not discuss the maintenance and or the damage of stationeries.
1.3. Research Methodology
Methodology of research activity which writer use consist of:
1.3.1 Data Collection Method 1. Observation 2. Interview 3. Library and Literature Studies
156Copyright © 2018, the Authors. Published by Atlantis Press. This is an open access article under the CC BY-NC license (http://creativecommons.org/licenses/by-nc/4.0/).
International Conference on Science and Technology (ICOSAT 2017)Advances in Intelligent Systems Research (AISR), volume 149
2. Theoretical Basis
2.1 System Definition The system is a unit unity that can not be separated between one unit with other units in achieving one predetermined goal [2]. 2.2 Inventories Definition According to Pardede in [3], inventory is the quantity of material or goods held or available that has an amount greater than the amount used in order to at any time in the future can be used. 2.3 Inventory Control Definition Herjanto in [4] defines inventory control as a set of policy that determine and ensure the availability of appropriate inventories in the right of time. Inventory control determines the level of inventory to be maintained, the time when the order should be taken place and the quantity of order should be held. 2.4 Forecasting Prasetya and Lukiastuti in [ 5] view forecasting as a process of prediction of the future based on the trends and testing of the past data. Further Pardede [4] defines forecasting as a scientific method to determine what will happen in the future. 3. Research Methodology
3.1 Observation Data collection is done by observing directly the
object and by looking directly the process and business activities running on the General Division Office of the Ministry of Religious Affairs of DKI Jakarta on 05 October - 16 February 2016. It is expected to see the business processes of the system to find the data needed for research.
3.2 Interview
This interview was conducted by having a discussion and by asking questions about all the necessary data in order to calculate the forecasting demand of office supplies
3.3 Library and Literature Studies
This study is conducted by studying various books, e-books, Journals, final assignments or theses, articles, and similar research related to concept of information systems, inventory control, Simple Moving Average (SMA), Simple Exponential Smoothing (SES), Mean Absolute Deviation (MAD), Economic Order Quantity (EOQ) and Safety Stock.
4. Result and Discussion
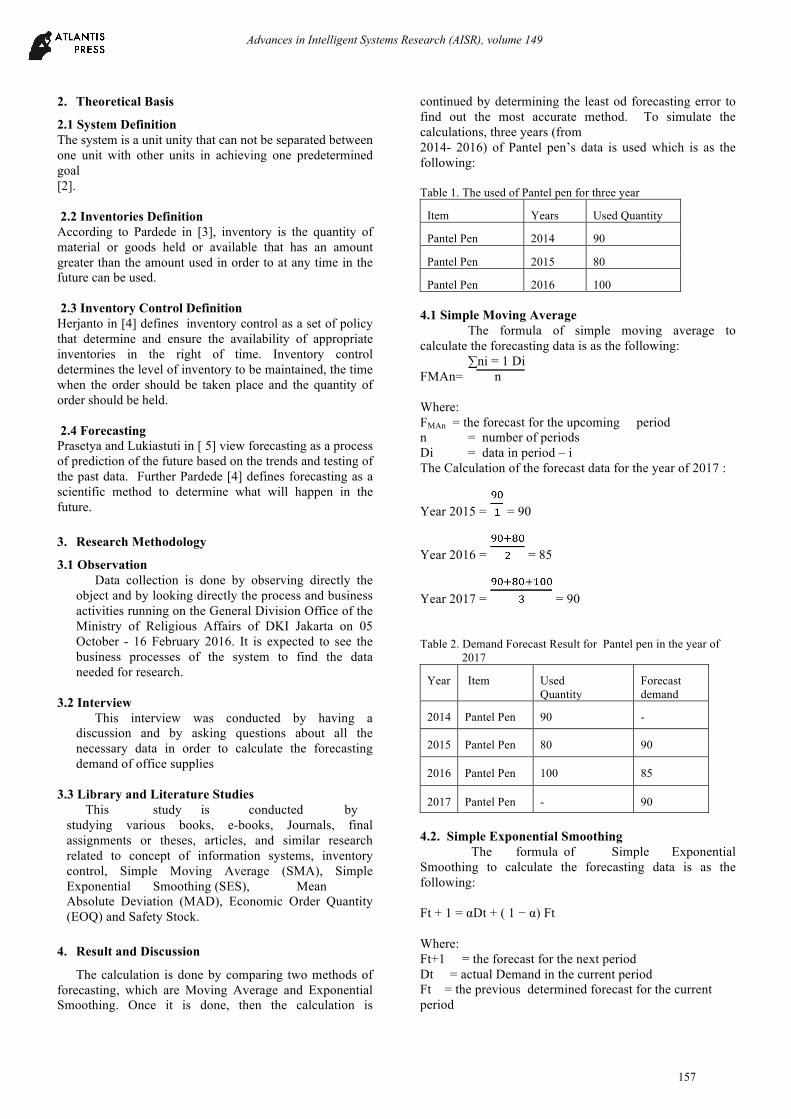
The calculation is done by comparing two methods of forecasting, which are Moving Average and Exponential Smoothing. Once it is done, then the calculation is
continued by determining the least od forecasting error to find out the most accurate method. To simulate the calculations, three years (from 2014- 2016) of Pantel pen’s data is used which is as the following: Table 1. The used of Pantel pen for three year
Item Years Used Quantity
Pantel Pen 2014 90
Pantel Pen 2015 80
Pantel Pen 2016 100 4.1 Simple Moving Average The formula of simple moving average to calculate the forecasting data is as the following: ∑ni = 1 Di FMAn= n Where: FMAn = the forecast for the upcoming period n = number of periods Di = data in period – i The Calculation of the forecast data for the year of 2017 :
Year 2015 = = 90
Year 2016 = = 85
Year 2017 = = 90 Table 2. Demand Forecast Result for Pantel pen in the year of 2017
Year Item Used Quantity
Forecast demand
2014 Pantel Pen 90 -
2015 Pantel Pen 80 90
2016 Pantel Pen 100 85
2017 Pantel Pen - 90
4.2. Simple Exponential Smoothing The formula of Simple Exponential Smoothing to calculate the forecasting data is as the following: Ft + 1 = αDt + ( 1 − α) Ft Where: Ft+1 = the forecast for the next period Dt = actual Demand in the current period Ft = the previous determined forecast for the current period
157
Advances in Intelligent Systems Research (AISR), volume 149

α = smoothing constant (between 0-1) For this research, smoothing constant of 0.1, 0.2, 0.3, 0.4 and 0.5 are used in the forecast calculation respectively such as the subsequent: α = 0.1 F2014 = 90 F2015 = (0.1 * 90) + (1-0,1) * 90 = 90 F 2016 = (0.1 * 80) + (1-0,1) * 90 = 89 F 2017 = (0.1 * 100) + (1-0,1) * 89= 90 α = 0.2 F2014 = 90 F2015 = (0.2 * 90) + (1-0,2) * 90 = 90 F2016 = (0.2 * 80) + (1-0,2) * 90 = 88 F2017 = (0.2 * 100) + (1-0,2) * 88 ≈ 90 α = 0.3 F2014 = 90 F2015 = (0.3 * 90) + (1-0,3) * 90 = 90 F2016 = (0.3 * 80) + (1-0,3) * 90 = 87 F2017 = (0.3 * 100) + (1-0,3) * 87≈ 91 α = 0.4 F2014 = 90 F2015 = (0.4 * 90) + (1-0,4) * 90 = 90 F2016 = (0.4 * 80) + (1-0,4) * 90 = 86 F2017 = (0.4 * 100) + (1-0,4) * 86 ≈ 92 α = 0.5 F2014 = 90 F2015 = (0.5 * 90) + (1-0,5) * 90 = 90 F2016 = (0.5 * 80) + (1-0,5) * 90 = 85 F2017 = (0.5 * 100) + (1-0,5) * 85 ≈ 93 Table 3. Demand Forecast Result for Pantel pen in the year of 2017 Using Simple Exponential Smoothing
4.3. The accuracy of forecast data To find the most accurate forecast data then it is required to calculate which forecast that has the least value of error. The Mean Absolute Deviation (MAD) can be used to calculate the forecast error whose formula is as the following: ∑ | 𝐃𝐭−𝐅𝐭 | MAD = 𝐧 Where: Dt = Demand in period t Ft = the forecast for period t n = total number of period
Using the forecast data of Moving average method, the MAD calculation is as the following:
Using the forecast data of Simple Exponential Smoothing the Calculation of MAD is as below: α = 0.1
α = 0.2
α = 0.3
α = 0.4
α = 0
Table 4. MAD in year 2014-2017
5. Conclusion and Recommendation 5.1. Conclusion
1. The forecast method that has the least forecast error is Simple Exponential Smoothing (SES) with smoothing constant of 0.5.
2. The forecast data of SES with smoothing constant 0.5 for the year 2017 is 93.
Year Item Q α = 0.1
α = 0.2
α = 0.3
α = 0.4
α = 0.5
2014 Pantel Pen 90 90 90 90 90 90
2015 Pantel Pen 80 90 90 90 90 90
2016 Pantel Pen 100 89 88 87 86 85
2017 Pantel Pen - 90 90 91 92 93 MA SES
0.1 SES 0.2 SES
0.3 SES 0.4
SES 0.5
MAD 48 6 6 5 5 4 Data Forecast for 2017
90 90 90 91 92 93
158
Advances in Intelligent Systems Research (AISR), volume 149

5.2. Recommendation It is expected that the forecast data with the least
forecast error is used to calculate the economic order quantity dan safety stock to mimimize the inventory cost and to avoid stockout. Acknowledgment
We thankful to the Faculty of Science and Technology of Syarif Hidayatullah State Islamic University Jakarta and all the staff of the Regional Office of the Ministry of Religious Affairs of Jakarta who have supported this study References
[1] Assauri, S. (2008). Manajemen Produksi dan Operasi, edisi revisi. Jakarta: Lembaga Penerbit Fakultas Ekonomi Universitas Indonesia.
[2] Gaol, C. J. (2008). Sistem Informasi Manajemen Pemahaman dan Aplikasi. Jakarta: PT. Grasindo.
[3] Pardede, P.M. (2007). Manajemen Operasi dan Produksi – Teori, Model dan Kebijakan. Yogyakarta: cv. Andi Offset.
[4] Herjanto, E. (2008). Manajemen Operasi. Jakarta: PT. Grasindo.
[5] Prasestya, D.H., & Lukiastuti, S.M. (2001). Manajemen Operasi. Jakarta: PT. Buku Seru.
159
Advances in Intelligent Systems Research (AISR), volume 149