forecasting plant vigor through vegetation...
TRANSCRIPT
FORECASTING PLANT VIGOR THROUGH VEGETATION INDEX MAPPING
FATEHAH HANIM BINTI AHMAD OTHMAN
This report is submitted in partial fulfillment of the requirements for the Bachelor of Computer Science ..{So :ltv. Me De;,r@]opmen.tl
lt-r
FACULTY OF INFORMATION AND COMMUNICATION TECHNOLOGY UNIVERSITI TEKNIKAL MALAYSIA MELAKA
2013


ACKNOWLEDGEMENT
I have taken efforts in this project. However, it would not have been possible without the kind
support and help of many individuals and organizations. I sincerely express my gratitude and
I would like to extend my sincere thanks to all of them.
I am highly indebted to my supervisor, Dr Asmala bin Ahmad for his guidance and constant
supervision as well as for providing necessary information regarding the project & also for
his support in completing the project.
I would like to express my gratitude towards my parents & two important friend of mine
Ummi Kalsom bt Mohamad Hashim and Nuramalina bt Mat Serah for their kind co-operation
and encouragement which help me in completion of this project.
I would like to express my special gratitude and thanks to industry persons for giving me
such attention and time.
My thanks and appreciations also go to my colleague in developing the project and people
who have willingly helped me out with their abilities.
ABSTRACT
The purpose of this project is to forecasting plant vigor through vegetation index mapping.
The Normalized Difference Vegetation Index (NDVI) is a simple graphical indicator that can
be used to analyze remote sensing measurements, typically but not necessarily from a space
platform, and assess whether the target being observed contains live green vegetation or not.
Remote sensing in conjunction with Landsat-5 satellite is used to map the NDVI information
map. Remote sensing (RS) is a technique that uses a sensing device to collect information on
given objects or phenomena from afar without physical contact. The area cover for this study
is Klang, Selangor. Density slicing is a digital data interpretation method used in analysis
of remotely sensed imagery to enhance the information gathered from an individual
brightness band. The ISODATA classification algorithm is regarded as a common method in
the field of analyzing remote sensing images. Density slicing technique will be compare with
ISODATA classification technique for accuracy assessment. The methodology consist of 4
phases; analysis, design, implementation and verification.
ABSTRAK
Tujuan projek ini adalah untuk meramal kesuburan tanaman melalui pemetaan indeks
tumbuh-tumbuhan. The Normalized Difference Vegetation Index (NDVI) adalah penunjuk
grafik yang boleh digunakan untuk menganalisis pengukuran remote sensing, kebiasannya
tetapi tidak semestinya dari satu ruangan platform, dan menilai sama ada sasaran yang
diperhatikan mengandungi tumbuh-tumbuhan hijau atau tidak. Remote sensing dengan
kerjasama dari satelit Landsat-5 digunakan untuk memetakan maklumat peta NDVI. Remote
Sensing (RS) adalah teknik yang menggunakan alat pengesan untuk mengumpul maklumat
mengenai objek yang diberikan atau fenomena dari jauh tanpa sentuhan fizikal. Kawasan
untuk kajian ini ialah Klang, Selangor. Density slicing adalah kaedah tafsiran data digital
yang digunakan dalam analisis imej yang dikesan untuk memperbaiki hasil maklumat yang
dikumpul dari kumpulan kecerahan secara individu. Pengelasan algoritma ISODATA
dianggap sebagai kaedah yang biasa digunakan dalam bidang menganalisis imej hasil dari
remote sensing. Teknik density slicing akan bandingkan dengan teknik pengelasan ISODATA
untuk penilaian ketepatan. Kaedah ini terdiri daripada 4 fasa, analisis, reka bentuk,
pelaksanaan dan ujian pengesahan.

TABLE OF CONTENTS
CHAPTER 1: INTRODUCTION .................................................................................................1
1.1 Project Background ................................................................................................................ 1-3
1.2 Problem Statements ...................................................................................................................4
1.3 Objectives ..................................................................................................................................4
1.4 Scopes ........................................................................................................................................4
1.5 Project Significant ......................................................................................................................4
1.6 Expected Output.........................................................................................................................5
1.7 Conclusion .................................................................................................................................5
CHAPTER 2: LITERATURE REVIEW AND METHODOLOGY .........................................6
2.1 Why Remote Sensing? ...............................................................................................................6
2.2 Vegetation Index .................................................................................................................... 6-8
2.3 Methodology .......................................................................................................................... 8-9
CHAPTER 3: ANALYSIS ..........................................................................................................10
3.1 Problem Analysis .....................................................................................................................10
3.2 Requirement Analysis ..............................................................................................................10
3.2.1Satellite Data ............................................................................................................ 10-11
3.2.2 Software .........................................................................................................................12
3.2.3 Ancillary ........................................................................................................................12
3.3 Conclusion ...............................................................................................................................12
CHAPTER 4: DESIGN ...............................................................................................................13
4.1 Introduction ..............................................................................................................................12
4.2 NDVI Process .................................................................................................................... 13-14
4.2.1 Input ...............................................................................................................................15
4.2.2 Geometric Correction ....................................................................................................15
4.2.3 Subset/Resize ........................................................................................................... 15-16
4.2.4 Ocean Masking ..............................................................................................................16
4.2.5 Cloud Masking ..............................................................................................................16
4.2.6 NDVI Modeling.............................................................................................................17
4.2.7 NDVI Derivation ...........................................................................................................17
4.2.8 NDVI Segmentation ......................................................................................................17
4.2.9 Output ............................................................................................................................18

4.2.10 Accuracy Assessment/Testing .....................................................................................18
4.3 Conclusion ...............................................................................................................................18
CHAPTER 5: IMPLEMENTATION ........................................................................................19
5.1 Introduction ........................................................................................................................... 19
5.2 Data Pre-processing .................................................................................................................19
5.2.1 Input Data Process ................................................................................................... 19-21
5.2.2 Geometric Correction Process .......................................................................................21
5.2.3 Subset/Resize Process ............................................................................................. 21-23
5.2.4 Ocean Masking Process ........................................................................................... 23-24
5.3 NDVI Modeling Process ..........................................................................................................24
5.3.1 Conversion from Digital Number to Radiance ..............................................................25
5.3.2 Conversion from Radiance to NDVI ....................................................................... 25-26
5.4 NDVI Derivation .....................................................................................................................26
5.5 NDVI Segmentation.................................................................................................................27
5.5.1 Output ............................................................................................................................27
5.5.2 Accuracy Assessment/Testing .......................................................................................28
5.6 Conclusion ...............................................................................................................................28
CHAPTER 6: TESTING .............................................................................................................29
6.1 Introduction ..............................................................................................................................29
6.2 Density Slicing Technique ................................................................................................. 29-30
6.3 ISODATA Classification ................................................................................................... 30-31
6.4 Comparison Between Density Slicing and ISODATA Classification ............................... 32-34
6.5 Conclusion ...............................................................................................................................34
CHAPTER 7: APPLICATION OF LAND SURFACE TEMPERATURE
DETERMINATION USING ANDROID ...................................................................................35
7.1 Introduction ..............................................................................................................................35
7.2 Requirement .............................................................................................................................35
7.3 Graphical User Interface .................................................................................................... 36-37
7.4 Codes........................................................................................................................................37
7.4.1 XML Codes ...................................................................................................................37
7.4.2 Java Codes ............................................................................................................... 38-40
7.5 Conclusion ...............................................................................................................................40
CHAPTER 8: PROJECT CONCLUSION ................................................................................41
8.1 Introduction ..............................................................................................................................41

8.2 Strengths ..................................................................................................................................41
8.3 Weakness .................................................................................................................................41
8.4 Proposition for Improvement ............................................................................................. 41-42
8.5 Contribution .............................................................................................................................42
8.6 Conclusion ...............................................................................................................................42
REFERENCES .............................................................................................................................43
APPENDICES ................................................................................................................................ i
1
CHAPTER 1
INTRODUCTION
1.1 Project Background
The Normalized Difference Vegetation Index (NDVI) is a simple graphical indicator
that can be used to analyze remote sensing measurements, typically but not necessarily from
a space platform, and assess whether the target being observed contains live green vegetation
or not. NDVI has been in use for many years to measure and monitor plant growth (vigor),
vegetation cover, and biomass production from multispectral satellite data.
To determine the density of green on a patch of land, researchers must observe the
distinct colours (wavelengths) of visible and near-infrared sunlight reflected by the plants. As
can be seen through a prism, many different wavelengths make up the spectrum of sunlight.
When sunlight strikes objects, certain wavelengths of this spectrum are absorbed and other
wavelengths are reflected. The pigment in plant leaves, chlorophyll, strongly absorbs visible
light (from 0.4 to 0.7 µm) for use in photosynthesis. The cell structure of the leaves, on the
other hand, strongly reflects near-infrared light (from 0.7 to 1.1 µm). The more leaves a plant
has, the more these wavelengths of light are affected, respectively.
In general, if there is much more reflected radiation in near-infrared wavelengths than
in visible wavelengths, then the vegetation in that pixel is likely to be dense and may contain
some type of forest. If there is very little difference in the intensity of visible and near-
infrared wavelengths reflected, then the vegetation is probably sparse and may consist of
grassland, tundra, or desert.
2
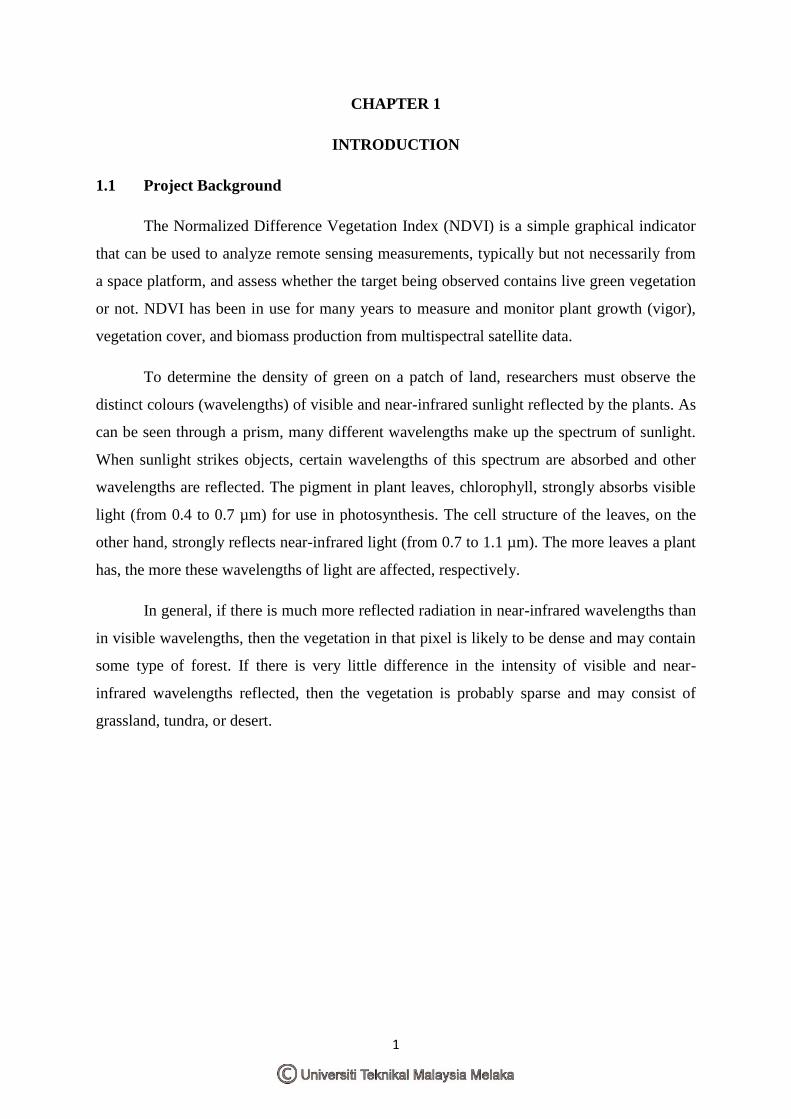
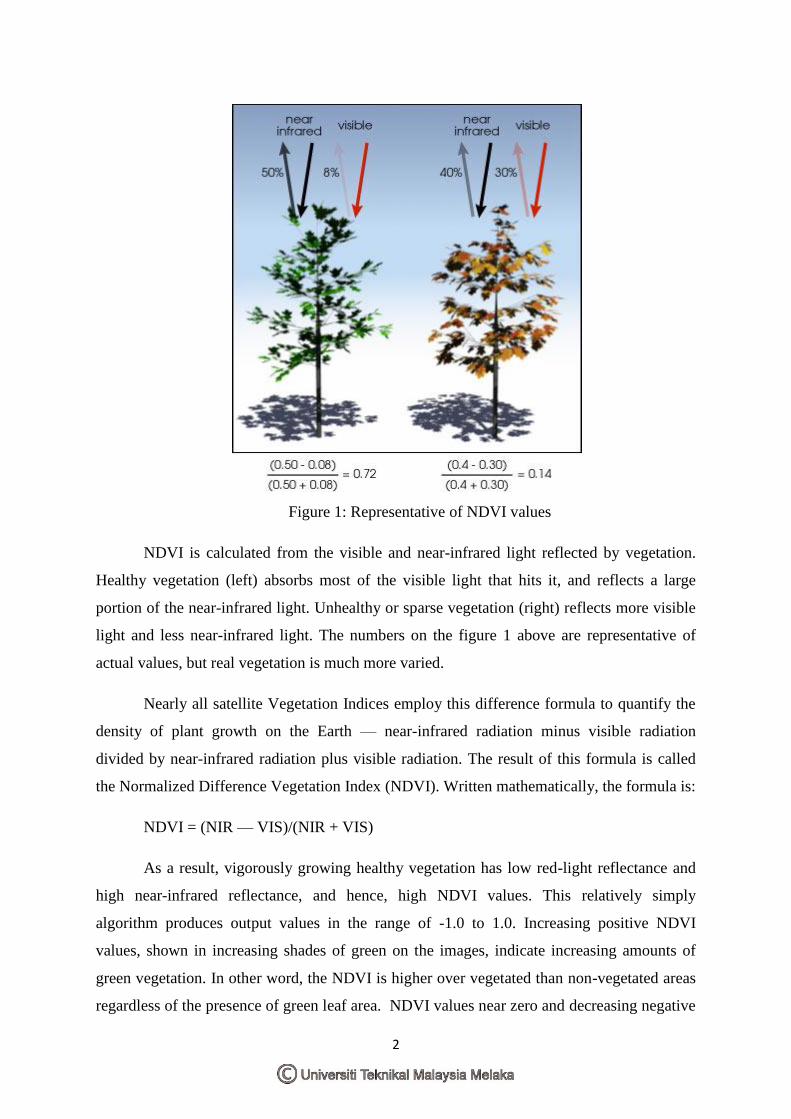
Figure 1: Representative of NDVI values
NDVI is calculated from the visible and near-infrared light reflected by vegetation.
Healthy vegetation (left) absorbs most of the visible light that hits it, and reflects a large
portion of the near-infrared light. Unhealthy or sparse vegetation (right) reflects more visible
light and less near-infrared light. The numbers on the figure 1 above are representative of
actual values, but real vegetation is much more varied.
Nearly all satellite Vegetation Indices employ this difference formula to quantify the
density of plant growth on the Earth — near-infrared radiation minus visible radiation
divided by near-infrared radiation plus visible radiation. The result of this formula is called
the Normalized Difference Vegetation Index (NDVI). Written mathematically, the formula is:
NDVI = (NIR — VIS)/(NIR + VIS)
As a result, vigorously growing healthy vegetation has low red-light reflectance and
high near-infrared reflectance, and hence, high NDVI values. This relatively simply
algorithm produces output values in the range of -1.0 to 1.0. Increasing positive NDVI
values, shown in increasing shades of green on the images, indicate increasing amounts of
green vegetation. In other word, the NDVI is higher over vegetated than non-vegetated areas
regardless of the presence of green leaf area. NDVI values near zero and decreasing negative

3
values indicate non-vegetated features such as barren surfaces (rock and soil) and water,
snow, ice, and clouds.
The importance of acquiring information from NDVI can address immediate needs
for information. The information helps to assist cultivators, agriculturists and modern farmers
to be acknowledged of their environment and surroundings.
Remote sensing is the acquisition of information about an object or event without
involves any physical contact with the object. This term implies to the usage of aerial sensor
technology to detect and classify objects on earth. Remote sensing in conjunction with
Landsat-5 satellite is used to map the NDVI information map. Landsat-5 satellites has
provided multispectral imagery products for 30 years, and their long history and reliability
has made them a popular source for documenting changes in land cover and use over time.
Landsat-5 sensor is called Thematic Mapper (TM). The specifications of the sensor are as
follows:
Seven spectral bands, including a thermal band:
Band 1 Visible (0.45 - 0.52 µm) 30 m
Band 2 Visible (0.52 - 0.60 µm) 30 m
Band 3 Visible (0.63 - 0.69 µm) 30 m
Band 4 Near-Infrared (0.76 - 0.90 µm) 30 m
Band 5 Near-Infrared (1.55 - 1.75 µm) 30 m
Band 6 Thermal (10.40 - 12.50 µm) 120 m
Band 7 Mid-Infrared (2.08 - 2.35 µm) 30 m
1.2 Problem Statement
The acquisition of data for NDVI information map requires relatively high cost and
manpower needs to working manually. In other word an impractical way of gaining
data.
The aim of this study is to develop or derive a method that resulted of NDVI
information map.
4
1.3 Objectives
To design a method to derive NDVI information
To develop a NDVI information method
To assess the accuracy of the NDVI map
1.4 Scope
i. Software
The software involves for this study are ENVI(Environment for
Visualizing Images) and Matlab
ii. Study Area
The area cover for this study is Klang, Selangor. The latitude and
longitude coordinates of the study area is 3.0333° N, 101.4500° E
respectively. Area of Klang is 573 km².
To derive the NDVI information map, all band are used (Band 1 –
Band 7)
iii. User Scope
The information is specifically made to assist researcher, science
officer and any field related to education.
1.5 Project Significant
Generally this study does not high consuming in term of time and cost. It is
inexpensive because less manpower is assigned to perform the task. It is only related
to knowledgeable people who are familiar with the ENVI software. The reason why
this study is less time consuming is because it involves no physical contact with the
area covered.
The Normalized Difference Vegetation Index (NDVI) shows patterns of vegetative
growth from green-up to senescence by indicating the quantity of actively
photosynthesizing biomass on a landscape (Burgan 1996). Such images allow for the
production of maps, which indicate visual greenness and can be extremely valuable to
land managers and researchers in determining changes in vegetation over time.

5
1.6 Expected Output
The main expected results are to generate a NDVI information map of Klang area.
The NDVI information map can assist researchers in making prediction of vegetation
covered.
1.7 Conclusion
In the end of the day, the first chapter revolve around the background of this project
and indicate what are the problem statements that leads to the objectives to acquire the
information map. The scope of this study specify on the software used, the selected area and
intellectual person who related to this field of study can gain a lot of information and
knowledge and its significant to the modern environment.
6
CHAPTER 2
LITERATURE REVIEW AND METHODOLOGY
2.1 Why Remote Sensing?
Remote sensing (RS) is a technique that uses a sensing device to collect information
on given objects or phenomena from afar without physical contact. Hand held cameras,
photographic instruments installed in aircrafts, and satellite sensors are devices that can be
used in data gathering. Remote sensing techniques have provided a range of useful methods
that quantitatively measure land change process as on a larger scale with less expense
compared with traditional methods, such as field surveys (Wang, 2012 ). Vegetation studies
based on remotely sensed data began to be used in the mid-1970s with data obtained from
Landsat MSS (Multi Spectral Scanner). The use of remotely sensed data from satellite
platforms for crop and drought monitoring has become wide spread since the mid and late
1980s. Moreover, remote sensing has become an important source of information for
monitoring vegetation conditions and land use or land-cover changes (Chu et al. 2009).
2.2 Vegetation Index
The Normalized Difference Vegetation Index (NDVI) calculated from the red and
near-infra-red bands, is one of the most widely used vegetation indexes in a variety of
vegetation studies such as measuring plant growth or extracting phenological metrics (Wang,
2012). A comparative method using Normalized Difference Vegetation Index (NDVI) has
been developed for monitoring the presence and spread of cheatgrass (Winter, 2003).
Vegetation Index (VI) time series derived from satellite images are some of the most
important sources of information in detecting vegetation conditions as well as in monitoring
land cover processes (Wang, 2012). Traditional methods, such as field surveys, are labor
intensive relative to remote sensing, which has emerged as the most useful data source for
quantitatively measuring land-cover changes at the landscape and smaller scales with a
relatively low expense. As for result, such images allow for the production of maps, which
indicate visual greenness and can be extremely valuable to land managers and researchers in
determining changes in vegetation over time (Winter, 2003).
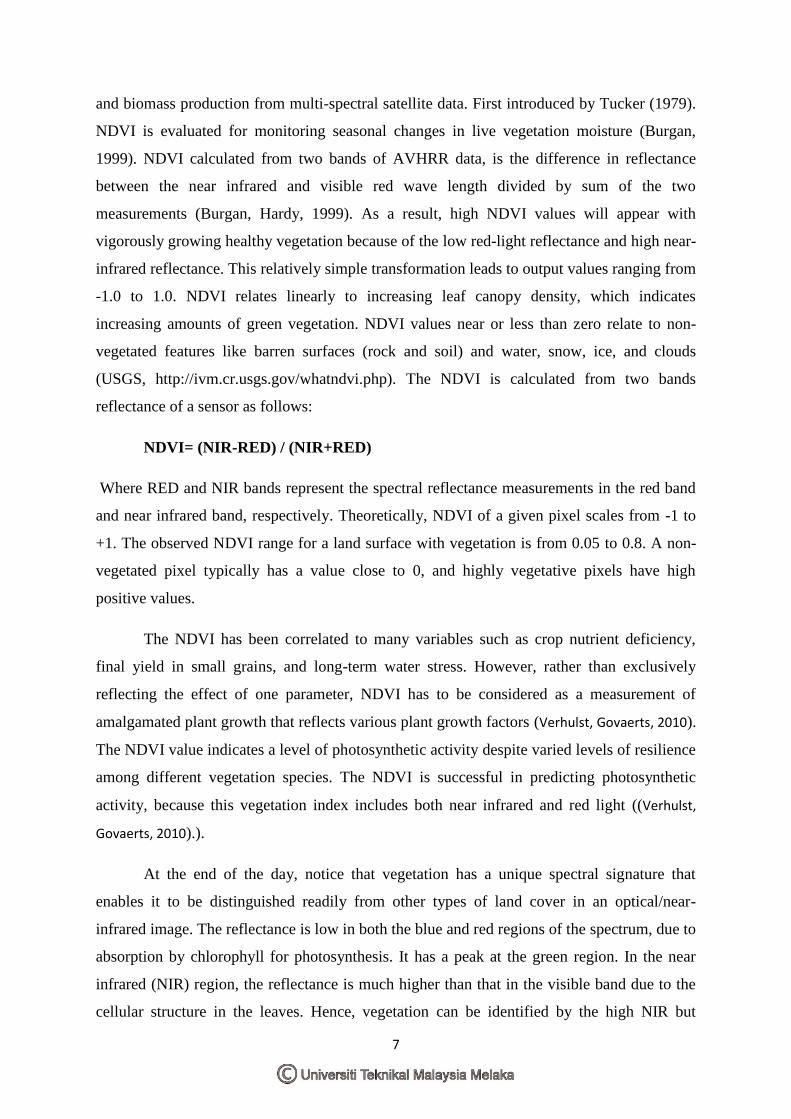
The NDVI (Normalized Difference Vegetation Index) is one of the most widely used
vegetation indices in recent years that measure and monitor plant growth, vegetation cover,
7
and biomass production from multi-spectral satellite data. First introduced by Tucker (1979).
NDVI is evaluated for monitoring seasonal changes in live vegetation moisture (Burgan,
1999). NDVI calculated from two bands of AVHRR data, is the difference in reflectance
between the near infrared and visible red wave length divided by sum of the two
measurements (Burgan, Hardy, 1999). As a result, high NDVI values will appear with
vigorously growing healthy vegetation because of the low red-light reflectance and high near-
infrared reflectance. This relatively simple transformation leads to output values ranging from
-1.0 to 1.0. NDVI relates linearly to increasing leaf canopy density, which indicates
increasing amounts of green vegetation. NDVI values near or less than zero relate to non-
vegetated features like barren surfaces (rock and soil) and water, snow, ice, and clouds
(USGS, http://ivm.cr.usgs.gov/whatndvi.php). The NDVI is calculated from two bands
reflectance of a sensor as follows:
NDVI= (NIR-RED) / (NIR+RED)
Where RED and NIR bands represent the spectral reflectance measurements in the red band
and near infrared band, respectively. Theoretically, NDVI of a given pixel scales from -1 to
+1. The observed NDVI range for a land surface with vegetation is from 0.05 to 0.8. A non-
vegetated pixel typically has a value close to 0, and highly vegetative pixels have high
positive values.
The NDVI has been correlated to many variables such as crop nutrient deficiency,
final yield in small grains, and long-term water stress. However, rather than exclusively
reflecting the effect of one parameter, NDVI has to be considered as a measurement of
amalgamated plant growth that reflects various plant growth factors (Verhulst, Govaerts, 2010).
The NDVI value indicates a level of photosynthetic activity despite varied levels of resilience
among different vegetation species. The NDVI is successful in predicting photosynthetic
activity, because this vegetation index includes both near infrared and red light ((Verhulst,
Govaerts, 2010).).
At the end of the day, notice that vegetation has a unique spectral signature that
enables it to be distinguished readily from other types of land cover in an optical/near-
infrared image. The reflectance is low in both the blue and red regions of the spectrum, due to
absorption by chlorophyll for photosynthesis. It has a peak at the green region. In the near
infrared (NIR) region, the reflectance is much higher than that in the visible band due to the
cellular structure in the leaves. Hence, vegetation can be identified by the high NIR but
8
ANALYSIS
DESIGN
IMPLEMENTATION
VERIFICATION
generally low visible reflectance. This property has been used in early reconnaissance
missions during war times for "camouflage detection".
2.3 Methodology
In order to achieve the objectives of this study, the method used are describe here.
Based on the literature review, this study will carry out approach by Damon Winter that
proposed a comparative method using Normalized Difference Vegetation Index (NDVI) has
been developed for monitoring the presence and spread of cheatgrass.
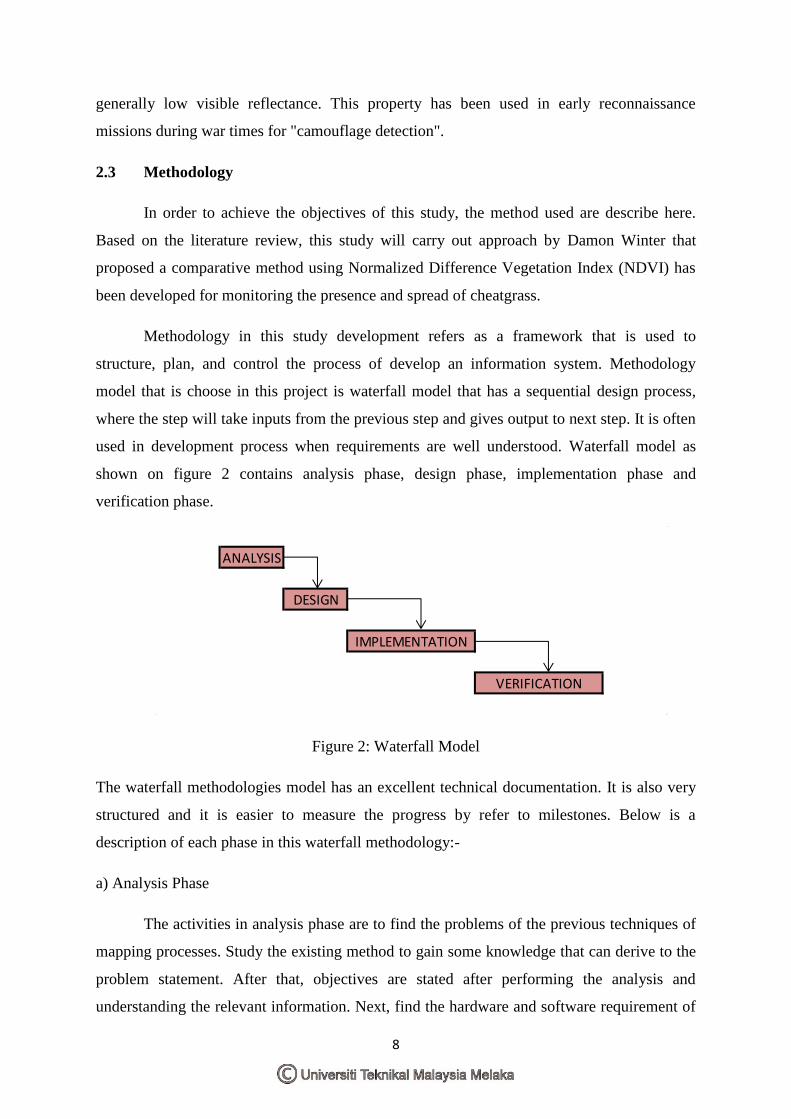
Methodology in this study development refers as a framework that is used to
structure, plan, and control the process of develop an information system. Methodology
model that is choose in this project is waterfall model that has a sequential design process,
where the step will take inputs from the previous step and gives output to next step. It is often
used in development process when requirements are well understood. Waterfall model as
shown on figure 2 contains analysis phase, design phase, implementation phase and
verification phase.
Figure 2: Waterfall Model
The waterfall methodologies model has an excellent technical documentation. It is also very
structured and it is easier to measure the progress by refer to milestones. Below is a
description of each phase in this waterfall methodology:-
a) Analysis Phase
The activities in analysis phase are to find the problems of the previous techniques of
mapping processes. Study the existing method to gain some knowledge that can derive to the
problem statement. After that, objectives are stated after performing the analysis and
understanding the relevant information. Next, find the hardware and software requirement of
9
remote sensing mapping processes and select the location of study area to proceed for the
next process the satellite images. Project plan are also made in this phase.
b) Design Phase
The activities in design phase are the flow chart of mapping process for NDVI. Based
on the requirements and the detailed analysis, the NDVI map will be produced. Design phase
is the most crucial phase in the development of NDVI map.
c) Implementation
Implementation phase is where theory turned into practice. The major steps involved
in this phase are getting the information and documentation of NDVI. What exactly the step
that take part during the whole process of developing NDVI map. The most important thing is
information such as vegetation index value and its statistics will be shown on the resulted
map.
d) Verification
After the implementation phases are complete, the output is verified and any faults in
earlier phases will be removed in this phase. The result will be compare compared with one
more technique for accuracy assessment. The study of NDVI will provide the information
about vegetated and non-vegetated area.

10
CHAPTER 3
ANALYSIS
3.1 Problem Analysis
Generally the development for NDVI information map requires satellite data which
should contain enough sufficient data that mainly obtained from Landsat-5 Thematic Mapper
(TM).
The study area plays an important role in this study. The suitable area will determined
the value of NDVI. In the context of suitable is the selected area is recognized and believed to
have vegetation. Although NDVI can also help to make prediction on non-vegetation area,
but for this study, the focus is more on vegetated area.
The step by step process involve in this study. What are the criteria of the task needed
to be performed in order to achieve the objectives of this study? The pre-processing step used
on the raw satellite data and the next step is the masking procedure which is use to eliminate
unwanted things. For example use to ocean masking and cloud masking. All these step by
step procedure will be elaborated on the next chapter.
3.2 Requirement Analysis
3.2.1 Satellite Data
The input data for this study are collected through the satellite Landsat-5 TM (Landsat
TM 7 spectral bands 30m spatial resolution 16 day repeat cycle). The basic functions of most
satellite sensors are to collect information about the reflected radiation along a pathway, also
known as the field of view (FOV), as the satellite orbits the Earth. The smallest area of
ground that is sampled is called the instantaneous field of view (IFOV). The IFOV is also
described as the pixel size of the sensor. This sampling or measurement occurs in one or
many spectral bands of the EM spectrum. The data collected by each satellite sensor can be
described in terms of spatial, spectral and temporal resolution.

11
(i) Spatial resolution
The spatial resolution (also known as ground resolution) is the ground area imaged for
the instantaneous field of view (IFOV) of the sensing device. Spatial resolution may also be
described as the ground surface area that forms one pixel in the satellite image. The IFOV or
ground resolution of the Landsat Thematic Mapper (TM) sensor, for example, is 30 m. The
ground resolution of weather satellite sensors is often larger than a square kilometer. There
are satellites that collect data at less than one meter ground resolution but these are classified
military satellites or very expensive commercial systems.
(ii) Temporal resolution
Temporal resolution is a measure of the repeat cycle or frequency with which a sensor
revisits the same part of the Earth’s surface. The frequency will vary from several times per
day, for a typical weather satellite, to 8—20 times a year for a moderate ground resolution
satellite, such as Landsat TM. The frequency characteristics will be determined by the design
of the satellite sensor and its orbit pattern.
(iii)Spectral resolution
The spectral resolution of a sensor system is the number and width of spectral bands
in the sensing device. The simplest form of spectral resolution is a sensor with one band only,
which senses visible light. An image from this sensor would be similar in appearance to a
black and white photograph from an aircraft. A sensor with three spectral bands in the visible
region of the EM spectrum would collect similar information to that of the human vision
system. The Landsat TM sensor has seven spectral bands located in the visible and near to
mid infrared parts of the spectrum.
The sensors aboard the Landsat satellite measures reflected radiation in seven spectral
bands from the visible through the thermal infrared. The sensors high spatial resolution
(approximately 30m) makes it useful in precision agriculture. The spectral response and
higher spatial resolution make it suitable for assessing vegetative condition for individual
fields but the overpass frequency is only once every 16 days. The less frequent overpass
makes it difficult to use these data for assessing rapidly changing events such as insect
outbreaks or water stress. New satellites with enhanced capabilities are planned and remotely
sensed data will become more widely used in management support systems.

12
3.2.2 Software
The required software for this study is called ENVI (an acronym for "Environment for
Visualizing Images"). ENVI is a software application used to process and analyze geospatial
imagery. It is commonly used by remote sensing professionals and image analysts. ENVI
bundles together a number of scientific algorithms for image processing a lot of which are
contained in automated, wizard-based approach that walks users through complex tasks.
One more software that will be used for this study is Matlab. Matlab is a high-level
language and interactive program from The MathWorks for numeric computation and
visualisation. MATLAB supports numerical analysis, matrix computation, signal processing,
linear algebra, statistics, Fourier analysis, filtering, optimisation and numerical integration. It
can output two and three dimensional graphics and can be integrated with C, C++, Fortran,
Java, COM and Microsoft Excel.
Image Processing by using Mathlab provides a comprehensive set of reference-
standard algorithms, functions, and apps for image processing, analysis, visualization, and
algorithm development. It can perform image enhancement, image deblurring, feature
detection, noise reduction, image segmentation, geometric transformations, and image
registration. Many toolbox functions are multithreaded to take advantage of multicore and
multiprocessor computers. Matlab software is estimated to be used during PSM 2.
3.2.3 Ancillary
Ancillary data is non-remote sensing data for interpretive model analysis or for
integration into Geographic Information Systems. In this project ancillary data is needed for
reference and comparison with the output.
Ancillary data are secondary data, pertaining to the area or classes of interest, such as
topographic, demographic, or climatological data. Ancillary data may be digitized and used
in conjunction with the primary remote sensing data.
3.3 Conclusion
In the end of the day, requirement of data is very important in order for an analysis to
be accurate and generated good result.
13
CHAPTER 4
DESIGN
4.1 Introduction
This chapter explains about the output development process of NDVI information
map. Starting from the input data type used for this study up to the final output result. The
satellite data (image) need to go through several stages of the process to produce the output.
The accuracy assessment will take part once the output is obtained. The process flow are
based on waterfall methodology.
4.2 NDVI Process
The sequences of NDVI development process are shown by figure 3. For every
component stated on the flow chart, it needs to meet the specification so that desired output
will be achieved. Each component in the flow chart process plays different roles and offers
various information for the NDVI information map. Each process is conducted based on
specific types of algorithm. The formula used must be appropriate for each component
involved. The end result of this stage should be analyzed so as to obtain a good result. The
final output for this study is a NDVI map that represents useful information about vegetation
index to end users. The result obtained from this study is important and useful for further
analysis and research.

14
Flow chart for NDVI
Component 1
Component 2
Component 3
Component 4
Component 5
Component 6
Component 7
Component 8
Component 9
NDVI Modelling
NDVI Derivation
NDVI Segmentation
Accuracy Assessment + Compare +
Analysis
Geometric Correction
Subset/Resize
Ocean Masking
Cloud Masking
Output
Input
Figure 3: The flow chart of NDVI process

15
4.2.1 Input
Input is a data that is included in a program to be processed into an information to
certain parties. Selected input must meet certain criteria that are appropriate to the program
that will be carried out. Sufficient input will produce a good output for the program. Input
source also plays an important role during the selection process inputs. Resources must be
truthful and reliable and certified by the appropriate bodies.
Input format used in this study is the satellite image. Satellite images are generated
from multiple cameras extensively, instruments and sensors installed in satellites that orbiting
the earth. The data provided from these sources offers great use to forecasters, urban
planners, scientist and other user.
4.2.2 Geometric Correction
The transformation of image data, such as Landsat data, to match spatial relationships
as they are on the Earth. Includes correction for band-to-band offsets, line length, Earth
rotation, and detector-to-detector sampling delay. For Landsat, a distinction is made between
data that have been geometrically corrected using systematic, or predicted, values (Level-1G)
and data that have been geometrically corrected using more precise ground control point data
(orthorectified, Level-1G-Terrain).
Correction of errors in remote sensing data, such as that caused by the satellite does
not live on a fixed height or the sensor does not work from the main focal plane. Image is
often compared with the ground control points and resampled accurate basemaps, so that the
exact location and the values of the appropriate pixel can be calculated.
4.2.3 Subset/Resize
Resize Data (Spatial/Spectral) is used to subset images. Subset is generally use for
larger portion image. Usually the satellite data that received from remote sensing agency
covers more than interested region that user wants. Selection is made based on some kind of
image of a particular method. There are two types of subsets, which are spatial subset and
spectral subset. Spatial subset use to limit applying functions to the image. Selecting
interactively from the image. Spectral subset use to limit application of a function to selected
bands of an image. For example user wish to use only certain bands (spectral ranges) in the