forecasting innovation pathways: the case of nano-enhanced
TRANSCRIPT
1
Forecasting Innovation Pathways:
The Case of Nano-enhanced Solar Cells Alan L. Porter,
i Ying Guo,
ii Lu Huang,
iii Douglas K. R. Robinson
iv
ABSTRACT
We have recently devised a 10-step framework to extend research profiling to help identify promising
commercialization routes for a target emerging technology. Our approach combines empirical and
expert analyses. We herein illustrate this framework for the case of nano-enhanced solar cells.
INTRODUCTION
Our endeavors should be considered within the context of Future-oriented Technology Analyses
(“FTA” – see http://foresight.jrc.ec.europa.eu/). Over the years, FTA tools have expanded from
technology forecasting of incrementally advancing technologies (for example, consider Moore‟s Law
describing some six decades of continual advances in semi-conductor capabilities).1
Today,
considerable interest is directed toward New & Emerging Science & Technologies (“NESTs”) as
increasingly, NESTs are anticipated to provide considerable wealth creation. These forms of
technologies tend to be less predictable than incremental innovation processes; they are more dependent
on discontinuous advances; and the anticipated (disruptive) impacts on markets and on society are
difficult (although not impossible) to foresee. In our endeavor to grapple with this challenging
situation, we seek to provide usable intelligence, not only to get a handle of the discontinuous
development of NEST‟s, but also on the pertinent contextual forces and factors affecting possible
technological innovation. However, technology opportunities analysis2 for NESTs poses notable
challenges.
Recently, we put forward our approach to Forecasting Innovation Pathways (“FIP”).3 That paper
provides conceptual background for our endeavors to combine “Tech Mining”4 and “Multi-path
mapping.”5 It explores the promise of this approach through its application to two illustrative
innovation situations, for nano-biosensors and for deep brain stimulation. This paper illustrates
application of the FIP approach for a further case, that of nanotechnology-enhanced solar cells
(“NESCs”). In particular, we focus on a specific type of solar cell, Dye Sensitized Solar Cells
(“DSSCs”).
i Alan Porter is director of R&D for Search Technology, Inc. He is also Professor Emeritus of Industrial &
Systems Engineering, and Public Policy, at Georgia Tech, where he continues to co-direct the Technology Policy
& Assessment Center. E-mail: [email protected]. Tel: 404-384-6295.
ii Ying Guo has just completed her Ph.D. in Management Science and Engineering, Beijing Institute of
Technology of China. Email: [email protected] Tel.: +86 13810027376
iii Lu Huang is a faculty member in the School of Management and Economics, Beijing Institute of Technology.
Email: [email protected] Tel.: +86 13401183006 iv Douglas K. R. Robinson holds a part-time Post-Doctoral position at the Centre for Management Sciences,
Ecoles des Mines, Paris (France). He is also Technical Analyst at the Institute of Nanotechnology (UK). Email:
[email protected] Tel.: +33 621716728
2
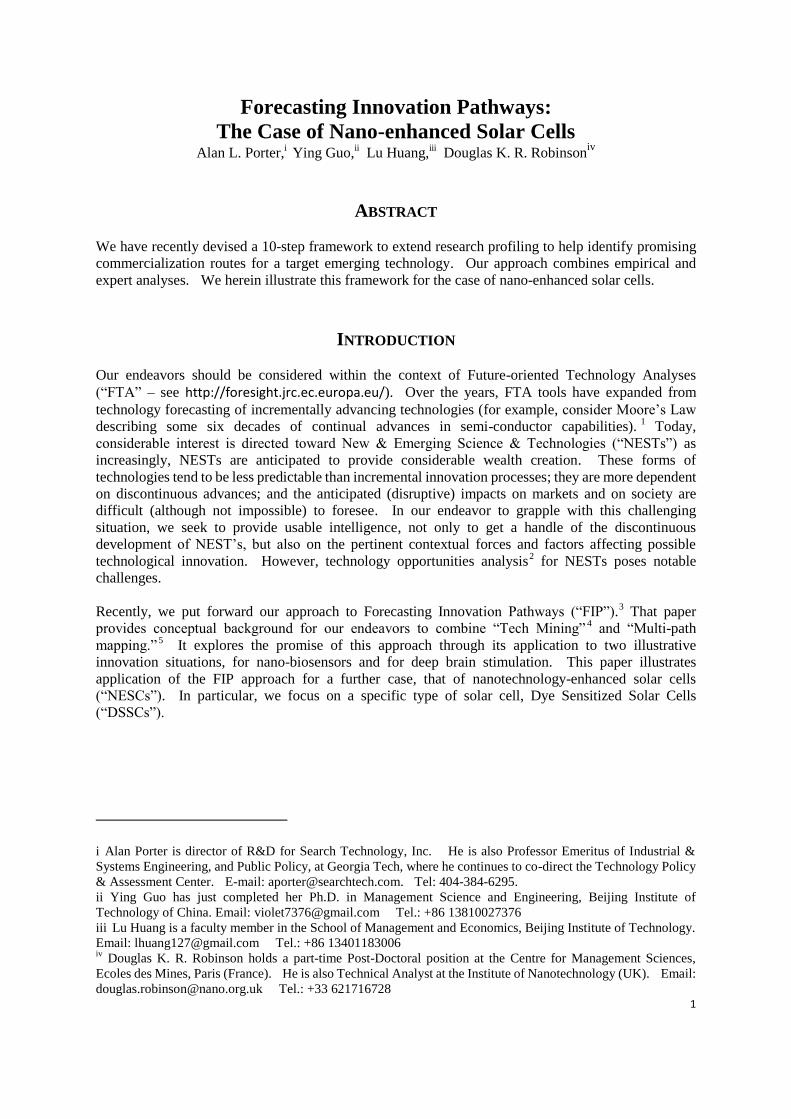
THE FIP FRAMEWORK
The FIP framework includes four stages:
Stage 1 – Understand the NEST and its critical environment
Stage 2 – Tech Mine
Stage 3 – Forecast likely innovation paths
Stage 4 – Synthesize and report
To operationalize these stages, we break them down into 10 steps (Figure 1). We label these “A
through J” but should emphasize that forecasting innovation pathways is not a once-through, linear
process. Rather, it is one that gathers information pursuant to the various steps, being quite willing
to revisit earlier steps as one learns more about the emerging technology and distinguishes vital issues
affecting potential commercial or other applications. In particular, we have set “Step J” – engage
experts – deliberately out of sequence to call attention to it. In our FIP exercises to date, expert
engagement has tended toward informal, in-depth involvement of a limited number of knowledgeable
individuals. We distinguish that from formalized involvement of many experts (e.g., Delphi
procedures), although one could consider augmenting the FIP approach by such techniques.v
Stage 1 is targeted to get the first understanding of the technology – how it works and what functions
it can accomplish (Step A). In addition, we work to characterize the organizational and contextual
factors involved in developing and applying this technology (Step B). We have adopted one of
many innovation systems modeling approaches,6 some addressing NESTs
7 -- the Technology
Delivery System (“TDS”) approach8, 1
-- to reflect contextual dynamics. We find it suitable for FIP
by distinguishing: 1) the enterprise to translate R&D findings to a bonafide innovation and take that to
market, and 2) the key contextual factors affecting the success of that innovation process. Stage 1 is
largely descriptive.
Stage 2, in contrast, is heavily empirical. We search for R&D activity in suitable Science,
Technology & Innovation (“ST&I”) databases, and profile that activity and the associated actors from
these data (Steps C & D). There are many analytical tools to help profile R&D, including
bibliometric analyses, social network analyses, and trend analyses. We adapt these to facilitate our
study as a function of the NEST‟s state of development. We seek innovation indicators (i.e., the
v The FIP framework is designed to put tools to work in a systematic way, and should be taken as a menu that
can be tailored and added to, although we argue that the stages and steps can be generalizable.
3
empirical measures to help gauge technological maturation and prospects for successful applications4).
We also seek to figure out how technological characteristics link to functional advantages,
applications, and potential users (Step E).
As mentioned, Step J, “engage experts,” is an iterative and ongoing process. This depends on the
Competitive Technical Intelligence (“CTI”) analysts‟ knowledge of the target technology. In our
case for nano-enhanced solar cells, we only claim modest knowledge, so we needed guidance
throughout the process. At Georgia Tech, we drew upon a couple of faculty members to orient our
work. Most importantly, we found a willing PhD student (Chen Xu) to collaborate in our analyses.
Later, we gathered approximately ten persons knowledgeable about the technology and policy aspects
for an afternoon workshop. In other cases, the CTI team may include persons deeply conversant
with the target technology, altering the nature of expert inputs needed. Such expert interactions are
best if ongoing and iterative. For instance, early formulation of the TDS with pointers toward key
institutions may illuminate needs for special expertise. Eliciting advice from such experts may, then,
lead to identification of additional (or different) key players in the TDS, and so forth.
Stage 3 brings expertise to bear on the empirical results. Step F digests the prior results to present
those to participating experts and stakeholders. Convening a workshop with multiple perspectives
can anchor Step G explorations of alternative innovation pathways. This is meant to be a creative
endeavor to identify potential applications and array different ways to attain these. It should take
into account competing technologies that could hold advantages over the target NEST under study.
After a stage of open brainstorming workshop activities, it is desirable to elicit ideas from the experts
on “issues.” That is, what are important hurdles to be surmounted along the various innovation
pathways? What are key policy and/or business management leverage points to enhance the
prospects of success? If possible, it can also be valuable to obtain the views of the participants on
impact assessment – i.e., what are potential “unintended, indirect, and delayed” effects9 that could
arise from pursuing a given development path?
Stage 4 (Step I) consists of integration and communication. The aim is to synthesize what has been
revealed about alternative innovation pathways for the NEST under study. Multiple modes
(including interactive means) should be considered to communicate findings to various target users.
As suitable, additional diagnoses based on the findings could lead to targeted recommendations (e.g.,
what steps should our organization pursue regarding development of this NEST?).
THE CASE OF NANOTECHNOLOGY-ENHANCED SOLAR CELLS (NESCS)
Stage 1. Understand the NEST and its TDS (Technology Delivery System)
We offer a number of analytical examples pertaining to NESCs. We present these as a vignette, not a
full-blown case analysis. The motivation for the analyses is scholarly inquiry, not real-time CTI.
Step A calls on the analysts to characterize the technology. Elsewhere, we have explored NESCs and
DSSCs in more detail.10
11
12
Here we note the importance of understanding how these solar cells
work, what functions are important on the R&D agenda, and how the technology could be applied.
Society‟s energy needs promote special interest in renewable energy sources, such as solar cells. Solar
cells can be characterized in three developmental generations.13
First Generation-- “Conventional
Solar Cells,” made from crystalline silicon, account for ~90% of the market, but these are expensive.
Second Generation (“Thin-film Solar Cells)” can be divided into two groups: “Silicon Thin-film” and
“Compound Semiconductor Thin-film.” The latter employ nanotechnology to improve efficiency --
e.g., enlarge the effective optical path for absorption by using nano-materials. Third Generation solar
cells or “New Concepts Solar Cells” are classified in different ways. We note two groups: 1)

4
“Compound Semiconductor Thin-film Solar Cells” that employ quantum dots to enhance efficiency,
and 2) “Dye-sensitized Solar cells.”14
These DSSCs also apply nanotechnologies to enhance cell
performance.
Step B calls for modeling the Technology Delivery System (“TDS”). We emphasize two perspectives
in addressing such socio-economic systems:
a) Push-Pull Enterprise Analysis – to capture the key entity or entities (organizations) to take the
emerging R&D advances (the “Push”) and connect those to potential users – i.e., markets (the
“Pull”)
b) Contextual Forces Analysis – to identify the key factors that will promote, or impede, the
intended technological innovation (typically, oriented toward product or process
commercialization).
Figure 2, below, offers a high-level TDS for DSSCs.15
Based on our analyses of current
developments and target applications, we think it important to track the involvement of three sorts of
companies – those pursuing research; those emphasizing development (in the form of patenting); and
those associated with identifiable business initiatives. We find relatively few companies doing all
three. Later, we will illustrate further probing into the key DSSC actors.
Figure 2 also shows notable governmental and competitive factors. The recent upsurge in support
for renewable energy promotes solar cell initiatives. Long term, we believe general economic forces
will likely be conducive to innovation, but the short term global economic malaise has hit the solar
cell market hard. DSSCs currently hold a minuscule share of the market, but hold bright prospects.
This TDS provides a framework to share with experts to advance more in-depth deliberations.
Stage 2. Tech Mine
Stage 2 leads us into three empirical elements of FIP. These build upon database searches to retrieve
information on R&D, patent, and business-related activity concerning the technology in question. In
addition, in our Framework (Figure 1) we situate Step J, Engage Experts, here. However, as noted, this
is just to ensure that we don‟t neglect to involve experts throughout the study, as needed and where
feasible. To conduct Stage 2 well, one truly needs to integrate empirical and expert information.
Step C involves detailed R&D profiling work. With respect to DSSCs, we searched and downloaded
abstract records from four databases. After cleaning, we have:
2168 publications from the Science Citation Index (SCI), reflecting fundamental research
from the seminal O'Regan and Gratzel paper 14
(in 1991 through 2009
2593 publications from EI Compendex, reflecting more applied (engineering-oriented)
research from 1991 through 2009
1559 patents from the Derwent World Patent Index (DWPI)
1372 records from the Factiva database, capturing business-related activity (e.g., press
releases, trade publication coverage), from 1997 through 2009.
5
Figure 2: Technology Delivery System for DSSCs

6
R&D Profile
Government Competitors
Renewable energy subsidies
• EU: feed-in tariffs
• US: ARRA2009
• …
DSSC research funding
• For academe: from OS
• For company: from NSF
• …
Fuel energy: • climate
change,…
• can not be replaced yet
Traditional solar cell: • expensive,…
• can not be replaced yet
Private Sector Players
Companies pursuing Development [e.g.,
patenting] Companies performing Research [e.g., SCI
publications]
Companies developing Business
initiatives [e.g., Factiva activity]
Research emphases
• TiO2
• efficiency
• …
Leading countries:
• Japan, China, US, Switzerland , and South Korea
• Konarka Technologies
• G24 Innov
• Dyesol
• …
Applications & Markets
• Power-supply charging devices
• Building-integrated photovoltaic (BIPV)
• …
Funding Funding Stimulating
Stimulating/Impeding

7

8
We draw upon these data, together with additional internet probes and expert advice, to work on all
three Stage 2 steps. Concerning R&D, we are especially interested in learning about technological
maturation and “hot” topics, key organizations, and networking among the R&D players at country and
organization level. We selectively illustrate here to give the flavor of FIP-oriented “Tech Mining” 4.
Figure 3 compares activity trends from the four database searches. Some points of note:
Note the tremendous growth rate in activity in all four sources
Concerning R&D, it is interesting to see that scientific research (SCI) has risen together with
engineering-oriented research (Compendex), and with patenting [the recent drop in patent
priority year numbers is an artifact of patent family data]
Note the upsurge in publication and patent activity around 2003, and the subsequent burst in
commercial activity from 2008 – suggesting that this technology could well be on the brink of
major commercialization.
We applied science overlay mapping16
to locate DSSC R&D among the disciplines. This approach
uses the Subject Categories that Web of Science assigns to journals. So, for a set of publications
indexed by Web of Science (in this case, by SCI, which is part of Web of Science), we locate this
research via the journals in which it appears. Figure 4 overlays DSSC research over a base map
reflecting the 221 Subject Categories shown by the background intersecting arcs. The Subject
Categories are grouped into “macro-disciplines” based on the degree of co-citation of the Subject
Categories in a large sample of articles indexed by Web of Science.17
Those macro-disciplines become
the labels in the figure. The DSSC research concentrations appear as nodes in the map, with larger
nodes reflecting greater numbers of publications.
Figure 4 illustrates that global DSSC research involves an extensive range of research fields
concentrated in the Materials Science and Chemistry macro-disciplines. This analysis helps understand
the fields involved, to help identify technical experts.

9
Figure 5. Geo-map of DSSC Research Organizations in China (based on SCI)

10
Figure 5, above, locates Chinese research organizations with many SCI publications on DSSCs. The
leading organization, the Chinese Academy of Sciences (with 156 of 413 publications located) is not
shown. Such geo-mapping supports analyses of regional concentration and location of research
“hotbeds.” [The map is made using a VantagePoint (closely related to Thomson Data Analyzer (TDA))
software macro together with Google Earth.]
Figure 6 shows social networking among these leading DSSC fundamental research organizations. In
this case, the Chinese Academy of Sciences is included (with all its institutions collapsed together). In
Thomson Data Analyzer, one could click on a given paper or set of them to examine the authors, topics,
etc. In this way the analyst can identify relationships among key institutions. Interestingly, some of
the highly collaborative institutions are not themselves in China – e.g., Royal Institute of Technology
and the Swiss Federal Institute of Technology. They collaborate on sufficient papers with Chinese
colleagues to appear here.
Figure 6. Collaboration among Top 15 Chinese DSSC Research Organizations (SCI)
11
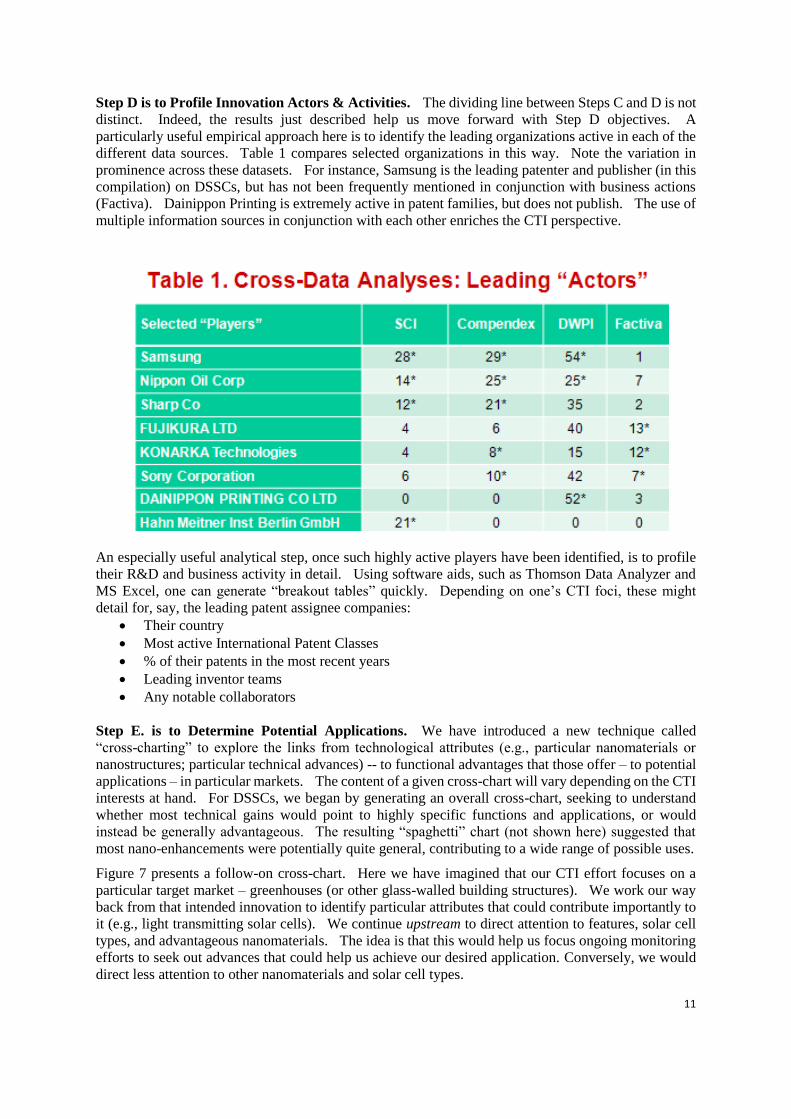
Step D is to Profile Innovation Actors & Activities. The dividing line between Steps C and D is not
distinct. Indeed, the results just described help us move forward with Step D objectives. A
particularly useful empirical approach here is to identify the leading organizations active in each of the
different data sources. Table 1 compares selected organizations in this way. Note the variation in
prominence across these datasets. For instance, Samsung is the leading patenter and publisher (in this
compilation) on DSSCs, but has not been frequently mentioned in conjunction with business actions
(Factiva). Dainippon Printing is extremely active in patent families, but does not publish. The use of
multiple information sources in conjunction with each other enriches the CTI perspective.
An especially useful analytical step, once such highly active players have been identified, is to profile
their R&D and business activity in detail. Using software aids, such as Thomson Data Analyzer and
MS Excel, one can generate “breakout tables” quickly. Depending on one‟s CTI foci, these might
detail for, say, the leading patent assignee companies:
Their country
Most active International Patent Classes
% of their patents in the most recent years
Leading inventor teams
Any notable collaborators
Step E. is to Determine Potential Applications. We have introduced a new technique called
“cross-charting” to explore the links from technological attributes (e.g., particular nanomaterials or
nanostructures; particular technical advances) -- to functional advantages that those offer – to potential
applications – in particular markets. The content of a given cross-chart will vary depending on the CTI
interests at hand. For DSSCs, we began by generating an overall cross-chart, seeking to understand
whether most technical gains would point to highly specific functions and applications, or would
instead be generally advantageous. The resulting “spaghetti” chart (not shown here) suggested that
most nano-enhancements were potentially quite general, contributing to a wide range of possible uses.
Figure 7 presents a follow-on cross-chart. Here we have imagined that our CTI effort focuses on a
particular target market – greenhouses (or other glass-walled building structures). We work our way
back from that intended innovation to identify particular attributes that could contribute importantly to
it (e.g., light transmitting solar cells). We continue upstream to direct attention to features, solar cell
types, and advantageous nanomaterials. The idea is that this would help us focus ongoing monitoring
efforts to seek out advances that could help us achieve our desired application. Conversely, we would
direct less attention to other nanomaterials and solar cell types.

12
Figure 7: Focused DSSC Cross-Charting:
Tracking Materials to Technology to Functions to Applications
The cross-chart could spawn related probes. For instance, we could search within our patent set to see
which assignees appear to be the most involved. Searching claims and uses fields within DWPI reveal
some 19 patent families, of which Samsung holds 6. That suggests that it may be worthwhile to look
within Samsung patenting. We find a total of 54 DSSC-related patent families. Mapping inventor
collaboration patterns suggests two relatively separate R&D teams, one of which is associated with all
of the glass-wall patents. Next steps might include visiting Samsung websites and direct discussion with
their inventors.
Alternatively, other cross-chart foci are quite possible. Were our interests centered on a given
technical aspect (e.g., cheaper film deposition methods), we could make a different cross-chart to
accentuate relationships with that capability. This could help identify potential partners with
complementary interests at different places along this technology development progression, thereby
serving “Open Innovation” purposes.18
13
Stage 3. Forecast Likely Innovation Paths
Step F lays out alternative innovation pathways. This stage was conducted in two rounds. The
first round involved face-to-face interviews with researchers at Georgia Institute of Technology (US),
which provided input to allow a first evaluation of our analyses. The second round entailed a campus
workshop (~10 participants including ~5 with particular knowledge in nano-enhanced solar cells).
This focused on mapping likely innovation avenues, following the process described and demonstrated
by Robinson and Propp.5 Their expert workshops involve a wider spectrum of experts and
stakeholders for a more extended interaction (e.g., full day). We then called upon our collaborating
expert, Chen Xu, again to help interpret results from the workshop (lots of notes).
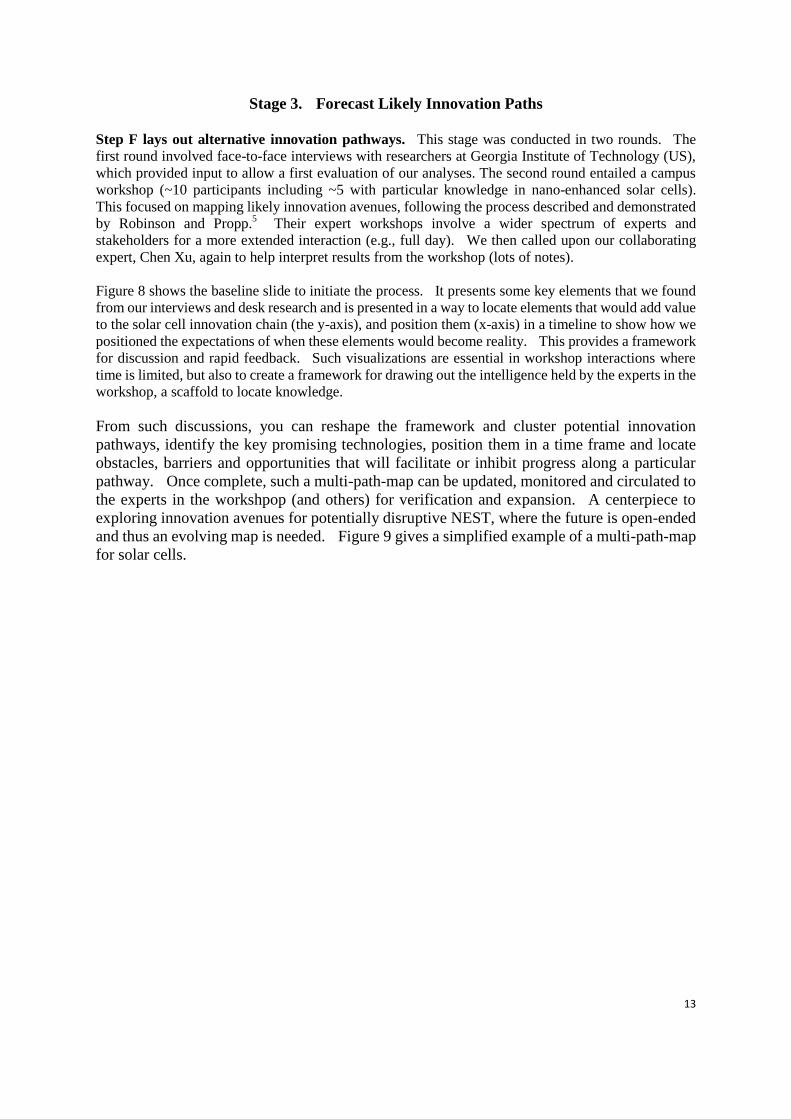
Figure 8 shows the baseline slide to initiate the process. It presents some key elements that we found
from our interviews and desk research and is presented in a way to locate elements that would add value
to the solar cell innovation chain (the y-axis), and position them (x-axis) in a timeline to show how we
positioned the expectations of when these elements would become reality. This provides a framework
for discussion and rapid feedback. Such visualizations are essential in workshop interactions where
time is limited, but also to create a framework for drawing out the intelligence held by the experts in the
workshop, a scaffold to locate knowledge.
From such discussions, you can reshape the framework and cluster potential innovation
pathways, identify the key promising technologies, position them in a time frame and locate
obstacles, barriers and opportunities that will facilitate or inhibit progress along a particular
pathway. Once complete, such a multi-path-map can be updated, monitored and circulated to
the experts in the workshpop (and others) for verification and expansion. A centerpiece to
exploring innovation avenues for potentially disruptive NEST, where the future is open-ended
and thus an evolving map is needed. Figure 9 gives a simplified example of a multi-path-map
for solar cells.
14
Present Short/medium term Long term
Material
Nanostructure
Structure function
Product
Application area
cadmium sulfide
(CdS)Government
amorphous
siliconCompetitors copper indium diselenide
(CIS)Renewable energy subsidies
• EU: feed-in tariffs
• US: ARRA2009
• …
cadmium telluride (CdTe)DSSC research funding
• For academe: from OS
• For company: from NSF
• …
TiO2, ZnO……
Organic materials
Nanoparticle
Nanowires Fuel energy:
• climate change,…
• can not be replaced yet
Quantum
dotTraditional solar cell:
• expensive,…
• can not be replaced yet
Carbon
nanotubesPrivate Sector Players
Large surface area could increase light absorption
Large surface area could help charge separation
Tailor optical properties through its size
Multiple excition generation (MEG)
Provide new film deposition methods to reduce cost
Silicon Thin-film Solar Cell
Compound Semiconductor Thin-film Solar Cells
Grid connected
Off-grid Personal Product
3 D solar cells
Dye-sensitized solar cells
Organic solar cells
Figure 8. Populating the multi-path framework

15
Figure 9. Multi-Path Map for Dye Sensitized Solar Cells

16
You can identify lead and lag relationships from silicon-based -- through quantum dot
enhanced -- solar cells. It suggests that the latter may point toward more niche-market, special
application (higher price) applications. The silicon lead could prove tough competition for
those pursuing such applications (much as the immense silicon infrastructure has become the
dominant semi-conductor platform).
Step G explores innovation components. Once you have such a map, one can consider what
is involved to progress along a given pathway to particular products, processes, or services,
offered to particular markets. This should identify essential requirements for success that are
not yet available. The process should also explore “how” those could be brought about. For
instance, does a particular need call for government funding or standard setting? Are there
requisite developments that call for partnering among which organizations? Figure 9 details a
few issues (as an illustration) but the full map will have more (critical issues and potentially
critical) issues that would need to be handled for successful innovation. For instance, what are
the full life cycle costs of these various solar cell formulations?
Step H calls to Perform Technology Assessment. Much of the FIP process serves to
promote the first type of Technology Assessment – evaluation of competing technologies.
From Figure 1 onward, we are oriented towards the consideration of the target NEST with full
awareness that it does not enter a vacuum, it doesn‟t have the market to itself. So how do the
suggested NEST innovation pathways compare with alternatives? A first step is to broaden
the Technology Assessment beyond the technology alone, but on the selection criteria outside
of technical functionality. This leads us to the second type of Technology Assessment –
impact assessment. We especially want to identify potential hazards and side-effects,
including environmental, health and safety concerns that could arise. For solar cells, there are
particularly toxic materials that could pose dangers during extraction, processing, and
manufacturing processes. What sort of exposure issues are there? How do they compare with
the risk and regulation landscape? Are the protocols for handling such substances in place? Is
the risk framework adequate?
Additionally, are there materials apt to degrade into more toxic forms with extended exposure
to sunlight and weather? What is to be done with the solar cells at the end of their useful life?
On the other hand, and really interesting in FIP, is exploration of possible alternative,
“unintended” application opportunities. Might the NEST‟s functional enhancements enable
products in other markets? This has been illustrated by Robinson and Propp (2008), for the
lab-on-a-chip platform.
Stage 4. Synthesize & Report.
These activities will take different forms and is related to why the FIP analysis is being done
and for whom. Public sector oriented FIP would likely want to point toward suggested
leverage points to promote a given family of innovations, or, as well, to preclude unintended
costs. Robinson‟s studies typically provide reports and recommendations. Private sector FIP
complements traditional CTI analyses, extending thinking toward strategic alternative pathway
construction. FIP should inform the full sequence of developmental stages – from R&D
portfolio selection, through new product development, various Open Innovation explorations,
mergers & acquisitions with a technological aim, and so forth.
Various means could be used to integrate and communicate FIP findings. Socio-technical
scenarios are especially appealing. These combine a large number of elements and dynamics
relating to potential innovation chains. Lively story-telling can take actors' initiatives and
interactions into account, and the surrounding or ensuing dynamics and shifts in agendas that
slowly become irreversible. Scenarios are used here to provide insights into how plausible
17
futures may unfold from the present, constructed in narratives that reflect innovation journeys.
Were Figure 9‟s three simplified pathways to be fleshed out, they could provide key inputs.
However, we would suggest that scenarios be written, not as is usually the case, as mutually
exclusive alternatives, but as potential unfolding of the present into the future, where certain
elements could be transferred into each other. In this way the scenarios are a role-play in text
form that illustrate the challenges, opportunities, actors involved, and consequences of different
paths taken, and the outcomes of co-evolution between actor strategies and the evolving
innovation landscape.19
We argue that scenarios are best used to promote in-depth
consideration of managerial or policy options to advance particular innovations, not as
forecasts of pathway likelihood. FIP can support such scenarios through showing in a visually
concise way, the landscape of the expected futures on which these scenarios play out. FIP
stimulates and informs decision making processes.
To wrap up, this is our second paper to present this approach (Figure 1) to Forecasting
Innovation Pathways (see Robinson et al. in the References). That paper suggests ways that
particular Future-oriented Technology Analysis techniques can contribute to the FIP steps.
We are still refining the approach as we try it out on NEST cases. The variability among
NEST situations and possible decision needs calls for the FIP approach to be considered as very
flexible. The extent of data available, time horizon for innovation, and scope of study all
reinforce the need to adapt these 10 steps to one‟s priorities. We hope that our FIP promotes
the use of multiple information resources in conjunction with expert opinion.
Acknowledgements: This research was undertaken at Georgia Tech drawing on support from
the National Science Foundation (NSF) through the Center for Nanotechnology in Society
(Arizona State University; Award No. 0531194); and the Science of Science Policy Program --
“Measuring and Tracking Research Knowledge Integration” (Georgia Tech; Award
#0830207). The findings and observations contained in this paper are those of the authors and
do not necessarily reflect the views of the National Science Foundation.

18
REFERENCES
1 Roper, A.T., Cunningham, S.W., Porter, A.L., Mason, T.W., Rossini, F.A., and Banks, J., Forecasting
and Management of Technology, New York: John Wiley, 2d edition to appear.
2 Porter, A.L., Jin, X-Y., Gilmour, J.E., Cunningham, S., Xu, H., Stanard, C., and Wang, L.,
"Technology Opportunities Analysis: Integrating Technology Monitoring, Forecasting & Assessment
with Strategic Planning, SRA Journal (Society of Research Administrators), 21, No. 2, 21-31, 1994.
3 Robinson, D.K.R., Huang, L., Guo, Y., and Porter, A.L., Forecasting Innovation Pathways for New and
Emerging Science & Technologies, Technological Forecasting & Social Change, under submission.
4 Porter, A.L., and Cunningham, S.W. , Tech Mining: Exploiting New Technologies for Competitive
Advantage. New York: Wiley, 2005.
5 Robinson, D.K.R., and Propp, T., Multi-path mapping for alignment strategies in emerging science
and technologies. Technological Forecasting & Social Change, 75, 517-538, 2008.
6 Hekkert, M.P., Suurs, R.A.A. , Negro, S.O., Kuhlmann, S., and Smits, R.E.H.M., A new approach for
analyzing technological change. Technological Forecasting & Social Change, 74, 413-432, 2007.
7 van Merkerk, R.O., and van Lente, H., Tracing emerging irreversibilities in emerging technologies:
The case of nanotubes. Technological Forecasting & Social Change, 72, 1094-1112, 2005.
8 Wenk, E. Jr. and Kuehn, T. J. Interinstitutional Networks in Technological Delivery Systems, in: J.
Haberer (Ed.), Science and Technology Policy, Lexington Books, Lexington, MA, 153-175, 1977.
9 Coates, J.F. (1976), „Technology Assessment: A Tool Kit‟, Chemtech, 6, 372-383.
10 Guo, Y., Huang, L., Porter, A., L., Nanotechnology-enhanced thin-film solar cells: analysis of global
research activities with future prospects, The 18th International Conference on Management of
Technology, Orlando, Florida, 10, 2009.
11 Guo, Y., Huang, L., and Porter, A.L., Profiling Research Patterns for a New and Emerging Science
and Technology: Dye-Sensitized Solar Cells, The Atlanta Conference on Science and Innovation Policy,
Atlanta, 2009.
12 Guo, Y., Huang, L., and Porter, A.L., The Research Profiling Method Applied to Nano-enhanced,
Thin-film Solar Cells, R&D Management, 40 (2), 195-208, 2010.
13 Conibeer, G., Third-generation Photovoltaics. Materials Today, 10, 42-51, 2007.
14 O'Regan, B., Gratzel, M., A low-cost, high-efficiency solar-cell based on dye-sensitized colloidal
TiO2 films, Nature, 353 (6346), 737-740, 1991.
15 Guo, Y., Xu, C., Huang, L., and Porter, A.L., Composing a technology delivery system for an
emerging energy technology: The case of dye-sensitized solar cells, in preparation.
16 L.Leydesdorff, L., and Rafols, I., A Global Map of Science Based on the ISI Subject Categories,
Journal of the American Society for Information Science and Technology, 60 (2), 348-362, 2009.
17 Porter, A.L., and Rafols, I., Is Science Becoming more Interdisciplinary? Measuring and Mapping
Six Research Fields over Time, Scientometrics, 81(3), 719-745, 2009.
18 Chesbrough, H.W. (2006). Open innovation: a new paradigm for understanding industrial innovation.
In Chesbrough, H.W., Vanhaverbeke, W. and West, J (eds), Open Innovation: Researching a New
Paradigm. Oxford: Oxford University Press.
19
Robinson D. K. R. (2009) Co-evolutionary Scenarios: An application to prospecting futures of the
responsible development of nanotechnology. Technological Forecasting and Social Change, 76 (2009)
1222-1239