forecasting business failure in china using case-based reasoning with hybrid case respresentation
TRANSCRIPT

Copyright © 2009 John Wiley & Sons, Ltd.
Forecasting Business Failure in China Using Case-Based Reasoning with Hybrid Case Respresentation
HUI LI* AND JIE SUNSchool of Business Administration, Zhejiang Normal University, PR China
ABSTRACTCase-based reasoning (CBR) is a very effective and easily understandable method for solving real-world problems. Business failure prediction (BFP) is a forecasting tool that helps people make more precise decisions. CBR-based BFP is a hot topic in today’s global fi nancial crisis. Case representation is critical when forecasting business failure with CBR. This research describes a pioneer investigation on hybrid case representation by employing principal component analysis (PCA), a feature extraction method, along with stepwise multivariate discriminant analysis (MDA), a feature selection approach. In this process, sample cases are represented with all available fi nancial ratios, i.e., features. Next, the stepwise MDA is used to select optimal features to produce a reduced-case representation. Finally, PCA is employed to extract the fi nal information representing the sample cases. All data signifi ed by hybrid case representation are recorded in a case library, and the k-nearest-neighbor algorithm is used to make the forecasting. Thus we constructed a hybrid CBR (HCBR) by integrating hybrid case representation into the forecasting tool. We empirically tested the performance of HCBR with data collected for short-term BFP of Chinese listed companies. Empirical results indicated that HCBR can produce more promising prediction performance than MDA, logistic regres-sion, classical CBR, and support vector machine. Copyright © 2009 John Wiley & Sons, Ltd.
key words business failure prediction (BFP); hybrid case-based reasoning (HCBR); principal component analysis (PCA); feature selection and extraction; case representation
INTRODUCTION AND MOTIVATION
The current global fi nancial crisis has inspired researchers, managers, investors, and governors to pay more attention to business failure prediction (BFP). BFP is an effective tool that helps businesses control risks in a competitive economic society. Various methods for BFP have been discussed in the BFP literature. These studies primarily employ statistical methods; in particular, multivariate
Journal of ForecastingJ. Forecast. 29, 486–501 (2010)Published online 8 October 2009 in Wiley InterScience(www.interscience.wiley.com) DOI: 10.1002/for.1149
* Correspondence to: Hui Li, School of Business Administration, Zhejiang Normal University, sub-box 91 in PO Box 62, YingBinDaDao 688, Jinhua City 321004, Zhejiang Province, PR China. E-mail: [email protected]
Forecasting Business Failure in China 487
Copyright © 2009 John Wiley & Sons, Ltd. J. Forecast. 29, 486–501 (2010) DOI: 10.1002/for
discriminant analysis (MDA) and logistic regression (Logit) are especially popular (Altman and Saunders, 1998; Altman, 1968; Ohlson, 1980). Nowadays, intelligent methods are more fre-quently used to construct forecasting methods of BFP, including case-based reasoning (CBR) (Jo et al., 1997; Li and Sun, 2008, 2009; Li et al., 2009), neural network (Adya and Collopy, 1998; Yang et al., 1999; Tsai and Wu, 2008; Ravi and Pramodh, 2008), support vector machine (SVM) (Min and Lee, 2005; Hui and Sun, 2006; Min et al., 2006; Hua et al., 2007; Ding et al., 2008), rough sets theory (Dimitras et al., 1999; McKee, 2003), data envelopment analysis (Premachandra et al., 2009), Bayesian network (Sarkar and Sriram, 2001; Sun and Shenoy, 2007), and data mining (Lin and McClean, 2001; Sun and Li, 2008). Very recently, a decision-aiding technique (Sun and Li, 2009b) has also been used as a forecasting tool in BFP. Among the methods of BFP, SVM-based BFP has recently become the most abundantly researched. Numerous research studies have concluded that SVM, a specifi c implementation of neural network, outperforms the other methods in BFP.
CBR is very easily understandable; consequently, it has already been applied to solve many real-world problems. CBR has the following two unique advantages, which make it more applicable than other BPF methods: (1) the modeling mechanism of CBR can easily be understood by industrial users; and (2) CBR-based BFP enables users to offer suggestions on why companies are predicted to fall and how they can avoid failure. Thus, like SVM-based BPF, CBR-based BFP has also been avidly researched as of late.
Three processes are critical when using CBR to forecast business failure: representing cases, computing similarities, and generating a forecast. A consensus of similar cases of business failure is used to produce a forecasting; to facilitate this process, the technique of majority voting is often used. For example, the team of Li and Sun (2009a) made an investiga-tion into improving the predictive performance of CBR-based BFP by applying information fusion techniques to produce a consensus from CBR ensembles. Similarity computation is commonly implemented by using the Euclidean metric. For example, the team of Park and Han (2002) attempted to employ feature weighting in the Euclidean metric to improve the predictive performance of CBR-based BFP; the team of Li and Sun also attempted to use the grey relational degree (Sun and Hui, 2006), ranking-order information (Li and Sun, 2008), Gaussian indicators (Li and Sun, 2009b), pseudo-relations (Li et al., 2009), and the combination of outranking relations (Li and Sun, in press) to implement similarity computation more effectively. All these methods help CBR produce better predictive performance in calculating potential business failure.
Frankly, the base of similarity computation and forecasting generation, i.e., case representation, has been cautiously studied in CBR-based BFP. Case representation determines what should be entered into CBR. This process is important in infl uencing the predictive performance of CBR. In previous research, a common method of representing cases is simply employing fi lters or wrappers for feature selection. We therefore wonder whether or not a hybrid means of case presentation can help CBR produce more accurate forecasting.
The motivation for this research is to investigate whether or not hybrid case representation can help CBR improve forecasting performance by combining principal component analysis (PCA) with stepwise MDA. This research is organized as follows: the next section presents construction of the hybrid CBR (HCBR) by combining hybrid case presentation with the k-nearest neighbor (kNN) algorithm; the third section illustrates the design and hypotheses of the empirical experiment; the fourth section examines and discusses the empirical results; and the fi fth section draws conclusions and outlines ideas for further research.
488 H. Li and J. Sun
Copyright © 2009 John Wiley & Sons, Ltd. J. Forecast. 29, 486–501 (2010) DOI: 10.1002/for
HYBRID CASE-BASED REASONING (HCBR)
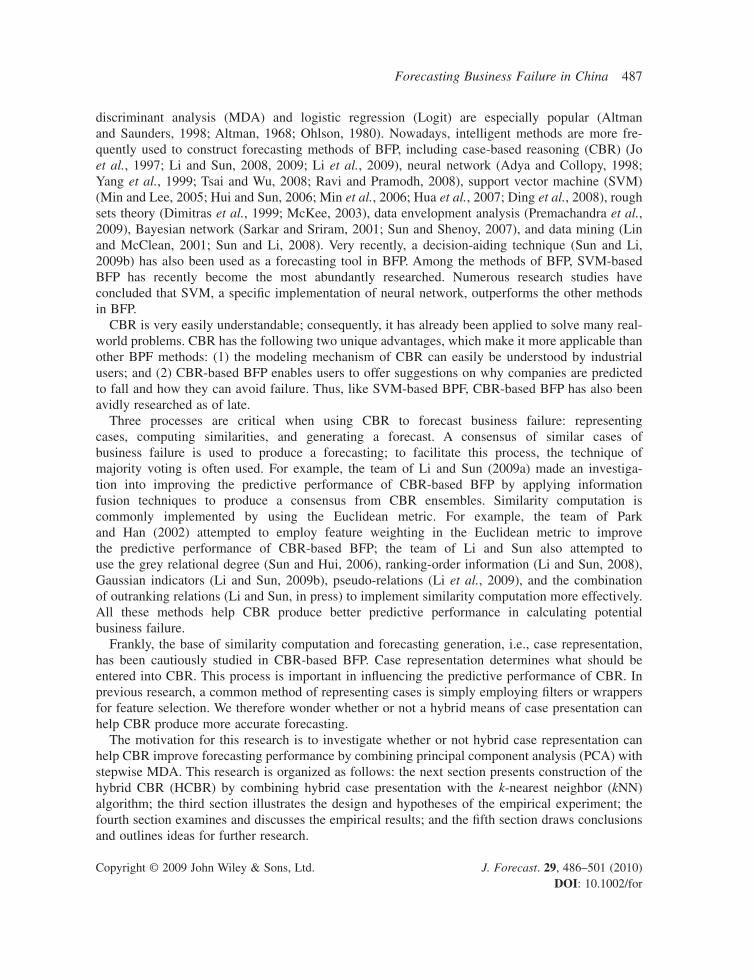
Principle of the HCBRThe principle of the HCBR is illustrated in Figure 1. In this study, we attempt to construct an HCBR by combining PCA with stepwise MDA as a hybrid means of case representation. Thus we do not revise the other two critical factors of classical CBR-based BFP, i.e., similarity calculation and forecasting generation. We still use both the Euclidean metric to measure case similarities and pure majority voting to produce a forecast. The combination of hybrid case representation and the kNN algorithm yields the new HCBR. The working fl ow of HCBR is illustrated in Figure 2.
We focus on forecasting business failure using HCBR; thus all inputs of HCBR are fi nancial data that represent individual companies’ performance. This type of data can be collected from public information released by the companies. Commercial databases can also be used as the source of data for BFP. All useful data are represented by all available fi nancial ratios. These fi nancial ratios are taken as features of HCBR. We can obtain comprehensive descriptions on the business performance of individual companies with data represented by all available fi nancial ratios; this representation is the base of the HCBR.
There are two types of data reduction techniques used to implement hybrid case representation: feature selection and feature extraction. Traditionally, these two techniques are used independently to represent cases; however, we examine whether or not they can be used together to construct a hybrid case presentation approach. The feature selection process is the fi rst step in producing a reduced-case representation from all available features. In this step, we use stepwise MDA, a fi lter approach which is independent from HCBR. We likewise employ the feature extraction approach as another step to represent cases; to do so, we use PCA, a chief feature extraction method, to produce the fi nal case representation. The information represented by the features produced by PCA is input into the kNN algorithm. A Euclidean distance is utilized to measure case similarity, and pure major-ity voting is used to generate the forecasting.
Figure 1. Principle of HCBR
Forecasting Business Failure in China 489
Copyright © 2009 John Wiley & Sons, Ltd. J. Forecast. 29, 486–501 (2010) DOI: 10.1002/for
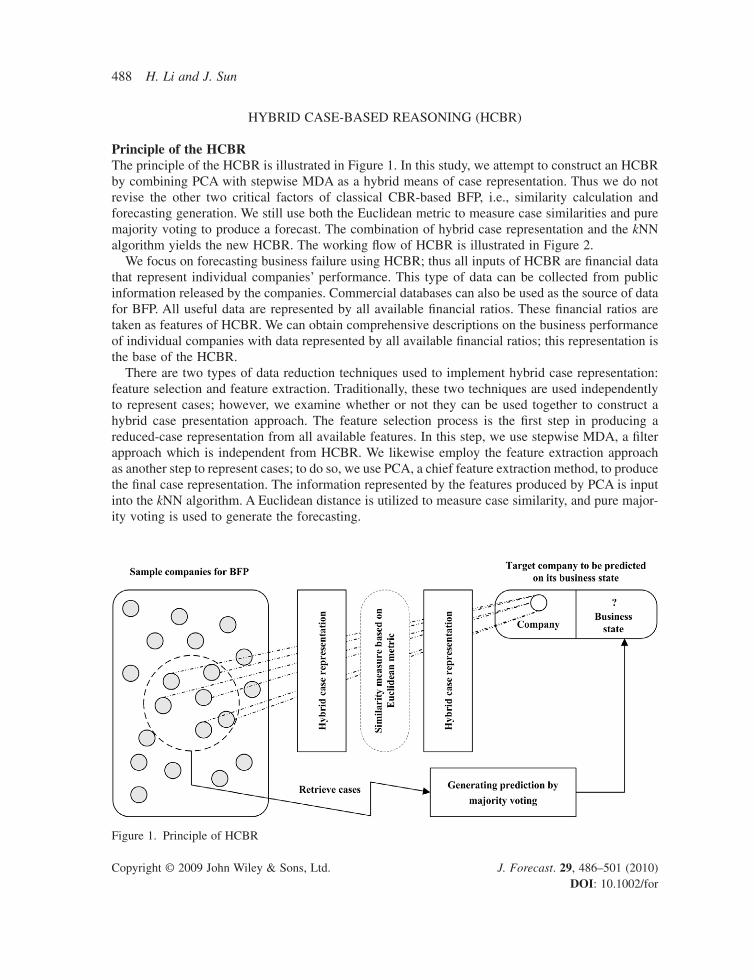
Hybrid case representationHybridization is implemented for case representation by combining stepwise feature selection and feature extraction. This hybridization is illustrated in Figure 3. In order to illustrate the hybridization more clearly, we present the method of hybrid case representation from two views: i.e., the principle of hybrid case representation and the implementation of hybrid case representation. The former is an illustration from a conceptual perspective, and the latter is an illustration from a technique per-spective. From the conceptual viewpoint, all available features are fi rst used to describe cases for the BFP; next, an effective stepwise feature selection method is used to reduce the dimension of data; and fi nally, the feature extraction method is employed to generate the fi nal case representation. The number of features in the fi rst step is the largest among the three steps. Using as many features as possible is very critical in describing the problem of BFP. All features produced by the second step are selected from features of the fi rst step; thus the number of features in the second step is much smaller than that of the fi rst step. The feature number in the last step is the smallest. These features are computed from extracted principal components of the features in the second step. For BFP, fi nancial ratios are used as features describing business performance of companies. In a BFP of Chinese listed companies, the best fi lter is stepwise MDA. Thus we use this feature selection
Figure 2. Flow of HCBR

490 H. Li and J. Sun
Copyright © 2009 John Wiley & Sons, Ltd. J. Forecast. 29, 486–501 (2010) DOI: 10.1002/for
method to produce a reduced-case representation. PCA is a chief feature extraction technique that is used to produce the fi nal case representation by removing key components from signifi cant features picked out by stepwise MDA.
Similarity calculation and prediction generation in HCBRAfter the hybrid case representation is created, case retrieval and case reuse are then implemented. Assume that case a and case b are expressed by ca and cb. There are n features in the hybrid case representation, which are expressed by f1, f2, . . . , fn. Case similarity can be computed by the follow-ing means:
Similarity Euclidean Dis
value
c cc c
c f
a ba b
a i
,,
,
( ) =( )
=+ ( )
1 1
1β
β −− ( )( )=∑ value c fa ii
n
, 2
1
(1)
Figure 3. Hybrid case representation
Forecasting Business Failure in China 491
Copyright © 2009 John Wiley & Sons, Ltd. J. Forecast. 29, 486–501 (2010) DOI: 10.1002/for
where value(ca, fi) expresses the value of case a on the ith feature, and Euclidean Dis(ca, cb) expresses the Euclidean distance between case a and case b. We place equal importance on each feature, since hybrid case representation is a specifi c implementation of feature weighting.
After all of the similarities between the target case and each historical case have been calculated, the prediction of the target case can be produced by majority voting. Prediction generation can be implemented in the following way:
l c L z l caz
jc l c Dj j
( ) argmax( , ( ) )
= = ( )( )∈
∑ (2)
where L( ) is an indicator function that only returns 1 or 0, z is a class label, D is the set of nearest neighbors, and cj expresses the jth nearest neighbor.
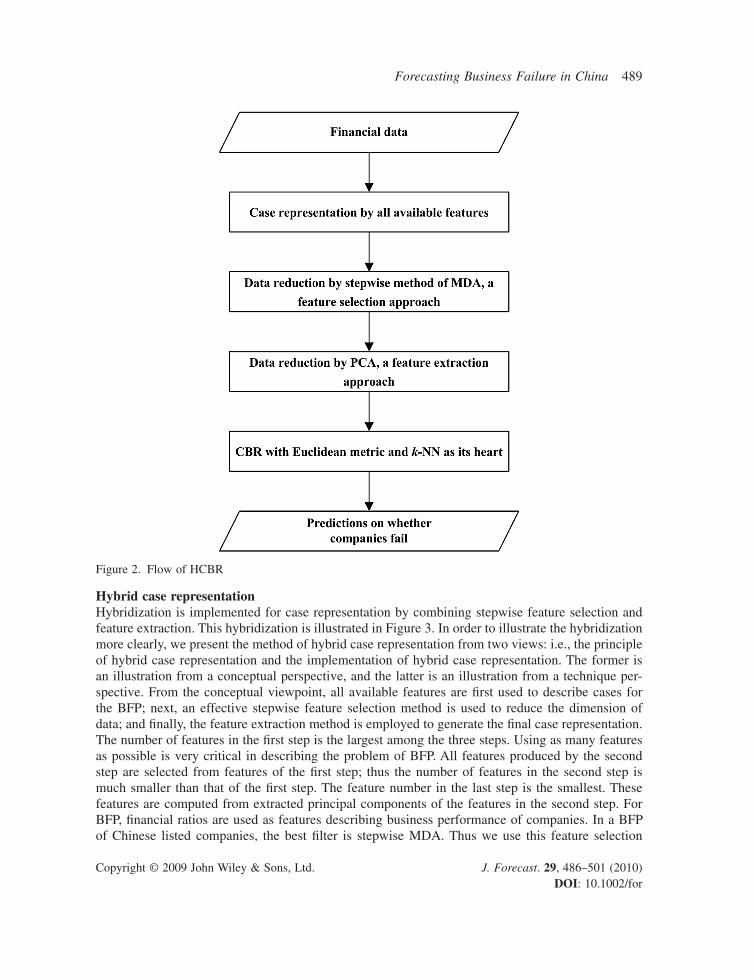
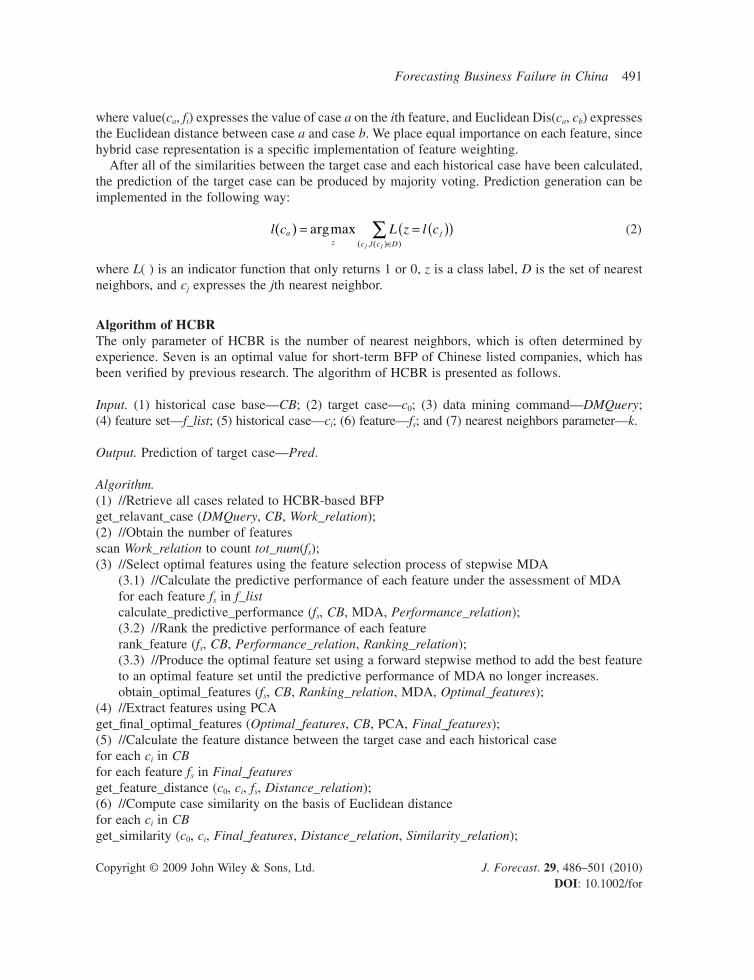
Algorithm of HCBRThe only parameter of HCBR is the number of nearest neighbors, which is often determined by experience. Seven is an optimal value for short-term BFP of Chinese listed companies, which has been verifi ed by previous research. The algorithm of HCBR is presented as follows.
Input. (1) historical case base—CB; (2) target case—c0; (3) data mining command—DMQuery; (4) feature set—f_list; (5) historical case—ci; (6) feature—fs; and (7) nearest neighbors parameter—k.
Output. Prediction of target case—Pred.
Algorithm.(1) //Retrieve all cases related to HCBR-based BFPget_relavant_case (DMQuery, CB, Work_relation);(2) //Obtain the number of featuresscan Work_relation to count tot_num(fs);(3) //Select optimal features using the feature selection process of stepwise MDA (3.1) //Calculate the predictive performance of each feature under the assessment of MDA for each feature fs in f_list calculate_predictive_performance (fs, CB, MDA, Performance_relation); (3.2) //Rank the predictive performance of each feature rank_feature (fs, CB, Performance_relation, Ranking_relation); (3.3) //Produce the optimal feature set using a forward stepwise method to add the best feature
to an optimal feature set until the predictive performance of MDA no longer increases. obtain_optimal_features (fs, CB, Ranking_relation, MDA, Optimal_features);(4) //Extract features using PCAget_fi nal_optimal_features (Optimal_features, CB, PCA, Final_features);(5) //Calculate the feature distance between the target case and each historical casefor each ci in CBfor each feature fs in Final_featuresget_feature_distance (c0, ci, fs, Distance_relation);(6) //Compute case similarity on the basis of Euclidean distancefor each ci in CBget_similarity (c0, ci, Final_features, Distance_relation, Similarity_relation);
492 H. Li and J. Sun
Copyright © 2009 John Wiley & Sons, Ltd. J. Forecast. 29, 486–501 (2010) DOI: 10.1002/for
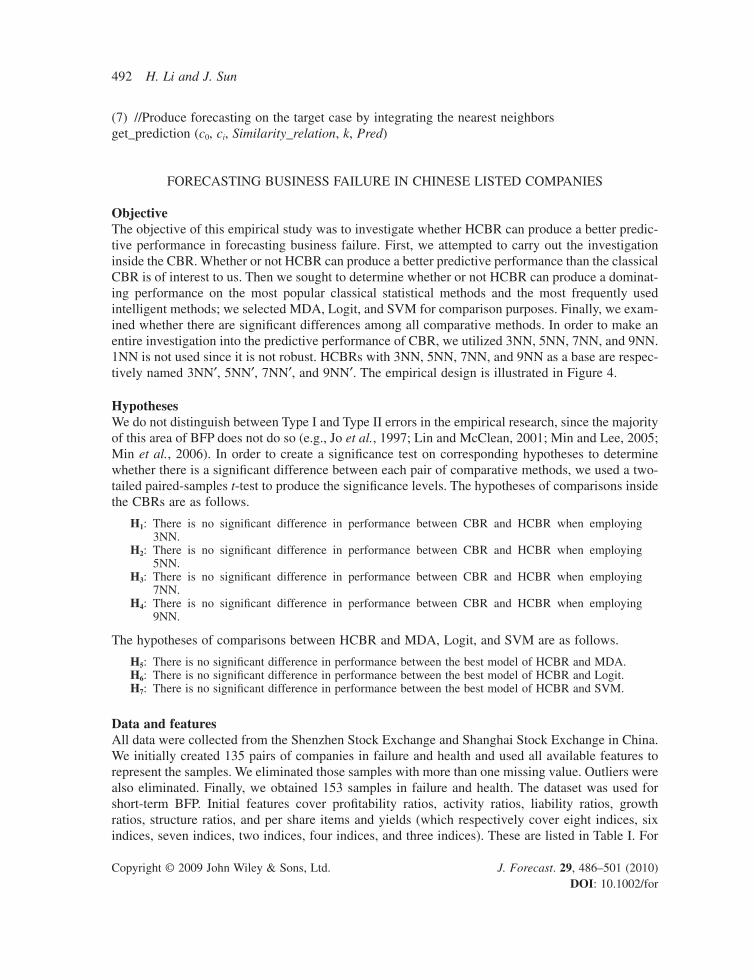
(7) //Produce forecasting on the target case by integrating the nearest neighborsget_prediction (c0, ci, Similarity_relation, k, Pred)
FORECASTING BUSINESS FAILURE IN CHINESE LISTED COMPANIES
ObjectiveThe objective of this empirical study was to investigate whether HCBR can produce a better predic-tive performance in forecasting business failure. First, we attempted to carry out the investigation inside the CBR. Whether or not HCBR can produce a better predictive performance than the classical CBR is of interest to us. Then we sought to determine whether or not HCBR can produce a dominat-ing performance on the most popular classical statistical methods and the most frequently used intelligent methods; we selected MDA, Logit, and SVM for comparison purposes. Finally, we exam-ined whether there are signifi cant differences among all comparative methods. In order to make an entire investigation into the predictive performance of CBR, we utilized 3NN, 5NN, 7NN, and 9NN. 1NN is not used since it is not robust. HCBRs with 3NN, 5NN, 7NN, and 9NN as a base are respec-tively named 3NN′, 5NN′, 7NN′, and 9NN′. The empirical design is illustrated in Figure 4.
HypothesesWe do not distinguish between Type I and Type II errors in the empirical research, since the majority of this area of BFP does not do so (e.g., Jo et al., 1997; Lin and McClean, 2001; Min and Lee, 2005; Min et al., 2006). In order to create a signifi cance test on corresponding hypotheses to determine whether there is a signifi cant difference between each pair of comparative methods, we used a two-tailed paired-samples t-test to produce the signifi cance levels. The hypotheses of comparisons inside the CBRs are as follows.
H1: There is no signifi cant difference in performance between CBR and HCBR when employing 3NN.
H2: There is no signifi cant difference in performance between CBR and HCBR when employing 5NN.
H3: There is no signifi cant difference in performance between CBR and HCBR when employing 7NN.
H4: There is no signifi cant difference in performance between CBR and HCBR when employing 9NN.
The hypotheses of comparisons between HCBR and MDA, Logit, and SVM are as follows.
H5: There is no signifi cant difference in performance between the best model of HCBR and MDA.H6: There is no signifi cant difference in performance between the best model of HCBR and Logit.H7: There is no signifi cant difference in performance between the best model of HCBR and SVM.
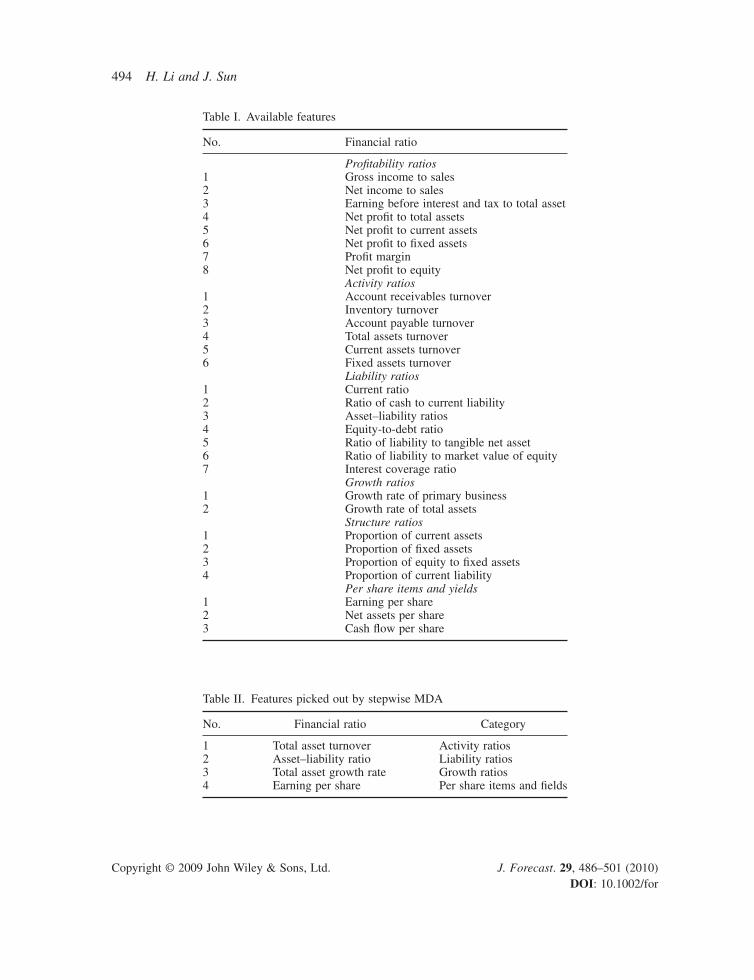
Data and featuresAll data were collected from the Shenzhen Stock Exchange and Shanghai Stock Exchange in China. We initially created 135 pairs of companies in failure and health and used all available features to represent the samples. We eliminated those samples with more than one missing value. Outliers were also eliminated. Finally, we obtained 153 samples in failure and health. The dataset was used for short-term BFP. Initial features cover profi tability ratios, activity ratios, liability ratios, growth ratios, structure ratios, and per share items and yields (which respectively cover eight indices, six indices, seven indices, two indices, four indices, and three indices). These are listed in Table I. For
Forecasting Business Failure in China 493
Copyright © 2009 John Wiley & Sons, Ltd. J. Forecast. 29, 486–501 (2010) DOI: 10.1002/for
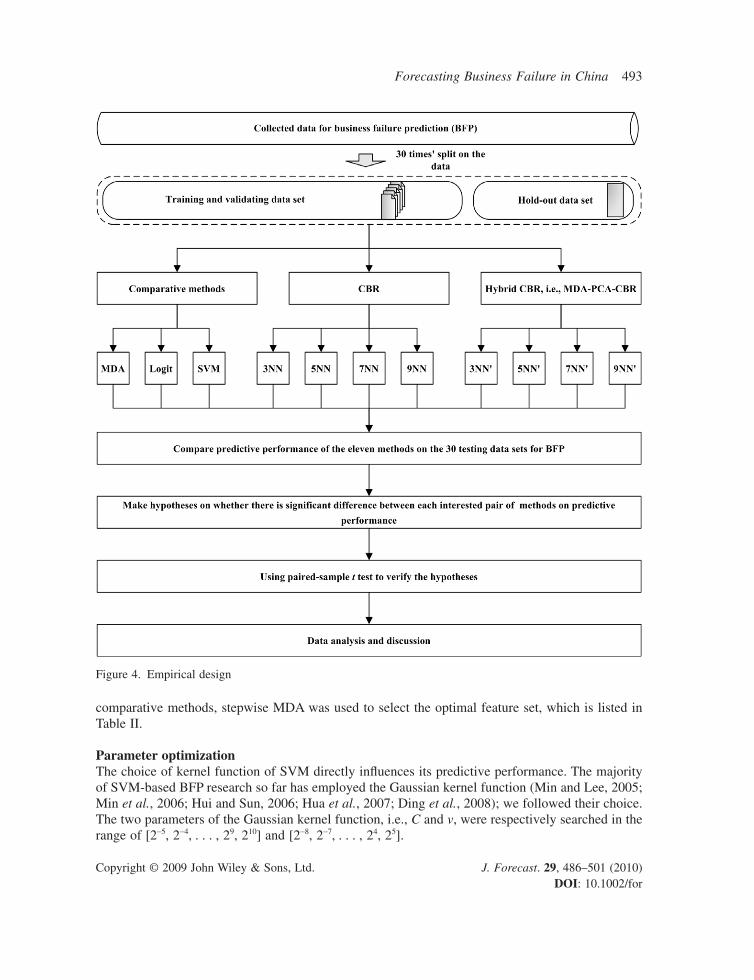
comparative methods, stepwise MDA was used to select the optimal feature set, which is listed in Table II.
Parameter optimizationThe choice of kernel function of SVM directly infl uences its predictive performance. The majority of SVM-based BFP research so far has employed the Gaussian kernel function (Min and Lee, 2005; Min et al., 2006; Hui and Sun, 2006; Hua et al., 2007; Ding et al., 2008); we followed their choice. The two parameters of the Gaussian kernel function, i.e., C and v, were respectively searched in the range of [2−5, 2−4, . . . , 29, 210] and [2−8, 2−7, . . . , 24, 25].
Figure 4. Empirical design
494 H. Li and J. Sun
Copyright © 2009 John Wiley & Sons, Ltd. J. Forecast. 29, 486–501 (2010) DOI: 10.1002/for
Table I. Available features
No. Financial ratio
Profi tability ratios1 Gross income to sales2 Net income to sales3 Earning before interest and tax to total asset4 Net profi t to total assets5 Net profi t to current assets6 Net profi t to fi xed assets7 Profi t margin8 Net profi t to equity
Activity ratios1 Account receivables turnover2 Inventory turnover3 Account payable turnover4 Total assets turnover5 Current assets turnover6 Fixed assets turnover
Liability ratios1 Current ratio2 Ratio of cash to current liability3 Asset–liability ratios4 Equity-to-debt ratio5 Ratio of liability to tangible net asset6 Ratio of liability to market value of equity7 Interest coverage ratio
Growth ratios1 Growth rate of primary business2 Growth rate of total assets
Structure ratios1 Proportion of current assets2 Proportion of fi xed assets3 Proportion of equity to fi xed assets4 Proportion of current liability
Per share items and yields1 Earning per share2 Net assets per share3 Cash fl ow per share
Table II. Features picked out by stepwise MDA
No. Financial ratio Category
1 Total asset turnover Activity ratios2 Asset–liability ratio Liability ratios3 Total asset growth rate Growth ratios4 Earning per share Per share items and fi elds
Forecasting Business Failure in China 495
Copyright © 2009 John Wiley & Sons, Ltd. J. Forecast. 29, 486–501 (2010) DOI: 10.1002/for
EMPIRICAL RESULTS AND DISCUSSION
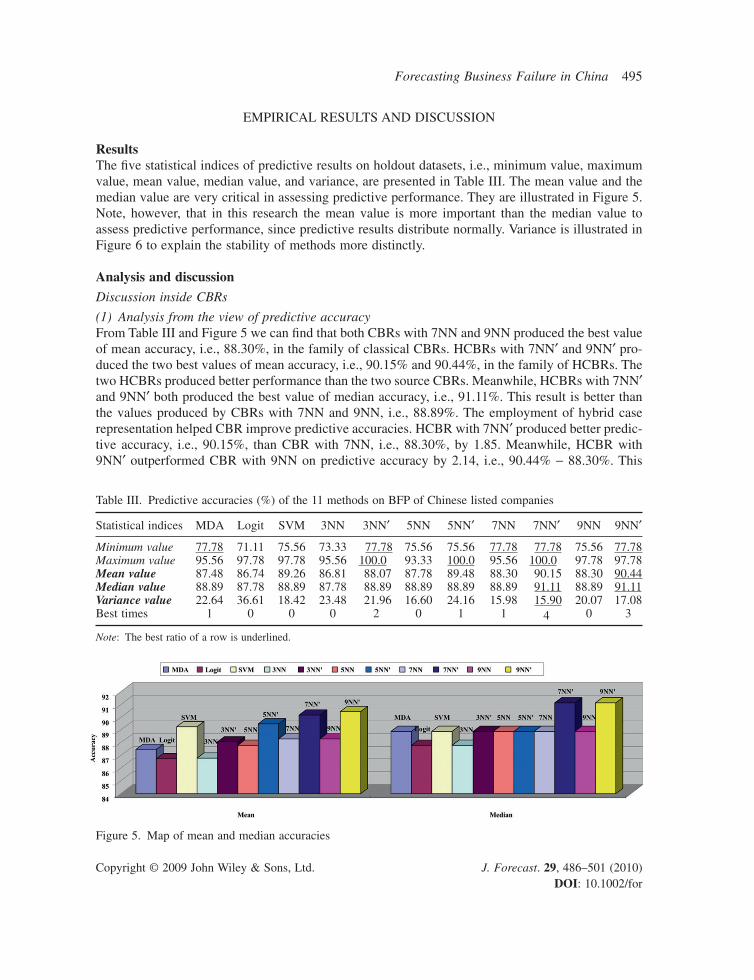
ResultsThe fi ve statistical indices of predictive results on holdout datasets, i.e., minimum value, maximum value, mean value, median value, and variance, are presented in Table III. The mean value and the median value are very critical in assessing predictive performance. They are illustrated in Figure 5. Note, however, that in this research the mean value is more important than the median value to assess predictive performance, since predictive results distribute normally. Variance is illustrated in Figure 6 to explain the stability of methods more distinctly.
Analysis and discussion
Discussion inside CBRs
(1) Analysis from the view of predictive accuracyFrom Table III and Figure 5 we can fi nd that both CBRs with 7NN and 9NN produced the best value of mean accuracy, i.e., 88.30%, in the family of classical CBRs. HCBRs with 7NN′ and 9NN′ pro-duced the two best values of mean accuracy, i.e., 90.15% and 90.44%, in the family of HCBRs. The two HCBRs produced better performance than the two source CBRs. Meanwhile, HCBRs with 7NN′ and 9NN′ both produced the best value of median accuracy, i.e., 91.11%. This result is better than the values produced by CBRs with 7NN and 9NN, i.e., 88.89%. The employment of hybrid case representation helped CBR improve predictive accuracies. HCBR with 7NN′ produced better predic-tive accuracy, i.e., 90.15%, than CBR with 7NN, i.e., 88.30%, by 1.85. Meanwhile, HCBR with 9NN′ outperformed CBR with 9NN on predictive accuracy by 2.14, i.e., 90.44% − 88.30%. This
Table III. Predictive accuracies (%) of the 11 methods on BFP of Chinese listed companies
Statistical indices MDA Logit SVM 3NN 3NN′ 5NN 5NN′ 7NN 7NN′ 9NN 9NN′
Minimum value 77.78 71.11 75.56 73.33 77.78 75.56 75.56 77.78 77.78 75.56 77.78Maximum value 95.56 97.78 97.78 95.56 100.0 93.33 100.0 95.56 100.0 97.78 97.78Mean value 87.48 86.74 89.26 86.81 88.07 87.78 89.48 88.30 90.15 88.30 90.44Median value 88.89 87.78 88.89 87.78 88.89 88.89 88.89 88.89 91.11 88.89 91.11Variance value 22.64 36.61 18.42 23.48 21.96 16.60 24.16 15.98 15.90 20.07 17.08Best times 1 0 0 0 2 0 1 1 4 0 3
Note: The best ratio of a row is underlined.
Figure 5. Map of mean and median accuracies

496 H. Li and J. Sun
Copyright © 2009 John Wiley & Sons, Ltd. J. Forecast. 29, 486–501 (2010) DOI: 10.1002/for
means that the employment of hybrid case representation for BFP helps CBR with 9NN obtain greater accuracy than CBR with 7NN. The best model of HCBR for short-term BFP of Chinese listed companies is 9NN′. Meanwhile, HCBR with 3NN′ and HCBR with 5NN′ respectively pro-duced better predictive performance than CBR with 3NN and CBR with 5NN by 1.26 and 1.7, i.e., 88.07% − 86.81% and 89.48% − 87.78%.
Thus the fi nding is that the employment of hybrid case representation for CBR can help the method produce better predictive performance in BFP. We also fi nd that HCBR outperforms CBR by 1.26, 1.7, 1.85, and 2.14 on 3NN, 5NN, 7NN, and 9NN respectively. This means that the improvement on the predictive performance of CBR is becoming more signifi cant with the number of nearest neighbors increasing. Our objective of improving the predictive performance of CBR in BFP by integrating stepwise MDA with PCA was realized.
(2) Analysis from the view of predictive stabilityFrom Table III and Figure 6 we can see that CBR with 7NN produced the smallest value of variance, i.e., 15.98, among all CBRs. HCBR with 7NN′ produced the smallest value of variance among the 11 methods, i.e., 15.90. Meanwhile, HCBR with 9NN′ produced a value of variance of 17.08, which is smaller than that produced by CBR with 9NN by 2.99. This means that the employment of hybrid case representation stabilizes the predictive performance of CBR.
Thus our objective of improving the predictive stability of CBR in BFP by integrating stepwise MDA with PCA is achieved. The fi nding indicates that the utilization of hybrid case representation for CBR can help the method produce better predictive stability in BFP.
(3) The hypothesis between the best two models of HCBRAlthough HCBR with 9NN′ marginally outperforms HCBR with 7NN′ by 90.44% − 90.15% = 0.29, the median values of HCBR with 7NN′ and HCBR with 9NN′ are the same, i.e., 91.11%. Meanwhile, the former HCBR achieved the best ratios of statistics three times, and the latter HCBR hit the best ratios four times. This means that HCBR with 7NN′ outperforms HCBR with 9NN′ by the fi ve statistical indices of minimum value, maximum value, median value, mean value, and variance. In light of these fi ndings, we further attempted to investigate whether or not there is a signifi cant difference in predictive performance between the two best models of HCBR. Another hypothesis is introduced here.
H8: There is no signifi cant difference in performance between HCBR with 7NN′ and HCBR with 9NN′.
Figure 6. Variance map of the performance of the 11 methods
Forecasting Business Failure in China 497
Copyright © 2009 John Wiley & Sons, Ltd. J. Forecast. 29, 486–501 (2010) DOI: 10.1002/for
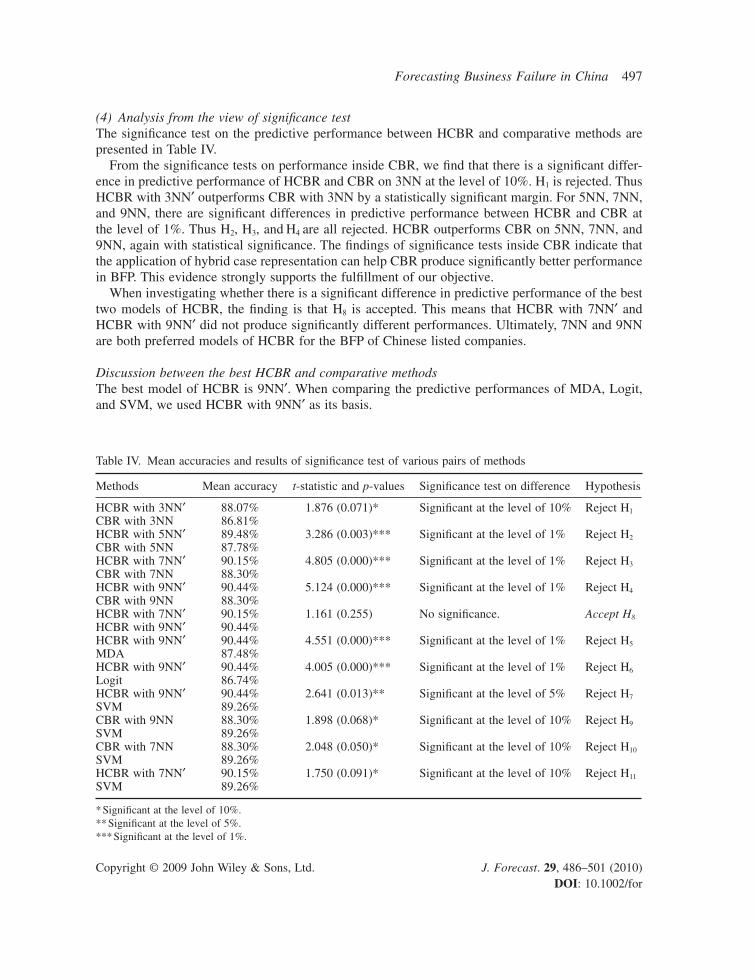
(4) Analysis from the view of signifi cance testThe signifi cance test on the predictive performance between HCBR and comparative methods are presented in Table IV.
From the signifi cance tests on performance inside CBR, we fi nd that there is a signifi cant differ-ence in predictive performance of HCBR and CBR on 3NN at the level of 10%. H1 is rejected. Thus HCBR with 3NN′ outperforms CBR with 3NN by a statistically signifi cant margin. For 5NN, 7NN, and 9NN, there are signifi cant differences in predictive performance between HCBR and CBR at the level of 1%. Thus H2, H3, and H4 are all rejected. HCBR outperforms CBR on 5NN, 7NN, and 9NN, again with statistical signifi cance. The fi ndings of signifi cance tests inside CBR indicate that the application of hybrid case representation can help CBR produce signifi cantly better performance in BFP. This evidence strongly supports the fulfi llment of our objective.
When investigating whether there is a signifi cant difference in predictive performance of the best two models of HCBR, the fi nding is that H8 is accepted. This means that HCBR with 7NN′ and HCBR with 9NN′ did not produce signifi cantly different performances. Ultimately, 7NN and 9NN are both preferred models of HCBR for the BFP of Chinese listed companies.
Discussion between the best HCBR and comparative methodsThe best model of HCBR is 9NN′. When comparing the predictive performances of MDA, Logit, and SVM, we used HCBR with 9NN′ as its basis.
Table IV. Mean accuracies and results of signifi cance test of various pairs of methods
Methods Mean accuracy t-statistic and p-values Signifi cance test on difference Hypothesis
HCBR with 3NN′ 88.07% 1.876 (0.071)* Signifi cant at the level of 10% Reject H1
CBR with 3NN 86.81%HCBR with 5NN′ 89.48% 3.286 (0.003)*** Signifi cant at the level of 1% Reject H2
CBR with 5NN 87.78%HCBR with 7NN′ 90.15% 4.805 (0.000)*** Signifi cant at the level of 1% Reject H3
CBR with 7NN 88.30%HCBR with 9NN′ 90.44% 5.124 (0.000)*** Signifi cant at the level of 1% Reject H4
CBR with 9NN 88.30%HCBR with 7NN′ 90.15% 1.161 (0.255) No signifi cance. Accept H8
HCBR with 9NN′ 90.44%HCBR with 9NN′ 90.44% 4.551 (0.000)*** Signifi cant at the level of 1% Reject H5
MDA 87.48%HCBR with 9NN′ 90.44% 4.005 (0.000)*** Signifi cant at the level of 1% Reject H6
Logit 86.74%HCBR with 9NN′ 90.44% 2.641 (0.013)** Signifi cant at the level of 5% Reject H7
SVM 89.26%CBR with 9NN 88.30% 1.898 (0.068)* Signifi cant at the level of 10% Reject H9
SVM 89.26%CBR with 7NN 88.30% 2.048 (0.050)* Signifi cant at the level of 10% Reject H10
SVM 89.26%HCBR with 7NN′ 90.15% 1.750 (0.091)* Signifi cant at the level of 10% Reject H11
SVM 89.26%
* Signifi cant at the level of 10%.** Signifi cant at the level of 5%.*** Signifi cant at the level of 1%.

498 H. Li and J. Sun
Copyright © 2009 John Wiley & Sons, Ltd. J. Forecast. 29, 486–501 (2010) DOI: 10.1002/for
(1) Analysis from the view of predictive accuracyFrom Table III and Figure 5, we fi nd that the mean predictive accuracy of HCBR with 9NN′, i.e., 90.44%, is higher than that of MDA, Logit, and SVM, i.e., 87.48%, 86.74%, and 89.26%. For comparative methods, SVM produced the highest value of mean accuracy. Thus HCBR with 9NN′ outperforms MDA, Logit, and SVM by 2.96, 3.7, and 1.18 respectively. In terms of median accuracy, HCBR outperforms SVM, MDA, and Logit by 2.22, 2.22, and 3.33 respectively. The fi ndings indi-cate that the employment of hybrid case representation helps CBR produce better predictive perfor-mance than comparative methods.
(2) Analysis from the view of predictive stabilityWe fi nd from Table III and Figure 6 that HCBR with 9NN′, MDA, Logit, and SVM respectively produced variance values of 17.08, 22.64, 36.61, and 18.42. It can be concluded that HCBR with 9NN′ is more stable than MDA, Logit, and SVM by margins of 5.56, 19.53, and 1.34, respectively. The fi ndings indicate that HCBR with 9NN can behave with more stability than comparative methods.
(3) Analysis from the view of signifi cance test
(a) Signifi cance tests respectively between the best model of HCBR and comparative methodsResults of signifi cance tests between HCBR and MDA, Logit, and SVM are listed in Table IV, from which we fi nd that HCBR with 9NN′ outperforms MDA and Logit by a statistically signi-fi cantly margin at the level of 1%. H5 and H6 are both rejected. Meanwhile, H7 is also rejected at the signifi cance level of 5%. HCBR outperforms SVM in statistical signifi cance. The fi nd-ings indicate that it is feasible to integrate PCA with stepwise MDA for case representation in CBR-based BFP. HCBR can produce a dominating predictive performance on MDA, Logit, and SVM.
(b) Signifi cance test between the source model of the best HCBR and SVMNote that SVM produced the best predictive performance among all the three comparative methods. In order to fi nd the effectiveness of utilizing hybrid case representation in CBR more clearly, we attempted to compare the predictive performances of the source model of the best HCBR, i.e., CBR with 9NN, and SVM. Thus, we introduce the ninth hypothesis, i.e.:
H9: There is no signifi cant difference in performance between CBR with 9NN and SVM.
The results of the signifi cance test on the predictive performance between CBR with 9NN and SVM are listed in Table IV. We observe that there is a signifi cant difference in predictive performance between CBR with 9NN and SVM at the level of 10%. This means that CBR with 9NN is outper-formed by SVM at the signifi cant level of 10%. Thus, we reject H9.
When considering results produced by SVM, CBR with 9NN, and HCBR with 9NN′, we can fi nd that CBR with 9NN is signifi cantly outperformed by SVM, and SVM is signifi cantly outperformed by HCBR with 9NN′. The fi ndings indicate that the employment of hybrid case representation helps CBR signifi cantly improve predictive performance.
(c) Signifi cance tests between the second-best HCBR and SVMAs previously noted, HCBR with 7NN′ and HCBR with 9NN′ are the two best models of HCBR. Furthermore, there is no signifi cant difference in predictive performance between the two best models of HCBR. Thus another two hypotheses are introduced, i.e.:
Forecasting Business Failure in China 499
Copyright © 2009 John Wiley & Sons, Ltd. J. Forecast. 29, 486–501 (2010) DOI: 10.1002/for
H10: There is no signifi cant difference in performance between CBR with 7NN and SVM.H11: There is no signifi cant difference in performance between HCBR with 7NN′ and SVM.
Results of the signifi cance test on the predictive performance between CBR with 7NN and SVM, and HCBR with 7NN′ and SVM, are presented in Table IV, from which we can fi nd that there is a signifi cant difference in predictive performance between HCBR with 7NN′ and SVM at the level of 10%. Meanwhile, there is also a signifi cant difference in predictive performance between CBR with 7NN and SVM. Both H10 and H11 are rejected. This means that CBR with 7NN is signifi cantly out-performed by SVM at the level of 10%, and HCBR signifi cantly outperforms SVM at the statistical level of 10%. The fi ndings indicate that the application of hybrid case representation helps CBR signifi cantly improve predictive performance.
SummaryWe have analyzed the results from the respective views of predictive accuracy, predictive stability, and signifi cance tests. All the fi ndings reject the hypothesis that the employment of the hybrid as a representation cannot help CBR produce a dominating predictive performance. The preferred models of HCBR are 7NN′ and 9NN′. There is no signifi cant difference in the predictive performance of the two best models of HCBR. Thus the objective of this research, to improve the predictive perfor-mance of CBR, has been fulfi lled.
CONCLUSION AND FURTHER RESEARCH
The conclusion of this research is that, by combining PCA with stepwise feature selection, HCBR can produce a dominating predictive accuracy and predictive stability in short-term BFP of Chinese listed companies. There is signifi cant statistical improvement in the predictive performance of CBR when hybrid case representation is employed. Among the three comparative methods of MDA, Logit, and SVM, SVM produced the best predictive performance. The best model of CBR is outperformed by SVM with statistical signifi cance. By contrast, the best model of HCBR outperforms SVM sig-nifi cantly. This fi nding produces strong evidence that the employment of hybrid case representation can help CBR improve predictive performance. The best choice for HCBR is 7NN or 9NN in the BFP of Chinese listed companies. This is consistent with our previous research.
In this study, hybrid case representation was fulfi lled by integrating PCA with the feature selection approach of stepwise MDA. In fact, this is a specifi c implementation of integrating PCA with the best fi lter approach. Since we focus on predicting business failures of Chinese listed companies and the best fi lter of this task is stepwise MDA, we combined PCA with stepwise MCA. Further research should be conducted to investigate whether or not this approach can help CBR improve the predic-tive performance of other countries’ BFPs. Note that the best approach of feature selection for other countries’ BFPs may use fi lters other than stepwise MDA. Meanwhile, further research could include whether other methods of feature extraction can help CBR produce a dominating predictive perfor-mance in BFP.
ACKNOWLEDGEMENTS
This research is partially supported by the National Natural Science Foundation of China (no. 70801055) and the Zhejiang Provincial Natural Science Foundation of China (no. Y607011).

500 H. Li and J. Sun
Copyright © 2009 John Wiley & Sons, Ltd. J. Forecast. 29, 486–501 (2010) DOI: 10.1002/for
The authors gratefully thank editors and anonymous referees for their comments and recommendations.
REFERENCES
Adya M, Collopy F. 1998. How effective are neural networks at forecasting and prediction? A review and evalu-ation. Journal of Forecasting 17(5–6): 481–495.
Altman EI. 1968. Financial ratios, discriminant analysis and the prediction of corporate bankruptcy. Journal of Finance 23: 589–609.
Altman EI, Saunders A. 1998. Credit risk measurement: developments over the last 20 years. Journal of Banking and Finance 21(11–12): 1721–1742.
Dimitras AI, Slowinski R, Susmaga R et al. 1999. Business failure prediction using rough sets, European Journal of Operational Research 114(2): 263–280.
Ding Y, Song X, Zeng Y. 2008. Forecasting fi nancial condition of Chinese listed companies based on support vector machine. Expert Systems with Applications 34(4): 3081–3089.
Hua Z, Wang Y, Xu X, Zhang B, Liang L. 2007. Predicting corporate fi nancial distress based on integration of support vector machine and logistic regression. Expert Systems with Applications 33(2): 434–440.
Hui X-F, Sun J. 2006. An application of support vector machine to companies’ fi nancial distress prediction. In Model-ing Decisions for Artifi cial Intelligence, Torra V, Narukawa Y, Valls A et al. (eds). Springer: Berlin: 274–282.
Jo H, Han I, Lee H. 1997. Bankruptcy prediction using case-based reasoning, neural network and discriminant analysis for bankruptcy prediction. Expert Systems with Applications 13(2): 97–108.
Li H, Sun J. 2008. Ranking-order case-based reasoning for fi nancial distress prediction. Knowledge-Based Systems 21(8): 868–878.
Li H, Sun J. 2009a. Majority voting combination of multiple case-based reasoning for fi nancial distress prediction. Expert Systems with Applications 36(3): 4363–4373.
Li H, Sun J. 2009b. Gaussian case-based reasoning for business failure prediction with empirical data in China. Information Sciences 179(1–2): 89–108.
Li H, Sun J. in press. Business failure prediction using hybrid2 case-based reasoning (H2CBR). Computers and Operations Research 37(1): 137–151.
Li H, Sun J, Sun B-L. 2009. Financial distress prediction based on OR-CBR in the principle of k-nearest neighbors. Expert Systems with Applications 39(1): 643–659.
Lin F-Y, McClean S. 2001. A data mining approach to the prediction of corporate failure. Knowledge-Based Systems 14: 189–195.
McKee TE. 2003. Rough sets bankruptcy prediction models versus auditor signaling rates. Journal of Forecasting 22(8): 569–586.
Min J-H, Lee Y-C. 2005. Bankruptcy prediction using support vector machine with optimal choice of kernel function parameters. Expert Systems with Applications 28: 603–614.
Min S-H, Lee J, Han I. 2006. Hybrid genetic algorithms and support vector machines for bankruptcy prediction. Expert Systems with Applications 31(3): 652–660.
Ohlson JA. 1980. Financial ratios and the probabilistic prediction of bankruptcy. Journal of Accounting Research 18: 109–131.
Park C-S, Han I. 2002. A case-based reasoning with the feature weights derived by analytic hierarchy process for bankruptcy prediction. Expert Systems with Applications 23(3): 255–264.
Premachandra IM, Bhabra G, Sueyoshi T. 2009. DEA as a tool for bankruptcy assessment: a comparative study with logistic regression technique. European Journal of Operational Research 192(2): 412–424.
Ravi V, Pramodh C. 2008. Threshold accepting trained principal component neural network and feature subset selection: application to bankruptcy prediction in banks. Applied Soft Computing 8(4): 1539–1548.
Sarkar S, Sriram RS. 2001. Bayesian models for early warning of bank failures. Management Science 47(11): 1457–1475.
Sun J, Hui X-F. 2006. Financial distress prediction based on similarity weighted voting CBR. In Advanced Data Mining and Applications, Li X, Zaiane R, Li Z (eds). Springer: Berlin; 947–958.
Sun J, Li H. 2008. Data mining method for listed companies’ fi nancial distress prediction. Knowledge-Based Systems 21(1): 1–5.
Forecasting Business Failure in China 501
Copyright © 2009 John Wiley & Sons, Ltd. J. Forecast. 29, 486–501 (2010) DOI: 10.1002/for
Sun J, Li H. 2009. Financial distress early warning based on group decision making. Computers and Operations Research 36(3): 885–906.
Sun L, Shenoy PP. 2007. Using Bayesian networks for bankruptcy prediction: some methodological issues. European Journal of Operational Research 180(2): 738–753.
Tsai C-F, Wu J-W. 2008. Using neural network ensembles for bankruptcy prediction and credit scoring. Expert Systems with Applications 34(4): 2639–2649.
Yang Z, Platt M, Platt H. 1999. Probabilistic neural networks in bankruptcy prediction, Journal of Business Research 44(2): 67–74.
Authors’ biographies:Hui Li, who received his PhD from Harbin Institute of Technology in China, is a young member of the World Federation on Soft Computing and a member of Association for Information Systems. He is an associate professor of Zhejiang Normal University in China. He has had over 40 papers accepted and published in some signifi cant journals and conferences, including: European Journal of Operational Research, Information Sciences, Computers and Operations Research, Expert Systems with Applications, Knowledge-Based Systems, and Intelligent Data Engineering and Automated Learning. He has also led several national funded research projects, including the National Natural Science Foundation of China and the Zhejiang Provincial Natural Science Foundation of China. His primary interests include business failure forecasting, applied soft computing, case-based reasoning, and busi-ness computing.
Jie Sun, who received all her BS, MS, and Ph.D. from Harbin Institute of Technology (China), is an associate professor of Zhejiang Normal University (China). Till now, she has had nearly 40 papers accepted and published by some signifi cant journals and conferences, including: Journal of Forecasting, Computers and Operations Research, Expert Systems with Applications, Knowledge-Based Systems, European Journal of Operational Research, and Information Sciences. She has also led a project by the National Natural Science Foundation of China. Her primary interests include fi nancial distress forecasting, fi nancial management, business computing, group decision making, among others.
Authors’ addresses:Hui Li and Jie Sun, School of Business Administration, Zhejiang Normal University, sub-box 91 in PO Box 62, YingBinDaDao 688, Jinhua City 321004, Zhejiang Province, PR China.