forecasting austrian national elections: the grand...
TRANSCRIPT
1
Forecasting Austrian national elections: the grand coalition model
Julian Aichholzer a* a University of Vienna, Department of Methods in the Social Sciences, Rathausstraße 19,
1010 Vienna, Austria. *Corresponding author
Johanna Willmann b
b SUNY at Stony Brook, Department of Political Science, Social and Behavioral Sciences Building, 7th Floor, Stony Brook NY 11794-4392, United States.
Draft version Accepted for publication in International Journal of Forecasting
Biographical notes: Julian Aichholzer is a pre-doc research associate at the Department of Methods in the Social Sciences, University of Vienna and member of the Austrian National Election Study (AUTNES). His primary research interests lie in the field of electoral behavior and survey methodology. Johanna Willmann is a PhD candidate at the University of Vienna and a Fulbright foreign grantee at the University of Stony Brook, Department of Political Science. Her fields of interest include voting behaviour and political psychology. Acknowledgements: This research is conducted under the auspices of the Austrian National Election Study (AUTNES), a National Research Network (NFN) sponsored by the Austrian Research Fund (FWF) (S10903-G11). A previous version was presented at the ÖGPW Tag der Politikwissenschaft, University of Graz, Austria, 30 November 2012. We are deeply indebted to Michael Lewis-Beck for his encouragement and guidance throughout the process of this research. Finally, we thank the two anonymous referees for their helpful comments. All errors remain our own.
2
Abstract
Forecasting national election outcomes has become established practice across several
democracies. In the present paper we develop an economic voting model to forecast the future
success of the Austrian ‘grand coalition’, i.e. the joint electoral success of the two mainstream
parties SPOE and OEVP, at the 2013 Austrian Parliamentary Elections. Our main argument is
that the success of both parties is strongly tied to the accomplishments of the Austrian system
of corporatism, that is, the Social Partnership (Sozialpartnerschaft), in providing economic
prosperity. Using data from Austrian national elections between 1953 and 2008 (n = 18), we
rely on the following predictors in our forecasting model: (1) unemployment rates, (2)
previous incumbency of the two parties, and (3) dealignment over time. We conclude that, in
general, the two mainstream parties benefit considerably from low unemployment rates and
they are weakened whenever they have previously formed a coalition government. Further,
we show that they have continuously lost a good share of their voter basis throughout the past
decades.
Keywords:
Austria; election forecasting; economic voting; multi-party system; Social Partnership

3
Introduction
Forecasts of Austrian national elections traditionally rely upon classical opinion polls,
conducted several days or weeks ahead of an election, or on political stock-markets (Filzmaier
et al. 2003; Hofinger and Ogris 2002). In this paper we are going to forecast the 2013
Austrian parliamentary elections by means of a macro-economic voting model. While this is
established practice in other countries like the US (e.g. Lewis-Beck and Tien 2008; Norpoth
2004), France (e.g. Foucault and Nadeau 2012), or Great Britain (e.g. Lebo and Norpoth
2011; Lewis-Beck et al. 2004; Sanders 2005), this kind of forecasting is a novelty to the
Austrian case. Yet, there is one cross-country comparative forecasting model for radical right
parties in Europe by Evans and Ivaldi (2011) which includes Austria as a case. Relying on
incumbency, unemployment and the number on asylum seekers, they accurately predict the
vote share of the Austrian Freedom Party (FPOE) in 2008. Another study by Neck and Kabuz
(1997) estimates a popularity function for Austrian parties drawing upon macro economic
data (unemployment, inflation, income growth). No efforts, however, have been undertaken to
model a vote function and forecast vote shares of the Austrian mainstream parties based on
political and economic indicators.
Thus, our contribution is fourfold. First, we will close this research gap and develop a
politico-economic voting model to forecast the joint success of the two mainstream parties
SPOE (Social Democrats) and the OEVP (People’s Party), the so-called ‘grand coalition’, at
the 2013 national election. In particular, we ask whether they will manage to keep the
absolute majority of votes beyond 2013. Second, we will add new input to the challenges of
developing electoral vote forecasts for multiparty systems. For the most part, forecasting
models have been developed for two-party or majoritarian systems like the US or Great
Britain, where frequently one single party forms the government and where it is
unambiguously determinable who should be made accountable for economic success or
4
failure. Austria, on the contrary, is a multiparty system where frequently different party
coalitions have formed the government and where economic accountability is difficult to
attribute. Bellucci (2010), Hooghe and Dassonneville (forthcoming), Norpoth and Gschwend
(2010), Magalhães and Aguiar-Conraria (2009) or Stegmaier and Lewis-Beck (2009) have
already set forth models for various multiparty systems and developed individual solutions by
drawing upon the respective country-specific circumstances. We will enrich this branch of
thinking by developing yet another way of coping with multiparty forecasting. Instead of
modeling the vote share of the single governing parties, we model the vote share of the grand
coalition. Thereby we draw upon the Austrian-specific circumstance of corporatism, arguing
that the joint success and economic accountability of the grand coalition parties SPOE and
OEVP can be traced back to their intertwining in Social Partnership arrangements. Third, we
will postulate a parsimonious, politico-economic voting model that gets along without the
frequently used party popularity measure drawn from opinion polls. Thus, we do not rely on
opinion polls in a model that else wise is created from objective political and macro-economic
data. Fourth, we develop a forecasting model with a comparably long lead time of up to one
year.
The paper proceeds as follows. In section one we will discuss the theoretical
underpinning of our economic voting model and address the peculiarity of the Austrian Social
Partnership which helps us to overcome the problems related to multiparty forecasts. In
section two we will specify the details and expectations of our model. Section three will
elaborate on the data sources used in section four, where the voting model is fitted to the past
elections. Finally, in section five, we will forecast the combined vote share of the SPOE and
OEVP for the 2013 elections. We conclude with summarizing our findings.
5
1. Theory: Economic Voting and Social Partnership
Being asked about the most important problem facing their country today, many survey
respondents would indicate that the economy or concerns about unemployment are the most
important issues to them. A considerable branch of the voting literature, i.e. the economic
voting literature (Duch and Stevenson 2008; Fiorina 1981; Key 1966), builds on this
pronouncement. This finding is also confirmed for Austria. More than half of the respondents
(56 per cent) in the 2009 Austrian National Election Study indicated that either
unemployment or the economy matters most to them (see AUTNES 2009). Beyond the
topicality of the economic crisis at this time, these finding are also supported by other surveys
in the past (see Müller 2000, p.42).
So, the state of the economy matters to citizens and they are comfortable when
prosperity is enhanced, economic growth is advanced and unemployment is decreased. The
responsibility hypothesis of economic voting theory assumes that voters reward or punish
parties for the state of the economy, that is, economic prosperity or recession, at the poll. It is
assumed that they can identify who is responsible for the recent economic ups and downs and
accordingly support this party at the poll or let it down. The latter point essentially poses a
problem to forecasting vote shares in multi-party systems (Anderson 2010). In two-party
systems or majoritarian systems, where the government regularly consists of only one party,
the accountability of the government for the state of the economy can be easily assigned to a
single party. In multiparty systems, however, where frequently party coalitions form the
government, it remains to be questioned which party voters will be hold accountable at the
ballot box.
We are by no means the first to recognize that multiparty systems pose a challenge to
election forecasting. For instance, Hooghe and Dassonneville (forthcoming) as well as
Norpoth and Gschwend (2010) have already forecasted election outcomes in proportional

6
representative systems. Hoghe and Dassonneville (forthcoming), for example, have overcome
the multi-party problem by forecasting the vote-share for incumbent parties in general,
treating all parties that participated in a coalition on equal footing as an incumbent party and
assuming that they are equally held responsible by the voters on election day. This approach
requires some sort of repeatedly collected party approval rate measure to level out differences
in party size, which we do not have available for Austria beyond the 1990s. By contrast,
Norpoth and Gschwend (2010) meet the multiparty challenge by using only party specific
variables and no contextual data like economic well-being. That is, they regress the vote share
of every governing coalition only on characteristics of this very coalition and not on context
specific variables. This, however, is incompatible with our economic vote presumption which
assumes that voters blame the incumbent government for economic failure or success.
So, to solve the multiparty challenge of economic voting in Austria, one has to figure
out who is seen as responsible for the state of the economy. In other words, whom do the
voters most likely hold responsible for economic developments? To put it with Lewis-Beck
and Paldam (2000, p.119), “In a multi-party system, the economic voter may target a whole
coalition, a party within the coalition, or even assign a particular economic policy to a
particular party. Once ‘responsibility’ is properly understood, it can be properly modeled
[…]”. We argue that to properly understand responsibility for economic developments in
Austria it is important to consider the actual power over the economy. To a large extent it is
within the discretion of the Austrian system of corporatism, that is, the social partnership
(Sozialpartnerschaft).1 The social partnership, more than any government, has strong
influence on a wide range of economic (and social) questions and is thus responsible for the
success or failure of their policies (Lewis 2002; Marterbauer 2005). When it comes to the
permanent body of the corporatist consent and its influence on the country’s economic 1 This institutionalized co-operation consists of representatives from the Trade Union Federation (ÖGB), the Federal Economic Chamber (WKÖ), the Federal Chamber of Labour (BAK), and the Chamber of Agriculture (LK). See: http://www.sozialpartner.at/sozialpartner/Sozialpartnerschaft_mission_en.pdf
7
prosperity, Austria is doubtlessly a special case as is frequently noted (e.g. Lewis 2002).
Different from virtually all other corporatist systems, the influence of the representational
organizations of labor and employers in Austria goes well beyond conventional consensus
seeking or policy concertation and extends to what Tálos and Kittel (2002) term ‘policy
accordation’. That is to say, the labor and employer associations do not only seek consensus
in negotiations with the government, but actually draft policy propositions on a wide range of
socioeconomic issues which are then either submitted directly to the Parliament or which pass
through the Cabinet to the Parliament. In either way the propositions remain largely
unchanged and are adopted as suggested by the associations (Tálos 2005).
Now, one can argue that the social partnership has forfeited its influence in the past
two decades compared to the ‘golden age’ of the 1960s or 1970s. Thus, its responsibility for
the economic well-being of the country would be questionable. Indeed, the increasing
internationalization and in particular the Europeanization of the economy, leaving national
actors with lesser policy discretion, has led authors to speculate about the end of corporatism
(Crepaz 1994; Tálos 2005). However, we believe that the responsibility assumption still holds
due to two reasons: first, the political developments of the 1990s have not necessarily led to
an erosion of corporatist power, but to a transformation. As Heinisch (2000) points out, the
Austrian Social Partnership has fared pretty well in adapting to the altered challenges of
internationalization and rather strengthened its position in the 1990s. He concludes that the
corporatist partners have actually become a driving force of Austria’s EU accession and
expanded their reach by diversifying into non-traditional policy fields. Second, and more
importantly, formal change in power does not prevent citizens from believing that the Social
Partnership still matters. There is some evidence that the Social Partnership is still seen as
advantageous for Austria in the popular opinion and citizens tend to demand a fair amount of
influence of this institution (Heinisch 2000; Kittel 2000; Tálos 2005, pp.210f; Tálos and

8
Kittel 2002). This implies that people are aware of the Social Partnership’s functioning and
have certain expectations as to its outcome. Thus, they will ascribe responsibility to the Social
Partnership when it delivers economic well-being as well as when it fails to do so.
Thus, we properly understand responsibility for economic prosperity as tied to the
Social Partnership. However, this rationale does not immediately help us in effectively
modeling economic responsibility. After all, the Social Partnership is an extra-parliamentary
institution, or what Duch and Stevenson (2008, p.178) call a ‘nonelectorally dependent
decision maker’, which cannot directly be hold accountable at the ballot box. The
institutionalized co-operation is, however, historically very closely linked to the two Austrian
mainstream parties, with the OEVP representing the employer organization and the SPOE
representing the employee organizations. Leading representatives of the corporatist
associations regularly become Members of the Parliament for either of the two parties,
sometimes they are even assigned governmental positions, but in any case they are strong
opinion leaders within their parties. The voters can thus blame or reward the parties for
failures or achievements of the Social Partnership. We assume that voters jointly blame the
SPOE and OEVP at the ballot box when economic matters are working unsatisfactorily and,
thus, we model the combined vote share of these two parties as a function of economic
prosperity within the country.2 As can be seen in the table in the appendix, the combined vote
share of the SPOE and OEVP was very high in the 1960s and 1970s when the country
experienced considerable economic growth and economic stability – for which the corporatist
system is conventionally made responsible (Gerlich et al. 1988). With the decelerating
economic growth in the subsequent decades, some voters lost their faith in the competence of
the SPOE and OEVP and their party-affiliated corporatist organizations in directing the
2 Note: Also, looking at the past 18 elections (1953-2008) vote shares of the SPOE and the OEVP were considerably correlated (r = 0.74).

9
country’s economy to sufficient economic prosperity and the combined vote share decreased
accordingly.
2. Specifying the Model
After having made a case for the basic logic of our model, i.e. the SPOE and OEVP are
jointly held responsible for economic failure and success, we will set forth to specify it in
more detail. That is to say, our independent variables are: unemployment, incumbency, and a
measure for progressing partisan dealignment.
We build our model upon unemployment as the main economic measure for two
reasons: on the one hand we contend that the unemployment rate is a good indicator of the
general economic prosperity within a country. This measure frequently fares well in forecast
models. While Lewis-Beck and Tien (2005), for example, use jobs in their (Jobs) model for
the US, Arzheimer and Evans (2010) as well as Foucault and Nadeau (2012) draw upon
unemployment as an economic indicator to forecast French national elections, as do
Magalhães, Aguiar-Conraria and Lewis-Beck (2011) for Spanish elections. Second, we make
a case on the voters’ individual evaluations. As our argument is that people blame the SPOE
and OEVP for the success of the institutionalized employer/employee co-operation, it is
reasonable to choose an indicator upon which the Social Partnership has an influence. Further,
as we have seen above, people consider unemployment a pressing issue – not only those who
are directly concerned by it, but also those who actually have jobs. When jobs are scarce,
wages are not raised and it is difficult to change the employment position to make one’s
career. Thus, people generate a general bad mood when talking about the bad economic
prospect with each other and we assume that voters follow this general mood and weaken the
two mainstream parties as unemployment increases.
10
To sum it up, we will rely on the general unemployment rate as an indicator of
economic prosperity and we expect the relationship between the unemployment rate and the
support for the mainstream parties to be negative: the higher the unemployment rate, the less
votes are cast for the ‘grand coalition’ and the more protest votes are gained by other
(opposition) parties. We argue that the causal link is primarily through the Social Partnership,
that is, the parties representing employers and employees are rewarded or punished by the
voter for the state of the economy. However, it is reasonable to assume that this effect will
matter more (or only) if both parties were incumbent in the previous term and formed a so
called ‘grand coalition’. If one of the two parties was an opposition party it could recover and
allocate votes from the other party again. Technically speaking, we will therefore interact the
unemployment rate with a variable indicating grand coalition incumbency.3
Further, we argue that incumbency of the two parties itself can have a negative effect
on vote shares. We argue that the popularity of the coalition parties dwindles when they are in
office, what Norpoth (1991) terms ‘incumbency fatigue’. In particular, their practice of the
Proporz (proportional) system is assumed to tire out the voters. Jobs in nationalized industries
and administration, including the public service broadcaster (ORF), are usually shared among
the SPOE and the OEVP (e.g. Ennser-Jedenastik forthcoming). This practice has often been
criticized as intransparent, unjust, and inflexible and may therefore harm their success in the
subsequent election. Note, however, that we do not make specific hypotheses about the
leading party in a grand coalition government. That is, we implicitly assume equal
responsibility attribution. Further, when looking at our interaction hypothesis we have strong
reason to believe that there should be no impact of incumbency if unemployment rates
approach zero.
3 Note: See data on incumbency in the Appendix. Besides one-party governments (elected 1966-1979), there were four other coalitions, namely SPOE/FPOE (elected 1983, 1986), and OEVP/FPOE (elected 1999, 2002). Yet, it has never occurred that none of two parties participated in the government.
11
Finally, we have to make allowance for the steady partisan dealignment (see Dalton
and Wattenberg 2000) in our model which has been affecting the baseline vote share of the
two mainstream parties since the 1950s. In other words, it is very unlikely that, ceteris
paribus, today the two parties will gain the same vote shares as in the 1960s or 1970s. While
Austria used to be characterized by high rates of party membership and strong party
identification with the two mainstream parties, this phenomenon has gradually decreased over
time. Since we lack reliable and updated data on issues like party membership figures, voter
survey data on partisan affect or socio-structural changes in classical cleavage groups in the
constituency, we insert a time index variable capturing the dealignment effect (see, for
example, Fair 1988). Moreover, using a time index is often used for detrending time-series
data.
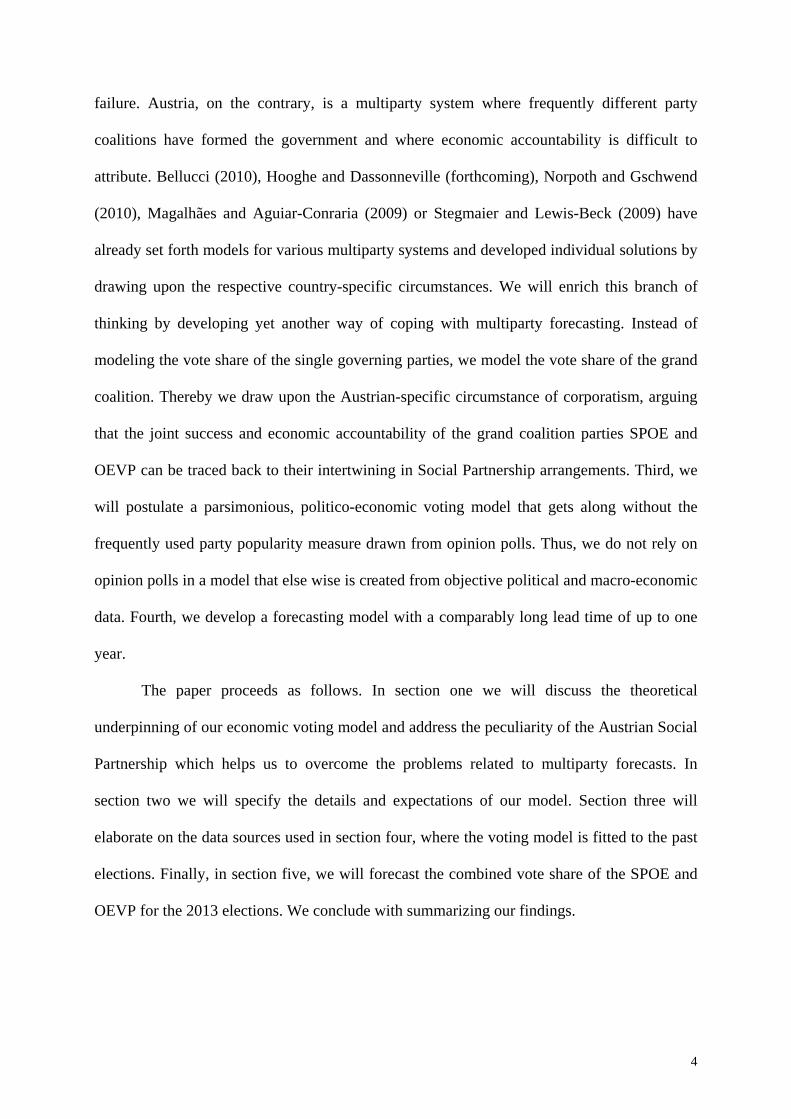
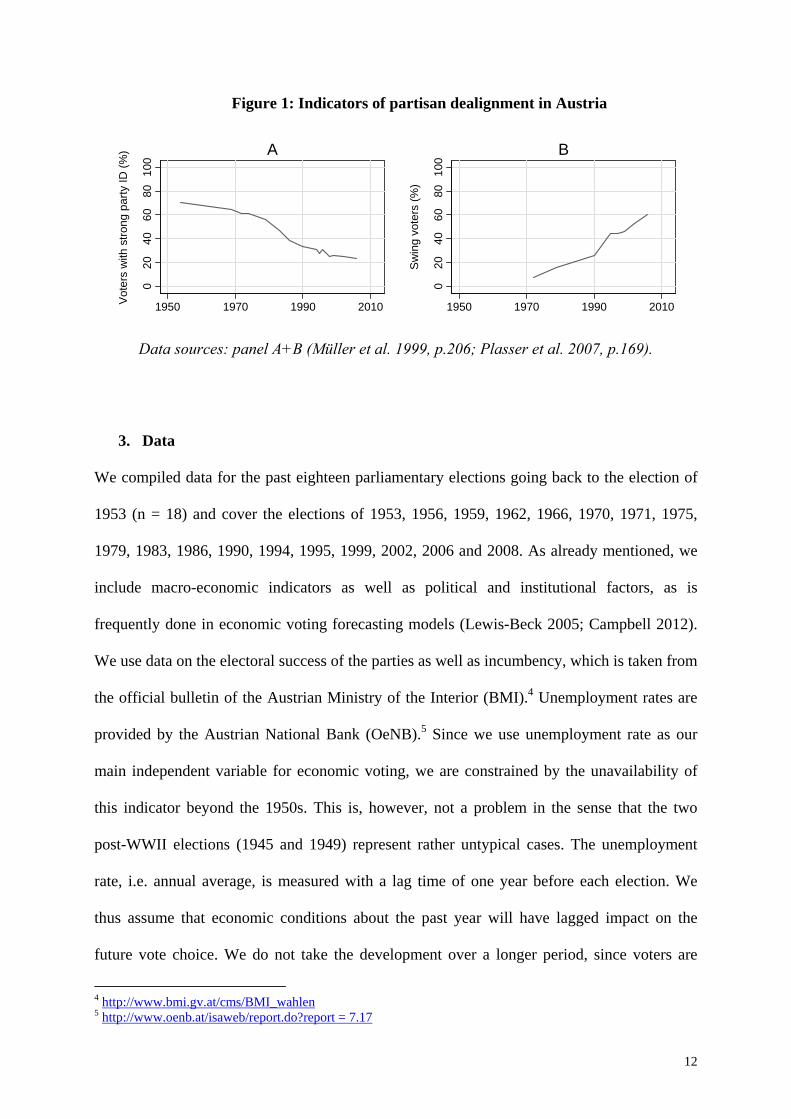
Though our time index is a rather rough indicator, it serves as a proxy for otherwise
unavailable data and can be seen as the ‘common factor’ underlying several indicators of
dealignment. Indeed, available figures (see Figure 1) show that party identification in Austria
has been declining since the mid-1950s, while swing voting is on the rise. Several social
changes in the constituency thus suggest a severe and continuous decline in the voter basis of
both the SPOE and the OEVP that is still ongoing. It is not yet clear when this decline will
reach a preliminary bottom. Hence, once the pattern in decline will change in the future,
forecasting with the present model will become inaccurate.
12
Figure 1: Indicators of partisan dealignment in Austria
020
4060
8010
0
Vot
ers
with
stro
ng p
arty
ID (%
)
1950 1970 1990 2010
A
020
4060
8010
0
Sw
ing
vote
rs (%
)
1950 1970 1990 2010
B
Data sources: panel A+B (Müller et al. 1999, p.206; Plasser et al. 2007, p.169).
3. Data
We compiled data for the past eighteen parliamentary elections going back to the election of
1953 (n = 18) and cover the elections of 1953, 1956, 1959, 1962, 1966, 1970, 1971, 1975,
1979, 1983, 1986, 1990, 1994, 1995, 1999, 2002, 2006 and 2008. As already mentioned, we
include macro-economic indicators as well as political and institutional factors, as is
frequently done in economic voting forecasting models (Lewis-Beck 2005; Campbell 2012).
We use data on the electoral success of the parties as well as incumbency, which is taken from
the official bulletin of the Austrian Ministry of the Interior (BMI).4 Unemployment rates are
provided by the Austrian National Bank (OeNB).5 Since we use unemployment rate as our
main independent variable for economic voting, we are constrained by the unavailability of
this indicator beyond the 1950s. This is, however, not a problem in the sense that the two
post-WWII elections (1945 and 1949) represent rather untypical cases. The unemployment
rate, i.e. annual average, is measured with a lag time of one year before each election. We
thus assume that economic conditions about the past year will have lagged impact on the
future vote choice. We do not take the development over a longer period, since voters are
4 http://www.bmi.gv.at/cms/BMI_wahlen 5 http://www.oenb.at/isaweb/report.do?report = 7.17
13
usually assumed to have a relatively short time horizon with regards to economic evaluations
(see Lewis-Beck and Paldam 2000).
In our model we finally include the combined vote share of the two parties as our
dependent variable (M = 80.95, S.D. = 12.90, Min = 55.24, Max = 93.37), unemployment rate
in the year before the election (y-1) (M = 4.77, S.D. = 2.00, Min = 1.50, Max = 7.50), an
interaction of unemployment and joint incumbency of SPOE and OEVP in the previous
elections (incumbent in 56 per cent of the elections), as well as a time index variable (see, for
example, Fair 1988). The time index variable acts as a control for the assumed dealignment
process and the increased volatility of the electorate at every election. We also tried to model
the loss of mainstream parties’ voter basis using other proxies for long-term changes in
partisanship, for example, a moving average of lagged vote shares of previous elections as
suggested by Norpoth and Gschwend (2010). However, the lagged vote shares follow a
curvilinear pattern that goes hand in hand with low unemployment rates in the 1970s and,
hence, cannot be considered an independent trend. Rather the inspection of model residuals
suggests that there is an almost linear time-dependent trend (serious autocorrelation) in vote
shares that is neither explained by unemployment nor by incumbency. Nevertheless, it is
important to note that our time index variable serves only as an approximation for a societal
trend which we can observe for the previous elections and which we assume to be true also
for the next election. Hence, we do not encourage making predictions based on this index
variable for the infinite future, as this will result in natural extinction of the two parties.
Rather, this trend must be updated with each election to come.
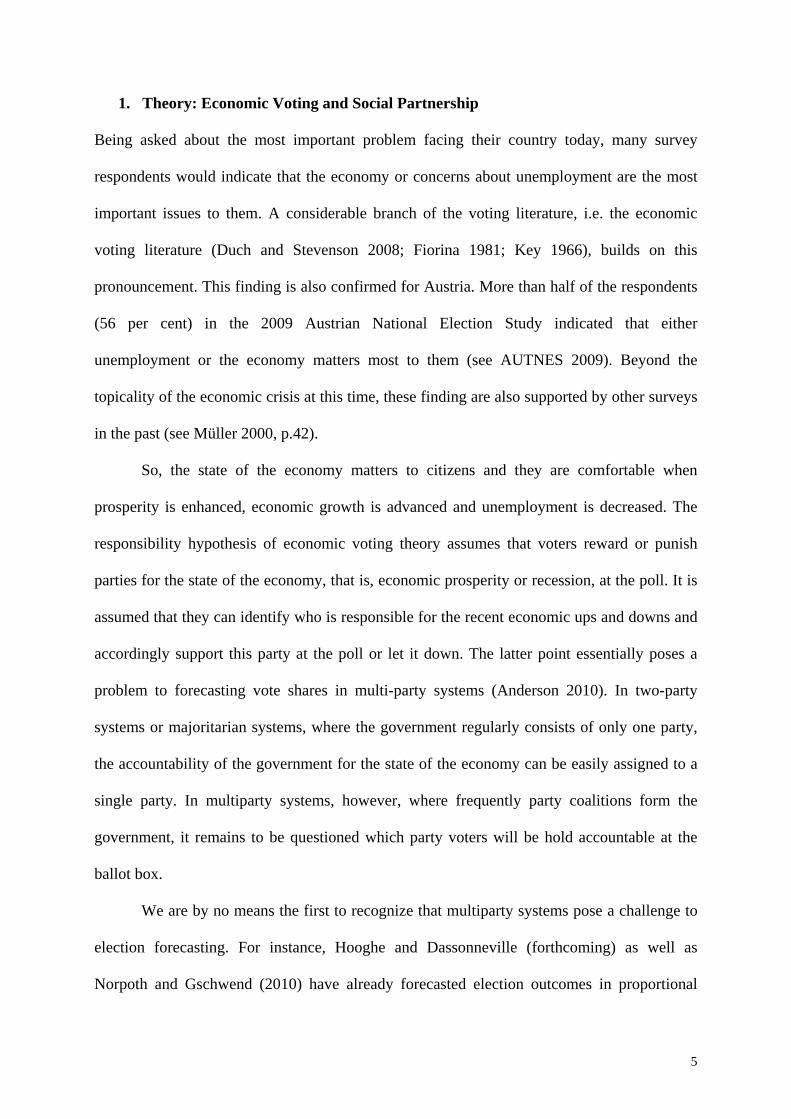
In order to get familiar with the data we provide bivariate scatterplots (Figure 2) for
the main variables in our model for all the election years under consideration. Note that
markers represent the dummy variable on previous incumbency (1 = incumbent, 0 = not
incumbent) of both parties.

14
Figure 2: Scatterplots for independent variables in the model
I I I I I 00 0 0 00
III I
00
I
OEVP
SPOE
020
4060
8010
0
Com
bine
d vo
te s
hare
(%)
1950 1960 1970 1980 1990 2000 2010
Year
I
I I
I I 000
0
00 I
III
00
I
01
23
45
67
8
Une
mpl
oym
ent r
ate
y-1
(%)
1950 1960 1970 1980 1990 2000 2010
Year
IIIII
000 0 00
I
II
I
0
0
I
5060
7080
9010
0
Com
bine
d vo
te s
hare
(%)
0 1 2 3 4 5 6 7 8
Unemployment rate y-1 (%)
In the graph we see several important relationships using bivariate associations: the
combined vote share has decreased since the mid-1970s, though in a curvilinear shape, the
unemployment rate was relatively high in the 1950s and 1960s, very low in the mid-1970s,
and increases again since the 1980s. And most importantly, vote shares are lower at higher
unemployment rates. Finally, there is a certain pattern of lower vote shares given that both
parties were previously the incumbents.
4. Models and Results
It is common practice that a forecasting model should satisfy four main criteria: lead,
parsimony, accuracy, and reproducibility (Lewis-Beck 2005). We will address each of these
points in the following. Since our aim is looking into the future, our forecasting model must
produce good estimates at a considerably large lead time. Thus, we use the average

15
unemployment rate of the year preceding an election.6 Compared to other forecast models,
this is a rather extensive lead time with predictions possible up to one year in advance (see
Lewis-Beck 2005, p.157). In terms of parsimony we try to use as few independent variables
as possible to accurately fit the forecast. The respective data can be found in the appendix to
warrant reproducibility of the model. Finally, the accuracy of a forecast will be discussed in
detail in the following section.
In what follows, we estimate the combined vote share of SPOE and OEVP using our
predictor variables for the elections from 1953 till 2008 (n = 18). We estimate five separate
models, each time using ordinary least squares (OLS) regression. The final model, which we
use for making the forecast, consists of pre-election year unemployment rate (U), joint
incumbency of SPOE+OEVP (I), and an election index variable (E) with each election being
a discrete event in time (where 1953 = 0, the first election in our data set). To cover the
interaction hypothesis mentioned earlier we include an interaction term (U·I) which states that
the effect of the unemployment rate on the parties’ vote share is moderated by their previous
incumbency. Hence, our regression equation reads as follows:
IUEIUV ⋅⋅+⋅+⋅+⋅+= 43210ˆ βββββ (Eq. 1)
We compare the models and check whether the model fit significantly improves when
introducing independent variables using classical fit measures. Table 1 below provides several
indicators for the accuracy of the estimated model. The R2 estimate gives the percentage of
variance accounted for by the predictor variables, whereas the adjusted R2 is corrected for the
sample size and number of predictors, and is thus a more conservative model fit measure.
Since the elections are not a sample in the traditional sense, improvement in prediction (R2) is
regarded as a more suitable indicator of a variable’s explanatory power than standard errors of
6 We checked whether deseasonalized unemployment rates (constant seasonal pattern) would be more appropriate, using different lag times (2 to 6 months before each election). The annual unemployment rate one year before each election, however, produced the most accurate prediction.
16
regression coefficients. The Standard Error of Estimate (SEE) is seen as a good estimate of
the average error in a prediction and is usually used to calculate a confidence interval of the
forecast (see Lewis-Beck 2005, p.153). We also report the mean absolute error (MAE) of
forecast residuals. Lower AIC and BIC values indicate a relative better model fit of the data.
Finally, the Durbin-Watson (D-W) statistic informs about issues of autocorrelation in time
series data.
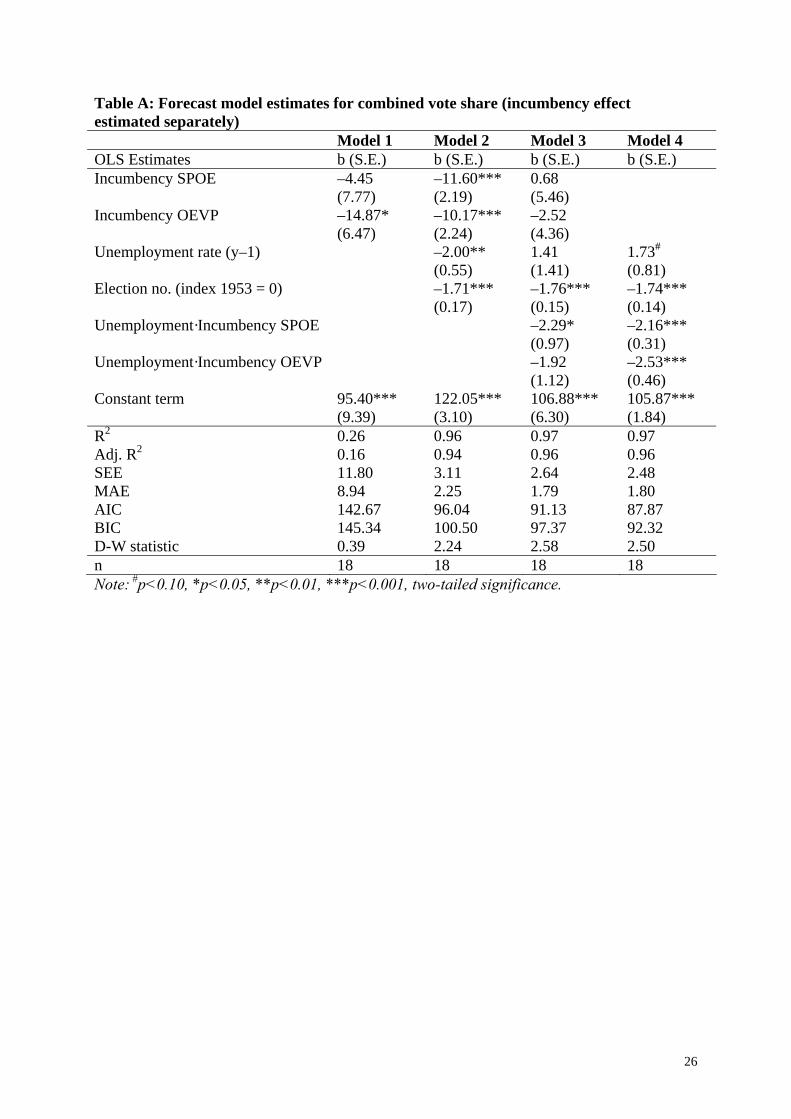
First, we ran a regression to test our model with regards to party-specific effects (see
Table A in the Appendix). Overall, the results tell us that the model works well to predict the
combined vote share of both parties, also if we examine SPOE and OEVP incumbency and its
interaction with unemployment separately. We establish that the total vote share is
particularly diminished whenever both parties were incumbent. However, we expect an
interaction effects to be at work. Note that in interaction models the main effects of one
variable (x1) can be read as the average effect if the other main variable (x2) was zero (for a
discussion, see Brambor et al. 2006). To prevent inefficiency (variance inflation) due to
collinearity we omit the main effect of incumbency in the interaction model (β2=0) as there is
strong theoretical reason and empirical support to believe that there is no effect when
unemployment approaches zero. We show that the unemployment effect reaches its maximum
if both parties were incumbent (sum of interaction effects). At the same time, if only one of
the two parties was in power, unemployment has hardly any effect on the combined vote
share as all effects basically balance out (main effect plus one interaction effect). Since the
interaction effects of incumbency are statistically indistinguishable, we proceed with the
intended and more parsimonious model using the shared incumbency.7
Next, we start out by estimating separate regression analyses for our full model, i.e.
the combined vote share, to also examine bivariate results (see Table 1). We see that
7 Note: Using the model including party-specific incumbency basically gives the same forecast results.
17
unemployment (Model 1), incumbency (Model 2), and the election index, i.e. going from one
election to the next, (Model 3) all have a negative effect on the combined vote share of the
SPOE and OEVP, though not controlling for other factors. In particular, more than half of the
variance is accounted for either by unemployment or a hypothesized linear trend in
dealignment. The effects of unemployment, incumbency, and the election index also remain
important after controlling for each other (Model 4). That is, higher unemployment rates
(around –2 per cent), having formed a grand coalition (around –11 per cent) in the previous
election as well as a loss in the baseline vote share in each consecutive election (around –2 per
cent) will harm the two parties. As mentioned in previous sections, we expect that the effect
of unemployment would weigh more heavily if SPOE and OEVP were the incumbent parties
(Model 5). A variable representing this interaction adds further explanatory power and
confirms that unemployment rates will especially harm the parties when governing a
coalition. Again, in this model we see that incumbency has no effect if unemployment
approaches zero. Still, we find some indication that higher unemployment rates would even
have a minor negative effect on the vote share of the SPOE and the OEVP if not both of them
were incumbent. We omit the main effect of incumbency (β2=0) in our final model to be used
for an accurate forecast (see Final Model) also due to theoretical reasons. In doing so, we get
more efficient estimates (we reduce collinearity due to the interaction terms) and a better
model fit.8 The final model performs very well according to all the fit and accuracy measures,
showing that high unemployment rates in combination with being incumbent (interaction
term) and continuous decline in partisan support will derogate the vote share of the two
mainstream parties SPOE and OEVP.
8 Note: We stick to omitting the constitutive term of incumbency as the regression coefficient estimates and forest results hardly change. Again, model fit measures support the usefulness of this final model for making the forecast.
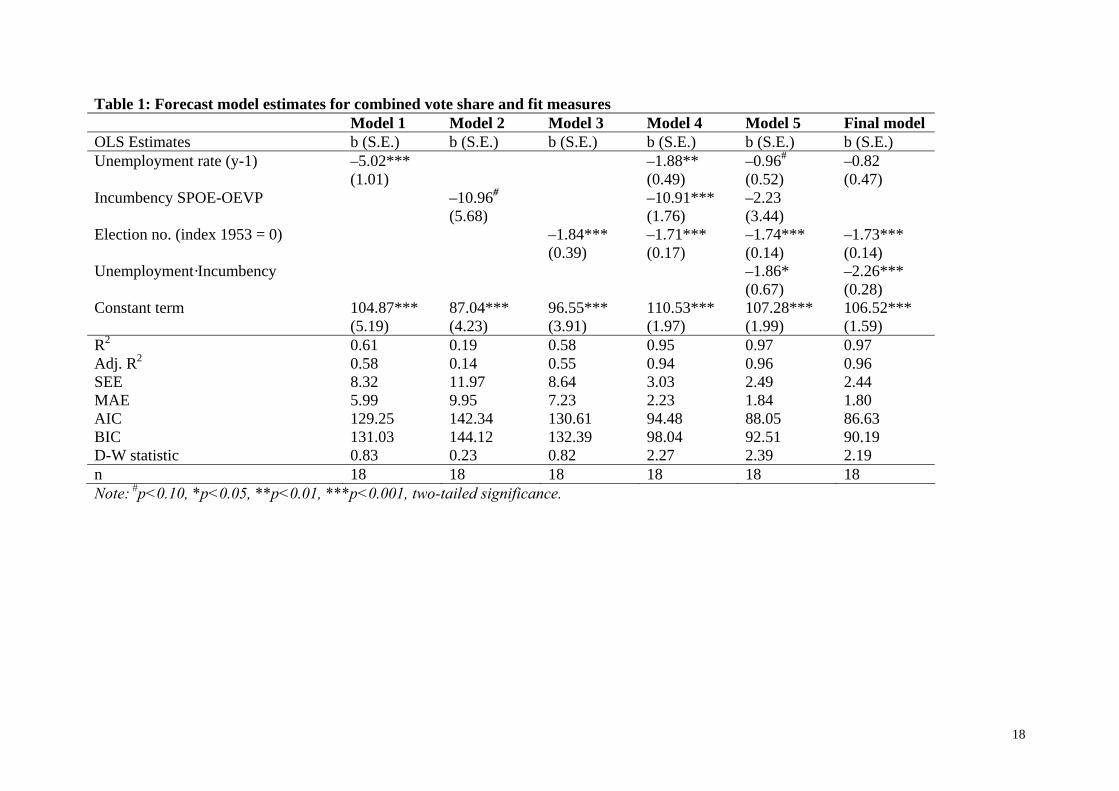
18
Table 1: Forecast model estimates for combined vote share and fit measures Model 1 Model 2 Model 3 Model 4 Model 5 Final model OLS Estimates b (S.E.) b (S.E.) b (S.E.) b (S.E.) b (S.E.) b (S.E.) Unemployment rate (y-1) –5.02***
(1.01) –1.88**
(0.49) –0.96# (0.52)
–0.82 (0.47)
Incumbency SPOE-OEVP –10.96# (5.68)
–10.91*** (1.76)
–2.23 (3.44)
Election no. (index 1953 = 0) –1.84*** (0.39)
–1.71*** (0.17)
–1.74*** (0.14)
–1.73*** (0.14)
Unemployment·Incumbency –1.86* (0.67)
–2.26*** (0.28)
Constant term 104.87*** (5.19)
87.04*** (4.23)
96.55*** (3.91)
110.53*** (1.97)
107.28*** (1.99)
106.52*** (1.59)
R2 0.61 0.19 0.58 0.95 0.97 0.97 Adj. R2 0.58 0.14 0.55 0.94 0.96 0.96 SEE 8.32 11.97 8.64 3.03 2.49 2.44 MAE 5.99 9.95 7.23 2.23 1.84 1.80 AIC 129.25 142.34 130.61 94.48 88.05 86.63 BIC 131.03 144.12 132.39 98.04 92.51 90.19 D-W statistic 0.83 0.23 0.82 2.27 2.39 2.19 n 18 18 18 18 18 18 Note: #p<0.10, *p<0.05, **p<0.01, ***p<0.001, two-tailed significance.
19
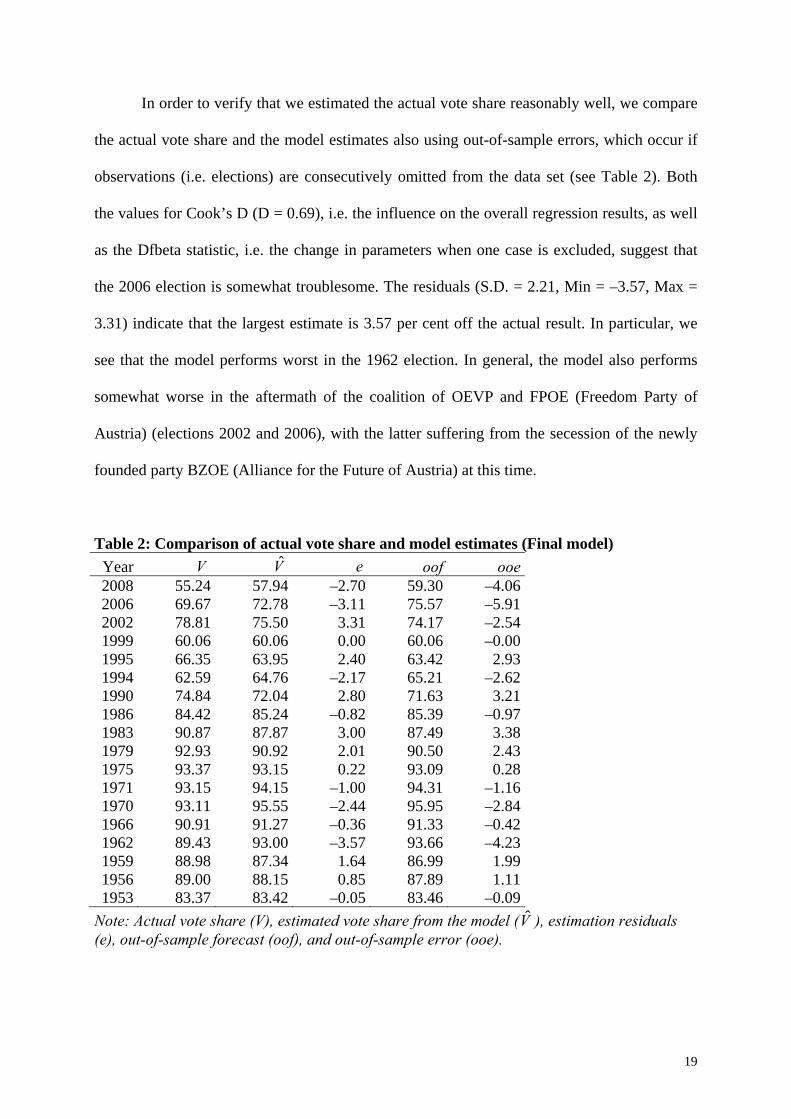
In order to verify that we estimated the actual vote share reasonably well, we compare
the actual vote share and the model estimates also using out-of-sample errors, which occur if
observations (i.e. elections) are consecutively omitted from the data set (see Table 2). Both
the values for Cook’s D (D = 0.69), i.e. the influence on the overall regression results, as well
as the Dfbeta statistic, i.e. the change in parameters when one case is excluded, suggest that
the 2006 election is somewhat troublesome. The residuals (S.D. = 2.21, Min = –3.57, Max =
3.31) indicate that the largest estimate is 3.57 per cent off the actual result. In particular, we
see that the model performs worst in the 1962 election. In general, the model also performs
somewhat worse in the aftermath of the coalition of OEVP and FPOE (Freedom Party of
Austria) (elections 2002 and 2006), with the latter suffering from the secession of the newly
founded party BZOE (Alliance for the Future of Austria) at this time.
Table 2: Comparison of actual vote share and model estimates (Final model) Year V V̂ e oof ooe2008 55.24 57.94 –2.70 59.30 –4.062006 69.67 72.78 –3.11 75.57 –5.912002 78.81 75.50 3.31 74.17 –2.541999 60.06 60.06 0.00 60.06 –0.001995 66.35 63.95 2.40 63.42 2.931994 62.59 64.76 –2.17 65.21 –2.621990 74.84 72.04 2.80 71.63 3.211986 84.42 85.24 –0.82 85.39 –0.971983 90.87 87.87 3.00 87.49 3.381979 92.93 90.92 2.01 90.50 2.431975 93.37 93.15 0.22 93.09 0.281971 93.15 94.15 –1.00 94.31 –1.161970 93.11 95.55 –2.44 95.95 –2.841966 90.91 91.27 –0.36 91.33 –0.421962 89.43 93.00 –3.57 93.66 –4.231959 88.98 87.34 1.64 86.99 1.991956 89.00 88.15 0.85 87.89 1.111953 83.37 83.42 –0.05 83.46 –0.09
Note: Actual vote share (V), estimated vote share from the model (V̂ ), estimation residuals (e), out-of-sample forecast (oof), and out-of-sample error (ooe).

20
5. Making the Forecast
We move on to making a forecast for the 2013 election (the 18th election according to the time
index variable), using current labor market data. The annual average unemployment rate for
the year 2012 was 7.0 per cent (source: OeNB). Drawing upon this scenario and including
current incumbency of the two parties, we substitute the values in our regression equation
(Eq. 1) as follows:
.74351726.21873.10782.0 106.52ˆ =⋅⋅−⋅−+⋅−=V (Eq. 2)
According to the final model, the two parties will gain about 54 per cent of the popular
vote share in the coming election. This is somewhat higher than current polls (since beginning
of the year 2013) suggest (Figure 3), which predict the combined vote share to be around the
50 per cent mark.
Figure 3: Forecasts of vote shares according to polls
4042
.545
47.5
5052
.555
57.5
60
Est
imat
ed v
ote
shar
e fro
m p
olls
(%)
0 10 20 30
Calender week (Year 2013)
Source: Data from polling institutes Gallup, Karmasin, Market, Hajek, IMAS, Oekonsult, Spectra, and meinungsraum.at (n = 45, M = 51.38, S.D. = 2.03, Min = 44, Max = 57) [last entry: 26 July 2013].
21
We also provide estimates of the uncertainty of our prediction. First, we provide a 95
per cent confidence interval (CI) which is computed from the SEE times the t-value at given
degrees of freedom:
43.2145.2ˆˆ14 ⋅=⋅= = mm VtSEEVCI df (Eq. 3)
According to this calculation, the interval gives 95 per cent confidence that the two
parties would range between 49 and 59 per cent in the next election.
Second, we use simulations to describe the results of our statistical model. As pointed
out by King et al. (2000) the estimates of the regression parameters are not perfectly certain
but show fluctuations and stochastic uncertainty. We can, however, calculate forecasts using
the point estimates and the variance-covariance matrix of the estimates in our model. King et
al. (2000) show how this can be computed.9 The main difference in the simulation model is
that it uses exact values for each independent variable (see Eq. 2) rather than a general
uncertainty measure, such as the SEE. We use 1,000 simulations to compute the expected
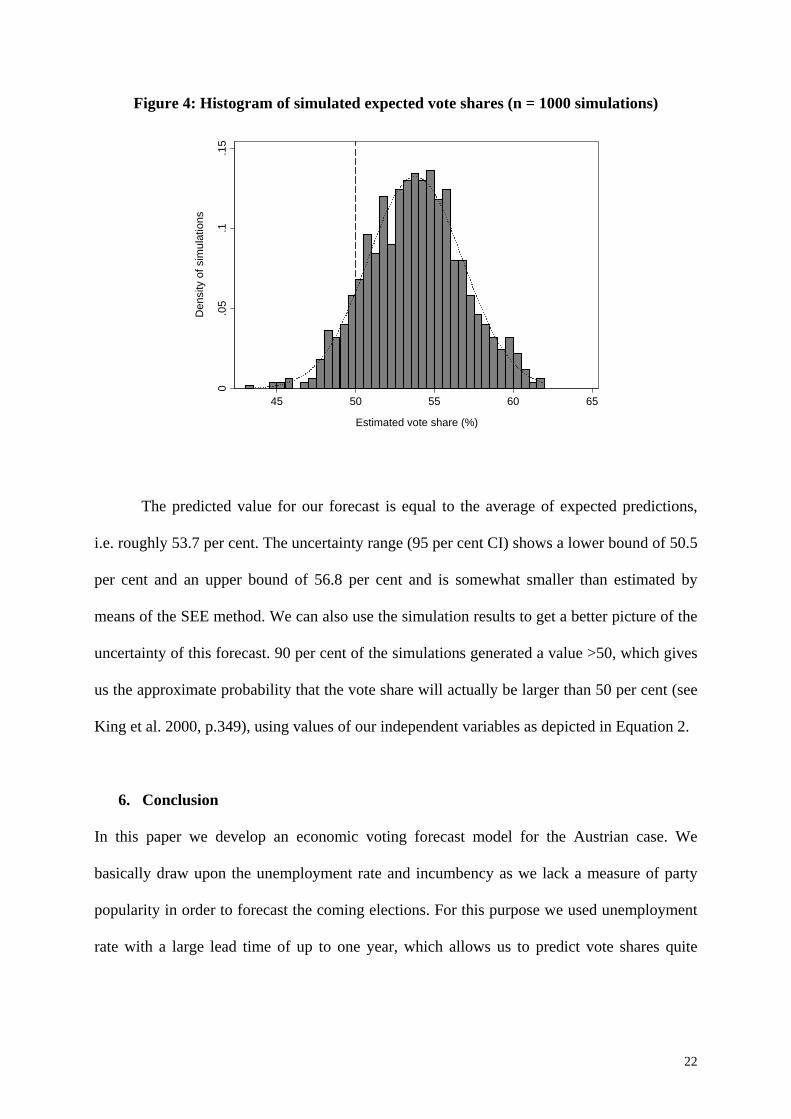
values that incorporate these uncertainty components. Figure 4 shows the density
(distribution) of these expected values.
9 Note: We use the STATA package ‘clarify’ by King et al. (2000) to calculate our predictions.
22
Figure 4: Histogram of simulated expected vote shares (n = 1000 simulations)
0.0
5.1
.15
Den
sity
of s
imul
atio
ns
45 50 55 60 65
Estimated vote share (%)
The predicted value for our forecast is equal to the average of expected predictions,
i.e. roughly 53.7 per cent. The uncertainty range (95 per cent CI) shows a lower bound of 50.5
per cent and an upper bound of 56.8 per cent and is somewhat smaller than estimated by
means of the SEE method. We can also use the simulation results to get a better picture of the
uncertainty of this forecast. 90 per cent of the simulations generated a value >50, which gives
us the approximate probability that the vote share will actually be larger than 50 per cent (see
King et al. 2000, p.349), using values of our independent variables as depicted in Equation 2.
6. Conclusion
In this paper we develop an economic voting forecast model for the Austrian case. We
basically draw upon the unemployment rate and incumbency as we lack a measure of party
popularity in order to forecast the coming elections. For this purpose we used unemployment
rate with a large lead time of up to one year, which allows us to predict vote shares quite
23
accurately. Still, this is a quite extensive lead time and future research might investigate the
impact of time in economic developments on economic voting in more depth.
Further, we overcome the challenges usually connected with multiparty forecasts by
predicting the joint vote share of the grand coalition parties SPOE and OEVP. We argue that,
at the polls, those parties will be held accountable for economic ups and downs as they are the
political representation of the Social Partnership. That is, we maintain that when the economy
prospers, voters will be satisfied with the performance of the corporatist organizations and
reward the two mainstream parties. This effect is apparently stronger if the parties were
incumbent in the previous term but is to a very small degree also traceable if they were not.
According to our forecast, the next election will be very close, with the combined vote
share of the mainstream parties SPOE and OEVP only 3.7 points above the 50 percent mark.
We are also highly confident that they cannot reach a two third majority which would enable
them to pass laws of constitutional status. At the same time we have to emphasize that a 50
percent majority does not necessarily mean that the two parties indeed will or can form a
governmental coalition. This, of course, also depends on their political will and the translation
of vote shares into seats in parliament, which in turn will be affected by the vote share of the
smaller parties that do or do not reach the necessary threshold to be represented in Parliament.
Finally, we discuss some limitations. As is obvious, the model uses a very rough
measure of ‘natural’ decline in party support of the two mainstream parties since the 1950s. A
more exact measure of the actual party support would be desirable in order to cope with future
changes in the pattern of partisan dealignment. Further, our model depends on the assumption
that the Social Partnership is perceived as a decisive actor in socioeconomic policy-making by
the public and that the SPOE and OEVP are jointly held responsible at the poll for the success
or failure of ‘policy accordation’. This conjecture does not go unchallenged (see Karlhofer
and Tálos 2005) and our model might lose in predictive power as the Social Partnership loses
24
in political power. Notwithstanding this, we have shown that lagged unemployment rates
perform very well in explaining the past elections since 1953. Thus, both mainstream parties
make ground on low unemployment rates and thus depend on each other.
25
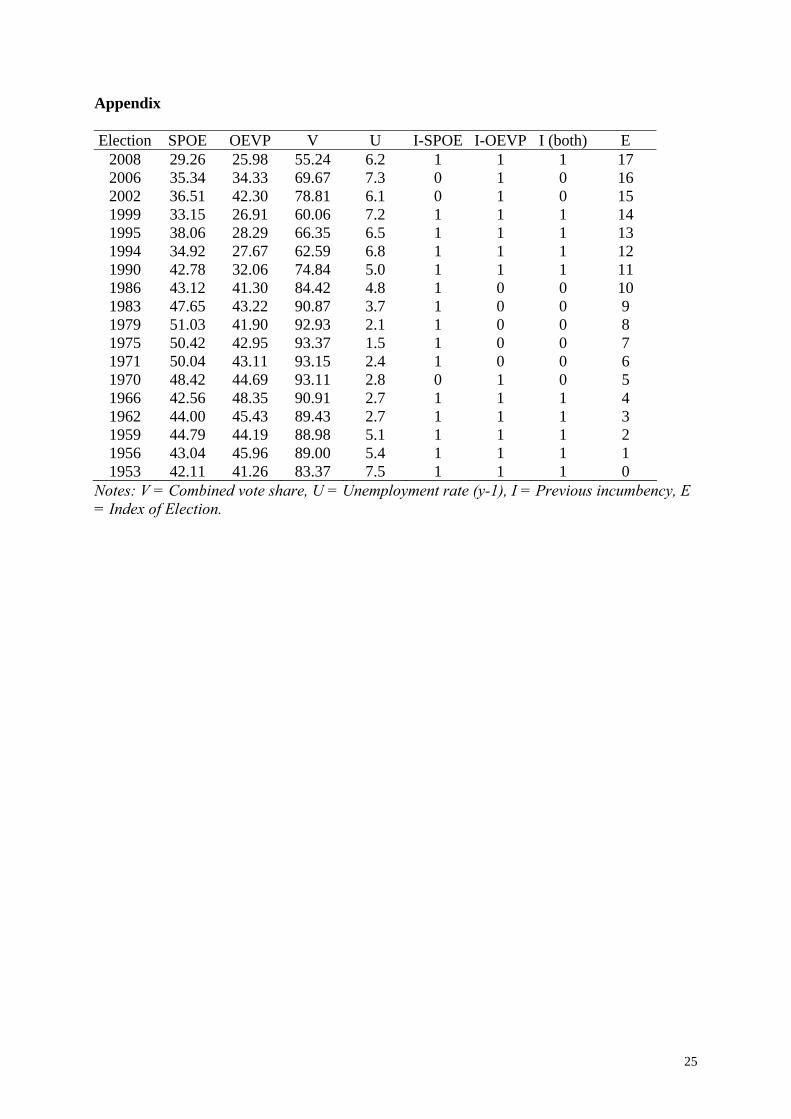
Appendix
Election SPOE OEVP V U I-SPOE I-OEVP I (both) E 2008 29.26 25.98 55.24 6.2 1 1 1 17 2006 35.34 34.33 69.67 7.3 0 1 0 16 2002 36.51 42.30 78.81 6.1 0 1 0 15 1999 33.15 26.91 60.06 7.2 1 1 1 14 1995 38.06 28.29 66.35 6.5 1 1 1 13 1994 34.92 27.67 62.59 6.8 1 1 1 12 1990 42.78 32.06 74.84 5.0 1 1 1 11 1986 43.12 41.30 84.42 4.8 1 0 0 10 1983 47.65 43.22 90.87 3.7 1 0 0 9 1979 51.03 41.90 92.93 2.1 1 0 0 8 1975 50.42 42.95 93.37 1.5 1 0 0 7 1971 50.04 43.11 93.15 2.4 1 0 0 6 1970 48.42 44.69 93.11 2.8 0 1 0 5 1966 42.56 48.35 90.91 2.7 1 1 1 4 1962 44.00 45.43 89.43 2.7 1 1 1 3 1959 44.79 44.19 88.98 5.1 1 1 1 2 1956 43.04 45.96 89.00 5.4 1 1 1 1 1953 42.11 41.26 83.37 7.5 1 1 1 0
Notes: V = Combined vote share, U = Unemployment rate (y-1), I = Previous incumbency, E = Index of Election.
26
Table A: Forecast model estimates for combined vote share (incumbency effect estimated separately) Model 1 Model 2 Model 3 Model 4 OLS Estimates b (S.E.) b (S.E.) b (S.E.) b (S.E.) Incumbency SPOE –4.45 –11.60*** 0.68 (7.77) (2.19) (5.46) Incumbency OEVP –14.87* –10.17*** –2.52 (6.47) (2.24) (4.36) Unemployment rate (y–1) –2.00** 1.41 1.73# (0.55) (1.41) (0.81) Election no. (index 1953 = 0) –1.71*** –1.76*** –1.74*** (0.17) (0.15) (0.14) Unemployment·Incumbency SPOE –2.29* –2.16*** (0.97) (0.31) Unemployment·Incumbency OEVP –1.92 –2.53*** (1.12) (0.46) Constant term 95.40*** 122.05*** 106.88*** 105.87*** (9.39) (3.10) (6.30) (1.84) R2 0.26 0.96 0.97 0.97 Adj. R2 0.16 0.94 0.96 0.96 SEE 11.80 3.11 2.64 2.48 MAE 8.94 2.25 1.79 1.80 AIC 142.67 96.04 91.13 87.87 BIC 145.34 100.50 97.37 92.32 D-W statistic 0.39 2.24 2.58 2.50 n 18 18 18 18 Note: #p<0.10, *p<0.05, **p<0.01, ***p<0.001, two-tailed significance.

27
References
Anderson, C. J. (2010). Economic voting and political context: a comparative perspective.
Electoral Studies, 19, 151–170.
Arzheimer, K., & Evans, J. (2010). Bread and butter à la francaise: multiparty forecasts of the
French legislative vote (1981-2007). International Journal of Forecasting, 26, 19–31.
AUTNES (2009). AUTNES Post-Post Election Survey 2009, August 2011. Available at:
http://www.autnes.at.
Bellucci, P. (2010). Election cycles and electoral forecasting in Italy, 1994–2008.
International Journal of Forecasting, 26, 54–67.
Brambor, T., Clark, W. R., & Golder, M. (2006). Understanding interaction models:
improving empirical analyses. Political Analysis, 14, 63–82.
Campbell, A., Converse, P. E., Miller, W. E., & Stokes, D. E. (1960). The American voter.
New York: Wiley.
Campbell, J. E. (2012). Forecasting the 2012 American national elections: editor’s
introduction. PS: Political Science & Politics, 45, 610–613.
Crepaz, M. (1994). From semisovereignty to sovereignty: the decline of corporatism and rise
of parliament in Austria. Comparative Politics, 27, 45–65.
Dalton, R. J., & Wattenberg, M. P. (Eds.) (2000). Parties without partisans: political change
in advanced industrial democracies. Oxford: Oxford Univ. Press.
Duch, R. M., & Stevenson, R. T. (2008). The economic vote: how political and economic
institutions condition election results. New York: Cambridge University Press.
Ennser-Jedenastik, L. (forthcoming). The Politics of Patronage and Coalition: How Parties
Allocate Managerial Positions in State-Owned Enterprises. Political Studies.
DOI: 10.1111/1467-9248.12031

28
Evans, J., & Ivaldi, G. (2010). Comparing forecasts of radical right voting in four European
countries. International Journal of Forecasting, 26, 82–97.
Fair, R. C. (1988). The effect of economic events on votes for president: 1984 update.
Political Behavior, 10, 168–179.
Filzmaier, P., Beyrl, M., Hauser, F., & Huber, J. (2003). Wahlbörsen als interdisziplinäres
Instrument der Sozialforschung: Erfahrungen aus Wahlen in Österreich. SWS
Rundschau, 43, 387–410.
Fiorina, M. P. (1981). Retrospective voting in American national elections. New Haven: Yale
Univ. Press.
Foucault, M., & Nadeau, R. (2012). Forecasting the 2012 French presidential election. PS:
Political Science & Politics, 45, 218–222.
Gerlich, P., Grande, E., & Müller, W. C. (1988). Corporatism in Crisis: Stability and Change
of Social Partnership in Austria. Political Studies, 36, 209–223.
Heinisch, R. (2000). Coping with economic integration: corporatist strategies in Germany and
Austria in the 1990s. West European Politics, 23, 67–96.
Hofinger, C., & Ogris, G. (2002). Orakel der Neuzeit: Was leisten Wahlbörsen,
Wählerstromanalysen und Wahltagshochrechnungen? Österreichische Zeitschrift für
Politikwissenschaft, 31, 143–158.
Hooghe, M., & Dassonneville, R. (forthcoming). Party members as an electoral linking
mechanism: an election forecasting model for political parties in Belgium, 1981–2010.
Party Politics, DOI: 10.1177/1354068811436053.
Iyengar, S., & Simon, A. F. (2000). New perspectives and evidence on political
communication and campaign effects. Annual Review of Psychology, 51, 149–69.
Karlhofer, F., & Tálos, E. (Eds.) (2005). Sozialpartnerschaft: Österreichische und
europäische Perspektiven. Wien: Lit-Verlag.
29
Key, V. O. (1966). The responsible electorate: rationality in presidential voting, 1936-1960.
Cambridge: Harvard Univ. Press.
King, G., Tomz, M., & Wittenberg, J. (2000). Making the most of statistical analyses:
improving interpretation and presentation. American Journal of Political Science, 44,
347–361.
Kittel, B. (2000). Deaustrification? The Policy Area Specific Evolution of Austrian Social
Partnership. West European Politics, 23, 108–129.
Lebo, M., & Norpoth, H. (2011). Yes, Prime Minister: the key to forecasting British elections.
Electoral Studies, 30, 258–263.
Lewis, J. (2002). Austria in Historical Perspective: From Civil War to Social Partnership. In:
S. Berger & H. Compston (Eds.), Policy concertation and social partnership in Western
Europe. New York: Berghahn Books, pp. 19–34.
Lewis-Beck, M. (2005). Election forecasting: principles and practice. The British Journal of
Politics & International Relations, 7, 145–164.
Lewis-Beck, M., & Paldam, M. (2000). Economic voting: an introduction. Electoral Studies,
19, 113–121.
Lewis-Beck, M., & Tien, C. (2005). The Jobs Model forecast: well done in 2004. PS:
Political Science & Politics, 38, 27–28.
Lewis-Beck, M., & Tien, C. (2008). The job of President and the Jobs Model forecast: Obama
for ’08? PS: Political Science & Politics, 41, 687–690.
Lewis-Beck, M., Nadeau, R., & Bélanger, E. (2004). General election forecasts in the United
Kingdom: a political economy model. Electoral Studies, 23, 279–290.
Magalhães, P. C., & Aguiar-Conraria, L. (2009). Growth, centrism, and semi-presidentialism:
forecasting the Portuguese general elections. Electoral Studies, 28, 314–321.

30
Marterbauer, M. (2005). Veränderte Rahmenbedingungen und Präferenzen in der
Wirtschaftspolitik. In: F. Karlhofer & E. Tálos (Eds.), Sozialpartnerschaft.
Österreichische und Europäische Perspektiven. Wien: Lit Verlag, pp. 57–78.
Müller, W. C. (2000). Wahlen und die Dynamik des österreichischen Parteiensystems seit
1986. In: F. Plasser, P. A. Ulram & F. Sommer (Eds.), Das österreichische
Wahlverhalten. Wien: Signum, pp. 13–54.
Müller, W. C., Plasser, F., Ulram, P. A. (1999). Schwäche als Vorteil, Stärke als Nachteil. Die
Reaktion der Parteien auf den Rückgang der Wählerbindungen in Österreich. In: P.
Maier, W. C. Müller & F. Plasser (Eds.), Parteien auf komplexen Wählermärkten.
Wien: Signum, pp. 201–245.
Plasser, F., Ulram, P. A., Seeber, G. (2007). Was Wähler(innen) bewegt: Parteien-, Themen-
und Kandidatenorientierungen 2006. In: P. Maier, F. Plasser & P. A. Ulram (Eds.),
Wechselwahlen. Wien: Facultas.WUV, pp. 155–194.
Neck, R., & Karbuz, S. (1997). Econometric estimations of popularity functions: a case study
for Austria. Public Choice, 91, 57–88.
Norpoth, H. (1991). The popularity of the Thatcher government: a matter of war and
economy. In: H. Norpoth, D. Lafay & M. Lewis-Beck (Eds.), Economics and politics:
the calculus of support. Ann Arbor: Univ. of Michigan Press, pp. 141–160.
Norpoth, H. (2004). From primary to general election: a forecast of the presidential vote. PS:
Political Science & Politics, 37, 737–740.
Norpoth, H., & Gschwend, T. (2010). The chancellor model: forecasting German elections.
International Journal of Forecasting, 26, 42–53.
Sanders, D. (2005). Popularity functions forecasts for the 2005 UK general election. British
Journal of Politics and International Relations, 7, 174–190.

31
Stegmaier M., & Lewis-Beck, M. (2009). Learning the economic vote: Hungarian forecasts,
1998-2010. Politics & Policy, 37, 769–780.
Tálos, E. (2005). Vom Vorzeige- zum Auslaufmodell: Österreichs Sozialpartnerschaft 1945
bis 2005. In: F. Karlhofer & E. Tálos (Eds.), Sozialpartnerschaft: Österreichische und
europäische Perspektiven. Wien: Lit-Verlag, pp. 185–216.
Tálos, E., & Kittel, B. (2002). Austria in the 1990s: the routine of social partnership in
question? In: S. Berger & H. Compston (Eds.), Policy concertation and social
partnership in Western Europe: lessons for the 21st century. New York: Berghahn
Books, pp. 35–50.