forecast of on-road electric transportation in the u.s. (2010-2035)
TRANSCRIPT

FORECAST OF ON-ROAD ELECTRIC TRANSPORTATION IN THE U.S. (2010 - 2035)
IEE Whitepaper April 2013

Forecast of On-Road Electric Transportation in the U.S.
(2010–2035)
IEE Whitepaper
April 2013
Prepared by
Adam Cooper
Lisa Wood
IEE
Ingrid Rohmund
David Costenaro
Anthony Duer
EnerNOC Utility Solutions Consulting


TABLE OF CONTENTS
EXECUTIVE SUMMARY .......................................................................................................... 1
INTRODUCTION......................................................................................................................... 4
LIGHT DUTY VEHICLE SCENARIOS ................................................................................... 8
LIGHT DUTY VEHICLE SCENARIO RESULTS .................................................................. 9
TRANSPORTATION SCENARIO RESULTS ....................................................................... 12
SUMMARY ................................................................................................................................. 18
APPENDIXES ............................................................................................................................. 20
APPENDIX A TRANSPORTATION SECTOR ANALYSIS APPROACH ......................... 21
APPENDIX B CO2 EMISSIONS REDUCTION ESTIMATES: APPROACH AND
ASSUMPTIONS .......................................................................................................................... 22
ELECTRIC LIGHT DUTY VEHICLE SCENARIOS (6 SCENARIOS): ................................................... 22
CO2 EMISSION REDUCTION SCENARIOS (4 SCENARIOS) ............................................................. 22 CO2 EQUIVALENT REDUCTION ESTIMATES: ............................................................................... 23
APPENDIX C REFERENCES .................................................................................................. 26

1
EXECUTIVE SUMMARY
In 2010, the transportation sector comprised 29 percent of total national energy consumption in
the U.S., making it the second largest consumer of energy, behind only the industrial sector.
Within transportation, the 225 million light duty vehicles (LDVs) in the U.S. (i.e., cars and light
trucks) today consume almost 60% of energy in the transportation sector.1 This is expected to
grow to as many as 276 million LDVs by 2035. Fossil fuels currently make up about 99 percent
of the fuel in transportation and 31 percent of U.S. greenhouse gas emissions can be tied to the
burning of fossil fuels in the transportation sector.2 Electrification of transportation makes sense
from both an economic and environmental perspective and is beginning to gain traction in a
variety of applications. This report provides a forecast of electricity use in transportation from
2010 to 2035 based on the progressive adoption of electric vehicles, primarily electric light duty
and commercial vehicles.
Various policy, technology, and economic drivers as well as consumer demand will determine
the ultimate levels of electric vehicle adoption, including: advances in battery technology, oil
prices, and government mandates on fuel economy (e.g., CAFE standards). And, in turn, electric
vehicle adoption will impact greenhouse gas emissions. For illustrative purposes, IEE developed
low, medium, and high electric transportation scenarios. These scenarios provide projections
based on EIA’s Annual Energy Outlook (AEO) 2012 Reference Case, advances in battery
technology (e.g., improved battery chemistry that allows for faster and deeper charging and
reductions in battery cell and other component costs), and oil prices increasing to $200 per
barrel:
Under the low electric transportation scenario, based on the AEO 2012 Reference Case,
electric light duty vehicles (LDV) comprise 2 percent of the registered vehicle stock (5.3
million out of 276 million light duty vehicles), and electricity consumption increases by 33
TWh in 2035. The switch to electric LDVs reduces vehicle emissions by about 9 to 22
million metric tons of CO2 equivalent in the year 2035 based on a 2035 power generation
mix. The specific reduction depends on improvements in internal combustion engine (ICE)
technologies, as well as changes in the electric power generation fuel mix.3
1 DOE, Annual Energy Outlook 2012
2 EPA, Inventory of U.S. Greenhouse Gas Emissions and Sinks: 1990-2011. April 2013
3 Emission reduction estimates are based on data from DOE’s Alternative Fuels Data Center, EIA’s Annual
Energy Outlook 2012, improvements to ICE vehicle fuel economy, and the PHEV and AEV share of vehicle

2
Under the medium electric transportation scenario, based on advances in battery technology,
electric LDVs comprise 10 percent of the registered vehicle stock (24.8 million out of 261
million light duty vehicles), and electricity consumption increases by 112 TWh in 2035. The
switch to electric LDVs reduces vehicle emissions by about 41 to 94 million metric tons of
CO2 equivalent in the year 2035 based on a 2035 power generation mix. The specific
reduction depends on improvements in ICE technologies, as well as changes in the electric
power generation fuel mix.
Under the high electric transportation scenario, based on the advances in battery technology
and high oil prices ($200/barrel in 2035), electric LDVs comprise 12 percent of the registered
vehicle stock (30.4 million out of 256 million light duty vehicles), and electricity
consumption increases by 147 TWh in 2035. The switch to electric LDVs reduces vehicle
emissions by about 51 to 116 million metric tons of CO2 equivalent in the year 2035 based
on a 2035 power generation mix. The specific reduction depends on improvements in ICE
technologies, as well as changes in the electric power generation fuel mix.
Table 1 shows the stock of registered electric LDVs in the low, medium, and high scenarios. As
demonstrated in Table 1, advances in battery technology alone will have a major impact on
electric vehicle adoption resulting in almost 25 million EVs by 2035. Combining advanced
battery technology with high oil prices will spur the adoption of EVs even more resulting in
more than 30 million EVs by 2035.
Table 1: Light Duty Electric Vehicle Stock: Forecast by Scenario (thousands)
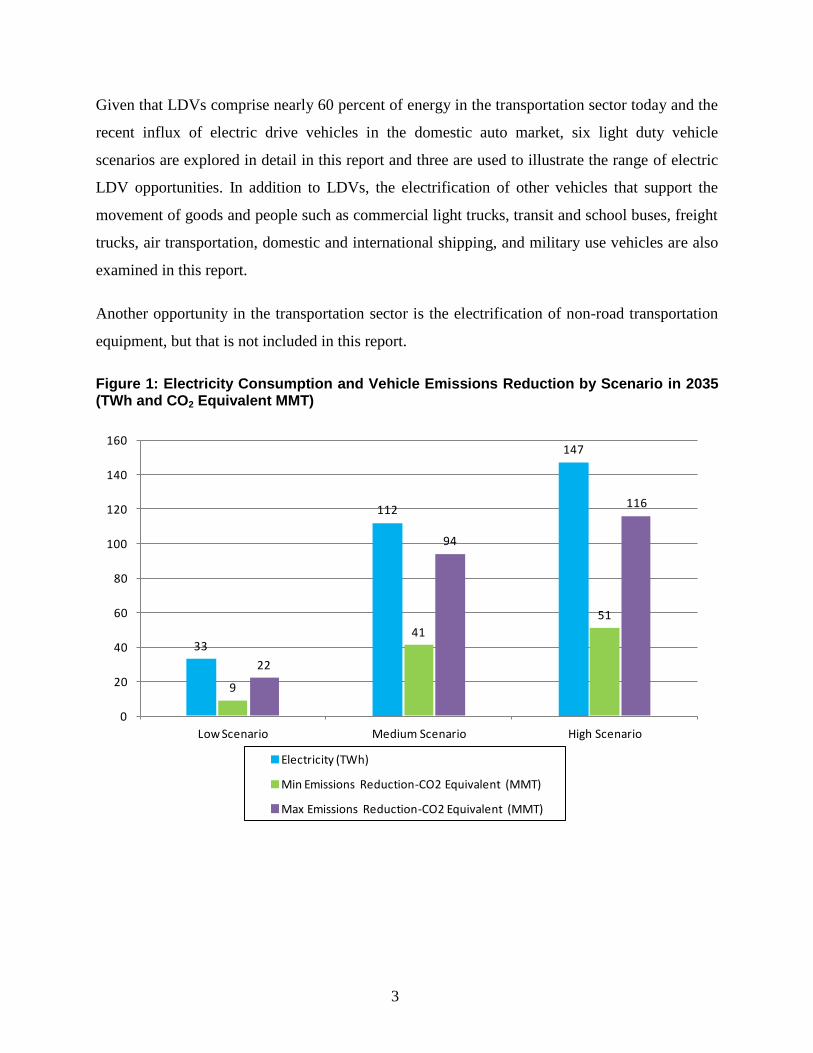
Figure 1 shows the results of the low (33 TWh), medium (112 TWh), and high (147 TWh)
electric transportation scenarios in terms of electricity usage and carbon reduction. Under the
medium scenario, based on advances in battery technology, if EVs comprise 10% of the
registered vehicle stock in 2035, this would result in a reduction of 41 to 94 million metric tons
of CO2 equivalent depending on the improvements to ICE technologies and the carbon intensity
of the 2035 power generation mix.
stock in each scenario. See Appendix B for details on alternative ICE efficiency and power sector mix
scenarios. http://www.afdc.energy.gov/vehicles/electric_emissions.php
Light Duty Electric Vehicle Stock by Scenario 2010 2015 2020 2025 2030 2035
Low Scenario: AEO 2012 Reference Case 20 230 900 1,960 3,430 5,330
Medium Scenario: Advanced Battery 20 839 3,711 8,079 15,560 24,800
High Scenario: Advanced Battery & High Oil
($200/barrel in 2035) 20 1,117 5,354 11,069 19,295 30,400
3
Given that LDVs comprise nearly 60 percent of energy in the transportation sector today and the
recent influx of electric drive vehicles in the domestic auto market, six light duty vehicle
scenarios are explored in detail in this report and three are used to illustrate the range of electric
LDV opportunities. In addition to LDVs, the electrification of other vehicles that support the
movement of goods and people such as commercial light trucks, transit and school buses, freight
trucks, air transportation, domestic and international shipping, and military use vehicles are also
examined in this report.
Another opportunity in the transportation sector is the electrification of non-road transportation
equipment, but that is not included in this report.
Figure 1: Electricity Consumption and Vehicle Emissions Reduction by Scenario in 2035 (TWh and CO2 Equivalent MMT)
33
112
147
9
41
51
22
94
116
0
20
40
60
80
100
120
140
160
Low Scenario Medium Scenario High Scenario
Electricity (TWh)
Min Emissions Reduction-CO2 Equivalent (MMT)
Max Emissions Reduction-CO2 Equivalent (MMT)

4
INTRODUCTION
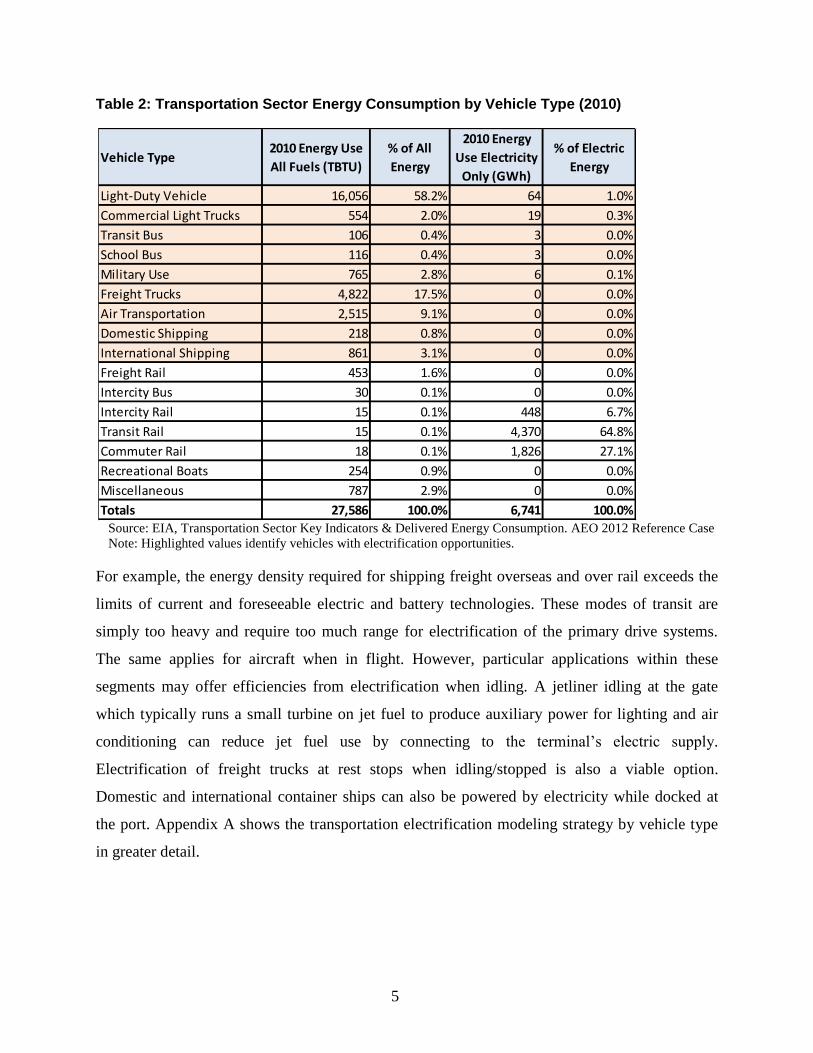
This analysis is based on AEO 2012’s Transportation Sector Reference Case for all fuels. Table
2 shows total energy use and electric energy use in 2010 for each of the vehicle classes identified
in the AEO. Light-duty vehicles (LDV)—consisting of automobiles, light trucks, and
motorcycles—dominate total energy usage in the transportation sector (58.2%), followed by
freight trucks and air transportation. Considering electric energy for transportation, however,
light duty vehicles consume only 1% of electric energy, with intercity, transit, and commuter rail
collectively accounting for 98.6% of electric transportation use today. Hence, LDVs represent a
large electrification opportunity.
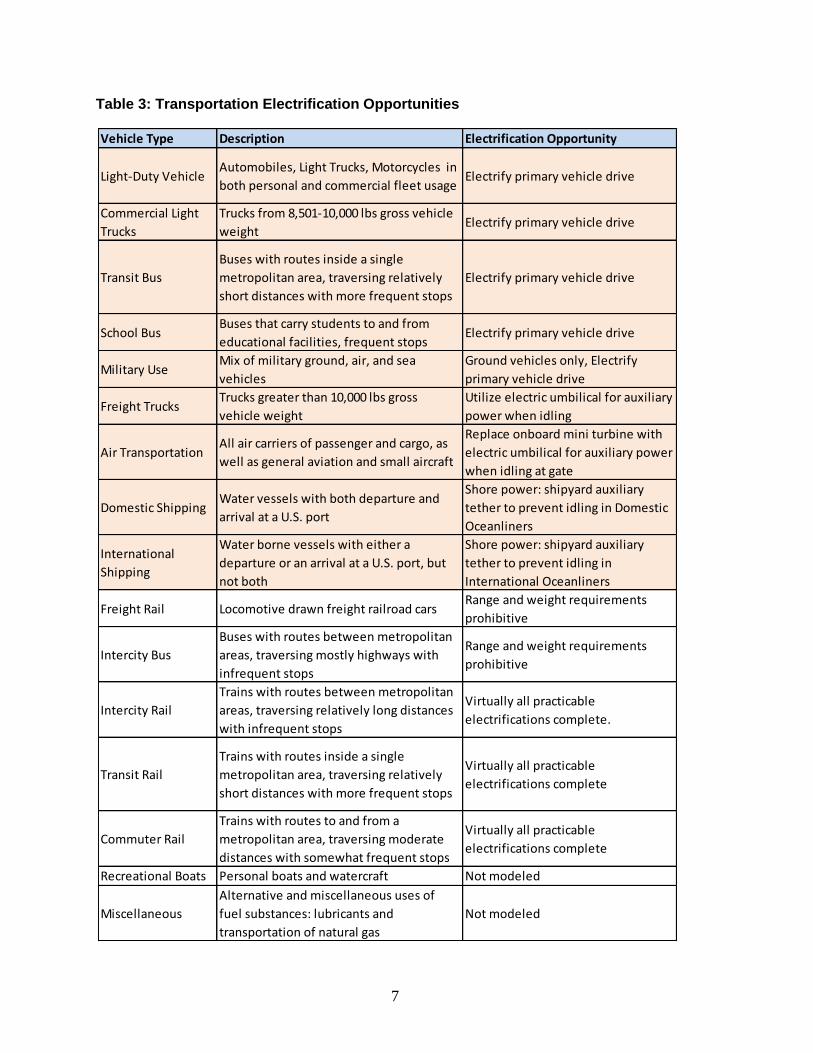
For each of the vehicle types outlined in Table 2, we identify electrification opportunities in
Table 3. LDVs represent the largest transportation electrification opportunity, because although
LDVs dominate energy usage in the transportation sector, the penetration of electric LDVs is still
small, as indicated in Table 2. The most common options for electric LDVs are all-electric
vehicles (AEVs), which operate solely on battery power, such as the Nissan Leaf and Tesla S,
and plug-in hybrid electric vehicles (PHEVs), which operate on both battery power and fossil-
fuel, such as the Chevy Volt and Prius Plug-in. A typical AEV consumes 3,000 to 4,000 kWh per
year, slightly more than an average central air-conditioner. A PHEV consumes between 20-50%
of the electricity used by an AEV, depending upon battery range and driving habits, with the
remainder of its energy coming from gasoline.4 This estimate is fairly conservative.
5
In addition to LDVs, electrification opportunities exist within commercial light trucks, transit
bus, school bus, military, freight trucks, air transportation, and domestic and international
shipping vehicle types. In this paper, we identify LDVs, commercial light trucks, transit bus,
school bus, and on-base military ground vehicles as vehicle types that can be fully electrified.
Conversely, the electrification opportunity of freight trucks, air transportation, domestic and
international shipping is restricted. These vehicles can be electrified to only a small degree due to
physical and economic constraints.
4 http://avt.inel.gov/evproject.shtml
5 Data from Volt Stats, which tracks the real world electricity usage and performance of Chevy Volts from a
sample set of Volt drivers shows that 70-80 percent of total miles driven are on electric.
http://www.voltstats.net/
5
Table 2: Transportation Sector Energy Consumption by Vehicle Type (2010)
Source: EIA, Transportation Sector Key Indicators & Delivered Energy Consumption. AEO 2012 Reference Case
Note: Highlighted values identify vehicles with electrification opportunities.
For example, the energy density required for shipping freight overseas and over rail exceeds the
limits of current and foreseeable electric and battery technologies. These modes of transit are
simply too heavy and require too much range for electrification of the primary drive systems.
The same applies for aircraft when in flight. However, particular applications within these
segments may offer efficiencies from electrification when idling. A jetliner idling at the gate
which typically runs a small turbine on jet fuel to produce auxiliary power for lighting and air
conditioning can reduce jet fuel use by connecting to the terminal’s electric supply.
Electrification of freight trucks at rest stops when idling/stopped is also a viable option.
Domestic and international container ships can also be powered by electricity while docked at
the port. Appendix A shows the transportation electrification modeling strategy by vehicle type
in greater detail.
Vehicle Type2010 Energy Use
All Fuels (TBTU)
% of All
Energy
2010 Energy
Use Electricity
Only (GWh)
% of Electric
Energy
Light-Duty Vehicle 16,056 58.2% 64 1.0%
Commercial Light Trucks 554 2.0% 19 0.3%
Transit Bus 106 0.4% 3 0.0%
School Bus 116 0.4% 3 0.0%
Military Use 765 2.8% 6 0.1%
Freight Trucks 4,822 17.5% 0 0.0%
Air Transportation 2,515 9.1% 0 0.0%
Domestic Shipping 218 0.8% 0 0.0%
International Shipping 861 3.1% 0 0.0%
Freight Rail 453 1.6% 0 0.0%
Intercity Bus 30 0.1% 0 0.0%
Intercity Rail 15 0.1% 448 6.7%
Transit Rail 15 0.1% 4,370 64.8%
Commuter Rail 18 0.1% 1,826 27.1%
Recreational Boats 254 0.9% 0 0.0%
Miscellaneous 787 2.9% 0 0.0%
Totals 27,586 100.0% 6,741 100.0%

6
Non-road transportation equipment at airports, seaports, mines, warehouses, intermodal facilities,
and agriculture production sites also represent tremendous electrification opportunities, but this
report primarily focuses on on-road transportation opportunities.
7
Table 3: Transportation Electrification Opportunities
Vehicle Type Description Electrification Opportunity
Light-Duty VehicleAutomobiles, Light Trucks, Motorcycles in
both personal and commercial fleet usageElectrify primary vehicle drive
Commercial Light
Trucks
Trucks from 8,501-10,000 lbs gross vehicle
weightElectrify primary vehicle drive
Transit Bus
Buses with routes inside a single
metropolitan area, traversing relatively
short distances with more frequent stops
Electrify primary vehicle drive
School BusBuses that carry students to and from
educational facilities, frequent stopsElectrify primary vehicle drive
Military UseMix of military ground, air, and sea
vehicles
Ground vehicles only, Electrify
primary vehicle drive
Freight TrucksTrucks greater than 10,000 lbs gross
vehicle weight
Utilize electric umbilical for auxiliary
power when idling
Air TransportationAll air carriers of passenger and cargo, as
well as general aviation and small aircraft
Replace onboard mini turbine with
electric umbilical for auxiliary power
when idling at gate
Domestic ShippingWater vessels with both departure and
arrival at a U.S. port
Shore power: shipyard auxiliary
tether to prevent idling in Domestic
Oceanliners
International
Shipping
Water borne vessels with either a
departure or an arrival at a U.S. port, but
not both
Shore power: shipyard auxiliary
tether to prevent idling in
International Oceanliners
Freight Rail Locomotive drawn freight railroad carsRange and weight requirements
prohibitive
Intercity Bus
Buses with routes between metropolitan
areas, traversing mostly highways with
infrequent stops
Range and weight requirements
prohibitive
Intercity Rail
Trains with routes between metropolitan
areas, traversing relatively long distances
with infrequent stops
Virtually all practicable
electrifications complete.
Transit Rail
Trains with routes inside a single
metropolitan area, traversing relatively
short distances with more frequent stops
Virtually all practicable
electrifications complete
Commuter Rail
Trains with routes to and from a
metropolitan area, traversing moderate
distances with somewhat frequent stops
Virtually all practicable
electrifications complete
Recreational Boats Personal boats and watercraft Not modeled
Miscellaneous
Alternative and miscellaneous uses of
fuel substances: lubricants and
transportation of natural gas
Not modeled
8
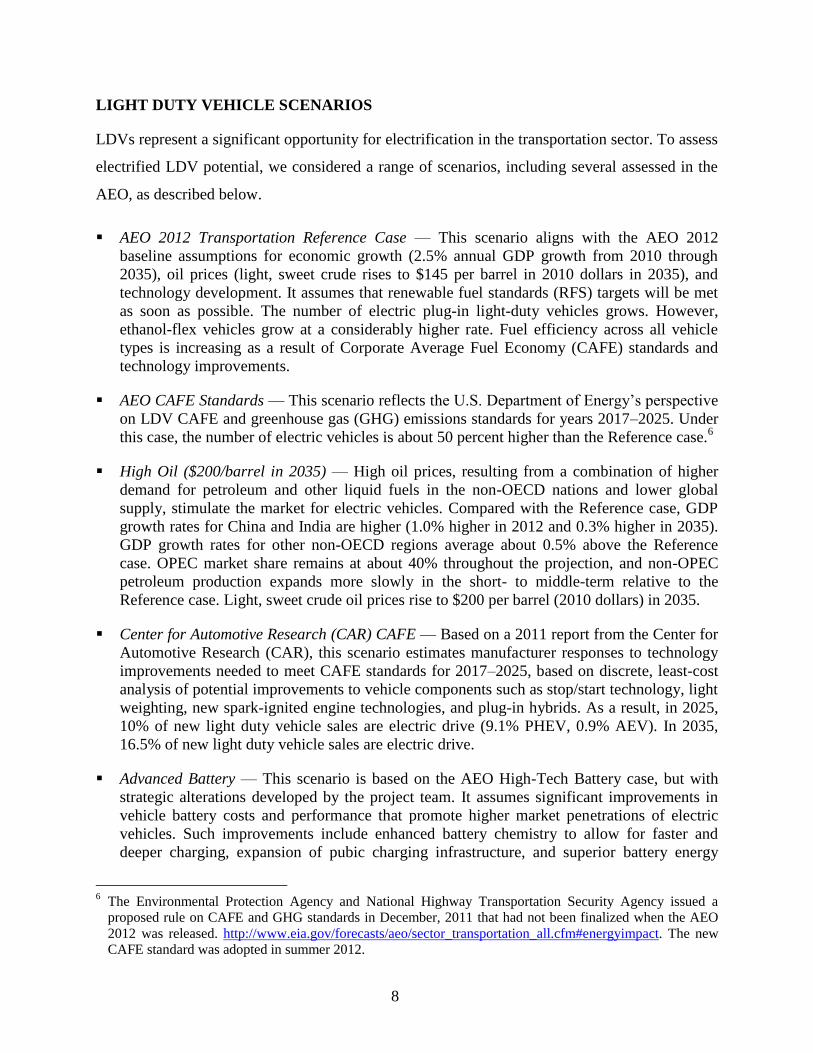
LIGHT DUTY VEHICLE SCENARIOS
LDVs represent a significant opportunity for electrification in the transportation sector. To assess
electrified LDV potential, we considered a range of scenarios, including several assessed in the
AEO, as described below.
AEO 2012 Transportation Reference Case — This scenario aligns with the AEO 2012
baseline assumptions for economic growth (2.5% annual GDP growth from 2010 through
2035), oil prices (light, sweet crude rises to $145 per barrel in 2010 dollars in 2035), and
technology development. It assumes that renewable fuel standards (RFS) targets will be met
as soon as possible. The number of electric plug-in light-duty vehicles grows. However,
ethanol-flex vehicles grow at a considerably higher rate. Fuel efficiency across all vehicle
types is increasing as a result of Corporate Average Fuel Economy (CAFE) standards and
technology improvements.
AEO CAFE Standards — This scenario reflects the U.S. Department of Energy’s perspective
on LDV CAFE and greenhouse gas (GHG) emissions standards for years 2017–2025. Under
this case, the number of electric vehicles is about 50 percent higher than the Reference case.6
High Oil ($200/barrel in 2035) — High oil prices, resulting from a combination of higher
demand for petroleum and other liquid fuels in the non-OECD nations and lower global
supply, stimulate the market for electric vehicles. Compared with the Reference case, GDP
growth rates for China and India are higher (1.0% higher in 2012 and 0.3% higher in 2035).
GDP growth rates for other non-OECD regions average about 0.5% above the Reference
case. OPEC market share remains at about 40% throughout the projection, and non-OPEC
petroleum production expands more slowly in the short- to middle-term relative to the
Reference case. Light, sweet crude oil prices rise to $200 per barrel (2010 dollars) in 2035.
Center for Automotive Research (CAR) CAFE — Based on a 2011 report from the Center for
Automotive Research (CAR), this scenario estimates manufacturer responses to technology
improvements needed to meet CAFE standards for 2017–2025, based on discrete, least-cost
analysis of potential improvements to vehicle components such as stop/start technology, light
weighting, new spark-ignited engine technologies, and plug-in hybrids. As a result, in 2025,
10% of new light duty vehicle sales are electric drive (9.1% PHEV, 0.9% AEV). In 2035,
16.5% of new light duty vehicle sales are electric drive.
Advanced Battery — This scenario is based on the AEO High-Tech Battery case, but with
strategic alterations developed by the project team. It assumes significant improvements in
vehicle battery costs and performance that promote higher market penetrations of electric
vehicles. Such improvements include enhanced battery chemistry to allow for faster and
deeper charging, expansion of pubic charging infrastructure, and superior battery energy
6 The Environmental Protection Agency and National Highway Transportation Security Agency issued a
proposed rule on CAFE and GHG standards in December, 2011 that had not been finalized when the AEO
2012 was released. http://www.eia.gov/forecasts/aeo/sector_transportation_all.cfm#energyimpact. The new
CAFE standard was adopted in summer 2012.

9
density. Based on these improvements, the project team adjusted the AEO scenario from
AEVs at 52% of the electric LDV market and zero presence of 200-mile vehicles to AEVs at
63%, some of which will have a 200-mile range. These assumptions better represent the
advances in battery technology.
Advanced Battery & High Oil ($200/barrel in 2035) — This scenario is a combination of two
of the previously described scenarios: Advanced Battery and AEO High Oil Price. This
scenario models the impact of both high oil prices and rapid advancements in battery
technology. The vehicle stock and new EV sales resulting from those two scenarios are
summed, then multiplied by 0.90 to reflect that these sales would not be simply additive. A
portion of the purchases driven by high oil prices would also occur under the drivers of
advanced battery technology.
LIGHT DUTY VEHICLE SCENARIO RESULTS
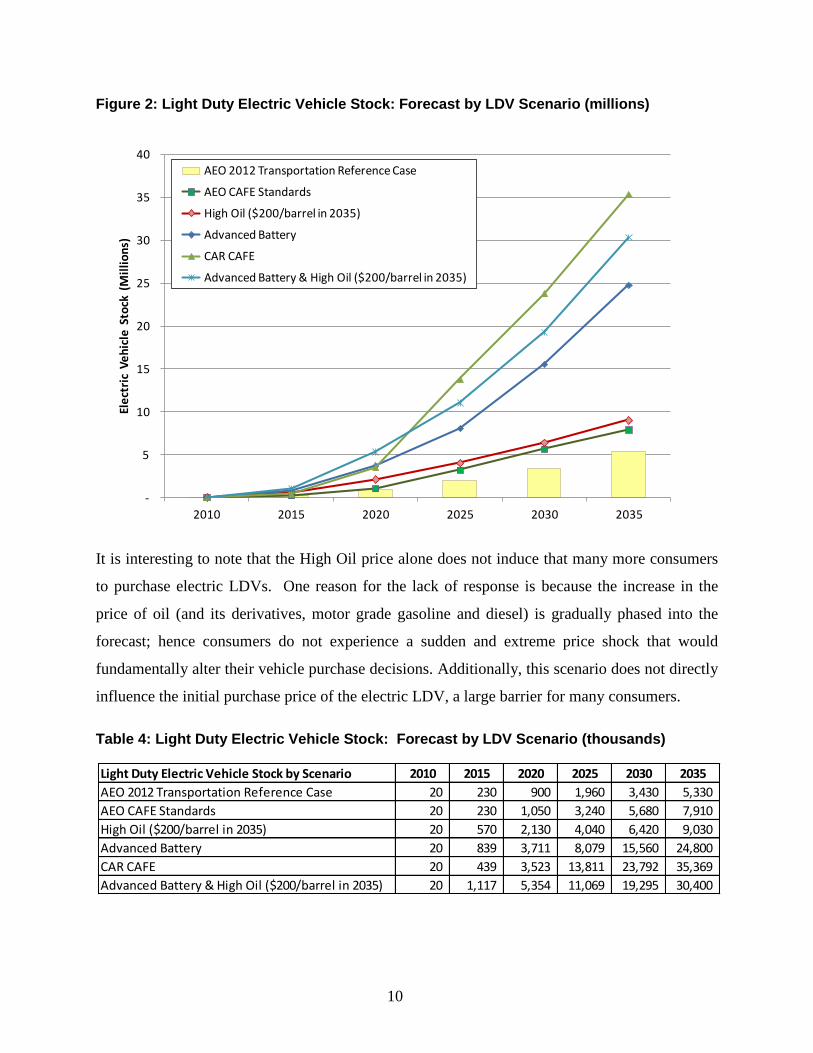
Figure 2 and Table 4 show how the electric LDV stock develops over the forecast period. The
AEO 2012 Transportation Reference Case is the most conservative scenario and electric LDV
stock reaches 5.3 million in 2035 (approximately 2 percent of all registered LDVs on the road in
the U.S.). The AEO CAFE and High Oil ($200/barrel in 2035) scenarios forecast a higher
penetration of electric LDVs , projecting 7.9 million and 9 million electric LDVs, respectively
(equivalent to 2.9 and 3.3 percent of all registered LDVs on the road in the U.S. in 2035).
The Advanced Battery scenario shows substantial penetration of electric LDVs with 24.8 million
vehicles on the road in 2035 (9.5 percent of all LDVs). This scenario shows the importance of
the initial purchase price (influenced by battery costs), and the value of having enhanced vehicle
utility through range extension and reduced charge time. The CAR CAFE scenario shows the
highest penetration of electric LDVs with 35.4 million LDVs on the road in 2035 (14.7 percent
of the vehicle stock). However, we believe the distribution of electric LDVs in the CAR report is
not representative because it assumes a very uneven distribution of PHEVs relative to AEVs
(roughly 9 to 1). The final scenario, Advanced Battery & High Oil shows penetration of 30.4
million electric LDVs on the road in 2035 (11.9 percent of the vehicle stock).
10
Figure 2: Light Duty Electric Vehicle Stock: Forecast by LDV Scenario (millions)
It is interesting to note that the High Oil price alone does not induce that many more consumers
to purchase electric LDVs. One reason for the lack of response is because the increase in the
price of oil (and its derivatives, motor grade gasoline and diesel) is gradually phased into the
forecast; hence consumers do not experience a sudden and extreme price shock that would
fundamentally alter their vehicle purchase decisions. Additionally, this scenario does not directly
influence the initial purchase price of the electric LDV, a large barrier for many consumers.
Table 4: Light Duty Electric Vehicle Stock: Forecast by LDV Scenario (thousands)
-
5
10
15
20
25
30
35
40
2010 2015 2020 2025 2030 2035
Ele
ctri
c V
eh
icle
Sto
ck (
Mil
lio
ns)
AEO 2012 Transportation Reference Case
AEO CAFE Standards
High Oil ($200/barrel in 2035)
Advanced Battery
CAR CAFE
Advanced Battery & High Oil ($200/barrel in 2035)
Light Duty Electric Vehicle Stock by Scenario 2010 2015 2020 2025 2030 2035
AEO 2012 Transportation Reference Case 20 230 900 1,960 3,430 5,330
AEO CAFE Standards 20 230 1,050 3,240 5,680 7,910
High Oil ($200/barrel in 2035) 20 570 2,130 4,040 6,420 9,030
Advanced Battery 20 839 3,711 8,079 15,560 24,800
CAR CAFE 20 439 3,523 13,811 23,792 35,369
Advanced Battery & High Oil ($200/barrel in 2035) 20 1,117 5,354 11,069 19,295 30,400

11
Figure 3 and Table 5 show the impact of electric LDV penetration on electricity consumption in
the transportation sector. The two main drivers of LDV electricity consumption over the forecast
period are the accumulation of electric vehicles within the stock of registered vehicles and the
electric drive range (i.e., based on battery capacity) of the vehicle. The AEO 2012 Transportation
Reference Case scenario shows total electricity consumption of 13.1 TWh in 2035. The AEO
CAFE and High Oil ($200/barrel in 2035) scenarios project electricity consumption of 18.9 TWh
and 29.3 TWh, respectively in 2035.
The CAR CAFE scenario projects the highest number of electric LDVs by 2035, 35.4 million,
yet has only 52 TWh associated with these vehicles. In comparison, the Advanced Battery and
High Oil scenario projects the largest increase in LDV electricity consumption with 87.8 TWh
consumed in 2035 associated with 30.4 million LDVs. While the result may seem
counterintuitive given a comparison of the electric vehicle stock across the two scenarios, it is
because the Advanced Battery and High Oil scenario includes a higher share of AEVs, some
with a 200-mile range, than the CAR CAFE scenario.
Figure 3: Light Duty Vehicle Electric Energy Consumed: Forecast by LDV Scenario (TWh)
0
10
20
30
40
50
60
70
80
90
100
2010 2015 2020 2025 2030 2035
Ele
ctri
c V
eh
icle
En
erg
y (
TWh
)
AEO 2012 Transportation Reference Case
AEO CAFE Standards
High Oil ($200/barrel in 2035)
Advanced Battery
CAR CAFE
Advanced Battery & High Oil ($200/barrel in 2035)

12
Table 5: Light Duty Vehicle Electric Energy Consumed: Forecast by LDV Scenario (TWh)
TRANSPORTATION SCENARIO RESULTS
For illustrative purposes, we defined three electric transportation scenarios, low, medium, and
high, as defined below.
The low electric transportation scenario includes:
o The penetration of electric LDVs from the AEO 2012 Transportation Reference Case
(5.3 million electric LDVs).
o Electrification of commercial light trucks, transit bus, school bus, and military vehicle
type stock at 50 percent the growth rate for electric LDVs in the AEO 2012
Transportation Reference Case. The battery and charging infrastructure technology
used by these vehicles types is similar to electric LDVs.
o Freight trucks, air transportation, and domestic and international shipping vehicle
types displace 20 percent of their fossil fuel energy demands with auxiliary electric
power while idled.
o Transit and commuter rail electrification are based on the AEO 2012 Transportation
Reference Case.
Figure 4 and Table 6 show electricity consumption under the low scenario by six transportation
sector end uses including electric LDVs. The “all other” category includes transit bus, school
bus, freight trucks, air transportation, and domestic and international shipping vehicle types. The
impact of the individual electric vehicle types that comprise the “all other” category are
combined for this report.
Under the low scenario, U.S. electricity consumption increases by 33 TWh in 2035. Electric
LDVs, commercial light trucks, and commuter rail are the primary drivers for the increase
with LDVs making up 13 of the 33 TWh, about 40 percent of the total.
Light Duty Vehicle Electric Energy by Scenario 2010 2015 2020 2025 2030 2035
AEO 2012 Transportation Reference Case 0 1 2 4 8 13
AEO CAFE Standards 0 1 2 7 13 19
High Oil ($200/barrel in 2035) 0 3 9 15 22 29
Advanced Battery 0 1 8 21 42 67
CAR CAFE 0 1 7 24 37 52
Advanced Battery & High Oil ($200/barrel in 2035) 0 3 13 29 53 88

13
Under the low scenario, depending upon the carbon intensity of the electric power sector and
the fuel economy of ICE vehicles, the switch to electric LDVs reduces emissions by 9 to 22
million metric tons of CO2 equivalent in 2035 (as shown in Figure 1). For illustrative
purposes, taking the midpoint of the range, a reduction of 16 MMT is comparable to the
emissions from the electricity used annually in 2.4 million homes, or reducing gasoline
consumption by 1.8 billion gallons.7
Figure 4: Electricity Use in Transportation Sector –Low Scenario (TWh)
Table 6: Electricity Use in Transportation Sector – Low Scenario (TWh)
7 Emission reduction estimates are based on data from DOE’s Alternative Fuels Data Center, EIA’s Annual
Energy Outlook 2012, improvements to ICE vehicle fuel economy, and the PHEV and AEV share of vehicle stock in each scenario. See Appendix B for details. EPA’s Greenhouse Gas Equivalencies Calculator
provides various equivalency statements associated with emissions reductions, including gallons of gasoline
and electricity use in home equivalencies.
0
20
40
60
80
100
120
140
160
2010 2015 2020 2025 2030 2035
TWh
All OtherCommuter RailTransit RailMilitary UseCommercial Light TrucksLight-Duty Vehicle
Electricity Use by Vehicle Type 2010 2015 2020 2025 2030 2035
Light Duty Vehicle 0 1 2 4 8 13
Commercial Light Trucks 0 0 1 1 2 4
Military Use 0 0 0 0 1 1
Transit Rail 4 5 5 5 5 6
Commuter Rail 2 2 2 2 2 2
All Other 0 1 1 2 4 7
Total 7 8 11 16 23 33

14
The medium electric transportation scenario includes:
o The penetration of electric LDVs from the Advanced Battery Scenario (24.8 million
electric LDVs).
o Electrification of commercial light trucks, transit bus, school bus, and military
vehicle type stock at 50 percent the growth rate for electric LDVs in the AEO 2012
Transportation Reference Case. The battery and charging infrastructure technology
used by these vehicles types is similar to electric LDVs.
o Freight trucks, air transportation, and domestic and international shipping vehicle
types displace 35 percent of their fossil fuel energy demands with auxiliary electric
power while idled.
o Transit and commuter rail electrification are based on the AEO 2012 Transportation
Reference Case.
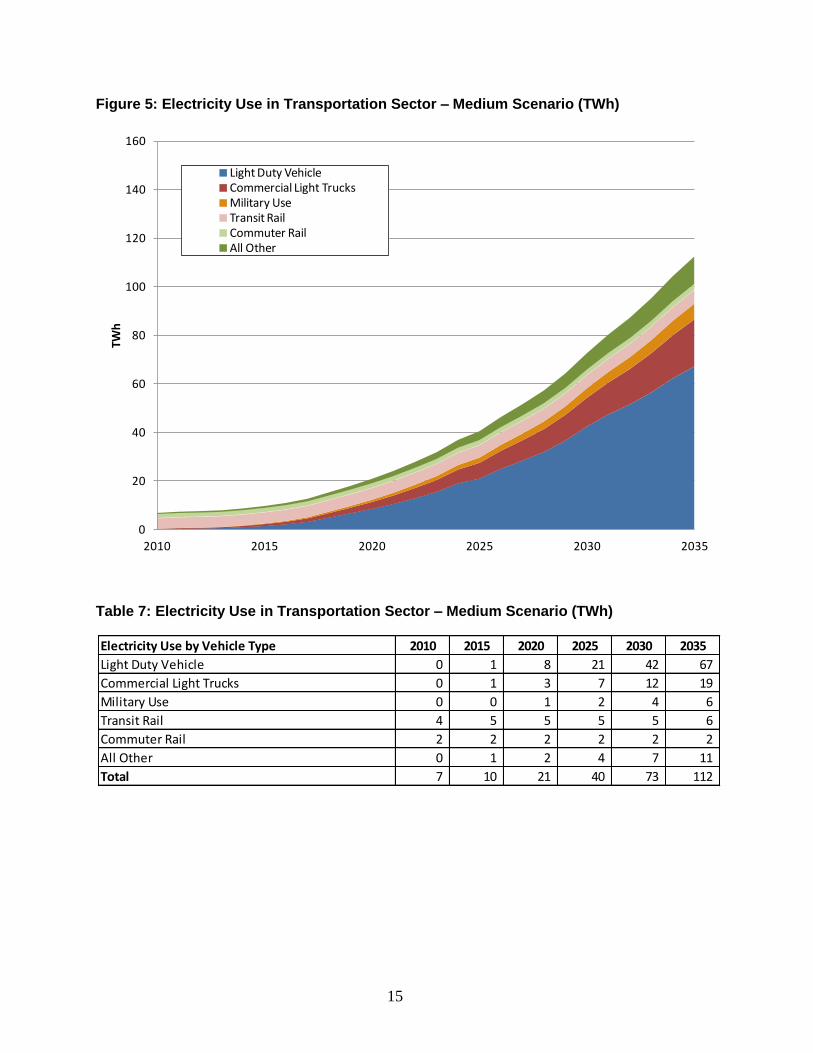
Figure 5 and Table 7 show the medium scenario where advances in battery technology induce
consumers to purchase electric powered vehicles.
Under the medium scenario, U.S. electricity consumption increases by 112 TWh in 2035.
Electric LDVs account for 67 TWh, or nearly 60 percent, of the total, and commercial light
trucks account for 19 TWh, or 17 percent of the total.
Under the medium scenario, depending upon the carbon intensity of the electric power sector
and the fuel economy of ICE vehicles, the switch to electric LDVs reduces emissions by 41
to 94 million metric tons of CO2 equivalent in 2035 (as shown in Figure 1). For illustrative
purposes, taking the midpoint of the range, a reduction of 68 MMT is comparable to the
emissions from the electricity used annually in 10.2 million homes, or reducing gasoline
consumption by 7.6 billion gallons.
15
Figure 5: Electricity Use in Transportation Sector – Medium Scenario (TWh)
Table 7: Electricity Use in Transportation Sector – Medium Scenario (TWh)
0
20
40
60
80
100
120
140
160
2010 2015 2020 2025 2030 2035
TWh
Light Duty VehicleCommercial Light TrucksMilitary UseTransit RailCommuter RailAll Other
Electricity Use by Vehicle Type 2010 2015 2020 2025 2030 2035
Light Duty Vehicle 0 1 8 21 42 67
Commercial Light Trucks 0 1 3 7 12 19
Military Use 0 0 1 2 4 6
Transit Rail 4 5 5 5 5 6
Commuter Rail 2 2 2 2 2 2
All Other 0 1 2 4 7 11
Total 7 10 21 40 73 112
16
The high electric transportation scenario includes:
o The penetration of electric LDVs from the Advanced Battery & High Oil ($200/barrel
in 2035) scenario (30.4 million electric LDVs).
o Electrification of commercial light trucks, transit bus, school bus, and military vehicle
type stock at 50 percent the growth rate for electric LDVs in the Advanced Battery
&High Oil ($200/barrel in 2035) scenarios. The battery and charging infrastructure
technology used by these vehicles types is similar to electric LDVs.
o Freight trucks, air transportation, and domestic and international shipping vehicle
types displace 50 percent of their fossil fuel energy demands with auxiliary electric
power while idled.
o Transit and commuter rail electrification are based on the AEO 2012 Transportation
Reference Case.
Figure 6 and Table 8 show the high scenario where battery advancements and rising oil prices
induce consumers to purchase electric powered vehicles.
Under the high scenario, U.S. electricity consumption increases by 147 TWh in 2035.
Electric LDVs account for 88 TWh, or nearly 60 percent, of the total, and commercial light
trucks account for 26 TWh, or 18 percent of the total.
Under the high scenario, depending upon the carbon intensity of the electric power sector and
the fuel economy of ICE vehicles, the switch to electric LDVs reduces emissions by 51 to
116 million metric tons of CO2 equivalent in 2035 (as shown in Figure 1).. For illustrative
purposes, taking the midpoint of the range, a reduction of 84 MMT is comparable to the
emissions from the electricity used annually in 12.6 million homes, or reducing gasoline
consumption by 9.4 billion gallons.

17
Figure 6: Electricity Use in Transportation Sector – High Scenario (TWh)
Table 8: Electricity Use in Transportation Sector – High Scenario (TWh)
0
20
40
60
80
100
120
140
160
2010 2015 2020 2025 2030 2035
TWh
All OtherCommuter RailTransit RailMilitary UseCommercial Light TrucksLight-Duty Vehicle
Electricity Use by Vehicle Type 2010 2015 2020 2025 2030 2035
Light Duty Vehicle 0 3 13 29 53 88
Commercial Light Trucks 0 1 4 9 16 26
Military Use 0 0 1 3 5 9
Transit Rail 4 5 5 5 5 6
Commuter Rail 2 2 2 2 2 2
All Other 0 1 2 5 9 16
Total 7 12 28 52 91 147

18
SUMMARY
Fossil fuels currently make up about 99 percent of the fuel in transportation and 31 percent of
U.S. greenhouse gas emissions can be tied to the burning of fossil fuels in the transportation
sector.8 Electrification of transportation makes sense from both an economic and environmental
perspective and is beginning to gain traction in a variety of applications. Various policy,
technology, and economic drivers as well as consumer demand will determine the ultimate levels
of electric vehicle adoption, including: advances in battery technology, oil prices, and
government mandates on fuel economy (e.g., CAFE standards). And, in turn, electric vehicle
adoption will impact greenhouse gas emissions.
The results in this report show that advanced battery technology (in the medium scenario) can
increases the penetration of electric LDVs from approximately 5 million to 24 million in 2035, or
roughly 1 out of every ten cars and light trucks on the road in the U.S. When advanced batteries
are coupled with high oil prices (in the high scenario), the number of electric vehicles could rise
to more than 30 million by 2035 (about 12 percent of the LDV stock in the U.S. in 2035).
The growth of electric LDVs in the medium and high scenarios is largely due to improvements in
vehicle battery costs and performance. Given that the medium and high scenarios project 10 to
12 percent of the vehicle stock to be electrified in 2035, sizable emission reductions of 41 to 116
MMT CO2 will occur in 2035 through the use of electricity as a transportation fuel.
Based on today’s average mix of generation resources, driving an electric car emits roughly half
as much pollution as the conventional vehicle. As the U.S. mix of power generation sources gets
cleaner and the number of electric vehicles grows, the environmental benefits of driving electric
vehicles will only increase. Alternative estimates of emission reductions under different power
generation mixes are provided in Appendix B.
To put the results into a larger context, based on the AEO 2012 Reference Case for Residential,
Commercial, and Industrial (excluding transportation), electricity use is projected to increase by
710 TWh between 2010 and 2035. Relative to the AEO projected 710 TWh of increased
electricity consumption over this 25 year period, both the medium and the high electric
8 EPA, Inventory of U.S. Greenhouse Gas Emissions and Sinks: 1990-2011. April 2013.

19
transportation scenarios in this report, resulting in 112
TWh and 147 TWh, respectively, are significant additions to electricity consumption. This
demonstrates again the important link between a cleaner power generation mix in the future and
a higher penetration of electric transportation in the U.S.

20
APPENDIXES

21
APPENDIX A
TRANSPORTATION SECTOR ANALYSIS APPROACH
Table A-1: Transportation Electrification Modeling Strategy
Vehicle Type
AEO 2012
Reference Low Scenario Medium Scenario High Scenario
Light-Duty VehicleLDV Penetration
Data
LDV data from
Reference Case of AEO
2012 (13.1 TWh in 2035)
LDV data from High Tech
Battery (67.1 TWh in
2035)
LDV data from High Tech
Battery + High Oil (87.8
TWh in 2035)
Commercial Light Trucks No electrification
Electrified Stock% = 0.50
x LDV's Electrified
Stock%
Electrified Stock% = 0.50
x LDV's Electrified
Stock%
Electrified Stock% = 0.50
x LDV's Electrified
Stock%
Transit Bus No electrification
Electrified Stock% = 0.50
x LDV's Electrified
Stock%
Electrified Stock% = 0.50
x LDV's Electrified
Stock%
Electrified Stock% = 0.50
x LDV's Electrified
Stock%
School Bus No electrification
Electrified Stock% = 0.50
x LDV's Electrified
Stock%
Electrified Stock% = 0.50
x LDV's Electrified
Stock%
Electrified Stock% = 0.50
x LDV's Electrified
Stock%
Military Use No electrification
Electrified Stock% = 0.10
x LDV's Electrified
Stock%
(Ground vehicles only)
Electrified Stock% = 0.10
x LDV's Electrified
Stock% (Ground vehicles
only)
Electrified Stock% = 0.10
x LDV's Electrified
Stock% (Ground vehicles
only)
Freight Trucks No electrification20% auxiliary power
electrification
35% auxiliary power
electrification
50% auxiliary power
electrification
Air Transportation No electrification20% auxiliary power
electrification
35% auxiliary power
electrification
50% auxiliary power
electrification
Domestic Shipping No electrification20% auxiliary power
electrification
35% auxiliary power
electrification
50% auxiliary power
electrification
International Shipping No electrification20% auxiliary power
electrification
35% auxiliary power
electrification
50% auxiliary power
electrification

22
APPENDIX B
CO2 EMISSIONS REDUCTION ESTIMATES: APPROACH AND ASSUMPTIONS
ELECTRIC LIGHT DUTY VEHICLE SCENARIOS (6 SCENARIOS):
For this report, we developed six electric light duty vehicle scenarios based on available sources.
AEO 2012 Reference Case
AEO 2012 High Oil Price ($200/barrel in 2035) scenario
AEO 2012 Proposed CAFE Standards 2017-2025 scenario
AEO 2012 High Technology Battery scenario (with modifications)
o The “Advanced Battery” scenario in this report is based on AEO’s High Technology
Battery scenario with strategic alterations made to the disposition of the electric
vehicle mix, including redistributing the electric vehicles to include 63% AEV’s,
some of which will have a 200-mile range. These assumptions better represent the
battery advances than the original AEO scenario, which estimated AEV’s at 52% of
the electric LDV market and no 200-mile vehicles.
Center for Automotive Research 2011 Report
o In addition to the AEO 2012 CAFE Scenario, IEE used a second CAFE scenario
based on the Center for Automotive Research’s 2011 report, The U.S. Automotive
Market and Industry in 2025 that projects that, in 2025, 10% of new light duty
vehicle sales are electric drive (9.1% PHEV, 0.9% AEV), and in 2035, 16.5% of new
light duty vehicle sales are electric drive.
Combined AEO 2012 High Technology Battery scenario & High Oil Price scenario (with
modifications)
o IEE also developed a High Technology Battery and High Oil Price scenario that sums
the vehicle stock and new EV sales resulting from those two scenarios are summed,
then multiplied by 0.90 to reflect that these sales would not be simply additive.
CO2 EMISSION REDUCTION SCENARIOS (4 SCENARIOS)
Efficient ICE; AEO 2012 Reference Case Power Sector Mix in 2035
Efficient ICE; AEO 2012 Low Cost Renewable Scenario Power Sector Mix in 2035
Conventional ICE; AEO 2012 Reference Case Power Sector Mix in 2035
Conventional ICE; AEO 2012 Low Cost Renewable Scenario Power Sector Mix in 2035

23
To develop the efficient internal combustion engine (ICE) scenario, we divide the annual miles
driven per vehicle by the 2035 average vehicle stock miles per gallon (MPG) estimate from AEO
2013 Reference Case to produce an estimate of gasoline consumed annually per vehicle in 2035
(about 441 gallons).9 Multiplying the gasoline consumption by pounds of GHG per gallon of
gasoline provides the pounds of CO2 emissions from an efficient ICE vehicle of 10,588 annually
(versus a conventional ICE vehicle with emissions of 13,043 pounds of CO2 annually).
2035 average vehicle stock MPG = 3410
Estimated annual miles driven = 15,000
Pounds of CO2 equivalent per gallon of gasoline = 24
Estimated pounds of CO2 equivalent per vehicle = 10,588
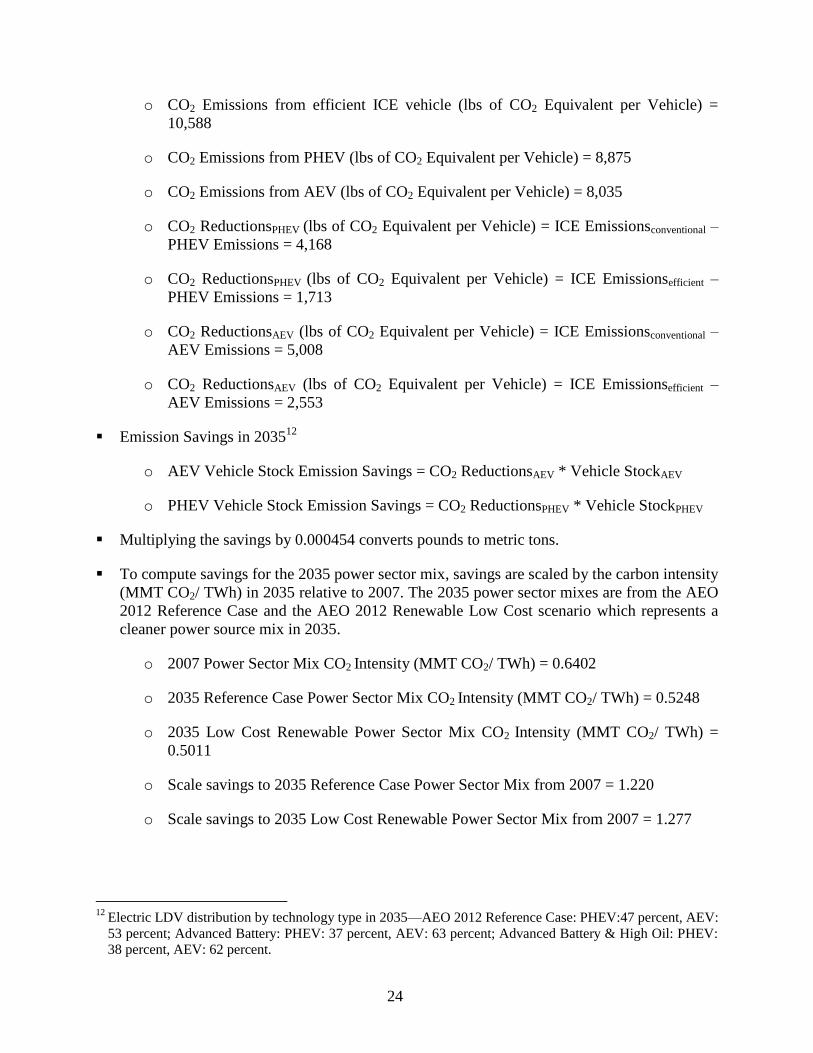
CO2 EQUIVALENT REDUCTION ESTIMATES:
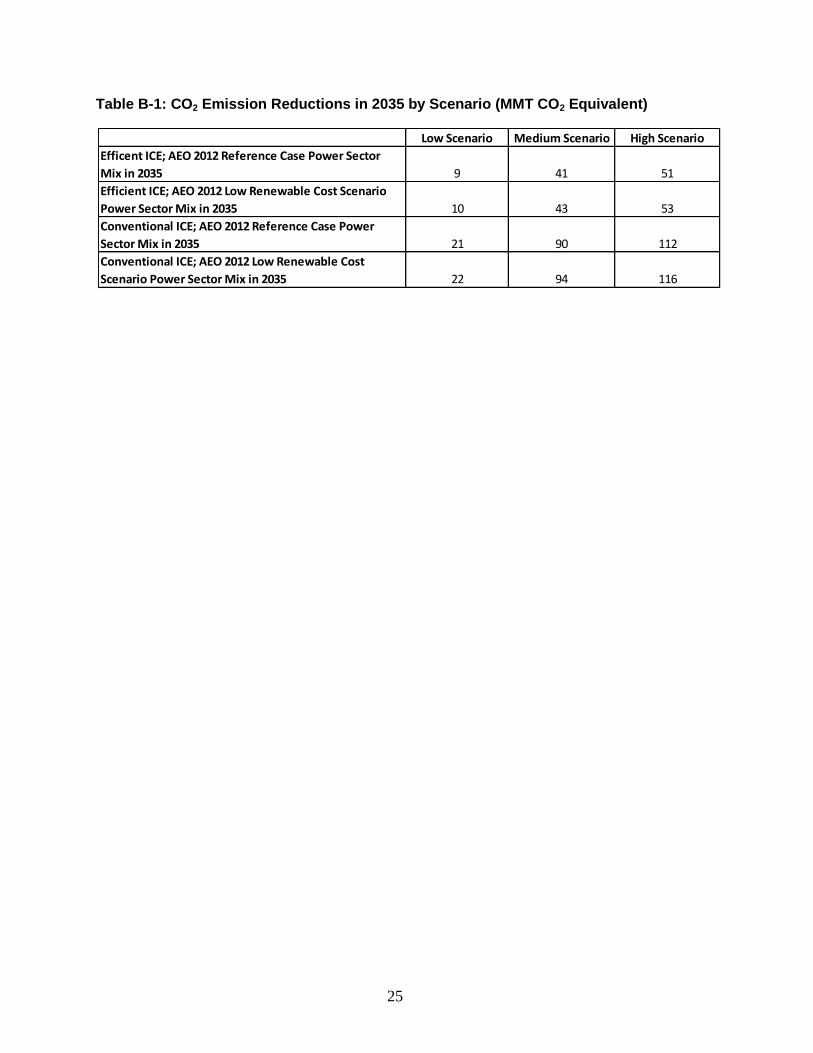
To provide carbon reduction context for transportation electrification, this report also provides
CO2 reduction estimates from electric LDVs in the year 2035, based on 2035 power sector mixes
and vehicle fuel economy for three scenarios. Table B-1 provides approximate CO2 reduction
estimates for the year 2035. These estimates are not cumulative, and are meant to be an
approximation and not a comprehensive analysis of CO2 emissions reductions.
To compute savings we use the DOE Alternative Fuels Data Center’s per vehicle “well to
wheels” estimate of annual pounds of CO2 equivalent emitted from vehicles with internal
combustion engines (ICEs), AEVs, and PHEVs given the national power sector mix in
2007.11
This power mix is updated to 2035 using the AEO (as explained below).
An alternate emissions estimate was developed to represent efficient ICE vehicles due to
technology improvements to meet model year 2017-2025 CAFE.
Subtracting AEV and PHEV well to wheels emissions from the ICE estimates produces
emission reduction benefits (i.e., savings) on a per vehicle basis by type.
o CO2 Emissions from conventional ICE vehicle (lbs of CO2 Equivalent per Vehicle) =
13,043
9 The AEO 2013 Reference Case includes the adoption of the final model year 2017 to 2025 GHG emissions
and CAFE standards for LDVS, which increases the projected fuel economy of the vehicle stock. 10
Rounded from 34.23 MPG. 11
http://www.afdc.energy.gov/vehicles/electric_emissions.php
24
o CO2 Emissions from efficient ICE vehicle (lbs of CO2 Equivalent per Vehicle) =
10,588
o CO2 Emissions from PHEV (lbs of CO2 Equivalent per Vehicle) = 8,875
o CO2 Emissions from AEV (lbs of CO2 Equivalent per Vehicle) = 8,035
o CO2 ReductionsPHEV (lbs of CO2 Equivalent per Vehicle) = ICE Emissionsconventional –
PHEV Emissions = 4,168
o CO2 ReductionsPHEV (lbs of CO2 Equivalent per Vehicle) = ICE Emissionsefficient –
PHEV Emissions = 1,713
o CO2 ReductionsAEV (lbs of CO2 Equivalent per Vehicle) = ICE Emissionsconventional –
AEV Emissions = 5,008
o CO2 ReductionsAEV (lbs of CO2 Equivalent per Vehicle) = ICE Emissionsefficient –
AEV Emissions = 2,553
Emission Savings in 203512
o AEV Vehicle Stock Emission Savings = CO2 ReductionsAEV * Vehicle StockAEV
o PHEV Vehicle Stock Emission Savings = CO2 ReductionsPHEV * Vehicle StockPHEV
Multiplying the savings by 0.000454 converts pounds to metric tons.
To compute savings for the 2035 power sector mix, savings are scaled by the carbon intensity
(MMT CO2/ TWh) in 2035 relative to 2007. The 2035 power sector mixes are from the AEO
2012 Reference Case and the AEO 2012 Renewable Low Cost scenario which represents a
cleaner power source mix in 2035.
o 2007 Power Sector Mix CO2 Intensity (MMT CO2/ TWh) = 0.6402
o 2035 Reference Case Power Sector Mix CO2 Intensity (MMT CO2/ TWh) = 0.5248
o 2035 Low Cost Renewable Power Sector Mix CO2 Intensity (MMT CO2/ TWh) =
0.5011
o Scale savings to 2035 Reference Case Power Sector Mix from 2007 = 1.220
o Scale savings to 2035 Low Cost Renewable Power Sector Mix from 2007 = 1.277
12
Electric LDV distribution by technology type in 2035—AEO 2012 Reference Case: PHEV:47 percent, AEV:
53 percent; Advanced Battery: PHEV: 37 percent, AEV: 63 percent; Advanced Battery & High Oil: PHEV:
38 percent, AEV: 62 percent.
25
Table B-1: CO2 Emission Reductions in 2035 by Scenario (MMT CO2 Equivalent)
Low Scenario Medium Scenario High Scenario
Efficent ICE; AEO 2012 Reference Case Power Sector
Mix in 2035 9 41 51
Efficient ICE; AEO 2012 Low Renewable Cost Scenario
Power Sector Mix in 2035 10 43 53
Conventional ICE; AEO 2012 Reference Case Power
Sector Mix in 2035 21 90 112
Conventional ICE; AEO 2012 Low Renewable Cost
Scenario Power Sector Mix in 2035 22 94 116

26
APPENDIX C
REFERENCES
Center for Automotive Research, “The U.S. Automotive Market and Industry in 2025”, June
2011
Department of Energy, Alternative Fuels Data Center-- http://www.afdc.energy.gov/
Electrification Coalition, “Electrification Roadmap: Revolutionizing Transportation and
Achieving Energy Security”, November 2009
Energy Information Administration, “Annual Energy Outlook 2012”, June 2012,
http://www.eia.doe.gov/forecasts/aeo/
Energy Information Administration, “Annual Energy Outlook 2013 Early Release”, December
2012, http://www.eia.doe.gov/forecasts/aeo/
Environmental Protection Agency, “Inventory of U.S. Greenhouse Gas Emissions and Sinks:
1990-2011”, April 2013
Environmental Protection Agency, Greenhouse Gas Equivalencies Calculator--
http://www.epa.gov/cleanenergy/energy-resources/calculator.html
EPRI-NRDC Joint Technical Report, “Environmental Assessment of Plug-In Hybrid Electric
Vehicles, Volume 1: Nationwide Greenhouse Gas Emissions (1015325)” July 2007.
Idaho National Laboratory, American Recovery and Reinvestment Act (ARRA)—Light-Duty
Electric Drive Vehicle and Charging Infrastructure Testing--
http://avt.inel.gov/evproject.shtml
Union of Concerned Scientists, “State of Charge”, June 2012
Volt Stats! – http://www.voltstats.net/

About IEEIEE is an Institute of The Edison Foundation focused on advancing the adoption of innovative and efficient technologies among electric utilities and their technology partners that will transform the power grid. IEE promotes the sharing of information, ideas, and experiences among regulators, policymakers, technology companies, thought lead-ers, and the electric power industry. IEE also identifies policies that support the business case for adoption of cost-effective technologies. IEE’s members are committed to an affordable, reliable, secure, and clean energy future.
IEE is goverened by a Management Committee of 23 electric industry Chief Executive Officers. IEE members are the investor-owned utilties who represent about 70% of the U.S. electric power industry. IEE has a permanent Advisory Committee of leaders from the regulatory com-munity, federal and state governement agencies, and other informed stakeholders. IEE has a Strategy Committee of senior electric industry executives and 33 smart grid techology company partners. Visit us at: www.edisonfoundation.net/IEE
For more information contact:Adam Cooper Research Manager IEE 701 Pennsylvania Avenue, N.W. Washington, D.C. 20004-2696 202.508.5551 [email protected]