forecast informed reservoir operations for lake mendocino · · 2017-07-18 forecast informed...
TRANSCRIPT

www.sonomacountywater.org
Forecast Informed Reservoir Operations for Lake MendocinoChris DelaneyJuly 11, 2017
Contributors:John Mendoza
Sonoma County Water Agency
Brett WhitinCalifornia Nevada River Forecast Center
Robert HartmanConsultant
David ReynoldsCooperative Institute for Research in Environmental Sciences
Julie KalanskyCenter for Western Weather and Water Extremes

Presentation Overview
BackgroundForecast Informed Reservoir Operations (FIRO)Lake Mendocino
Lake Mendocino FIRO Model
Model Results
Summary of Findings

Forecast Informed Reservoir OperationsLake Mendocino FIRO Demonstration Project
Steering CommitteeCounty, State and Federal Agencies
Lake Mendocino FIRO Workplan – July 2015Evaluate viability of FIRO
Preliminary Viability Assessment – Summer 2017
ObjectiveImprove water supply reliability, yetNot increase flood risk to downstream communities.
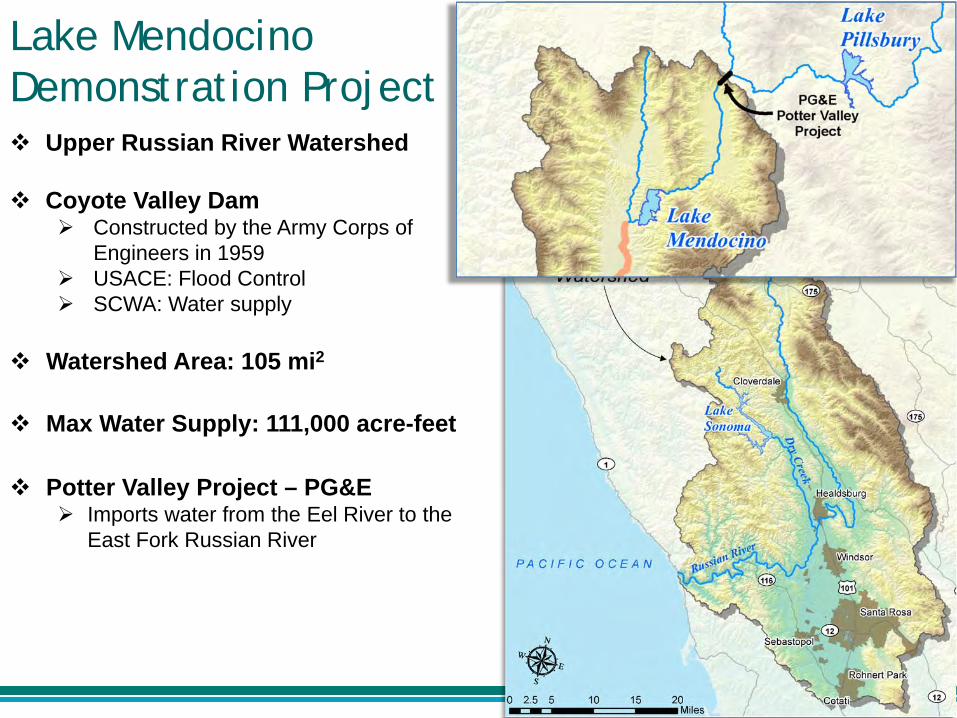
Lake Mendocino Demonstration Project
Upper Russian River Watershed
Coyote Valley DamConstructed by the Army Corps of Engineers in 1959USACE: Flood ControlSCWA: Water supply
Watershed Area: 105 mi2
Potter Valley Project – PG&EImports water from the Eel River to the East Fork Russian River
Max Water Supply: 111,000 acre-feet
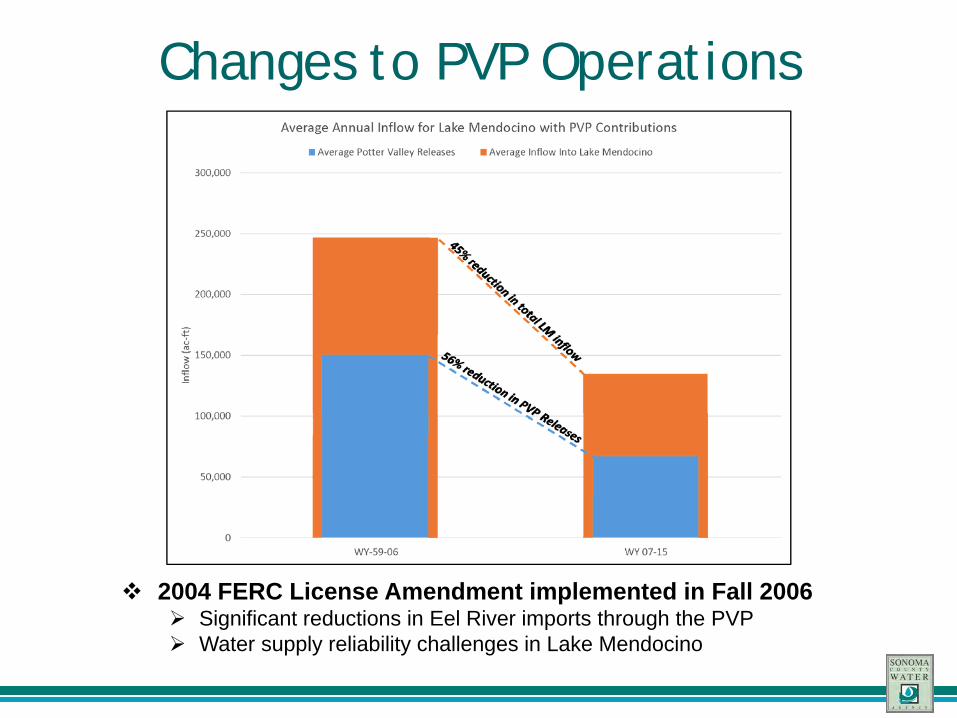
Changes to PVP Operations
2004 FERC License Amendment implemented in Fall 2006Significant reductions in Eel River imports through the PVPWater supply reliability challenges in Lake Mendocino
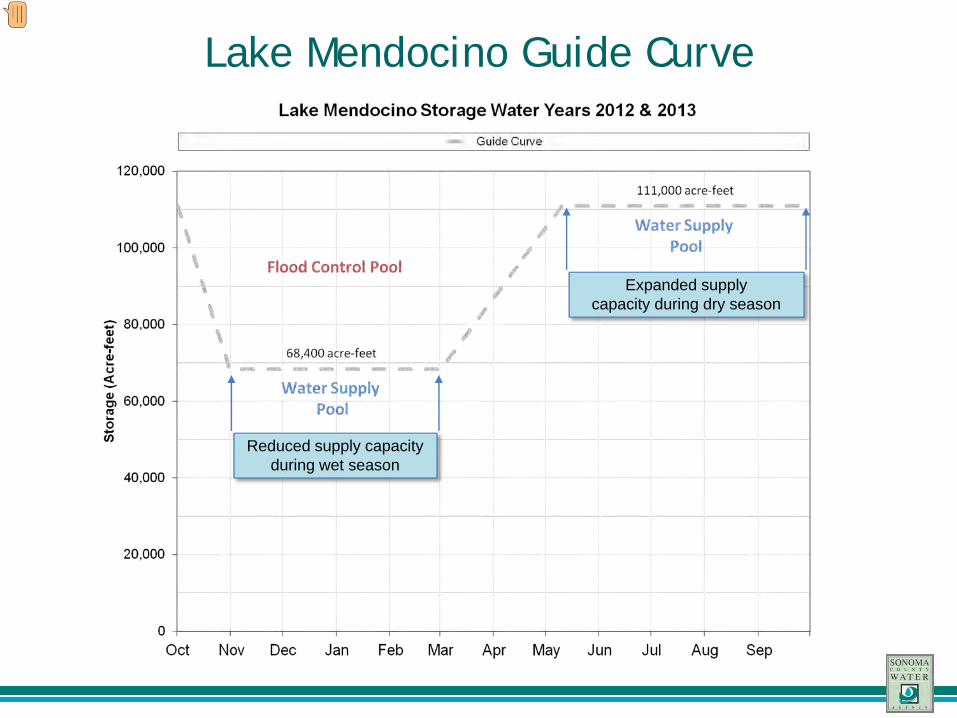
Lake Mendocino Guide Curve
Reduced supply capacity during wet season
Expanded supplycapacity during dry season

Lake Mendocino Guide Curve
WY2012 ≈ WY2013
Distribution very different
Different storage outcomes
Can we save some of this water?

Lake Mendocino FIRO Model
Upper Russian RiverPotter Valley Project to the USGS Gage at Healdsburg70 mile reach6 Model Junctions
Hydrology Scenarios1. 2017 Virtual Operations Trial
Real-time CNRFC Ensemble Flow Forecasto 59 –member, 15-day
2. Historical Conditions: 1985-2010CNRFC Ensemble Flow Hindcast
Flood Operations Scenarios1. Existing Operations2. Ensemble Forecast Operations (EFO) – Risk Based
Reservoir Management ModelDaily time step

Ensemble Forecast Operations (EFO)Modeling Overview
CNRFC Ensemble Flow Forecast Storage Forecast
Flood Risk Analysis
Flood Release
Process repeated each time step

Results: 2017 Virtual Operations Test
Small events in December
Filling reservoir
Corps flood release
EFO scenario storing water
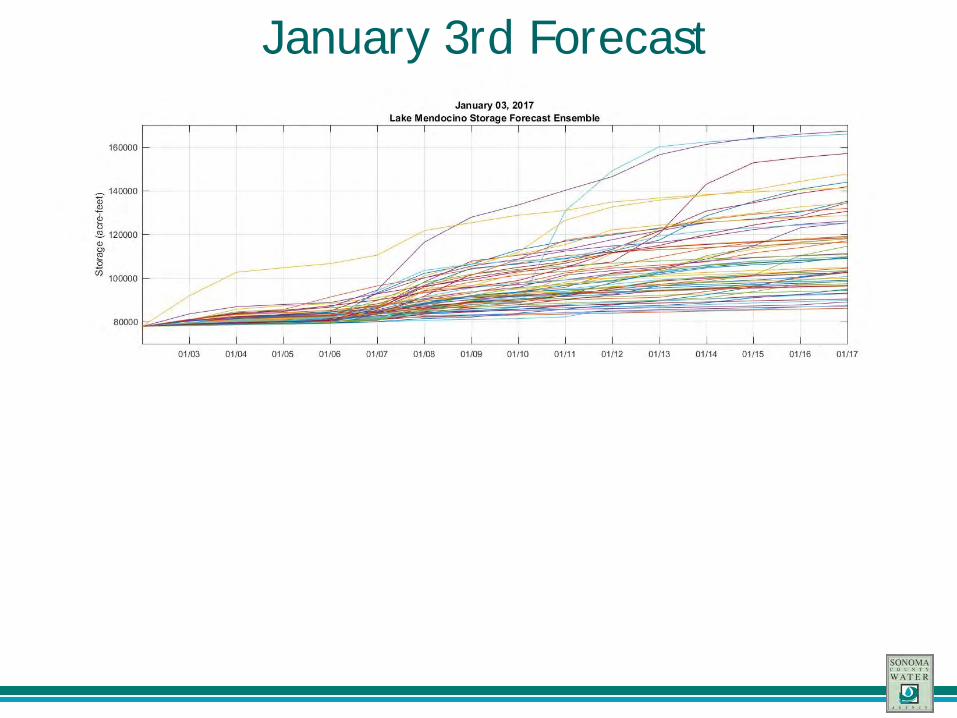
January 3rd Forecast

January 3rd Forecast
Risk of exceeding storage threshold

January 3rd Forecast
Risk based guide curve

January 3rd Forecast
EFO Flood Release = 2,000 cfs

Results: 2017 Virtual Operations Test
2,000 cfs pre-release for 5-days
Reduced storage before storm event

Results: 2017 Virtual Operations Test
Flood control operations: High inflows & Reduced releases
Rapid increaseIn storage
No increase in peak flows

Results: 2017 Virtual Operations Test
Pre-release in advance of storm

Results: 2017 Virtual Operations Test
Flood operations = reservoir refill

Results: 2017 Virtual Operations Test
EFO scenario reduced lower than Observed
EFO peak ≈ Observed Peak

Results: 2017 Virtual Operations Test
EFO scenario storing water5,500 af

2017 Storage Projection
8,700 af

Results: 1985-2010 Historical SimulationLake Mendocino Storage

Results: 1985-2010 Historical SimulationEnd of Water Year Storage
~20K acre-feet increase in median

Results: 1985-2010 Historical SimulationHopland Flows > 8,000 cfs
No instances of increase flow above flood stage
Flood Stage
Nuisance Flooding

Summary of Findings
FIRO may improve water supply reliability for Lake Mendocino
Further analysis and modeling is recommended
Model results do not indicate increased risk of downstream flooding
CNRFC ensemble flow forecasts demonstrate adequate skill to support a FIRO Decision Support System for Lake Mendocino

Questions?
Contact:E-mail:
Contributors:
Chris [email protected] Mendoza, Brett Whitin, Robert Hartman, David Reynolds, and Julie Kalansky