foraging under contrasting oceanographic conditions: the ... · gentoo penguins are inshore...
TRANSCRIPT
MARINE ECOLOGY PROGRESS SERIESMar Ecol Prog Ser
Vol. 302: 245–261, 2005 Published November 4
INTRODUCTION
Marine top predators are highly mobile speciesexploiting a spatially and temporally heterogeneousenvironment (Hunt et al. 1999). In response to thisheterogeneity, many marine birds and mammals canexhibit considerable variation in their foraging behav-iour or at-sea distribution (e.g. Croxall et al. 1988, Wil-son 1995, Boyd 1996, Weimerskirch 1998, Rodary et al.2000, Charassin & Bost 2001, Beauplet et al. 2004,Grémillet et al. 2004a).
For the last 20 yr, the development of microproces-sor-based time-depth recorders (e.g. Kooyman et al.1992, Croxall et al. 1993, Wilson 1995, Boyd et al.2004), satellite transmitters and global positioningsystems (e.g. Jouventin & Weimerskirch 1990, Mc-Connell et al. 2002, Weimerskirch et al. 2002) has
allowed us to gain considerable knowledge about theforaging behavior and energetics of diving species.Recently, it has appeared that individuals of the samespecies can adapt their behavioral responses, via dif-ferent foraging modes, to changes in prey availability(Boyd et al. 1994, McCafferty et al. 1998, Ropert-Coudert et al. 2002). The response of any one specieswill differ according to several parameters such asseason, breeding stage and abiotic conditions (Sala-molard & Weimerskirch 1993, Hunt et al. 1999, Cha-rassin & Bost 2001, Charassin et al. 2002). Hence, theeffects of biotic and abiotic factors on foraging strate-gies are difficult to discriminate. One way to copewith this difficulty is to adopt a comparative approachon a small spatial scale. The study, during a givenyear and breeding stage, of several populations of thesame species, living in habitats which are geographi-
© Inter-Research 2005 · www.int-res.com*Email: [email protected]
Foraging under contrasting oceanographicconditions: the gentoo penguin at Kerguelen
Archipelago
Amélie Lescroël*, Charles-André Bost
Centre d’Etudes Biologiques de Chizé, CNRS, UPR 1934, 79360 Villiers en Bois, France
ABSTRACT: Coastal seabirds are bound to be dependent on local marine resources. We hypothesizethat the localization of the breeding colony will influence the foraging patterns of such predators. Theforaging behavior of gentoo penguins Pygoscelis papua was investigated in contrasting marine envi-ronments at Kerguelen Archipelago over the 2002–03 and 2003–04 breeding seasons. Using time-depth recorders (TDRs) and satellite transmitters, we describe the at-sea distribution and divingbehavior of gentoo penguins breeding in 2 colonies facing the open sea (Open Sea 1 and Open Sea 2)and 1 colony protected in a closed bay (Closed Sea). The foraging behavior varies extensively acrossthe Kerguelen Archipelago, almost as much as it does over the entire range of the species. Differentforaging strategies emerge, depending on the local conditions: large foraging ranges, long trips, longbenthic dives on demersal fish at Open Sea colonies versus small foraging ranges, short trips, shortpelagic dives on swarming crustaceans at Closed Sea, for a same foraging effort. The diving behav-ior of the gentoo penguin therefore varies as a function of the locality and the site, closely related toprey availability. This study demonstrates the importance of foraging plasticity as a fundamentalaspect of life history in coastal marine predators.
KEY WORDS: Pygoscelis papua · Foraging strategy · Diving behavior · At-sea distribution ·Behavioural plasticity · Geographic variation · Prey availability · Marine predator
Resale or republication not permitted without written consent of the publisher
Mar Ecol Prog Ser 302: 245–261, 2005
cally close to each other but different in terms ofmarine resources, should eliminate the majority ofthe confounding abiotic factors. Until now, few studies(Kirkwood & Robertson 1997, Radl & Culik 1999) havefollowed this approach.
A particularly well-suited model is the gentoo pen-guin Pygoscelis papua, which is one of the main avianbenthic consumers of the sub-Antarctic area (e.g.Croxall & Prince 1980a, Ridoux 1994, Woehler 1995).Gentoo penguins are inshore opportunistic feeders asillustrated by their diet varying greatly both with local-ity (see review in Bost & Jouventin 1990) and breedingcolony (Hindell 1989, Lescroël et al. 2004). Despitethe large distribution range of the gentoo penguinfrom the Antarctic Peninsula (63° 15’ to 65° 05’ S) to thenorthernmost sub-Antarctic islands (Crozet Archi-pelago, 46° 00’ S), only 2 studies (Hindell 1989,Lescroël et al. 2004) have focused on the spatial varia-tion of the gentoo penguin diet. No study has investi-gated the spatial variation of the diving behavior of thegentoo penguin. Furthermore, the at-sea distributionand movements of the gentoo penguin have rarelybeen directly determined (i.e. by satellite telemetry orgeolocation: Wilson et al. 1998, during summer; Clau-sen & Pütz 2003, Tanton et al. 2004, during winter) andtheir diving behavior has been described in only 4(Croxall et al. 1988, Williams et al. 1992, Bost et al.1994, Wilson et al. 1996) of the 9 breeding localities(Bost & Jouventin 1990), and was nevercarried out on more than 1 colony.
Almost 40 000 pairs of gentoo penguins(12% of the world’s population) breedannually on Kerguelen Archipelago (Bost& Jouventin 1990). They are scattered insmall colonies along the indented coast,experiencing a wide range of oceano-graphic conditions. As gentoo penguinsare neritic foragers during the breedingperiod (Wilson 1995), they are bound tobe dependent on local marine resources.We therefore hypothesize that thelocalization of the breeding colony willstrongly influence their foraging patterns.In this study, conducted on a small spatialscale, our objectives were (1) to describethe foraging characteristics, diving be-havior and feeding areas of the gentoopenguin at Kerguelen Archipelago, (2) tocompare its foraging behavior in contrast-ing marine environments at KerguelenArchipelago, between colonies facing thesea and a sheltered colony, and (3) tostudy how local oceanographic conditionsmay affect the foraging ecology of amarine top predator.
This is the first study to investigate the foragingbehavior of the gentoo penguin on the Kerguelenplateau, which is the largest submarine plateau of theSouthern Ocean and one of the most productive areasof sub-Antarctic localities (Duhamel 1987, Blain et al.2001). It also provides the first comparative study ofdiving behavior in penguins that takes into accountenvironmental variability on a small spatial scale dur-ing the whole breeding cycle (from incubation to chickcrèche). This study was conducted over 2 consecutiveyears at several sites, from winter to summer each year,and encompassed 2 breeding seasons.
MATERIALS AND METHODS
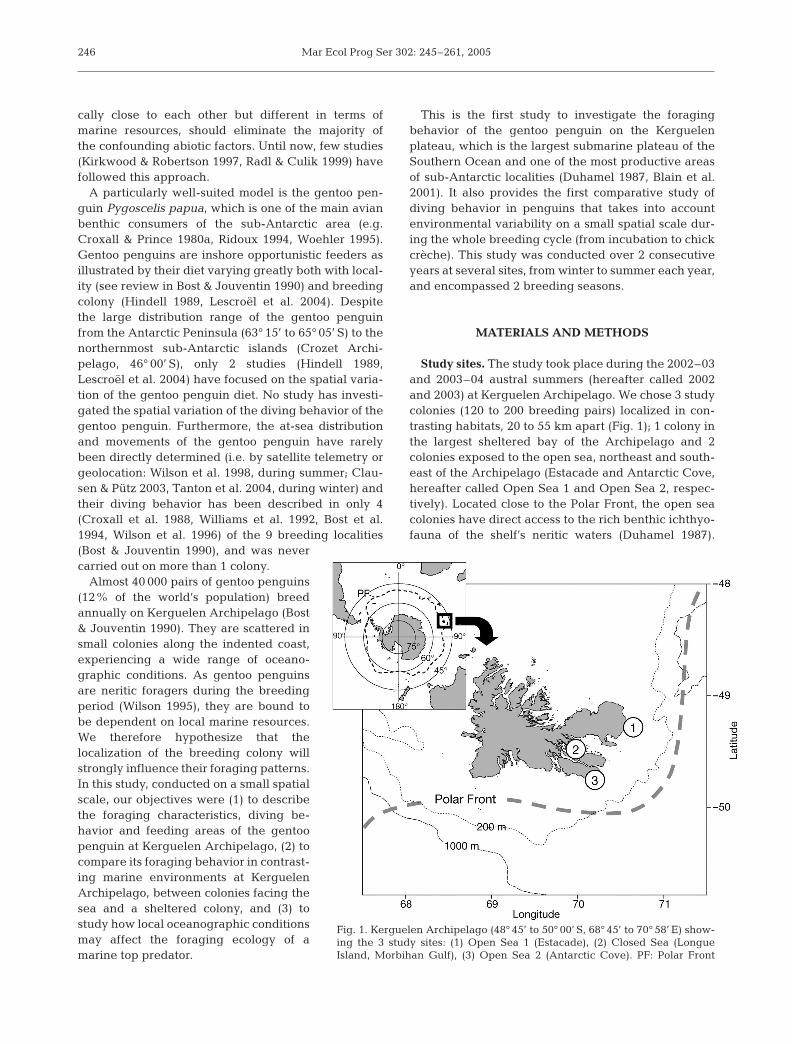
Study sites. The study took place during the 2002–03and 2003–04 austral summers (hereafter called 2002and 2003) at Kerguelen Archipelago. We chose 3 studycolonies (120 to 200 breeding pairs) localized in con-trasting habitats, 20 to 55 km apart (Fig. 1); 1 colony inthe largest sheltered bay of the Archipelago and 2colonies exposed to the open sea, northeast and south-east of the Archipelago (Estacade and Antarctic Cove,hereafter called Open Sea 1 and Open Sea 2, respec-tively). Located close to the Polar Front, the open seacolonies have direct access to the rich benthic ichthyo-fauna of the shelf’s neritic waters (Duhamel 1987).
246
Fig. 1. Kerguelen Archipelago (48° 45’ to 50° 00’ S, 68° 45’ to 70° 58’ E) show-ing the 3 study sites: (1) Open Sea 1 (Estacade), (2) Closed Sea (LongueIsland, Morbihan Gulf), (3) Open Sea 2 (Antarctic Cove). PF: Polar Front
Lescroël & Bost: Microgeographical variation of foraging in the gentoo penguin
Open Sea 1 and Open Sea 2 differ by their distance tothe Polar Front and to oceanic waters, and by their ter-restrial environment (a flat peninsula surrounded bysandy beaches and steep cliffs broken by deep sandyvalleys, respectively) (Lescroël et al. 2004). The ClosedSea colony, Longue Island, is located in the westernpart of the Morbihan Gulf, a sheltered bay of about700 km2 with kelp belts, muddy sand and low tidalamplitude. The Morbihan Gulf is a productive eco-system, which supports important populations ofmeso- and macrozooplankton (Razouls et al. 1997,Bocher et al. 2001).
Foraging behaviour. During the 2002 and 2003breeding seasons, a total of 46 breeding gentoo pen-guins were equipped with time-depth recorders(TDRs) to study their diving behavior. We used 2 mod-els of TDR (Wildlife Computers) which recorded depth(resolution of 0.5 m), temperature and light level every5 s: (1) Mk7 (86 mm × 20 mm × 11 mm, 27 g) and (2)Mk9 (67 mm × 17 mm × 17 mm, 30 g). A total of 11breeding gentoo penguins were equipped with a plat-form terminal transmitter (PTT, Kiwisat 101, 130 mm ×28 mm × 14 mm, 77 g) during the 2002 breeding seasonto study their at-sea distribution. The cross-sectionalareas of Mk7, Mk9 and PTTs were equivalent to 1.0,1.3 and 1.7% of the cross-sectional area of a gentoopenguin, respectively. We equipped the same numberof males and females with each device.
The devices were streamlined to reduce hydro-dynamic drag (Culik et al. 1994). Breeding birds werecaptured on the beach at their departure to the seausing a landing net. The devices were attached tofeathers in the midline of the lower back so as to mini-mize drag (Bannasch et al. 1994) using a cyanoacrylateglue (Loctite 401) and plastic cable ties. Birds wereweighed, measured, marked with serial numberspainted on the breast with picric acid and then re-leased towards the sea. Care was taken to minimizestress after the capture by covering the bird’s headwith a hood while they were being handled (10 to15 min). Birds were recaptured after 1 foraging tripand the devices were subsequently redeployed on dif-ferent individuals. All devices were recovered, exceptfor one on a female from the Open Sea 1 group duringcrèche 2002 that did not come back to the colonybefore our departure.
Satellite data analysis. The Argos system assignedlocations to 7 classes on the basis of positional accu-racy. The accuracy of locations was classified as fol-lows: Class 3 was accurate to within 150 m, Class 2 to350 m, Class 1 to 1 km; Classes 0, A and B have noassigned accuracy; and Class Z indicates an invalidlocation. Because of the low number of daily locations,all classes except Class Z were included in the ana-lysis. Locations were filtered so that those that gave
transit speeds ≥ 2.8 m s–1 over half an hour (i.e. themaximum measured velocity, Robinson & Hindell1996) or ≥ 2.0 m s–1 over an hour or more (i.e. the maxi-mum velocity measured for an extended period,Wilson et al. 1989) were discarded. Then, using home-made software (CROZARG, author: T. Zorn), we calcu-lated the maximal range from the colony, the swim-ming speed to this maximum distance (i.e. the outwardswimming speed calculated as the mean of all theswimming speeds between locations from the depar-ture to the point of maximal range) and the returnswimming speed to the colony (mean of all the swim-ming speeds between locations from the point ofmaximal range to the return to the colony). We alsocalculated an index of sinuosity, which is the cumu-lated distance traveled to the point of maximal rangedivided by the distance of maximal range (Haggett &Chorley 1969, Grémillet et al. 2004b). Due to the lownumber of locations obtained for 2 birds from OpenSea 1 (i.e. 5 locations versus 11 to 76 locations for theother equipped birds), we discarded them from thecalculations of swimming speed and sinuosity.
Diving data analysis. Dive parameters were an-alyzed using dedicated dive analysis software (Multi-Trace, Jensen Software Systems) to determine the divedepth, dive duration, bottom time (i.e. the time spentaround the maximum depth, defined by the periodspent at a depth equal to at least 60% of the maximumdepth with a vertical speed smaller than 0.3 m s–1,which corresponds to the inflexion point of the divebefore and after reaching the maximum depth), totalway vertical at the bottom (i.e. the vertical distancetravelled during bottom time), and the duration andvertical velocity of the descent and ascent phases. Thedetermination of each parameter was visually verifiedfor each dive. According to the depth resolution ofTDRs, a dive was deemed to occur when the maximumdepth was ≥1 m.
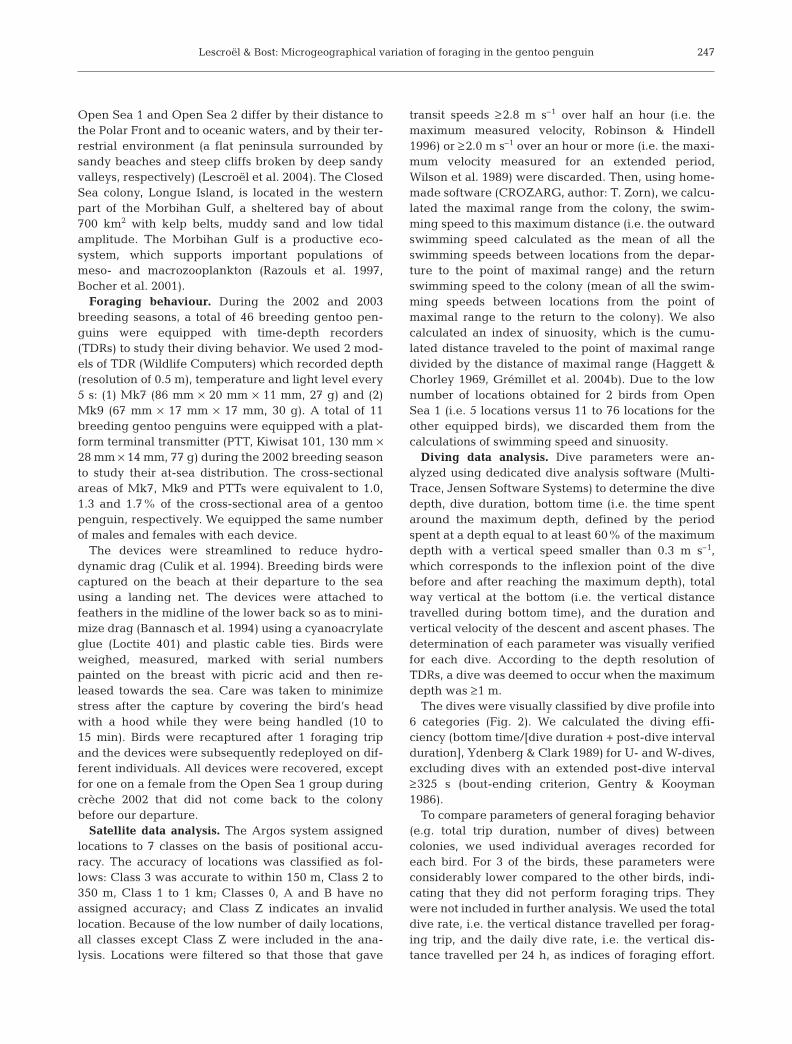
The dives were visually classified by dive profile into6 categories (Fig. 2). We calculated the diving effi-ciency (bottom time/[dive duration + post-dive intervalduration], Ydenberg & Clark 1989) for U- and W-dives,excluding dives with an extended post-dive interval≥ 325 s (bout-ending criterion, Gentry & Kooyman1986).
To compare parameters of general foraging behavior(e.g. total trip duration, number of dives) betweencolonies, we used individual averages recorded foreach bird. For 3 of the birds, these parameters wereconsiderably lower compared to the other birds, indi-cating that they did not perform foraging trips. Theywere not included in further analysis. We used the totaldive rate, i.e. the vertical distance travelled per forag-ing trip, and the daily dive rate, i.e. the vertical dis-tance travelled per 24 h, as indices of foraging effort.
247
Mar Ecol Prog Ser 302: 245–261, 2005
Temperature data were used to determine the begin-ning and end of each foraging trip. Depending on theair temperature, the logger temperature could dropsharply when the bird entered the water to attain thewater temperature (the sea-surface temperature atKerguelen Archipelago during winter is about 3°C,Park et al. 1993). We defined the onset of this tempera-ture drop as the beginning of the foraging trip. The endof the foraging trip was indicated by a rapid tempera-ture increase and strong fluctuations.
For comparison of specific dive parameters (e.g.maximum depth, dive duration), dives were treatedindependently. In order to take into account the partialautocorrelation of dives (Hurlbert 1984) and to give allbirds an equal statistical weight, we randomly selected50 dives per bird except for 1 bird (69 feeding dives, 40dives selected). The maximum depth of foraging divesactually lost correlation after 2 successive dives and
the lowest number of foraging dives recorded for 1individual was around 100. This resulted in a 2090dives data set (1150, 800 and 250 at Open Sea 1,Closed Sea and Open Sea 2, respectively). As the max-imum depth reached during a dive influenced all otherdive parameters (Wilson et al. 1996, 1997, Cherel etal. 1999), the data were standardized (Sokal & Rohlf1995) by depth class to compare normal deviates ofdive parameters independently of depth (Tremblay &Cherel 2000).
Feeding frequency and effect of instrumentation.We estimated the effect of the instrumentation by com-paring foraging trip duration between instrumentedand non-instrumented birds. For that, we painted thesides of 30 incubating birds in Open Sea 1 and ClosedSea without catching them, using a brush with a longhandle. We were then able to know at a distance,which one of the mates (marked or not) was at sea andwhich one was on the nest. Hence, foraging trip dura-tion of non-instrumented birds was visually assessedby 3 observations per day during incubation and chickguard for 1 wk.
During crèche, both parents may forage at sea atthe same time and bird departures or returns oftenoccurred during periods of darkness. Consequently,direct observation of shift duration was by far moredifficult and we used 10 VHF transmitters (60 mm ×26 mm × 14 mm, 36 g; i.e. 1.6% of the cross-sectionalarea of a gentoo penguin, Sirtrack) in Open Sea 1,Open Sea 2 and Closed Sea to assess the feeding fre-quency. The transmitters were attached using Loctite401 and remained on the birds for 3 to 6 d, providinginformation on 2 to 7 trip durations per bird. The pres-ence or absence of the birds at the colony was assessedby scanning the VHF frequencies every 2 h, day andnight, using a multidirectional Yaggi antenna coupledto a VHF receptor. For analysis, we used individualaverages for each bird.
Statistics. Data were analyzed statistically usingSystat 7.0. Values are given as means ± SD unlessstated otherwise. Comparisons of general foragingparameters between the study sites and breeding
248
0 m2 m
10 m
T S A V W U
Fig. 2. Pygoscelis papua. Stylized profiles of dive typesperformed by gentoo penguins at Kerguelen Archipelago.T: travelling dives, occurring at depths ≤ 2 m; S: searchingdives, occurring at depths between 2 and 10 m with no irregu-larities in the smooth descent/ascent patterns; A: asymmetri-cal feeding dives performed at depths > 2 m with a distinctdescent phase and then a ragged ascent phase (or the oppo-site); V: pelagic feeding dives, i.e. symmetrical dives per-formed at depths >10 m with no bottom phase; W: symmetri-cal feeding dives with pronounced ragged bottom; U: benthicfeeding dives performed at depths >10 m with flat bottom(Le Boeuf et al. 1988, Williams et al. 1992, Wilson 1995,
Kirkwood & Robertson 1997)
Set Incubation Chick guard CrècheOpen Sea 1 Closed Sea Open Sea 1 Closed Sea Open Sea 1 Open Sea 2 Closed Sea
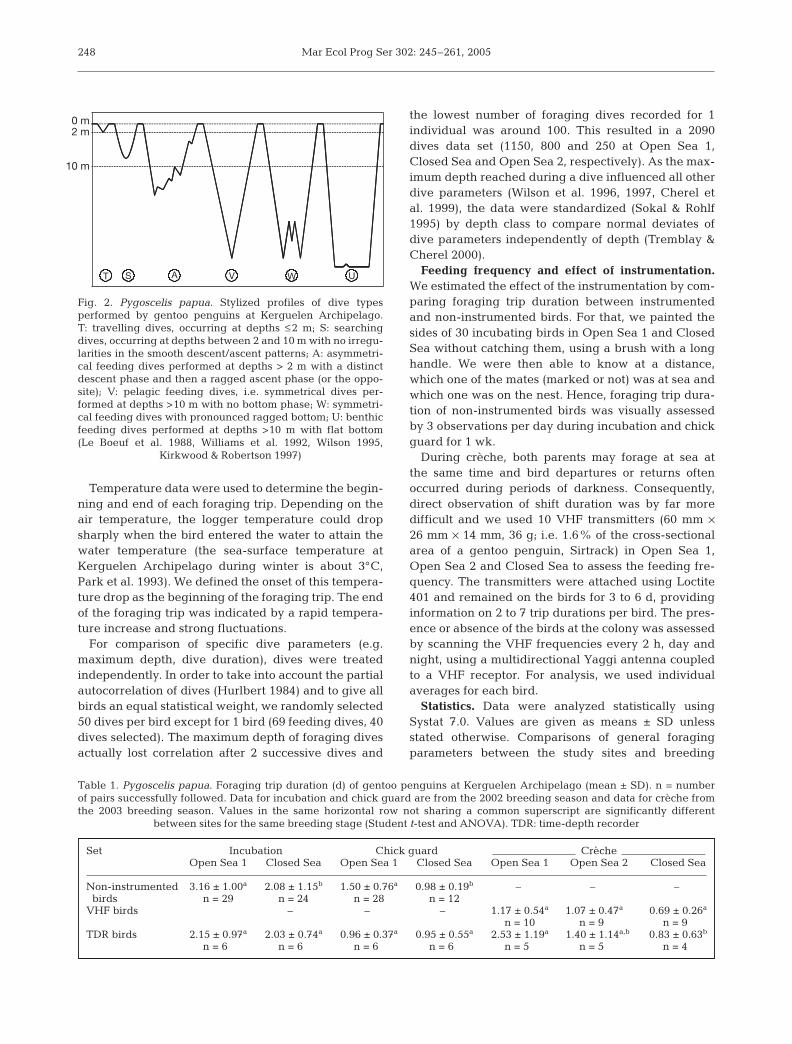
Non-instrumented 3.16 ± 1.00a 2.08 ± 1.15b 1.50 ± 0.76a 0.98 ± 0.19b –. –00 –. birds n = 29 n = 24 n = 28 n = 12
VHF birds –a –a –a 1.17 ± 0.54a 1.07 ± 0.47a,b 0.69 ± 0.26a
n = 10 n = 9.00 n = 90TDR birds 2.15 ± 0.97a 2.03 ± 0.74a 0.96 ± 0.37a 0.95 ± 0.55a 2.53 ± 1.19a 1.40 ± 1.14a,b- 0.83 ± 0.63b
n = 60 n = 60 n = 60 n = 60 n = 50 n = 500. n = 40
Table 1. Pygoscelis papua. Foraging trip duration (d) of gentoo penguins at Kerguelen Archipelago (mean ± SD). n = numberof pairs successfully followed. Data for incubation and chick guard are from the 2002 breeding season and data for crèche fromthe 2003 breeding season. Values in the same horizontal row not sharing a common superscript are significantly different
between sites for the same breeding stage (Student t-test and ANOVA). TDR: time-depth recorder
Lescroël & Bost: Microgeographical variation of foraging in the gentoo penguin
stages were made using a Student’s t-test orANOVA. Dive parameters were compared betweensites with respect to the breeding stage using anested ANOVA with the factor ‘bird’ nested into‘site’. ANOVAs were followed by the Tukey post hoctest when necessary. Normality and homoscedasticitywere tested before using parametric tests. Signifi-cance was assumed for p < 0.05.
RESULTS
Foraging trip duration
Instrumented and non-instrumented birds
The foraging trip duration did not differ significantlybetween instrumented and non-instrumented birds(F1,154 = 1.939, p = 0.166 for all 3 sites) (Table 1).
Among sites
After being equipped in late afternoon, birds de-parted to sea mainly at the end of the subsequentnight at Open Sea 1 and Open Sea 2 (81 and 80% ofdepartures, respectively) and at dawn (31%) or dur-ing the day after (44%) at Closed Sea. At all sites,they returned mainly during the day (57, 60 and94% at Open Sea 1, Open Sea 2 and Closed Sea,respectively).
Gentoo penguins from Open Sea 1 made signifi-cantly longer foraging trips than birds from Closed Sea
during incubation and chick guard (Table 1, F1,53 =13.232, p = 0.001 and F1,40 = 5.228, p = 0.028, respec-tively, data from non-instrumented birds). Concern-ing the crèche period, birds from Open Sea 1 andOpen Sea 2 also tended to forage longer than birdsfrom Closed Sea (F1,28 = 3.055, p = 0.065, data fromVHF birds).
Among breeding stages
At both Open Sea 1 and Closed Sea, trip duration wassignificantly longer during incubation than during otherbreeding stages (F2,95 = 32.895, p < 0.0001 at Open Sea 1and F2,45 = 11.589, p < 0.0001 at Closed Sea) (Table 1).
Satellite tracking data
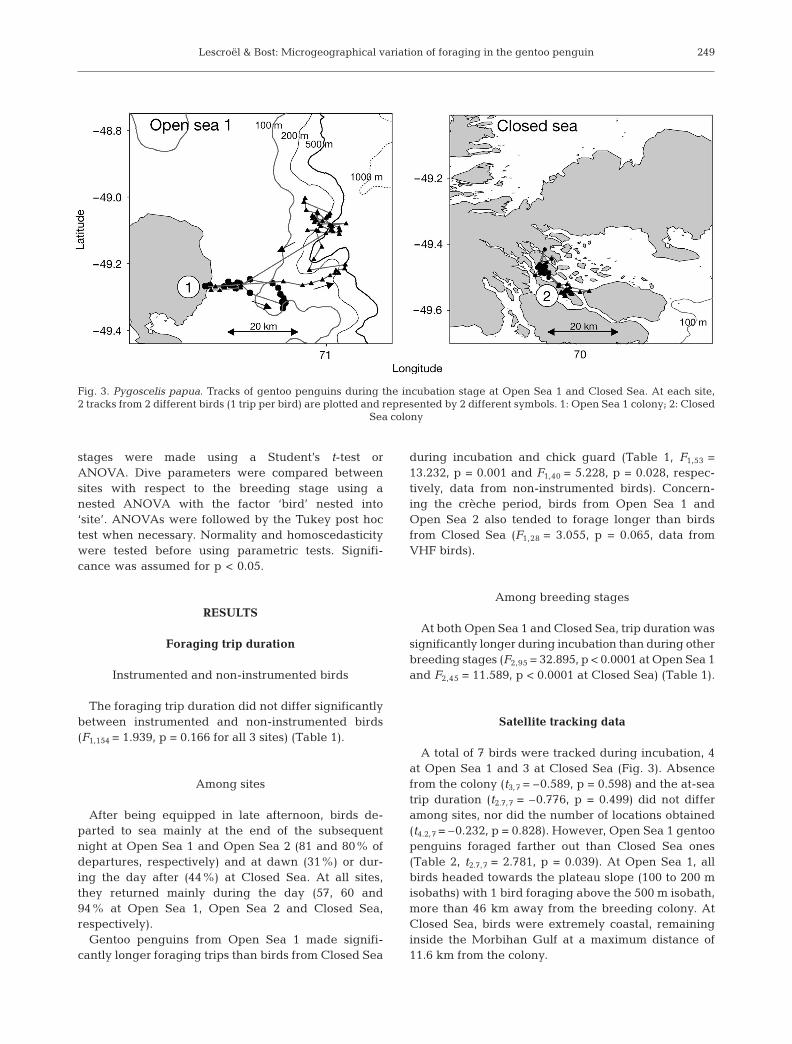
A total of 7 birds were tracked during incubation, 4at Open Sea 1 and 3 at Closed Sea (Fig. 3). Absencefrom the colony (t3,7 = –0.589, p = 0.598) and the at-seatrip duration (t2.7,7 = –0.776, p = 0.499) did not differamong sites, nor did the number of locations obtained(t4.2,7 = –0.232, p = 0.828). However, Open Sea 1 gentoopenguins foraged farther out than Closed Sea ones(Table 2, t2.7,7 = 2.781, p = 0.039). At Open Sea 1, allbirds headed towards the plateau slope (100 to 200 misobaths) with 1 bird foraging above the 500 m isobath,more than 46 km away from the breeding colony. AtClosed Sea, birds were extremely coastal, remaininginside the Morbihan Gulf at a maximum distance of11.6 km from the colony.
249
Fig. 3. Pygoscelis papua. Tracks of gentoo penguins during the incubation stage at Open Sea 1 and Closed Sea. At each site,2 tracks from 2 different birds (1 trip per bird) are plotted and represented by 2 different symbols. 1: Open Sea 1 colony; 2: Closed
Sea colony
Mar Ecol Prog Ser 302: 245–261, 2005
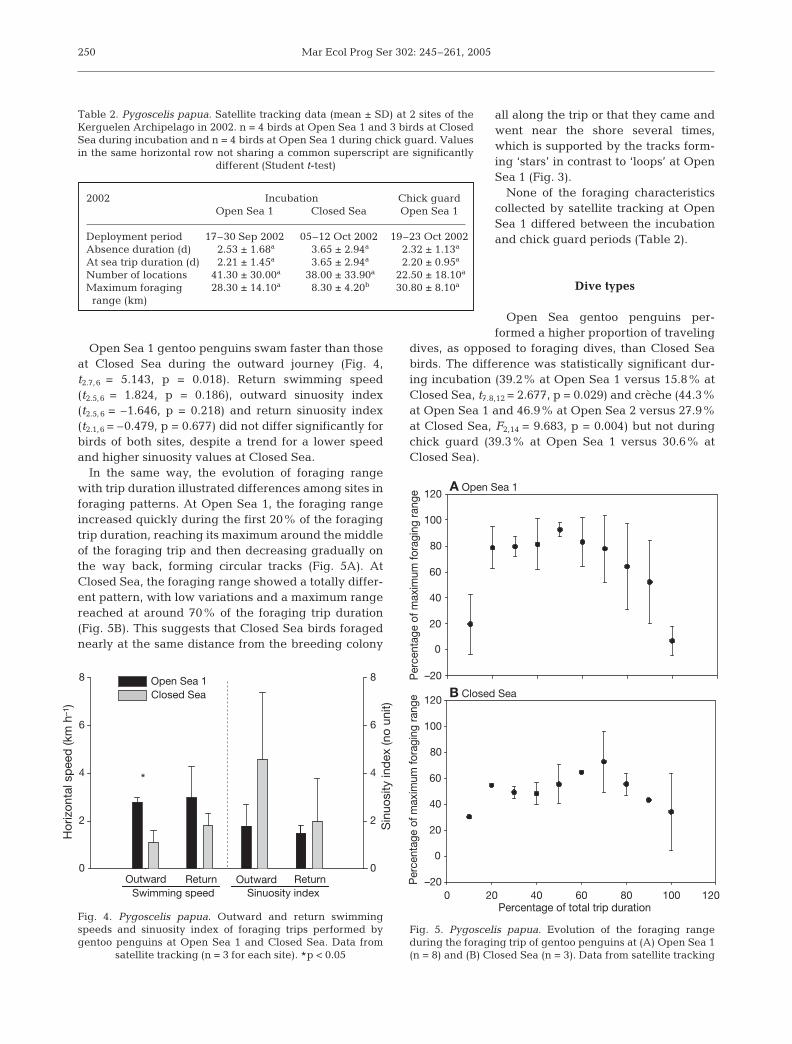
Open Sea 1 gentoo penguins swam faster than thoseat Closed Sea during the outward journey (Fig. 4,t2.7,6 = 5.143, p = 0.018). Return swimming speed(t2.5,6 = 1.824, p = 0.186), outward sinuosity index(t2.5,6 = –1.646, p = 0.218) and return sinuosity index(t2.1,6 = –0.479, p = 0.677) did not differ significantly forbirds of both sites, despite a trend for a lower speedand higher sinuosity values at Closed Sea.
In the same way, the evolution of foraging rangewith trip duration illustrated differences among sites inforaging patterns. At Open Sea 1, the foraging rangeincreased quickly during the first 20% of the foragingtrip duration, reaching its maximum around the middleof the foraging trip and then decreasing gradually onthe way back, forming circular tracks (Fig. 5A). AtClosed Sea, the foraging range showed a totally differ-ent pattern, with low variations and a maximum rangereached at around 70% of the foraging trip duration(Fig. 5B). This suggests that Closed Sea birds foragednearly at the same distance from the breeding colony
all along the trip or that they came andwent near the shore several times,which is supported by the tracks form-ing ‘stars’ in contrast to ‘loops’ at OpenSea 1 (Fig. 3).
None of the foraging characteristicscollected by satellite tracking at OpenSea 1 differed between the incubationand chick guard periods (Table 2).
Dive types
Open Sea gentoo penguins per-formed a higher proportion of traveling
dives, as opposed to foraging dives, than Closed Seabirds. The difference was statistically significant dur-ing incubation (39.2% at Open Sea 1 versus 15.8% atClosed Sea, t7.8,12 = 2.677, p = 0.029) and crèche (44.3%at Open Sea 1 and 46.9% at Open Sea 2 versus 27.9%at Closed Sea, F2,14 = 9.683, p = 0.004) but not duringchick guard (39.3% at Open Sea 1 versus 30.6% atClosed Sea).
250
0
2
4
6
8
0
2
4
6
8Open Sea 1Closed Sea
Outward Return Outward ReturnSwimming speed Sinuosity index
Hor
izon
tal s
pee
d (k
m h
–1)
Sin
uosi
ty in
dex
(no
unit)
*
Fig. 4. Pygoscelis papua. Outward and return swimmingspeeds and sinuosity index of foraging trips performed bygentoo penguins at Open Sea 1 and Closed Sea. Data from
satellite tracking (n = 3 for each site). #p < 0.05
–20
20
40
60
80
100
120
–20
20
40
60
80
100
120
A Open Sea 1
Per
cent
age
of m
axim
um fo
ragi
ng ra
nge
0 20 40 60 80 100 120
B Closed Sea
Percentage of total trip duration
Per
cent
age
of m
axim
um fo
ragi
ng ra
nge
0
0
Fig. 5. Pygoscelis papua. Evolution of the foraging rangeduring the foraging trip of gentoo penguins at (A) Open Sea 1(n = 8) and (B) Closed Sea (n = 3). Data from satellite tracking
2002 Incubation Chick guardOpen Sea 1 Closed Sea Open Sea 1
Deployment period 17–30 Sep 2002 05–12 Oct 2002 19–23 Oct 2002Absence duration (d) 2.53 ± 1.68a 3.65 ± 2.94a 2.32 ± 1.13a
At sea trip duration (d) 2.21 ± 1.45a 3.65 ± 2.94a 2.20 ± 0.95a
Number of locations 41.30 ± 30.00a 38.00 ± 33.90a 22.50 ± 18.10a
Maximum foraging 28.30 ± 14.10a 8.30 ± 4.20b 30.80 ± 8.10a
range (km)
Table 2. Pygoscelis papua. Satellite tracking data (mean ± SD) at 2 sites of theKerguelen Archipelago in 2002. n = 4 birds at Open Sea 1 and 3 birds at ClosedSea during incubation and n = 4 birds at Open Sea 1 during chick guard. Valuesin the same horizontal row not sharing a common superscript are significantly
different (Student t-test)
Lescroël & Bost: Microgeographical variation of foraging in the gentoo penguin
Gentoo penguins were not only diurnal foragers. Asmall proportion of shallow foraging dives (<15 mdepth) was performed during the night. This occurredmore often at Open Sea 1 (16.4, 16.8 and 13.2% during
incubation, chick guard and crèche, respectively) thanat other sites (3.2, 5.3 and 11.9% during incubation,chick guard and crèche at Closed Sea, respectivelyand 4.2% during crèche at Open Sea 2).
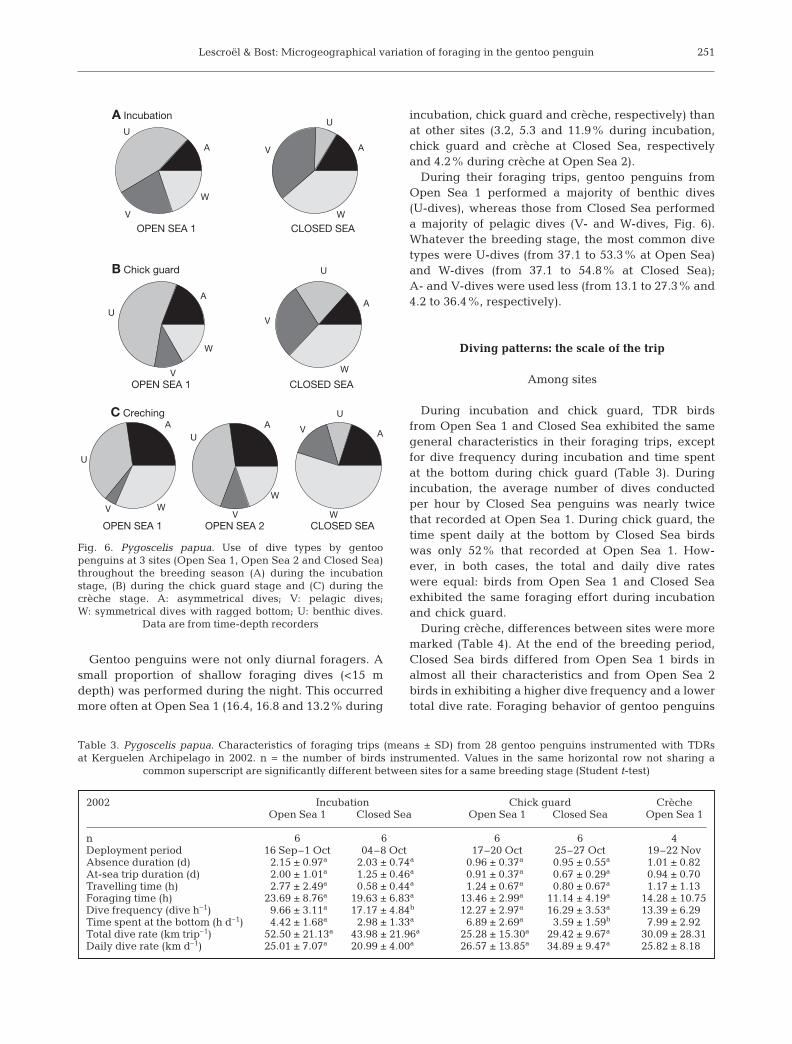
During their foraging trips, gentoo penguins fromOpen Sea 1 performed a majority of benthic dives(U-dives), whereas those from Closed Sea performeda majority of pelagic dives (V- and W-dives, Fig. 6).Whatever the breeding stage, the most common divetypes were U-dives (from 37.1 to 53.3% at Open Sea)and W-dives (from 37.1 to 54.8% at Closed Sea);A- and V-dives were used less (from 13.1 to 27.3% and4.2 to 36.4%, respectively).
Diving patterns: the scale of the trip
Among sites
During incubation and chick guard, TDR birdsfrom Open Sea 1 and Closed Sea exhibited the samegeneral characteristics in their foraging trips, exceptfor dive frequency during incubation and time spentat the bottom during chick guard (Table 3). Duringincubation, the average number of dives conductedper hour by Closed Sea penguins was nearly twicethat recorded at Open Sea 1. During chick guard, thetime spent daily at the bottom by Closed Sea birdswas only 52% that recorded at Open Sea 1. How-ever, in both cases, the total and daily dive rateswere equal: birds from Open Sea 1 and Closed Seaexhibited the same foraging effort during incubationand chick guard.
During crèche, differences between sites were moremarked (Table 4). At the end of the breeding period,Closed Sea birds differed from Open Sea 1 birds inalmost all their characteristics and from Open Sea 2birds in exhibiting a higher dive frequency and a lowertotal dive rate. Foraging behavior of gentoo penguins
251
A Incubation
B Chick guard
C Creching
OPEN SEA 1 CLOSED SEA
OPEN SEA 1 CLOSED SEA
OPEN SEA 1 CLOSED SEAOPEN SEA 2
A
U
W
V
A
U
W
V
A
U
W
V
A
U
W
V
A
U
WV
AU
W
V
A
U
W
V
Fig. 6. Pygoscelis papua. Use of dive types by gentoopenguins at 3 sites (Open Sea 1, Open Sea 2 and Closed Sea)throughout the breeding season (A) during the incubationstage, (B) during the chick guard stage and (C) during thecrèche stage. A: asymmetrical dives; V: pelagic dives;W: symmetrical dives with ragged bottom; U: benthic dives.
Data are from time-depth recorders
2002 Incubation Chick guard CrècheOpen Sea 1 Closed Sea Open Sea 1 Closed Sea Open Sea 1
n 6 6 6 6 4Deployment period 16 Sep–1 Oct 04–8 Oct 17–20 Oct 25–27 Oct 19–22 NovAbsence duration (d) 2.15 ± 0.97a 2.03 ± 0.74a 0.96 ± 0.37a 0.95 ± 0.55a 1.01 ± 0.82At-sea trip duration (d) 2.00 ± 1.01a 1.25 ± 0.46a 0.91 ± 0.37a 0.67 ± 0.29a 0.94 ± 0.70Travelling time (h) 2.77 ± 2.49a 0.58 ± 0.44a 1.24 ± 0.67a 0.80 ± 0.67a 1.17 ± 1.13Foraging time (h) 23.69 ± 8.76a 19.63 ± 6.83a 13.46 ± 2.99a 11.14 ± 4.19a 14.28 ± 10.75Dive frequency (dive h–1) 9.66 ± 3.11a 17.17 ± 4.84b 12.27 ± 2.97a 16.29 ± 3.53a 13.39 ± 6.29Time spent at the bottom (h d–1) 4.42 ± 1.68a 2.98 ± 1.33a 6.89 ± 2.69a 3.59 ± 1.59b 7.99 ± 2.92Total dive rate (km trip–1) 52.50 ± 21.13a 43.98 ± 21.96a 25.28 ± 15.30a 29.42 ± 9.67a 30.09 ± 28.31Daily dive rate (km d–1) 25.01 ± 7.07a 20.99 ± 4.00a 26.57 ± 13.85a 34.89 ± 9.47a 25.82 ± 8.18
Table 3. Pygoscelis papua. Characteristics of foraging trips (means ± SD) from 28 gentoo penguins instrumented with TDRsat Kerguelen Archipelago in 2002. n = the number of birds instrumented. Values in the same horizontal row not sharing a
common superscript are significantly different between sites for a same breeding stage (Student t-test)
Mar Ecol Prog Ser 302: 245–261, 2005
from Open Sea 1 and Open Sea 2 didnot differ during crèche except for theforaging time, which was greater atOpen Sea 1. Due to their much shorterforaging trips and despite their higherdive frequency, Closed Sea birds ex-hibited a lower total dive rate. Never-theless, the daily dive rate did not differamong the 3 sites, so birds would makeabout the same foraging effort evenduring crèche.
Among breeding stages
At both Open Sea 1 and Closed Seasites, most parameters remained identi-cal between stages (Tables 3 & 4).Closed Sea birds, however, reducedtheir foraging time (t10,12 = –2.596, p =0.027) and increased their foragingeffort through their daily dive rate(t6.7,12 = 3.312, p = 0.014) between incu-bation and chick guard.
Among years
At Open Sea 1, foraging trips under-taken by TDR birds lasted longerduring crèche in 2003 than crèche in2002 (Tables 3 & 4). This was reflectedby longer absences (t7,9 = –2.457, p =0.044), at-sea trip durations (t7,9 =–3.287, p = 0.013), and travelling (t6,9 =–2.914, p = 0.027) and foraging (t7,9 =–2.591, p = 0.036) times in 2003. Never-theless, there was no difference in divefrequency, total time spent daily at thebottom, or total or daily dive rate.
Diving patterns: the scale of the dive
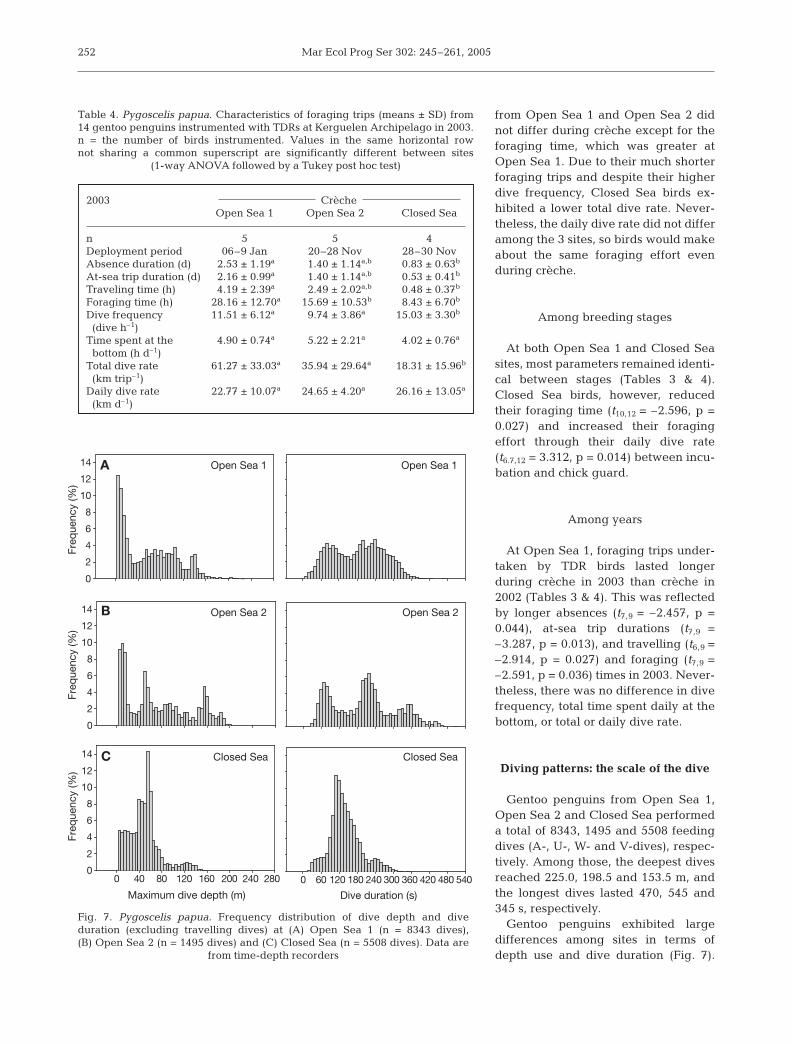
Gentoo penguins from Open Sea 1,Open Sea 2 and Closed Sea performeda total of 8343, 1495 and 5508 feedingdives (A-, U-, W- and V-dives), respec-tively. Among those, the deepest divesreached 225.0, 198.5 and 153.5 m, andthe longest dives lasted 470, 545 and345 s, respectively.
Gentoo penguins exhibited largedifferences among sites in terms ofdepth use and dive duration (Fig. 7).
252
2003 CrècheOpen Sea 1 Open Sea 2 Closed Sea
n 5 5 4Deployment period 06–9 Jan 20–28 Nov 28–30 NovAbsence duration (d) 2.53 ± 1.19a 1.40 ± 1.14a,b 0.83 ± 0.63b
At-sea trip duration (d) 2.16 ± 0.99a 1.40 ± 1.14a,b 0.53 ± 0.41b
Traveling time (h) 4.19 ± 2.39a 2.49 ± 2.02a,b 0.48 ± 0.37b
Foraging time (h) 28.16 ± 12.70a 15.69 ± 10.53b 8.43 ± 6.70b
Dive frequency 11.51 ± 6.12a 9.74 ± 3.86a 15.03 ± 3.30b
(dive h–1)Time spent at the 4.90 ± 0.74a 5.22 ± 2.21a 4.02 ± 0.76a
bottom (h d–1)Total dive rate 61.27 ± 33.03a 35.94 ± 29.64a 18.31 ± 15.96b
(km trip–1)Daily dive rate 22.77 ± 10.07a 24.65 ± 4.20a 26.16 ± 13.05a
(km d–1)
Table 4. Pygoscelis papua. Characteristics of foraging trips (means ± SD) from14 gentoo penguins instrumented with TDRs at Kerguelen Archipelago in 2003.n = the number of birds instrumented. Values in the same horizontal rownot sharing a common superscript are significantly different between sites
(1-way ANOVA followed by a Tukey post hoc test)
0
2
4
6
8
10
12
14
Maximum dive depth (m)
0 40 80 120 160 200 240 280
Freq
uenc
y (%
)Fr
eque
ncy
(%)
Freq
uenc
y (%
)
0
2
4
6
8
10
12
14
Dive duration (s)
0 60 120 180 240 300 360 420 480 540
Closed Sea Closed Sea
Open Sea 1 Open Sea 1
0
2
4
6
8
10
12
14 Open Sea 2 Open Sea 2
A
B
C
Fig. 7. Pygoscelis papua. Frequency distribution of dive depth and diveduration (excluding travelling dives) at (A) Open Sea 1 (n = 8343 dives),(B) Open Sea 2 (n = 1495 dives) and (C) Closed Sea (n = 5508 dives). Data are
from time-depth recorders
Lescroël & Bost: Microgeographical variation of foraging in the gentoo penguin
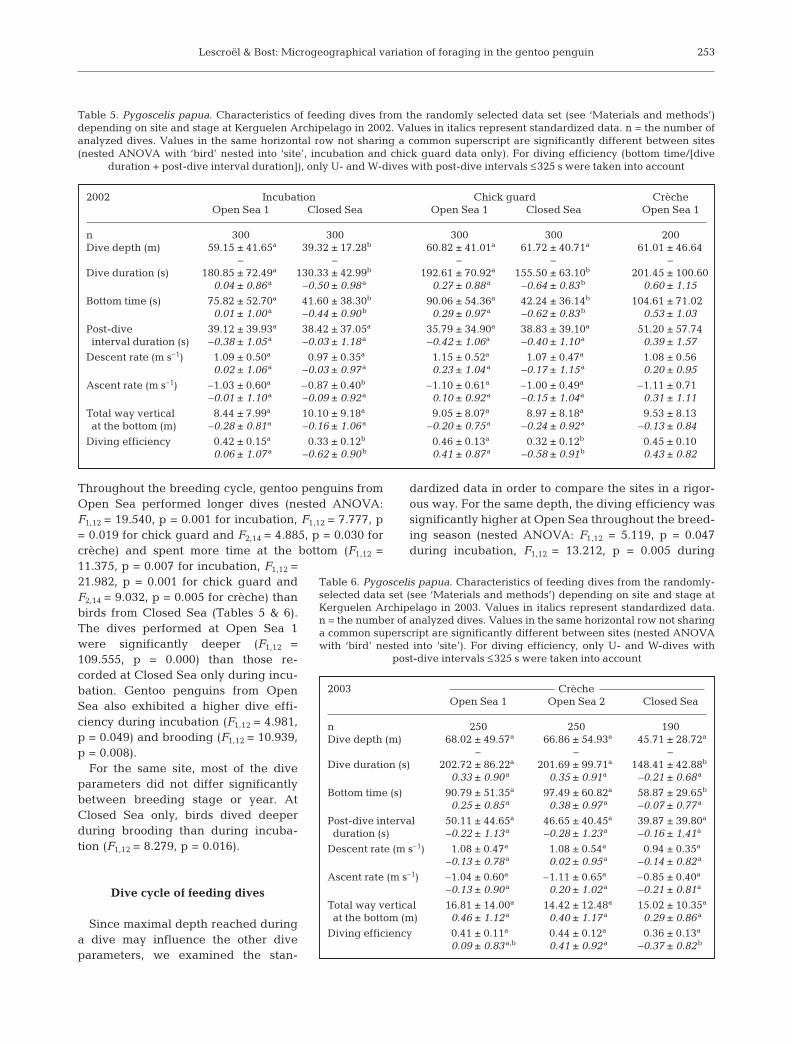
Throughout the breeding cycle, gentoo penguins fromOpen Sea performed longer dives (nested ANOVA:F1,12 = 19.540, p = 0.001 for incubation, F1,12 = 7.777, p= 0.019 for chick guard and F2,14 = 4.885, p = 0.030 forcrèche) and spent more time at the bottom (F1,12 =11.375, p = 0.007 for incubation, F1,12 =21.982, p = 0.001 for chick guard andF2,14 = 9.032, p = 0.005 for crèche) thanbirds from Closed Sea (Tables 5 & 6).The dives performed at Open Sea 1were significantly deeper (F1,12 =109.555, p = 0.000) than those re-corded at Closed Sea only during incu-bation. Gentoo penguins from OpenSea also exhibited a higher dive effi-ciency during incubation (F1,12 = 4.981,p = 0.049) and brooding (F1,12 = 10.939,p = 0.008).
For the same site, most of the diveparameters did not differ significantlybetween breeding stage or year. AtClosed Sea only, birds dived deeperduring brooding than during incuba-tion (F1,12 = 8.279, p = 0.016).
Dive cycle of feeding dives
Since maximal depth reached duringa dive may influence the other diveparameters, we examined the stan-
dardized data in order to compare the sites in a rigor-ous way. For the same depth, the diving efficiency wassignificantly higher at Open Sea throughout the breed-ing season (nested ANOVA: F1,12 = 5.119, p = 0.047during incubation, F1,12 = 13.212, p = 0.005 during
253
2002 Incubation Chick guard CrècheOpen Sea 1 Closed Sea Open Sea 1 Closed Sea Open Sea 1
n 300 300 300 300 200Dive depth (m) 59.15 ± 41.65a 39.32 ± 17.28b 60.82 ± 41.01a 61.72 ± 40.71a 61.01 ± 46.64
0– 0– 0– 0– 0–Dive duration (s) 180.85 ± 72.49a 130.33 ± 42.99b 192.61 ± 70.92a 155.50 ± 63.10b 201.45 ± 100.60
0.04 ± 0.86a –0.50 ± 0.98a 0.27 ± 0.88a –0.64 ± 0.83b 0.60 ± 1.15
Bottom time (s) 75.82 ± 52.70a 41.60 ± 38.30b 90.06 ± 54.36a 42.24 ± 36.14b 104.61 ± 71.020.01 ± 1.00a –0.44 ± 0.90b 0.29 ± 0.97a –0.62 ± 0.83b 0.53 ± 1.03
Post-dive 39.12 ± 39.93a 38.42 ± 37.05a 35.79 ± 34.90a 38.83 ± 39.10a 51.20 ± 57.74interval duration (s) –0.38 ± 1.05a –0.03 ± 1.18a –0.42 ± 1.06a –0.40 ± 1.10a 0.39 ± 1.57
Descent rate (m s–1) 1.09 ± 0.50a 0.97 ± 0.35a 1.15 ± 0.52a 1.07 ± 0.47a 1.08 ± 0.560.02 ± 1.06a –0.03 ± 0.97a 0.23 ± 1.04a –0.17 ± 1.15a 0.20 ± 0.95
Ascent rate (m s–1) –1.03 ± 0.60a –0.87 ± 0.40b –1.10 ± 0.61a –1.00 ± 0.49a –1.11 ± 0.71–0.01 ± 1.10a –0.09 ± 0.92a 0.10 ± 0.92a –0.15 ± 1.04a 0.31 ± 1.11
Total way vertical 8.44 ± 7.99a 10.10 ± 9.18a 9.05 ± 8.07a 8.97 ± 8.18a 9.53 ± 8.13at the bottom (m) –0.28 ± 0.81a –0.16 ± 1.06a –0.20 ± 0.75a –0.24 ± 0.92a –0.13 ± 0.84
Diving efficiency 0.42 ± 0.15a 0.33 ± 0.12b 0.46 ± 0.13a 0.32 ± 0.12b 0.45 ± 0.100.06 ± 1.07a –0.62 ± 0.90b 0.41 ± 0.87a –0.58 ± 0.91b 0.43 ± 0.82
Table 5. Pygoscelis papua. Characteristics of feeding dives from the randomly selected data set (see ‘Materials and methods’)depending on site and stage at Kerguelen Archipelago in 2002. Values in italics represent standardized data. n = the number ofanalyzed dives. Values in the same horizontal row not sharing a common superscript are significantly different between sites(nested ANOVA with ‘bird’ nested into ‘site’, incubation and chick guard data only). For diving efficiency (bottom time/[dive
duration + post-dive interval duration]), only U- and W-dives with post-dive intervals ≤ 325 s were taken into account
2003 CrècheOpen Sea 1 Open Sea 2 Closed Sea
n 250 250 190Dive depth (m) 68.02 ± 49.57a 66.86 ± 54.93a 45.71 ± 28.72a
0– 0– 0–Dive duration (s) 202.72 ± 86.22a 201.69 ± 99.71a 148.41 ± 42.88b
0.33 ± 0.90a 0.35 ± 0.91a –0.21 ± 0.68a
Bottom time (s) 90.79 ± 51.35a 97.49 ± 60.82a 58.87 ± 29.65b
0.25 ± 0.85a 0.38 ± 0.97a –0.07 ± 0.77a
Post-dive interval 50.11 ± 44.65a 46.65 ± 40.45a 39.87 ± 39.80a
duration (s) –0.22 ± 1.13a –0.28 ± 1.23a –0.16 ± 1.41a
Descent rate (m s–1) 1.08 ± 0.47a 1.08 ± 0.54a 0.94 ± 0.35a
–0.13 ± 0.78a 0.02 ± 0.95a –0.14 ± 0.82a
Ascent rate (m s–1) –1.04 ± 0.60a –1.11 ± 0.65a –0.85 ± 0.40a
–0.13 ± 0.90a 0.20 ± 1.02a –0.21 ± 0.81a
Total way vertical 16.81 ± 14.00a 14.42 ± 12.48a 15.02 ± 10.35a
at the bottom (m) 0.46 ± 1.12a 0.40 ± 1.17a 0.29 ± 0.86a
Diving efficiency 0.41 ± 0.11a 0.44 ± 0.12a 0.36 ± 0.13a
0.09 ± 0.83a,b 0.41 ± 0.92a –0.37 ± 0.82b
Table 6. Pygoscelis papua. Characteristics of feeding dives from the randomly-selected data set (see ‘Materials and methods’) depending on site and stage atKerguelen Archipelago in 2003. Values in italics represent standardized data.n = the number of analyzed dives. Values in the same horizontal row not sharinga common superscript are significantly different between sites (nested ANOVAwith ‘bird’ nested into ‘site’). For diving efficiency, only U- and W-dives with
post-dive intervals ≤ 325 s were taken into account
Mar Ecol Prog Ser 302: 245–261, 2005
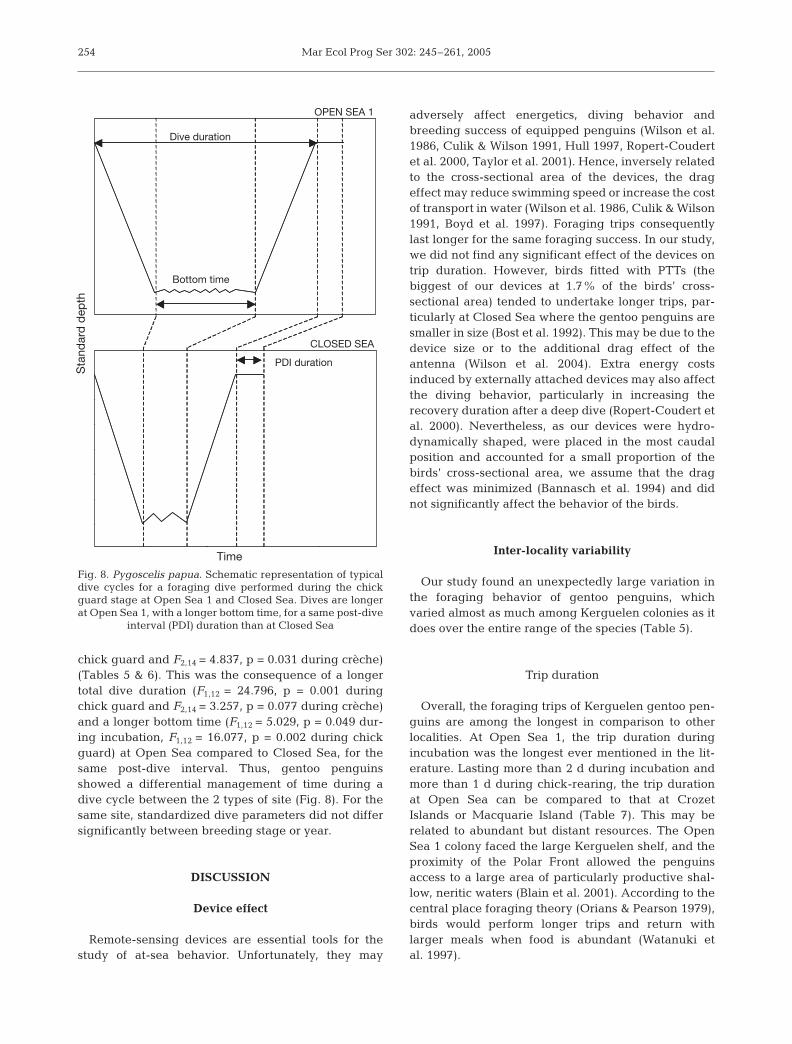
chick guard and F2,14 = 4.837, p = 0.031 during crèche)(Tables 5 & 6). This was the consequence of a longertotal dive duration (F1,12 = 24.796, p = 0.001 duringchick guard and F2,14 = 3.257, p = 0.077 during crèche)and a longer bottom time (F1,12 = 5.029, p = 0.049 dur-ing incubation, F1,12 = 16.077, p = 0.002 during chickguard) at Open Sea compared to Closed Sea, for thesame post-dive interval. Thus, gentoo penguinsshowed a differential management of time during adive cycle between the 2 types of site (Fig. 8). For thesame site, standardized dive parameters did not differsignificantly between breeding stage or year.
DISCUSSION
Device effect
Remote-sensing devices are essential tools for thestudy of at-sea behavior. Unfortunately, they may
adversely affect energetics, diving behavior andbreeding success of equipped penguins (Wilson et al.1986, Culik & Wilson 1991, Hull 1997, Ropert-Coudertet al. 2000, Taylor et al. 2001). Hence, inversely relatedto the cross-sectional area of the devices, the drageffect may reduce swimming speed or increase the costof transport in water (Wilson et al. 1986, Culik & Wilson1991, Boyd et al. 1997). Foraging trips consequentlylast longer for the same foraging success. In our study,we did not find any significant effect of the devices ontrip duration. However, birds fitted with PTTs (thebiggest of our devices at 1.7% of the birds’ cross-sectional area) tended to undertake longer trips, par-ticularly at Closed Sea where the gentoo penguins aresmaller in size (Bost et al. 1992). This may be due to thedevice size or to the additional drag effect of theantenna (Wilson et al. 2004). Extra energy costsinduced by externally attached devices may also affectthe diving behavior, particularly in increasing therecovery duration after a deep dive (Ropert-Coudert etal. 2000). Nevertheless, as our devices were hydro-dynamically shaped, were placed in the most caudalposition and accounted for a small proportion of thebirds’ cross-sectional area, we assume that the drageffect was minimized (Bannasch et al. 1994) and didnot significantly affect the behavior of the birds.
Inter-locality variability
Our study found an unexpectedly large variation inthe foraging behavior of gentoo penguins, whichvaried almost as much among Kerguelen colonies as itdoes over the entire range of the species (Table 5).
Trip duration
Overall, the foraging trips of Kerguelen gentoo pen-guins are among the longest in comparison to otherlocalities. At Open Sea 1, the trip duration duringincubation was the longest ever mentioned in the lit-erature. Lasting more than 2 d during incubation andmore than 1 d during chick-rearing, the trip durationat Open Sea can be compared to that at CrozetIslands or Macquarie Island (Table 7). This may berelated to abundant but distant resources. The OpenSea 1 colony faced the large Kerguelen shelf, and theproximity of the Polar Front allowed the penguinsaccess to a large area of particularly productive shal-low, neritic waters (Blain et al. 2001). According to thecentral place foraging theory (Orians & Pearson 1979),birds would perform longer trips and return withlarger meals when food is abundant (Watanuki etal. 1997).
254
Dive duration
Bottom time
PDI duration
OPEN SEA 1
CLOSED SEA
Time
Sta
ndar
d d
epth
Fig. 8. Pygoscelis papua. Schematic representation of typicaldive cycles for a foraging dive performed during the chickguard stage at Open Sea 1 and Closed Sea. Dives are longerat Open Sea 1, with a longer bottom time, for a same post-dive
interval (PDI) duration than at Closed Sea

Lescroël & Bost: Microgeographical variation of foraging in the gentoo penguin
The shorter trips at Closed Sea are halfway betweenthose exhibited at the northern and southern localities.Closed Sea birds indeed foraged for 2 d during incuba-tion but then performed daily trips during chick guard(0.98 d) and crèche (0.69 d), whereas birds from theAntarctic Peninsula, South Georgia and South Shet-land Islands made even shorter trips, from 2 to 12 h(Table 7). The short trips performed by Closed Seabirds were probably due to the proximity of abundantmacrozooplankton species (Bocher et al. 2001). Forinstance, Parathemisto gaudichaudii occurs in highdensities in the Morbihan Gulf, and particularly in itswestern part (Bocher et al. 2001, Bost et al. 1994);therefore, around the Closed Sea colony. In this way,the strong dependence shown at Closed Sea on 2 crus-tacean species Euphausia vallentini and P. gau-dichaudii (Lescroël et al. 2004) is similar to thatobserved at Antarctic localities on Antarctic krillEuphausia superba.
At-sea distribution
In foraging nearly 20 km away from their breedinggrounds and as far as 46 km away, Open Sea birds arehalfway between those from Macquarie Island, andthose from Crozet and Marion Islands (Table 7).Gentoo penguins from Closed Sea, however, exhibitedthe smallest incubation range of all localities (3.6 to11.6 km), being similar to those at the southernmostlocalities during chick rearing (Antarctic Peninsula,South Shetland and South Georgia Islands) (Table 7).
Diving behavior
During their trips, Open Sea birds dived as fre-quently as birds from Macquarie and South GeorgiaIslands, i.e. around 10 dives per hour. Closed Sea birdsdived more often, around 15 dives per hour as at the
255
Breeding stage Locality Trip duration Foraging Dive frequency Dive Dive Diet Sourcea
(d) range (km) (dive h–1) depth (m) duration (s)
Incubation Crozet Is. 2.4 (130) – – – Cr AMarion Is. 1–2 (54–108) – – – Fi/Cr B
Kerguelen Is. COpen Sea 1 3.16 28.3 (46.0) 9.7 59.1 (225) 181 (345) FiClosed Sea 2.08 8.3 (11.6) 17.2 39.3 (108) 130 (275) CrFalkland Is. – – – – – Fi/Cr D
South Georgia Is. 1.4 (76) – – – Cr or Fi EAntarctic Peninsula 1.8 50 (200) – – – Cr F
Chick guard Crozet Is. 1.2 (65) – 25.3 (210) 203 Cr/Fi AMarion Is. 0.34–0.99 7 – – – Fi/Cr B
Kerguelen Is. COpen Sea 1 1.5 30.8 (37.6) 12.3 60.8 (187) 193 (344) FiClosed Sea 0.98 – 16.3 61.7 (153) 155 (295) CrHeard Is. – – – – – Fi G
Macquarie Is. 0.52–1.70 12.7–39.1 9.5 89 (212) 210 (384) Fi HSouth Georgia Is. 0.26–0.50 2.4–4.1 (35) 10.9 71.4–98.2b 144–168 Cr or Fi ESouth Shetland Is. 0.19–0.52 17 (24) 14.7 – 128 Cr I
Antarctic Peninsula 0.08–0.29 5 (16) 18.2 34.7 (107) (225) Cr F
Crèche Kerguelen Is. COpen Sea 1 1.17 – 12.4 65 (213) 202 (470) FiOpen Sea 2 1.07 5.5–21 9.7 66.9 (198) 202 (440) Fi/CrClosed Sea 0.69 – 15.0 45.7 (146) 148 (278) Cr
aKey to sources. A: Bost & Jouventin (1990), Bost et al. (1994), Ridoux (1994); B: Van Zinderen Bakker (1971), Adams & Brown(1983), Adams & Klages (1989), Brown et al. (1990); C: Lescroël et al. (2004), this study; D: Clausen & Pütz (2002); E: Croxall& Prince (1980b, 1987), Croxall et al. (1988), Kato et al. (1991), Williams (1991), Williams et al. (1992), Wilson et al. (1998);F: Cordier et al. (1983), Wilson et al. (1996); G: Klages et al. (1990); H: Robinson & Hindell (1996;) I: Volkman et al. (1980),Trivelpiece et al. (1986, 1987)
bMean depth was calculated by the authors for dives deeper than 30 m
Table 7. Pygoscelis papua. Foraging characteristics and diet of the gentoo penguin at different breeding localities, from northto south of the breeding range (mean with maximal values in parentheses). Rearing = Chick guard + Crèche. For the diet, weindicated the dominant taxon by mass. Cr: Crustaceans; Fi: Fish; Cr/Fi: mixed diet dominated by crustaceans; Fi/Cr: mixed
diet dominated by fish
Mar Ecol Prog Ser 302: 245–261, 2005
Antarctic Peninsula and South Shetland Islands. AtOpen Sea 1, we recorded the deepest (225 m) and thelongest (470 s) dives ever reported for a gentoo pen-guin.
There was a large variation in the foraging behavior atKerguelen Archipelago with Open Sea penguins tend-ing to behave like those from the northern localities,whereas Closed Sea penguins behaved more like thosefrom the southern localities. Interestingly, Open Seapenguins fed predominantly on fish while the ClosedSea ones favored crustaceans most of the time (Table 7).Thus, the foraging behavior of the gentoo penguin isnot strictly set for the species and may vary as a functionof locality and probably of prey availability.
Intra-locality variability
Such diversity on the scale of the Kerguelen Archi-pelago may be linked to the high diversity of theoceanographic conditions in the penguin feedingareas. Since the foraging ecology of the gentoo pen-guin was investigated at several sites during the sameseason following the same methodology, we can there-fore exclude any year-season confounding effect in ourintersite comparisons.
At-sea distribution
At the Open Sea sites, gentoo penguins departed be-fore the end of the night, possibly to arrive at their re-mote feeding grounds when the luminosity enables themto dive deeply. Accordingly, most of the tracked birds ar-rived near their maximal foraging range between 11:00and 14:00 h (local time). They foraged much farther thanClosed Sea birds, as reflected by the high proportion oftravelling dives, and swam faster to get to their feedingareas. At Open Sea 1, gentoo penguins undertook directcircular tracks towards the shelf slope where they founda predictable resource, namely nototheniid fish and theIcefish Champsocephalus gunnari. These species arepreferentially located on the eastern part of the shelf(Duhamel 1987, 1993), known to be an area of high fishabundance (Guinet et al. 2001), and form the main itemsin the gentoo penguin diet at Open Sea 1 (Lescroël et al.2004). At Open Sea 2, we did not collect data on the pen-guin at-sea distribution but birds frequently diveddeeper than 150 m depth, which corresponds to at least21 km away from the colony. Thus, Open Sea 2 penguinsprobably also foraged on the shelf slope (data from theService Hydrographique et Océanographique de laMarine, France).
Closed Sea birds departed later, mainly during day-light hours, to undertake short sinuous trips in the
vicinity of the colony. They took much more sinuoustracks, traveling around the colony in search of theirmain prey, the very mobile and patchy swarms ofEuphausia vallentini and Parathemisto gaudichaudii(Lescroël et al. 2004).
Short foraging trips such those performed at ClosedSea are only possible when prey availability near thecolony is sufficiently high (Wilson 1995). This tacticwas possible because of the high productivity of theMorbihan Gulf (Razouls et al. 1997). Available crus-tacean biomass is indeed particularly high in this bay,and dominated in all seasons by Parathemisto gau-dichaudii (Bocher et al. 2001, P. Mayzaud pers. comm.).Birds may also have been limited by landmasses butthis is unlikely to occur as the open ocean was located<15 km away from the colony. On the other hand, thegreater distances travelled by Open Sea penguins maybe a consequence of (1) the exploitation of distant butabundant and predictable resources or (2) the deple-tion of resources or the competition for resourcesaround the breeding colony (Ashmole & Ashmole1967). Due to the influence of the Polar Front (Fig. 1),the east of the archipelago is a very productive area(Blain et al. 2001) where other top predators, likeblack-browed albatrosses and fur seals, forage inten-sively (Guinet et al. 2001, Pinaud & Weimerskirch2002). Furthermore, the Icefish Champsocephalusgunnari and the nototheniid Lepidonotothen squam-ifrons, 2 important species in the gentoo penguin dietat Open Sea (Lescroël et al. 2004), are preferentiallyand abundantly located on the eastern part of the shelf(Duhamel 1993). Since all equipped gentoo penguinsheaded their trips towards the eastern shelf slope, thefirst hypothesis is likely to be valid. However, wecannot exclude an additional effect of competitionbecause, although our study colonies had similar sizes,the density of gentoo penguins is higher on the north-eastern coast of the archipelago than inside the Morbi-han Gulf (around 175 versus 11 individuals per kilo-meter of coast, respectively) (C. A. Bost & A. Lescroëlunpubl. data). In this latter case, increased distanceswould increase the probability of prey encounters(Wilson & Wilson 1990). Nevertheless, there are alsonumerous colonies of potential competitors such asthe Rockhopper penguins Eudyptes chrysocome filholiand Kerguelen shags Phalacrocorax atriceps verruco-sus in the Morbihan Gulf, which are missing aroundOpen Sea 1 (Weimerskirch et al. 1989).
Diving behaviour
Penguins are mainly visual predators (Wilson 1995).Accordingly, the birds from both Open Sea and ClosedSea confined most of their diving activity to the day-
256
Lescroël & Bost: Microgeographical variation of foraging in the gentoo penguin
light hours but also dived at very shallow depths dur-ing the night, as reported at Macquarie Island (Robin-son & Hindell 1996). However, at Open Sea 1, gentoopenguins performed dives much more frequently atnight than at the other 2 sites. This observation caneasily be explained by the longer trip duration, at leastduring incubation and chick guard, leading to morefrequent overnight trips. Thus, the proportion of thesenight dives at Open Sea 1 tended to decrease betweenchick guard and crèche. Whether night diving mayrepresent an additional constraint for visual predators,shallow dives during the night may allow the birds tocatch pelagic prey such as squids, near the surface,during their nyctemeral migration (Weimerskirch et al.1986, Weimerskirch & Wilson 1992, Croxall & Prince1994).
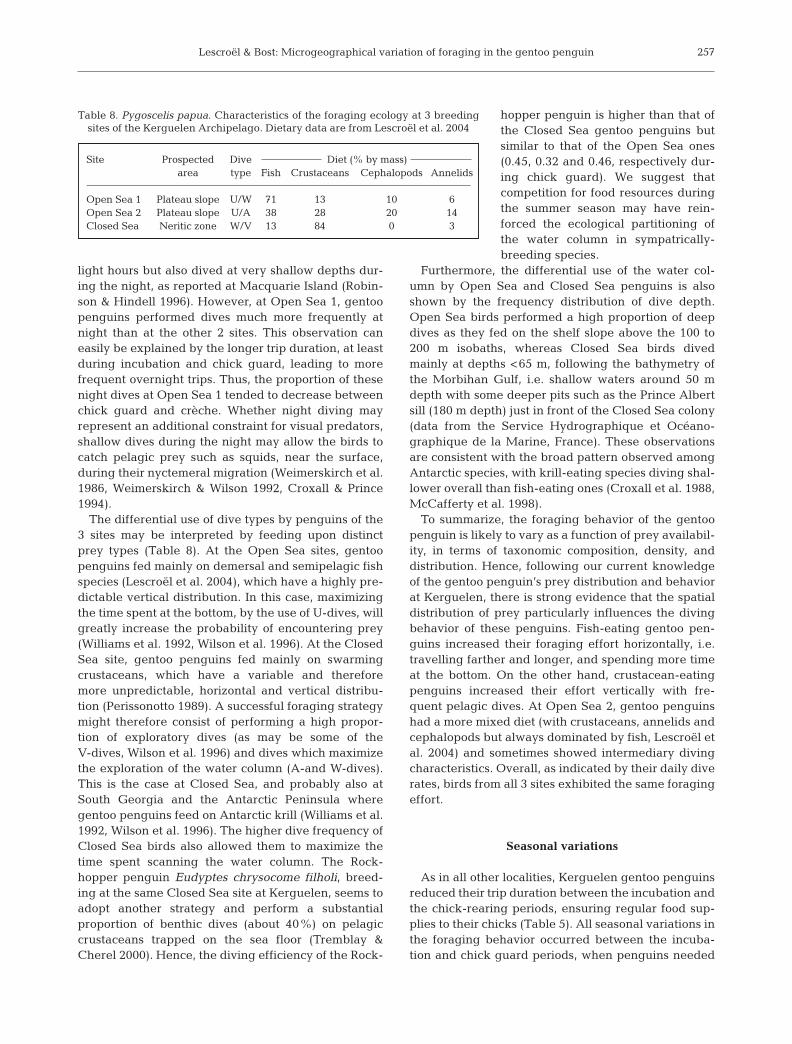
The differential use of dive types by penguins of the3 sites may be interpreted by feeding upon distinctprey types (Table 8). At the Open Sea sites, gentoopenguins fed mainly on demersal and semipelagic fishspecies (Lescroël et al. 2004), which have a highly pre-dictable vertical distribution. In this case, maximizingthe time spent at the bottom, by the use of U-dives, willgreatly increase the probability of encountering prey(Williams et al. 1992, Wilson et al. 1996). At the ClosedSea site, gentoo penguins fed mainly on swarmingcrustaceans, which have a variable and thereforemore unpredictable, horizontal and vertical distribu-tion (Perissonotto 1989). A successful foraging strategymight therefore consist of performing a high propor-tion of exploratory dives (as may be some of theV-dives, Wilson et al. 1996) and dives which maximizethe exploration of the water column (A-and W-dives).This is the case at Closed Sea, and probably also atSouth Georgia and the Antarctic Peninsula wheregentoo penguins feed on Antarctic krill (Williams et al.1992, Wilson et al. 1996). The higher dive frequency ofClosed Sea birds also allowed them to maximize thetime spent scanning the water column. The Rock-hopper penguin Eudyptes chrysocome filholi, breed-ing at the same Closed Sea site at Kerguelen, seems toadopt another strategy and perform a substantialproportion of benthic dives (about 40%) on pelagiccrustaceans trapped on the sea floor (Tremblay &Cherel 2000). Hence, the diving efficiency of the Rock-
hopper penguin is higher than that ofthe Closed Sea gentoo penguins butsimilar to that of the Open Sea ones(0.45, 0.32 and 0.46, respectively dur-ing chick guard). We suggest thatcompetition for food resources duringthe summer season may have rein-forced the ecological partitioning ofthe water column in sympatrically-breeding species.
Furthermore, the differential use of the water col-umn by Open Sea and Closed Sea penguins is alsoshown by the frequency distribution of dive depth.Open Sea birds performed a high proportion of deepdives as they fed on the shelf slope above the 100 to200 m isobaths, whereas Closed Sea birds divedmainly at depths <65 m, following the bathymetry ofthe Morbihan Gulf, i.e. shallow waters around 50 mdepth with some deeper pits such as the Prince Albertsill (180 m depth) just in front of the Closed Sea colony(data from the Service Hydrographique et Océano-graphique de la Marine, France). These observationsare consistent with the broad pattern observed amongAntarctic species, with krill-eating species diving shal-lower overall than fish-eating ones (Croxall et al. 1988,McCafferty et al. 1998).
To summarize, the foraging behavior of the gentoopenguin is likely to vary as a function of prey availabil-ity, in terms of taxonomic composition, density, anddistribution. Hence, following our current knowledgeof the gentoo penguin’s prey distribution and behaviorat Kerguelen, there is strong evidence that the spatialdistribution of prey particularly influences the divingbehavior of these penguins. Fish-eating gentoo pen-guins increased their foraging effort horizontally, i.e.travelling farther and longer, and spending more timeat the bottom. On the other hand, crustacean-eatingpenguins increased their effort vertically with fre-quent pelagic dives. At Open Sea 2, gentoo penguinshad a more mixed diet (with crustaceans, annelids andcephalopods but always dominated by fish, Lescroël etal. 2004) and sometimes showed intermediary divingcharacteristics. Overall, as indicated by their daily diverates, birds from all 3 sites exhibited the same foragingeffort.
Seasonal variations
As in all other localities, Kerguelen gentoo penguinsreduced their trip duration between the incubation andthe chick-rearing periods, ensuring regular food sup-plies to their chicks (Table 5). All seasonal variations inthe foraging behavior occurred between the incuba-tion and chick guard periods, when penguins needed
257
Site Prospected Dive Diet (% by mass)area type Fish Crustaceans Cephalopods Annelids
Open Sea 1 Plateau slope U/W 71 13 10 6Open Sea 2 Plateau slope U/A 38 28 20 14Closed Sea Neritic zone W/V 13 84 0 3
Table 8. Pygoscelis papua. Characteristics of the foraging ecology at 3 breedingsites of the Kerguelen Archipelago. Dietary data are from Lescroël et al. 2004
Mar Ecol Prog Ser 302: 245–261, 2005
to adjust the amount of food needed to feed chicks,which was obviously higher than for self-maintenance.There was no discernable adjustment of trip durationbetween rearing young versus older chicks as wasfound at Macquarie Island (Robinson & Hindell 1996).Nevertheless, during the crèche stage, both parentsforaged at the same time and no longer relieved eachother, potentially increasing the feeding frequency oftheir chicks (Trivelpiece et al. 1987).
At Closed Sea, gentoo penguins increased their dailydive rate compared to the incubation period by divingdeeper during chick guard for a same dive frequency.At Open Sea 1, gentoo penguins tended to increasetheir dive frequency between incubation and chickguard. Thus, at both sites, birds increased their forag-ing effort, mainly in the vertical dimension. This maybe related to the decrease of the proportion of fish inthe penguin diet at both Open Sea 1 and Closed Seasites during a period of probable high abundance ofsub-Antarctic krill (Lescroël et al. 2004). Hence, gentoopenguins might adapt to changes in the relativeabundance of food sources.
CONCLUSIONS
Opportunism appears to be a key feature of the gen-too penguin’s foraging ecology. This inshore feedingspecies is able to adapt to local oceanographic condi-tions to utilize available prey species. Other penguinspecies, such as Rockhopper Eudyptes chrysocome,Emperor Aptenodytes forsteri or Adélie Pygoscelisadeliae penguins, exhibit flexible chasing tactics(Watanuki et al. 1993, Wienecke & Robertson 1997,Tremblay & Cherel 2003), but none of them shows sucha degree of plasticity both in the foraging dimensions(i.e. distance from the colony, horizontal and verticalcomponents of the water column during diving) and inthe diet, especially at a small spatial scale.
At Kerguelen Archipelago, gentoo penguins showedat least 2 foraging strategies that depended on thelocal conditions: large foraging ranges, long trips, longbenthic dives on demersal fish at colonies facing theopen sea versus small foraging ranges, short trips andshort pelagic dives on swarming crustaceans at themore enclosed site, for the same foraging effort. Thisresult emphasizes the importance of behavioral plas-ticity when living in heterogeneous, highly variableenvironments like coastal habitats compared to oceanicones (Ropert-Coudert et al. 2002). Consequently, cau-tion must be exercised in extrapolating informationgathered at a specific site, breeding stage or year,especially concerning coastal species.
Ecological adaptations to local oceanographic condi-tions have been reported in some other marine apex
predators like shags or cormorants (Grémillet et al.1998, Wanless et al. 1998, Kato et al. 1991, 2000), Rock-hopper penguins (Tremblay & Cherel 2003) and furseals (Boyd et al. 1994, McCafferty et al. 1998, Beau-plet et al. 2004) but remain understudied. Yet, suchstudies might provide original information on the localavailability and characteristics of marine prey popula-tions (Ridoux 1988) and help to monitor coastal marineecosystems (Boyd & Murray 2001).
Acknowledgements. This work was supported by the InstitutPolaire Paul Emile Victor (IPEV, Programme No. 394), theTerres Australes et Antarctiques Françaises and the CentreNational de la Recherche Scientifique. We thank A. Lamalleand the members of the 52nd, 53rd and 54th missions atKerguelen, and especially V. Chartendrault, E. Pettex, C.Marteau, J. L. Chill and F. Le Bouard for their help in thefield. The authors are also grateful to A. Schmidt for his helpin the analysis of TDR data and to J. Lage who provided hissoftware. We thank N. D. Holmes, G. Beauplet and 4 anony-mous reviewers for their helpful comments on the manu-script. Finally, many thanks to A. Pape who improved theEnglish.
LITERATURE CITED
Adams NJ, Brown CR (1983) Diving depths of the gentoopenguin (Pygoscelis papua). Condor 85:503–504
Adams NJ, Klages NT (1989) Temporal variation in the dietof the gentoo penguin Pygoscelis papua at sub-AntarcticMarion Island. Colon Waterbird 12:30–36
Ashmole NP, Ashmole MJ (1967) Comparative feeding eco-logy of sea birds of a tropical oceanic island. Bull PeabodyMus Nat Hist, Yale Univ 24:1–131
Bannasch R, Wilson RP, Culik BM (1994) Hydrodynamicaspects of design and attachment of a back-mounteddevice in penguins. J Exp Biol 194:83–96
Beauplet G, Dubroca L, Guinet C, Cherel Y, Dabin W,Gagne C, Hindell M (2004) Foraging ecology of sub-Antarctic fur seals Arctocephalus tropicalis breeding onAmsterdam Island: seasonal changes in relation tomaternal characteristics and pup growth. Mar Ecol ProgSer 273:211–225
Blain S, Tréguer P, Belviso S, Bucciarelli E and 7 others (2001)A biogeochemical study of the island mass effect in thecontext of the iron hypothesis: Kerguelen Islands, South-ern Ocean. Deep-Sea Res I 48:163–187
Bocher P, Cherel Y, Labat JP, Mayzaud P, Razouls S, Jou-ventin P (2001) Amphipod-based food web: Themisto gau-dichaudii caught in nets and by seabirds in Kerguelenwaters, southern Indian Ocean. Mar Ecol Prog Ser 223:261–276
Bost CA, Jouventin P (1990) Evolutionary ecology of thegentoo penguin Pygoscelis papua. In: Davis L, Darby J(eds) Penguin biology. Academic Press, San Diego, CA,p 85–112
Bost CA, Jouventin P, Pincson Du Sel N (1992) Morphometricvariability on a microgeographical scale in two inshoreseabirds. J Zool 226:135–149
Bost CA, Pütz K, Lage J (1994) Maximum diving depth anddiving patterns of the gentoo penguin Pygoscelis papua atthe Crozet Islands. Mar Ornithol 22:237–244
258
Lescroël & Bost: Microgeographical variation of foraging in the gentoo penguin
Boyd IL (1996) Temporal scales of foraging in a marinepredator. Ecology 77:426–434
Boyd IL, Murray WA (2001) Monitoring a marine ecosystemusing responses of upper trophic level predators. J AnimEcol 70:747–760
Boyd IL, Arnould JPY, Barton T, Croxall JP (1994) Foragingbehaviour of Antarctic fur seals during periods of contrast-ing prey abundance. J Anim Ecol 63:703–713
Boyd IL, McCafferty DJ, Walker TR (1997) Variation inforaging effort by lactating Antarctic fur seals: response tosimulated increased foraging costs. Behav Ecol Sociobiol40:135–144
Boyd IL, Kato A, Ropert-Coudert Y (2004) Bio-logging sci-ence: sensing beyond the boundaries. In: Naito Y (ed) Bio-logging science: Proc Int Symp Bio-logging Science,National Institute of Polar Research, Tokyo, Mar 17–21,2003. Memoirs of National Institute of Polar Research,Special Issue 58, National Institute of Polar Research,Tokyo
Brown CR, Klages NT, Adams NJ (1990) Short and medium-term variation in the diets of penguins at Marion Island.S Afr Antarct Res 20:13–20
Charassin JB, Bost CA (2001) Utilisation of the oceanic habi-tat by king penguins over the annual cycle. Mar Ecol ProgSer 221:285–297
Charassin JB, Park YH, Le Maho Y, Bost CA (2002) Penguinsas oceanographers unravel hidden mechanisms of marineproductivity. Ecol Lett 5:317–319
Cherel Y, Tremblay Y, Guinard E, Georges JY (1999) Divingbehaviour of female northern rockhopper penguins,Eudyptes chrysocome moseleyi, during the broodingperiod at Amsterdam Island (Southern Indian Ocean). MarBiol 134:375–385
Clausen A, Pütz K (2002) Recent trends in diet compo-sition and productivity of Gentoo, magellanic and rock-hopper penguins in the Falkland Islands. Aquat Conserv12:51–61
Clausen A, Pütz K (2003) Winter diet and foraging range ofgentoo penguins (Pygoscelis papua) from Kidney Cove,Falkland Islands. Polar Biol 26:32–40
Cordier JR, Mendez A, Mougin JL, Visbeek G (1983) Lesoiseaux de la baie de l’Espérance, Péninsule Antarctique(63° 24’ S, 56° 59’ W). L’Oiseau R.F.O 51:147–160
Croxall JP, Prince PA (1980a) Food, feeding ecology and eco-logical segregation of seabirds at South Georgia. Biol JLinn Soc 14:103–131
Croxall JP, Prince PA (1980b) The food of gentoo penguinPygoscelis papua and Macaroni penguin Eudypteschrysolophus at South Georgia. Ibis 122:245–253
Croxall JP, Prince PA (1987) Seabirds as predators on marineresources, especially krill, at South Georgia. In: CroxallJP (ed) Seabirds: feeding ecology and role in marineecosystems. Cambridge University Press, Cambridge,p 347–368
Croxall JP, Prince PA (1994) Dead or alive, night or day:How do albatrosses catch squid? Antarct Sci 6:155–162
Croxall JP, Davis RW, O’Connall MJ (1988) Diving patterns inrelation to diet of gentoo and macaroni penguins at SouthGeorgia. Condor 90:157–167
Croxall JP, Briggs DR, Kato A, Naito Y, Watanuki Y,Williams TD (1993) Diving pattern and performance in themacaroni penguin Eudyptes chrysolophus. J Zool 230:31–47
Culik BM, Wilson RP (1991) Swimming energetics and per-formance of instrumented Adélie penguins (Pygoscelisadeliae). J Exp Biol 158:355–368
Culik BM, Bannasch R, Wilson RP (1994) External devices
on penguins: How important is shape? Mar Biol 118:353–357
Duhamel G (1987) Ichtyofaune des Secteurs Indien Occiden-tal et Atlantique Oriental de l’océan austral: Biogéogra-phie, cycles biologiques et dynamique des populations.PhD thesis, Université Pierre et Marie Curie, Paris
Duhamel G (1993) Distribution, abondance et principales car-actéristiques biologiques des espèces de la ZEE des îlesKerguelen en 1987 et 1988. In: Duhamel G (ed) Cam-pagnes SKALP 1987 et 1988 aux îles Kerguelen à bord desnavires ‘SKIF’ et ‘KALPER’. Rapp Camp Mer Publ IFRTP93–01:194–251
Gentry RL, Kooyman GL (1986) Methods of dive analysis.In: Gentry RL, Kooyman GL (eds) Fur seals: maternalstrategies on land and at sea. Princeton University Press,Princeton, NJ, p 28–40
Grémillet D, Argentin G, Schulte B, Culik BM (1998) Flexibleforaging techniques in breeding Cormorants Phalacro-corax carbo and shags Phalacrocorax aristotelis: benthicor pelagic feeding? Ibis 140:113–119
Grémillet D, Kuntz G, Delbart F, Mellet M and 6 others(2004a) Linking the foraging performance of a marinepredator to local prey abundance. Funct Ecol 18:1–7
Grémillet D, Dell’Omo G, Ryan PG, Peters G, Ropert-CoudertY, Weeks SJ (2004b) Offshore diplomacy, or how seabirdsmitigate intra-specific competition: a case study basedon GPS tracking of Cape gannets from neighbouringcolonies. Mar Ecol Prog Ser 268:265–279
Guinet C, Dubroca L, Lea MA, Goldsworthy SD, Cherel Y,Duhamel G, Bonadonna F, Donnay JP (2001) Spatial distri-bution of foraging in female Antarctic fur seals Arcto-cephalus gazella in relation to oceanographic variables: ascale-dependent approach using geographic informationsystems. Mar Ecol Prog Ser 219:251–264
Haggett P, Chorley R (1969) Network analysis in geography.Edward Arnold, London
Hindell MA (1989) The diet of gentoo penguins Pygoscelispapua at Macquarie Island: winter and early breedingseason. Emu 89:71–78
Hull C (1997) The effect of carrying devices on breedingRoyal penguins. Condor 99:530–534
Hunt GL, Mehlum F, Russell RW, Irons D, Decker MB, BeckerPH (1999) Physical processes, prey abundance, and theforaging ecology of seabirds. In: Adams NJ, Slotow RH(eds) Proc 22 Int Ornithol Congr Durban. BirdLife SouthAfrica, Johannesburg
Hurlbert SH (1984) Pseudoreplication and the design ofecological field experiments. Ecol Monogr 54:187–211
Jouventin P, Weimerskirch H (1990) Satellite tracking ofwandering albatrosses. Nature 343:746–748
Kato A, Williams TD, Barton TR, Rodwell S (1991) Short-termvariation in the winter diet of gentoo penguins Pygoscelispapua at South Georgia during July 1989. Mar Ornithol19:31–38
Kato A, Watanuki Y, Nishiumi I, Kuroki M, Shaughnessy P,Naito Y (2000) Variation in foraging and parental behaviorof King Cormorants. Auk 117(3):718–730
Kirkwood R, Robertson G (1997) The foraging ecology offemale Emperor Penguins in winter. Ecol Monogr 67(2):155–176
Klages NTW, Pemberton D, Gales RP (1990) The diets of Kingand gentoo penguins at Heard Island. Aust Wildl Res 17:53–60
Kooyman GL, Cherel Y, Le Maho Y, Croxall JP, Thorson PH,Ridoux V, Kooyman CA (1992) Diving behavior and en-ergetics during foraging cycles in king penguins. EcolMonogr 62:143–163
259

Mar Ecol Prog Ser 302: 245–261, 2005
Le Boeuf BJ, Costa DP, Huntley AC, Feldkamp SD (1988)Continuous, deep diving in female northern elephantseals, Mirounga angustirostris. Can J Zool 66:446–458
Lescroël A, Ridoux V, Bost CA (2004) Spatial and temporalvariation in the diet of the gentoo penguin (Pygoscelispapua) at Kerguelen Islands. Polar Biol 27:206–216
McCafferty D, Boyd IL, Walker TR, Taylor RI (1998) Foragingresponses of Antarctic fur seals to changes in the marineenvironment. Mar Ecol Prog Ser 166:285–299
McConnell BJ, Fedak MA, Burton HR, Englehard GH, Reijn-ders P (2002) Movements and foraging areas of naive,recently weaned southern elephant seal pups. J Anim Ecol71:65–78
Orians GH, Pearson NE (1979) On the theory of central placeforaging. In: Horm DJ, Mitchell RD, Stairs GR (eds)Analysis of ecological systems. Ohio University Press,Columbus, OH, p 157–177
Park YH, Gambéroni L, Charriaud E (1993) Frontal structure,water masses, and circulation in the Crozet basin. J Geo-phys Res 97:12361–12385
Perissinotto R (1989) The structure and diurnal variations ofthe zooplankton of the Prince Edwards Islands: implica-tions for the biomass build-up of higher trophic levels.Polar Biol 9:505–510
Pinaud D, Weimerskirch H (2002) Ultimate and proximatefactors affecting the breeding performance of a marinetop-predator. Oikos 99:141–150
Radl A, Culik BM (1999) Foraging behaviour and reproduc-tive success in Magellanic penguins (Spheniscus magel-lanicus): a comparative study of two colonies in southernChile. Mar Biol 133:381–393
Razouls S, De Bovée F, Delille D, Fiala M, Mayzaud P (1997)Temporal variability of bacteria, phytoplankton and zoo-plankton assemblages of the sub-Antarctic MorbihanBay (Kerguelen Archipelago). In: Battaglia B, Valencia J,Walton DWH (eds) Antarctic communities, species, struc-ture and survival. Cambridge University Press, Cambridge,p 86–92
Ridoux V (1988) Subantarctic krill Euphausia vallentinipreyed upon by penguins around Crozet Islands (South-ern Indian Ocean): population structure and avian cycle.J Plankton Res 10:675–690
Ridoux V (1994) The diets and dietary segregation of sea-birds at the subantarctic Crozet Islands. Mar Ornithol 22:1–192
Robinson SA, Hindell MA (1996) Foraging ecology of gentoopenguins Pygoscelis papua at Macquarie Island duringthe period of chick care. Ibis 138:722–731
Rodary D, Bonneau W, Le Maho Y, Bost CA (2000) Benthicdiving in male emperor penguins (Aptenodytes fosteri)foraging in winter. Mar Ecol Prog Ser 207:171–181
Ropert-Coudert Y, Bost CA, Handrich Y, Bevan RM, ButlerPJ, Woakes AJ, Le Maho Y (2000) Impact of externallyattached loggers on the diving behaviour of the KingPenguin. Physiol Biochem Zool 73:438–445
Ropert-Coudert Y, Kato A, Bost CA, Rodary D, Sato A, LeMaho Y, Naito Y (2002) Do Adélie penguins modify theirforaging behaviour in pursuit of different prey? Mar Biol140:647–652
Salamolard M, Weimerskirch H (1993) Relationship betweenforaging effort and energy requirement throughout thebreeding season in the Wandering albatross. Funct Ecol 7:643–652
Sokal RR, Rohlf FJ (1995) Biometry: the principles andpractice of statistics in biological research. Freeman, NewYork
Tanton JL, Reid K, Croxall JP, Trathan PN (2004) Winter dis-
tribution and behaviour of gentoo penguins Pygoscelispapua at South Georgia. Polar Biol 27:299–303
Taylor SS, Leonard ML, Boness DJ, Majluf P (2001) Foragingtrip duration increases for Humboldt Penguins taggedwith recording devices. J Avian Biol 32:369–372
Tremblay Y, Cherel Y (2000) Benthic and pelagic dives: a newforaging behaviour in rockhopper penguins. Mar EcolProg Ser 204:257–267
Tremblay Y, Cherel Y (2003) Geographic variation in theforaging behaviour, diet and chick growth of rockhopperpenguins. Mar Ecol Prog Ser 251:279–297
Trivelpiece WZ, Bengston JL, Trivelpiece SG, Volkman NJ(1986) Foraging behavior of gentoo and chinstrap pen-guins as determined by new radiotelemetry techniques.Auk 103:777–781
Trivelpiece WZ, Trivelpiece SG, Volkman NJ (1987) Ecologi-cal segregation of Adélie, gentoo and chinstrap penguinsat King George Island, Antarctica. Ecology 68:351–361
Van Zinderen Bakker EM Jr (1971) A behavior analysis of thegentoo penguin Pygoscelis papua Forster in Marion andPrince Edward Islands. In: Van Zinderen Bakker EM Sr,Winterbotton JM, Dyer RA (eds) Report on the SouthAfrican biological and geological expedition 1965–1966.Balkema, Cape Town, p 251–272
Volkman NJ, Jazdzewski K, Kittel W, Trivelpiece WZ (1980)Diets of Pygoscelis Penguins at King George Island,Antarctica. Condor 82:373–378
Wanless S, Grémillet D, Harris MP (1998) Foraging activityand performance of Shags Phalacrocorax aristotelis inrelation to environmental characteristics. J Avian Biol29(1):49–54
Watanuki Y, Kato A, Mori Y, Naito Y (1993) Diving perfor-mance of Adelie penguins in relation to food availability infast sea-ice areas: comparison between years. J Anim Ecol62:634–646
Watanuki Y, Kato A, Robertson G (1997) Diving and foragingbehaviour of Adélie penguins in areas with and withoutfast sea-ice. Polar Biol 17:296–304
Weimerskirch H (1998) Foraging strategies of Indian Oceanalbatrosses and their relationships with fisheries. In:Robertson G, Gales R (eds) Albatross biology & conserva-tion. Surrey Beaty & Sons, Chippington North, p 168–179
Weimerskirch H, Wilson RP (1992) When do wandering alba-trosses Diomedea exulans forage? Mar Ecol Prog Ser 86:297–300
Weimerskirch H, Jouventin P, Stahl JC (1986) Comparativeecology of the six albatross species breeding on the CrozetIslands. Ibis 128:195–213
Weimerskirch H, Zotier R, Jouventin P (1989) The avifauna ofthe Kerguelen Islands. Emu 89:15–29
Weimerskirch H, Bonnadona F, Bailleul F, Mabille G,Dell’Omo G, Lipp HP (2002) GPS tracking of foragingalbatrosses. Science 295:1259
Wienecke BC, Robertson G (1997) Foraging space of emperorpenguins Aptenodytes forsteri in Antarctic shelf waters inwinter. Mar Ecol Prog Ser 159:249–263
Williams TD (1991) Foraging ecology and diet of gentoopenguins Pygoscelis papua at South Georgia during thewinter and an assessment of their winter prey consump-tion. Ibis 133:3–13
Williams TD, Briggs DR, Croxall JP, Naito A, Kato A (1992)Diving pattern and performance in relation to foragingecology in the gentoo penguin, Pygoscelis papua. J Zool227:211–230
Wilson RP (1995) The foraging ecology of penguins. In: WilliamsT (ed) Penguins. Oxford University Press, Oxford, p 81–106
Wilson RP, Wilson MP (1990) Foraging ecology of breeding
260
Lescroël & Bost: Microgeographical variation of foraging in the gentoo penguin
Spheniscus penguins. In: Davis LS, Darby JT (eds) Pen-guin biology. Academic Press, San Diego, CA, p 181–206
Wilson RP, Grant WS, Duffy DC (1986) Recording devices onfree-ranging animals: Does measurement affect foragingperformance? Ecology 67:1091–1093
Wilson RP, Nagy KA, Obst BS (1989) Foraging ranges ofpenguins. Polar Rec 25:303–307
Wilson RP, Culik BM, Peters G, Bannasch R (1996) Divingbehaviour of gentoo penguins, Pygoscelis papua: factorskeeping dive profiles in shape. Mar Biol 126:153–162
Wilson RP, Bost CA, Pütz K, Charrassin JB, Culik BM,Adelung D (1997) Southern rockhopper penguin Eudypteschrysocome chrysocome foraging at Possession Island.Polar Biol 17:323–329
Wilson RP, Alvarrez B, Latorre L, Adelung D, Culik B, Ban-nasch R (1998) The movements of gentoo penguinsPygoscelis papua from Ardley Island Antarctica. Polar Biol19:407–413
Wilson RP, Kreye JM, Lucke K, Urquhart H (2004) Antennaeon transmitters on penguins: balancing energy budgets onthe high wire. J Exp Biol 207:2649–2662
Woehler E (1995) Consumption of southern ocean marineresources by penguins. In: Dann P, Norman I, Reilly P(eds) The penguins: ecology and management. SurreyBeatty & Sons, Chippington North, p 266–294
Ydenberg RC, Clark CW (1989) Aerobiosis and anaerobiosisduring diving by western grebes: an optimal foragingapproach. J Theor Biol 139:437–449
261
Editorial responsibility: Otto Kinne (Editor-in-Chief), Oldendorf/Luhe, Germany
Submitted: February 8, 2005; Accepted: May 11, 2005Proofs received from author(s): October 13, 2005