foraging patterns of northern fulmars … patterns of northern fulmars in alaska inferred from fatty...
TRANSCRIPT

FORAGING PATTERNS OF NORTHERN FULMARS IN ALASKA INFERRED
FROM FATTY ACID SIGNATURE ANALYSIS
By
Shiway W. Wang
RECOMMENDED: ________________________________________
________________________________________
________________________________________
________________________________________
________________________________________ Advisory Committee Chair
________________________________________
Program Head, Graduate Program in Marine Science and Limnology
APPROVED: ______________________________________________ Dean, School of Fisheries and Ocean Sciences
______________________________________________ Dean of the Graduate School
______________________________________________ Date
Alan M. Springer
C. Loren Buck
Scott A. Hatch
Sara J. Iverson
A. Sasha Kitaysky
Bruce Finney
Denis Wiesenburg
Susan M. Henrichs
November 22, 2005
FORAGING PATTERS OF NORTHER FULMARS IN ALASKA INFERRED FROM
FATTY ACID SIGNATURE ANALYSIS
A
THESIS
Presented to the Faculty
of the University of Alaska Fairbanks
in Partial Fulfillment of the Requirements
for the Degree of
MASTER OF SCIENCE
By
Shiway W. Wang, B.S.
Fairbanks, Alaska
December 2005

iii
Abstract
Diets of Northern Fulmars (Fulmarus glacialis) in the North Pacific are poorly
known, and thus relationships of fulmars to supporting food webs and their potential
sensitivity to ecosystem variability, such as that driven by a changing climate, also are
uncertain. I employed a new technique, fatty acid (FA) signature analysis, to examine
dietary differences among fulmars at three colonies in Alaska. I predicted that 1)
signatures of adipose tissue and stomach oils would differ because the time scale each
depot reflects differ and/or because adipose tissue FAs may be influenced by predator
metabolism, while stomach oil FAs may be influenced by differential uptake; 2) fulmar
diets would differ between colonies located in distinct oceanographic settings, which
create unique habitats for prey assemblages; 3) diets would differ temporally within
colonies because of inter-annual variability in the physical environment resulting in
variation of prey FA signatures; and 4) diets of adult fulmars and their chicks would be
similar because they feed by regurgitation. I found that FA signatures of adipose tissue
were significantly different than those of stomach oil; there were conspicuous spatial and
temporal differences in adipose tissue signatures; but diets of adults may differ from
those of chicks.

iv
Table of Contents
Page
Signature Page ..................................................................................................................... i
Title Page ............................................................................................................................ ii
Abstract.............................................................................................................................. iii
Table of Contents............................................................................................................... iv
List of Figures.................................................................................................................... vi
List of Tables .................................................................................................................... vii
Preface ............................................................................................................................. viii
Introduction......................................................................................................................... 1
Northern Fulmars ........................................................................................................... 3
Stomach oil...................................................................................................................... 6
Diet studies...................................................................................................................... 8
Fatty acid signature analysis ........................................................................................ 10
Objectives...................................................................................................................... 11
Chapter 1. Fatty acid signatures of stomach oil and adipose tissue of Northern Fulmars (Fulmarus glacialis) in Alaska: implications for diet analysis..................... 13
1.1 Abstract ....................................................................................................................... 13
1.2 Introduction............................................................................................................. 15
1.3 Materials and methods ............................................................................................ 18
1.3.1 Study sites & sample collection................................................................... 18
1.3.2 Lipid extraction and analysis ...................................................................... 20
1.3.3 Data analysis............................................................................................... 21
v
1.4 Results..................................................................................................................... 23
1.5 Discussion ............................................................................................................... 25
1.6 Acknowledgements................................................................................................. 31
1.7 References............................................................................................................... 32
Chapter 2. Fatty acids in Northern Fulmars (Fulmarus glacialis) breeding in Alaska: a qualitative comparison of diet ...................................................................... 48
2.1 Abstract ................................................................................................................... 48
2.2 Introduction............................................................................................................. 50
2.3 Materials and Methods............................................................................................ 53
2.3.1 Sample collection ........................................................................................ 53
2.3.2 Lipid extraction and analysis ...................................................................... 54
2.3.3 Data analysis............................................................................................... 55
2.4 Results..................................................................................................................... 58
2.4.1 Differences among adults............................................................................ 58
2.4.2 Differences between adults and chicks........................................................ 60
2.5 Discussion ............................................................................................................... 61
2.5.1 Differences among adults............................................................................ 61
2.5.2 Differences between adults and chicks........................................................ 64
2.6 Acknowledgements................................................................................................. 68
2.7 References............................................................................................................... 69
Conclusions .................................................................................................................. 87
References .................................................................................................................... 92

vi
List of Figures
Page
Chapter 1. Figure 1.1. Range of coloration of stomach oil ................................................................ 43
Figure 1.2. Locations of four major fulmar colonies in Alaska........................................ 44
Figure 1.3. Mean values of stomach oil and adipose tissue signatures ............................ 45
Figure 1.4. Discriminant scores of mean differences between lipid sources.................... 47
Chapter 2. Figure 2.1. Locations of four major fulmar colonies in Alaska........................................ 82
Figure 2.2. Mean values of fatty acids in adult fulmars ................................................... 83
Figure 2.3. Mean values of fatty acids in adult-chick pairs .............................................. 84
Figure 2.4a. First and second principle components for adult fulmars............................. 85
Figure 2.4b. First and second principle components for adult-chick pairs....................... 85
Figure 2.5a. First and second discriminant functions for adult fulmars ........................... 86
Figure 2.5b. First and second discriminant functions for adult-chick pairs ..................... 86

vii
List of Tables
Page
Chapter 1. Table 1.1. Mean values for fatty acid composition of adipose tissue and stomach oil..... 40
Table 1.2. Squared Mahalanobis distances from discriminant analysis ........................... 42
Chapter 2. Table 2.1. Mean values for fatty acid composition of adult adipose tissue...................... 76
Table 2.2. Mean values for fatty acid composition of adult and chick adipose tissue ..... 79
Table 2.3. Predicted group classification from discriminant analysis .............................. 81

viii
Preface
This thesis is dedicated to my parents, Jack C.M. Wang and Jane W.J. Wang, who
taught me the value of hard work, persistence, and always giving 110%. I also dedicate
this thesis to my brother, G. Sam Wang, and sister, Kristina L. Wang, for supporting me
in my adventures and for keeping me grounded: I thank my family for all their love and
encouragement.
This project would not have been possible without financial support from the
following sources: U.S. Geological Survey, Alaska Science Center; University of Alaska
Fairbanks (UAF), Institute of Marine Science and the Department of Biology & Wildlife;
Dalhousie University, the Natural Sciences and Engineering Research Council (NSERC)
Canada; the Ken Turner Memorial Scholarship; the Thesis Completion Fellowship; and
Summer Research Tuition Scholarship. I also received travel awards from UAF and the
American Ornithologists’ Union for travel to conferences. I thank the following field
assistants who braved the projectile puking fulmars to help with the collection of data:
Allyson Larned, Ellen Naughter, Mette Nielson, Naomi Bargmann, Andy Ramey, Taya
Kitaysky, and Dan Mulcahy. Without the support of the Alaska Maritime National
Wildlife Refuge this work would not have been possible; a special thank you to Greg
Siekaniec, Vernon Byrd, Heather Renner and Jeff Williams for always making sure I had
the support needed to achieve my goals. Transportation to field sites was provided by
Captain Kevin Bell and crew on the M/V Tiglâx, U. S. Coast Guard Air Station Kodiak,
and the late Captain Gary Edwards and crew of the F/V Big Valley. Thanks to Dr. Susan

ix
Henrichs for providing lab equipment at UAF. Many thanks to Sue Budge, Shelley Lang,
and Sharon Temple at Dalhousie University for assistance with analyzing samples and
answering all my questions concerning lab work. I thank Laura Bender and the staff at
the Graduate School (UAF) and Christina Neumann (School of Fisheries and
Oceanography) for their support and assistance.
I ended up with five talented mentors on my committee: I am grateful for their
encouragement, patience, and faith in my success, their efforts to promote my growth as a
scientist and also for their companionship. My advisory committee chair, Dr. Alan
Springer, is a great supervisor both in and out of the field. He was always available for
discussions about science and life in general. Dr. Sara Iverson graciously opened the door
of her laboratory and home to me, and has been extremely helpful with the fatty acid
analysis. Without her mentorship, I would be lost in a sea of fatty acids. I thank Dr. Scott
Hatch for planting the seed of this project and for financially supporting me through my
graduate studies. Scott logged many hours with me out in the field, noose-poled all birds
for me, and never stopped doubting that I would achieve my goals. Dr. Sasha Kitaysky
played an instrumental role in developing and evaluating the study design of this project.
I thank Dr. Loren Buck for providing both ears for listening to me and for answering my
questions about physiology. Additionally, their critical reading of this thesis greatly
improved its clarity and content. I thank Dr. Susan Henrichs for sitting on my committee
during my first year. For help with statistical analysis, I thank Dr. Edward Murphy - I
spent many hours in his office. Thanks to Dr. Denis Wiesenburg, Dean of the School of
Fisheries and Ocean Sciences, and Dr. Bruce Finney, Program Head, Graduate Program

x
in Marine Science and Limnology, for time spent carefully reviewing this thesis and
improving the final product.
I thank my office mates and friends in and outside of the university for providing
help and comic relief over the past three years. Time donated by these people to discuss
all aspects of my project, from field protocols to multivariate statistics, was extremely
valuable to my progress on this thesis. Thanks to the following colleagues: Naomi
Bargmann, Cory Williams, Brook Gamble, Rebecca McGuire, Heather Wilson, Laura
Phillips, Mette Nielson, Janet Doherty, Angie Dubois, Danielle Mason, Julie Morse, Josh
Schmidt, John Pearce, John Brewer, Alison Banks, Mike Shultz, Morgan Benowitz-
Fredericks, and Pat Doak.
And last, but certainly not least, I thank David Safine for his love, patience, and
support during this thesis project. His ability to tolerate me during extreme levels of
stress for the past three years is commendable. Thank you for always being there for me.
1
Introduction
Since the mid-1970’s, the combined effects of environmental changes and
commercial fishing pressures have resulted in fluctuations in the composition of
marine communities in the North Pacific Ocean (NRC 1996, Francis et al. 1998).
Changes in the N. Pacific Ocean have been implicated in the decline in abundance of
some prey species and coincided with changes in abundance and productivity of
seabirds and marine mammals (e.g. Trites 1992, Piatt & Anderson 1996, Springer
1998). Observed declines have prompted scientists to investigate causal links between
changes in diet composition and population dynamics of marine mammals and
seabirds.
Effects of climate change on species at higher trophic levels have been
documented worldwide. Over the past 50 years, ocean warming has caused the
reduction of sea-ice extent and a decrease in secondary production in sub-Antarctic
waters (e.g. Taylor & Wilson 1990, Weimerskirch et al. 2003, Barbraud &
Weimerskirch 2001). Probably in response to these changes some seals and seabirds
in the Southern Ocean have declined severely, while others have increased. During an
El Niño event in the 1990s, die-offs of seabirds in Alaska and of pinnipeds from the
west coast of North American down to South America occurred (e.g. Mendenhall
1997). Black Guillemots (Cepphus grylle) nesting on Cooper Island in Barrow
increased from fewer than 18 individuals in 1975 to 225 in 1989 due to a longer
snow-free breeding seasons resulting from global warming (Divoky 1998).

2
Time scales of climate change range from interannual fluctuations with,
impacts such as contrasting patterns of reproductive performance of planktivorous
and piscivorous alcids (Kitaysky & Golubova 2000), decadal cycles such as the
Pacific Decadal Oscillation (PDO) in the N. Pacific (Mantua et al. 1997), and even
longer-term changes (Sugimoto & Tadokoro 1997). The PDO is the alternation of the
Aleutian Low pressure system between two quasi-stable states of intensity and spatial
variability over a period of 15-30 years (Trenberth & Hurrell 1994, Mantua et al.
1997). Changes between the two states result in dramatic shifts in the biological
community (e.g. Francis et al. 1994, Hare & Mantua 2000). Examples of such
bottom-up regulation include the response of salmon production across the N. Pacific
to changing levels of secondary and primary production, the latter driven by physical
conditions created by the PDO (e.g. Francis & Hare 1994, Mantua et al. 1997).
Comparable changes in abundance and productivity of seabirds in Alaska are also
thought to reflect environmental fluctuations (e.g. Piatt & Anderson 1996, Springer
1998).
Most seabirds are high trophic level consumers in marine food webs and can
serve as sensitive indicators of changes in marine ecosystems (Furness & Todd 1984,
Cairns 1987, Montevecchi 1993, Montevecchi & Myers 1995, Springer 1998). Many
seabird species respond to fluctuations in forage fish populations and respond by
changing their diets (Furness & Cooper 1982, Springer et al. 1984, Springer &
Speckman 1997). Reproductive success of seabirds can be affected by seasonal and
annual changes in prey availability (Vermeer 1992, Kitaysky & Golubova 2000).

3
When prey availability is low, seabirds may increase foraging effort, skip a year of
breeding, emigrate, suffer increased mortality and slower chick growth, and
populations may experience reduced breeding success (Springer et al. 1996, Cairns
1987, Furness & Barrett 1991, Furness & Nettleship 1991, Hamer et al. 1991,
Springer & Speckman 1997).
Northern Fulmars
Northern Fulmars are an abundant and conspicuous seabird that exemplifies
many of the above phenomena. Diets of Northern Fulmars in the N. Pacific Ocean are
poorly known, however, and thus relationships of fulmars to supporting food webs
and the species’ sensitivity to ecosystem variability are also highly uncertain. Fulmars
are opportunistic and generalist predators and consume a wider variety of prey than
many other species of seabirds in Alaska. In the N. Pacific, fulmars feed on
cephalopods, zooplankton, lantern fishes (Myctophidae), Scyphozoan jellyfish,
juveniles of commercial fish species, e.g., walleye pollock (Theragra
chalcogramma), and other forage species that are critical to pelagic food webs and
sensitive indicators of environmental change, e.g., capelin (Mallotus villosus) and
Pacific sandlance (Ammodytes hexapterus) (Preble & McAtee 1923, Bradstreet 1985,
Hunt et al. 1981a, Hunt et al. 1981b, Harrison 1984, Sanger 1986, Hills & Fiscus
1988, Gould et al. 1997, Hatch & Nettleship 1998, Hatch unpubl.). The ability of
fulmars to exploit a wide-variety of prey with no obvious reliance on specific species
allows for the speculation that their generalist, opportunistic feeding habits help to

4
buffer them from changes in physical conditions and associated food webs (e.g. Piatt
& Anderson 1996).
In addition to live-caught prey items, fulmars also follow fishing vessels in
pursuit of offal, which is composed of fish refuse (livers, entrails, and whole fish
discards; Fisher 1952, Hunt et al. 1981b, Hatch 1993). Breeding numbers and ranges
of Atlantic fulmars have expanded dramatically over the last 200 years and the
importance of commercial fisheries in that growth has been debated (Hatch &
Nettleship 1998). Phillips et al. (1999) concluded that the general pattern for Atlantic
fulmars in more southerly populations was to consume more discards than fulmars in
the northern populations: however, their ability to exploit commercial fisheries for
food resources is evident across their range. Use of offal is not well documented in
the Pacific (Fitzgerald & Kuletz 2003), yet fulmars may be consuming up to 75% of
the total discards from some commercial fisheries (A. Schultz, commercial fisherman,
pers, comm.).
Implications of fulmars relying on commercial fisheries include potential
population expansions in the Pacific and potential crashes in populations if
commercial fishery activities are reduced, with or without coincident decreases in
abundance of natural prey. Decreased commercial fishery activity may, however,
diminish bycatch mortality and thus offset the loss of food potentially obtained during
fisheries operations. Current population trends of fulmars are of interest because this
species is the largest single component of seabird bycatch in Alaska—59% of the
seabird bycatch in the Bering Sea-Aleutian Islands fishery for groundfish and 46% of

5
the bycatch in the Gulf of Alaska fishery (observations from 1993 – 2002; Fitzgerald
& Kuletz 2003).
The population of fulmars in North America is estimated at 2.1 million
individuals, with 70% occurring in Alaska (Hatch & Nettleship 1998). There are four
major Alaskan breeding colonies: 1) Chagulak Island (52˚35' N, 171˚10' W) located
in a deep oceanic basin in the central Aleutian Archipelago with populations
estimated at 500 000; 2) St. Matthew and Hall Islands (60˚30' N, 172˚45' W) located
in the middle of the large continental shelf in the central Bering Sea with
approximately 450 000 individuals; 3) the Semidi Islands (56˚05' N, 156˚45' W) on
the continental shelf in the western Gulf of Alaska, where the local oceanography is
influenced primarily by the Alaska Coastal Current and the Alaska Stream and where
about 440 000 individuals occur; and 4) the Pribilof Islands, principally St. George
Island (56˚35' N, 170˚35' W) near the edge of the continental shelf in the southeastern
Bering Sea, which hosts an estimated 80 000 individuals (Hatch & Hatch 1983, Hatch
1993). Overall, the populations of fulmars in the N. Pacific are though to be stable
(Hatch & Nettleship 1998). The population on St. Paul Island in the Pribilof Islands
appears to be increasing, while the population on nearby St. George Island has been
decreasing since 1992. There is no discernable trend in the Semidi Islands (Dragoo et
al. 2003, Larned & Sapora 2005), and no trend data exist for St. Matthew/Hall or
Chagulak islands. In 2003, fulmars colonized Attu Island in the Aleutian Archipelago
(Byrd & Williams 2004).
6
Stomach oil
Northern Fulmars belong to the order Procellariiformes, most members of
which are unique among seabirds because they produce stomach oils (Lewis 1966,
Warham 1977, Roby et al. 1993, Roby et al. 1997, Taylor et al. 1997). Early studies
hypothesized that stomach oil was produced in the glandular wall of the
proventriculus and was used for preening (Rosenheim & Webster 1926, Matthews
1949), or that it was an ingested preen gland secretion (Carter & Malcolm 1927,
Carter 1928). However, close resemblances were noted between fulmar stomach oil
and other oils found in marine systems (Lovern 1938, Kritzler 1948), and further
studies on its composition and variability between individuals indicated that it
originates from the diet.
Stomach oils are formed in the proventriculi of both by both adults and chicks
by a combination of specialized gastric anatomy and physiology (Roby et al. 1989,
Place et al. 1989, Roby et al. 1992, Roby et al. 1993 ). Aqueous dietary components
are rapidly emptied from the proventriculus, while neutral lipids are retained (Roby et
al. 1989). Oil production was hypothesized to be an adaptation that allows breeding
adults to enhance provisioning rates while foraging on distant and dispersed food
supplies (Ashmole 1971, Warham 1977, Laugksch & Duffy 1986, Roby et al. 1993,
Obst & Nagy 1993, Roby et al. 1997; Taylor et al. 1997). This hypothesis was
supported in an experiment demonstrating that stored oil in the proventriculus has
energetic advantages for seabirds that frequently experience periods of fasting
7
because it reduces the metabolic costs of storing fat reserves from assimilated fatty
acids (FAs) and later re-mobilizing them for use during fasting (Roby et al. 1997).
Stomach oils are also used by both adults and chicks as a defense mechanism
against predators such as falcons, eagles, gulls, ravens, foxes, and humans (Fisher
1952, Warham et al. 1976, Warham 1977, Clarke 1989). Experimental studies and
field observations have shown that birds soiled with oil ejected from as far away as 3
meters experienced reduced flight and insulation capabilities that often resulted in
death (Fisher 1952, Broad 1974, Clarke 1977, Mearns 1983). Historically, humans
consumed stomach oil for medicinal purposes and used it as a lubricant and fuel for
oil lamps (Travers & Travers 1873, Warham 1977).
The color of stomach oil is correlated with diet (Warham et al. 1976) and
ranges from colorless, to shades of yellow, orange, red, amber, deep reddish-brown
and even green, which may be contributed from bile (Fisher 1952, Lewis 1969,
Warham 1977 ). Colorless oils may represent lipids of meso- and bathypelagic fishes
(Lewis 1969), while red samples contain carotenoids and esterified astaxanthin
pigments found in planktonic crustaceans or in squids that consumed crustaceans
(Fisher 1952, Lewis 1969).
The composition of stomach oil was first described early in the last century,
but the analyses were incomplete by modern standards, with only partial chemical
compositions of the oil identified (Smith 1911, Carter & Malcolm 1927, Rosenheim
& Webster 1927, Carter 1928). Later studies showed that the chemical composition of
stomach oil includes hydrocarbons, monoester waxes, diacylglycerol ethers,

8
triglycerides, diglycerides, monoglycerides, alcohols, cholesterols, and free FAs as
well as more polar lipids (Lewis 1966, Lewis 1969, Cheah & Hansen 1970a, Cheah &
Hansen 1970b, Clarke & Prince 1976, Warham et al. 1976). The lipid composition of
stomach oils reflects not only the composition of recent meals but also the relative
solubility of each class of lipids in the stomach oils already accumulated (Place et al.
1989). Thus, there are two distinct lipid sources to consider in a dietary analysis of
Procellariiform birds using fatty acids, stomach oil and adipose tissue (Lewis 1969,
Cheah & Hansen 1970a, Clarke & Prince 1976, Imber 1976; Watts & Warham 1976,
Warham 1977, Jacob 1982, Place et al. 1989). Some studies compared the lipid
composition of stomach oil and adipose tissue of Procellariiformes (Rosenheim &
Webster 1926, Lovern 1938; Cheah & Hansen 1970a, Bishop et al. 1983, Horgan &
Barrett 1985, Clarke 1989), and Connan et al. (2005) recently used lipid classes in
stomach oils of Procellariiformes to infer diets.
Diet studies
Traditionally, information on diets of breeding seabirds has been collected by
screening burrows to obtain chick meals of puffins (Hatch & Sanger 1992); by
various methods of live capture to cause adults and chicks to regurgitate (Duffy &
Jackson 1986); by visual identification, as used with murres and guillemots to
identify meals delivered to chicks (Van Pelt & Shultz 2002, Litzow et al. 2002); and
by collecting birds and determining stomach contents by dissection (Duffy & Jackson
1986).

9
There are several well-known problems associated with these traditional
methods. Most methods employed in the past are consumptive—vital meals are taken
away from the adults or chicks, or the birds are sacrificed. Visual identification of
prey and chick meals from nests give information on prey items of chicks, which may
not accurately reflect the diet of the adults (Duffy & Jackson 1986, Annett & Pierotti
1989,Votier et al. 2003). Another problem is that soft-bodied invertebrates or other
parts that are not easily detected are often inaccurately represented (Harrison 1984,
Duffy & Jackson 1986). Hard parts that persist longer in the digestive system are
easier to identify than soft parts and can overemphasize the importance of some prey
items (Furness et al. 1984, Jobling & Breiby 1986). Moreover, each observation
provides information on only the most recent meal eaten, which may not represent the
average diet. Another method for studying diets, the analysis of stable isotopes,
provides information on general trophic levels of predators, but the species of prey
usually cannot be determined.
In an effort to overcome most of the problems mentioned above, I applied a
new method of investigating diets in this study, FA signature analysis. FA analysis is
a non-lethal method and is less invasive than most traditional methods of sampling
described previously. This type of analysis provides information about the diet
integrated over a period of time (e.g. 2 – 4 weeks, Iverson et al. in prep) rather than
just the most recent meal as with traditional methods.
Lipids have been used as biomarkers and general indicators of diets of
predators in marine ecosystems for many years (Sargent et al. 1988), and the analysis

10
of FAs in reservoir lipids (adipose tissue and blubber) has been used to infer trophic
levels, as well as spatial and temporal patterns in foraging behavior, of free living
marine mammals and seabirds (Iverson & Oftedal 1992, Iverson 1993, Iverson et al.
1997a, Iverson et al. 1997b, Kirsch et al. 2000, Iverson et al. 2001, Brown et al. 1999,
Raclot et al. 1998, Iverson & Springer 2002, Dahl et al. 2003). More recently, diets of
marine predators have been described quantitatively using Quantitative Fatty Acid
Signature Analysis (QFASA). QFASA is a statistical model that provides quantitative
estimates of the proportions of prey species in diets of individual predators (Iverson et
al. 2004).
Fatty acid signature analysis
FA signature analysis and QFASA are based on the observation that specific
FAs (carbon chain length ≥ 14) from prey are incorporated with little change, or in a
predictable manner, into the body fat of marine predators, and thus they can be used
as qualitative and quantitative food tracers (Iverson 1993, Iverson et al. 2004). A few
FAs can be biosynthesized by animals (Cook 1991), but they can be distinguished
from those that are acquired from the diet. FAs are used directly for energy or are re-
esterified, primarily to triacylglycerols, and stored in adipose tissue. Although
metabolism and biosynthesis of certain FAs occur within the predator, resulting in a
FA composition of its adipose tissue that does not match exactly that of its prey, most
FAs are deposited with little modification and in a predictable way (Iverson et al.
2004).

11
Not all FAs are good indicators of diet and appropriate for use in statistical
analysis (Iverson et al. 2004). FAs that were used in this study were chosen by how
well they indicated diet, and included those with the largest overall variances based
on the assumption that the FAs with the largest fluctuations in levels would provide
the most useful information in differentiating among fulmars. Sixteen out of 69
identifiable FAs in fulmar adipose tissue and stomach oil samples were used in the
analyses, of which 10 arise primarily from diet (18:2n-6, 18:3n-3, 18:4n-3, 20:1n-11,
20:1n-9, 20:4n-6, 20:5n-3, 22:1n-11, 22:1n-9, 22:6n-3) and 6 can be both
biosynthesized and acquired from the diet (14:0, 16:0, 18:0, 16:1n-7, 18:1n-9, 18:1n-
7); (Iverson et al. 2004). These sixteen FAs are ubiquitous in marine ecosystems and
the origins are well known, allowing for the reconstruction of the predator diet (e.g.
Ackman et al. 1974, Pascal & Ackman 1976, Ackman 1980, Sargent & Whittle 1981,
Sargent et al. 1988, Falk-Petersen et al. 1990, Dunstan et al. 1994).
Objectives
The larger objective of this study was to describe FA signatures of adipose
tissue and stomach oil of Northern Fulmars at nesting colonies in Alaska in order to
estimate diets. In Chapter 1, I compare the FA signatures of stomach oil and adipose
tissue. The finer scale question is if FA signatures from the two lipid sources are
detectably different. The larger scale question concerns the biological significance of
differences in signatures and implications for diet analysis. In Chapter 2, I use FA
signatures to assess spatial (between colonies), temporal (seasonal and inter-annual),

12
and age class (adult-chick) variability in the diet of fulmars at three colonies located
in distinct oceanographic settings in Alaska. I expected that 1) signatures of adipose
tissue and stomach oils would differ because of the differing time scale each depot
reflects and/or because adipose tissue FAs may be influenced by predator
metabolism, while stomach oil FAs may be influenced by differential uptake; 2)
fulmar diets would differ between colonies located in distinct oceanographic settings;
3) diets would differ temporally within colonies because of potential interannual
variability in the physical environment resulting in temporal shifts in FA signatures of
prey species; and 4) diets of adult fulmars and their chicks would be similar because
they feed by regurgitation.
I anticipated that this study would advance our understanding of seabird
foraging ecology in Alaska, provide new information about fulmar diets in different
geographic locations, and would complement such facets of ongoing research as the
satellite telemetry and molecular genetics on fulmars in Alaska (S.A. Hatch, unpubl.).
By understanding the diet and foraging ecology of fulmars and other marine birds,
predator-prey relationships and foraging patterns can be used in assessing the impact
of environmental variation on the birds and their ecosystem. With those motivations, I
resolved to learn as much as possible about the diets of Northern Fulmars in Alaska
using FA signature analysis.

13
Chapter 1. Fatty acid signatures of stomach oil and adipose tissue of Northern
Fulmars (Fulmarus glacialis) in Alaska: implications for diet analysis1
Abbreviations
BHT - butylated hydroxytoluene; FA(s) - fatty acid(s)
1.1 Abstract
The goal of this study was to use fatty acid signature analysis to estimate diets of
Northern Fulmars. We compared the fatty acid composition of two lipid sources,
stomach oil and adipose tissue, of individuals breeding at three major colonies in
Alaska. Fulmars and related species produce stomach oils that consist of lipids
retained from prey and represent prey consumed during the most recent foraging
events. Fulmars also store dietary lipids, and those they synthesize de novo, in
adipose tissue. The proportions of fatty acids in adipose tissue reflect deposition and
mobilization integrated over periods of weeks. We found that fatty acid signatures of
adipose tissue were significantly different than those of stomach oil, but not all fatty
acids were consistently higher or lower in either lipid source. These results are likely
P
1PPrepared for submission to The Journal of Comparative Physiology as Wang,
S.W., Iverson, S.J., Springer, A. M., and Hatch, S.A. Fatty acid signatures of
stomach oil and adipose tissue of Northern Fulmars (Fulmarus glacialis) in
Alaska: implications for diet analysis.
14
due to the time scales over which diets are integrated—short-term (stomach oil)
versus longer term (adipose tissue), the presence of biosynthesized lipids in adipose
tissue, or different deposition and mobilization rates and solubility of individual fatty
acids.
Keywords fatty acid signature analysis – Fulmarus glacialis – stomach oil – Alaska –
diet analysis

15
1.2 Introduction
Fatty acid (FA) signature analysis of reservoir lipid (adipose tissue and
blubber) has been used to infer trophic levels, as well as spatial and temporal patterns
in foraging behavior of free ranging marine mammals and seabirds (Iverson 1993;
Iverson et al. 1997a; Iverson et al. 1997b; Kirsch et al. 2000; Brown et al. 1999;
Raclot et al. 1998; Iverson & Springer 2002; Dahl et al. 2003). Given a
comprehensive database of prey FA signatures, it is possible to estimate the
proportions of different prey in the diet using Quantitative Fatty Acid Signature
Analysis, or QFASA (Iverson et al. 2004). FA signature analysis and QFASA are
based on the observation that prey FAs of carbon chain length ≥ 14 are incorporated
with little change into the body fat of marine predators, and thus they can be used as
qualitative and quantitative food tracers (Iverson 1993; Iverson et al. 2004). Some
FAs can be synthesized by animals, but the number and types are limited (Cook
1991). Therefore, biosynthesized FAs can be distinguished from those that are
acquired from the diet. FAs are used directly for energy or are re-esterified, primarily
to triacylglycerols, and stored in adipose tissue. Although metabolism and
biosynthesis of certain FAs occur within the predator, resulting in a FA composition
of its adipose tissue that does not match exactly that of its prey, most FAs are
deposited with little modification or in a predictable way (Iverson et al. 2004). In this
study, we present the analysis of stomach oil and adipose tissue fatty acid signatures
of Northern Fulmars (Fulmarus glacialis).
16
Northern fulmars belong to the order Procellariiformes. Members of this
order are unique among seabirds because they produce stomach oils (Lewis 1966;
Warham 1977; Roby et al. 1993; Roby et al. 1997; Taylor et al. 1997). Close
resemblances were noted between the lipid composition of Procellariiform stomach
oil and other oils found in marine systems (Lewis 1966; Cheah & Hansen 1970ab)
and further studies on the composition of stomach oil and variability between
individuals indicated that it originates from the diet (Lewis 1969; Cheah & Hansen
1970a; Clarke & Prince 1976; Imber 1976; Watts & Warham 1976; Warham 1977;
Jacob 1982; Place et al. 1989). Stomach oils are formed in the proventriculus of both
adults and chicks by a combination of specialized gastric anatomy and physiology
(Roby et al. 1989; Place et al. 1989; Roby et al. 1992; Roby et al. 1993), which
rapidly empties aqueous dietary components from the proventriculus while retaining
the neutral lipids (Roby et al. 1989).
The color of stomach oil has been found to be correlated with diet (Warham et
al. 1976). In fulmars, it ranges from colorless, to shades of yellow, orange, red,
amber, deep reddish-brown, and green (Figure 1.1). Colorless oils may represent
lipids of meso- and bathypelagic fishes (Lewis 1969), while red samples contain
carotenoids and esterified astaxanthin pigments found in planktonic crustaceans or in
squids that have consumed crustaceans (Fisher 1952; Lewis 1969). Green coloration
may arise from a contribution of bile (Fisher 1952; Lewis 1969; Warham 1977).
The composition of stomach oil was first described early in the last century,
but those analyses were incomplete by modern standards, investigating only partial

17
chemical compositions of the oil (Smith 1911; Carter & Malcolm 1927; Carter 1928;
Rosenheim & Webster 1927). Later studies determined that the chemical composition
of stomach oil includes hydrocarbons, monoester waxes, diacylglycerol ethers,
triacylglycerols, diacylglycerols, monoacylglycerols, alcohols, cholesterols, and free
FAs, as well as more polar lipids (Lewis 1966; Lewis 1969; Cheah & Hansen 1970a;
Cheah & Hansen 1970b; Clarke & Prince 1976; Warham et al. 1976). More recently,
Connan et al. (2005) have used lipid classes in stomach oils of Procellariiformes to
infer their diets. Previous studies comparing the FA composition of stomach oil and
adipose tissue of Procellariiformes (Rosenheim & Webster 1926; Lovern 1938;
Cheah & Hansen 1970a; Bishop et al. 1983; Horgan & Barrett 1985; Clarke 1989)
relied on small samples and limited quantitative analysis to distinguish FA signatures
of the two lipid sources.
The eventual goal of our work is to use QFASA to estimate diets of fulmars in
Alaska. In the context of that goal, the objectives of the current study were (1) to
characterize the relationship between FAs in adipose tissue and stomach oil of
individual Northern Fulmars, and (2) to evaluate how well FAs discriminate between
the two lipid sources. We expected that FA signatures from stomach oil and adipose
tissue would differ because adipose tissue FAs are comprised of dietary FAs plus
those that can be biosynthesized, whereas stomach oils contain only dietary FAs that
have not been processed metabolically but may have experienced selective uptake or
release (Place et al. 1989). Additionally, FAs from adipose tissue likely provide
information on dietary intake integrated over an extended interval (e.g., 2-4 weeks;

18
Iverson et al. in prep) whereas stomach oil FAs should represent only the most recent
intake (e.g., 1-2 days: Roby et al. 1989 suggested < 12 hrs for stomach oil to form in
4 week-old Antarctic giant-petrel chicks (Macronectes giganteus). We further
expected to find no consistent pattern for all FAs in stomach oil versus adipose tissue
among individual birds, i.e., relative levels of different FAs in stomach oil and
adipose tissue would vary independently due to individual variability in diets and
differing rates of mobilization and/or utilization.
1.3 Materials and methods
1.3.1 Study sites and sample collection
Samples from adult fulmars and chicks were collected from three of the four
major fulmar colonies in Alaska during the breeding season of 2004: Chowiet Island
in the Semidi Islands group in the western Gulf of Alaska (56˚05' N, 156˚45' W), St.
George Island in the Pribilof Islands group in the eastern Bering Sea (56˚35' N,
170˚35' W), and Chagulak Island in the central Aleutian Archipelago (52˚35' N,
171˚10' W) (Figure 1.2). Samples were not collected on the same dates at the three
islands due to logistical constraints.
Adult birds were captured using a modified dip net, a noose-pole, or by hand
from their nests. Adipose tissue and stomach oil samples were collected from adults
on Chagulak I. in July (n = 26) and St. George I. in June (n = 27) and August (n =
20). Adipose tissue and stomach oil samples were collected from chicks captured by
hand from the nest on Chowiet I. during August (n = 30).

19
To collect stomach oil, the bird’s head was positioned in a Whirl-Pak©
immediately upon capture to ensure minimal loss of sample if the bird willingly
regurgitated during handling. Collected oil samples averaged 80 ml. Within several
hours of being collected, the stomach oil was transferred to glass vials with Teflon
caps containing chloroform with 0.01% BHT as antioxidant for storage.
Biopsy was used to obtain synsacral adipose tissue samples from individuals
(Enderson & Berger 1968). The sampled area was disinfected with chlorhexidine and
a shallow incision approximately 0.5 cm in length was made just through the skin. A
sample of approximately 0.1 g was excised from the subcutaneous fat reservoir and
placed in a vial of chloroform with 0.01% BHT. The incision sites were closed with
Vet-bond © to insure closure and rapid healing, which minimized the chances of
infection. All samples were stored frozen until analyzed.
Morphometric measurements were taken from all individuals. Wing-length
and mass were used to estimate the ages of chicks using a logarithmic curve fitted to
changes in length with age from a sample of known-age chicks (Hatch 1979). Chicks
sampled on Chowiet I. in August were estimated to be 22 ± 5.7 (SD) days old on
average. The age of chicks at fledging is unknown in Alaska, however the mean age
at fledging in Scotland is 53 days (Hatch & Nettleship 1998). On Chowiet I. in 2002,
the first fulmar chick was observed to fledge on September 10 and the first observed
hatching occurred on July 16, inferring an approximate fledging at 56 days of age.

20
1.3.2 Lipid extraction and analysis
Lipids were extracted using a modified Folch extraction (Folch et al. 1957;
Iverson et al. 2001). FA methyl esters were prepared directly from 100 mg of the pure
extracted lipid (filtered and dried over anhydrous sodium sulfate) using 3.0 ml
Hilditch reagent (0.5 N H2SO4 in methanol) and 1.5 ml methylene chloride with
0.01% BHT, capped under nitrogen, and heated at 100°C for 1 hour. FA methyl esters
were then extracted into hexane, concentrated, and brought up to volume (50 mg/ml)
with high purity hexane.
Identification and quantification of FA methyl esters were performed on
samples using temperature-programmed gas liquid chromatography as described
previously (Iverson & Oftedal 1992; Iverson et al. 1997b; Budge et al. 2002; Iverson
et al. 2004) on a Perkin Elmer Autosystem II Capillary FID gas chromatograph fitted
with a 30m x 0.25 mm id column coated with 50% cyanopropyl polysiloxane (0.25µ
film thickness; J&W DB-23; Folsom, California, USA) and linked to a computerized
integration system (Turbochrom 4 software, PE Nelson, San Jose, California, USA).
All sample chromatograms and FA identifications were individually checked,
corrected, and reintegrated as necessary. FAs are expressed as mass percent of total
FAs.
The dietary lipids of most animals, and especially carnivores, consist of
triacylglycerols (3 FAs esterified to a glycerol backbone), reflecting the primary
storage form of lipid in animals. However, in the marine environment a number of
fish and invertebrates store their lipids primarily as wax esters comprised of a FA

21
esterified to a long-chain fatty alcohol (e.g. Benson et al. 1972). Many seabirds have
the ability to digest and assimilate dietary wax esters (Roby et al. 1986). The
presence of fatty alcohols resulting from the transesterification of wax esters in
stomach oil was determined by using thin layer chromatography. Fatty alcohols, and
thus wax esters, were not present in adipose tissue samples. In order to account for
wax esters, the alcohols of which are deposited as FAs in the adipose tissue, extra
precautions were taken to convert wax ester alcohols to their respective FAs when
present. The transesterification process converts the FAs in acyl lipids to FA methyl
esters, however, fatty alcohols and dimethylacetals are also generated if wax esters
are present. Thus, we used a modified Jones’ reagent (13.5 g CrO3, 6.4 ml H2SO4,
43.6 ml distilled water) to oxidize the alcohols and dimethylacetals to free FAs,
which were methylated and quantitatively recombined with FA methyl esters from
the same sample according to Budge & Iverson (2003).
1.3.3 Data analysis
Sixty-nine FAs were identified and quantified in Northern Fulmar lipid
samples. FAs that were used in statistical analyses were chosen by how well they
reflected diet (Iverson et al. 2004). Selected FAs were those with the highest overall
variances, which represented the majority of the signature, and those with overall
means of ≥ 0.35% of the total FAs. Seventeen FAs met these criteria. Despite the
large overall variance of one of those FAs (22:5n-3), it was excluded from the
analyses because it may be an intermediate between 20:5n-3 and 22:6n-3 (e.g.

22
Ackman et al. 1988). All analyses were thus performed using 16 FAs, of which 10 are
considered to be exclusively dietary and 6 could arise from both diet and
biosynthesis. The 16 FAs accounted for 90.8% by mass of the total FAs (Table 1.1).
Percentages of FAs were transformed into log ratios prior to analysis by first
renormalizing the values for the FAs over 100% and then dividing the value for each
of the other FAs by the value for a reference FA, 18:0 (Aitchison 1986; Budge et al.
2002; Iverson et al. 2002). The resulting 15 ratios were then log transformed and used
in the analyses.
Differences between adipose tissue and stomach oil samples were evaluated
using a combination of univariate and multivariate techniques. A MANOVA was
performed on a subset of FAs to evaluate differences in FA signatures between the
two lipid sources in adults from Chagulak I. in July and St. George I. in June and
August. This was followed by an ANOVA using Tukey’s multiple comparisons test
to detect any pair-wise differences between sampling groups. A paired t-test using a
Bonferroni adjustment was used to evaluate differences between individual FAs from
stomach oil and adipose tissue in adults on Chagulak I. in July, St. George I. in June
and August, and chicks on Chowiet I. in August. Discriminant analyses were
performed to reveal patterns of variation between stomach oil and adipose tissue FAs
among adults on Chagulak I. in July, St. George I. in June and August, and chicks on
Chowiet I. in August. Separate discriminant analyses were also performed to
evaluate how well FAs discriminated between adipose tissue and stomach oil from
adults on Chagulak I. in July, St. George I. in June and August, and chicks on

23
Chowiet I. in August. All statistical analyses were performed using the SAS
statistical software (SAS 2000). Wilk’s λ was used as the test of significance of the
discriminant analyses to separate groups. The number of observations correctly
classified and the squared Mahalanobis distances to groups were used to evaluate the
performance of the discriminant analyses. Classifications were cross-validated using a
jack-knife procedure (SAS 2000). The predicted group membership of individuals
based on the jack-knife procedure was examined to determine into which group
individuals were misclassified. Data are presented as means ± standard errors.
Differences are considered significant at p < 0.05.
1.4 Results
There were significant differences in FA signatures between stomach oil and
adipose tissue among adults on Chagulak I. in July and St. George I. in June and
August (p < 0.0001, MANOVA, Figure 3). Levels of 14 FAs were significantly
different (p < 0.0033) between adipose tissue and stomach oil of adults at Chagulak
I.; ten were different for adults on St. George I. in June and nine in August; and 15
were different between the two lipid sources for chicks on Chowiet I. (Figure 1.3,
Table 1.1). Absolute differences between the mean levels of some individual FAs in
stomach oil and adipose tissue were significantly different between sampling groups
(Table 1.1).
We also evaluated how well FAs discriminated between adipose tissue and
stomach oil independently for all four sampling groups. We found that for all groups,

24
100% of the variation between adipose tissue and stomach oil was explained using
the subset of 16 FAs: 98.2% of adults were correctly classified to lipid source on St.
George I. in June and 95.0% in August; 98.1% of adults on Chagulak I. were
correctly classified in July; and 96.7% of chicks were correctly classified on Chowiet
I. in August (Figure 1.4a). The squared Mahalanobis distances between lipid sources
ranged from 39 to 110 standard deviation units (p < 0.0001, Table 1.2). Individual
observations for the first and second discriminant functions on the same plot revealed
similar separation between the two lipid sources for all four sampling groups (Figure
1.4a).
Discriminant analysis showed that the differences in signatures between
stomach oil and adipose tissue were similar for adults on Chagulak I. in July and St.
George I. in August, while differences in signatures between stomach oil and adipose
tissue were best discriminated in adults on St. George I. in June and chicks on
Chowiet I. in August (Figure 1.4b). The Squared Mahalanobis distances from group
centroids ranged from 5 to 20 standard deviation units (p < 0.0001, Table 1.2). The
first and second discriminant functions explained 90.4% of the variation in
differences in lipid sources among adults on Chagulak I. in July, adults on St. George
I. in June and August, and chicks on Chowiet I. in August. The first three
discriminant functions were significant (p < 0.0001), the first function alone
accounted for 52.2% of the variance, and 77.1% of the individuals were correctly
classified.

25
1.5 Discussion
The FA composition of stomach oil and adipose tissue differed substantially
within individual adults and chicks in all regions. We found levels of FAs 14:0, 16:0,
16:1n-7, 16:4n-1, 18:4n-3 and 20:5n-3 to be significantly higher in stomach oil than
in adipose tissue (Fig. 1.3). In contrast, levels of the isomers of the long-chain
monounsaturated FAs 20:1 and 22:1 were generally lower in stomach oils compared
to adipose tissue from the same individuals (Table 1.1, Fig. 1.3). Differences in FA
signatures of adipose tissue and stomach oil could arise from the different time spans
reflected in the samples (i.e., stomach oil represents the last meal whereas adipose
tissue represents a longer term integration of intake). The most recent meals would
likely have a different FA pattern than the average diet if heterogeneous meals were
consumed over time. Additionally, such differences in the composition of the two
lipid sources may be caused by varying degrees of direct deposition of individual FAs
from the diet. Presumably, stomach oil had undergone no metabolic processing of
triacylglycerols and FAs, but was instead a mixture of the triacylglycerols and FAs
from the most recent meal. Also, little is known about any selectivity in uptake or
release of specific FAs from stomach oil. In contrast, the FAs found in adipose had
been digested and assimilated, i.e., released from the glycerol or alcohol backbone,
re-esterified and passed through the circulation, then released, taken up and re-
esterified into adipose tissue. Although it has been shown that many FAs from the
diet are deposited in adipose tissue at an almost 1:1 ratio (Iverson & Springer 2002;
Iverson et al. 2004), it is also known that the effects of metabolism within the
26
predator can affect levels of specific FAs in adipose stores (e.g., Klasing 1998;
Iverson et al. 2004; Cooper et al. 2005).
We observed that wax ester alcohols were only found in Northern Fulmar
stomach oil samples and not in their adipose tissue. This observation is consistent
with our understanding of the metabolic fate of wax esters in predators that store FAs
as triacylglycerols (Budge & Iverson 2003). Many seabirds have the ability to digest
and assimilate dietary wax esters efficiently (Roby et al. 1986), and wax ester
alcohols contribute significantly to the fatty acid composition of adipose tissue in
predators (Budge & Iverson 2003). Therefore, in comparing FA signatures between
stomach oil and adipose tissue, we accounted for the wax ester alcohols that can be
deposited into the adipose tissue. The technique described in Budge & Iverson (2003)
generates a FA signature of prey containing wax esters that is equivalent to that which
the predator has available for deposition upon digestion of that prey, and thus we are
confident that this procedure did not contribute to any significant differences found
between stomach oil and adipose tissue FAs in our fulmar samples.
Although 14:0 can be synthesized by vertebrates, very little of it is released
from the fatty acid synthase enzyme complex and, therefore, a high adipose tissue
concentration of 14:0 is found only when it is acquired from the diet (Nelson 1992).
The low level of 14:0 in adipose tissue of fulmars compared to stomach oil suggests
that 14:0 was mobilized directly from stomach oil before it could be deposited into
the adipose tissue, or explained by the temporal differences between the lipid sources.

27
Lower levels of 16:0 in fulmar adipose tissue compared to stomach oil are
inconsistent with findings for other species of seabirds (Iverson & Springer 2002),
and 16:0 is found to be higher in the blubber of marine mammals than in their prey
due to biosynthesis (Kirsch et al. 2000). One explanation for this difference is that
although animals may have the capacity for synthesizing lipids, many rarely use their
biochemical apparatus for lipid synthesis if their diet includes sufficient fats (Pond
1998). Therefore, lower levels of 16:0 in fulmar adipose tissue may indicate a diet of
prey with similarly low levels of 16:0, or of individuals in a non-fasting state. 16:1n-7
is a precursor for the synthesis of other fatty acids (i.e. 18:1n-7, 20:1n-7) and low
levels in fulmar adipose tissue could be due to its mobilization directly from stomach
oil to produce longer chain FAs rather than using it from adipose tissue. However,
this is not very likely because animals that acquire sufficient fats in their diet will not
biosynthesize FAs (Pond 1998).
Reduced deposition of 18:4n-3 and 20:5n-3 could also be explained by direct
mobilization of these FAs from stomach oil before they can be deposited into adipose
tissue. The n-3 and n-6 FAs are considered essential FAs and deficiencies in them can
cause detrimental effects in membrane and organ function, which may explain why
levels of 18:4n-3 and 20:5n-3 are low in adipose tissue (Innis 1991).
Discriminant analyses revealed a distinct separation between stomach oil and
adipose tissue using the subset of indicator FAs (Figure 1.4a). However, discriminant
analysis using the differences between levels of individual FAs in oil compared to
adipose tissue (Figure 1.4b) indicated otherwise. It showed that (1) a consistent

28
relationship between adipose tissue and stomach oil FAs does not exist or (2) a
consistent relationship does exist but there is significant spatial variation in the diet
that accounts for the differences in signatures. Not all FAs occurred at lower or higher
levels in stomach oil or adipose tissue consistently in all four sampling groups (Figure
1.3, Table 1.1) suggesting that physiological mechanisms alone do not explain the
differences in lipid source signatures and that a combination of diet and physiology
influences the differences between FA acid signatures of stomach oil and adipose
tissue. We suggest that differences in FA signatures of adipose tissue and stomach oil
are due not only to the presence of biosynthesized FAs in adipose tissue, but may also
be explained by a combination of two effects: (1) temporal differences, with stomach
oil signatures representing a short-term diet and adipose tissue signatures reflecting
diet integrated over a longer interval, and (2) different deposition or mobilization
characteristics of individual FAs from oil into adipose tissue. In the first case, large
variation in FA signatures in stomach oil and adipose tissue would be indicative of a
highly variable diet over time, whereas close similarities between the signatures of
the two lipid sources would indicate a temporally homogenous diet.
It is advantageous for seabirds that form stomach oil to directly metabolize
FAs in the oil rather than to deposit them first in adipose tissue and later mobilize
them during periods of fasting, as the latter bears a cost of 25% to 30% of the
assimilated energy (Ricklefs 1974; Spady et al. 1976; Roby et al. 1989; Roby et al.
1997). Preferential accumulation of neutral lipids, predominantly triacylglycerols, in
stomach oil and the rapid gastric emptying of more polar lipids, such as

29
phospholipids, rather than a uniform deposition in adipose tissue may be an important
determinant of FA signatures in stomach oil compared to adipose tissue. Cooper et al.
(2005) have shown that in grey seals (Halichoerus grypus), individual dietary FAs
likely undergo differential metabolism before their assimilation into chylomicrons,
triacylglycerol-rich lipoproteins synthesized in the small intestine of mammals that
act as the primary transport lipoproteins for dietary FAs in blood. This results in
differences between FA composition of seal blubber and prey. In birds, dietary
triacylglycerols are absorbed in the small intestine and incorporated into portomicrons
which are the primary transport lipoproteins. Portomicrons are routed through the
liver, where elongation and desaturation can occur, along with synthesis of
monounsaturated FAs. The liver repackages the dietary lipids and synthesized lipids
and the resulting triacylglycerols are carried to peripheral tissue for energy or stored
in the adipose tissue for later use (Klasing 1998). Because dietary FAs must pass
through the liver, the possibility of extensive modification is greater in birds than in
most mammals. It is therefore important to understand how individual dietary FAs are
being processed in birds.
This study is the first attempt to compare the FA composition of stomach oil
and adipose tissue of Northern Fulmars in detail. FA signature analysis of both
stomach oil and adipose tissue has the potential of being extremely informative, with
stomach oil providing information on the most recent meals and adipose tissue
revealing a diet integrated over a longer period of time. Our investigation has shown
that there are differences between stomach oil and adipose tissue signatures; however,
30
the biological importance of these differences needs to be evaluated. By using
QFASA (Iverson et al. 2004) to model the diets of fulmars using stomach oil and
adipose tissue and a library of known prey FAs, we will be able to determine how
these differences in signatures are biologically significant when making quantitative
inferences on diet. In order to accurately estimate the diet of predators using QFASA,
calibration coefficients must be calculated through captive feeding studies to account
for lipid metabolism (Iverson et al. 2004, Cooper et al. 2005). In addition to
modeling the diet of fulmars from their adipose tissue using calibration coefficients
calculated for other seabirds (Iverson & Springer 2002), stomach oil compositions
without calibration coefficients might be also used to model the diet of fulmars. If the
results of the model are comparable, then the implications are that stomach oil and
adipose tissue FAs represent the same diet, and the less invasive method of using
stomach oil would give the same information as the relatively more invasive adipose
tissue collection. Because stomach oil FAs in essence are an intermediate between
prey and adipose tissue FAs, it is feasible that the differences between stomach oil
and adipose tissue FA signatures may be used to calculate calibration coefficients for
fulmars in lieu of a captive study and, at the very least, reveal metabolic information
of individual FAs in fulmars that may be applied to other seabirds in future studies.

31
1.6 Acknowledgements
We are indebted to G. Siekaniec, G.V. Byrd, and the staff at Alaska Maritime
National Wildlife Refuge for support with our research efforts. We thank A. Larned,
E. Naughter, M. Nielson, N. Bargmann, and A. Ramey for their assistance with field
work; S. Temple and S. Lang at Dalhousie University for assistance with lab
analyses; A. Kitaysky, C.L. Buck, and E. Murphy for providing critical comments on
an earlier manuscript; and S. Henrichs for use of lab equipment at the University of
Alaska Fairbanks. Transportation to field sites was provided by Captain K. Bell and
crew on the M/V Tiglâx, United States Coast Guard Kodiak Air Station, and the late
Captain G. Edwards and crew on the F/V Big Valley. This project was funded by the
U.S. Geological Survey, Alaska Science Center, and the Ken Turner Memorial
Scholarship awarded to S. Wang. Additional support was provided by research and
equipment grants to S.J.I. from the Natural Sciences and Engineering Research
Council (NSERC), Canada. The collection of samples complies with the current rules
of the Institutional Animal Care and Use Committee (IACUC #03-16) at the
University of Alaska Fairbanks, the Alaska Department of Fish and Game (Permits
03-002, 04-061), and the U. S. Fish and Wildlife Service (Special Use Permit 03-009,
04-006).

32
References
Ackman RG, Ratnayake WMN, Olsson B (1988) The ‘basic’ fatty acid composition
of Atlantic fish oils: potential similarities useful for enrichment of polyunsaturated
fatty acids by urea complexation. J Am Oil Chem Soc 65:136 – 138
Aitchison J (1986) The statistical analysis of compositional data. Chapman and Hall,
New York
Benson AA, Lee RF, Nevenzel JC (1972) Wax esters: major marine metabolic energy
sources. In: Ganguly J, Smellie RMS (eds) Current trends in the biochemistry of
lipids. Biochemical Society Symposia, Academic Press, London, pp 175-187
Bishop DG, Ritz DA, Hosie GW, Kenrick JR, Olley J (1983) Fatty acid composition
of the lipids of Puffinus tenuirostris (Temminck) in relation to its diet. J Exp Mar Biol
Ecol 71:17-26
Brown DJ, Boyd IL, Cripps GC, Butler PJ (1999) Fatty acid signature analysis from
the milk of Antarctic fur seals and Southern elephant seals from South Georgia:
implications for diet determination. Mar Ecol Prog Ser 187:251-263
Budge SM, Iverson SJ (2003) Quantitative analysis of fatty acid precursors in marine
samples: direct conversion of wax ester alcohols and dimethylacetals to FAMEs. J
Lipid Res 44:1802-1807
33
Budge SM, Iverson SJ, Bowen WD, Ackman RG (2002) Among-and within-species
variability in fatty acid signatures of marine fish and invertebrates on the Scotian
Shelf, Georges Bank, and southern Gulf of St. Lawrence. Can J Fish Aquat Sci
59:886-898
Cart CL (1928) A chemical investigation of mutton-bird oil. Part II. Comparison of
stomach oil and body fat. J Soc Chem Indust 47:26-30
Carter CL, Malcolm J (1927) Observations on the biochemistry of “mutton bird” oil.
Biochem J 21:484-493
Cheah CC, Hansen IA (1970a) Stomach oil and tissue lipids of the petrels Puffinus
pacificus and Pterodroma macroptera. Int J Biochem 1:203-208
Cheah CC, Hansen IA (1970b) Wax esters in the stomach oil of petrels. Int J
Biochem 1:198-202
Clarke A, Prince PA (1976) The origin of stomach oil in marine birds: analyses of the
stomach oil from six species of subantarctic Procellariiform birds. J Exp Mar Biol
Ecol 23:15-30
Clarke A (1989) Seabirds. In: Ackman RG (ed) Marine biogenic lipids, fats and oils.
CRC Press, Boca Raton, Florida, pp 383-398

34
Connan M, Mayzaud P, Boutoute M, Weimerskirch H, Cherel, Y (2005) Lipid
composition of stomach oil in a procellariiform seabird Puffinus tenuirostris:
implications for food web studies. Mar Ecol Prog Ser 290: 277 - 290
Cook HW (1991) Fatty acid desaturation and chain elongtation in eucaryotes. In:
Vance DE, Vance JE (eds) Biochemistry of lipids and membranes. Elsevier Science,
Amsterdam, The Netherlands, pp 141-169
Cooper MH, Iverson SJ, Heras H (2005) Dynamics of blood chylomicron fatty acids
in a marine carnivore: implications for lipid metabolism and quantitative estimation
of predator diets. J Comp Physiol B 175:133-145
Dahl TM, Falk-Petersen S, Gabrielsen GW, Sargent JR, Hop H, Millar RM (2003)
Lipids and stable isotopes in common eider, black-legged kittiwake and northern
fulmar: a trophic study from an Arctic fjord. Mar Ecol Prog Ser 256:257-269
Enderson J, Berger D (1968) Chlorinated hydrocarbon residues in Peregrines and
their prey species from northern Canada. Condor 70:149-153
Fisher J (1952) The Fulmar. Collins, London
Folch J, Lees M, Sloane-Stanly GH (1957) A simple method for the isolation and
purification of total lipids from animal tissues. J Biol Chem 226:497-509

35
Hatch SA (1979) Breeding and population ecology of northern fulmars (Fulmarus
glacialis) at Semidi Islands, Alaska. M.S. Thesis. University of Alaska Fairbanks,
Alaska.
Hatch SA, Nettleship DN (1998) Northern Fulmar (Fulmarus glacialis). The Birds of
North America, Inc., Philadelphia, PA
Horgan IE, Barrett JA (1985) The use of lipid profiles in comparing the diet of
seabirds. In: Siegfried WR, Condy PR, Laws RM. Antarctic nutrient cycles and food
webs. Springer, Berlin Heidelberg, pp 494-497
Imber MJ (1976) The origin of petrel stomach oils: a review. Condor 78:366-369
Innis SM (1991) Essential fatty acids in growth and development. Prog Lipid Res
30:39-103
Iverson SJ, Springer AM, Kitaysky AS, Byrd GV (in prep) Divergent diets of four
species of seabirds in the Bering Sea estimated from fatty acid signatures: validations
in captive and free-ranging individuals.
Iverson SJ (1993) Milk secretion in marine mammals in relation to foraging: can milk
fatty acids predict diet? Symp Zool Soc Lond 66:263-291
Iverson SJ, Arnould JPY, Boyd IL (1997a) Milk fatty acid signatures indicate both
major and minor shifts in the diet of lactating Antarctic fur seals. Can J Zool 75:188-
197

36
Iverson SJ, Field C, Bowen WD, Blanchard W (2004) Quantitative fatty acid
signature analysis: a new method of estimating predator diets. Ecol Monogr 74:211-
235
Iverson SJ, Frost KJ, Lowry LF (1997b) Fatty acid signatures reveal fine scale
structure of foraging distribution of harbor seals and their prey in Prince William
Sound, Alaska. Mar Ecol Prog Ser 151:255-271
Iverson SJ, Frost KJ, Lang SLC (2002) Fat content and fatty acid composition of
forage fish and invertebrates in Prince William Sound, Alaska: factors contributing to
among and within species variability. Mar Ecol Prog Ser 241:161-181
Iverson SJ, Lang SLC, Cooper MH (2001) Comparison of the Bligh and Dyer and
Folch methods for total lipid determination in a broad range of marine tissue. Lipids
36:1283-1287
Iverson SJ, Oftedal OT (1992) Fatty acid composition of black bear (Ursus
americanus) milk during and after the period of winter dormancy. Lipids 27:940-943
Iverson SJ, Springer AM (2002) Estimating seabird diets using fatty acids: protocol
development and testing of ReFER Hypotheses. NPMR Final Report.
Jacob J (1982) Stomach Oils. In: Farner DS, King JR, Parkes KC (eds) Avian
Biology. Academic Press, London, pp 325-340

37
Kirsch PE, Iverson SJ, Bowen WD (2000) Effect of a low-fat diet on body
composition and blubber fatty acids of captive juvenile harp seals (Phoca
groenlandica). Physiol Biochem Zool 73:45-59
Klasing KC (1998) Comparative avian nutrition. Cab International, New York
Lewis RW (1966) Studies of glyceryl ethers of the stomach oil of Leach's Petrel,
Oceanodroma leucorhoa. Comp Biochem Physiol 19:363-377
Lewis RW (1969) Studies on the stomach oils of marine animals. II. Oils of some
procellariiform birds. Comp Biochem Physiol 31:725-731
Lovern JA (1938) The body fats of some seabirds. Biochem J 32:2142-2144
Nelson GJ (1992) Dietary fatty acids and lipid metabolism. In: Chow CK (ed) Fatty
acids in foods and their health implications. Dekker, New York, pp 437-471
Place AR, Stoyan NC, Ricklefs RE, Butler RG (1989) Physiological basis of stomach
oil formation in Leach's storm-petrel (Oceanodroma leucorhoa). Auk 106:687-699
Pond CM (1998) The fats of life. Cambridge University Press, Cambridge, UK
Raclot T, Groscolas R, Cherel Y (1998) Fatty acid evidence for the importance of
myctophid fishes in the diet of king penguins, Aptenodytes patagonicus. Mar Biol
132:523-533
38
Ricklefs RE (1974) Energetics of reproduction in birds. Publications of the Nuttall
Ornithological Club No.15, pp 152-292
Roby DD, Place AR, Ricklefs RE (1986) Assimilation and deposition of wax esters in
planktivorous seabirds. J Exp Zool 238:19-41
Roby DD, Taylor JRE, Place AR (1993) Physiological aspects of stomach oil
formation in Antarctic seabirds. Antarct J US 28:146-147
Roby DD, Taylor JRE, Place AR (1997) Significance of stomach oil for reproduction
in seabirds: an interspecies cross-fostering experiment. Auk 114:725-736
Roby DD, Brink KL, Place AR (1989) Relative passage rates of lipid and aqueous
digesta in the formation of stomach oils. Auk 106:303-313
Roby DD, Taylor JRE, Place AR (1992) Investigation of the adaptive role of stomach
oils in seabird reproduction. Antarct J US 7:147-178
Rosenheim O, Webster TA (1926) The stomach oil of the fulmar petrel (Fulmarus
glacialis). Biochem J 21:111-118
SAS (2000) Release 8.01 edition. SAS Institute, Cary, North Carolina, USA
Smith LH (1911) Some constants of mutton bird oil. J Soc Chem Indust 30:405
Spady DW, Payne PR, Picou D, Waterlow JC (1976) Energy balance during recovery
from malnutrition. Am J Clin Nutr 29:1073-1078

39
Taylor JRE, Place AR, Roby DD (1997) Stomach oil and reproductive energetics in
Antarctic prions, Pachyptila desolata. Can J Zool 75:490-500
Warham J (1977) The incidence, functions and ecological significance of petrel
stomach oils. Proc New Zeal Ecol Soc 24:84-93
Warham J, Watts R, Dainty RJ (1976) The composition, energy content and function
of the stomach oils of petrels (order, Procellariiformes). J Exp Mar Biol Ecol 23:1-13
Watts R, Warham J (1976) Structure of some intact lipids of petrel stomach oils.
Lipids 11:423-429

40
Table 1.1. Mean values for fatty acid composition of adipose tissue and stomach oil. Mean diff. = mean differences between values for adipose tissue and stomach oil ± SD.
fat oil mean diff. p-value fat oil mean diff. p-value
Saturated (14.68 ± 3.130) (17.76 ± 2.19) (18.75 ± 2.509) (31.18 ± 10.32)14:0* 3.19 ± 0.969 4.97 ± 1.247 1.78 ± 1.204a,b <.0001 7.46 ± 2.215 18.79 ± 9.675 11.33 ± 8.887a <.000116:0* 8.55 ± 2.009 11.11 ± 1.594 2.56 ± 2.006a,b <.0001 8.66 ± 1.578 11.02 ± 1.692 2.36 ± 2.495b <.000117:0 0.10 ± 0.038 0.07 ± 0.017 0.11 ± 0.077 0.06 ± 0.03918:0* 2.84 ± 0.564 1.61 ± 0.531 - - 2.51 ± 0.784 1.30 ± 1.223 - -20:0 0.30 ± 0.067 0.15 ± 0.035 0.37 ± 0.070 0.35 ± 0.098Monounsaturated (67.99 ± 7.305) (57.57 ± 7.22) (67.14 ± 6.348) (51.94 ± 10.988)16:1n-11 0.29 ± 0.093 0.34 ± 0.064 0.30 ± 0.094 0.21 ± 0.07016:1n-7* 3.35 ± 1.319 6.30 ± 1.058 2.94 ± 1.343a <.0001 2.96 ± 0.957 3.57 ± 1.011 0.61 ± 0.919a,b <.000118:1n-11 0.53 ± 0.210 0.33 ± 0.154 0.67 ± 0.197 0.23 ± 0.33018:1n-9* 13.05 ± 3.63 13.08 ± 3.925 0.04 ± 3.881a <.0001 7.48 ± 4.283 3.15 ± 2.876 4.33 ± 3.835b 0.024118:1n-7* 2.95 ± 1.7073 3.62 ± 1.093 0.67 ± 0.871a <.0001 1.78 ± 1.264 1.16 ± 1.173 0.63 ± 1.216b 0.121518:1n-5 0.43 ± 0.091 0.62 ± 0.144 0.45 ± 0.065 0.51 ± 0.07720:1n-11* 19.57 ± 3.775 12.02 ± 1.891 7.56 ± 3.097a 0.1360 28.78 ± 7.629 22.57 ± 7.908 6.21 ± 10.170a 0.001820:1n-9* 4.11 ± 0.820 3.92 ± 1.097 0.20 ± 0.902a <.0001 3.77 ± 0.572 2.89 ± 0.524 0.88 ± 0.579a <0.000120:1n-7 0.47 ± 0.120 0.29 ± 0.070 0.510 ± 0.157 0.19 ± 0.17222:1n-11* 22.97 ± 7.154 17.09 ± 4.729 5.88 ± 5.190a,b 0.0030 20.66 ± 4.501 17.75 ± 4.752 2.91 ± 6.761a 0.000222:1n-9* 1.52 ± 0.479 1.25 ± 0.446 0.27 ± 0.415a,b 0.0020 1.20 ± 0.286 0.67 ± 0.306 0.53 ± 0.386a 0.103122:1n-7 0.30 ± 0.083 0.25 ± 0.083 0.25 ± 0.051 0.16 ± 0.060Polyunsaturated (10.55 ± 3.93) (15.54 ± 6.46) (8.31 ± 4.237) (10.55 ± 7.228)16:2n-4 0.24± 0.124 0.47 ± 0.159 0.29 ± 0.092 0.42 ± 0.19416:3n-6 0.21 ± 0.084 0.27 ± 0.142 0.11 ± 0.056 0.07 ± 0.05516:4n-1 0.18 ± 0.133 0.64 ± 0.711 0.23 ± 0.124 1.01 ± 0.657
18:2n-6* 0.99 ± 0.076 0.92 ± 0.182 0.07 ± 0.182a <.0001 0.67 ± 0.156 0.36 ± 0.214 0.31 ± 0.162b 0.587218:3n-3* 0.43 ± 0.131 0.51 ± 0.088 0.08 ± 0.122a <.0001 0.24 ± 0.109 0.19 ± 0.171 0.05 ± 0.110b 0.002018:4n-3* 1.25± 0.795 2.03 ± 1.305 0.78 ± 1.023a <.0001 0.90 ± 0.528 1.70 ± 1.215 0.80 ± 0.858a <.000120:2n-6 0.26 ± 0.062 0.25 ± 0.074 0.14 ± 0.041 0.09 ± 0.07020:4n-6* 0.25 ± 0.052 0.29 ± 0.065 0.04 ± 0.068a <.0001 0.23 ± 0.094 0.24 ± 0.307 0.01 ± 0.316a <.000120:4n-3 0.31 ± 0.136 0.47 ± 0.102 0.18 ± 0.105 0.24 ± 0.25220:5n-3* 2.54 ± 1.581 6.83 ± 3.706 4.29 ± 3.348a <.0001 2.05 ± 1.269 4.61 ± 3.304 2.56 ± 3.236a <.000121:5n-3 0.22 ± 0.108 0.33 ± 0.165 0.18 ± 0.103 0.16 ± 0.19122:5n-3 1.21 ± 0.347 0.51 ± 0.208 1.26 ± 0.388 0.46 ± 0.51922:6n-3* 4.12 ± 1.507 4.31 ± 1.571 0.19 ± 1.416a <.0001 2.98 ± 2.204 2.18 ± 2.275 0.80 ± 2.294b 0.160324:1n-9 0.96 ± 0.440 1.20 ± 0.571 0.63 ± 0.228 0.42 ± 0.164
Chagulak Is. July (n = 26) St. George Is. June (n = 27)

41
Table 1.1 continued
fat oil mean diff. p-value fat oil mean diff. p-valueSaturated (16.00 ± 2.467) (19.39 ± 1.234) (15.29 ± 2.785) (16.02 ± 3.115)14:0* 3.443 ± 1.015 5.01 ± 1.484 1.56 ± 0.924b <.0001 2.46 ± 0.588 3.87 ± 0.610 1.41 ± 0.671a,b <.000116:0* 9.09 ± 1.711 11.33 ± 1.428 2.24 ± 1.697a <.0001 9.55 ± 1.891 9.81 ± 2.045 0.26 ± 1.903a <.000117:0 0.15 ± 0.051 0.55 ± 0.253 0.28 ± 0.052 0.65 ± 0.40118:0* 3.32 ± 0.608 2.51 ± 0.897 - - 3.00 ± 0.547 1.69 ± 0.863 - -20:0 0.27 ± 0.071 0.11 ± 0.042 0.25 ± 0.050 0.13 ± 0.032Monounsaturated (59.88 ± 6.809) (49.06 ± 2.811) (67.12 ± 5.880) (62.92 ± 6.906)16:1n-11 0.30 ± 0.098 0.33 ± 0.100 0.37 ± 0.101 0.32 ± 0.04216:1n-7* 3.86 ± 1.086 5.77 ± 0.718 1.91 ± 1.105b <.0001 3.61 ± 0.992 6.04 ± 0.564 2.43 ± 1.089a,b <.000118:1n-11 0.94 ± 0.462 0.91 ± 0.364 0.58 ± 0.198 0.35 ± 0.16018:1n-9* 12.80 ± 3.384 12.15 ± 4.641 0.65 ± 3.134a 0.0052 18.11 ± 3.222 15.46 ± 3.364 2.65 ± 4.011a <.000118:1n-7* 3.61 ± 1.009 4.23 ± 1.354 0.62 ± 0.905a,b <.0001 3.07 ± 1.003 3.12 ± 1.057 0.05 ± 1.002a <.000118:1n-5 0.49 ± 0.086 0.56 ± 0.149 0.57 ± 0.108 0.72 ± 0.15320:1n-11* 17.44 ± 4.282 12.06 ± 2.686 5.38 ± 4.385a 0.6916 17.20 ± 4.169 12.67 ± 2.786 4.52 ± 3.410a 0.003120:1n-9* 3.54 ± 0.706 2.98 ± 0.538 0.56 ± 0.612a 0.1292 5.01 ± 0.720 4.57 ± 0.815 0.44± 0.749a <.000120:1n-7 0.47 ± 0.206 0.32 ± 0.318 0.51 ± 0.083 0.37 ± 0.07022:1n-11* 17.03 ± 5.327 10.83 ± 3.247 6.20 ± 5.257b 0.2989 18.26 ± 4.496 19.196 ± 5.015 0.94 ± 4.650a <.000122:1n-9* 1.13 ± 0.418 0.72 ± 0.222 0.41 ± 0.318a 0.3270 1.36 ± 0.269 1.49 ± 0.345 0.13 ± 0.309b <.000122:1n-7 0.22 ± 0.071 0.16 ± 0.069 0.22 ± 0.045 0.25 ± 0.059Polyunsaturated (16.59 ± 4.105) (22.62 ± 2.572) (10.28 ± 3.098) (11.38± 5.015)16:2n-4 0.19 ± 0.034 0.19 ± 0.046 0.35 ± 0.088 0.52 ± 0.16216:3n-6 0.29 ± 0.109 0.44 ± 0.125 0.16 ± 0.078 0.26 ± 0.08416:4n-1 0.25 ± 0.138 0.59 ± 0.274 0.06 ± 0.052 0.16 ± 0.12118:2n-6* 0.98 ± 0.207 0.82 ± 0.141 0.15 ± 0.139a,b 0.0151 1.28 ± 0.095 1.083 ± 0.147 0.20 ± 0.168a <.000118:3n-3* 0.55 ± 0.221 0.63 ± 0.208 0.08 ± 0.165a,b <.0001 0.53 ± 0.136 0.55 ± 0.109 0.02 ± 0.140a,b <.000118:4n-3* 1.96 ± 0.935 3.15 ± 1.245 1.20 ± 0.877a <.0001 0.64 ± 0.391 1.09 ± 0.534 0.46 ± 0.440a <.000120:2n-6 0.29 ± 0.040 0.3 ± 0.080 0.3 ± 0.043 0.25 ± 0.04420:4n-6* 0.34 ± 0.122 0.43 ± 0.586 0.09 ± 0.543b 0.0002 0.33 ± 0.126 0.36 ± 0.113 0.03 ± 0.160a <.000120:4n-3 0.47 ± 0.155 0.64 ± 0.289 0.32 ± 0.126 0.41 ± 0.16320:5n-3* 4.79 ± 2.186 9.24 ± 1.038 4.45 ± 2.003a <.0001 1.95 ± 1.167 4.10 ± 2.476 2.15 ± 1.895a <.000121:5n-3 0.34 ± 0.105 0.49 ± 0.060 0.12 ± 0.071 0.21 ± 0.10322:5n-3 1.40 ± 0.492 0.94 ± 0.511 1.26 ± 0.469 0.69 ± 0.47622:6n-3* 6.88 ± 1.637 7.43 ± 1.547 0.56 ± 1.708a,b <.0001 4.77 ± 1.326 3.90 ± 1.795 0.87 ± 1.759a,b <.000124:1n-9 0.61 ± 0.220 0.58 ± 0.192 0.67 ± 0.185 1.52 ± 0.415
Chowiet Is. August (chicks n = 30)St. George Is. August (n = 20)
a Values are mean mass percent ± SD of fatty acids (31 out of 69, including reference FA 18:0) which averaged ≥ 0.2% among samples analyzed, with totals in parentheses. *Designates the 16 fatty acids used in analyses. Values for mean diff. are absolute values in percentages: values for the same FAs that do not share a common superscript letter are significantly different (p < 0.0033, Tukey’s multiple comparison test). P-values are shown for paired t-tests using the Bonferroni adjustment to evaluate differences between adipose tissue and stomach oil.

42
Table 1.2. Squared Mahalanobis distances from discriminant analysis. Distances to group centroids in standard deviation units (p < 0.0001): (a) for mean absolute differences between stomach oil and adipose tissue, and (b) between lipid source signatures for adults on Chagulak I. in July, St. George I. in June and August 2004, and chicks on Chowiet I. in August 2004.
(a)From Group Chowiet I. Aug. Chagulak I. Jul. St. George I. Aug. St. George I. Jun.Chowiet I. Aug. 0.00 10.35 14.12 18.94Chagulak I. Jul. 10.35 0.00 4.44 12.26St. George I. Aug. 14.12 4.44 0.00 13.96St. George I. Jun. 18.94 12.26 13.96 0.00(b)From lipid source Chowiet I. Aug. Chagulak I. Jul. St. George I. Aug. St. George I. Jun.Stomach oilChowiet I. Aug. 52.92 - - -Chagulak I. Jul. - 36.28 - -St. George I. Aug. - - 26.94 -St. George I. Jun. - - - 30.38
Group = mean differences between stomach oil and adipose tissue
Adipose tissue

43
Figure 1.1. Range of coloration of stomach oil. Samples collected from Northern Fulmars in Alaska. Most samples displayed shades of yellow, orange, or red. Occasional greenish samples (not shown) probably contained bile (Fisher 1952; Lewis 1969; Warham 1977).

44
Figure 1.2. Locations of the four major fulmar colonies in Alaska. 1) Semidi Islands (56˚05' N, 156˚45' W) in the western Gulf of Alaska; 2) Chagulak Island (52˚35' N, 171˚10' W) in the eastern Aleutian Islands; 3) Pribilof Islands (56˚35' N, 170˚35' W) in the eastern Bering Sea; and 4) St. Matthew and Hall islands (60˚40' N, 173˚10' W) in the northern Bering Sea. Studies were not undertaken at the latter site.
Western Gulf of Alaska
Bering Sea
Semidi Is. (Chowiet I.)
Pribilof Is. (St. George I.)
Chagulak I.
St. Matthew/Hall Is.
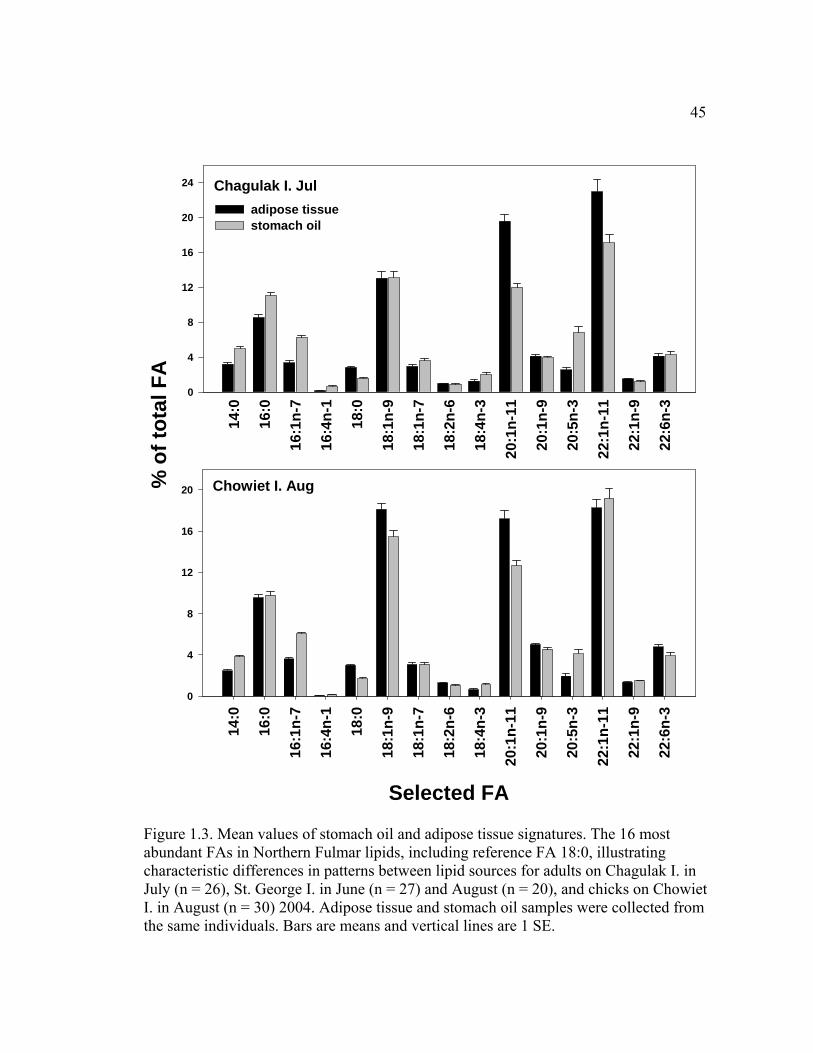
45
Chagulak I. Jul
14:
0
16:
0
16:
1n-7
16:
4n-1
18:
0
18:
1n-9
18:
1n-7
18:
2n-6
18:
4n-3
20:
1n-1
1
20:
1n-9
20:
5n-3
22:
1n-1
1
22:
1n-9
22:
6n-3
% o
f tot
al F
A
0
4
8
12
16
20
24
adipose tissuestomach oil
Chowiet I. Aug
Selected FA
14:
0
16:
0
16:
1n-7
16:
4n-1
18:
0
18:
1n-9
18:
1n-7
18:
2n-6
18:
4n-3
20:
1n-1
1
20:
1n-9
20:
5n-3
22:
1n-1
1
22:
1n-9
22:
6n-3
0
4
8
12
16
20
Figure 1.3. Mean values of stomach oil and adipose tissue signatures. The 16 most abundant FAs in Northern Fulmar lipids, including reference FA 18:0, illustrating characteristic differences in patterns between lipid sources for adults on Chagulak I. in July (n = 26), St. George I. in June (n = 27) and August (n = 20), and chicks on Chowiet I. in August (n = 30) 2004. Adipose tissue and stomach oil samples were collected from the same individuals. Bars are means and vertical lines are 1 SE.

46
St. George I. Jun
14:
0
16:
0
16:
1n-7
16:
4n-1
18:
0
18:
1n-9
18:
1n-7
18:
2n-6
18:
4n-3
20:
1n-1
1
20:
1n-9
20:
5n-3
22:
1n-1
1
22:
1n-9
22:
6n-3
0
4
8
12
16
20
24
28
32
adipose tissuestomach oil
St. George I. Aug
Selected FA
14:
0
16:
0
16:
1n-7
16:
4n-1
18:
0
18:
1n-9
18:
1n-7
18:
2n-6
18:
4n-3
20:
1n-1
1
20:
1n-9
20:
5n-3
22:
1n-1
1
22:
1n-9
22:
6n-3
0
5
10
15
20% o
f tot
al F
A
Figure 1.3 continued
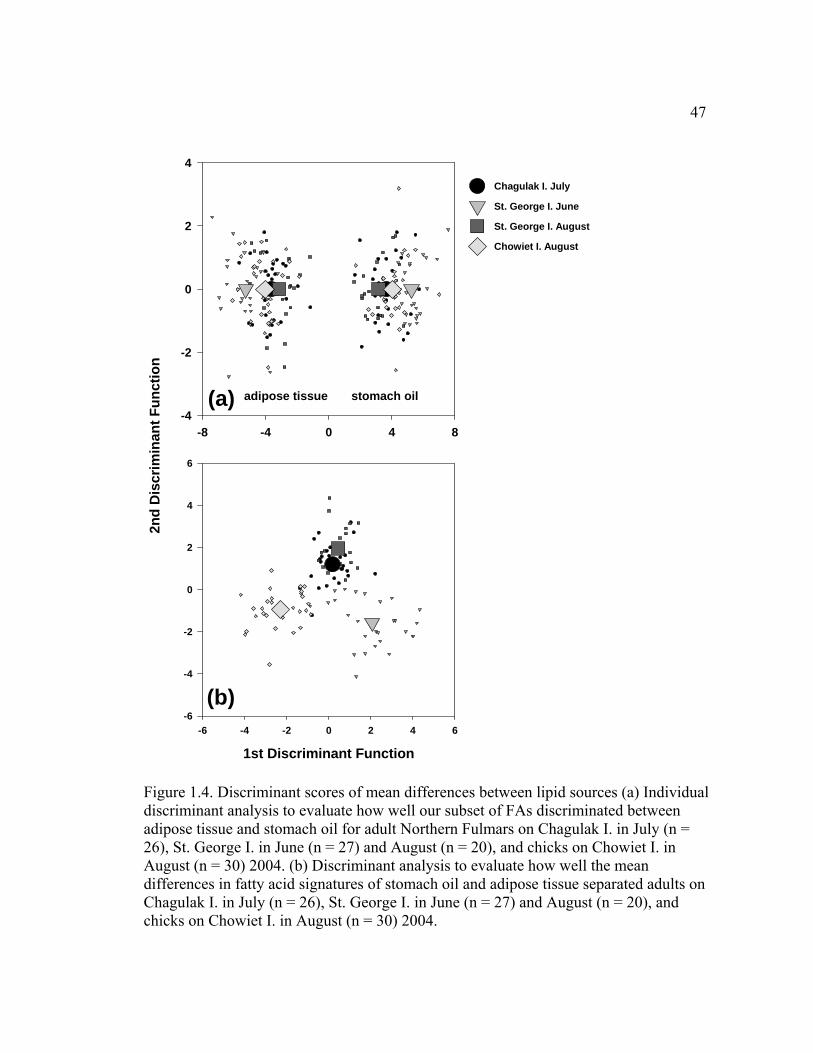
47
-8 -4 0 4 8-4
-2
0
2
4
1st Discriminant Function
-6 -4 -2 0 2 4 6
2nd
Dis
crim
inan
t Fun
ctio
n
-6
-4
-2
0
2
4
6
Chagulak I. July
St. George I. June
St. George I. August
Chowiet I. August
(a)
(b)
adipose tissue stomach oil
Figure 1.4. Discriminant scores of mean differences between lipid sources (a) Individual discriminant analysis to evaluate how well our subset of FAs discriminated between adipose tissue and stomach oil for adult Northern Fulmars on Chagulak I. in July (n = 26), St. George I. in June (n = 27) and August (n = 20), and chicks on Chowiet I. in August (n = 30) 2004. (b) Discriminant analysis to evaluate how well the mean differences in fatty acid signatures of stomach oil and adipose tissue separated adults on Chagulak I. in July (n = 26), St. George I. in June (n = 27) and August (n = 20), and chicks on Chowiet I. in August (n = 30) 2004.

48
Chapter 2. Fatty Acids in Northern Fulmars (Fulmarus glacialis) breeding in
Alaska: a qualitative comparison of diet2
2.1 Abstract
Variations in the diet composition of a generalist predator may be indicative of
changes in the ecosystem. Diets of Northern Fulmars (Fulmarus glacialis) in the North
Pacific Ocean are poorly known, and thus relationships of fulmars to supporting food
webs and their potential sensitivity to ecosystem variability also are uncertain. We
employed fatty acid signature analysis of adipose tissue from adults and chicks to
examine dietary differences among fulmars breeding at the three largest colonies in
Alaska. We found conspicuous differences between fatty acid signatures of adult fulmars
at the three locations within years, and between seasons at individual colonies. Inter-
annual differences in signatures at individual colonies were not as great as seasonal and
spatial differences. We conclude that differences in FA signatures reflect differences in
diet composition, probably because the colonies are located in distinct oceanographic
settings, which create unique habitats for prey assemblages, and inter-annual variation in
diet reflects variation in the physical environment. Comparison of adults and chicks
revealed similarities in differences between age class signatures in 2003 and 2004,
P
2PPrepared for submission to Marine Ecology Progress Series as Wang, S. W., Iverson,
S. J., Springer, A. M., and Hatch, S.A. Fatty acids in Northern Fulmars breeding in
Alaska: a qualitative comparison of diet.

49
suggesting that adults fed chicks a diet different than that they consumed themselves.
Keywords fatty acids, Northern Fulmar, Fulmarus glacialis, Alaska, diet analysis

50
2.2 Introduction
Northern fulmars (Fulmarus glacialis) are opportunistic and generalist predators.
In the North Pacific Ocean, fulmars feed on cephalopods, zooplankton, lantern fishes
(Myctophidae), Scyphozoan jellyfish, juveniles of commercial fish species, e.g., walleye
pollock (Theragra chalcogramma), and other forage species that are critical to pelagic
food webs and sensitive indicators of environmental change, e.g., capelin (Mallotus
villosus) and Pacific sandlance (Ammodytes hexapterus) (Preble & McAtee 1923,
Bradstreet 1985, Hunt et al. 1981a, Hunt et al. 1981b, Harrison 1984, Sanger 1983, Hills
& Fiscus 1988, Gould et al. 1997, Hatch & Nettleship 1998, Hatch unpubl.). Fulmars also
follow fishing vessels for offal (Fisher 1952, Hunt et al. 1981b, Hatch 1993). However,
diets of fulmars at nesting colonies in summer are poorly known in the N. Pacific. Thus,
relationships of fulmars to supporting food webs, and the sensitivity of fulmars to
ecosystem variability, such as that driven by a changing climate or by commercial
fisheries, also are highly uncertain.
The population of fulmars in North America is estimated at 2.1 million
individuals with 70% occurring in Alaska (Hatch & Nettleship 1998). There are four
major breeding colonies in Alaska: 1) Chagulak Island (52˚35' N, 171˚10' W), located in
a deep oceanic basin in the central Aleutian Archipelago, has a population estimated at
500 000; 2) St. Matthew and Hall Islands (60˚30' N, 172˚45' W) located in the middle of
the large continental shelf in the central Bering Sea has approximately 450 000
individuals; 3) the Semidi Islands (56˚05' N, 156˚45' W) in the western Gulf of Alaska,
where the local oceanography is primarily influenced by the Alaska Coastal Current and

51
the Alaska Stream has approximately 440 000 individuals; and 4) the Pribilof Islands
(56˚35' N, 170˚35' W), located near the continental shelf edge in the southeastern Bering
Sea, have approximately 79 700 individuals (Hatch & Hatch 1983, Hatch 1993, Fig. 2.1).
The locations of these colonies in distinct oceanographic settings, i.e., in distinct habitats,
provide opportunities for characteristic prey assemblages and food webs to form. By
understanding the foraging ecology and diets of fulmars and other marine birds in diverse
habitats, predator-prey relationships and foraging patterns can be used in comparative
ways as measures of the impact of environmental variation on the birds and the
ecosystem.
There are several well-known problems and biases associated with traditional
methods of estimating seabird diets, such as analysis of stomach contents, including
differential retention of prey hard parts and the need to sacrifice animals (Furness et al.
1984; Harrison 1984; Duffy & Jackson 1986; Jobling & Breiby 1986; Annett & Pierotti
1989; Votier et al. 2003). Most of the problems are eliminated by using fatty acid (FA)
analysis to estimate diets. The concept of using lipids as biomarkers and general
indicators of diets of predators in marine ecosystems has been applied for many years
(Sargent et al. 1988), and the analysis of FAs in reservoir lipids (adipose tissue and
blubber) has been used to infer trophic levels, as well as spatial and temporal patterns in
foraging behavior, of free ranging marine mammals and seabirds (Iverson & Oftedal
1992, Iverson 1993, Iverson et al. 1997a, Iverson et al. 1997b, Kirsch et al. 2000, Iverson
et al. 2001b, Brown et al. 1999, Raclot et al. 1998, Iverson & Springer 2002, Dahl et al.
2003).

52
FA signature analysis is based on the knowledge that prey species have
characteristic FA patterns, or signatures, and that specific FAs of carbon chain length ≥
14 from prey are incorporated with little change into the body fat of marine predators and
can thus be used as qualitative and quantitative diet tracers (Iverson 1993, Iverson et al.
2004). Some FAs can be synthesized by animals, but the number is limited (Cook 1991)
and they can be distinguished from those that are acquired only from the diet. Once
ingested, FAs are used for energy directly or are re-esterified, primarily to
triacylglycerols, and stored in adipose tissue. Although metabolism and synthesis of
certain FAs occur within the predator, resulting in a FA composition of its adipose tissue
that does not match exactly that of its prey (Iverson et al. 2004), most FAs are deposited
with little modification and in a predictable way.
The objectives of this study were to use FA signatures to assess spatial (between
colonies), temporal (seasonal and inter-annual), and age class (adult-chick) variability in
the diet of fulmars at three colonies in Alaska. We predicted that the diets would: 1)
differ among colonies because they are located in distinct marine habitats with different
prey assemblages; 2) differ inter-annually because of variability in the physical
environment and the production and availability of prey; 3) differ seasonally due to
availability of prey whose presence and abundance respond to seasonal physical and
biological cycles; and 4) not differ between adults and chicks because adult fulmars feed
their chicks by regurgitation of the meal they have just consumed, and theoretically
chicks receive an aliquot of the homogenized meal.

53
2.3 Materials and Methods
2.3.1 Sample collection
Samples of adipose tissue were collected from adult fulmars on Chowiet I.
(Semidi Islands) during the incubation stage in May 2003 (n = 30) and 2004 (n = 25), and
during the chick-rearing stage in August 2003 (n = 27) and 2004 (n = 31); on St. George
I. (Pribilof Islands) during incubation in June 2003 (n = 29) and 2004 (n = 30), and
during the chick-rearing stage in August 2003 (n = 9) and 2004 (n = 26); and on
Chagulak I. during incubation in July 2004 (n = 30). Samples of adipose tissue were
collected from chicks and one respective parent on Chowiet I. during August 2003 (n = 8
pairs) and 2004 (n = 25 pairs). Samples were not collected on the same dates at the three
islands due to logistical constraints. Fulmars at St. Matthew I. and Hall I. were not
sampled.
Adult birds were captured using a modified dip net or a noose-pole, or by hand at
the nest. Chicks were captured by hand from the nest. A live biopsy technique was used
to obtain synsacral adipose tissue samples from individuals (Enderson & Berger 1968;
Iverson & Springer 2002). The area was disinfected with chlorhexidine and an incision of
approximately 0.5 cm in length was made through the skin. A small sample of adipose
tissue of approximately 0.1 g was excised from the fat layer and placed in a vial of
chloroform with 0.01% BHT as an antioxidant. Vet-bond© was applied on the incision to
insure closure and rapid healing.

54
Morphometric measurements were taken from all individuals. Wing-length and
mass were used to estimate the ages of chicks (Hatch 1979). All samples were stored
frozen until analyzed.
2.3.2 Lipid extraction and analysis
Lipids were extracted using a modified Folch extraction (Folch et al. 1957,
Iverson et al. 2001a). FA methyl esters were prepared directly from ≤ 100 mg of the pure
extracted lipid (filtered and dried over anhydrous sodium sulfate) using 3.0 ml Hilditch
reagent (0.5 N H2SO4 in methanol) and 1.5 ml methylene chloride with 0.01% BHT,
capped under nitrogen, and heated at 100°C for 1 hour. FA methyl esters were then
extracted into hexane, concentrated, and brought up to volume (50 mg/ml) with high
purity hexane.
FA methyl esters were quantified using temperature-programmed gas liquid
chromatography as described previously (Iverson & Oftedal 1992, Iverson et al. 1997b,
Budge et al. 2002, Iverson et al. 2004) on a Perkin Elmer Autosystem II Capillary FID
gas chromatograph fitted with a 30m x 0.25 mm id column coated with 50% cyanopropyl
polysiloxane (0.25µ film thickness; J&W DB-23; Folsom, California, USA) and linked to
a computerized integration system (Turbochrom 4 software, PE Nelson, San Jose,
California, USA). Fatty acids and isomers were identified using known standard mixtures
(Nu Check Prep., Elysian, Minnesota, USA), silver-nitrate (argentation) chromatography,
and GC-mass spectrometry (Hewlett-Packard 6890 Gas Chromatograph, 1:20 split
injection, Micromass Autospec oa-TOF mass spectrometer, operated at 1000 resolution

55
and scanning masses 120 to 450 [Hewlett Packard, Palo Alto, California, USA]). GC
columns were kept in good condition by changing septa daily, cleaning the injector liner
regularly, use of a guard column, and frequent replacement. All sample chromatograms
and fatty acid identifications were individually checked and corrected and reintegrated as
necessary. FAs are expressed as mass percent of total FAs and are designated by short-
handed nomenclature of carbon chain length, number of double bonds and location (n-x)
of the double bond nearest the terminal methyl group.
2.3.3 Data analysis
Not all FAs are indicative of diet and appropriate for use in statistical analysis
(Iverson et al. 2004). FAs that were used in our analyses were chosen by how well they
indicated diet, which included those with the largest overall variances and overall means
≥ 0.2% of the total FAs. Seventeen FAs met these criteria and represented the majority of
the signature. Despite the large overall variance of one of these, 22:5n-3, it was not used
as it may be an intermediate between 20:5n-3 and 22:6n-3 (e.g. Ackman et al. 1988).
Thus, all analyses were performed using 16 FAs, of which 10 come from diet alone and 6
arise from both biosynthesis and diet: together these FAs accounted for 90.9% by mass of
the total FAs (Table 2.1). Percentages of the 16 FAs were renormalized over 100% and
the values were divided by the value for a reference FA, 18:0 (Aitchison 1986). The
resulting 15 ratios were then log transformed and used in the analyses. The sample size of
any group used in discriminant analysis must be greater than the number of variables

56
used (Stevens 1986, Legendre & Legendre 1998), and, therefore, only groups with 16 or
more samples were included in the analyses.
Differences in FA signatures among adult fulmars and between adults and chicks
were evaluated using a combination of univariate and multivariate techniques. Due to
sample size restrictions mentioned above, data from adults on St. George I. in August
2003 (n = 9) and chicks and adults on Chowiet I. in August 2003 (n = 8 pairs) were only
included in the principle component analysis (PCA). The seven ratios resulting from the
eight FAs with the highest overall variance were used to conduct a paired t-test for chicks
and adults on Chowiet I. in August 2003. Because most samples were not repeated, each
data set (e.g., Chowiet I. in May 2004) was treated as an individual sampling group and
we performed a MANOVA followed by ANOVA using Tukey’s multiple comparisons
test with the Bonferroni adjustment to detect pair-wise differences in mean
concentrations of FAs between groups. A 2-factor MANOVA was used to evaluate
overall year or month effects of FA concentrations for adults sampled on Chowiet I. in
May and August 2003 and 2004. A 1-factor MANOVA was used to evaluate any overall
month effects for adults sampled on St. George I. in June and August 2004, and to
evaluate any overall year effects for adults sampled on St. George I. in June of 2003 and
2004. PCA and discriminant analyses were used to evaluate how well our subset of FAs
discriminated among all sampling groups. Scores for individual samples from PCA were
used as response variables in an ANOVA to analyze the effect of each sampling group on
FAs.

57
We used a paired t-test with a Bonferroni adjustment to evaluate differences
between individual FAs from adults and chicks on Chowiet I. during August 2003 and
2004. PCA and discriminant analysis were also used to evaluate how well FAs
discriminated between adults and chicks. To assess the effect of age on FA composition,
the samples’ scores on the PCs were used as response variables in an ANOVA.
Wilk’s λ was used as the test of significance of the discriminant analyses to
separate among groups of adults at the three colonies and between adults and chicks on
Chowiet I. in August 2004. The number of observations correctly classified was used to
evaluate the performance of the discriminant analyses. Classifications were cross-
validated using a jack-knife procedure (SAS 2000). The predicted group membership of
individuals based on the jack-knife procedure was examined to determine into which
group individuals were misclassified. All statistical analyses were performed in the SAS
program (SAS 2000).
Chick age (days) was estimated from wing length (mm) using a logarithmic curve
fitted to changes in length with age from a sample of known-age chicks (Hatch 1979).

58
2.4 Results
2.4.1 Differences among adults
Sixty-nine FAs were identified and quantified in fulmar adipose tissue samples.
Given this large number, we present summary data for only those FAs we used in the
analyses (see Table 1). Complete data, including all FAs quantified, are available upon
request from the corresponding author.
The FA composition varied substantially across time and among colonies (Table
2.1, Fig. 2.2). We found a significant difference in adult FA signatures between years and
months on Chowiet I. (p < 0.0001, 2-factor MANOVA). Overall FA signatures were also
different between years for adults on St. George I. in June 2003 and 2004 (p < 0.0001,
MANOVA), however only one FA (18:2n-6) was significantly different (p < 0.0033,
Tukey’s multiple comparison with Bonferroni adjustment, Table 2.1), indicating that
signatures were actually quite similar between groups. FA signatures also differed
between adults sampled on St. George I. in June and August 2004 (p < 0.0001,
MANOVA), with five individual FAs differing between groups (Table 2.1).
Although the most abundant FAs were generally similar across sampling groups,
levels of individual FAs varied greatly among colonies and over time. All adults
exhibited high levels of 20:1n-11 (15.0 – 29.1%) and 22:1n-11 (17.9 – 31.3%) (Table 2.1,
Fig. 2.2). Higher levels of 20:1n-9 (6.5 – 7.0%) were found in adults on Chowiet I. in
May 2003 and 2004, and in May 2004 the birds were characterized by a unique signature
having significantly lower levels of 20:5n-3 (0.2%) and 22:6n-3 (1.2%) than the mean of

59
all adults. FA 18:1n-9 (7.4 – 9.1%) was lowest in fulmars from Chowiet I. in August
2004 and St. George I. in June 2003 and 2004 (Table 2.1, Fig. 2.2).
The PCA produced four eigenvalues > 1.0. In combination, these PCs explained
88.3% of the variance (PC1:41.7%, PC2:20.3%, PC3: 15.5%, PC4: 10.8%). A plot of the
mean scores ± SE on PC1 and PC2 shows separation between sampling groups with PC1
separating all adults from Chowiet I. from adults on St. George I. and Chagulak I., and
PC2 separating individuals from Chowiet I. in August 2003 and 2004 and St. George I. in
August 2003 from all other sampling groups (Fig. 2.4a). Based on the FA loadings along
PC1, the separation of sampling groups was due mainly to the combination of differences
in levels of 22:1n-9, 22:1n-11, 20:1n-9 (generally higher in adults on Chowiet I.) and
18:4n-3, 20:5n-3 (lower in adults on Chowiet I.). FA loadings along PC2 show that
differences in levels of 14:0, 16:0, and 16:1n-7 also contributed to the separation among
adults. All four PCs were significant (p < 0.0001, ANOVA), and using Tukey’s multiple
pair-wise comparisons, none of them were able to distinguish patterns in differences
among the three colonies or between each individual group, i.e., individual FAs were not
always higher or lower at Chagulak I., Chowiet I., or St. George I.
Results of the discriminant analysis showed that the first discriminant function
separated groups by colonies and the second discriminant function roughly separated
signatures of birds sampled early in the breeding season (May and June) from those
sampled later in the breeding season (July and August) (Fig. 2.5a). This analysis also
demonstrated the inter-annual similarities in FA signatures among individuals from
Chowiet I. in May and August 2003 and 2004. Although FA signatures, in general,

60
overlapped between colonies and sampling periods, 81.8% of original grouped cases, and
76.1% of cross-validated grouped cases were correctly classified to their respective
sampling groups (Table 2.3). The first six discriminant functions were significant and
accounted for 99.1% of the variation (p ≤ 0.0001): the first and second accounted for
69.2% of the variation (first: 45.6%, second: 23.6%).
2.4.2 Differences between adults and chicks
The ages of chicks sampled on Chowiet I. in 2003 and 2004 were estimated to be
14 ± 5.8 days (range 9 – 25) and 21 ± 5.9 days (range 13 – 32), respectively, and were
significantly different between years (p = 0.0031). FA composition varied significantly (p
< 0.0001, MANOVA) between adults and chicks from Chowiet I. in August 2004 (Table
2.2, Fig. 2.3), and eight FAs were significantly different between age classes (p <0.0033,
paired t-test, Bonferroni adjustment): 16:0, 16:1n-7, 18:1n-9, 18:1n-7, 18:2n-6, 18:3n-3,
20:1n-9 and 20:4n-6 were higher in chicks than in adults. Although levels of 22:1n-11
averaged 29% and 27% in adults compared to only 15% and 18% in chicks in 2003 and
2004, respectively, these differences were not significant.
The PCA produced three eigenvalues > 1.0, which in combination accounted for
82.5% of the variation (PC1:37.5%, PC2:29.2%, PC3:15.8%). A plot of the mean scores
± SE on PC1 and PC2 showed a clean division between adults and chicks (Fig. 2.4b).
PC1 and PC2 were both significant, but using Tukey’s multiple pair-wise comparisons,
only PC1 was able to distinguish differences between adults and chicks in 2004 and
differences between chicks in both years (p < 0.0001, ANOVA). Nevertheless,

61
differences between adults and chicks in 2003 and differences between adults in both
years were not significant.
Results of the discriminant analysis demonstrated the strong significance of
overall differences among the 16 FAs between age classes (Fig. 5b). The first
discriminant function accounted for 100% of the variation (p < 0.001%): 100% of
original grouped case and 96.0% of cross-validated individuals were correctly classified
as adults or chicks.
2.5 Discussion
Differences in FA signatures of adult fulmars at the three locations within years
and between seasons at individual colonies supported our predictions that 1) fulmar diets
would differ between colonies; 2) diets would differ between years within colonies, and
3) diets would differ between seasons within colonies. Signatures of chicks differed
significantly in 2004 from those of adults, which did not support prediction 4) that diets
of adult fulmars and their chicks would be similar.
2.5.1 Differences among adults
FA profiles of fulmars varied conspicuously among the three colonies—Chowiet
I. on the continental shelf of the western Gulf of Alaska was most different from St.
George I. on the shelf of the eastern Bering Sea, and Chagulak I. in the Aleutian
Archipelago and ecotone separating the basins of the Bering Sea and the Gulf of Alaska
lay midway between. Likewise, seasonal differences were pronounced at both Chowiet I.

62
and St. George I. We also found inter-annual differences at Chowiet I. and St. George I.,
but those differences were not as great as the spatial differences between colonies and
seasonal differences at Chowiet I. and St. George I.
Although FA signatures of adults on Chowiet I. during May 2003 and 2004 were
statistically different, the two groups fell into the same quadrant in the discriminant
analysis (Fig. 2.4a). Signatures in August 2003 and 2004 were significantly different, but
also fell into the same quadrant. Furthermore, the Mahalanobis distance between group
centroids in the discriminant analysis was not great for adults in August 2003 and 2004,
which minimizes the biological significance of the statistical difference. The
Mahalanobis distance was greater in May 2003 and 2004, indicating diets likely did differ
somewhat more between springs of the two years.
Adults on St. George I. in June 2003 and 2004 had almost identical FA signatures,
with only 18:2n-6 being statistically different between the two years. However, levels of
18:2n-6 in birds sampled on St. George I. in June 2003 and 2004 were just 0.63% and
0.67%, respectively, which may not be biologically significant, and the Mahalanobis
distance was very short, which supports the indication that the same, or a very similar,
diet was consumed by adults in June of both years.
Previous studies compiled by Hatch & Nettleship (1998) have shown seasonal
and annual shifts in the diets of Northern Fulmars in the Atlantic and Pacific, and also
longer-term variation in their diet. Compared to other members of the Procellariiformes,
Northern Fulmars forage relatively close to their breeding colonies. During the pre-
incubation and incubation stage, foraging trips can last over 4 – 5 days, and Atlantic
63
fulmars have been recorded to forage as far as 1000 km from their breeding colonies
before egg-laying and 40-200 km during incubation. Observations on the daily activity of
adults indicate that most foraging during the chick-rearing stage occurs < 100 km from
the breeding colonies (Furness & Todd 1984, Hatch & Nettleship 1998). These
observations suggest that because foraging ranges differ between the breeding stages,
then diets may also differ between the breeding stages. This is consistent with our results
that show seasonal changes in the diets of fulmars at Chowiet and St. George islands. In
other words, largely overlapping foraging ranges at early stages (pre-incubation) should
result in somewhat similar diets. During the chick-rearing stage the diets should be
distinct, as birds forage closer to their colonies and diets should thus reflect
oceanographic settings of that region. In addition, the inter-annual differences we found
in the diets of adults on Chowiet I. (August 2003 versus August 2004) could be explained
by the differences in chick ages and associated differences in adult foraging patterns.
Our results also compliment what is currently known about assemblages of prey
species in the Western Gulf of Alaska, Bering Sea, and Aleutian Is., and about the trophic
dependencies of other species of seabirds in these regions. Although diets of conspecific
seabirds overlap extensively across the broad northern N. Pacific, there are still notable
regional differences. For example, squids are abundant and widespread throughout the N.
Pacific and are known to be consumed by fulmars and many other species of seabirds that
feed at the edge of and off the continental shelf (DeGange & Sanger 1986, Sanger 1987,
Hills & Fiscus 1988, Hatch & Nettleship 1998). On the other hand, whereas capelin is a
common and important forage species of piscivorous seabirds in the Gulf of Alaska, it is

64
much less common at the Pribilof Is. and rare in the Aleutian Is. (Hunt et al. 1981a,
Sanger 1983, DeGange & Sanger 1986, Sanger 1987, Springer & Byrd 1989, Hatch &
Sanger 1992, Springer et al. 1996). Similarly, most piscivorous seabirds at the Pribilof Is.
consume principally juvenile walleye pollock, which is the most abundant species of
forage fish in that habitat on the eastern Bering Sea shelf. Pollock is common, but less so,
in the Gulf of Alaska and rare in the Aleutians. Diet studies of fulmars have also shown a
lower diversity of fish prey in high-arctic waters than in the low-arctic or boreal zones,
and higher diversity in the north-east Pacific waters than anywhere else fulmars forage
(Hatch & Nettleship 1998), which also supports our findings of spatial differences in diet
between fulmars at the three colonies.
2.5.2 Differences between adults and chicks
Although we did not find significant differences between FA signatures of chicks
and adults in 2003, the qualitative differences between age classes were similar to those
found between chicks and adults in 2004 (Table 2). We attribute the lack of power to
detect any differences between signatures in 2003 to a small sample size (n = 8 pairs),
and thus the strict interpretation of these results in 2003 should be done cautiously.
FA signatures of adult fulmars on Chowiet I. differed from those of chicks,
significantly so in 2004. This may be explained by: 1) adults actually feeding their chicks
a different diet than they were consuming themselves, or 2) the use of essential FAs from
stomach oil in Procellariiform chicks rather than adipose tissue.

65
The first possibility, that adults fed their chicks different prey than they consumed
themselves, contradicts information compiled by Hatch & Nettleship (1998), who report
that “as far as is known” the food of the young is “similar to that of adults.” Furthermore,
Bishop et al. (1983) found large differences between four FAs in adipose tissue of short-
tailed shearwater (Puffinus tenuirostris) adults compared to chicks, and also that there
was less variability in the FA composition of the adipose tissue in chicks than in adults.
This reflected differences in their modes of existence, e.g., adult shearwaters have a
higher turnover rate of adipose tissue FAs because they are continuously foraging and
dietary FAs are deposited into the adipose tissue to a limited extent, while chicks
accumulate large quantities of adipose tissue as an energy reserve and to fuel tissue
synthesis. The authors also found variability between stomach oil and adipose tissue
signatures and suggested that the digestibility of prey and the amount of time it remains
in the stomach of the adult before it is fed to a chick would affect the lipid composition of
the meal. That is, if the adults collected their food a considerable distance from the
colony, some digestion would have occurred in the stomach prior to the chick being fed
and could have affected what the adult deposited versus what was fed to the chicks.
Partial digestion of food items could explain the differences in signatures even if adults
fed their chicks the same prey they consumed, meaning that differences between adult
and chick signatures are not biologically meaningful. On the other hand, data collected on
body masses of four species of Procellariiformes returning to their breeding colonies
suggested that adults use short trips almost exclusively to gather prey for their chicks,
while longer trips were used to replenish energy consumed during foraging for chick
66
meals (Weimerskirch et al. 1994). This provides evidence that adults may have fed chicks
different prey items than they consumed for themselves. Furthermore, the ages of chicks
sampled in 2003 and 2004 were significantly different. Because there was less temporal
overlap in fat deposition between chicks and adults in 2003 (chicks in 2004 were older),
the age difference between years may have contributed to the differences between
signatures of adults and chicks in 2004.
With regard to the second possibility, stomach oil is another source from which
FAs can be mobilized. Storage of lipids in the proventriculus has energetic advantages for
seabirds that frequently experience periods of fasting, because it reduces the need to
synthesize fat reserves from assimilated FAs and later re-mobilize these stores during
fasting with the associated metabolic cost (Roby et al. 1989, Roby et al. 1997). Chicks at
the nest will utilize FAs from their stomach oil before utilizing FAs stored in their
adipose tissue. This results in differences in FA profiles between stomach oil and adipose
tissue (Chapter 1), and thus signatures from adult and chick stomach oil may be more
similar than stomach oil and adipose tissue from the same bird. In fact, Hendriks et al.
(2000) found that the FA profiles of crop contents of adult and chick grey-faced petrels
(Pterodroma macroptera) were indeed almost identical, suggesting that stomach oil
comparisons should be made rather than comparisons of adipose tissue signatures.
However, unlike other Procellariiformes with wider foraging ranges, adult fulmars only
incidentally feed their chicks stomach oil. Instead, whole or partially digested prey are
more commonly passed between adults and chicks (Imber 1976, Hatch & Nettleship
67
1998), which suggests that comparing stomach oil between adults and chicks may not be
applicable for fulmars.
In summary, FA signatures of adult Northern Fulmars varied seasonally and
between the three colonies, likely reflecting changes in prey distributions and abundances
between geographic regions (habitats) and over seasons, as well as possible variability in
the foraging behavior and foraging ranges of adults during different stages of the
breeding season. Inter-annual variation in signatures was much less prominent. Life
history patterns of fulmars during the breeding season support our findings of seasonal
variation in the diets of fulmars on Chowiet I. and St. George I. in 2003 and 2004.
Differences in fatty acid profiles we found between adults and chicks on Chowiet I. in
August 2004, but no differences in 2003, could be explained by several factors and
requires further investigation.
It will be important to build a library of FA signatures of prey for fulmars to use
to estimate diets quantitatively with QFASA (Iverson et al. 2004), and also to evaluate
the spatial and temporal variability of prey to be used in this model. Further studies
should also examine the signatures from fresh regurgitations of adults and compare them
to the stomach oil and adipose tissue signatures of chicks, which will aid in the
understanding of how signatures change from one lipid source to another.

68
2.6 Acknowledgements
We are indebted to G. Siekaniec, G.V. Byrd, and the staff at Alaska Maritime
National Wildlife Refuge for support with our research efforts. We thank A. Larned, E.
Naughter, M. Nielson, N. Bargmann, and A. Ramey for their assistance with field work;
S. Temple and S. Lang at Dalhousie University for assistance with lab analyses; A.
Kitaysky, C.L. Buck, and E. Murphy for providing critical comments on an earlier
manuscript; and S. Henrichs for use of lab equipment at the University of Alaska
Fairbanks. Transportation to field sites was provided by Captain K. Bell and crew on the
M/V Tiglâx, U.S. Coast Guard Kodiak Air Station, and the late Captain G. Edwards and
crew on the F/V Big Valley. This project was funded by the U.S. Geological Survey,
Alaska Science Center, and the Ken Turner Memorial Scholarship awarded to SWW.
Additional support was provided by research and equipment grants to SJI from the
Natural Sciences and Engineering Research Council (NSERC), Canada. The collection of
samples complies with the current rules of the Institutional Animal Care and Use
Committee (IACUC #03-16) at the University of Alaska Fairbanks, the Alaska
Department of Fish and Game (Permits 03-002, 04-061), and the U. S. Fish and Wildlife
Service (Special Use Permit 03-009, 04-006).

69
2.7 References
Ackman RG, Ratnayake WMN, Olsson B (1988) The ‘basic’ fatty acid composition of
Atlantic fish oils: potential similarities useful for enrichment of polyunsaturated fatty
acids by urea complexation. J Am Oil Chem Soc 65:136 – 138
Aitchison J (1986) The statistical analysis of compositional data. Chapman and Hall,
New York
Annett C, Pierotti R (1989) Chick hatching as a trigger for dietary switching in the
western gull. Colon Waterbirds 12:4-11
Bishop DG, Ritz DA, Hosie GW, Kenrick JR, Olley J (1983) Fatty acid composition of
the lipids of Puffinus Tenuirostris (Temminck) in relation to its diet. J Exp Mar Biol Ecol
71:17-26
Bradstreet MSW (1985) Feeding Studies. U.S. Minerals Management Service, OCS
Study MMS 85-0068, Anchorage, AK:257-306
Brown DJ, Boyd IL, Cripps GC, Butler PJ (1999) Fatty acid signature analysis from the
milk of Antarctic fur seals and Southern elephant seals from South Georgia: implications
for diet determination. Mar Ecol Prog Ser 187:251-263
Budge SM, Iverson SJ, Bowen WD, Ackman RG (2002) Among-and within-species
variability in fatty acid signatures of marine fish and invertebrates on the Scotian Shelf,
Georges Bank, and southern Gulf of St. Lawrence. Can J Fish Aquat Sci 59:886-898

70
Cook HW (1991) Fatty acid desaturation and chain elongtation in eucaryotes. In: Vance
DE, Vance JE (eds) Biochemistry of lipids and membranes. Elsevier Science,
Amsterdam, The Netherlands, p 141-169
Dahl TM, Falk-Petersen S, Gabrielsen GW, Sargent JR, Hop H, Millar RM (2003) Lipids
and stable isotopes in common eider, black-legged kittiwake and northern fulmar: a
trophic study from an Arctic fjord. Mar Ecol Prog Ser 256:257-269
DeGange AR, Sanger GA (1986) Marine birds. In: Hood DW, Zimmerman ST (eds) The
Gulf of Alaska physical environment and biological resources. NOAA Ocean Assessment
Division, Alaska Office, Washington, D.C., p 479-526
Duffy DC, Jackson S (1986) Diet studies of seabirds: a review of methods. Colon
Waterbirds 9:1-17
Enderson J, Berger D (1968) Chlorinated hydrocarbon residues in Peregrines and their
prey species from northern Canada. Condor 70:149-153
Fisher J (1952) The Fulmar. Collins, London
Folch J, Lees M, Sloane-Stanly GH (1957) A simple method for the isolation and
purification of total lipids from animal tissues. J Biol Chem 226:497-509
Furness BL, Laugksch RC, Duffy DC (1984) Cephalopod beaks and studies of seabird
diets. Auk 101:619

71
Furness RW, Todd CM (1984) Diets and feeding of fulmars Fulmarus glacialis during
the breeding season: a comparison between St. Kilda and Shetland colonies. Ibis
126:379-387
Gould P, Walker W, Ostrom P (1997) Foods of northern fulmars associated with high-
seas drift nets in the transitional region of the North Pacific. Northwestern Nat 78:57-61
Harrison NM (1984) Predation on jellyfish and their associates by seabirds. Limnol
Oceanogr 29:1335-1337
Hatch SA (1979) Breeding and population ecology of northern fulmars (Fulmarus
glacialis) at Semidi Islands, Alaska. MS dissertation, University of Alaska Fairbanks,
Fairbanks, AK
Hatch SA (1993) Ecology and population status of Northern Fulmars Fulmarus glacialis
of the North Pacific. In: Vermeer K, Briggs KT, Morgan KH, Siegel-Causey D (eds) The
status, ecology, and conservation of marine birds of the North Pacific. Can Wildlife
Service Special Publ, Ottawa, p 82-91
Hatch SA, Hatch MA (1983) Populations and habitat use of marine birds in the Semidi
Islands, Alaska. Murrelet 64:39-46
Hatch SA, Sanger GA (1992) Puffins as samples of juvenile pollock and other forage fish
in the Gulf of Alaska. Mar Ecol Prog Ser 80:1-14

72
Hatch SA, Nettleship DN (1998) Northern Fulmar (Fulmarus glacialis). The Birds of
North America, Inc., Philadelphia, PA
Hendriks WH, O'Conner S, Thomas DV, Rutherfurd SM, Taylor GA, Guilford WG
(2000) Nutrient composition of the crop contents of growing and adult grey-faced petrels
(Pterodroma macroptera): a preliminary investigation. J R Soc N Z 30:105-111
Hills S, Fiscus CH (1988) Cephalopod beaks from the stomachs of northern fulmars
(Fulmarus glacialis) found dead on the Washington coast. Murrelet 69:15-20
Hunt GL Jr, Burgeson B, Sanger GA (1981a) Feeding ecology of seabirds in the eastern
Bering Sea. In: Hood DW, Calder JA. The eastern Bering Sea shelf: oceanography and
resources, Vol 2. Off Mar Pollut Assess, Natl Oceanogr Atmos Adm, University of
Washington Press, Seattle, WA, p 629-648
Hunt GL Jr, Gould PJ, Forsell DJ, Peterson Jr H (1981b) Pelagic distribution of marine
birds in the eastern Bering Sea. In: Hood DW, Calder JA. The eastern Bering Sea shelf:
oceanography and resources,Vol 2. Off Mar Pollut Assess, Natl Oceanogr Atmos Adm,
University of Washington Press, Seattle, WA, p 689-718
Imber MJ (1976) The origin of petrel stomach oils: a review. Condor 78:366-369
Iverson SJ (1993) Milk secretion in marine mammals in relation to foraging: can milk
fatty acids predict diet? Symp Zool Soc Lond 66:263-291
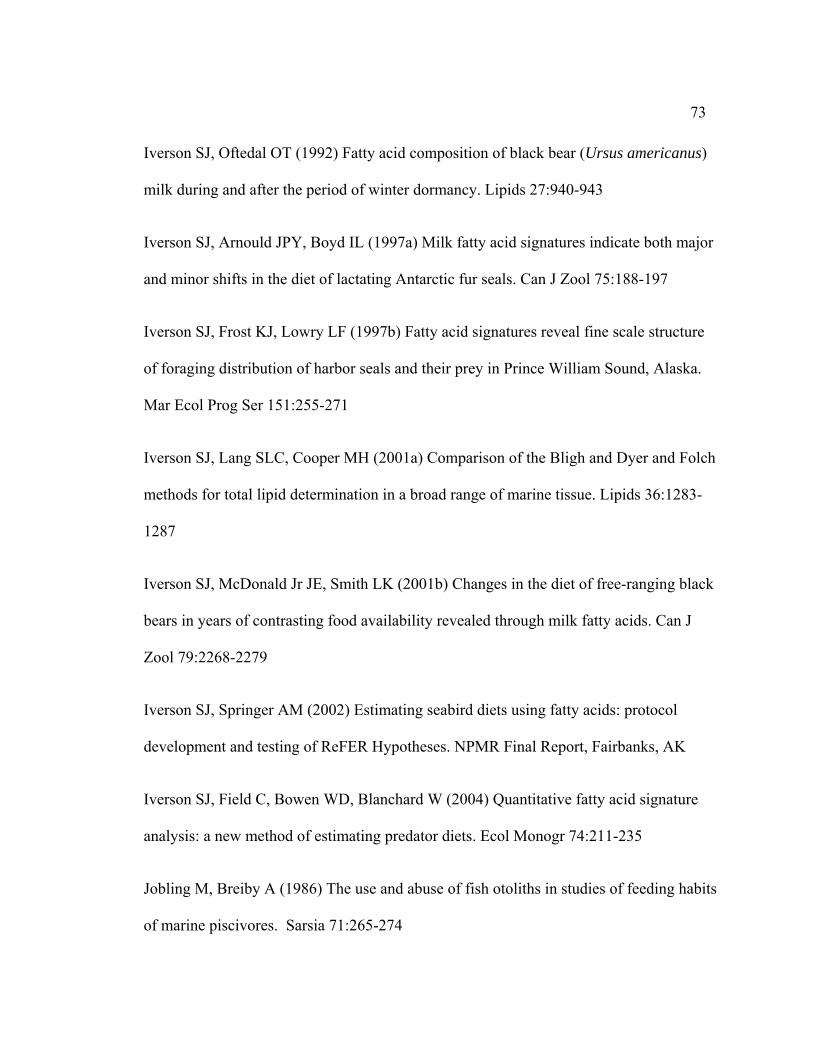
73
Iverson SJ, Oftedal OT (1992) Fatty acid composition of black bear (Ursus americanus)
milk during and after the period of winter dormancy. Lipids 27:940-943
Iverson SJ, Arnould JPY, Boyd IL (1997a) Milk fatty acid signatures indicate both major
and minor shifts in the diet of lactating Antarctic fur seals. Can J Zool 75:188-197
Iverson SJ, Frost KJ, Lowry LF (1997b) Fatty acid signatures reveal fine scale structure
of foraging distribution of harbor seals and their prey in Prince William Sound, Alaska.
Mar Ecol Prog Ser 151:255-271
Iverson SJ, Lang SLC, Cooper MH (2001a) Comparison of the Bligh and Dyer and Folch
methods for total lipid determination in a broad range of marine tissue. Lipids 36:1283-
1287
Iverson SJ, McDonald Jr JE, Smith LK (2001b) Changes in the diet of free-ranging black
bears in years of contrasting food availability revealed through milk fatty acids. Can J
Zool 79:2268-2279
Iverson SJ, Springer AM (2002) Estimating seabird diets using fatty acids: protocol
development and testing of ReFER Hypotheses. NPMR Final Report, Fairbanks, AK
Iverson SJ, Field C, Bowen WD, Blanchard W (2004) Quantitative fatty acid signature
analysis: a new method of estimating predator diets. Ecol Monogr 74:211-235
Jobling M, Breiby A (1986) The use and abuse of fish otoliths in studies of feeding habits
of marine piscivores. Sarsia 71:265-274

74
Kirsch PE, Iverson SJ, Bowen WD (2000) Effect of a low-fat diet on body composition
and blubber fatty acids of captive juvenile harp seals (Phoca groenlandica). Physiol
Biochem Zool 73:45-59
Legendre P, Legendre L (1998) Numerical ecology. Elsevier Scientific Publishers,
Amsterdam
Preble EA, McAtee WL (1923) A biological survey of the Pribilof Islands, Alaska. No.
American Fauna, no. 46
Raclot T, Groscolas R, Cherel Y (1998) Fatty acid evidence for the importance of
myctophid fishes in the diet of king penguins, Aptenodytes patagonicus. Mar Biol
132:523-533
Roby DD, Brink KL, Place AR (1989) Relative passage rates of lipid and aqueous digesta
in the formation of stomach oils. Auk 106:303-313
Roby DD, Taylor JRE, Place AR (1997) Significance of stomach oil for reproduction in
seabirds: an interspecies cross-fostering experiment. Auk 114:725-736
Sanger GA (1983) Diets and food web relationships of seabirds in the Gulf of Alaska and
adjacent marine regions. U.S. Fish and Wildlife Service Report, Denver, CO
Sanger GA (1987) Trophic levels and trophic relationships of seabirds in the Gulf of
Alaska. In: Croxall JP (ed) Seabirds feeding ecology and role in marine ecosystems.
Cambridge University, Cambridge, p 229-257

75
Sargent JR, Parkes RJ, Mueller-Harvey I, Henderson RJ (1988) Lipid biomarkers in
marine ecology. In: Sleigh MA (ed) Microbes in the sea. Ellis Horwood, Chichester, UK,
p 119-138
SAS (2000) Release 8.01 edition. SAS Institute, Cary, North Carolina, USA
Springer AM, Byrd GV (1989) Seabird dependence on walleye pollock in the
southeastern Bering Sea. In: Proceedings of the International Symposium on the Biology
and Management of Walleye Pollock, 14-16 November 1988. Sea Grant, University of
Alaska, Fairbanks, AK, p 667-677
Springer AM, Piatt JF, Van Vliet G (1996) Seabirds as proxies of marine habitats and
food webs in the western Aleutian Arc. Fish Oceanogr 5:45-55
Stevens J (1986) Applied multivariate statistics for the social sciences. Lawrence
Erlbaum Associates, New Jersey
Votier SC, Bearhop S, MacCormick A, Ratcliffe N, Furness RW (2003) Assessing the
diet of great skuas, Catharacta skua, using five different techniques. Polar Biol 26:20-26
Weimerskirch H, Chastel O, Ackerman L, Chaurand T, Cuenot-Chaillet F, Hindermeyer
X, Judas J (1994) Alternate long and short foraging trips in pelagic seabird parents. Anim
Behav 47:472-476

76
Table 2.1. Mean values for fatty acid composition of adult adipose tissue.
May 2003 (n = 30) Aug 2003 (n = 27) May 2004 (n = 25) Aug 2004 (n = 31)Saturated (11.03 ± 2.387) (13.79 ± 5.204) (10.17 ± 2.520) (15.09 ± 3.983) 14:0* 1.83 ± 0.434b,c 1.94 ± 0.836c 1.73 ± 0.451b,c 2.52 ± 0.630c,d
16:0* 5.81 ± 1.663b 7.55 ± 3.676b,c 5.40 ± 1.743b 7.32 ± 2.574c
17:0 0.31 ± 0.185 0.51 ± 0.226 0.16 ± 0.063 0.43 ± 0.205 18:0* 2.24 ± 0.460 2.90 ± 0.853 2.03 ± 0.319 3.67± 0.991 20:0 0.36 ± 0.076 0.37 ± 0.113 0.33 ± 0.087 0.40 ± 0.084Monounsaturated (78.14 ± 5.127) (70.02 ± 10.11) (83.16 ± 3.248) (66.96 ± 7.514) 16:1n-11 0.31 ± 0.129 0.38 ± 0.221 0.17 ± 0.061 0.70 ± 0.342 16:1n-7* 1.88 ± 0.899a,b 2.31 ± 1.560b,c 1.94 ± 1.018a,b 2.11 ± 0.858b
18:1n-11 0.77 ± 0.259 0.65 ± 0.344 0.60 ± 0.161 0.56 ± 0.187 18:1n-9* 12.62 ± 3.816a,c 11.91 ± 5.615d,e 13.19 ± 2.937a 9.05 ± 5.436b
18:1n-7* 1.55 ± 0.650a,b 2.69 ± 1.618a,c 1.41 ± 0.354a,b 1.88 ± 0.985b
18:1n-5 0.42 ± 0.104 0.34 ± 0.132 0.48 ± 0.155 0.58 ± 0.196 20:1n-11* 18.91 ± 3.388a,b 14.95 ± 4.869a 23.63 ± 3.337b 18.42 ± 4.384a
20:1n-9* 6.96 ± 0.670b 5.26 ± 1.907c 6.51 ± 0.248b 4.03 ± 0.828a
20:1n-7 0.55 ± 0.097 0.65 ± 0.202 0.42 ± 0.062 0.73 ± 0.179 22:1n-11* 30.32 ± 5.362b,c 27.34 ± 10.753a,b 31.34 ± 4.017b 26.52 ± 7.478a
22:1n-9* 2.76 ± 0.412d 2.50 ± 1.000c,d 2.43 ± 0.264d 1.48 ± 0.411a,b
22:1n-7 0.41 ± 0.069 0.42 ± 0.324 0.40 ± 0.055 0.31 ± 0.072Polyunsaturated (10.71 ± 3.029) (16.10 ± 5.466) (6.63 ± 1.079) (17.89 ± 4.594) 16:2n-4 0.34 ± 0.082 0.27 ± 0.184 0.06 ± 0.028 0.32 ± 0.118 16:3n-6 0.08 ± 0.048 0.14 ± 0.113 0.39 ± 0.052 0.077 ± 0.063 16:4n-1 0.04 ± 0.044 0.07 ± 0.085 0.01 ± 0.006 0.03 ± 0.044 18:2n-6* 1.01 ± 0.127a 0.85 ± 0.183b,c 0.97 ± 0.14a 1.04 ± 0.278b,c
18:3n-3* 0.26 ± 0.094a,b 0.33 ± 0.148a,b 0.19 ± 0.081a,b 0.42 ± 0.132a,b
18:4n-3* 0.46 ± 0.224b 0.76 ± 0.530b 0.14 ± 0.062c 0.89 ± 0.382b
20:2n-6 0.25 ± 0.053 0.28 ± 0.106 0.19 ± 0.045 0.39 ± 0.107 20:4n-6* 0.38 ± 0.076a 0.52 ± 0.185a 0.27 ± 0.037a,c 0.61 ± 0.268a
20:4n-3 0.15 ± 0.077 0.30 ± 0.159 0.07 ± 0.045 0.45 ± 0.189 20:5n-3* 1.04 ± 0.708b 3.02 ± 2.716a,d 0.21 ± 0.131c 2.41 ± 1.378b,d
21:5n-3 0.09 ± 0.046 0.22 ± 0.115 0.05 ± 0.011 0.17 ± 0.071 22:5n-3 1.15 ± 0.494a 1.66 ± 0.682b,c 0.43 ± 0.201e 2.55 ± 0.760a,b
22:6n-3* 2.85 ± 1.522b,d 4.92 ± 2.121a,b 1.16 ± 0.487c 5.68 ± 1.811a,b
24:1n-9 1.34 ± 0.303 1.29 ± 0.519 1.41 ± 0.283 1.10 ± 0.349
Chowiet Island

77
Table 2.1. continued
June 2003 (n = 29) Aug 2003 (n = 9) June 2004 (n = 30) Aug 2004 (n = 26)Saturated (18.19 ± 2.688) (19.59 ± 3.335) (19.29 ± 3.091) (16.57 ± 3.303) 14:0* 5.69 ± 1.936a 2.62 ± 0.938 7.38 ± 2.389a 3.4 ± 1.081b,d
16:0* 8.74 ± 2.013a,b 11.45 ± 2.431 8.49 ± 1.688a 8.97 ± 2.105a,b
17:0 0.21 ± 0.113 0.17 ± 0.126 0.12 ± 0.075 0.14 ± 0.048 18:0* 2.77 ± 0.842 4.48 ± 0.996 2.52 ± 0.777 3.25 ± 0.619 20:0 0.35 ± 0.083 0.27 ± 0.079 0.38 ± 0.088 0.27 ± 0.075Monounsaturated (67.94 ± 8.217) (57.64 ± 7.333) (69.61 ± 6.259) (63.32 ± 8.506) 16:1n-11 0.28 ± 0.086 0.30 ± 0.045 0.30 ± 0.103 0.29 ± 0.093 16:1n-7* 3.08 ± 1.549a,c 4.82 ± 1.309 2.84 ± 0.994a 3.87 ± 1.320a
18:1n-11 1.05 ± 0.500 0.58 ± 0.314 0.66 ± 0.196 0.89 ± 0.424 18:1n-9* 8.10 ± 4.023b,f 19.19 ± 4.23 7.41 ± 4.193b,e 12.65 ± 3.317d,e,f
18:1n-7* 2.37 ± 1.581a,c 5.66 ± 1.633 1.73 ± 1.216b,c 3.52 ± 1.122a
18:1n-5 0.37 ± 0.061 0.41 ± 0.066 0.45 ± 0.076 0.49 ± 0.104 20:1n-11* 26.00 ± 9.521b,c 9.44 ± 4.804 29.09 ± 7.454b 17.67 ± 4.498a,c
20:1n-9* 4.09 ± 0.532a,c 4.48 ± 3.069 3.79 ± 0.711a,c 3.58 ± 0.741a
20:1n-7 0.52 ± 0.217 0.68 ± 0.255 0.54 ± 0.263 0.47 ± 0.186 22:1n-11* 19.99 ± 5.888a 10.05 ± 6.115 20.87 ± 4.450a,c 17.85 ± 7.655a
22:1n-9* 1.34 ± 0.312a,b,c 1.03 ± 0.439 1.22 ± 0.362a,b,c 1.16 ± 0.506a
22:1n-7 0.23 ± 0.053 0.24 ± 0.071 0.25 ± 0.073 0.23 ± 0.093Polyunsaturated (13.79 ± 6.679) (22.71± 4.178) (11.04 ± 4.662) (20.07 ± 5.458) 16:2n-4 0.09 ± 0.041 0.18 ± 0.035 0.28 ± 0.099 0.19 ± 0.036 16:3n-6 0.29 ± 0.125 0.29 ± 0.095 0.11 ± 0.054 0.29 ± 0.12416:4n-1 0.29 ± 0.189 0.20 ± 0.144 0.22 ± 0.123 0.25 ± 0.15218:2n-6* 0.63 ± 0.327d 0.88 ± 0.053 0.67 ± 0.152c 0.95 ± 0.198b,c
18:3n-3* 0.29 ± 0.197a 0.37 ± 0.118 0.23 ± 0.108a 0.52 ± 0.222b
18:4n-3* 0.79 ± 0.570b 0.88 ± 0.551 0.86 ± 0.523a,b 1.88 ± 0.963a
20:2n-6 0.15 ± 0.060 0.24 ± 0.037 0.14 ± 0.041 0.28 ± 0.044 20:4n-6* 0.26 ± 0.113b 0.52 ± 0.127 0.23 ± 0.095b 0.33 ± 0.112b,c
20:4n-3 0.21 ± 0.140 0.29 ± 0.104 0.18 ± 0.103 0.45 ± 0.174 20:5n-3* 3.56 ± 2.450a,d 5.95 ± 2.694 1.97 ± 1.258a,b 4.71 ± 2.402a
21:5n-3 0.25 ± 0.149 0.39 ± 0.093 0.17 ± 0.010 0.33 ± 0.126 22:5n-3 1.47 ± 0.764 1.95 ± 0.559 1.35 ± 0.590 1.33 ± 0.45 22:6n-3* 3.93 ± 2.129b,d 8.60 ± 1.974 2.95 ± 2.112d 6.53 ± 2.083a
24:1n-9 0.42 ± 0.131 0.55 ± 0.207 0.64 ± 0.251 0.68 ± 0.384
St. George Island

78
Table 2.1. continued
Chagulak IslandJuly 2004 (n = 30)
Saturated (14.53 ± 4.284) 14:0* 2.99 ± 1.14b
16:0* 7.98 ± 2.662a,b
17:0 0.09 ± 0.039 18:0* 2.70 ± 0.707 20:0 0.31 ± 0.081Monounsaturated (71.76 ± 8.590) 16:1n-11 0.28 ± 0.106 16:1n-7* 3.08 ± 1.493a,c
18:1n-11 0.51 ± 0.212 18:1n-9* 12.28 ± 4.367c,d
18:1n-7* 2.73 ± 1.209a,c
18:1n-5 0.41 ± 0.126 20:1n-11* 20.37 ± 4.630a,b
20:1n-9* 4.11 ± 0.763a,c
20:1n-7 0.47 ± 0.119 22:1n-11* 25.03 ± 9.432a,b
22:1n-9* 1.63 ± 0.599b,c
22:1n-7 0.33 ± 0.108Polyunsaturated (13.66 ± 4.539) 16:2n-4 0.23 ± 0.135 16:3n-6 0.21 ± 0.08516:4n-1 0.17 ± 0.14218:2n-6* 0.94 ± 0.191b
18:3n-3* 0.40 ± 0.159b,c
18:4n-3* 1.14 ± 0.806a,b
20:2n-6 0.26 ± 0.063 20:4n-6* 0.25 ± 0.049b
20:4n-3 0.29 ± 0.146 20:5n-3* 2.33 ± 1.63a,b
21:5n-3 0.21 ± 0.113 22:5n-3 1.18 ± 0.360 22:6n-3* 3.79 ± 1.714b,d
24:1n-9 1.11 ± 0.632
a Values are mean mass percent ± SD of fatty acids (31 out of 69) which averaged ≥ 0.1% among samples analyzed with totals in parentheses. *Designates the 16 FAs used in analyses. Those values for the same FAs that do not share a common superscript letter are significantly different from each other (p < 0.0033, birds on St. George I. in August 2003 were not included in this analysis due to small sample size).

79
Table 2.2. Mean values for fatty acid composition of adult and chick adipose tissue
Adults Chicks mean diff. p-valueSaturated (12.99 ± 3.506) (17.98 ± 3.853) 14:0* 1.81 ± 0.509 2.40 ± 0.786 16:0* 6.77 ± 2.170 10.65 ± 2.378 3.89 ± 3.113 0.007 17:0 0.51 ± 0.190 0.37 ± 0.053 18:0* 2.94 ± 0.917 3.63 ± 0.947 - - 20:0 0.39 ± 0.103 0.30 ± 0.082Monounsaturated (70.28 ± 8.19) (63.72 ± 8.364) 16:1n-11 0.50 ± 0.296 0.38 ± 0.049 16:1n-7* 1.79 ± 0.590 3.20 ± 0.937 1.41 ± 1.113 0.022 18:1n-11 0.82 ± 0.554 0.52 ± 0.330 18:1n-9* 10.20 ± 4.15 19.852 ± 2.633 9.65 ± 2.883 0.040 18:1n-7* 2.17 ± 0.825 3.41 ± 1.209 - - 18:1n-5 0.39 ± 0.166 0.51 ± 0.084 20:1n-11* 15.58 ± 3.473 13.13 ± 4.793 2.45 ± 6.389 0.225 20:1n-9* 5.38 ± 0.965 4.80 ± 0.999 0.58 ± 1.019 0.150 20:1n-7 0.70 ± 0.210 0.60 ± 0.096 22:1n-11* 29.16 ± 7.276 14.86 ± 4.765 14.30 ± 8.503 0.019 22:1n-9* 2.60 ± 0.776 1.43 ± 0.306 - - 22:1n-7 0.38 ± 0.105 0.23 ± 0.045Polyunsaturated (16.69 ± 4.964) (18.22 ± 5.260) 16:2n-4 0.32 ± 0.222 0.31 ± 0.078 16:3n-6 0.09 ± 0.037 0.17 ± 0.070 16:4n-1 0.03 ± 0.028 0.08 ± 0.070 18:2n-6* 0.91 ± 0.147 1.29 ± 0.084 - - 18:3n-3* 0.34 ± 0.130 0.52 ± 0.162 - - 18:4n-3* 0.75 ± 0.377 0.76 ± 0.547 - - 20:2n-6 0.34 ± 0.125 0.31 ± 0.055 20:4n-6* 0.65 ± 0.236 0.51 ± 0.199 - - 20:4n-3 0.34 ± 0.179 0.34 ± 0.122 20:5n-3* 2.45 ± 1.200 2.95 ± 2.276 - - 21:5n-3 0.18 ± 0.050 0.20 ± 0.124 22:5n-3 1.94 ± 0.882 1.54 ± 0.413 22:6n-3* 5.42 ± 2.267 6.95 ± 2.200 1.53 ± 3.980 0.4978 24:1n-9 1.28 ± 0.335 0.72 ± 0.187
Chowiet August 2003 (n = 8)

80
Table 2.2. continued
Adults Chicks mean diff. p-valueSaturated (14.84 ± 4.218) (16.12 ± 2.691) 14:0* 2.50 ± 0.668 2.41 ± 0.488 0.09 ± 0.687 0.006 16:0* 7.12 ± 2.711 9.54 ± 1.861 2.42 ± 2.906 <.0001 17:0 0.46 ± 0.209 0.29 ± 0.051 18:0* 3.60 ± 1.084 2.92 ± 0.535 - - 20:0 0.39 ± 0.080 0.25 ± 0.055Monounsaturated (67.42 ± 8.074) (70.29 ± 5.579) 16:1n-11 0.72 ± 0.351 0.38 ± 0.104 16:1n-7* 2.08 ± 0.859 3.69 ± 0.933 1.61 ± 0.207 <.0001 18:1n-11 0.56 ± 0.188 0.59 ± 0.220 18:1n-9* 8.54 ± 5.435 18.23 ± 3.092 9.69 ± 6.019 <.0001 18:1n-7* 1.72 ± 0.830 3.03 ± 0.960 1.31 ± 1.229 <.0001 18:1n-5 0.60 ± 0.199 0.58 ± 0.106 20:1n-11* 18.86 ± 4.524 17.39 ± 4.094 1.46 ± 5.250 0.310 20:1n-9* 3.95 ± 0.842 5.09 ± 0.706 1.14 ± 1.005 <.0001 20:1n-7 0.73 ± 0.189 0.51 ± 0.080 22:1n-11* 27.27 ± 7.638 18.45 ± 4.176 8.83 ± 7.884 0.144 22:1n-9* 1.48 ± 0.425 1.37 ± 0.265 0.11 ± 0.419 0.226 22:1n-7 0.31± 0.073 0.23 ± 0.034Polyunsaturated (17.68 ± 4.887) (13.52 ± 3.168) 16:2n-4 0.32 ± 0.099 0.35 ± 0.071 16:3n-6 0.07 ± 0.048 0.15 ± 0.073 16:4n-1 0.02 ± 0.025 0.05 ± 0.042 18:2n-6* 1.05 ± 0.308 1.30 ± 0.096 0.25 ± 0.324 <.0001 18:3n-3* 0.42 ± 0.138 0.53 ± 0.122 0.15 ± 0.307 <.0001 18:4n-3* 0.88 ± 0.398 0.54 ± 0.292 0.34 ± 0.394 0.010 20:2n-6 0.40 ± 0.104 0.29 ± 0.040 20:4n-6* 0.62 ± 0.286 0.32 ± 0.13 0.30 ± 2.957 <.0001 20:4n-3 0.46 ± 0.202 0.31 ± 0.119 20:5n-3* 2.36 ± 1.454 1.75 ± 1.052 0.61 ± 1.463 0.340 21:5n-3 0.17 ± 0.066 0.11 ± 0.063 22:5n-3 2.53 ± 0.814 1.26 ± 0.475 22:6n-3* 5.53 ± 1.862 4.61 ± 1.299 0.92 ± 1.874 0.6839 24:1n-9 1.11 ± 0.369 0.67 ± 1.83
Chowiet August 2004 (n = 25)
b Values are mean mass percent ± SD of fatty acids (31 out of 69) which averaged ≥ 0.1% among samples analyzed with totals in parentheses. *Designates the 16 FAs used in analyses in 2004, only 8 fatty acids were used for analysis of birds in 2003. P-values are shown for paired t-test using the Bonferroni adjustment to evaluate differences between adipose tissue in adults and chicks on Chowiet I. in August 2003 and 2004.
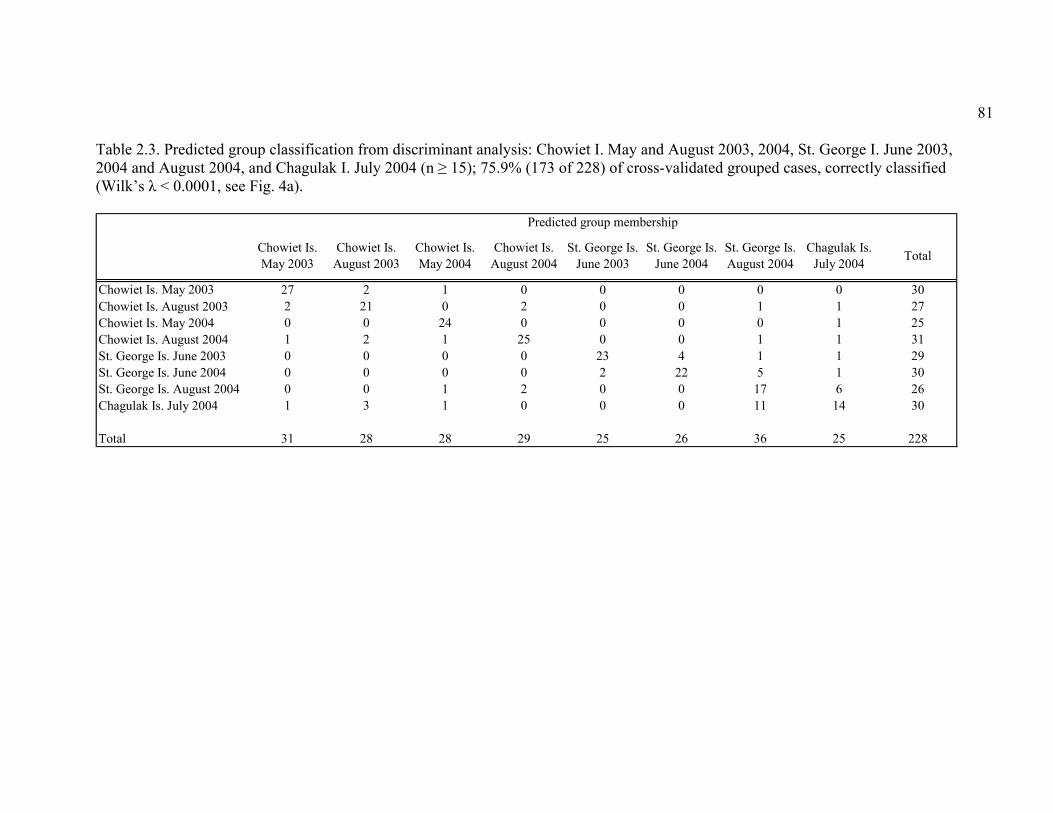
81
Table 2.3. Predicted group classification from discriminant analysis: Chowiet I. May and August 2003, 2004, St. George I. June 2003, 2004 and August 2004, and Chagulak I. July 2004 (n ≥ 15); 75.9% (173 of 228) of cross-validated grouped cases, correctly classified (Wilk’s λ < 0.0001, see Fig. 4a).
Chowiet Is. May 2003
Chowiet Is. August 2003
Chowiet Is. May 2004
Chowiet Is. August 2004
St. George Is. June 2003
St. George Is. June 2004
St. George Is. August 2004
Chagulak Is. July 2004 Total
Chowiet Is. May 2003 27 2 1 0 0 0 0 0 30Chowiet Is. August 2003 2 21 0 2 0 0 1 1 27Chowiet Is. May 2004 0 0 24 0 0 0 0 1 25Chowiet Is. August 2004 1 2 1 25 0 0 1 1 31St. George Is. June 2003 0 0 0 0 23 4 1 1 29St. George Is. June 2004 0 0 0 0 2 22 5 1 30St. George Is. August 2004 0 0 1 2 0 0 17 6 26Chagulak Is. July 2004 1 3 1 0 0 0 11 14 30
Total 31 28 28 29 25 26 36 25 228
Predicted group membership

82
Figure 2.1. Locations of the four major fulmar colonies in Alaska. 1) Chowiet Island (56˚05' N, 156˚45' W) in the Semidi Islands group in the western Gulf of Alaska; 2) Chagulak Island (52˚35' N, 171˚10' W) in the eastern Aleutian Islands; 3) St. George Island (56˚35' N, 170˚35' W) in the Pribilof Islands group in the eastern Bering Sea; and 4) Hall Island (60˚40' N, 173˚10' W), adjacent to St. Matthew Island in the northern Bering Sea. Studies were not undertaken at Hall I.
Western Gulf of Alaska
Bering Sea
Semidi Is. (Chowiet I.)
Pribilof Is. (St. George I.)
Chagulak I.
St. Matthew/Hall Is.

83
18:
4n-3
20:
1n-1
1
20:
1n-9
20:
4n-6
20:
5n-3
22:
1n-1
1
22:
1n-9
22:
6n-3
0
5
10
15
20
25
30
35
Selected FA
14:
0
16:
0
16:
1n-7
18:
0
18:
1n-9
18:
1n-7
18:
2n-6
18:
3n-3
% o
f tot
al F
A 0
4
8
12
16Chowiet I. May 2003Chowiet I. Aug 2003Chowiet I. May 2004Chowiet I. Aug 2004St. George I. Jun 2003St. George I. Jun 2004St. George I. Aug 2004Chagulak I. Jul 2004
Figure 2.2. Mean values of fatty acids in adult fulmars. The 16 FAs with the greatest overall variance in Northern Fulmar adipose tissue, including reference fatty acid 18:0, illustrating differences between samples. Bars are means and vertical lines are 1 SE. Adults on Chowiet I. during May 2003 (n = 30) and 2004 (n = 27), and August 2003 (n = 25) and 2004 (n = 31); St. George I. during June 2003 (n = 29) and 2004 (n = 30), and August 2004 (n = 26); and Chagulak I. during July 2004 (n = 30).
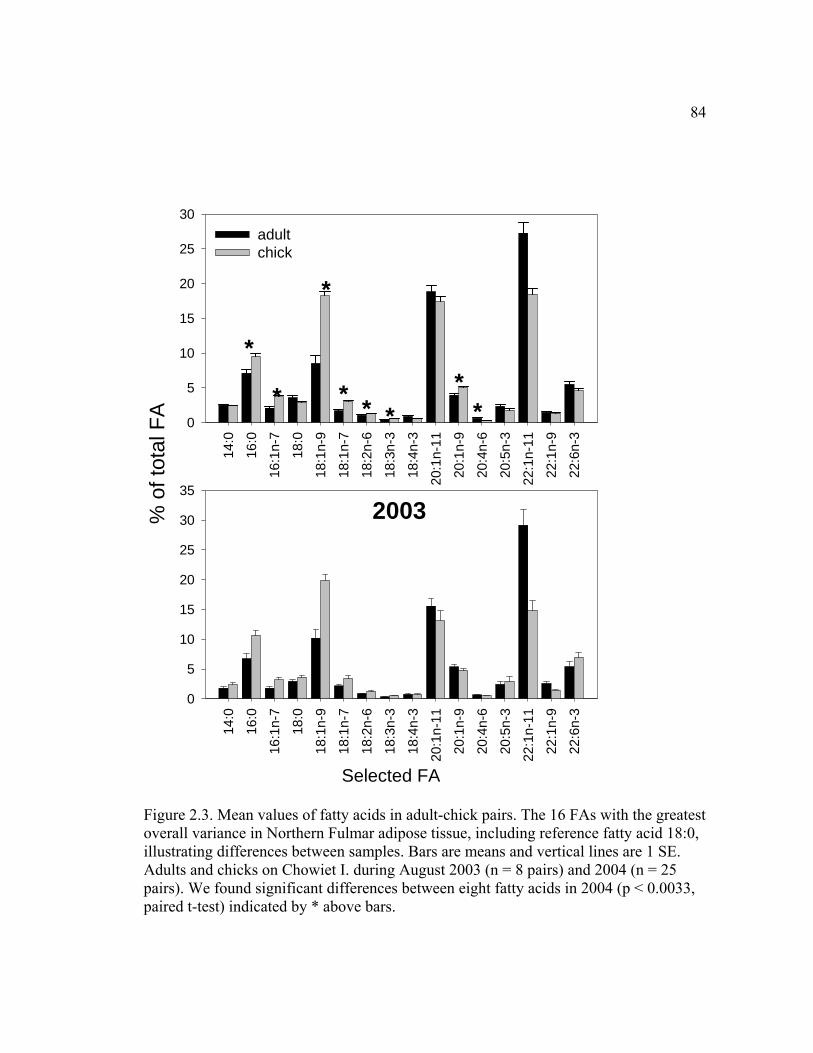
84
14:
0
16:
0
16:
1n-7
18:
0
18:
1n-9
18:
1n-7
18:
2n-6
18:3
n-3
18:
4n-3
20:
1n-1
1
20:
1n-9
20:4
n-6
20:
5n-3
22:
1n-1
1
22:
1n-9
22:
6n-3
0
5
10
15
20
25
30adult chick
*
Selected FA
14:
0
16:
0
16:
1n-7
18:
0
18:
1n-9
18:
1n-7
18:
2n-6
18:3
n-3
18:
4n-3
20:
1n-1
1
20:
1n-9
20:4
n-6
20:
5n-3
22:
1n-1
1
22:
1n-9
22:
6n-3
% o
f tot
al F
A
0
5
10
15
20
25
30
35
2003
*
*
* * **
*
Figure 2.3. Mean values of fatty acids in adult-chick pairs. The 16 FAs with the greatest overall variance in Northern Fulmar adipose tissue, including reference fatty acid 18:0, illustrating differences between samples. Bars are means and vertical lines are 1 SE. Adults and chicks on Chowiet I. during August 2003 (n = 8 pairs) and 2004 (n = 25 pairs). We found significant differences between eight fatty acids in 2004 (p < 0.0033, paired t-test) indicated by * above bars.
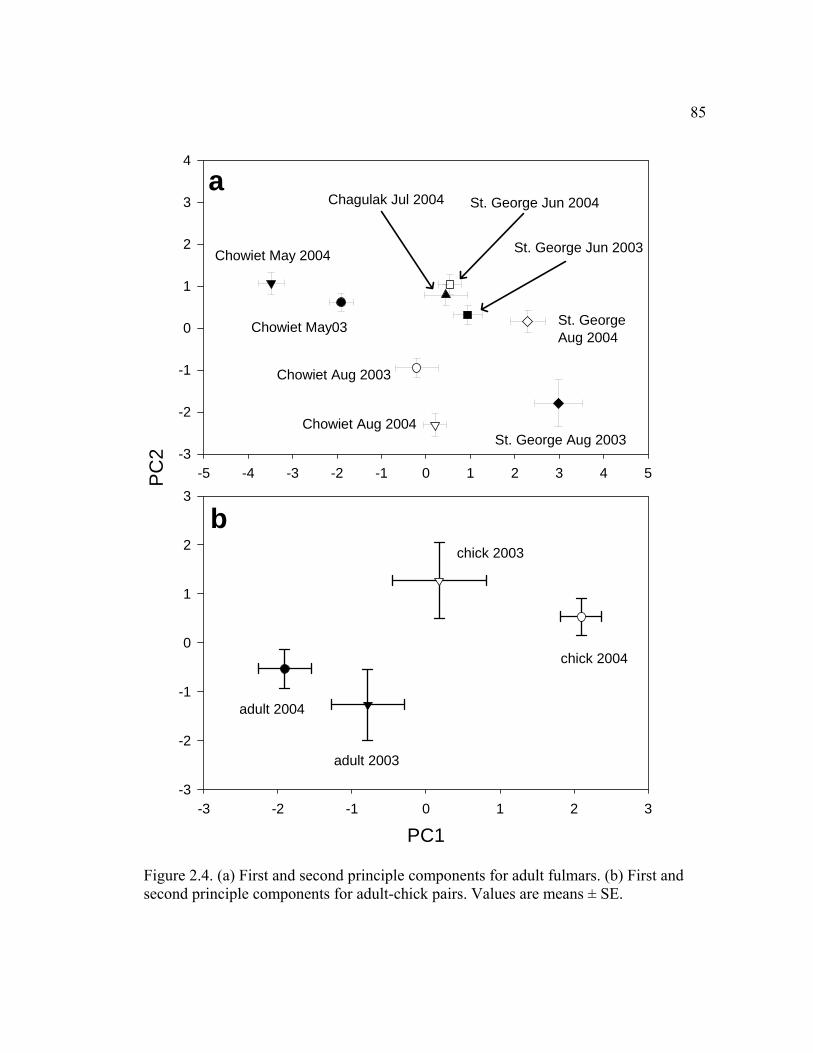
85
-5 -4 -3 -2 -1 0 1 2 3 4 5-3
-2
-1
0
1
2
3
4
PC1-3 -2 -1 0 1 2 3
PC
2
-3
-2
-1
0
1
2
3
a
b
adult 2003
chick 2004
Chowiet Aug 2004
Chowiet Aug 2003
St. George Aug 2004
St. George Jun 2003
St. George Jun 2004
Chowiet May 2004
Chowiet May03
Chagulak Jul 2004
St. George Aug 2003
chick 2003
adult 2004
Figure 2.4. (a) First and second principle components for adult fulmars. (b) First and second principle components for adult-chick pairs. Values are means ± SE.

86
-8 -6 -4 -2 0 2 4 6-3
-2
-1
0
1
2
3
-6 -4 -2 0 2 4 6-6
-4
-2
0
2
4
6
a
b
adultschicks
Chowiet Aug 2004
Chowiet Aug 2003
St. George Aug 2004
St. George Jun 2003
St. George Jun 2004
Chowiet May 2004
Chowiet May 2003
Chagulak Jul 2004
1st Discriminant Function
2nd
Dis
crim
inan
t Fun
ctio
n
2004
Figure 2.5. (a) First and second discriminant functions for adult fulmars. (b) First and second discriminant functions for adult-chick pairs. Values are means and individual observations.
87
Conclusions
I compared FA signatures between stomach oil and adipose tissue of Northern
Fulmars, and assessed spatial (between colonies), temporal (seasonal and inter-annual),
and age class (adult-chick) variability in their diets. I found that FA signatures of adipose
tissue were significantly different than those of stomach oil, which supported prediction
1, that signatures of adipose tissue and stomach oils would differ because of the differing
time scale each depot reflects and/or because adipose tissue FAs may be influenced by
predator metabolism, while stomach oil FAs may be influenced by differential uptake.
There were conspicuous spatial and temporal differences in adipose tissue signatures,
which supported prediction 2, fulmar diets would differ between colonies located in
distinct oceanographic settings and prediction 3, that diets would differ temporally within
colonies because of potential interannual variability in the physical environment resulting
in temporal shifts in FA signatures of prey species. Adipose tissue signatures in chicks
differed significantly from those of adults in 2004, and similar patterns existed in 2003,
contrary to prediction 4, that diets of adult fulmars and their chicks would be similar
because they feed by regurgitation.
FA composition of both stomach oil and adipose tissue have the potential of being
extremely informative, with stomach oil providing information on the most recent meals
and adipose tissue revealing a diet integrated over a longer period of time. Both time
scales are of interest to biologists. The results of my research have shown that there are
differences between stomach oil and adipose tissue signatures, but the biological
significance of these differences needs to be evaluated. My results also showed that FA
88
signatures of adult Northern Fulmars varied seasonally and at the three colonies located
in distinct oceanographic settings in Alaska, likely reflecting changes in prey
distributions and abundances both between geographic regions and over seasons.
Although I did not find significant differences between chicks and adults in 2003,
the differences in the levels of individual FAs between adults and chicks were similar to
those found in 2004. I attribute the lack of power to detect any differences between
signatures in 2003 to a small sample size (n = 8 pairs). The simplest explanation for the
differences in FA profiles between adults and chicks on Chowiet I. in 2004, and likely
2003, is that adults were feeding their chicks a different diet than they were consuming
themselves. However, other factors which may explain these differences, such as the
preferential use of essential FA from stomach oil in chicks, require further investigation.
In the absence of known prey signatures for reference, the interpretation of FA
data is subjective and qualitative. Nonetheless, by using multivariate statistical tools, such
as principle components and discriminant analysis, the relative differences between
signatures can be assessed. Such use of FA signatures to evaluate diet qualitatively raises
the question: how many FAs must differ from one signature to another to conclude that
the implied differences in diet are biologically significant? This question can be
answered by quantitatively assessing the diet of predators using QFASA. My post-thesis
research will include estimations of the relative proportions of prey in the diets of fulmars
using QFASA. The results from a QFASA model will also help to interpret the
significance of differences in signatures by addressing the issue posed above regarding
statistical difference versus biological significance.

89
In addition to modeling the diets of fulmars using adipose tissue alone, I will also
model the diets using stomach oil FA signatures. This will allow me to determine how the
differences in signatures between the two lipid sources affect an estimate of diet. If the
results of models are comparable, then the implications would be that stomach oil and
adipose tissue FAs represent the same diet, and the less invasive method of using
stomach oil would provide sufficient information to characterize a fulmar’s diet
composition. Because stomach oil FAs in essence are an intermediate between prey and
adipose tissue FAs, it is feasible that the differences between stomach oil and adipose
tissue FA signatures may be used to calculate calibration coefficients for fulmars in lieu
of a captive study, and at the very least reveal metabolic information of individual FAs in
fulmars that may be applied to other seabirds in future studies.
A short-coming of this study was the unbalanced sampling design available for
use in Chapter 1. Because samples were collected opportunistically and fulmars do not
always eject stomach oil when handled, I lacked the number of samples from some
colonies and age classes needed to assess potentially important interactions. Differences
in signatures between the two lipid sources could be explained by either a difference in
diet or by patterns of FA mobilization from stomach oil and adipose tissue. Differences
between adult and chick signatures, in particular, may result from the use of essential FAs
in the stomach oil of chicks rather than from the adipose tissue. To address these issues
and determine the rates of FA mobilization from stomach oil, a captive study on adults
and chicks is needed. By feeding captive birds known diets (homogenous and mixed),
and by using radioisotopes, the fate of fatty acids in food and stomach oil can be

90
determined (e.g. Budge et al. 2004, Roby et al. 1989). To accurately estimate the diets of
wild fulmars, we need to understand FA metabolism, including transitions that occur
between food, stomach oil, and adipose tissue FAs.
Additional studies are also needed to address the impact of commercial fisheries
on fulmars in Alaska. For example, we should know the amount of offal consumed by
fulmars in relation to naturally available prey, and how populations and breeding success
respond to the exploitation of commercial byproducts.
From previous studies we know that in an ecosystem, FA signatures of prey are
not constant because of variability between age classes, seasons, and geography:
nevertheless, variability among species is expected to be much higher than variability
within species (Iverson et al. 1997b, Iverson et al. 2002, Budge et al. 2002). However,
we do not know how much within-species variability exists over time, or between
ecologically distinct regions such as the Bering Sea and the Gulf of Alaska. Currently, the
assumption is that prey species in the Gulf of Alaska exhibit the same FA signature as the
same species in the Bering Sea and the North Pacific, and there is no significant seasonal
change in FA signatures in a particular prey species. However, if there is significant
spatial, seasonal, and/or inter-annual variability in prey, a new prey library will need to
be built every season and every year from areas of concern, both of which are expensive
and time consuming. These issues of temporal and spatial variability in FA composition
of forage species are currently being addressed in Dr. Sara Iverson’s laboratory at
Dalhousie University.

91
In another ongoing study (Regime Forcing and Ecosystem Reponse [ReFER]), a
protocol was developed for using QFASA to estimate the diets of four seabird species on
St. Paul I., St. George I., and Bogoslof I. in Alaska (Iverson & Springer 2002). Results
from my research, including post-thesis work, will complement the ReFER project by
further revealing differences and similarities in diets of seabirds in Alaska. I hope to
reveal differences in seabird FA metabolism by comparing calibration coefficients among
the different seabird species, and to possibly use fulmar calibration coefficients on
closely related species such as storm-petrels.
In conclusion, I found that the diets of Northern Fulmars agreed with most of my
predictions, but further work is desirable to thoroughly validate these results. I have
shown that FA signature analysis is a powerful tool for characterizing and comparing
foraging patterns of seabirds. This approach to diet analysis, including QFASA, can
significantly increase our understanding of foraging ecology, diet composition, and
predator-prey relationships of fulmars and other marine birds, all of which yield measures
of the impact of environmental variation on the birds and their ecosystem.

92
References
Ackman RG (1980) Fish lipids. Part I. In: Connell JJ (ed) Advances in fish science and
technology. Fishing News Books, Surrey, UK, p 86-103
Ackman RG, Linke BA, Hingley J (1974) Some details of fatty acids and alcohols in the
lipids of North Atlantic copepods. J Fish Res Bd Can 31:1812-1818
Annett C, Pierotti R (1989) Chick hatching as a trigger for dietary switching in the
western gull. Colonial Waterbirds 12:4-11
Ashmole NP (1971) Seabird ecology and the marine environment. In: Farner DS, King
JR (eds) Avian Biology. Academic Press, New York, pp 223-286
Bishop DG, Ritz DA, Hosie GW, Kenrick JR, Olley J (1983) Fatty acid composition of
the lipids of Puffinus Tenuirostris (Temminck) in relation to its diet. J Exp Mar Biol Ecol
71:17-26
Barbraud C, Weimerskirch H (2001) Emperor penguins and climate change. Nature 411,
183-186
Bradstreet MSW (1985) Feeding Studies. U.S. Minerals Management Service, OCS
Study MMS 85-0068, Anchorage, AK:257-306
Broad RA (1974) Contamination of birds with fulmar oil. Br Birds 67:297-301
93
Brown DJ, Boyd IL, Cripps GC, Butler PJ (1999) Fatty acid signature analysis from the
milk of Antarctic fur seals and Southern elephant seals from South Georgia: implications
for diet determination. Mar Ecol Prog Ser 187:251-263
Budge SM, Cooper MH, Iverson SJ (2004) Demonstration of the deposition and
modification of dietary fatty acids in pinnipeds blubber using radiolabelled precursors.
Phys Biochem Zool 77:682-687
Budge SM, Iverson SJ, Bowen WD, Ackman RG (2002) Among-and within-species
variability in fatty acid signatures of marine fish and invertebrates on the Scotian Shelf,
Georges Bank, and southern Gulf of St. Lawrence. Can J Fish Aquat Sci 59:886-898
Byrd GV, Williams JC ( 2004) Cormorant surveys in the Near Island Group, Aleutian
Islands, Alaska, in July 2003 with notes on other species. U.S. Fish and Wildl. Serv.
Rep. AMNWR 03/13
Cairns DK (1987) Seabirds as indicators of marine food supplies. Biol Oceanogr 5 :261-
271
Carter CL (1928) A chemical investigation of mutton-bird oil. Part II. Comparison of
stomach oil and body fat. J Soc Chem Ind 47:26-30
Carter CL, Malcolm J (1927) Observations on the biochemistry of “mutton bird” oil.
Biochem J 21:484-493

94
Cheah CC, Hansen IA (1970a) Stomach oil and tissue lipids of the petrels Puffinus
pacificus and Pterodroma macroptera. Int J Biochem 1:203-208
Cheah CC, Hansen IA (1970b) Wax esters in the stomach oil of petrels. Int J Biochem
1:198-202
Clarke A (1977) Contamination of pergrine falcons (Falco peregrinus) with fulmar
stomach oil. J Zool 181:11-20
Clarke A (1989) Seabirds. In: Ackman RG (ed) Marine biogenic lipids, fats and oils.
CRC Press, Boca Raton, Florida, pp 383-398
Clarke A, Prince PA (1976) The origin of stomach oil in marine birds: analyses of the
stomach oil from six species of subantarctic Procellariiform birds. J Exp Mar Biol Ecol
23:15-30
Connan M, Mayzaud P, Boutoute M, Weimerskirch H, Cherel, Y (2005) Lipid
composition of stomach oil in a procellariiform seabird Puffinus tenuirostris:
implications for food web studies. Mar Ecol Prog Ser 290: 277 – 290
Cook HW (1991) Fatty acid desaturation and chain elongtation in eucaryotes. In: Vance
DE, Vance JE (eds) Biochemistry of lipids and membranes. Elsevier Science,
Amsterdam, The Netherlands, p 141-169

95
Dahl TM, Falk-Petersen S, Gabrielsen GW, Sargent JR, Hop H, Millar RM (2003) Lipids
and stable isotopes in common eider, black-legged kittiwake and northern fulmar: a
trophic study from an Arctic fjord. Mar Ecol Prog Ser 256:257-269
Divoky G (1998) Factors affecting the growth of a Black Guillemot colony in Northern
Alaska. PhD Thesis. Univ. of Alaska Fairbanks
Dragoo DE, Byrd GV, Irons DB (2003) Breeding status, population trends and diets of
seabirds in Alaska, 2001. US Fish & Wildl Serv Rep, AMNWR 03/05
Duffy DC, Jackson S (1986) Diet studies of seabirds: a review of methods. Colon
Waterbirds 9:1-17
Dunstan GA, Volkman JK, Barrett SM, Leroi J-M, Jeffrey SW (1994) Essential
polyunsaturated fatty acids from 14 species of diatom (Bacillariophyceae).
Phytochemistry 35:155-161
Falk-Petersen S, Hopkins CCE, Sargent JR (1990) Trophic relationships in the pelagic,
arctic food web. In: Barnes M, Gibson RN (eds) Trophic relationships in the marine
environment. Proc 24th Eur Mar Biol Symp, Aberdeen University Press, Oban, Argyll,
Scotland, p 315-333
Fisher J (1952) The Fulmar. Collins, London

96
Fitzgerald S, Kuletz K (2003) Seabirds. In: Livingston, P.A. (ed). Ecosystem
Considerations for 2004. Appendix C. Stock Assessment and Fishery Evaluation Report
for the Groundfish Resources of the EBS/AI and GOA. North Pacific Fishery
Management Council, Anchorage, AK, p 206-238
Francis RC, Hare SR (1994) Decadal-scale regime shifts in the large marine ecosystems
of the North-east Pacific: a case for historical science. Fish Oceanogr 3:4: 279-291.
Francis RC, Hare SR, Hollowed AB, Wooster WS (1998) Effects of interdecadal climate
variability on the oceanic ecosystems of the NE Pacific. Fish Oceanogr 7:1-21
Furness RW, Cooper J (1982) Interactions between seabird and pelagic fish populations
in the Southern Benguela region. Mar Ecol Prog Ser 8:243-250
Furness BL, Laugksch RC, Duffy DC (1984) Cephalopod beaks and studies of seabird
diets. Auk 101:619
Furness RW, Todd CM (1984) Diets and feeding of fulmars Fulmarus glacialis during
the breeding season: a comparison between St. Kilda and Shetland colonies. Ibis
126:379-387
Furness RW, Barrett R.T. (1991) Ecological responses of seabirds to reductions of fish
stocks in north Norway and Shetland. Int Ornith Congr 20:2241-2245
Furness RW, Nettleship DN (1991) Seabirds as monitors of changing marine
environments. Int Ornith Congr 20:2237-2280

97
Gould P, Walker W, Ostrom P (1997) Foods of northern fulmars associated with high-
seas drift nets in the transitional region of the North Pacific. Northwestern Nat 78:57-61
Hamer KC, Furness RW, Caldow RWG (1991) The effects of changes in food
availability on the breeding ecology of great skuas Catharacta skua in Shetland. J Zool
Lond 223:175-188
Hare SR, Mantua NJ (2000) Empirical evidence for North Pacific regime shifts in 1977
and 1989. Progr Oceanogr 47: 103-146.
Harrison NM (1984) Predation on jellyfish and their associates by seabirds. Limnol
Oceanogr 29:1335-1337
Hatch SA (1993) Ecology and population status of Northern Fulmars Fulmarus glacialis
of the North Pacific. In: Vermeer K, Briggs KT, Morgan KH, Siegel-Causey D (eds) The
status, ecology, and conservation of marine birds of the North Pacific. Can Wildlife
Service Special Publ, Ottawa, p 82-91
Hatch SA, Hatch MA (1983) Populations and habitat use of marine birds in the Semidi
Islands, Alaska. Murrelet 64:39-46
Hatch SA, Sanger GA (1992) Puffins as samplers of juvenile pollock and other forage
fish in the Gulf of Alaska. Mar Ecol Prog Ser 80:1-14
Hatch SA, Nettleship DN (1998) Northern Fulmar (Fulmarus glacialis). The Birds of
North America, Inc., Philadelphia, PA

98
Hills S, Fiscus CH (1988) Cephalopod beaks from the stomachs of northern fulmars
(Fulmarus glacialis) found dead on the Washington coast. Murrelet 69:15-20
Horgan IE, Barrett JA (1985) The use of lipid profiles in comparing the diet of seabirds.
In: Siegfried WR, Condy PR, Laws RM. Antarctic nutrient cycles and food webs.
Springer, Berlin Heidelberg, pp 494-497
Hunt Jr GL, Burgeson B, Sanger GA (1981a) Feeding ecology of seabirds in the eastern
Bering Sea. University of Washington Press, Seattle, WA, p 629-647
Hunt Jr GI, Gould, P.J., Forsell DJ, Peterson Jr. H (1981b) Pelagic distribution of marine
birds in the eastern Bering Sea. In: Hood DW, Calder JA. The eastern Bering Sea shelf:
oceanography and resources. University of Washington Press, Seattle, WA, p 689-718
Imber MJ (1976) The origin of petrel stomach oils: a review. Condor 78:366-369
Iverson SJ (1993) Milk secretion in marine mammals in relation to foraging: can milk
fatty acids predict diet? Symp Zool Soc Lond 66:263-291
Iverson SJ, Oftedal OT (1992) Fatty acid composition of black bear (Ursus americanus)
milk during and after the period of winter dormancy. Lipids 27:940-943
Iverson SJ, Arnould JPY, Boyd IL (1997a) Milk fatty acid signatures indicate both major
and minor shifts in the diet of lactating Antarctic fur seals. Can J Zool 75:188-197

99
Iverson SJ, Frost KJ, Lowry LF (1997b) Fatty acid signatures reveal fine scale structure
of foraging distribution of harbor seals and their prey in Prince William Sound, Alaska.
Mar Ecol Prog Ser 151:255-271
Iverson SJ, McDonald Jr JE, Smith LK (2001) Changes in the diet of free-ranging black
bears in years of contrasting food availability revealed through milk fatty acids. Can J
Zool 79:2268-2279
Iverson SJ, Frost KJ, Lang SLC (2002) Fat content and fatty acid composition of forage
fish and invertebrates in Prince William Sound, Alaska: factors contributing to among
and within species variability. Mar Ecol Prog Ser 241:161-181
Iverson SJ, Springer AM (2002) Estimating seabird diets using fatty acids: protocol
development and testing of ReFER Hypotheses. NPMR Final Report, Fairbanks, AK
Iverson SJ, Field C, Bowen WD, Blanchard W (2004) Quantitative fatty acid signature
analysis: a new method of estimating predator diets. Ecol Monogr 74:211-235
Iverson SJ, Springer AM, Kitaysky AS, Byrd GV (in prep) Divergent diets of four
species of seabirds in the Bering Sea estimated from fatty acid signatures: validations in
captive and free-ranging individuals.
Jacob J (1982) Stomach Oils. In: Farner DS, King JR, Parkes KC (eds) Avian Biology.
Academic Press, London, pp 325-340

100
Jobling M, Breiby A (1986) The use and abuse of fish otoliths in studies of feeding habits
of marine piscivores. Sarsia 71:265-274
Kirsch PE, Iverson SJ, Bowen WD (2000) Effect of a low-fat diet on body composition
and blubber fatty acids of captive juvenile harp seals (Phoca groenlandica). Physiol
Biochem Zool 73:45-59
Kitaysky AS, Golubova EG (2000) Climate change causes contrasting trends in
reproductive performance of planktivorous and piscivorous alcids. J Anim Ecol 69:248-
262
Kritzler H (1948) Observations on behavior in captive fulmars. Condor 50:5-15
Larned A, Sapora S (2005) Results of seabird monitoring at Chowiet Island in 2005:
summary appendices. US Fish & Wildl Serv Rep, AMNWR 05/15
Laugksch RC, Duffy DC (1986) Food transit rates in cape gannets and jackass penguins.
Condor 88:117-119
Lewis RW (1966) Studies of glyceryl ethers of the stomach oil of Leach's Petrel,
Oceanodroma leucorhoa. Comp Biochem Physiol 19:363-377
Lewis RW (1969) Studies on the stomach oils of marine animals. II. Oils of some
procellariiform birds. Comp Biochem Physiol 31:725-731
Litzow MA, Piatt JF, Prichard AK, Roby DD (2002) Response of pigeon guillemots to
variable abundance of high-lipid and low-lipid prey. Oecologia 132:286-295

101
Lovern JA (1938) The body fats of some seabirds. Biochem J 32:2142-2144
Mantua NJ, Hare SR, Zhang Y, Wallace JM, Francis RC (1997) A Pacific interdecadal
climate oscillation with impacts on salmon production. Bull Amer Meteoro Soc 78:1069-
1079
Matthews LH (1949) The origin of stomach oil in the petrels, with comparative
observations on the avian proventriculus. Ibis 91:373-392
Mearns R (1983) Breeding peregrines oiled by fulmars. Bird Study 30:243-244
Mendenhall VM (1997) Preliminary report on the 1997 Alaska seabird die-off. US Fish
& Wildlife Serv. Rep. Anchorage, AK.
Montevecchi WA, Myers RA (1995) Prey harvests of seabirds reflect pelagic fish and
squid abundance on multiple spatial and temporal scales. Mar Ecol Prog Ser 117:1-9
Montevecchi WA (1993) Birds as indicators of change in marine prey stocks. In: Furness
RW, Greenwood JJD (eds) Birds as monitors of environmental change. Chapman & Hall,
London, p 217-266
National Research Council (1996) The Bering Sea ecosystem. National Academy Press,
Washington, DC. 307 pp.
Nelson GJ (1992) Dietary fatty acids and lipid metabolism. In: Chow CK (ed) Fatty acids
in foods and their health implications. Dekker, New York, p 437-471

102
Obst BS, Nagy KA (1993) Stomach oil and the energy budget of Wilson's storm-petrel
nestlings. Condor 95:792-805
Pascal JC, Ackman RG (1976) Long chain monoethylenic alcohol and acid isomers in
lipids of copepods and capelin. Chem Phys Lipids 16:219-223
Phillips RA, Petersen MK, Lilliendahl K, Solmundssom J, Hamer KC, Camphuysen CJ,
Zonfrillo B (1999) Diet of the northern fulmar Fulmarus glacialis: reliance on
commercial fisheries. Mar Biol 125:159-170
Piatt JF, Anderson P (1996) Response of common murres to the Exxon Valdez Oil Spill
and long-term changes in the Gulf of Alaska marine ecosystem. Am Fish Soc Symp
18:270-737
Place AR, Stoyan NC, Ricklefs RE, Butler RG (1989) Physiological basis of stomach oil
formation in Leach's storm-petrel (Oceanodroma leucorhoa). Auk 106:687-699
Pond CM (1998) The fats of life. Cambridge University Press, Cambridge, UK
Preble EA, McAtee WL (1923) A biological survey of the Pribilof Islands, Alaska. No.
American Fauna, no. 46
Raclot T, Groscolas R, Cherel Y (1998) Fatty acid evidence for the importance of
myctophid fishes in the diet of king penguins, Aptenodytes patagonicus. Mar Biol
132:523-533

103
Roby DD, Brink KL, Place AR (1989) Relative passage rates of lipid and aqueous digesta
in the formation of stomach oils. Auk 106:303-313
Roby DD, Taylor JRE, Place AR (1992) Investigation of the adaptive role of stomach oils
in seabird reproduction. Antarct J US 7:147-178
Roby DD, Taylor JRE, Place AR (1993) Physiological aspects of stomach oil formation
in Antarctic seabirds. Antarct J US 28:146-147
Roby DD, Taylor JRE, Place AR (1997) Significance of stomach oil for reproduction in
seabirds: an interspecies cross-fostering experiment. Auk 114:725-736
Rosenheim O, Webster TA (1926) The stomach oil of the fulmar petrel (Fulmarus
glacialis). Biochem J 21:111-118
Sanger GA (1986) Diets and food web relationships of seabirds in the Gulf of Alaska and
adjacent marine regions. U.S. Fish and Wildlife Service Report, Denver, CO
Sargent JR, Whittle KJ (1981) Lipids and hydrocarbons in the marine food web. In:
Longhurst AR. Analysis of marine ecosystems. Academic, London, p 491-533
Sargent JR, Parkes RJ, Mueller-Harvey I, Henderson RJ (1988) Lipid biomarkers in
marine ecology. In: Sleigh MA (ed) Microbes in the sea. Ellis Horwood, Chichester, UK,
p 119-138
Smith LH (1911) Some constants of mutton bird oil. J Soc Chem Indust 30: 405

104
Springer AM (1998) Is it all climate change? Why marine bird and mammal populations
fluctuate in the North Pacific. In: Biotic impacts of extratropical climate change in the
Pacific. 'Aha Huliko'a Proc Hawaiian Winter Workshop, University of Hawaii, p 109-119
Springer AM, Roseneau DG, Murphy EC, Springer MI (1984) Environmental controls of
marine food webs: food habits of seabirds in the Eastern Chukchi Sea. Can J Fish Aquat
Sci 41:1202-1215
Springer AM, Piatt JF, van Vliet G (1996) Seabirds as proxies of marine habitats and
food webs in the western Aleutian Arc. Fish Oceanogr 5:45-55
Springer AM, Speckman SG (1997) A forage fish is what? Summary of the symposium.
In: Forage fishes in marine ecosystems. Alaska Sea Grant College Program, University
of Alaska Fairbanks, p 773-805
Sugimoto T, Tadokoro K (1997) Interannual-interdecadal variations in zooplankton
biomass, chlorophyll concentration and physical environment in the subarctic Pacific and
Bering Sea. Fish Oceanogr 6: 74-93.
Taylor JRE, Place AR, Roby DD (1997) Stomach oil and reproductive energetics in
Antarctic prions, Pachyptila desolata. Can J Zool 75:490-500
Taylor RH, Wilson PR (1990) Recent increase and southern expansion of Adelie penguin
populations in the Ross Sea, Antarctica, related to climatic warming. NZ J Ecol 14:25-29

105
Travers HH, Travers WTL (1873) On the birds of the Chatham Islands. Trans Proc New
Zeal Inst 5:212-222
Trenberth KE, Hurrell JW (1994) Decadal atmospheric-ocean variations in the North
Pacific. Clim Dynam 9:303-319
Trites AW (1992) Northern fur seals: why have they declined? Aquat Mam 18:3-18
Van Pelt TI, Shultz MT (2002) Common Murre Biology in lower Cook Inlet. In: Piatt JF
(ed) Response of seabirds to fluctuations in forage fish density. Final Report to Exxon
Valdez Oil Spill Trustee Council (Restoration Project 00163M) and Minerals
Management Service (Alaska OCS Region). Alaska Science Center, U.S. Geological
Survey, Anchorage, Alaska, pp 71-85
Vermeer K (1992) The diet of birds as a tool for monitoring the biological environment.
In: Vermeer K, Butler RWH, Morgan KH (eds) The ecology, status and conservation of
marine and shoreline birds on the west coast of Vancouver Island. Can Wildl Ser
Occasional Paper, Ottawa, p 41-50
Votier SC, Bearhop S, MacCormick A, Ratcliffe N, Furness RW (2003) Assessing the
diet of great skuas, Catharacta skua, using five different techniques. Polar Biol 26:20-26
Warham J (1977) The incidence, functions and ecological significance of petrel stomach
oils. Proc N Z Ecol Soc 24:84-93

106
Warham J, Watts R, Dainty RJ (1976) The composition, energy content and function of
the stomach oils of petrels (order, Procellariiformes). J Exp Mar Biol Ecol 23:1-13
Watts R, Warham J (1976) Structure of some intact lipids of petrel stomach oils. Lipids
11:423-429
Weimerskirch H, Inchausti P, Guinet C, Barbraud C (2003) Trends in bird and seal
populations as indicators of a system shift in the Southern Ocean. Antarct. Sci.15: 249-
256