for the year ended 30 june 2013 - parliament of victoria
TRANSCRIPT

Annual Reportfor the year ended 30 June 2013
City West Water CorporationABN 70 066 902 467


Contents
A Foreword from the Chairman and Managing Director ...............................................................................................1
Report of Operations ................................................................................................................................................2
Performance Report ...............................................................................................................................................22
Major non residential water users ............................................................................................................................24
Attestation on Compliance with the Australian/New Zealand Risk Management Standard ...........................................25
Statement of Comprehensive Income ......................................................................................................................26
Balance Sheet ........................................................................................................................................................27
Statement of Changes in Equity ..............................................................................................................................28
Cash Flow Statement .............................................................................................................................................29
Notes to and forming part of the Financial Statements
1. Summary of significant accounting policies ....................................................................................................30
2. Financial risk management objectives and policies .........................................................................................37
3. Revenue and other income ...........................................................................................................................40
4. Expenses ....................................................................................................................................................42
5. Income tax ...................................................................................................................................................43
6. Deferred tax assets and deferred tax liabilities reconciliation ..........................................................................44
7. Dividends ....................................................................................................................................................45
8. Current assets - Cash and cash equivalents .................................................................................................45
9. Current assets - Receivables ........................................................................................................................46
10. Current assets - Prepayments ......................................................................................................................47
11. Non current assets - Receivables .................................................................................................................47
12. Non current assets - Infrastructure, property, plant and equipment .................................................................47
13. Non-current assets - Intangible assets ..........................................................................................................49
14. Non current assets - Deferred tax assets ......................................................................................................50
15. Current liabilities - Payables ..........................................................................................................................50
16. Current liabilities - Borrowings .......................................................................................................................50
17. Current liabilities - Current tax liabilities ..........................................................................................................50
18. Current liabilities - Provisions ........................................................................................................................51
19. Current liabilities - Other ...............................................................................................................................52
20. Non-current liabilities - Borrowings ................................................................................................................52
21. Non-current liabilities - Deferred tax liabilities ..................................................................................................52
22. Non-current liabilities - Provisions ..................................................................................................................52
23. Non-current liabilities - Unearned income ......................................................................................................52
24. Equity ..........................................................................................................................................................52
25. Responsible persons and executives ............................................................................................................53
26. Remuneration of auditor ...............................................................................................................................56
27. Contingent assets and liabilities ....................................................................................................................56
28. Commitment for expenditure ........................................................................................................................57

29. Employee benefits ........................................................................................................................................58
30. Related party disclosure ...............................................................................................................................62
31. Economic dependency ................................................................................................................................68
32. Reconciliation of profit after income tax to net cash inflow from operating activities ..........................................68
33. Financial instruments ....................................................................................................................................69
Statutory Certification ..............................................................................................................................................73
Independent Auditor’s Report ..................................................................................................................................74
Appendix 1 – Disclosure Index ................................................................................................................................76
Appendix 2 – Key Performance Indicators ................................................................................................................79
Appendix 3 – Bulk Water Entitlement reporting .........................................................................................................81

We are pleased to present City West Water’s 2012-13 Annual Report. This report provides a summary of the corporation’s performance, audited financial report, corporate governance statements and additional statutory information.
Overall, City West Water performed very well across its triple bottom line key performance indicators. Profit before tax for the year was $48.7m compared to budget of $27.1m. Higher than expected sales revenue due to a hot and dry summer, as well as lower than expected finance charges and depreciation were the main contributing factors to this positive result. Water purchases were 103.2GL compared to last year’s 96.3GL and budget of 95.3GL.
A focus on customer service as well as improving the corporation’s productivity continues to be a priority for City West Water. The corporation’s aim is to continue to deliver the level of service customers want at lower cost.
City West Water commenced the implementation phase of the corporation’s business transformation program during the year. When the program is fully implemented over the next few years, City West Water’s operations will be simplified, efficiency improved and customer service capability strengthened. Release One of the program involves implementation of foundation modules such as finance and contract management. This release went live in early August 2013, and was delivered under budget.
The Victorian water regulator, the Essential Services Commission (ESC), handed down its final decision on prices for the next five years in late June 2013. City West Water’s residential customers will see their household bill increase by around 20 per cent from 1 July 2013. Approximately 80 per cent of the price increase is attributable to the fact that the State commenced to pay for the Victorian Desalination Plant (VDP), with the remaining increase largely due to the need to invest in infrastructure to service growth.
The costs associated with the VDP are separated into an annual availability payment (which meets the cost of the plant’s having been constructed and being available to supply water) and a payment based on how much water is ordered from the plant in any year. The annual availability payment is included in prices from 1 July 2013.
In any year, if no water is ordered from the VDP, residential water price increases will be limited to inflation for the remaining years of the ESC’s pricing decision. In any year for which water is ordered from the VDP, the average household bill is expected to increase by between $10 and $45 for that year in accordance with a formula approved by the ESC.
City West Water’s customers will continue to benefit from having the lowest residential bill of the three metropolitan Melbourne retailers for the next five years.
During the previous financial year, principally as a result of a delay in the commissioning of the Victorian Desalination Plant, Melbourne Water received income before it incurred costs in connection with the plant. As a result, the Victorian Government decided that retail water businesses should return those early collections to customers. City West Water returned the majority of the early recovery of VDP costs to customers during the 2012-13 year, with the balance to be returned in 2013-14. The return of this money to customers was cost neutral to City West Water as the repayments were fully funded through lower bulk charges to City West Water from Melbourne Water.
The Office of Living Victoria (OLV) released its ‘Melbourne’s Water Future’ consultation paper in early July 2013. The reforms outlined in the paper will result in a more integrated approach to securing a safe and reliable water supply, managing stormwater runoff and wastewater discharge, keeping our parks and gardens vibrant and improving the health of our waterways. City West Water’s five year strategic plan aligns closely with Melbourne’s Water Future, and the corporation will work with the OLV to effectively implement the strategy.
During the year, two members of the Board of Directors retired from their positions. On behalf of the Board, we would like to acknowledge the contributions of Jan Boxall and John Miller for the past six years. We welcomed two new Directors, Fiona Pearse and Peter McKeown, who were appointed in October 2012.
We extend a sincere thank you to the Board of Directors and staff for their continued support, efforts and achievements over the past year.
In accordance with the Financial Management Act 1994, we are pleased to attest that City West Water’s Annual Report is compliant with all statutory reporting requirements.
The Hon. Alan Stockdale Chairman
Melbourne 28 August 2013
1
A Foreword from the Chairman and Managing Director
Anne Barker Managing Director

Annual Report 2012-13
Report of Operations
General informationCity West Water Corporation is a statutory water authority incorporated under the Water Act 1989. It is one of three retail water businesses in metropolitan Melbourne owned by the Victorian Government. The Minister responsible for City West Water for the period from 1 July 2012 to 30 June 2013 was the Hon. Peter Walsh MLA, Minister for Water.
City West Water’s core business is the supply of water, sewerage, trade waste and where available, recycled water services to customers in accordance with the corporation’s Customer Charter. City West Water services over 385,000 residential and business customers in Melbourne’s central business district and inner and western suburbs.
Each year City West Water supplies around 100 billion litres of drinking water to customers and transfers approximately 94 per cent of sewage and trade waste collected to Melbourne Water’s Western Treatment Plant in Werribee. The remaining six per cent is treated at City West Water’s Altona Treatment Plant.
City West Water operates under Statements of Obligations issued by the Minister for Water under the Water Industry Act 1994. The Statements impose obligations on City West Water regarding the performance of its functions and exercise of powers. City West Water is required to monitor compliance with the obligations set out in the Statements, report on non-compliance and take remedial action.
The Essential Services Commission (ESC) is City West Water’s economic regulator. The ESC approves the prices the corporation charges its customers, as well as the standards of service the corporation delivers. City West Water is required to submit a five year Water Plan to the ESC which outlines what the corporation will achieve, as well as proposed prices. The ESC undertakes a public review of City West Water’s Water Plan in consultation with all stakeholders.
City West Water’s drinking water quality is regulated by the Department of Health under the Safe Drinking Water Act 2003, and its recycled water quality is regulated by the Environment Protection Authority (EPA) under the Environment Protection Act 1970. The management of the corporation’s sewerage responsibilities is also regulated by the EPA.
Vision To be a truly sustainable water business.
Mission To guarantee affordable and safe water for today and tomorrow, and contribute to a healthy urban habitat.
Values Leadership, integrity, innovation, respect.
2

3
Organisational structure
Board of Directors
Managing Director Anne Barker
Occupational Health and Safety Committee
General Manager, Service
Sustainability Geoff Gardiner
Environment and Social Sustainability Committee
(discontinued)
General Manager, Corporate Services
Sean Crees
Executive Remuneration Committee
General Manager, Water Solutions
Sam Torre
Risk Management and Audit Committee
General Manager, Engineering Matthew
Giesemann
General Manager, Business
Transformation and Technology Stephen
Robertson
General Manager People, Strategy
and Change James Kingsland
The Hon. Peter Walsh MLA was appointed as the Minister for Water in December 2010. As Minister for Water, the Minister is responsible for urban water, irrigation water, groundwater, water corporations and governance, allocation and trading, permanent water saving rules and water restrictions.
The Minister for Water appoints the directors of City West Water and the Victorian Government sets their remuneration. Directors are eligible for reappointment for subsequent terms. The Board is responsible for setting and overseeing the policies, objectives and strategies of City West Water, and ensuring risk is appropriately managed.
The Board meets 11 times per year, with additional meetings held on an as needed basis. It is committed to performing its role in accordance with the highest standards of corporate governance. There are three committees of the Board. The Risk Management and Audit Committee, and the Occupational Health and Safety Committee meet four times per year. The Executive Remuneration Committee meets as required.
The Board also had a fourth committee, the Environment and Social Sustainability Committee, which was discontinued during the year, its responsibilities being transferred to the Board.
The Board approves budgets and significant projects, reviews corporate policies and strategies, and oversees progress on key issues affecting the corporation.
The Board comprises seven non-executive Directors and the Managing Director. Each Director brings specialist skills to City West Water.
The Board reviews its own performance on a regular basis and reports to the Minister for Water and Treasurer of Victoria on the outcomes of these reviews.

Annual Report 2012-13
Report of Operations (continued)
Director Experience Committee membershipThe Hon. Alan Stockdale Chairman LLB, BA, FAICD.
The Hon. Alan Stockdale was appointed as Chairman of City West Water on 1 October 2011. Alan Stockdale is a part-time consultant for Maddocks Lawyers, Metro Trains Melbourne Pty Ltd and Yarris Pty Ltd. He is Chairman of the Medical Research Commercialisation Fund (2007 - current); a CEO Syndicate for the CEO Institute and the MBAV Foundation (2008 - current); Federal President of the Liberal Party of Australia (2008 - current); a Director of NSW Treasury Corporation (2005 - current) and a member of the Advisory Board of Lazard Australia (2011 - current). He has extensive corporate experience including roles with Macquarie Infrastructure Group and Macquarie Bank and as Chairman or a Director of several ASX-listed companies. Mr Stockdale was a member of the Victorian Parliament (1985 - 1999) and was Victorian Treasurer (1992 - 1999) and Minister for IT and Multimedia (1996 – 1999). He holds Bachelor of Laws and Bachelor of Arts degrees and is a Fellow of the Australian Institute of Company Directors.
Executive Remuneration Committee (Chairman)
Ex-officio member of all other Board committees
Anne BarkerManaging DirectorLLB, MAICD.
Anne Barker was appointed as City West Water’s Managing Director in November 2002. Ms Barker practised law before gaining broad management experience with Myer Stores and the ANZ Banking Group. Prior to joining City West Water, Ms Barker was the Executive Manager of the Commercial and Revenue divisions at SPI Powernet where she gained extensive experience working in a regulated utility environment. She is currently the Chair of Whitelion, Chair of Open Family Australia, Chair of the Smart Water Fund, a Director of LeadWest, and a Director of the Water Services Association of Australia.
Occupational Health and Safety Committee
Executive Remuneration Committee
Environment and Social Sustainability Committee (discontinued)
Debbie Goodin B.Ec, FCA, MAICD.
Debbie Goodin was appointed as a director on 1 October 2011 and is also the Deputy Chairperson of the Board. Debbie is self employed as a management consultant and also holds roles as a non-executive Director. Debbie has held senior operations, finance, project delivery, corporate strategy, mergers and acquisitions and corporate services roles in both the public and private sectors. Debbie also has experience working globally and in publicly listed companies. Debbie is a Director of Beyond Bank, a mutual bank regulated by APRA (2011-current) and chairs the audit committee and is a member of the risk committee for Beyond Bank. Ms Goodin has a Bachelor of Economics, is a Chartered Accountant, Member of the Institute of Company Directors, and is a qualified insolvency practitioner.
Risk Management and Audit Committee (Chairman)
Executive Remuneration Committee
4

5
Director Experience Committee membershipMarilyn Anderson B.Sc (Hons), PhD FAA, FTSE, FAICD.
Professor Marilyn Anderson was appointed a director on 1 July 2008. With over 30 years experience in scientific research in the areas of diabetes, cancer and plant biochemistry, Professor Anderson is a Professor of Biochemistry at LaTrobe University. Professor Anderson has consulted to the CSIRO and Department of Primary Industries and is an Associate Professorial Fellow in the Botany School at the University of Melbourne. She was a founding director at Hexima Limited, and is currently Hexima’s Chief Science Officer. Professor Anderson was a director at South East Water Limited for over 10 years, prior to her appointment at City West Water. Professor Anderson is a Fellow of the Australian Academy of Sciences, a Fellow of the Academy of Technological Sciences and Engineering and a Fellow of the Australian Institute of Company Directors. She has a Bachelor of Science (Honours) and a Doctorate of Philosophy (Biochemistry).
Occupational Health and Safety Committee (Chairman)
Risk Management and Audit Committee
Environment and Social Sustainability Committee (discontinued)
Jan Begg B.Sc (Hons), MBA FAICD.
Jan Begg was appointed a Director on 1 October 2011. Jan is the Managing Director of Azulin Pty Ltd, an independent business and governance consultancy. She is a non-executive Director of the Royal District Nursing Services, a non-executive Director of South Eastern Melbourne Medicare Local (until 30 December 2012), an independent member of Department of Education and Early Childhood Development Portfolio Audit Committee (Vic), a member of the Monash University Department of Management Advisory Board and a member of Melbourne Business School. Ms Begg previously had senior executive roles in Australia, UK and USA. She is the AICD representative on the Standards Australia committee on IT Governance and an Australian representative on the international standards committee. She has undertaken research and authored academic papers in the area of project governance. Ms Begg has a Bachelor of Science (Honours) and a Master of Business Administration and is a Fellow of the Australian Institute of Company Directors.
Occupational Health and Safety Committee
Environment and Social Sustainability Committee (discontinued)`
Peter McKeown B.Ec., LLB.
Peter McKeown was appointed as a director on 1 October 2012. Peter is a consultant with a background as legal counsel for public companies in the primary industry sector and prior to that as a legal practitioner in private and government practice. He is Company Secretary of Graziers’ Investment Company Limited and GIC holdings Pty Ltd and a Director of Woolmark Americas Limited (a Canadian Company). He is also an occasional sessional law lecturer at Monash University. He is a lay member of the St Vincent’s Hospital Animal Ethics Committee and the external legal member of the Australian Catholic University Human Research Ethics Committee. Peter McKeown was Chairman of the Executive Management Committee of Graziers Investment Company Limited (formerly Australian Wool Services Ltd) and General Counsel and Company Secretary for the Australian Wheat Board and AWB Limited. He has been Chairman of the Mount Lilydale College Advisory Board. Mr McKeown holds undergraduate degrees in economics and law from Monash University, is a practising lawyer and is currently completing his doctorate in law at Monash University.
Occupational Health and Safety Committee
Risk Management and Audit Committee

Annual Report 2012-13
Report of Operations (continued)
Director Experience Committee membershipFiona PearseB.Ec., CPA, GAICD.
Fiona Pearse was appointed a director on 1 October 2012. She has extensive financial and commercial experience gained in her executive career at large global companies. In her 14 years at BHP Billiton, she worked in accounting and tax in both Corporate Head Office roles as well as at coal-face geographic locations. Her experience covers diverse industries including Steel, Petroleum, Insurance, Transport and Utilities. She is also currently a non-executive Director at Australia’s largest charity, World Vision Australia, and at one of Australia’s leading girls’ schools, Presbyterian Ladies’ College where she chairs the Audit and Risk Management Committee. Fiona holds a Bachelor of Economics, majoring in Accounting; she is a Certified Practising Accountant, and a graduate of the Australian Institute of Company Directors.
Risk Management and Audit Committee
Executive Remuneration Committee
Environment and Social Sustainability Committee (discontinued)
Derek SkuesDip Arch., Reg. Arch.
Derek Skues was appointed as a director on 1 July 2008. With a background in architecture and project management, he was a Director of Atkinson Project Management for 20 years, a specialist project management firm with extensive experience in complex building projects such as hospitals. Most recently he has been an Executive Consultant for the multi-disciplinary global company Aurecon undertaking management consulting assignments. He is also a director of the Power House Youth Leadership Foundation and a past director of Lord Somers Camp and Power House, and the Royal South Yarra Lawn Tennis Club.
Occupational Health & Safety Committee
Executive Remuneration Committee
Environment and Social Sustainability Committee (discontinued) (Chairman)
Jan Boxall LLB, FAICD.
Jan Boxall was appointed as a director in January 2007. She is a practising lawyer and a former partner of the national law firm, Corrs Chambers Westgarth, where she advised clients in the property, infrastructure, health, statutory corporation and government sectors. Ms Boxall is the Chairman of the Board of Directors of the Royal Victorian Eye and Ear Hospital Board and was Chair of the Board of Cabrini Health from 2002 to 2006. Ms Boxall is a Fellow of the Australian Institute of Company Directors. Ceased as a Director 30 September 2012.
Occupational Health and Safety Committee
Risk Management and Audit Committee
John Miller AOB.A., B.Com., Ph.D, FCPA, FAICD.
Dr. John Miller was appointed as a Director in January 2007. Dr. Miller is a company Director and management consultant in the areas of strategy, marketing, sustainability and finance. He was previously head of the management schools at Monash and Swinburne. An FCPA, Dr. Miller was senior partner in two international accounting firms - PKF and a predecessor firm of KPMG. He is an honorary life member of CPA Australia and the AICD. John is a life member of the John Button Foundation, a bipartisan group supporting public policy sponsorship. He has been awarded an AO and the Australian centenary medal. Ceased as a Director 30 September 2012.
Executive Remuneration Committee
6

7
Board CommitteesRisk Management and Audit Committee
The Risk Management and Audit Committee assists the Board of Directors in fulfilling its corporate governance responsibilities by reviewing financial reports and other financial information produced by City West Water. In addition, it provides oversight and direction to City West Water’s internal control systems, legal and regulatory compliance processes, auditing and reporting processes, and risk management systems.
Occupational Health and Safety Committee
The Occupational Health and Safety Committee assists the Board in fulfilling its corporate governance responsibilities in relation to workplace health and safety. It does this by providing oversight and direction to City West Water’s occupational health and safety policies and procedures and related audit and reporting processes. In addition it ensures the continuous improvement of City West Water’s policies and procedures for workplace health and safety.
Executive Remuneration Committee
The Executive Remuneration Committee is responsible for setting City West Water’s policy on executive remuneration and individual remuneration packages for senior executives.
Environment and Social Sustainability Committee (discontinued)
The Environment and Social Sustainability Committee assisted the Board in driving the uptake of more sustainable practices through the corporation. It did this through enhancing the understanding of social and environmental issues and overseeing the development and implementation of sustainability, environmental and social policies. The committee also provided input into the development of key environmental and social strategies, plans, reports and practices. The Environmental and Social Sustainability Committee was disbanded in December 2012. The functions and responsibilities of the committee are now carried out by the Board.

Annual Report 2012-13
Report of Operations (continued)
Attendance at Board and committee meetings
Board of Directors meetings
Risk Management and Audit Committee
meetings
Occupational Health and Safety
Committee meetings
Environment and Social
Sustainability Committee
meetings
Executive Remuneration
Committee meetings
Eligible Attended Eligible Attended Eligible Attended Eligible Attended Eligible Attended
The Hon. Alan Stockdale
12 12 5 5 4 4 1 1 4 4
Anne Barker 12 12 5 3 5 4 3 1 1 4 4
Debbie Goodin 12 11 5 5 n/a n/a n/a n/a n/a n/a
Marilyn Anderson
12 10 5 5 4 4 1 1 n/a n/a
Jan Begg 12 12 5 3 2 2 2 1 1 n/a n/a
Peter McKeown 1
9 9 3 3 3 3 n/a n/a 1 1
Fiona Pearse 1 9 9 3 3 n/a n/a 1 1 2 2
Derek Skues 12 12 5 3 2 4 4 1 1 4 4
Jan Boxall 2 3 3 2 2 1 1 n/a n/a n/a n/a
John Miller 2 3 2 n/a n/a n/a n/a n/a n/a 1 01 began as a Director 1 October 2012 2 ceased as a Director 30 September 2012 3 the Director attended but was not a member of the committee
Occupational health and safetyCity West Water is committed to providing healthy and safe workplaces for all employees, contractors, customers and the public who access City West Water’s workplaces. To this end, City West Water works towards a safety culture of shared attitudes, values and beliefs concerning occupational health and safety (OH&S).
City West Water has in place an OH&S policy, which is reviewed by the Board on a regular basis. The policy adopts the general principles outlined within the standard AS 4801:2001 (Occupational Health and Safety Management Systems) which describes a systematic management approach that assists in sustained occupational health and safety improvement.
The policy seeks to support the following objectives of ensuring:
• compliance with relevant OH&S legislation and regulations, including the Occupational Health & Safety Act 2004, and the Occupational Health & Safety Regulations 2007
• that all employees, contractors and visitors are made aware of the health and safety requirements of City West Water
• the development, implementation and enhancement of the City West Water OH&S management system;
• systematic auditing and review of the OH&S management system
• implementation of risk management processes involving the identification, analysis, assessment, treatment and ongoing monitoring of risks to the safety of City West Water staff, customers, visitors, contractors and the public.
The table over the page outlines City West Water’s OH&S targets and its performance against those targets.
8

9
OH&S targets 2013 Actual 2013 Target Variance 2012 Actual
Lost time injuries 0 0 0 1
AS 4801: 2001 (OH&S) Retained Retain - Retained
Attendance at OH&S training (%) 99.9 95.0 5.2 99.3
Workplace inspections conducted (%) 100.0 100.0 0 100.0
Workforce dataCity West Water complies with the Public Administration Act 2004. Employees are selected on the basis of ability, knowledge and skills in fair and open competition that ensures equal opportunity. Promotion and advancement of qualified individuals within City West Water is based on these same principles, relevant to the position involved.
City West Water has in place a disability policy and a Disability Action Plan. City West Water aims to meet its obligations under the Disability Act 2006, the Disability Discrimination Act 1992, the Equal Opportunity Act 1995 and the Charter of Human Rights and Responsibilities Act 2006 by taking actions identified in its Disability Action Plan to eliminate barriers for people with a disability to accessing employment with City West Water.
Employees receive fair and equitable treatment without regard to race, colour, sexual preference, age, physical or mental disability, pregnancy, religion, political opinion, national extraction or social origin.
City West Water has policies for the prevention of harassment and bullying, and equal employment. These policies support the right of all people to work in an environment free from harassment, bullying and discrimination. Behaviour to the contrary will result in disciplinary action up to and including dismissal.
City West Water provides equal employment opportunity (EEO) and bullying prevention training to all employees. Employee Support Officers are available to provide information to employees about their rights and obligations relating to the prevention of harassment, bullying and discrimination.
At 30 June 2013, City West Water’s total workforce was 445 (2011-12, 394). The increase in total workforce can be largely attributed to the insourcing of information technology support, additional resources in the Customer Contact Centre to ensure the corporation meets its performance targets, and a short term increase in resources associated with the implementation of the Arrow Program. The average age of City West Water employees was 41.0 (2011-12 40.1), and the proportion of women in the corporation’s workforce was 41.6 per cent (2011-12 41.6 per cent).

Annual Report 2012-13
Report of Operations (continued)
Financial informationFinancial highlights
Profit before tax for the year was $48.7m compared to budget of $27.1m. Higher than expected sales revenue as a result of a hot and dry summer, as well as lower than expected finance charges and depreciation were the main factors that contributed to this positive result. Water purchases for the year were 103.2GL compared to last year’s 96.3GL and a budget of 95.3GL. The drier weather experienced during the year also contributed to higher than expected bursts and leaks of water mains.
City West Water made a total dividend payment of $24.8m during 2012-13 and paid equivalent income tax of $17.7m.
Total borrowings increased by $177.6m for the year. The increase in borrowing was mainly to fund the required capital expenditure to support growth in the corporation’s licence area as well as continued investment in infrastructure assets. City West Water funded capital expenditure for the year was $182.2m. The capital program for the year included two significant projects for City West Water; the West Werribee Dual Water Supply scheme and the Arrow Program. When complete, the West Werribee Dual Water Supply scheme will supply drinking and recycled water for 19,200 customers in existing and new residential estates in West Werribee. The Arrow Program is a business transformation program based on upgrading most business systems to an Oracle platform. When complete, it will enable significant efficiencies in City West Water’s business processes.
Return on equity was 4.9 per cent (2011-12 6.1 per cent) while cash interest cover was 2.3 times (2011-12 2.9 times). Gearing, as measured by total debt / (debt + equity) increased to 58.1 per cent (2011-12 47.3 per cent). The increase in gearing can be largely attributed to a downward revaluation of City West Water’s infrastructure assets at 30 June 2013, as well as borrowing to fund the continued investment in infrastructure assets. The downward revaluation of assets at balance date reflects the lower weighted average cost of capital (from 5.1 per cent to 4.5 per cent) embedded in the corporation’s prices from 1 July 2013.
City West Water has returned the majority of its share of the early collection of desalination plant costs to its customers. The early recovery of desalination plant costs occurred as a result of a delay in the commissioning of the Victorian Desalination Plant (VDP) and the VDP costs embedded in prices set by the Essential Services Commission for Melbourne Water Corporation’s bulk charges in 2009. The return of the money collected early for the VDP by City West Water is offset by an equivalent return from Melbourne Water in the form of a price freeze on bulk charges, as well as a once-off rebate to customers. These resulted in a cost neutral impact on City West Water’s finances. City West Water expects that the return will be completed in the first quarter of the 2013-14 financial year.
Summary of financial results 2012-13
($’000)2011-12
($’000)2010-11
($’000)2009-10
($’000)2008-09
($’000)
Sales revenue 422,912 429,867 364,856 309,464 265,597
Area contributions 15,934 16,753 17,344 15,843 13,399
Gifted assets 17,454 23,184 25,948 33,386 26,228
Other revenue 21,577 19,555 21,848 22,298 15,375
Total revenue 477,877 489,359 429,996 380,991 320,599
Bulk charges 227,223 225,509 168,450 139,208 115,775
Finance costs 52,422 45,879 39,734 32,090 24,045
Depreciation and amortisation 37,398 35,293 30,507 22,539 20,368
Employee benefits 33,153 30,201 26,441 25,792 23,043
Operating contracts 34,661 31,924 30,287 27,807 26,265
Other expenses 44,302 48,852 46,878 46,404 44,476
Total expenses 429,159 417,658 342,297 293,840 253,972
Profit before tax 48,718 71,701 87,699 87,151 66,627
10

11
Summary of financial position 2012-13
($’000)2011-12
($’000)2010-11
($’000)2009-10
($’000)2008-09
($’000)
Current assets 116,073 77,715 62,353 48,353 62,082
Non-current assets 1,837,812 1,938,297 1,805,999 1,556,043 1,034,489
Total assets 1,953,885 2,016,012 1,868,352 1,604,396 1,096,571
Current liabilities 173,403 186,168 135,692 124,310 126,684
Non-current liabilities 1,110,847 993,487 901,556 786,792 558,776
Total liabilities 1,284,250 1,179,655 1,037,248 911,102 685,460
Net assets 669,635 836,357 831,104 693,294 411,111
Net cash flows from operating activities
47,586 46,741 65,738 48,883 37,936
Payments for property, plant and equipment
157,071 126,900 92,691 95,248 90,007
Summary of financial performance
2012-13 ($’000)
2011-12 ($’000)
2010-11 ($’000)
2009-10 ($’000)
2008-09 ($’000)
Internal financing ratio (%) 13.9 1.0 47.2 12.8 0.7
Gearing ratio (%) (total debt / (debt + equity))
58.1 47.3 42.1 44.1 51.2
Gearing ratio (%) (total debt (including finance leases) / total assets))
47.5 37.2 34.2 34.0 39.3
Interest cover (EBIT) (times) 1.9 2.6 1.5 1.4 3.8
Interest cover (cash) (times) 2.3 2.9 3.5 3.4 3.1
Return on assets (%) 5.1 6.0 7.3 8.8 9.0
Return on equity (%) 4.9 6.1 7.9 11.8 9.9
Summary of capital expenditure
2012-13 ($’000)
2011-12 ($’000)
2010-11 ($’000)
2009-10 ($’000)
2008-09 ($’000)
City West Water funded capital expenditure
182,217 144,884 122,432 154,180 82,032

Annual Report 2012-13
Report of Operations (continued)
Matters subsequent to the end of the financial yearNo matter or circumstance has arisen since 30 June 2013 which has significantly affected, or may significantly affect:
• the corporation’s operations
• the results of those operations
• the corporation’s state of affairs in the financial year subsequent to 30 June 2013.
ConsultanciesDuring 2013-13, City West Water engaged 16 consultants where the total fees payable to the consultant was less than $10,000 (GST exclusive). The total expenditure incurred during 2012-13 in relation to these consultancies was $100,000 (GST exclusive).
In addition, City West Water engaged 10 consultants (see table below) at more than $10,000 (GST exclusive) to undertake the following projects:
The above consultancies include arrangements where an individual or organisation is engaged to provide expert analysis to facilitate decision making and perform a specific one-off task that involves skills or perspective which would not be normally expected to reside within City West Water. Consultancies for capital projects are not included.
City West Water engages a number of individuals and organisations to provide works or services on behalf of the corporation. These contract services are not considered to be consultants, and are not included in the above numbers.
Consultant Purpose Total approved project fee (GST excl.)
$'000
Expenditure 2012-13
(GST excl.)
$'000
Future expenditure (GST excl.)
$'000
Accessibility Oz Pty Ltd
Accessibility audit and disability action plan
49 39 10
Aecom Australia Pty Ltd
Integrated water management strategy 241 13 0
Deloitte Finance Pty Ltd
Various accounting, regulatory and governance advice
70 70 0
Five Consulting (Vic) Pty Ltd
Altona industrial project stage II 17 17 0
GHD Pty Ltd Feasibility studies and review of various stormwater projects
584 70 85
KPMG Governance review 15 15 0
MWH Australia Pty Ltd
Aquifer storage and recovery feasibility review
70 52 17
Sinclair Knight Merz Pty Ltd
West Werribee aquifer storage and recovery feasibility review, UGB (West) alternative water servicing plans, brine disposal pipelines at WTP and process review.
646 477 38
Kreab & Gavin Anderson (Australia) Ltd
Research for Water Plan, water supply demand strategy research, liveability focus groups
233 233 0
Strahan Research Pty Ltd
Customer satisfaction research 33 33 0
Total 1,958 1,019 150
12

13
Other informationFreedom of Information
City West Water is subject to the Freedom of Information Act 1982.
In 2012-13, City West Water received 12 requests for access to documents under the Freedom of Information Act 1982.
Requests for access to City West Water documents under the Freedom of Information Act 1982 may be made in writing to:
Freedom of Information Officer City West Water Locked Bag 350 Sunshine VIC 3020
Each application for information attracts a $25.10 fee ($25.70 from 1 July 2013). Applications must identify clearly the documents required.
General enquiries relating to Freedom of Information may be made by contacting the Freedom of Information Officer on (03) 9313 8320. City West Water staff authorised to make decisions on requests for access to documents are:
Sean Crees (Principal Officer) General Manager, Corporate Services
Andrew Jessop (Authorised Officer) Manager, Corporate Administration
Building Act 1993
The main purpose of the Building Act 1993 is to regulate building work and building standards. City West Water maintains its buildings in accordance with the building and maintenance provisions of the Act.
Protected Disclosure Act 2012
The Protected Disclosure Act 2012 came into effect on 10 February 2013. The purposes of the Act are:
a) to encourage and facilitate disclosures of: (i) improper conduct by public officers, public bodies and other persons (ii) detrimental action taken in reprisal for a person making disclosure under the Act b) to provide protection for: (i) persons who make those disclosures (ii) persons who may suffer detrimental action in reprisal for those disclosures; and c) to provide for the confidentiality of the content of those disclosures and the identity of persons who make those disclosures.
A member of the public or an employee of City West Water can make a disclosure under the Act if he or she believes that one or more employees of City West Water has engaged in improper conduct.
Disclosures of improper conduct by City West Water or its employees may be made by completing the form at the website address below:
ibac.vic.gov.au/report-corruption-or-misconduct/online-form
or by writing to:
Independent Broad-based Anti-corruption Commission (IBAC) PO Box 24234 Melbourne 3001 Telephone: 1300 735 135 Facsimile: (03) 8635 6444
There were no disclosures to IBAC of improper conduct either by City West Water or any of its employees during the reporting period.
Request No.
Access in full 4
Access in part 2
Access denied 0
Other - no documents 1
Not finalised 5
Total 12

Annual Report 2012-13
Report of Operations (continued)
National Competition PolicyCompetitive neutrality requires Government businesses to ensure where services compete, or potentially compete with the private sector, any advantage arising solely from their Government ownership be removed if it is not in the public interest. Government businesses are required to cost and price these services as if they were privately owned and thus be fully cost reflective. Competitive neutrality policy provides Government businesses with a tool to enhance decisions on resource allocation.
City West Water has an independent Board of Directors with independent and objective performance monitoring. The corporation receives equivalent tax treatment, borrowing requirements and regulations as a private business. City West Water operates in an environment where the Essential Services Commission (ESC) determines cost based pricing. City West Water submitted a draft Water Plan to the ESC to enable them to make a price determination for the third regulatory period (2013-14 to 2017-18). The ESC made a final determination on prices in June 2013. These new prices took effect from 1 July 2013.
With regard to the above, City West Water’s processes are consistent with the objectives of National Competition Policy agreements and the requirements of the ‘Competitive Neutrality Policy Victoria’ policy statement.
City West Water’s purchasing policy and procedures are aligned to Victorian Government Purchasing Board policies, and the corporation regularly reports on its compliance with the legal obligations of the Competition and Consumer Act 2010.
Environmental performanceCity West Water’s vision is to be a truly sustainable water business. Sustainability involves balancing social, environmental and economic objectives. City West Water has in place an Environmental Policy which outlines how the corporation seeks to meet the following environmental objectives:
• balancing the needs of customers and the environment in managing the supply and demand of water
• maximising sustainable reuse of water
• protecting the environment and minimising the impact of the corporation’s services on the environment
• moving towards zero waste
• enabling customers to become efficient water users and clean and efficient producers
• being a community leader and advocate in water cycle management
• partnering for sustainable outcomes and a healthier urban habitat.
The following table outlines City West Water’s environmental business targets and its performance against those targets.
Environmental targetsESC regulated standards 2013 Actual 2013 Target Variance 2012 Actual
Sewer blockages per 100km of sewer main (No.) 15.1 25.9 41.7 14.9
Interruptions to sewerage services restored within five hours (%)
98.9 96.7 2.3 97.6
Unaccounted for water (%) 9.3 9.5 2.1 9.3
Average time to attend sewer spills and blockages (minutes)
24.2 24.4 0.8 25.0
Sewer spills per 1,000 properties (No.) 0.48 1.60 70.0 0.55
Other targets
Response to sewer spills within 1 hour (%) 100.0 100.0 0 99.5
Spills due to pump station equipment failure (No.) 0 0 0 0
Non-food waste customers non-compliant with trade waste agreements (%)
1.10 ≤ 2.0 45.0 1.11
Compliance with EPA licence for discharge from Altona Treatment Plant (%)
100.0 100.0 0 100.0
ISO 14001: 2004 (Environmental Management) Retained Retain - Retained
HACCP (Water Quality) Retained Retain - Retained
14

15
Victorian Industry Participation PolicyThe Victorian Industry Participation Policy Act 2003 requires public bodies and departments to report on the implementation of the Victorian Industry Participation Policy (VIPP).
Contracts commenced to which the VIPP applied
During 2012-13, City West Water commenced four contracts totalling $23,725,034 to which the VIPP applied, as follows:
• these contracts all occurred within metropolitan Melbourne
• the commitments by contractors under the VIPP included:a) an overall level of local content of 58 per cent of
the total value of the contractsb) 63 full time equivalent jobsc) 6 apprenticeships and traineeshipsd) the following benefits to the Victorian economy
in terms of skills and technology transfer increases:i) the engagement and training of new
apprentices and trainees;i) staff training and skills development;i) research and development work relating to
smart networks in Australia; andi) technology transfer around software and
local development of integration with water utility systems.
Contracts completed to which the VIPP applied
During 2012-13 City West Water completed three contracts totalling $33,230,017 to which the VIPP applied, as follows:
• these contracts all occurred within metropolitan Melbourne
• the outcomes reported by contractors under VIPP included:
b) an overall level of local content of 99 per cent of the total value of the contracts
c) 58 full time equivalent jobsd) 8 apprenticeships and traineeshipse) the following benefits to the Victorian economy
in terms of skills and technology transfer increases:i) transfer of pipe laying skillsi) transfer of knowledge from experienced civil
construction personnel to new personneli) retention by and transfer of knowledge
and experience to employees and sub contractors with respect to the design, fabrication, construction and installation methods and requirements associated with distribution mains.
Privacy of informationCity West Water complies with the information privacy principles set out under the Victorian Information Privacy Act 2000. City West Water’s Privacy Policy and Customer Charter refer to the corporation’s commitment to protect the privacy of customers. City West Water ensures the information it holds is protected and actively prevents any unauthorised access to, or improper use of customer information.
A copy of City West Water’s Privacy Policy can be viewed at citywestwater.com.au.
Financial Management Act 1994Other information as required under the Financial Management Act 1994, but not specifically referred to, has been retained by the Accountable Officer and is available to the Minister, Members of Parliament and the public on request.
Other informationThe following information is available from City West Water subject to the Freedom of Information Act 1982:
• a statement that declarations of pecuniary interests have been duly completed by all relevant officers
• details of shares held by a Senior Officer as nominee or held beneficially in a statutory authority or subsidiary
• details of publications produced by the corporation about itself, and how these can be obtained
• details of changes in prices, fees, charges, rates and levies charged by City West Water
• details of any major external reviews carried out on City West Water
• details of major research and development activities undertaken by City West Water
• details of overseas visits undertaken including a summary of the objectives and outcomes of each visit
• details of major promotional, public relations and marketing activities undertaken by City West Water
• details of assessments and measures undertaken to improve the occupational health and safety of employees
• a general statement on industrial relations within the corporation and details of time lost through industrial accidents and disputes
• a list of major committees sponsored by City West Water, the purpose of each committee and the extent to which that purpose has been achieved
• details of all consultancies and contractors including:a) consultants and contractors engagedb) services providedc) expenditure committed for each engagement.

Annual Report 2012-13
Report of Operations (continued)
Water consumption and drought response reporting
Water consumptionWater consumption in CIty West Water’s service area is detailed in the following table:
District
Residential Customers Non-residential customers Non revenue water (ML)
Total consumption
(ML)
Average annual
consumption (ML) 1
Number Volume consumed
(ML)
Number Volume consumed
(ML)
City West Water
352,341 53,023 37,210 40,602 9,606 103,231 95,209
1 Average annual consumption calculated between 2008-09 and 2010-11
Drought response reportingMetropolitan water retailers are required to prepare a Drought Response Plan with four levels of water restrictions that control the use of drinking water outdoors. During the 2012-13 year, metropolitan Melbourne was subject to Stage 1 water restrictions from 1 July 2012 until 30 November 2012. From 1 December 2012, Stage 1 water restrictions were lifted and permanent water saving rules were put in place. Permanent water saving rules remain in place as at 30 June 2013.
A requirement of Melbourne Water Corporation’s Drought Response Plan is the joint development and publication of an annual Water Outlook.
The Water Outlook is a report that is prepared and published by 1 December each year by the metropolitan water utilities City West Water, Melbourne Water, South East Water and Yarra Valley Water. The Water Outlook is an adaptive management tool which is used by the metropolitan water utilities to:
• monitor the dynamic balance of supply and demand each year
• guide the implementation of actions identified previously by long term strategic planning exercises to influence the observed and potential future balance of supply and demand
• regularly provide information regarding the balance of supply and demand, and any actions being undertaken by the water utilities.
On 1 December 2012 the Water Outlook outlined a number of individual and joint industry short and medium term actions to improve future drought response. Below is a summary of the agreed joint short term actions.
• work with the Office of Living Victoria in the development of the first metropolitan integrated water cycle strategy - Melbourne’s Water Future
• work with the Office of Living Victoria, the Growth Areas Authority and Councils to develop integrated water plans at a regional and local level
• develop and maintain programs that target the four highest residential water use activities. This will include:
a) showerhead exchange program, including a trial of the performance of ultra-low flow showerheads
b) toilet retrofit program replacing single flush toilets with 4.5/3 litre dual flush units
c) information and advice on how to choose efficient washing machines
d) water efficient gardeninge) continued promotion of the Living Victoria Water
Rebate Program for households.
• delivery of these programs will occur through a range of channels including schools, websites, events, bill inserts and smart bills
• continue to work with industry to deliver the voluntary Water Management Action Plan program that encourages businesses using greater than 5ML per year to invest in water efficiency
• investigate and develop programs that seek savings from key non-residential water uses including cooling towers, evaporative coolers and council irrigation systems
• complete the National Benchmarking Study for various non-residential sectors including the development of a national website for industry comparison
• promote the Living Victoria Water Rebate program for small businesses, and assist businesses with water efficiency grants and water advice
• undertake active leak detection, reticulation mains renewals, pressure management, intelligent network technologies and rapid response to bursts and leaks.
16

17
Corporate water consumption1
2012-13 2011-12
Water consumed: 2,045kL Water consumed: 1,724kL
3.89kL per full time equivalent employee 4.74kL per full time equivalent employee
398.31 litres per m2 of office space 272.81 litres per m2 of office space
1Includes all water used at head office and canteen. Does not include water used by third party contractors.
Environmental sustainabilitySustainable water use
Integrated and sustainable use of water resources is encouraged by a number of water efficiency programs that City West Water offers its customers, including:
• the Showerhead Exchange Program
• the Toilet Retrofit Program
• the Healthy and Sustainable Gardens Program
• the Business Resource Efficiency Program
• the Steam System Efficiency Program.
City West Water advises businesses and community organisations on a number of grants and incentives available from federal, state and local governments, peak industry bodies and corporate foundations for resource efficiency projects.
During 2011-12, VicWater undertook a review which resulted in the enacting of a uniform by-law across Victoria. This by-law ensures that all Victorian water corporations have the same stages of water restrictions, and the same prohibitions within each stage of water restrictions.
The City West Water Community Liaison Committee meets on a quarterly basis. The group comprises community members representing a broad cross section of the corporation’s customer base including residential customers, industrial customers, peak industry body representatives, Council representatives and academics. The group acts as a sounding board for community views and provides endorsement of City West Water’s environmental sustainability planning.
Alternative water supply
City West Water is developing and implementing integrated water cycle solutions to deliver the vision of a smart and resilient water system for our customers. Throughout 2012-13 the corporation has expanded its alternative water supply system by:
• construction of the West Werribee Dual Water Supply Project, which will provide fit-for-purpose water for irrigation and toilet flushing to residential customers throughout the West Werribee growth area. Construction of the salt reduction plant and the transfer infrastructure is scheduled for completion in 2014, with the supply of recycled water to households to begin thereafter. There are currently 3,010 properties connected to the third pipe system awaiting supply. The expansion of the Urban Growth Area has allowed additional properties to be included in the West Werribee Dual Supply Project, which is now planned to ultimately supply more than 32,000 properties with recycled water
• undertaking a drilling program to investigate the viability of aquifer storage and recovery (ASR). ASR is a potentially economical means of storing large volumes of water in underground aquifers. The investigations to date indicate there is potential for viable ASR schemes in the West Werribee area. City West Water will undertake further testing to confirm the injection, extraction and storage capacities at the potential sites
• partnering with local government to deliver stormwater harvesting projects. The current projects with Hobsons Bay and Brimbank City Councils will be commissioned in early 2013-14 and will supply fit-for-purpose stormwater for public open space irrigation. Further opportunities in other municipalities are also currently being explored.

Annual Report 2012-13
Report of Operations (continued)
Recycled water supply
In 2012-13, City West Water supplied 1093ML of fit-for-purpose recycled water for industrial, commercial and irrigation use. This was supplied through the Altona Recycled Water Project, Werribee Recycling Scheme and Sunshine Golf Course projects. The volume supplied was below forecast due to operational problems preventing the Altona Recycled Water Project operating at full capacity, and wet conditions causing a decrease in irrigation demand.
In 2013-14 the volume of recycled water supplied will increase significantly due to the completion of the West Werribee Dual Water Supply Project and the subsequent supply of recycled water to over 3000 existing households.
City West Water’s Integrated Water Cycle Management Strategy
City West Water is developing an Integrated Water Cycle Management Strategy to manage the longer term challenges of population growth and a variable climate. The strategy, developed in consultation with the corporation’s stakeholders and the Office of Living Victoria, provides a clear direction for the planning of future water cycle management infrastructure for City West Water’s service area now and into the future. The strategy will be completed early in 2013-14. The strategy will replace City West Water’s current Water Supply Demand Strategy.
Sustainability Highlights
During 2012-13, City West Water
• engaged with the corporation’s Community Liaison Committee and internal stakeholders to develop Environmental Sustainability Plan 4. Information regarding City West Water’s environmental direction and activities from 2013-2018 is available on the City West Water website at citywestwater.com.au
• developed an energy strategy for the corporation that prioritises energy management actions which result in improved cost and environmental outcomes
• re-certified the corporation’s ISO 140001 Environmental Management System
• launched a project with RMIT University and the Smart Water Fund to investigate organic toxicant removal from recycled water brine using advanced oxidation processes
• worked with the Australian water industry to develop the AdaptWater tool to assess climate change impacts
• collaborated with Melbourne Water and the Centre for Aquatic Pollution Investigation and Management to investigate optimal approaches to manage pollution impacts in the Maribyrnong River
• elected new members to the corporation’s Community Liaison Committee and re-appointed a number of former members
• had EPA accredited auditors assess the corporation’s sewage system to ensure that it was protecting ground and surface water environments in City West Water’s service area
• provided input into the State Government’s Cleaner Yarra River and Port Phillip Bay Action Plan
• exchanged a total of 5206 showerheads for the year against a target of 5000
• received over 12,310 unique visitors and 50,841 page views since the launch of the Healthy Urban Habitat website in December 2011
• launched City West Water’s Healthy Urban Habitat Sustainable Gardening competition, which saw more than 260 customers sharing their stories and entries
• held nine sustainable gardening workshops across eight municipalities.
18

19
Other statutory obligationsVictorian Biodiversity Strategy
The Victorian Biodiversity Strategy was released in 1997. Amongst its aims are to:
• increase awareness of biodiversity conservation
• reduce habitat loss
• highlight processes which pose a major threat to biodiversity
• identify habitats and environments that require urgent management.
City West Water’s service area is within the Victorian volcanic plain bio-region. This bio-region has one of the highest removal rates of native vegetation in Victoria. Ecological vegetation classes native to the Victorian volcanic plain bio-region and protected under legislation include:
• natural temperate grasslands
• grassy eucalypt woodlands
• coastal and inland wetlands.
To protect vegetation in relation to City West Water’s operations, the corporation has in place an ISO 14001 accredited Environmental Management System, including Environmental Assessments and contractor Environmental Management Plans. These measures seek to ensure native vegetation encountered when building new assets is managed using an ‘avoid, minimise and offset’ approach (applying for permits and offsets as required) as outlined in the Department of Environment and Primary Industries (DEPI) Native Vegetation Management: Framework for Action 2002.
To improve biodiversity management and provide a standardised industry response, City West Water has been working with the other metropolitan retail water authorities to develop an industry code of practice for native vegetation associated with the construction and maintenance of utility assets. Together with the other metropolitan retail water authorities, City West Water has submitted a draft code of practice which is under review by DEPI. This operational document provides guidance for managing native vegetation when its removal does not trigger the need for a permit, in accordance with clause 52.17 of the Victorian Planning Provisions.
Where significant native vegetation removal cannot be avoided, City West Water has arranged for this to be offset elsewhere. Native vegetation offsets have been purchased during 2012-13 from Melton Shire Council and Melbourne Strategic Assessment to offset removal of plains grassland, (the predominant vegetation class in City West Water’s service area). City West Water has also received approval for an Offset Management Plan to develop conservation offsets on land surrounding the corporation’s Ballan Road tank site. Management actions during 2012-13 have included the eradication of weeds and rabbits, the erection of rabbit proof fencing and ecological monitoring. A review of the offsetting
purchasing strategy has determined the Ballan Road tank site has been City West Water’s most cost effective approach to date for offsetting native vegetation loss.
Victorian River Health Strategy
The Victorian River Health Strategy outlines the Government’s long term direction for the management of Victoria’s rivers. It provides a clear vision for the management of rivers in Victoria, comprehensive policy direction on issues affecting river health, and a blueprint for integrating efforts on rivers and ensuring the most effective river health benefits for the effort and resources invested.
Sewerage system actions by City West Water contribute to the objective for the Victorian River Health Strategy to achieve healthy rivers, streams and floodplains which meet the environmental, economic, recreational and cultural needs of current and future generations. This year the efficacy of City West Water’s system in managing risks to ground and surface water environments was assessed by Environment Protection Authority appointed auditors. The auditors found:
City West Water has demonstrated a very high level of identification and management of risks to the surface water and groundwater environments. A number of examples of City West Water achieving an industry best practice level of performance were identified during the audit including a number of supportive studies.
These supportive studies contribute towards City West Water’s commitments outlined in a joint water authority submission to the Cleaner Yarra River and Port Phillip Bay Action Plan. Initiatives City West Water has committed to include:
• investigation of the suitability of risk based approaches to targeting investment in system capacity to improve waterway health. To this end City West Water is collaborating with Melbourne Water and the Centre for Aquatic Pollution Investigation and Management to investigate factors affecting river health in the Brimbank catchment of the Maribyrnong River
• piloting a project in the Stony Creek sewerage catchment to integrate water quality monitoring, network operational performance issues, system hydraulic compliance issues, and asset risk management requirements. The project will use catchment level investigation to enhance business as usual sewage system level investigations. Outcomes will be used to develop a raft of asset preventative maintenance, asset renewal and system hydraulic improvement works within the sewer catchment to prioritise measures that will provide the greatest cost benefit outcomes for waterways and the environment.
The Victorian River Health Strategy will be replaced by the Victorian Waterway Management Strategy, which is currently subject to public consultation.

Annual Report 2012-13
Report of Operations (continued)
Other environmental activities
To meet City West Water’s environmental goals and the economic goal of prudent and efficient service delivery the corporation has a number of other environmental priority areas. Activities completed in 2012-13 are listed below. Further activities and management approaches are outlined in the Environment section of the City West Water website at citywestwater.com.au.
City West Water has participated in the development of a climate change adaptation tool for the Australian water industry. The tool provides information on adaptation cost effectiveness projections and flexible adaptation pathways. The Williamstown sewer catchment has been used as a case study to test the tool. City West Water will continue to investigate how this information can be used to help inform adaptation management summaries.
City West Water has been embedding the corporation’s environmental goal of ‘Towards Zero Waste’ in its staff through an aggressive target that aims to recycle 60 per cent of the corporation’s office waste. City West Water achieved this target in 2012-13. One hundred per cent of biosolids resulting from City West Water’s sewage treatment operations are reused in a third party composting operation. In addition, the corporation continues to pursue opportunities to reduce, reuse and recycle its construction wastes. Accomplishments this year include working with the corporation’s contractors, Programmed Facility Management, pipe manufacturers and recycling companies to recycle shrink wrap packaging, plastic fencing and decommissioned and left over sections of polyethylene pipe from the corporation’s network operations.
To understand the environmental impact of City West Water’s supply chain, the corporation has conducted a triple bottom line analysis of its supply chain, using the Water Services Association of Australia’s eco-footprint tool. The embedded carbon in the corporation’s supply chain (also referred to as Scope 3 emissions) is included in City West Water’s response to the Essential Services Commission’s Water Plan determination.
Greenhouse gas emissions
Greenhouse gas management at City West Water is dictated by the corporation’s Energy Strategy. The strategy follows the Environmental Protection Authority carbon management hierarchy which prioritises actions in the following areas: measure, set objectives, avoid, reduce, switch, sequester, assess and offset greenhouse gas emissions. The strategy aligns City West Water’s energy approach with carbon prices by replacing the corporation’s previous ‘net zero emissions’ target with the following targets:
• source renewable energy for high energy alternative water supplies (that are in line with State Government renewable energy commitments for desalination plants)
• review and implement cost effective carbon mitigation options (assessed using the water industry’s Cost of Carbon Abatement tool).
Greenhouse gas emissions by City West Water and its maintenance contractor Programmed Facility Management (PFM) and the purchase of carbon offsets in tonnes of CO2 equivalent are as follows:
2012-13 2011-12 2010-11 2009-10 2008-09
Water treatment and pumping 312.00 286.04 272.15 274.57 191.22
Wastewater treatment 9,693.00 10,612.69 8,777.15 7,839.82 7,147.23
Waste disposal 617.00 40.52 37.76 29.50 52.77
Energy use (non fleet) 2,115.00 2,051.46 1,830.04 2,069.43 2,361.10
Vehicle fleet 1,374.00 1,299.69 1,459.00 1,514.91 1.626.46
Other1 213.00 165.77 175.38 192.26 137.48
Offsets purchased2 -2,360.00 -14,608.50 -12,600.00 -12,403.45 -14,236.38
Net greenhouse gas emissions 11,964.00 -152.33 -47.92 -482.96 -2,720.121 Other emissions includes emissions from staff air travel, refrigerants, staff taxi journeys, office paper consumption and showerhead scrap recycling.2 Offset purchases have changed over time based on the availability and outcomes of Government accreditation schemes. Offset products utilised by City West Water from 2008 to 2013 comprised a combination of showerhead exchange (carbon abatement program), verified carbon offsets and Renewable Energy Certificate products. In addition to offsets, City West Water has purchased 10 per cent of its electricity using green power, which is accounted for in emissions figures.
20

21
Rebates paid to not for profit organisations under the water and sewerage rebate scheme
The State Revenue Office (SRO) defines certain organisations as not for profit. Such organisations serve the community in the fields of education, hospitals or nursing care, religious worship, charity, outdoor sporting, or recreation activities or war veterans’ organisations. These organisations are entitled to pay a concession amount on the service charge portion of their bills. City West Water invoices the SRO for the value of these concessions.
Provision of concessions to customers
Customers who hold a pension concession card, Department of Veterans’ Affairs Gold Card, or a Health Care Card are entitled to a 50 per cent concession on water and sewerage charges up to an annual maximum. The 2012-13 maximum was $277.00. If a customer is receiving only one service they are entitled to a concession of up to half the annual maximum. City West Water invoices the Department of Health for the value of these concessions.
Water concessions to those on life support machines (haemodialysis)
Residential customers who are required to receive in home haemodialysis are entitled to a rebate on water usage and sewage disposal charges. The Department of Health determines the rebate amount based on the average annual water usage of an in home haemodialysis machine of 168kL. This rebate is in addition to any other pension or concession a customer may be entitled to. City West Water invoices the Department of Health for the value of these concessions.
Utility Relief Grant Scheme
The Utility Relief Grant Scheme provides assistance for residential customers who are unable to pay their utility bills due to a temporary financial crisis. Assistance is provided to low income households suffering a short-term (within the last the 12 months) financial crisis who are unable to pay for a current account and who are at risk of restriction of supply. Relief is only available to a holder of a pension concession card, a health care card or a Department of Veterans’ Affairs gold card which is not marked ‘dependent’. Customers must meet certain criteria to demonstrate that unexpected hardship has left them seriously short of money. City West Water invoices the Department of Human Services for the value of these concessions.
Social SustainabilityCommunity Service Obligations
City West Water provided the following community service obligations during 2012-13.
2012-13 ($’000)
2011-12 ($’000)
Rebates paid to not for profit organisations under the water and sewerage rebate scheme 501 454
Provision of concessions to customers 19,753 19,106
Water concessions to those on life support machines (haemodialysis) 16 14
Utility relief grant scheme 198 175

Annual Report 2012-13
Performance Report
Note 2013
Actual
2013
Target
Variance
(%)
2012
Actual
Financial performance indicatorsF1
Internal financing ratio
(Net operating cash flow - dividends) / capital expenditure (%)
1
13.9
0.4
3,375
1.0
F2
Gearing ratio
Total debt (including finance leases) / total assets (%)
47.5
43.4
9.4
37.2
F3
Interest cover (EBIT)
Earnings before net interest and tax expense / net interest expense (times)
2
1.9
1.4
35.7
2.6
F4
Interest cover (cash)
Cash flow from operations before net interest and tax payments / net interest payments (times)
2
2.3
1.7
35.3
2.9
F5
Return on assets
Earnings before net interest and tax expense / average total assets (%)
3
5.1
4.3
18.6
6.0
F6
Return on equity
Net profit after tax / average total equity (%)
3
4.9
2.2
122.7
6.1
Service and environmental performance indicators (whole of business) S1
S1.1
Water supply interruptions
Number of customers receiving five unplanned water supply interruptions in a year (No.)
0 195 100.0 0
S2
S2.1
Interruption time indicators
Average duration of unplanned water supply interruptions (minutes)
120.4 138.5 13.1 34.5
S3
S3.1
Restoration of water supply
Unplanned water supply interruptions restored within five hours (%)
97.9 93.9 4.3 97.2
S4
S4.1
Reliability of sewerage collection services
Sewer spills from reticulation and branch sewers (Priority 1 and 2) (No.)
4 163 144 (13.2) 129
S5
S5.1
Containment of sewer spillages
Sewer spills contained within five hours (%)
100.0 100.0 0 100.0
S6
S6.1
S6.2
S6.3
S6.4
Customer complaints indicators
Water quality complaints (per 1000 customers)
Sewerage service, quality and reliability complaints (per 1000 customers)
Billing complaints (per 1000 customers)
Sewage odour complaints (per 1000 customers)
0.800
0.05
1.18
0.24
1.100
0.15
n/a
0.40
27.3
66.7
n/a
40.0
0.726
0.08
1.50
0.33
22

23
Note 2013
Actual
2013
Target
Variance
(%)
2012
Actual
Service and environmental performance indicators (Altona Treatment Plant) E1
E1.1
E1.2
Reuse indicators
Effluent reuse (volume) (%)
Biosolids reuse (dry mass) (%)
100.0
100.0
100.0
100.0
0
0
100.0
100.0
E2
E2.1
Sewage treatment standards
Number of analyses complying with licence agreements as a percentage of samples (%)
100.0
100.0
0
100.0
1) The internal financing ratio was impacted by lower than expected capital expenditure during the 2012-13 financial year.
2) Net interest expense was lower than expected due to lower than expected interest rates and lower than expected borrowings which was due in turn to lower than expected capital expenditure.
3) Higher than budgeted profit results as well as the impact of a downward asset revaluation have contributed to the above budget results.
4) The increase in reported spills was primarily due to better reporting and data capture of spills. In addition, there was an increase in isolated storm events during the year. These storm events impacted on some catchments that normally would not be affected by these types of events. City West Water’s CCTV and sewer cleaning focus has identified some of these areas for additional maintenance.

Annual Report 2012-13
Major non residential water users
Table 1: Customers by volume range
Volumetric Range – ML per year Number of customers
Equal to or greater than 200ML and less than 300ML 6
Equal to or greater than 300ML and less than 400ML 4
Equal to or greater than 400ML and less than 500ML 4
Equal to or greater than 500ML and less than 750ML 2
Equal to or greater than 750ML and less than 1000ML 1
Greater than 1000ML 3
Total number of customers 20
Table 2: Names of major customers and their participation in Water Management Action Plans
Name of customer waterMAP status Name of customer waterMAP status
Australian Vinyls Corporation Ltd Yes, waterMAP developed Nufarm Chemicals Yes, waterMAP developed
Baiada Poultry Pty Ltd Yes, waterMAP developed Onesteel Yes, waterMAP developed
Carlton & United Breweries, Abbotsford Brewery
Yes, waterMAP developed Peerless Holdings Pty Ltd Yes, waterMAP developed
Coogee Energy Yes, waterMAP developed Qenos Olefins Yes, waterMAP developed
CSF Proteins Yes, waterMAP developed Schweppes Australia Pty Ltd Yes, waterMAP developed
JBS Australia Pty Limited Yes, waterMAP developed Sugar Australia Yes, waterMAP developed
Leading Textiles Pty Ltd Yes, waterMAP developed Toyota Motor Corporation Australia
Yes, waterMAP developed
Melbourne Airport Yes, waterMAP developed University of Melbourne Yes, waterMAP developed
Melbourne Health (Royal Melbourne Hospital)
Yes, waterMAP developed Victoria Racing Club Yes, waterMAP developed
Mobil Refining Australia Yes, waterMAP developed Victoria Wool Processors Yes, waterMAP developed
24

25
Attestation on Compliance with the Australian/New Zealand Risk Management Standard
I, Alan Stockdale, certify that City West Water Corporation has risk management processes in place consistent with the Australian/New Zealand Risk Management Standard AS/NZS ISO 31000-2009 and an internal control system in place that enables the executive to understand, manage and satisfactorily control risk exposures. The Board of Directors, through the Risk Management and Audit Committee, verifies this assurance and that the risk profile of City West Water Corporation has been critically reviewed within the last 12 months.
This attestation is made in accordance with a resolution of the Board of Directors.
The Hon. Alan Stockdale
Chairman
Melbourne
28 August 2013

Annual Report 2012-13
Statement of Comprehensive Income
For the year ended 30 June 2013
Note 30 June 2013$’000
30 June 2012$’000
Revenue 3 473,049 485,845
Other income 3 4,828 3,514
Total income 477,877 489,359
Expenses 4 (376,737) (371,779)
Finance costs (52,422) (45,879)
Total expenses (429,159) (417,658)
Profit before income tax expense 48,718 71,701
Income tax expense 5(a) (11,580) (21,109)
Profit after income tax expense 37,138 50,592
Other comprehensive income/(expense)
Items that will not be reclassified to profit or loss
Gain/(loss) on revaluation of infrastructure 12 (255,800) (200)
Income tax relating to components of other comprehensive income/(expense)
5(c) 76,740 60
Other comprehensive income/(expense) after tax (179,060) (140)
TOTAL COMPREHENSIVE INCOME/(EXPENSE) (141,922) 50,452
The above Statement of Comprehensive Income should be read in conjunction with the accompanying notes.
26

27
Balance Sheet
As at 30 June 2013
Note 30 June 2013$’000
30 June 2012 $’000
ASSETSCurrent assetsCash and cash equivalents 8 40,009 3,207Receivables 9 74,462 72,175Prepayments 10 1,602 2,333Total current assets 116,073 77,715
Non current assetsInfrastructure, property, plant and equipment 12 1,679,735 1,806,334Intangible assets 13 158,053 131,939Receivables 11 24 24Total non current assets 1,837,812 1,938,297
TOTAL ASSETS 1,953,885 2,016,012
LIABILITIESCurrent liabilitiesPayables 15 88,270 75,734Borrowings 16 45,000 72,370Current tax liabilities 17 10,054 7,663Provisions 18 16,425 11,467Other 19 13,654 18,934Total current liabilities 173,403 186,168
Non current liabilitiesBorrowings 20 882,500 677,500Deferred tax liabilities (net) 6 223,070 308,363Defined benefit superannuation liability 29(c) 1,854 5,829Provisions 22 1,636 1,387Unearned income 23 1,787 408Total non current liabilities 1,110,847 993,487TOTAL LIABILITIES 1,284,250 1,179,655
NET ASSETS 669,635 836,357
EqUITyPaid up equity 24 (a) - 20,620Contributed equity 24 (b) 217,608 196,988Reserves 24 (c) 166,239 345,299Retained profits 24 (d) 285,788 273,450 TOTAL EqUITy 669,635 836,357The above Balance Sheet should be read in conjunction with the accompanying notes. Refer also to Note 27 - Contingent assets and liabilities, and Note 28 - Commitments for Expenditure.

Annual Report 2012-13
Statement of Changes in Equity
For the year ended 30 June 2013
Note Paid up Equity
Contributed Equity
Reserves Retained Profits
Total Equity
$'000 $'000 $'000 $'000 $'000
Balance at 1 July 2011 20,620 196,988 345,439 268,058 831,105
Comprehensive income for the year
Profit after income tax expense - - - 50,592 50,592
Other comprehensive income/(expense) after tax
- - (140) - (140)
Total comprehensive income for the year
- - (140) 50,592 50,452
Transactions with equity holders in their capacity as equity holders
Dividends paid 7 - - - (45,200) (45,200)
Total transactions with equity holders in their capacity as equity holders
- - - (45,200) (45,200)
Balance at 30 June 2012 20,620 196,988 345,299 273,450 836,357
Comprehensive income for the year
Profit after income tax expense - - - 37,138 37,138
Other comprehensive income/(expense) after tax
- - (179,060) - (179,060)
Total comprehensive income for the year
- - (179,060) 37,138 (141,922)
Transactions with the State in its capacity as owner
Reclassification upon transition to a statutory authority on 1 July 2012
(20,620) 20,620 - - -
Dividends paid 7 - - - (24,800) (24,800)
Total transactions with the State in its capacity as owner
(20,620) 20,620 - (24,800) (24,800)
Balance at 30 June 2013 - 217,608 166,239 285,788 669,635
The above Statement of Changes in Equity should be read in conjunction with the accompanying notes.
28

29
Cash Flow Statement
For the year ended 30 June 2013
Note 30 June 2013$’000
30 June 2012$’000
Cash flows from operating activities
Receipts from customers 458,246 452,057
Payments to suppliers and employees (363,334) (346,441)
Goods and Services Tax refund (net) 21,970 18,158
Interest received 44 202
Tax equivalent paid (17,741) (34,021)
Finance costs (51,599) (43,214)
Net cash provided by/(used in) operating activities
32 47,586 46,741
Cash flows from investing activities
Payments for infrastructure, property, plant, equipment and capital works in progress
(157,071) (126,900)
Payments for intangible assets (6,916) (20,000)
Proceeds from sale of infrastructure, property, plant and equipment
373 110
Net cash provided by/(used in) investing activities
(163,614) (146,790)
Cash flows from financing activities
Proceeds from borrowings 270,000 187,370
Repayment of borrowings (92,370) (45,000)
Dividends paid (24,800) (45,200)
Net cash provided by/(used in) financing activities
152,830 97,170
Net increase/(decrease) in cash and cash equivalents
36,802 (2,879)
Cash and cash equivalents at the beginning of the financial year
3,207 6,086
Cash and cash equivalents at the end of the financial year
8 40,009 3,207
The above Cash Flow Statement should be read in conjunction with the accompanying notes.

Annual Report 2012-13
Notes to and forming part of the Financial Statements
For the year ended 30 June 2013
1. Summary of significant accounting policies
As at 1 July 2012 the business held by City West Water Limited transferred to a statutory corporation known as City West Water Corporation under the Water Amendment (Governance and Other Reforms) Act 2012. The new Act has several transitional provisions which have transferred assets, liabilities, contracts (governed by Victorian law) and employees from City West Water Limited to City West Water Corporation. The entity’s governing legislation changed from the Water Industry Act 1994 to the Water Act 1989. City West Water Corporation has a water supply district and a sewerage district established under the Water Act 1989.
(a) Basis of preparation
General
This is a general purpose financial report that consists of a Statement of Comprehensive Income, Balance Sheet, Statement of Changes in Equity, Cash Flow Statement and notes accompanying these statements. This general purpose financial report has been prepared in accordance with Australian Accounting Standards, Interpretations and other authoritative pronouncements of the Australian Accounting Standards Board (AASB), the requirements of the Financial Management Act 1994, and applicable Ministerial Directions. City West Water is a for profit entity.
This Financial Report has been prepared on an accrual basis and a going concern basis. It is presented in Australian dollars, the functional and presentation currency of City West Water.
The principal address is:- City West Water Corporation 247-251 St Albans Road Sunshine 3020
Historical cost convention
This financial report has been prepared under the historical cost convention, as modified by the revaluation of infrastructure and land and buildings.
Critical accounting estimates
The preparation of financial reports in conformity with Australian Accounting Standards requires the use of certain critical accounting estimates. It also requires management to exercise its judgement in the process of applying City West Water’s accounting policies. Areas involving a high degree of estimates and assumptions which can materially impact the financial statements include:
• fair valuation of infrastructure assets. These assumptions are discussed in Note 1(o) and Note 12
• actuarial assumptions used to determine the assets and liabilities of City West Water’s defined benefits superannuation fund. These assumptions and the related carrying amounts are discussed in Note 29(c)
• estimate of useful lives of assets. These assumptions are discussed in Note 1(i)
• impairment of assets. These assumptions are discussed in Note 1(k)
• provisions. These assumptions are discussed in Note 1(s)
• income tax. These assumptions are discussed in Note 1(d).
Scope and presentation of financial statements
Statement of Comprehensive Income
All non owner changes in equity are presented in the Statement of Comprehensive Income. This presentation is consistent with the requirements of AASB 101 - Presentation of Financial Statements.
Balance Sheet
Assets and liabilities are presented on a current and non-current basis. Details of current and non-current assets and liabilities are disclosed in the notes, where relevant.
Statement of Changes in Equity
The Statement of Changes in Equity presents reconciliations of each non owner and owner equity opening balance at the beginning of the reporting period to the closing balance at the end of the reporting period. It shows separately changes due to amounts recognised in the comprehensive result, and amounts arising from transactions with the State in its capacity as owner.
Cash Flow Statement
Cash flows are classified according to whether they arise from operating activities, investing activities or financing activities. This classification is consistent with the requirements of AASB 107 - Statement of Cash Flows.
New and revised accounting Standards and Interpretations
City West Water has adopted all of the new and revised standards and interpretations issued by the AASB that are relevant to its operations and effective for the current financial year. The adoption of these new and revised standards and interpretations has not resulted in changes to City West Water’s accounting policies or the amounts reported for the current or prior years. The corporation has not early adopted any new or revised standards or interpretations. City West Water will adopt all new and revised accounting standards from the start of the reporting period after the effective date.
30

31
Changes in accounting policy
There have been no changes in accounting policy except any mandatory changes to comply with Australian Accounting Standards.
Standards issued that are applicable to City West Water, but not effective at 30 June 2013.
Standard Effective Date Key Changes Impact
AASB 9 'Financial Instruments' - revised standard, AASB 2009-11 'Amendments to Australian Accounting Standards arising from AASB 9' and AASB 2010-7 'Amendments to Australian Accounting Standards arising from AASB 9'
1 January 2015 Changes to AASB 9 affect the classification and measurement of financial assets.
While the impact of changes to AASB 9 is still being evaluated, it is anticipated that some changes to the current disclosure of financial instruments will be required.
AASB 13 'Fair Value Measurement' and AASB 2011-8 'Amendments to Australian Accounting Standards arising from AASB 13'
1 January 2013 AASB 13 explains how to measure fair value and aims to enhance fair value disclosures
Some minor changes to the disclosure around financial instruments may be required.
AASB 119 'Employee Benefits' - revised and AASB 2011-10 'Amendments to Australian Accounting Standards arising from AASB 119'
1 January 2013 The revised standard incorporates new disclosure and reporting requirements for employee benefits
Actuarial gains or losses on defined benefit superannuation will need to be recognised in Other Comprehensive Income, rather than directly in the Income Statement.
AASB 2011-4 'Amendments to Australian Accounting Standards to Remove Individual Key Management Personnel Disclosure Requirements'
1 July 2013 Removes the individual key management personnel disclosure requirements from AASB 124 Related Party Disclosures
It is anticipated that this will simplify related party disclosure information currently reported.
For the year ended 30 June 2013

Annual Report 2012-13
Notes to and forming part of the Financial Statements (continued)
For the year ended 30 June 2013
1. Summary of significant accounting policies (continued)
REVENUE
(b) Revenue recognition
Revenue is measured as the fair value of consideration received or receivable. City West Water recognises revenue when the amount of revenue can be reliably measured, it is probable that future economic benefits will flow to City West Water, and specific criteria have been met for each of the corporation’s activities as described below.
Each form of revenue is recognised as follows:
• water and sewerage service charges which are billed quarterly in advance, are recognised evenly throughout the financial year to reflect the pattern of revenue being earned
• water and sewerage usage charges are recognised as income when the service has been provided
• area contributions represent charges levied on developers to recover the costs of augmenting or constructing infrastructure assets to meet the future demands of urban growth. Developers are required to make a fair and reasonable contribution towards the cost of developing City West Water’s water supply distribution systems and sewage disposal systems. In accordance with the requirements of AASB Interpretation 18 - Transfers of Assets from Customers and AASB 118 - Revenue, recognition of income occurs upon receipt
• gifted assets arise where developers pay for the cost of construction of new assets, and subsequently ‘gift’ these assets to City West Water, which maintains them in perpetuity. In accordance with the requirements of AASB Interpretation 18 - Transfers of Assets from Customers and AASB 118 - Revenue, recognition of income occurs when the risks and rewards of ownership have been transferred to City West Water. This non cash revenue is recorded as ‘gifted assets’. Where actual cost is not available, City West Water recognises income by assessing the value of the works using a schedule of rates determined by the corporation. This table is based on historical cost tender information
• income receivable on investing activities is recognised as revenue when earned and is accrued in accordance with the terms and conditions of the underlying financial instruments
• government grants relating to costs are deferred and recognised in the Statement of Comprehensive Income over the period necessary to match them with the costs that they are intended to compensate. Grants are recognised at their fair value where there is reasonable assurance that the grant will be received and City West Water has complied with any attached conditions.
EXPENDITURE
(c) Borrowing and finance costs
Borrowings are carried at their fair values (principal amounts). Interest expense payable in arrears is accrued as incurred and is charged to the Statement of Comprehensive Income. Borrowings are treated as current liabilities if they mature within 12 months, except where City West Water has an agreement in place at balance date to refinance the maturing debt beyond the 12 month period.
(d) Income tax
City West Water is subject to the National Tax Equivalent Regime (NTER) pursuant to section 88(1) of the State Owned Enterprises Act 1992. Under this regime City West Water is required to pay to the Victorian State Government an amount equal to the tax liability applicable if City West Water was a private company. The tax equivalent rules are based on the Income Tax Assessment Act 1936 (as amended).
Income tax expense or revenue for the period is the tax payable or receivable on the current period’s taxable income, based on the applicable tax rate adjusted by changes in deferred tax assets and deferred tax liabilities attributable to temporary differences.
Deferred income tax is provided for in full, using the liability method, on temporary differences arising between the tax bases of assets and liabilities and their carrying amounts in the financial statements. Deferred income tax is not accounted for if it arises from the initial recognition of an asset or liability that affects neither accounting nor taxable profit nor loss.
Deferred income tax is determined using tax rates and laws that have been enacted or substantively enacted by balance date and are expected to apply when the related deferred income tax asset is realised or the deferred income tax liability is settled.
Deferred tax assets are recognised for deductible temporary differences and unused tax losses only if it is probable that future taxable amounts will be available to utilise those temporary differences and losses.
(e) Bulk charges
Bulk charges are levied by Melbourne Water Corporation for the cost of water City West Water purchases, and for sewage treated at Melbourne Water’s Western Treatment Plant. Variable charges are levied in arrears and are payable on a weekly basis. Fixed charges are levied once a month, and are payable on the 15th of the month to which they refer. Any variable charges that remain outstanding at period end are accrued.
32

33
(f) Environmental Contribution
The Water Industry (Environmental Contributions) Act 2004 amended the Water Industry Act 1994 to make provision for environmental contributions to be paid by water retailers. Consistent with legislative requirements, City West Water pays the Environmental Contribution to the State Government to fund various water related initiatives that promote the sustainable management of water, and to address the adverse impact on the environment associated with water use.
These contributions are recognised as expenses when they occur.
(g) Employee benefits and agency labour
Employee benefits and agency labour refers to all payments made to employees during the year. It includes payments to all City West Water staff as well as contract and agency staff. Payments include ordinary time, overtime, allowances and on costs. Employee benefits and agency labour is recognised as an expense in the Statement of Comprehensive Income.
(h) Leases
A lease is a right to use an asset for an agreed period of time in exchange for payment. Leases are classified at their inception as either operating or finance leases, based on the economic substance of the agreement so as to reflect the risks and rewards incidental to ownership. Leases are classified as operating leases whenever the terms of the lease retain substantially all the risks and rewards of ownership with the lessor. Payments made under operating leases are charged to the Statement of Comprehensive Income on a straight line basis over the period of the lease.
(i) Depreciation and amortisation
All infrastructure assets, buildings, plant and equipment and other non-current physical assets (excluding items under operating leases, assets held for sale and investment properties) that have a limited useful life are depreciated. All intangible assets with a limited useful life are amortised.
Depreciation and amortisation is generally calculated on a straight line basis, at rates that allocate an asset’s value less any estimated residual value, over its estimated useful life. The useful life and residual value of each group of assets is reviewed annually. The estimated useful lives of assets are listed below and are consistent with prior years.
Buildings 10 - 50 years
Infrastructure assets 10 - 90 years
Plant and equipment 3 - 10 years
Intangible assets 3 - 10 years
Depreciation of a new infrastructure asset begins in the month subsequent to the practical completion of works. Depreciation of other new assets begins in the month subsequent to acquisition. Amortisation of intangible assets begins in the month subsequent to commissioning.
(j) Repairs and maintenance
Routine maintenance, repair costs and minor asset renewal costs are expensed as incurred. Where the expenditure relates to the replacement of a component or the enhancement of an asset and the cost satisfies the requirements of an asset, the cost is capitalised and depreciated.
(k) Impairment of assets
Intangible assets with indefinite useful lives (and intangible assets not yet available for use) are not subject to amortisation, and are tested annually for impairment (i.e. as to whether their carrying value exceeds their recoverable amount, and so require write downs) and whenever there is an indication that an asset may be impaired.
All other assets are assessed annually for indications of impairment, except for:
• financial assets and
• non current physical assets held for sale (if applicable).
If there is an indication of impairment, the assets concerned are tested as to whether their carrying value exceeds their possible recoverable amount. Where an asset’s carrying value exceeds its recoverable amount, the difference is written off as an element of other comprehensive income, except to the extent that the write down can be debited to an asset revaluation surplus amount applicable to that class of asset. The recoverable amount (value in use) is measured as the higher of the present value of future cash flows expected to be obtained from the asset and the fair value less costs to sell.
ASSETS
(l) Cash and cash equivalents
For Cash Flow Statement presentation purposes, cash and cash equivalents includes cash on hand, deposits held at call with financial institutions, other short term, and highly liquid investments with original maturities of three months or less that are readily convertible to known amounts of cash and which are subject to an insignificant risk of change in value, and bank overdrafts. Bank overdrafts (if any) are shown within borrowings in current liabilities on the balance sheet.
For the year ended 30 June 2013

Annual Report 2012-13
Notes to and forming part of the Financial Statements (continued)
For the year ended 30 June 2013
1. Summary of significant accounting policies (continued)
(m) Receivables
Receivables are initially recognised at fair value and subsequently measured at fair value less provision for impairment. Collectability of receivables is reviewed on an ongoing basis. Debts which are known to be uncollectable are written off. A provision for impaired receivables is established where it is considered that the recovery of the outstanding debt is less than likely. The amount of the impairment loss is recognised in the Statement of Comprehensive Income as an element of expenses. When a receivable for which an impairment allowance had been recognised becomes uncollectable in a subsequent period, it is written off against the provision. Subsequent recovery of amounts previously written off is credited against impaired receivables in the Statement of Comprehensive Income. City West Water’s terms of trade are 14 days.
(n) Prepayments
Prepayments represent payments in advance of receipt of goods or services or that part of expenditure made in one accounting period covering a term extending beyond that period.
(o) Infrastructure, property, plant and equipment
The cost method of accounting has been used for all acquisitions of assets during the year. Cost is determined as the fair value of the assets given up at the date of acquisition plus any costs directly attributable to the acquisition. Fair value at acquisition is deemed to be equal to cost.
The cost of non-current assets constructed by City West Water includes all costs in respect of their construction. In the case of gifted assets, where actual cost is not available, cost is calculated using a schedule of rates determined by the corporation based on historical cost information.
Assets are capitalised when it is probable that future economic benefits associated with the item will flow to City West Water and that the item can be measured reliably. City West Water has a policy of capitalising labour costs which are directly attributable to capital projects.
The carrying amount of a replaced or abandoned asset is written off in the Statement of Comprehensive Income as an element of expenses. An asset’s carrying amount is written down immediately to its recoverable amount if the asset’s carrying amount is greater than its estimated recoverable amount.
Land and buildings Land and buildings are measured at fair value, being the amount for which an asset could be exchanged between knowledgeable willing parties in an arm’s length transaction. Fair value is determined by an independent valuer using direct comparison to market based transactions for comparable properties in comparable areas, or alternatively the capitalisation of net income approach. Fair value of land and buildings is discussed in Note 12.
Property, plant and equipment Property, plant and equipment is measured initially at cost, and subsequently at fair value less accumulated depreciation and impairment losses (if applicable).
Infrastructure Infrastructure assets are measured initially at cost, and subsequently at fair value less accumulated depreciation and impairment losses (if applicable). Fair value is determined using the discounted cash flow method.
Revaluation of non-current physical assets Non current physical assets are measured at fair value. A full revaluation normally occurs every five years, but may occur more frequently if fair value assessments indicate material changes in values. Independent valuers are used to conduct these scheduled revaluations. A full revaluation was last performed during 2010-11.
Revaluation increases or decreases arise from differences between an asset’s carrying value and fair value.
Net revaluation increments (where the carrying amount of an asset is increased as a result of a revaluation) are recognised in other comprehensive income and accumulated in the equity section of the Balance Sheet in reserves, except that a net revaluation increase shall be recognised in the net result when it reverses a net revaluation decrease in respect of the same class of property, plant and equipment previously recognised as an expense in the net result.
Net revaluation decreases are recognised immediately as expenses in the net result, except to the extent that the net revaluation decrease shall be recognised in other comprehensive income when a credit balance exists in reserves in respect of the same class of property, plant and equipment. The net revaluation decrease recognised in other comprehensive income reduces the amount accumulated in the equity section of the Balance Sheet in reserves.
34

35
(p) Intangible assets
Intangible assets are initially recognised at cost, and subsequently at cost less accumulated amortisation and impairment losses (if applicable). Intangible assets consist of software and water entitlement rights.
The water entitlement rights embodied in intangible assets have an indefinite useful life, and as such are not amortised. Instead they are tested for impairment annually, or more frequently if events or changes in circumstances indicate that they might be impaired.
LIABILITIES
(q) Payables
Payables are amounts which represent liabilities for goods and services provided to City West Water prior to the end of the financial year, which are unpaid at the end of the financial year. These amounts are unsecured, and are usually paid within 30 days of recognition.
(r) Borrowings
City West Water’s principal financial instruments are loans sourced from the Treasury Corporation of Victoria (TCV). These loans include overnight borrowings, floating rate notes and fixed rate loans, and are used to meet working capital requirements and fund capital expenditure.
Where City West Water has the intention and discretion to refinance loans maturing within 12 months of balance date, such borrowings are classified as non-current. All other borrowings are classified as current.
(s) Provisions
Provisions are recognised when City West Water has a present legal or constructive obligation as a result of past events, it is probable that an outflow of resources will be required to settle the obligation, and the amount can be reliably estimated.
(t) Unearned income
Unearned income represents payments received in advance of the provision of goods or services or any legal or constructive obligation required to be performed by City West Water to settle the terms of receipt of unearned income.
(u) Employee benefits
In relation to services rendered by employees to balance date, provision is made for City West Water’s liability for employee benefits.
(i) Salaries and annual leave Liabilities for salaries, including non-monetary benefits, and annual leave expected to be settled within 12 months of the reporting date are recognised in employee benefits liabilities. These liabilities are classified as current liabilities and measured at their nominal values. Employee benefits not expected to be settled within 12 months of the reporting date have been discounted to the present value of the expected future outflow.
(ii) Long service leave A liability for long service leave (LSL) is recognised in the provision for employee benefits.
Current liability - unconditional LSL is disclosed in the notes to the financial statements as a current liability even when the corporation does not expect to settle the liability within 12 months, because it will not have the unconditional right to defer the settlement of the entitlement should an employee choose to take leave within 12 months.
The components of this current LSL liability are measured at:
• nominal value - component that the corporation expects to settle within 12 months; and
• present value - component that the corporation does not expect to settle within 12 months.
Non-current liability - conditional LSL is disclosed as a non-current liability. In this case there is an unconditional right for the corporation to defer settlement until the employee has completed the requisite years of service. This non-current LSL liability is measured at present value. Any gain or loss following revaluation of the present value of this non-current LSL liability is recognised as an income or expense, except to the extent that a gain or loss arises due to changes in Commonwealth Government bond interest rates, in which case it is recognised as an element of other comprehensive income.
(iii) Employee benefit on-costs Employee benefit on-costs such as payroll tax, Workcover premium and superannuation are included in the provision for employee benefits.
For the year ended 30 June 2013

Annual Report 2012-13
Notes to and forming part of the Financial Statements (continued)
For the year ended 30 June 2013
1. Summary of significant accounting policies (continued)
(v) Superannuation
All City West Water employees are members either of City West Water’s defined benefit fund or an approved accumulation fund of their choice. Defined benefit members receive lump sum benefits on retirement, death, disablement or withdrawal from the plan. The defined benefit plan is closed to new members.
The amount charged to the Statement of Comprehensive Income in respect of superannuation represents the contributions made by City West Water to superannuation funds for the current service of current staff. Defined benefit superannuation contributions are made to the fund based on the relevant rule of the fund. Contributions to accumulation funds are made in accordance with the Superannuation Guarantee (Administration) Act 1992.
A liability or asset in respect of defined benefits superannuation is recognised and measured as the difference between the present value of employees’ accrued benefits at reporting date and the net market value of the superannuation plan’s assets at that date. The present value of accrued benefits is based on expected future payments which arise from membership of the plan to reporting date. Consideration is given to expected future wage and salary levels, experience of employee departures, and periods of service. Expected future payments are discounted using rates of Commonwealth Government bonds with terms to maturity that match, as closely as possible, the future estimated cash outflows.
City West Water has adopted the direct method of accounting for actuarial gains or losses for its defined benefit fund. All actuarial gains or losses are recognised immediately in the Statement of Comprehensive Income in the year in which they occur.
(w) Dividend payable
City West Water is required to pay a dividend in accordance with a determination by the Treasurer of Victoria under the Water Act 1989. An obligation to pay a dividend only arises after a formal determination is made by the Treasurer following consultation between the Board, the relevant portfolio Minister and the Treasurer. As this process has not been finalised as at balance date, the Balance Sheet does not include a provision for final dividend for the 2012-13 financial year.
(x) Goods and Services Tax
Revenues, expenses and assets are recognised net of Goods and Services Tax (GST), unless the GST incurred is not recoverable from the Australian Taxation Office (ATO). In this case it is recognised as part of the cost of acquisition of the asset or as part of the expense.
Cash flows arising from operating activities are presented on a gross basis. The GST components of cash flows arising from investing or financing activities which are recoverable from or payable to the ATO are presented as operating cash flows.
(y) Comparative amounts
Where necessary, figures for the previous year have been reclassified to facilitate comparison.
(z) Rounding of amounts to nearest thousand dollars
Amounts in the financial statements have been rounded to the nearest thousand dollars, or in certain cases to the nearest dollar.
36

37
City West Water’s activities expose it to a variety of financial risks, principally market risk, credit risk, and liquidity risk. The Board of Directors has overall responsibility for the establishment and oversight of City West Water’s risk management framework. City West Water’s principal financial instruments are loans sourced from the Treasury Corporation of Victoria (TCV). These loans include overnight borrowings, floating rate notes and fixed rate loans, and are used to meet working capital requirements and fund capital expenditure. City West Water has other financial assets and liabilities such as receivables and payables which arise directly from its operating activities. City West Water’s overall financial risk management strategy is to manage its financial risks within an environment that is in accordance with the risk criteria established by the Board of Directors. The General Manager, Corporate Services evaluates and implements risk mitigation strategies in consultation with the corporation’s relevant departments.
City West Water uses different methods to measure different types of risk to which it is exposed. These methods include sensitivity analysis in the case of interest rate risk and aging analysis for credit risk. All interest income earned by City West Water is generated by cash at bank, or 11am (short term) deposit with TCV. All interest expenses incurred by City West Water relate to borrowings.
Financial risk exposures
Market risk
Market risk is the risk that changes in market prices will affect the fair value of future cash flows of City West Water’s financial instruments. Market risk is comprised of interest rate risk, foreign exchange risk and other price risk. City West Water’s exposure to market risk is purely through interest rates.
City West Water’s exposure to market interest rates relates primarily to its floating rate debt, rolling over of fixed rate debt and new borrowings. City West Water’s borrowings are sourced from TCV and are managed within the range of Board and Treasurer approved limits. Interest rates and borrowing requirements are monitored regularly. City West Water manages its exposure to interest rate changes by holding a mix of fixed and floating rate debt. City West Water’s Treasury Risk Management Policy requires it to limit the proportion of floating rate debt to a maximum of 30 per cent of total debt. City West Water has minimal exposure to interest rate risk through cash holdings and manages its interest rate exposure on cash by investing its surplus funds with TCV.
City West Water has no exposure to foreign exchange rate risk or other price risk.
The following table summarises the sensitivity of City West Water’s financial assets and financial liabilities to interest rate risk.
For the year ended 30 June 2013
2. Financial risk management objectives and policies

Annual Report 2012-13
For the year ended 30 June 2013
2. Financial risk management objectives and policies (continued)
2.2 Sensitivity analysis
2011-12 Interest rate risk
-1% +1%
Financial assets Total $’000
Profit $’000
Equity $’000
Profit $’000
Equity $’000
Cash (Note 8) 3,207 (46) (46) 46 46
Receivables (Note 9, 11) 72,199 - - - -
Total financial assets 75,406 (46) (46) 46 46
Financial liabilities
Payables (Note 15) 75,734 - - - -
Borrowings (Note 16, 20) 749,870 1,574 1,574 (1,574) (1,574)
Advances and deposits (Note 19) 3,936 - - - -
Deferred developer reimbursements (Note 19)
13,450 - - - -
Total financial liabilities 842,990 1,574 1,574 (1,574) (1,574)
Total increase/(decrease) 1,528 1,528 (1,528) (1,528)
2012-13 Interest rate risk
-1% +1%
Financial assets Total $’000
Profit $’000
Equity $’000
Profit $’000
Equity $’000
Cash (Note 8) 40,009 (216) (216) 216 216
Receivables (Note 9, 11) 74,486 - - - -
Total financial assets 114,495 (216) (216) 216 216
Financial liabilities
Payables (Note 15) 88,270 - - - -
Borrowings (Note 16, 20) 927,500 3,969 3,969 (3,969) (3,969)
Advances and deposits (Note 19) 3,935 - - - -
Deferred developer reimbursements (Note 19)
8,641 - - - -
Total financial liabilities 1,028,346 3,969 3,969 (3,969) (3,969)
Total increase/(decrease) 3,753 3,753 (3,753) (3,753)
Notes to and forming part of the Financial Statements (continued)
38

39
Credit risk
Credit risk is the risk of financial loss to City West Water as a result of a customer or counterparty to a financial instrument failing to meet contractual obligations. Credit risk arises principally in connection with City West Water’s receivables.
City West Water’s exposure to credit risk is influenced by the individual characteristics of each customer. City West Water’s receivables balance consists of amounts due from a large number of residential customers as well as non-residential customers spread across a diverse range of industries. Receivables balances are monitored on an ongoing basis. Where applicable, collection action is taken to ensure that exposure to bad debt is minimised. City West Water has in place a policy and a procedure for the collection of overdue receivables.
City West Water’s maximum exposure to credit risk is the carrying amount of receivables. Further information on City West Water’s receivables policy is disclosed in Note 1(m).
Further analysis of City West Water’s receivable credit risk is disclosed in Note 9.
Liquidity risk
Liquidity risk is the risk that City West Water will no longer meet its financial obligations as they fall due. City West Water’s policy is to pay its accounts payable liabilities within 30 days or, in the event of dispute, within 30 days from the date of resolution.
City West Water manages liquidity risk by maintaining adequate bank overdraft and TCV borrowing facilities, continuous monitoring of forecast inflows and outflows, and matching the maturity profile of financial assets and financial liabilities where appropriate.
City West Water’s borrowings are sourced from TCV while surplus funds are also invested with TCV through 11am (short term) deposits.
Fair value estimation
The fair value of financial assets and financial liabilities must be estimated for recognition and measurement or for disclosure purposes.
The carrying values less any impairment provisions of trade receivables and payables are assumed to approximate their fair value due to their short term nature. The fair value of financial liabilities for disclosure purposes are estimated by discounting future contractual cash flows at the current market interest rate that is available to City West Water for similar financial instruments.
Refer to Note 33 for the carrying amounts and fair values of financial instruments.
Capital management
City West Water manages its capital by maintaining a prudent gearing level in order to provide the State with adequate returns and to ensure it can fund its operations as a going concern.
City West Water’s objective is to maintain its gearing ratio within the Essential Services Commission’s benchmark ratio of 60 per cent. City West Water’s gearing ratio (debt/debt + equity) for the year was 58.1 per cent, compared to 47.3 per cent in 2011-12.
The only externally imposed capital requirements applying to City West Water are:
• that the financial accommodation does not exceed the approval limits set by the Treasurer of Victoria pursuant to the Borrowing and Investment Powers Act 1987
• that City West Water, with the exception of a trading account with overdraft facilities, is required to borrow exclusively with TCV.
These external capital requirements are incorporated into the management of capital through Board and State Government approval of City West Water’s annual Corporate Plan.
For the year ended 30 June 2013

Annual Report 2012-13
For the year ended 30 June 2013
3. Revenue and other income
30 June 2013$’000
30 June 2012$’000
Sales revenue
Service charges - water 65,144 63,523
Volume charges - water 177,416 168,516
Service charges - sewerage 84,457 82,352
Volume charges - sewerage 85,892 82,708
Trade waste charges 29,646 29,229
Recycled water 4,108 3,539
Desalination cost returns 1 (23,751) -
Total sales revenue 422,912 429,867
Other revenue
Area contributions 15,934 16,753
Gifted assets 17,454 23,184
Works and services provided to third parties 5,633 5,876
Interest received/receivable 60 193
Miscellaneous fees and charges 9,832 8,670
Lease income 358 345
Other 866 957
Total other revenue 50,137 55,978
Total revenue 473,049 485,845
Other income
Government grants 2 480 3,404
Defined benefit superannuation income 3,975 -
Proceeds from sale of non-current assets 373 110
Total other income 4,828 3,514
Total revenue and other income 477,877 489,359
Notes to and forming part of the Financial Statements (continued)
40

41
1 Desalination cost returns represents the required one off return to City West Water’s customers for the early collection of desalination charges. The one off return is in addition to the repayment through City West Water’s price freeze effective from 1 July 2012, in order to return the full early collection of desalination charges from City West Water’s customers. The early collection of desalination costs occurred as a result of a delay in the commissioning of the Victorian Desalination Plant in comparison to the cost assumed in the prices set by the Essential Services Commission in 2009 for Melbourne Water Corporation’s bulk charges. The return of this money to customers was cost neutral to City West Water as the repayments were fully funded through lower bulk charges to City West Water from Melbourne Water.
2 City West Water received Government funding during the year for the following:
• Aquifer Storage and Recovery feasibility at the corporation’s West Werribee Dual Supply Project
• Docklands Recycled Water Project
• Smart Water Fund grant for two summer students
• water efficiency grants for small businesses (Small Business Grant Scheme).
There are no unfulfilled conditions or other contingencies attaching to these grants. The corporation did not benefit directly from any other form of Government assistance.
For the year ended 30 June 2013

Annual Report 2012-13
For the year ended 30 June 2013
4. Expenses
30 June 2013$’000
30 June 2012$’000
Bulk water and sewerage charges 227,223 225,509
Operating expenses
Environmental Contribution 10,787 10,787
Employee benefits and agency labour 33,153 30,201
Operating contracts 34,661 31,924
Information technology 6,809 6,455
Licence fees 751 594
Billing and collection 5,745 5,412
Rental expenses relating to operating leases 153 372
Grants and water conservation initiatives 1,785 1,665
Facilities maintenance 1,406 972
Insurance 988 1,408
Depreciation and amortisation 37,398 35,293
Energy 1,575 1,363
Asset disposal costs 820 430
Impaired receivables (net) 1,685 1,528
Defined benefit superannuation expense 1,166 6,379
Other 10,632 11,487
Total operating expenses 149,514 146,270
Total expenses 376,737 371,779
Notes to and forming part of the Financial Statements (continued)
42

43
For the year ended 30 June 2013
5. Income tax
30 June 2013$’000
30 June 2012$’000
(a) Income tax expenseCurrent tax 20,133 28,632
Deferred tax (8,553) (7,523)
11,580 21,109
Income tax expense is attributable to:
Profit from continuing operations 11,580 21,109
Aggregate income tax expense 11,580 21,109
Deferred income tax expense/(revenue) included in income tax expense comprises:
Decrease/(increase) in deferred tax assets (388) (2,276)
Increase/(decrease) in deferred tax liabilities (8,165) (5,247)
(8,553) (7,523)
(b) Numerical reconciliation of income tax expense to prima facie tax payableProfit from continuing operations before income tax expense 48,718 71,701
Tax at the Australian tax rate of 30 per cent (2011-12 30 per cent) 14,615 21,510
Tax effect of amounts which are not deductible/(taxable) in calculating taxable income:
Non deductible expenses 384 730
Non deductible depreciation 886 900
Additional deductible expenses (4,305) (2,031)
11,580 21,109
(c) Income Tax expense/(income) relating to items of other comprehensive income
Gain/(loss) on revaluation of infrastructure (76,740) (60)
(76,740) (60)

Annual Report 2012-13
For the year ended 30 June 2013
6. Deferred tax assets and deferred tax liabilities reconciliation
30 June 2013$’000
30 June 2012$’000
(a) Deferred tax assetsThe balance comprises temporary differences attributable to:Amounts recognised in the Statement of Comprehensive IncomeAccrued expenses 18 25Provisions 6,216 4,625Amortisation of intellectual property 25 28Defined benefit superannuation fund liability 556 1,749
6,815 6,427
Movements:Opening balance at the start of financial year 6,427 4,151Credited/(charged) to the Statement of Comprehensive Income (Note 5a) 388 2,276Closing balance at the end of financial year 6,815 6,427
Deferred tax assets expected to be recovered within 12 months 6,302 5,942Deferred tax assets expected to be recovered after more than 12 months 513 485
6,815 6,427
Set off of deferred tax assets pursuant to set off provisions (Note 14) (6,815) (6,427)Net deferred tax assets - -
(b) Deferred tax liabilitiesThe balance comprises temporary differences attributable to:Amounts recognised in the Statement of Comprehensive IncomeFixed assets - depreciation 94,489 101,769Developer contributed assets 64,142 65,028Receivables 3 2
Amounts recognised in equityLand and buildings revaluation 9,366 9,366Infrastructure assets revaluation 61,885 138,625
229,885 314,790
Movements:Opening balance at the start of financial year 314,790 320,097Credited/(charged) to the Statement of Comprehensive Income (Note 5a) (8,165) (5,247)Credited/(charged) to equity (76,740) (60)Closing balance at the end of financial year 229,885 314,790
Deferred tax liabilities expected to be settled within 12 months 3 2Deferred tax liabilities expected to be settled after more than 12 months 229,882 314,788
229,885 314,790
Set off of deferred tax assets pursuant to set off provisions (Note 14) (6,815) (6,427)Net deferred tax liabilities 223,070 308,363
Notes to and forming part of the Financial Statements (continued)
44

45
For the year ended 30 June 2013
7. Dividends
City West Water made a final dividend payment in respect of 2011-12 of $18.0m in December 2012 (2010-11 $45.2m). An interim dividend payment of $6.8m was made in respect of 2012-13 in June 2013 (2011-12 $0). As the 2012-13 final dividend has not been determined by the Treasurer, it has not been provided for at reporting date. The Board’s preliminary dividend estimate for this period is $4.7m. Refer to Note 24(d) for dividend payments made during the year, and Note 1(w) for dividend policy.
8. Current assets - Cash and cash equivalents
30 June 2013$’000
30 June 2012$’000
Cash at bank 484 3,153
Deposits at call 39,525 54
Total current assets - Cash and cash equivalents 40,009 3,207
The above figures are reconciled to cash at the end of the financial year as shown in the Cash Flow Statement as follows:
Balance as above 40,009 3,207
Balance per Cash Flow Statement 40,009 3,207
City West Water’s exposure to interest rate risk is discussed in Notes 2 and 33.

Annual Report 2012-13
For the year ended 30 June 2013
9. Current assets - Receivables
30 June 2013$’000
30 June 2012$’000
Unbilled receivables 45,996 43,769
Account receivables 31,124 30,969
Less: Provision for impaired receivables (2,658) (2,563)
Total current assets - Receivables 74,462 72,175
As at 30 June 2013, account receivables of the corporation with a nominal value of $2.658m (2011-12 $2.563m) were impaired. The individually impaired receivables relate to aged debts where it is considered that the recovery of the outstanding debt is less than likely. A portion of these receivables is expected to be recovered.
Receivables not past due and not impaired 68,729 65,797
Receivables past due but not impaired 3,075 3,815
The ageing of impaired receivables is as follows:
30-59 days past due 336 314
60-89 days past due 194 213
90 days and greater past due 2,128 2,036
Total current assets - Receivables 74,462 72,175
Total current assets - Receivables net of statutory taxes (GST) (Refer Note 33) 71,974 68,856
Movements in the provision for impaired receivables are as follows:
Opening balance at the start of the year (2,563) (2,362)
Provision for impaired receivables recognised during the year (2,583) (2,708)
Receivables written off during the year as uncollectible 2,488 2,497
Closing balance at the end of the year (2,658) (2,563)
As at 30 June 2013, account receivables of $3.075m (2011-12 $3.815m) were past due but not impaired. These relate to a number of independent customers for whom there is no recent history of default. The ageing analysis of these account receivables is as follows:
30-59 days past due 2,492 2,840
60-89 days past due 583 640
90 days and greater past due - 335
Receivables past due but not impaired 3,075 3,815
Notes to and forming part of the Financial Statements (continued)
46

47
For the year ended 30 June 2013
10. Current assets - Prepayments
30 June 2013$’000
30 June 2012$’000
Prepayments - general 873 1,950
Prepayment - Smart Water Fund 729 383
Total current assets - Prepayments 1,602 2,333
11. Non current assets - Receivables
Receivables 24 24
Total non current assets - Receivables 24 24
12. Non current assets - Infrastructure, property, plant and equipmentFreehold land at independent valuation 2011 33,504 33,504
Total land 33,504 33,504
Buildings at independent valuation 2011 6,686 6,686
Buildings at cost 2,646 2,688
Less: accumulated depreciation (1,800) (481)
Total buildings 7,532 8,893
Infrastructure assets at fair value 1,432,827 1,587,480
Total infrastructure assets 1,432,827 1,587,480
Plant and equipment at cost 27,102 21,053
Less: accumulated depreciation (16,015) (13,570)
Total plant and equipment 11,087 7,483
Works in progress 194,785 168,974
Total infrastructure, property, plant and equipment 1,679,735 1,806,334

Annual Report 2012-13
For the year ended 30 June 2013
An independent valuation of land and buildings was undertaken by a Karl Cundall of Value It Pty Ltd on behalf of Valuer-General Victoria as at 30 June 2011. Fair value is determined using direct comparison with market based transactions for comparable properties in comparable areas, or the capitalisation of net income approach. The historical cost of land and the historical written down value of buildings at 30 June 2013 was $2.136m and $8.934m respectively.
At the direction of the Minister for Finance, and in line with Whole of Government reporting, City West Water first adopted fair value for its infrastructure assets on 30 June 2010. Prior to this, City West Water’s infrastructure assets had been carried at historical cost. The initial valuation of City West Water’s infrastructure assets was undertaken by Deloitte using the discounted cash flow method, which calculates fair value by discounting estimated future cash flows to their present value. City West Water’s fair value of
infrastructure assets as at 30 June 2013 was also performed by Deloitte. A nominal after tax discount rate of approximately 6.4 per cent was used to discount the estimated future cash flows. In determining the future cash flows, City West Water takes into account its current regulated price path to 30 June 2018 as well as the forecast revenue requirement for the subsequent regulatory period using the Essential Services Commission’s ‘building block’ approach. A terminal value beyond the forecast period is determined based on City West Water’s expected normalised cash flows. The historical written down value of infrastructure assets at 30 June 2013 was $1,247.7m.
Reconciliations
Reconciliations of the carrying amounts of each class of non-current assets at the beginning and end of the current and prior financial years are set out below.
Freehold land Buildings Water & sewerage
infrastructure
Plant & equipment
Works in progress
Total
$’000 $’000 $’000 $’000 $’000 $’0002011-12
Net book amount at 1 July 2011
33,504 6,686 1,511,660 8,295 143,061 1,703,206
Additions and transfers from works in progress
- 2,688 104,383 2,911 25,913 135,895
Revaluations - decrement
- - (200) - - (200)
Disposals - - (335) (95) - (430)
Depreciation expense
- (481) (28,028) (3,628) - (32,137)
Net book amount at 30 June 2012
33,504 8,893 1,587,480 7,483 168,974 1,806,334
2012-13
Net book amount at 1 July 2012
33,504 8,893 1,587,480 7,483 168,974 1,806,334
Additions and transfers from works in progress
- 439 129,951 7,769 25,811 163,970
Revaluations - decrement
- - (255,800) - - (255,800)
Disposals - - (165) (392) - (557)
Depreciation expense
- (1,800) (28,639) (3,773) - (34,212)
Net book amount at 30 June 2013
33,504 7,532 1,432,827 11,087 194,785 1,679,735
Notes to and forming part of the Financial Statements (continued)
48

49
For the year ended 30 June 2013
13. Non-current assets - Intangible assets30 June 2013
$’00030 June 2012
$’000
Intangible assets at cost 169,219 125,292
Less: Accumulated amortisation (24,026) (20,962)
Total intangible assets 145,193 104,330
Works in progress 12,860 27,609
Net book amount intangible assets 158,053 131,939
Reconciliations
Reconciliations of the carrying amounts of each class of intangible assets at the beginning and end of the current and prior financial years are set out below.
Software Water entitlements
Works in progress
Total
$’000 $’000 $’000 $’0002011-12
Net book amount at 1 July 2011 17,338 83,333 2,097 102,768
Additions and transfers from works in progress 148 6,667 25,512 32,327
Disposals and transfers - - - -
Amortisation expense (3,156) - - (3,156)
Net book amount at 30 June 2012 14,330 90,000 27,609 131,939
2012-13
Net book amount at 1 July 2012 14,330 90,000 27,609 131,939
Additions and transfers from works in progress 37,133 10,000 (14,749) 32,384
Disposals and transfers - (3,084) - (3,084)
Amortisation expense (3,186) - - (3,186)
Net book amount at 30 June 2013 48,277 96,916 12,860 158,053
Water entitlements represent City West Water’s bulk water entitlements held in Northern Victoria as a result of its investment in Stage 1 of the Goulburn-Murray Water Connections Project. The project was originally established in 2007 as the Northern Victoria Irrigation Renewal Project (NVIRP). On 1 July 2012, NVIRP was merged with Goulburn-Murray Water to form the Goulburn-Murray Water Connections Project. The metropolitan water retailers contributed $300m to the $1 billion Stage 1 investment. Stage 1 will generate long term average annual water savings of 225GL which will be shared equally between irrigators, the metropolitan water retailers and the environment. The carrying amount at balance date represents City West Water’s share of contributions, net of the share of contributions from four regional urban water businesses with access to Melbourne’s pooled entitlement

Annual Report 2012-13
For the year ended 30 June 2013
14. Non current assets - Deferred tax assets
30 June 2013$’000
30 June 2012$’000
Deferred tax assets (refer Note 6(a)) 6,815 6,427
Total non current assets - Deferred tax assets 6,815 6,427
15. Current liabilities - PayablesPayables - trade 70,422 58,709
Payables - other 17,848 17,025
Total current liabilities - Payables 88,270 75,734
In line with City West Water’s terms of trade, all payables are expected to be settled within 30 days.
16. Current liabilities - Borrowings
Treasury Corporation of Victoria 45,000 72,370
Total current liabilities - Borrowings 45,000 72,370
No security has been provided in respect of any existing liability.
All of City West Water’s borrowings are made through the Treasury Corporation of Victoria (TCV) and are Government guaranteed. City West Water paid a fee of $928,205 (2011-12 $739,508) for this facility.
17. Current liabilities - Current tax liabilities
Current tax liabilities 10,054 7,663
Total current liabilities – Current tax liabilities 10,054 7,663
Notes to and forming part of the Financial Statements (continued)
50

51
For the year ended 30 June 2013
18. Current liabilities - Provisions
30 June 2013$’000
30 June 2012$’000
Employee benefits (Refer note 29) 10,582 9,169
Sundry provisions 5,843 2,298
Total current liabilities - Provisions 16,425 11,467
Sundry provisions are made up of the following:
Insurance provision 302 488
Restructuring provision 157 92
Biosolids management and desludging of ATP lagoon 674 1,251
Quarter three desalination returns 1 4,133 -
Other miscellaneous provisions 577 467
Total sundry provisions 5,843 2,2981 Desalination cost returns represents the required one off return to City West Water’s customers for the early collection of desalination charges. The one off return is in addition to the repayment through City West Water’s price freeze effective from 1 July 2012, in order to return the full early collection of desalination charges from City West Water’s customers. The early collection of desalination costs occurred as a result of a delay in the commissioning of the Victorian Desalination Plant in comparison to the cost assumed in the prices set by the Essential Services Commission in 2009 for Melbourne Water Corporation’s bulk charges. The return of this money to customers is cost neutral to City West Water as the repayments are fully funded through lower bulk charges to City West Water from Melbourne Water
Movement in sundry provisions Insurance Restructure
Biosolids/ desludge
qtr three desalination
returns Other Total
$’000 $’000 $’000 $’000 $’000 $’000
Carrying amount as at 1 July 2012
488 92 1,251 - 467 2,298
Additional provisions recognised
245 120 - 4,133 519 5,017
Payments/other sacrifices of economic benefit
(431) (55) (577) - (409) (1,472)
Carrying amount as at 30 June 2013
302 157 674 4,133 577 5,843

Annual Report 2012-13
For the year ended 30 June 2013
19. Current liabilities - Other30 June 2013
$’00030 June 2012
$’000
Advances and deposits 3,935 3,936
Deferred developer reimbursements 8,641 13,450
Unearned income 1,078 1,548
Total current liabilities - Other 13,654 18,934
20. Non-current liabilities - BorrowingsTreasury Corporation of Victoria 882,500 677,500
Total non-current liabilities - Borrowings 882,500 677,500
21. Non-current liabilities - Deferred tax liabilitiesDeferred tax liability (Refer Note 6(b)) 229,885 314,790
Total non current liabilities - Deferred tax liabilities 229,885 314,790
22. Non-current liabilities - ProvisionsEmployee benefits (Refer Note 29) 1,636 1,387
Total non-current liabilities - Provisions 1,636 1,387
23. Non-current liabilities - Unearned incomeUnearned income 1,787 408
Total non-current liabilities - Unearned income 1,787 408
24. Equity
Paid up equity - 20,620
Contributed equity 217,608 196,988
Revaluation surplus 166,239 345,299
Retained profits 285,788 273,450
Total equity 669,635 836,357
(a) Shareholder’s equity (whole dollars) $ $
(i) Authorised
Ordinary shares of $1 each - 100,000,000
(ii) Issued and paid up
Ordinary shares of $1 each fully paid - 20,620,250
All paid up equity was reclassified to contributed equity upon transition of City West Water Limited to a statutory authority known as City West Water Corporation on 1 July 2012.
Notes to and forming part of the Financial Statements (continued)
52

53
For the year ended 30 June 2013
24. Equity (continued)
(b) Contributed equityContributed equity at 30 June 2012 represents an amount equivalent to the net assets transferred to City West Water Limited from Melbourne Water on its formation on 1 January 1995.
Contributed equity at 30 June 2013 represents an amount equivalent to the net assets transferred to City West Water Limited from Melbourne Water on its formation on 1 January 1995, and the amount of paid up equity reclassified as contributed equity upon transition of City West Water Limited to a statutory authority known as City West Water Corporation on 1 July 2012.
(c) Reserves
30 June 2013$’000
30 June 2012$’000
Revaluation reserve at the beginning of the financial year 345,299 345,439
Infrastructure assets revaluation, net of tax (179,060) (140)
Revaluation reserve at the end of the financial year 166,239 345,299
(d) Retained profitsRetained profits at the beginning of the financial year 273,450 268,058
Profit after income tax expense 37,138 50,592
Interim dividend paid (Note 7) (6,800) -
Final dividend paid during 2012-13 in respect of 2011-12 (Note 7) (18,000) -
Final dividend paid during 2011-12 in respect of 2010-11 (Note 7) - (45,200)
Retained profits at the end of the financial year 285,788 273,450
25. Responsible persons and executives
The relevant Minister and directors of City West Water are deemed to be responsible persons by Ministerial Direction pursuant to the provisions of the Financial Management Act 1994.
Responsible persons
The persons who held the positions of responsible persons at any time during the financial year are as follows:
The Hon. Peter Walsh MLA Minister for Water 1 July 2012 - 30 June 2013 The Hon. Alan Stockdale Chairman 1 July 2012 - 30 June 2013 Ms Anne Barker Managing Director 1 July 2012 - 30 June 2013 Ms Debbie Goodin Director 1 July 2012 - 30 June 2013 Prof. Marilyn Anderson Director 1 July 2012 - 30 June 2013 Ms Jan Begg Director 1 July 2012 - 30 June 2013 Ms Fiona Pearse Director 1 October 2012 - 30 June 2013 Mr Peter McKeown Director 1 October 2012 - 30 June 2013 Mr Derek Skues Director 1 July 2012 - 30 June 2013 Ms Jan Boxall Director 1 July 2012 - 30 September 2012 Dr. John Miller Director 1 July 2012 - 30 September 2012
Amounts relating to the Minister are reported in the financial statements of the Department of Premier and Cabinet. Other relevant interests are declared in the Register of Members’ Interests which each Member of Parliament completes.

Annual Report 2012-13
For the year ended 30 June 2013
Remuneration received or receivable by responsible persons in connection with the management of City West Water Corporation during the reporting period is reported in the table below
30 June 2013No.
30 June 2012No.
$ $
10,000 - 19,999 4 2
20,000 - 29,999 - 1
30,000 - 39,999 - 2
40,000 - 49,999 4 4
60,000 - 69,999 - 1
90,000 - 99,999 1 -
380,000 - 389,999 1 1
Total 10 11
Total amount (whole dollars) $727,839 $763,381
Other related transactions and loans requiring disclosure under the directions of the Minister for Finance are reported at Note 30 of this report
Executives
The number of executive officers other than responsible persons (as defined in FRD 21B Responsible Person and Executive Officer Disclosures in the Financial Report) and their total remuneration during the reporting period and the prior period are shown in the first two columns of the table over the page in their relevant income bands. The base remuneration of executive officers is shown in the third and fourth columns. Base remuneration is exclusive of bonus payments, long service leave payments, redundancy payments and retirement benefits. The total annualised employee equivalent provides a measure of full time executive officers over the reporting period.
Several factors have affected total remuneration payable to executives over the year. A number of employment contracts were completed during the year and renegotiated, and a number of executives received bonus payments during the year. These bonus payments depend on the terms of individual employment contracts and achievement of bonus KPIs.
A number of executive officers retired or resigned during the reporting period. This has had an impact on total remuneration figures due to the inclusion of annual leave, long service leave and other payments.
Notes to and forming part of the Financial Statements (continued)
54

55
Total Remuneration Base Remuneration
30 June 2013No.
30 June 2012No.
30 June 2013No.
30 June 2012No.
$ $
80,000 - 89,999 - - - 1
90,000 - 99,999 - - - 1
100,000 - 109,999 - - 1 1
110,000 - 119,999 - - 1 1
120,000 - 129,999 - - 4 -
130,000 - 139,999 - - 5 5
140,000 - 149,999 - - 1 1
150,000 - 159,999 - - 2 2
160,000 - 169,999 5 2 3 -
170,000 - 179,999 2 4 - -
180,000 - 189,999 4 2 - 3
190,000 - 199,999 2 2 2 -
200,000 - 209,999 1 1 2 1
210,000 - 219,999 - - - -
220,000 - 229,999 1 - - -
230,000 - 239,999 1 - - -
240,000 - 249,999 1 1 - -
250,000 - 259,999 1 2 - -
260,000 - 269,999 1 - - -
270,000 - 279,999 1 2 - -
280,000 - 289,999 1 - - -
21 16 21 16
Total annualised employee equivalent1 19.8 16.0 19.8 16.0
Total amount (whole dollars) $4,293,642 $3,262,391 $3,147,204 $2,317,912
1 Annualised employee equivalent is based on working 38 ordinary hours per week over the reporting period.
Payments to other personnel
During the reporting period, City West Water had no other personnel, by way of contractors charged with significant management responsibilities.
For the year ended 30 June 2013
25. Responsible persons and executives (continued)

Annual Report 2012-13
For the year ended 30 June 2013
26. Remuneration of auditor
30 June 2013$’000
30 June 2012$’000
Amounts received, or due and receivable by the auditor of City West Water for:
Auditing accounts of City West Water 125 122
Total auditor’s remuneration 125 122
27. Contingent assets and liabilities
Contingent assetsIn the ordinary course of business, developers often provide a commitment to City West Water to construct water supply and sewerage assets. These assets are constructed within an agreed timeframe, and upon completion are transferred to City West Water at no charge.
Currently there is approximately $3.074m (2011-12 $5.768m) of water supply assets under construction, and a further $3.379m (2011-12 $4.280m) of water supply assets committed to for which construction is yet to begin. The value of sewerage assets under construction is approximately $5.379m (2011-12 $11.237m), with a further $4.387m (2011-12 $4.964m) committed to for which construction is yet to begin. Contingent upon the completion of these assets, they will be transferred to City West Water, which will maintain them in perpetuity.
Contingent liabilitiesContingent on the completion of the above assets, City West Water has a liability to reimburse developers an estimated $1.472m (2011-12 $3.666m) for water supply assets and, $2.225m (2011-12 $7.554m) for sewerage assets for additional works constructed at City West Water’s request. These reimbursements will occur either immediately on the completion of the assets or be deferred for an agreed period in accordance with the conditions of the agreement between City West Water and the developer.
Notes to and forming part of the Financial Statements (continued)
56

57
For the year ended 30 June 2013
28. Commitment for expenditure
(a.) Capital commitments
Total capital expenditure (inclusive of GST) contracted at balance date but not provided for in the accounts:
30 June 2013$’000
30 June 2012$’000
Not later than one year 32,741 71,865
Later than one year but not later than five years - 8,428
Total capital commitments not provided for in the accounts 32,741 80,293
(b.) Lease commitments
Total operating lease expenditure (inclusive of GST) contracted for at balance date but not provided for in the accounts:
Not later than one year 13 51
Later than one year but not later than five years 53 59
Later than five years 13 15
Total lease commitments not provided for in the accounts 79 125
Representing:
Non-cancellable operating leases 79 110
Cancellable operating leases - -
Total lease commitments not provided for in the accounts 79 110
(c) Other commitments 1
Other expenditure commitments (inclusive of GST) at balance date not provided for in the accounts:
Not later than one year 19,772 11,787
Later than one year but not later than five years 38,126 56,689
Total other commitments not provided for in the accounts 57,898 68,476
1 Contained within other commitments:
Smart Water Fund
The Smart Water Fund is a joint venture which is administered via an agreement between City West Water, South East Water, Yarra Valley Water, Melbourne Water and the Victorian Government, with the objective of delivering collaborative research in water related fields. City West Water has an equal interest in the arrangement with the other businesses. The total contributions paid to the Smart Water Fund to date amount to $7.950m. At balance date, City West Water’s share of unspent contributions to the fund amounts to $0.729m (Refer Note 10). City West Water expects to contribute a further $2.000m over the next two years in order to fund research and research related activities.
Environmental contributions
Consistent with the requirements of the Water Industry Act 1994, City West Water is committed to pay an annual Environmental Contribution of $18.563m for the next three years to the Department of Environment and Primary Industries.

Annual Report 2012-13
For the year ended 30 June 2013
29. Employee benefits
(a) Employee benefits and related oncost liabilities
30 June 2013$’000
30 June 2012$’000
Current
Annual leave unconditional and expected to be settled within 12 months 2,118 1,733
Annual leave unconditional and expected to be settled after 12 months 162 148
Long service leave unconditional and expected to be settled within 12 months 406 413
Long service leave unconditional and expected to be settled after 12 months 4,948 4,464
Other employee benefits 2,948 2,411
Provision for employee benefits - current (Refer Note 18) 10,582 9,169
Non-current
Provision for employee benefits - long service leave conditional 1,636 1,387
Provision for employee benefits – non-current (Refer Note 22) 1,686 1,387
Aggregate employee benefits and related oncost liabilities 12,218 10,556
(b) Superannuation
All City West Water employees are members of either City West Water’s defined benefit fund or an approved accumulation fund of their choice. Defined benefit fund members receive lump sum benefits on retirement, death, disability or withdrawal from the fund. The defined benefit section of the plan is closed to new members. All new employees receive accumulation only benefits.
The majority of employees of City West Water are members of either the Equipsuper fund or the Vision Super fund. All new City West Water employees who are not already members of the Equipsuper defined benefit fund must join an accumulation fund.
City West Water contributed a total of $3.2m (2011-12 $2.4m) to various accumulation funds during the year.
(c) Defined Benefit Superannuation
When actuarial gains or losses are made by the defined benefit fund, these amounts are recognised in the Statement of Comprehensive Income as per AASB 119 - Employee Benefits (refer Note 1(v)).
Reconciliation of present value of the defined benefit obligation
Present value of defined benefit obligations at beginning of the year (27,897) (21,953)
Current service cost (670) (558)
Interest cost (710) (1,022)
Contributions by plan participants (301) (274)
Actuarial gains/(losses) 271 (4,590)
Benefits paid 95 291
Taxes and premiums paid 230 209
Present value of defined benefit obligations at end of the year (28,982) (27,897)
Notes to and forming part of the Financial Statements (continued)
58

59
For the year ended 30 June 2013
29. Employee benefits (continued)
The defined benefit obligation consists entirely of amounts from plans that are wholly or partly funded.
30 June 2013$’000
30 June 2012$’000
Reconciliation of the fair value of plan assetsFair value of plan assets at beginning of the year 22,068 21,361
Expected return on plan assets 1,527 1,489
Actuarial gains/(losses) 2,391 (1,698)
Employer contributions 1,166 1,142
Contributions by plan participants 301 274
Benefits paid (95) (291)
Taxes and premiums paid (230) (209)
Fair value of plan assets at end of the year 27,128 22,068
Reconciliation of the assets and liabilities recognised in the Balance SheetPresent value of defined benefits obligation 1 (28,982) (27,897)
Fair value of plan assets 27,128 22,068
Net superannuation (liability)/asset (1,854) (5,829)1 Includes contributions tax provision
Amounts recognised in the Statement of Comprehensive Income 2
Service cost 670 558
Interest cost 710 1,022
Expected return on assets (1,527) (1,489)
Actuarial (gains)/losses (2,662) 6,288
Net superannuation expense/(income) (2,809) 6,379
2 Amounts recognised in the Statement of Comprehensive Income are recognised as follows:
Movement in defined benefit superannuation asset/liability recognised as income (Note 3) (3,975) -
Movement in benefit superannuation asset/liability recognised as expense (Note 4) - 5,237
Employer contributions to defined benefit superannuation fund (Note 4) 1,166 1,142
Amounts recognised in the Statement of Comprehensive Income (2,809) 6,379

Annual Report 2012-13
For the year ended 30 June 2013
Plan Assets
The percentage invested in each asset class at reporting date is:
30 June 2013per cent
30 June 2012per cent
Australian equity 30 35
International equity 29 27
Fixed income 10 11
Property 9 10
Alternatives/other 15 10
Cash 7 7
Total 100 100
The fair value of plan assets includes no amounts relating to:
• any of the corporation’s own financial instruments
• any property occupied by, or other assets used by the corporation
Expected rate of return on plan assets
The expected return on assets assumption is determined by weighting the expected long term return for each asset class by the target allocation of assets to each asset class and allowing for the correlations of the investment returns between asset classes. The returns used for each asset class are net of investment tax and investment fees. An allowance for administration expenses has also been deducted from the expected return.
30 June 2013$’000
30 June 2012$’000
Actuarial return on plan assets 3,918 (209)
Principal actuarial assumptions at reporting date:
30 June 2013per cent
p.a.
30 June 2012per cent
p.a.
Assumptions to determine superannuation expense
Discount rate 2.7 2.7
Expected rate of return on plan assets 7.0 7.0
Expected salary increase rate 4.0 4.0
Assumptions to determine defined benefit obligation
Discount Rate 3.1 2.7
Expected salary increase rate 4.0 4.0
Notes to and forming part of the Financial Statements (continued)
60

61
Historical information
30 June 2013 $’000
30 June 2012 $’000
30 June 2011 $’000
30 June 2010 $’000
30 June 2009 $’000
Present value of defined benefits obligation (28,982) (27,897) (21,953) (20,872) (18,241)
Fair value of plan assets 27,128 22,068 21,361 19,416 16,376
Surplus/(deficit) in plan (1,854) (5,829) (592) (1,456) (1,865)
Experience adjustments gain/(loss) - plan assets
2,391 (1,698) 545 301 (3,001)
Experience adjustments gain/(loss) - plan liabilities
(954) (222) (535) (1,227) (20)
Expected contributions
Expected employer contributions for the year ending 30 June 2014 amount to $0.665m.
For the year ended 30 June 2013
29. Employee benefits (continued)

Annual Report 2012-13
For the year ended 30 June 2013
30. Related party disclosure
Directors
The names of persons who were directors of City West Water at any time during the financial year are as follows: A. Stockdale, A. Barker, D. Goodin, M. Anderson, J. Begg, P. McKeown, F. Pearse, D. Skues, J. Boxall, and J. Miller.
Remuneration and retirement benefits
Information regarding the remuneration of directors is reported at Note 25 of this report.
Transactions with directors and Director related entities
Water and sewerage services were provided to directors and Director related entities for properties within City West Water’s licence area under normal commercial terms and conditions.
Ms Anne Barker is a Director of LeadWest. During the year City West Water paid $5,500 (2011-12 $5,500) for LeadWest membership.
Ms Anne Barker is Chairman of the not-for-profit organisation Whitelion. During the year City West Water paid $15,448 (2011-12 $13,900) to Whitelion in donations and for services rendered, with a further $0 (2011-12 $1,248) payable.
Ms Anne Barker is Chairman of the Smart Water Fund. During the year City West Water paid $1,000,000 (2011-12 $1,000,000) to the fund in financial contributions. The corporation received $108,193 from the Smart Water Fund (2011-12 $65,374), with a further $79,601 receivable (2011-12 $7,151) for sub-letting of office space and associated incidentals.
Ms Anne Barker is a member of the board of the Water Services Association of Australia (WSAA). During the year City West Water paid $247,956 (2011-12 $274,537) to WSAA, with a further $0 (2011-12 $69,986) outstanding and the corporation received $39,755 (2011-12 $17,077) from WSAA, with a further $0 (2011-12 $18,437) receivable.
Ms Jan Boxall is a former partner of law firm Corrs Chambers Westgarth and is entitled to the use of an office at the firm. During the year Corrs Chambers Westgarth provided legal services to City West Water for which an amount of $369,631 (2011-12 $171,118) was paid on normal commercial terms and conditions. A further $873 (2011-12 $13,800) remained payable at balance date.
Dr John Miller is an Adjunct Professor of Victoria University (an honorary position). During the year, City West Water paid $254,218 (2011-12 $222,196) with a further $5,508 (2011-12 $43,130) outstanding and payable to Victoria University for a range of services, including event facilitation, toilet retrofit, education costs and text book purchases. In addition, the corporation received $0 (2011-12 $1,458) in sponsor refunds from Victoria University.
Ms Jan Begg is a member of the Monash University Business and Management Department Advisory Board. During the year, City West Water paid $39,632 (2011-12 $38,500) to Monash University as contributions to various studies being undertaken by the university, with a further $0 (2011-12 $17,632) outstanding and payable at balance date.
Ms Jan Begg is a member of the Melbourne Business School. During the year, City West Water paid $0 (2011-12 $9,937) to the school for the provision of senior management courses.
Ms Jan Begg is an independent member of the Department of Education and Early Childhood Development Portfolio Audit Committee (Vic). During the year, City West Water paid $321,194 (2011-12 $33,528) to the department in developer reimbursements for the Suzanne Corey High School, Werribee. In addition, the corporation received $0, (2011-12 $13,372) in contribution fees and apprenticeship/traineeship completion bonuses from the department.
Ms Debbie Goodin was until 30 June 2013 the Chief Operating Officer of Spiire Australia Pty Ltd (a fully owned subsidiary of Downer EDI Limited). Ms Goodin continues to be contracted to Downer EDI Limited through her management consulting business.
During the year City West Water paid $61,094 (2011-12 $0) to Spiire with a further $16,500 (2011-12 $0) outstanding and payable for asset verification services. In addition, City West Water received $2,789 (2011-12 $0) for acceptance and connection fees.
During the year, City West Water paid Downer EDI Engineering Electrical Pty Ltd (formerly Corke Instrument Engineering (Aust) Pty Ltd) $296,744 (2011-12 $2,327), with a further $627 (2011-12 $3,399) outstanding and payable for design and construction of water main renewals.
During the year City West Water paid Downer EDI Works Pty Ltd $3,635,788 (2011-12 $8,122,023) with a further $689,752 (2011-12 $571,511) outstanding and payable for design and construction of water main renewals. In addition, City West Water received $0 (2011-12 $269) with a further $1,997 (2011-12 $0) outstanding and receivable from Downer EDI Works Pty Ltd for chargeable works.
During the year City West Water paid Downer EDI Engineering Pty Ltd $0 (2011-12 $1,033) for service and calibration of portable gas detection units. In addition, City West Water received $1,394 (2011-12 $0) from Downer EDI Engineering Pty Ltd for chargeable works.
All directors make a contribution to Directors’ Liability Insurance.
There were no further transactions with either directors or Director related entities during the reporting period other than payment for services referred to at Note 25 of this report.
Directors with related party interests were not involved in the relevant decision making process.
Notes to and forming part of the Financial Statements (continued)
62

63
Victorian Government
City West Water is subject to the provisions of the Water Act 1989 and the Water Industry Act 1994. City West Water operates under specific legislation and is subject to independent economic regulation. City West Water operates under a Board of Directors appointed by the Victorian Government, and makes equivalent tax payments and pays dividends to the Victorian Government.
Department of Environment and Primary Industries (DEPI)
City West Water bills and collects parks charges on behalf of the Department of Environment and Primary Industries. In addition, City West Water is required to make various payments to the Department which are included in expenses.
30 June 2013$’000
30 June 2012$’000
Payments
Environmental contributions 10,787 10,787
Parks rates collected on behalf of DEPI 36,790 35,168
Other 277 160
Receipts
Billings and collection fee 1,745 1,580
Water - Learn It! Live It! funding - 120
Water conservation rebates 274 113
Administration fee on water conservation rebates 1 1
Showerhead reimbursements - 200
Retrofit of dual flush toilets funding 61 139
Behavioural change campaign 11 273
Other 430 355
Payables
Parks rates collected on behalf of DEPI 69 40
Receivables
Billings and collection fee 41 157
Grants funding - 378
Water conservation rebates 17 20
For the year ended 30 June 2013
30. Related party disclosures (continued)

Annual Report 2012-13
For the year ended 30 June 2013
Department of Treasury and Finance
The Department of Treasury and Finance, as shareholder representative, approves and monitors implementation of City West Water’s Corporate Plan in consultation with the Department of Environment and Primary Industries.
30 June 2013$’000
30 June 2012$’000
Payments
Dividend 24,800 45,200
Income tax equivalent 17,741 34,021
Financial accommodation levy 7,097 5,415
Licence fee 414 353
Payables
Income tax equivalent 10,054 7,663
Financial accommodation levy 2,129 1,581
Treasury Corporation of Victoria
As required by the State Government, City West Water’s borrowings are sourced solely from the Treasury Corporation of Victoria.
Payments
Finance costs 43,525 37,057
Administration fees 928 740
Advisory services 25 25
Receipts
Net borrowings during the year 177,630 142,370
Interest received 7 141
Payables
Finance costs 15,397 15,137
Administration fees 322 307
Advisory services 6 6
Total borrowings 927,500 749,870
Receivables
Interest receivable 9 7
Notes to and forming part of the Financial Statements (continued)
64

65
Melbourne Water Corporation
City West Water sources all its water from Melbourne Water Corporation and the majority of its sewage is treated by Melbourne Water Corporation at the Western Treatment Plant. City West Water also bills and collects drainage charges on behalf of Melbourne Water Corporation.
30 June 2013$’000
30 June 2012$’000
Payments
Bulk water and sewage charges 226,441 224,084
Goulburn-Murray Water Connections Project contributions 10,000 22,000
Drainage rates collected on behalf of Melbourne Water 57,154 54,976
Property information statements 158 163
Other 164 65
Receipts
Billings and collection fees 2,960 2,736
Water supply/demand strategy (cost recovery) 150 123
Other 579 -
Payables
Bulk water and sewage charges 4,777 3,628
Drainage rates collected on behalf of Melbourne Water 1,134 1,293
Property information statements 83 76
Other 56 30
Receivables
Billings and collection fees 41 157
Other 7 176
For the year ended 30 June 2013
30. Related party disclosures (continued)

Annual Report 2012-13
For the year ended 30 June 2013
State Revenue Office (SRO)
The State Revenue Office is the Victorian Government’s tax collection agency. The SRO administers Victoria’s tax legislation and collects a range of taxes, duties and levies.
30 June 2013$’000
30 June 2012$’000
Payments
Land tax - 89
Payroll tax 1,900 1,654
Unclaimed monies 409 374
Other 1 -
Receipts
Pension rebate 501 454
Payables
Land tax 25 -
Payroll tax - 135
Receivables
Pension rebate 118 134
Payroll tax 22 -
Notes to and forming part of the Financial Statements (continued)
66

67
Department of Health
City West Water provides a number of services to the community, which includes the administration of the Pension Rebate and Health Care Card schemes on behalf of the Department of Health.
30 June 2013$’000
30 June 2012$’000
Payments
Safe Drinking Water Levy 123 120
Receipts
Pension rebate 19,753 19,106
Administration fee on pension rebate 199 196
Dialysis users rebate 16 14
Utility relief grant 198 175
Other 5 125
Receivables
Pension rebate 749 848
Administration fee on pension rebate 8 9
Dialysis users rebate 4 4
Other Victorian Government controlled entities
Water and sewerage services were provided to other Government controlled entities for properties within City West Water’s licence area under normal commercial terms and conditions.
For the year ended 30 June 2013
30. Related party disclosures (continued)

Annual Report 2012-13
For the year ended 30 June 2013
31. Economic dependency
The normal trading activities of City West Water depend to a significant extent on services relating to the acquisition of water and disposal of sewage currently supplied by Melbourne Water Corporation. During the financial year 2012-13 all drinking water supplies were sourced through this corporation and the majority of City West Water’s sewage disposals were made through the same corporation. As no alternative suppliers currently exist, this dependency is expected to continue into the future.
As required by Victorian legislation, City West Water’s borrowings are sourced solely from the Treasury Corporation of Victoria.
32. Reconciliation of profit after income tax to net cash inflow from operating activities
.
30 June 2013$’000
30 June 2012$’000
Profit after income tax expense 37,138 50,592
Plus/(less) non cash and investing items:
Depreciation and amortisation of assets 37,398 35,293
Impaired receivables 2,583 2,708
Net (gain)/loss on disposal of non-current assets 175 (15)
Asset write offs/write downs 272 335
Gifted assets (17,454) (23,184)
Changes in operating assets and liabilities:
Increase/(decrease) in unearned income 909 41
Decrease/(increase) in receivables (4,870) (19,234)
Decrease/(increase) in prepayments 731 (1,714)
Increase/(decrease) in payables (4,365) 7,456
Increase/(decrease) in deferred tax liabilities (8,553) (7,523)
Increase/(decrease) in current tax liabilities 2,391 (5,388)
Increase/(decrease) in other provisions 5,206 2,137
Increase/(decrease) in defined benefit superannuation liability (3,975) 5,237
Net cash inflow from operating activities 47,586 46,741
Notes to and forming part of the Financial Statements (continued)
68

69
Not
es to
and
form
ing
part
of th
e Fi
nanc
ial S
tate
men
ts
For t
he y
ear e
nded
30
June
201
3
33.
Fina
ncia
l ins
trum
ents
Inte
rest
rate
risk
(a) C
ity W
est W
ater
’s ex
posu
re to
inte
rest
rate
risk
and
the
effe
ctive
weig
hted
ave
rage
inte
rest
rate
for e
ach
class
of fi
nanc
ial a
sset
and
fina
ncial
liabi
lity is
set
out
belo
w.
(b) E
xpos
ure
arise
s pr
edom
inan
tly fr
om a
sset
s an
d lia
biliti
es b
earin
g va
riabl
e in
tere
st ra
tes
and
fixed
rate
bor
row
ings
whi
ch m
atur
e du
ring
the
year
.
2011
-12
Fixe
d in
tere
st m
atur
ing
in:
Wei
ghte
d av
erag
e in
tere
st ra
te
Floa
ting
inte
rest
rate
$’
000
1 ye
ar o
r le
ss
$’00
0
Ove
r 1 to
2
year
s
$’00
0
Ove
r 2 to
3
year
s
$’00
0
Ove
r 3 to
4
year
s
$’00
0
Ove
r 4 to
5
year
s
$’00
0
Ove
r 5
year
s
$’00
0
Non
inte
rest
be
arin
g
$’00
0
Tota
l $’
000
Fina
ncia
l ass
ets
Cash
and
cas
h eq
uiva
lents
(Not
e 8)
2.59
%3,
207
-3,
207
Rece
ivabl
es1
(Not
e 9,
11)
68,8
8068
,880
Tota
l fina
ncia
l ass
ets
3,20
7-
--
--
-68
,880
72,0
87
Fina
ncia
l lia
bilit
ies
Paya
bles
(Not
e 15
)75
,734
75,7
34
Borro
win
gs
(Not
e 16
, 20)
5.69
%27
,370
45,0
0065
,000
60,0
0060
,000
50,0
0044
2,50
0-
749,
870
Adva
nces
and
de
posit
s (N
ote
19)
3,93
63,
936
Defe
rred
deve
lope
r re
imbu
rsem
ents
(N
ote
19)
13,4
5013
,450
Tota
l fina
ncia
l lia
bilit
ies
27,3
7045
,000
65,0
0060
,000
60,0
0050
,000
442,
500
93,1
2084
2,99
0

Annual Report 2012-13
Not
es to
and
form
ing
part
of th
e Fi
nanc
ial S
tate
men
ts
For t
he y
ear e
nded
30
June
201
3
33.
Fina
ncia
l ins
trum
ents
(con
tinue
d)
2012
-13
Fixe
d in
tere
st m
atur
ing
in:
Wei
ghte
d av
erag
e in
tere
st ra
te
Floa
ting
inte
rest
rate
$’
000
1 ye
ar o
r le
ss
$’00
0
Ove
r 1 to
2
year
s
$’00
0
Ove
r 2 to
3
year
s
$’00
0
Ove
r 3 to
4
year
s
$’00
0
Ove
r 4 to
5
year
s
$’00
0
Ove
r 5
year
s
$’00
0
Non
inte
rest
be
arin
g
$’00
0
Tota
l $’
000
Fina
ncia
l ass
ets
Cash
and
cas
h eq
uiva
lents
(Not
e 8)
2.69
%40
,009
-40
,009
Rece
ivabl
es1
(Not
e 9,
11)
71,9
9871
,998
Tota
l fina
ncia
l ass
ets
40,0
09-
--
--
-71
,998
112,
007
Fina
ncia
l lia
bilit
ies
Paya
bles
(Not
e 15
)88
,270
88,2
70
Borro
win
gs
(Not
e 16
, 20)
5.23
%60
,000
45,0
0060
,000
60,0
0060
,000
80,0
0056
2,50
0-
927,
500
Adva
nces
and
de
posit
s (N
ote
19)
3,93
53,
935
Defe
rred
deve
lope
r re
imbu
rsem
ents
(N
ote
19)
8,64
18,
641
Tota
l fina
ncia
l lia
bilit
ies
60,0
0045
,000
60,0
0060
,000
60,0
0080
,000
562,
500
100,
846
1,02
8,34
61 Do
es n
ot in
clude
sta
tuto
ry ta
xes
(GST
)
Cons
isten
t with
its
inte
rest
rate
risk
man
agem
ent p
olicy
, City
Wes
t Wat
er e
nter
ed in
to a
num
ber o
f for
war
d ra
te s
ettle
men
ts d
urin
g th
e ye
ar to
man
age
its in
tere
st ra
te ri
sk e
xpos
ure.
The
re
wer
e no
out
stan
ding
forw
ard
rate
agr
eem
ents
at b
alanc
e da
te.
70

71
Not
es to
and
form
ing
part
of th
e Fi
nanc
ial S
tate
men
ts
For t
he y
ear e
nded
30
June
201
3
33.
Fina
ncia
l ins
trum
ents
(con
tinue
d)
2012
-13
Fixe
d in
tere
st m
atur
ing
in:
Wei
ghte
d av
erag
e in
tere
st ra
te
Floa
ting
inte
rest
rate
$’
000
1 ye
ar o
r le
ss
$’00
0
Ove
r 1 to
2
year
s
$’00
0
Ove
r 2 to
3
year
s
$’00
0
Ove
r 3 to
4
year
s
$’00
0
Ove
r 4 to
5
year
s
$’00
0
Ove
r 5
year
s
$’00
0
Non
inte
rest
be
arin
g
$’00
0
Tota
l $’
000
Fina
ncia
l ass
ets
Cash
and
cas
h eq
uiva
lents
(Not
e 8)
2.69
%40
,009
-40
,009
Rece
ivabl
es1
(Not
e 9,
11)
71,9
9871
,998
Tota
l fina
ncia
l ass
ets
40,0
09-
--
--
-71
,998
112,
007
Fina
ncia
l lia
bilit
ies
Paya
bles
(Not
e 15
)88
,270
88,2
70
Borro
win
gs
(Not
e 16
, 20)
5.23
%60
,000
45,0
0060
,000
60,0
0060
,000
80,0
0056
2,50
0-
927,
500
Adva
nces
and
de
posit
s (N
ote
19)
3,93
53,
935
Defe
rred
deve
lope
r re
imbu
rsem
ents
(N
ote
19)
8,64
18,
641
Tota
l fina
ncia
l lia
bilit
ies
60,0
0045
,000
60,0
0060
,000
60,0
0080
,000
562,
500
100,
846
1,02
8,34
61 Do
es n
ot in
clude
sta
tuto
ry ta
xes
(GST
)
Cons
isten
t with
its
inte
rest
rate
risk
man
agem
ent p
olicy
, City
Wes
t Wat
er e
nter
ed in
to a
num
ber o
f for
war
d ra
te s
ettle
men
ts d
urin
g th
e ye
ar to
man
age
its in
tere
st ra
te ri
sk e
xpos
ure.
The
re
wer
e no
out
stan
ding
forw
ard
rate
agr
eem
ents
at b
alanc
e da
te.
For the year ended 30 June 2013
33. Financial instruments (continued)
Credit risk City West Water’s maximum exposure to credit risk is represented by the carrying amount of its financial assets in the balance sheet.
Fair Value Measurements The table over the page presents City West Water’s financial assets and liabilities measured at fair value at 30 June 2013 and 30 June 2012.
Notes to and forming part of the Financial Statements (continued)

Annual Report 2012-13
For the year ended 30 June 2013
33. Financial instruments (continued)
2011-12 Carryingamount
$’000
Net FairValue$’000
Financial assets
Cash and cash equivalents (Note 8) 3,207 3,207
Receivables (Note 9,11)1 68,880 68,880
Total financial assets 72,087 72,087
Financial liabilities
Payables (Note 15) 75,734 75,734
Borrowings (Note 16, 20) 749,870 839,819
Advances and deposits (Note 19) 3,936 3,936
Deferred developer reimbursements (Note 19) 13,450 13,450
Total financial liabilities 842,990 932,939
2012-13
Financial assets
Cash and cash equivalents (Note 8) 40,009 40,009
Receivables (Note 9,11)1 71,998 71,998
Total financial assets 112,007 112,007
Financial liabilities
Payables (Note 15) 88,270 88,270
Borrowings (Note 16, 20) 927,500 998,174
Advances and deposits (Note 19) 3,935 3,935
Deferred developer reimbursements (Note 19) 8,641 8,641
Total financial liabilities 1,028,346 1,099,020
1 Does not include statutory taxes (GST)
Net fair value of financial instruments is determined on the following bases:
Cash, receivables, accounts payable and deposits are valued at their carrying amounts, as this approximates net market value. Borrowings are valued by discounting the expected future cash flows at the yield offered by Treasury Corporation of Victoria as at 30 June 2013.
Notes to and forming part of the Financial Statements (continued)
72

73
We certify that the attached financial statements for City West Water Corporation have been prepared in accordance with Standing Direction 4.2 of the Financial Management Act 1994, and applicable Financial Reporting Directions, Australian Accounting Standards, Interpretations and other mandatory professional reporting requirements.
We further state that in our opinion, the information set out in the Statement of Comprehensive Income, Balance Sheet, Statement of Changes in Equity, Cash Flow Statement and notes to and forming part of the financial statements presents fairly the financial transactions during the year ended 30 June 2013 and the financial position of the corporation as at 30 June 2013.
We are not aware of any circumstance which would render any particulars included in the financial statements to be misleading or inaccurate.
This financial report was authorised for release by the Board of Directors on 28 August 2013.
The Hon. Alan Stockdale Anne Barker Sean Crees
Chairman Managing Director General Manager, Corporate Services
Melbourne
28 August 2013
Statutory Certification

Annual Report 2012-13
Independent Auditor’s Report
74

75

Annual Report 2012-13
City West Water Corporation’s 2012-13 Annual Report is prepared in accordance with all relevant Victorian legislation and pronouncements. This index has been prepared to facilitate identification of City West Water’s compliance with statutory disclosure requirements.
Legislation Disclosure Required Page
Report of OperationsCharter and purpose
FRD 22D ......................Manner of establishment and the relevant Minister. ......................................... 53
FRD 22D ......................Objectives, functions, powers and duties. ....................................................... 2
FRD 22D ......................Nature and range of services provided. ........................................................... 2
Management and structure
FRD 22D ......................Organisational structure. ................................................................................. 3
FRD 22D ......................Directors of the Board. ................................................................................... 4-6
Financial and other information
FRD 10 .........................Disclosure Index. ............................................................................................ 76-77
FRD 22D ......................Five-year summary of financial results. ............................................................ 10-11
FRD 22D ......................Statement of workforce data. ......................................................................... 9
FRD 22D ......................Summary of financial results for the year. ........................................................ 1
FRD 22D ......................Significant changes in financial position during the year. .................................. 10
FRD 22D ......................Operational and budgetary objectives, and performance against objectives. ... 10
FRD 22D ......................Major changes or factors affecting performance. ............................................ 10
FRD 22D ......................Employment and conduct principles. .............................................................. 9
FRD 22D ......................Occupational health and safety policy. ............................................................ 8-9
FRD 22D ......................Subsequent events. ........................................................................................ 12
FRD 22D ......................Application and operation of the Freedom of Information Act 1982. ................ 13
FRD 22D ......................Application and operation of the Protected Disclosure Act 2012. .................... 13
FRD 22D ......................Statement of National Competition Policy. ...................................................... 14
FRD 22D ......................Statement of availability of other information. .................................................. 15
FRD 22D ......................Environmental performance. ........................................................................... 14
FRD 22D ......................Building and maintenance provisions of the Building Act 1993. ....................... 13
FRD 22D ......................Details of consultancies over $10,000............................................................. 12
FRD 22D ......................Details of consultancies under $10,000. ......................................................... 12
FRD 25A ......................Victorian Industry Participation Policy disclosures. .......................................... 15
FRD 27B ......................Presentation and reporting of performance information. .................................. 22-23
FRD 30A ......................Standard requirements for the design and print of annual reports. .................. Entire report
SD 4.5.5 .......................Risk management compliance attestation. ...................................................... 25
SD 4.2 (g) .....................General information requirements. .................................................................. 2
SD 4.2 (j) ......................Sign-off requirements. .................................................................................... 1
Appendix 1 – Disclosure Index
76

77
Legislation Disclosure Required Page
Ministerial reporting directions
MRD 01 ........................Performance reporting .................................................................................... 22-23
MRD 02 ........................Reporting on water consumption and drought response................................. 16-17
MRD 03 ........................Environmental and social sustainability reporting ............................................. 17-21
MRD 04 ........................Disclosure of information on bulk entitlements ................................................ 81-84
MRD 05 ........................Annual reporting of major non-residential water users ..................................... 24
Financial statementsFinancial statements required under Part 7 of the Financial Management Act 1994
SD 4.2(b) ......................Statement of Comprehensive Income. ............................................................ 26
SD 4.2(b) ......................Balance Sheet. ............................................................................................... 27
SD 4.2(a) ......................Statement of Changes in Equity. ..................................................................... 28
SD 4.2(b) ......................Cash Flow Statement. .................................................................................... 29
SD 4.2(b) ......................Notes to and forming part of the Financial Statements. ................................... 30-72
Other requirements under Standing Direction 4.2
SD 4.2(c) ......................Compliance with applicable Australian accounting standards ........................ and other authoritative pronouncements.
30
SD 4.2(c) ......................Compliance with Ministerial Directions. ........................................................... 30
SD 4.2(c) ......................Accountable Officer’s declaration. ................................................................... 73
SD 4.2(d) ......................Rounding of amounts. .................................................................................... 36
Other disclosures required by FRD's in notes to and forming part of the Financial Statements
FRD 3A ........................Accounting for dividends. ............................................................................... 36, 45
FRD 7A ........................Early adoption of authoritative accounting pronouncements. .......................... 30
FRD 17A ......................Long service leave wage inflation and discount rates. ..................................... 60
FRD 21B ......................Disclosures of responsible persons, executive officers and ............................ other personnel in the Financial Report.
53-55
FRD 103D ....................Non current physical assets. ........................................................................... 34, 47-48
FRD 105A ....................Borrowing costs. ............................................................................................ 26, 32
FRD 106 ....................... Impairment of assets. ..................................................................................... 34-35
FRD 108A ....................Classification of entities as for profit. ............................................................... 30
FRD 109 ....................... Intangible assets. ............................................................................................ 35,49
FRD 110 .......................Cash flow statements. .................................................................................... 29,30
FRD 112C ....................Defined benefit superannuation obligations. .................................................... 36, 58-61
FRD 114A ....................Financial instruments - General Government Entities and ............................... Public Non Financial Corporations.
69-71
FRD 119 .......................Contributions by owners. ................................................................................ 53
Appendix 1 – Disclosure Index (continued)

Annual Report 2012-13
Legislation Disclosure Required Page
FRD 120G ....................Accounting and reporting pronouncements not applicable to the ................... 2012-13 reporting period.
31
FRD 121 ....................... Infrastructure Assets (Water/Rail). ................................................................... 47-48
Legislation
Water Act 1989
Building Act 1993
Whistleblowers Protection Act 2001
Protected Disclosure Act 2012
Victorian Industry Participation Policy Act 2003
Financial Management Act 1984
Appendix 1 – Disclosure Index (continued)
78
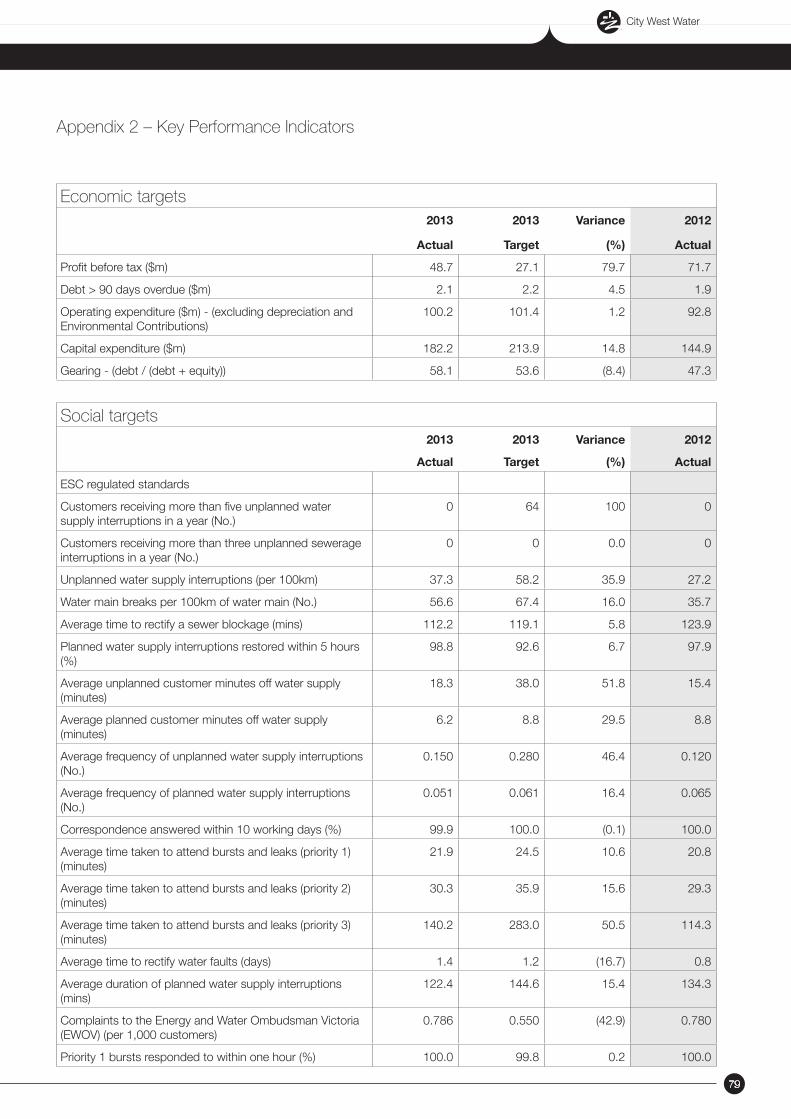
79
Appendix 2 – Key Performance Indicators
Economic targets
2013 2013 Variance 2012
Actual Target (%) Actual
Profit before tax ($m) 48.7 27.1 79.7 71.7
Debt > 90 days overdue ($m) 2.1 2.2 4.5 1.9
Operating expenditure ($m) - (excluding depreciation and Environmental Contributions)
100.2 101.4 1.2 92.8
Capital expenditure ($m) 182.2 213.9 14.8 144.9
Gearing - (debt / (debt + equity)) 58.1 53.6 (8.4) 47.3
Social targets
2013 2013 Variance 2012
Actual Target (%) Actual
ESC regulated standards
Customers receiving more than five unplanned water supply interruptions in a year (No.)
0 64 100 0
Customers receiving more than three unplanned sewerage interruptions in a year (No.)
0 0 0.0 0
Unplanned water supply interruptions (per 100km) 37.3 58.2 35.9 27.2
Water main breaks per 100km of water main (No.) 56.6 67.4 16.0 35.7
Average time to rectify a sewer blockage (mins) 112.2 119.1 5.8 123.9
Planned water supply interruptions restored within 5 hours (%)
98.8 92.6 6.7 97.9
Average unplanned customer minutes off water supply (minutes)
18.3 38.0 51.8 15.4
Average planned customer minutes off water supply (minutes)
6.2 8.8 29.5 8.8
Average frequency of unplanned water supply interruptions (No.)
0.150 0.280 46.4 0.120
Average frequency of planned water supply interruptions (No.)
0.051 0.061 16.4 0.065
Correspondence answered within 10 working days (%) 99.9 100.0 (0.1) 100.0
Average time taken to attend bursts and leaks (priority 1) (minutes)
21.9 24.5 10.6 20.8
Average time taken to attend bursts and leaks (priority 2) (minutes)
30.3 35.9 15.6 29.3
Average time taken to attend bursts and leaks (priority 3) (minutes)
140.2 283.0 50.5 114.3
Average time to rectify water faults (days) 1.4 1.2 (16.7) 0.8
Average duration of planned water supply interruptions (mins)
122.4 144.6 15.4 134.3
Complaints to the Energy and Water Ombudsman Victoria (EWOV) (per 1,000 customers)
0.786 0.550 (42.9) 0.780
Priority 1 bursts responded to within one hour (%) 100.0 99.8 0.2 100.0

Annual Report 2012-13
2013 2013 Variance 2012
Actual Target (%) Actual
Sewer spills within a house contained within one hour of notification (%)
100.0 100.0 0.0 100.0
Emergency calls answered within 30 seconds (%) 91.7 91.6 0.1 91.9
Account enquiries answered within 30 seconds (%) 69.0 80.0 (13.8) 55.0
Telephone calls to Connections and Metering answered within 30 seconds (%)
92.2 80.0 15.3 62.4
Other targets
2013 2013 Variance 2012
Actual Target (%) Actual
Number of customers receiving three sewer blockages in a year (No.)
1 5 80.0 1
ISO 9001: 2008 (Quality) Retained Retain - Retained
E.coli compliance 99.9 98.0 1.9 100.0
Safe drinking water standards 100.0 100.0 0.0 100.0
Recycled water standards - Class A 100.0 100.0 0.0 100.0
Recycled water standards - Class B 100.0 100.0 0.0 100.0
Customer satisfaction (%) 94.9 >90.0 1.1 95.6
Customers receiving five unplanned water supply interruptions in a year (%)
0 n/a n/a 0
Further key performance indicators, including environmental indicators are reported in the Report of Operations and the Performance Report
Appendix 2 – Key Performance Indicators (continued)
80

81
App
endi
x 3
– B
ulk
Wat
er E
ntitl
emen
t rep
ortin
g
The
thre
e m
etro
polita
n re
tail w
ater
cor
pora
tions
(the
reta
il cor
pora
tions
) hol
d bu
lk en
titlem
ents
to th
e w
ater
reso
urce
s of
the
Yarra
Rive
r, Th
omso
n Ri
ver,
Tara
go a
nd B
unyip
Rive
rs, S
ilver
an
d W
allab
y Cr
eeks
(Gou
lbur
n Ri
ver B
asin
) and
to th
e Vi
ctor
ian D
esali
natio
n Pr
ojec
t. Th
e en
titlem
ents
hav
e be
en e
stab
lishe
d as
a c
ollec
tive
“poo
l”. O
n 2
July
2012
, the
Min
ister
for W
ater
ga
zette
d ne
w b
ulk
entit
lemen
ts fo
r the
reta
il cor
pora
tions
in th
e Ri
ver M
urra
y an
d G
oulb
urn
syst
em o
f up
to 7
5,00
0ML
annu
ally,
as a
resu
lt of
the
reta
il cor
pora
tions
’ inv
estm
ent i
n th
e G
oulb
urn-
Mur
ray
Wat
er C
onne
ctio
ns P
rojec
t.
Mel
bour
ne re
tail
wat
er
corp
orat
ions
’ rep
ortin
g ob
ligat
ion
Com
bine
d ya
rra
Riv
er, S
ilver
and
W
alla
by C
reek
s,
Thom
son
Riv
er
yarr
a R
iver
3 Si
lver
and
W
alla
by
Cre
eks5
Thom
son
Riv
er8
Tara
go a
nd
Buny
ip
Riv
ers11
Vict
oria
n D
esal
inat
ion
Proj
ect14
Gou
lbur
n Sy
stem
18 19
Riv
er
Mur
ray23
24
The
volu
me
of w
ater
take
n by
the
reta
il cor
pora
tions
in 2
012-
13Cl
ause
15.
1 (a
)32
5,85
5ML
Clau
se 1
5.1 (a)
299,
636M
L
Clau
se 1
3.1 (a)
1,07
1ML
Clau
se 1
5.1 (a)
25,1
48M
L
Clau
se 1
4.1 (a)
4,61
2ML
(Tara
go)
2,19
0 M
L(B
unyip
)
Clau
se 1
1.1 (a)
0ML15
16
Clau
se 1
4.1 (b)
18M
L 20
0 M
L
Com
plian
ce w
ith th
e lo
ng te
rm
aver
age
bulk
entit
lemen
t dive
rsio
n lim
itCl
ause
15.
1 (b
)41
1,57
1ML1
Clau
se 1
5.1 (b)
297,
382M
L4
Clau
se 1
3.1 (b)
13,4
87M
L6
Clau
se 1
5.1 (b)
109,
694M
L9
Clau
se 1
4.1
(f)7,
545M
L (Ta
rago
)12
2,19
2ML
(Bun
yip)13
Clau
se 1
1.1 (e)
0 M
L
n/a
n/a
The
tota
l ann
ual c
onsu
mpt
ion
in
2012
-13
404,
260
ML
n/a
n/a
n/a
n/a
n/a
n/a
n/a
The
reta
il cor
pora
tions
’ sha
re o
f flow
s in
201
2-13
n/a
Clau
se 1
5.1 (a)
312,
311M
L
Clau
se 1
3.1 (a)
N/A
Clau
se 1
5.1 (a)
140,
799M
L
Clau
se 1
4.1 (a)
26,9
24M
L
Clau
se 1
1.1 (a)
N/A
Clau
se 1
4.1 (c)
18,0
99M
L
Clau
se 1
1.1 (a)
8,94
3ML
The
reta
il cor
pora
tions
’ sha
re o
f st
orag
e vo
lum
e at
30
June
201
3n/
aCl
ause
15.
1 (a)
428,
906M
L
n/a
Clau
se 1
5.1 (a)
754,
560M
L
Clau
se 1
4.1 (a)
29,5
47M
L
n/a
27,1
04M
L2113
,315
ML25
Volu
me
supp
lied
to p
rimar
y
entit
lemen
t hol
ders
Melb
ourn
e “P
ool”2
10,4
33M
L (W
este
rn W
ater
)0M
L(B
arw
on W
ater
)0M
L (W
este
rnpo
rt W
ater
)0M
L(S
outh
Gip
pslan
d W
ater
)
Clau
se 1
5.1 (a)
N/A
n/a
n/a
Clau
se 1
4.1 (a)
346M
L(G
ipps
land
Wat
er)
0ML
(Sou
ther
n Ru
ral W
ater
)
Clau
se 1
1.1
(a) 17
n/a
n/a

Annual Report 2012-13
Any
assig
nmen
t of w
ater
allo
catio
n or
te
mpo
rary
/per
man
ent t
rans
fers
of t
he
bulk
entit
lemen
t
n/a
Clau
se 1
5.1 (c)
Nil
Clau
se 1
3.1 (c)
Nil
Clau
se 1
5.1 (c)
Nil
Clau
se 1
4.1 (b)
Nil
Clau
se 1
1.1 (b)
Nil
Clau
se 1
4.1
(d)22
-25,
892M
LCl
ause
14.
1 (e)
Nil
Clau
se 1
1.1
(b)26
+4,3
72M
LCl
ause
11.
1 (c)
Nil
Any
tem
pora
ry o
r per
man
ent t
rans
fer
of th
e bu
lk en
titlem
ent w
hich
may
alte
r th
e flo
w in
the
wat
erw
ay
n/a
Clau
se 1
5.1 (d)
Nil
Clau
se 1
3.1 (d)
Nil
Clau
se 1
5.1 (d)
Nil
Clau
se 1
4.1 (a)
Nil
n/a
n/a
n/a
Any
amen
dmen
t to
the
bulk
entit
lemen
tn/
aCl
ause
15.
1 (e)
No
Clau
se 1
3.1 (e)
No
Clau
se 1
5.1 (e)
No10
Clau
se 1
4.1 (d)
No
Clau
se 1
1.1 (c)
No
Clau
se 1
4.1
(f) NoCl
ause
11.
1 (d)
No
Any
new
bul
k en
titlem
ent g
rant
ed to
th
e re
taile
rsn/
aCl
ause
15.
1 (f) Ni
lCl
ause
13.
1 (f)
Yes7
Clau
se 1
5.1
(f) Nil
Clau
se 1
4.1 (e)
Nil
Clau
se 1
1.1 (d)
Nil
Yes18
Yes23
Any
failu
res
to c
ompl
y w
ith a
ny
prov
ision
of t
he b
ulk
entit
lemen
tn/
aCl
ause
15.
1 (g)
Nil
Clau
se 1
3.1 (g)
Nil
Clau
se 1
5.1 (g)
Nil
Clau
se 1
4.1 (g)
Nil
Clau
se 1
1.1
(f) Nil
Clau
se 1
4.1 (g)
Nil
Clau
se 1
1.1 (e)
Nil
Any
diffic
ulty
exp
erien
ced
in c
ompl
ying
with
the
bulk
entit
lemen
t and
if s
o, a
ny
rem
edial
act
ion
take
n or
pro
pose
d
n/a
Clau
se 1
5.1 (h)
Nil
Clau
se 1
3.1 (h)
Nil
Clau
se 1
5.1 (h)
Nil
Clau
se 1
4.1 (h)
Nil
Clau
se 1
1.1 (g)
Nil
Clau
se 1
4.1 (h)
Nil
Clau
se 1
1.1
(f) Nil
82

83
Any
assig
nmen
t of w
ater
allo
catio
n or
te
mpo
rary
/per
man
ent t
rans
fers
of t
he
bulk
entit
lemen
t
n/a
Clau
se 1
5.1 (c)
Nil
Clau
se 1
3.1 (c)
Nil
Clau
se 1
5.1 (c)
Nil
Clau
se 1
4.1 (b)
Nil
Clau
se 1
1.1 (b)
Nil
Clau
se 1
4.1
(d)22
-25,
892M
LCl
ause
14.
1 (e)
Nil
Clau
se 1
1.1
(b)26
+4,3
72M
LCl
ause
11.
1 (c)
Nil
Any
tem
pora
ry o
r per
man
ent t
rans
fer
of th
e bu
lk en
titlem
ent w
hich
may
alte
r th
e flo
w in
the
wat
erw
ay
n/a
Clau
se 1
5.1 (d)
Nil
Clau
se 1
3.1 (d)
Nil
Clau
se 1
5.1 (d)
Nil
Clau
se 1
4.1 (a)
Nil
n/a
n/a
n/a
Any
amen
dmen
t to
the
bulk
entit
lemen
tn/
aCl
ause
15.
1 (e)
No
Clau
se 1
3.1 (e)
No
Clau
se 1
5.1 (e)
No10
Clau
se 1
4.1 (d)
No
Clau
se 1
1.1 (c)
No
Clau
se 1
4.1
(f) NoCl
ause
11.
1 (d)
No
Any
new
bul
k en
titlem
ent g
rant
ed to
th
e re
taile
rsn/
aCl
ause
15.
1 (f) Ni
lCl
ause
13.
1 (f)
Yes7
Clau
se 1
5.1
(f) Nil
Clau
se 1
4.1 (e)
Nil
Clau
se 1
1.1 (d)
Nil
Yes18
Yes23
Any
failu
res
to c
ompl
y w
ith a
ny
prov
ision
of t
he b
ulk
entit
lemen
tn/
aCl
ause
15.
1 (g)
Nil
Clau
se 1
3.1 (g)
Nil
Clau
se 1
5.1 (g)
Nil
Clau
se 1
4.1 (g)
Nil
Clau
se 1
1.1
(f) Nil
Clau
se 1
4.1 (g)
Nil
Clau
se 1
1.1 (e)
Nil
Any
diffic
ulty
exp
erien
ced
in c
ompl
ying
with
the
bulk
entit
lemen
t and
if s
o, a
ny
rem
edial
act
ion
take
n or
pro
pose
d
n/a
Clau
se 1
5.1 (h)
Nil
Clau
se 1
3.1 (h)
Nil
Clau
se 1
5.1 (h)
Nil
Clau
se 1
4.1 (h)
Nil
Clau
se 1
1.1 (g)
Nil
Clau
se 1
4.1 (h)
Nil
Clau
se 1
1.1
(f) Nil
Appendix 3 – Bulk Water Entitlement Reporting (continued)
Notes for compliance with bulk entitlementsCombined yarra River, Silver and Wallaby Creeks, Thomson River
1. Compliance with the long term average diversion limit of 555,000ML is assessed using a 15 year rolling average annual diversion.
2. The supply of water to Primary Entitlement Holders is obligated under the Victorian Desalination Project bulk entitlements, via water sourced from the Melbourne “pool” of all Melbourne’s bulk entitlement sources.
yarra River
3. The retail corporations hold the following bulk entitlements on the Yarra River:
• Bulk Entitlement (Yarra River – Melbourne Water for City West Water Limited) Conversion Order 2006 – BEE049364
• Bulk Entitlement (Yarra River – Melbourne Water for South East Water Limited) Conversion Order 2006 – BEE049363
• Bulk Entitlement (Yarra River – Melbourne Water for Yarra Valley Water Limited) Conversion Order 2006 – BEE049362
4. Compliance with the long term average diversion limit of 400,000ML is assessed using a 15 year rolling average annual diversion.
Silver and Wallaby Creeks
5. The retail corporations hold the following bulk entitlements on the Silver and Wallaby Creeks:
• Bulk Entitlement (Silver & Wallaby Creeks – Melbourne Water for City West Water Limited) Conversion Order 2006 – BEE049475
• Bulk Entitlement (Silver & Wallaby Creeks – Melbourne Water for South East Water Limited) Conversion Order 2006 – BEE049474
• Bulk Entitlement (Silver & Wallaby Creeks – Melbourne Water for Yarra Valley Water Limited) Conversion Order 2006 – BEE049473
6. Compliance with the 3-year total diversion limit of 66,000ML is assessed using a 3 year rolling total diversion.
7. The retail corporations received new bulk entitlements on 2 July 2013 in the Goulburn System as a result of the investments made in the Goulburn-Murray Water Connections Project.
Thomson River
8. The retail corporations hold the following bulk entitlements on the Thomson River:
• Transfer of Bulk Entitlement (Thomson River – Melbourne Water Corporation) Conversion Order 2001 to City West Water Limited 2006 – BEE049361
• Transfer of Bulk Entitlement (Thomson River – Melbourne Water Corporation) Conversion Order 2001 to South East Water Limited 2006 – BEE049360
• Transfer of Bulk Entitlement (Thomson River – Melbourne Water Corporation) Conversion Order 2001 to Yarra Valley Water Limited 2006 – BEE049359
9. Compliance with the long term average diversion limit of 171,800ML is assessed using a 15 year rolling average annual diversion.
10. On 12 May 2013, the Minister for Water amended the Bulk Entitlement (Thomson River – Environment) Order 2005, to provide changes to passing flow obligations. These changes were noted by the retail water corporations and Melbourne Water.
Tarago and Bunyip Rivers
11. The retail corporations hold the following bulk entitlements on the Tarago and Bunyip Rivers:
• Bulk Entitlement (Tarago and Bunyip Rivers – Melbourne Water for City West Water Limited) Conversion Order 2009 – BEE049358
• Bulk Entitlement (Tarago and Bunyip Rivers – Melbourne Water for South East Water Limited) Conversion Order 2009 – BEE049357
• Bulk Entitlement (Tarago and Bunyip Rivers – Melbourne Water for Yarra Valley Water Limited) Conversion Order 2009 – BEE049356
12. Compliance with the Tarago River long term average diversion limit of 24,950ML is assessed using a 5 year rolling average annual diversion.
13. Compliance with the Bunyip River long term average diversion limit of 5560ML is assessed using a 5 year rolling average annual diversion.

Annual Report 2012-13
Victorian Desalination Project
14. The retail corporations hold the following bulk entitlements to the Victorian Desalination Project:
• Bulk Entitlement (Desalinated Water – City West Water Limited) Order 2010 – BEE050814
• Bulk Entitlement (Desalinated Water – South East Water Limited) Order 2010 – BEE050815
• Bulk Entitlement (Desalinated Water – Yarra Valley Water Limited) Order 2010 – BEE050816
15. On 1 April 2012, the Minister for Water made a zero desalinated water order for the 2012-13 year.
16. 24,850ML was transferred to Cardinia Reservoir for commissioning of the Victorian Desalination Plant. This is not considered to be water taken under the bulk entitlement.
17. As the primary entitlement holders are supplied from the Melbourne “pool”, this is reported under Note 2 of the combined Yarra River, Silver and Wallaby Creeks and Thomson River.
Goulburn System
18. The retail corporations hold the following bulk entitlements to the Goulburn System:
• Bulk Entitlement (Goulburn System – City West Water) Order 2012 – BEE049478
• Bulk Entitlement (Goulburn System – South East Water) Order 2012 – BEE049477
• Bulk Entitlement (Goulburn System – Yarra Valley Water) Order 2012 – BEE049476
19. The retail corporations were granted bulk entitlements to the Goulburn System on 2 July 2012.
20. 18ML of was used to maintain the operational capacity of the North-South Pipeline and keep the pipeline charged for fire fighting purposes, as allowed under clause 9.1(c) of the retail corporations’ Statements of Obligations (System Management).
21. The retail corporations had 16,682ML deducted from their 30 June 2012 volumes as a result of carry over rules and spillable water account spill losses during 2012-13.
22. The retail corporations have in place water management strategies to manage water allocation holdings in the River Murray and Goulburn System to maximise the value of the resources held to their customers and minimise risk of spilling water allocation. These strategies include the transfer of allocations between bulk entitlement allocation bank accounts and trading allocations.
River Murray
23. The retail corporations hold the following bulk entitlements to the River Murray:
• Bulk Entitlement (River Murray – City West Water) Order 2012 – BEE049481
• Bulk Entitlement (River Murray – South East Water) Order 2012 – BEE049480
• Bulk Entitlement (River Murray – Yarra Valley Water) Order 2012 - BEE 049479
24. The retail corporations were granted bulk entitlements to the River Murray on 2 July 2012.
25. The retail corporations had 0ML deducted from their 30 June 2012 volumes as a result of carry over rules and spillable water account spill losses during 2012-13.
26. The retail corporations have in place water management strategies to manage water allocations holdings in the River Murray and Goulburn System to maximise the value of the resources held to their customers and minimise risk of spilling water allocation. These strategies include the transfer of allocations between bulk entitlement allocation bank accounts and trading allocations.
Appendix 3 – Bulk Water Entitlement Reporting (continued)
84

85

Printed on recycled paper
City West Water ABN 70 066 902 467 247-251 St Albans Road Locked Bag 350 Sunshine Vic 3020
Account and general enquiries: 131 691 Faults and emergencies: 132 642 Interpreter service: 131 450 Internet: citywestwater.com.au Email: [email protected]