for the recognition and valorization of organic wines by
TRANSCRIPT

foods
Article
Off-Flavours and Unpleasantness Are Cuesfor the Recognition and Valorization of OrganicWines by Experienced Tasters
Mylena Romano 1, Mahesh Chandra 1 , Mkrtich Harutunyan 1, Taciana Savian 2,Cristian Villegas 2, Valéria Minim 3 and Manuel Malfeito-Ferreira 1,*
1 Linking Landscape Environment Agriculture and Food (LEAF) Research Center,Instituto Superior de Agronomia, Universidade de Lisboa, Tapada da Ajuda, 1349-017 Lisboa, Portugal;[email protected] (M.R.); [email protected] (M.C.);[email protected] (M.H.)
2 Department of Exact Sciences, College of Agriculture Luiz de Queiroz, University of São Paulo,13418-900 São Paulo, Brazil; [email protected] (T.S.); [email protected] (C.V.)
3 Department of Food Technology, Federal University of Viçosa, Av. P.H. Rolfs, s/n,36570-900 Viçosa, MG, Brazil; [email protected]
* Correspondence: [email protected]
Received: 21 December 2019; Accepted: 17 January 2020; Published: 19 January 2020�����������������
Abstract: The drivers of consumer acceptance concerning organic wines are not well understood.In particular, among wine professionals, there are anecdotal evidences claiming that consumersaccept off-flavours that would not be tolerated if the wines were conventionally produced. Therefore,the aim of this study was to shed further light on this issue by tasting blind wines of both typesof production using a tasting panel comprised by experienced individuals of several nationalities.The tasted wines were both conventional and organic and were with and without off-flavours.The same wines were evaluated in three tasting sessions where the given information was: (1) allwines were conventional, (2) all wines were organic, and (3) tasters were asked to guess the mode ofproduction. A group of untrained tasters also rated the same organic wines in an informed session.The results showed that wines were significantly better scored and were given a higher willingnessto pay value in the “organic” session. In addition, the experienced tasting panel produced a list ofthe most frequent sensory descriptors. When tasters were asked to guess the mode of production,wines that were supposed to be organic received a higher citation of off-flavours, such as “oxidized”,“reductive”, and “animal/undergrowth”. Moreover, an overall emotional response of unpleasantnesswas associated with the recognition of organic wines in the “guess” session. Untrained tasters rated thesame organic wines with lower liking scores and were willing to pay less. In conclusion, off-flavoursand their unpleasantness worked as a cue to identify wines supposed to be organic by experiencedtasters. Their corresponding higher valorization could be explained by the psychological halo effectinduced by the organic label. Contrarily, consumers did not show this halo effect, depreciating wineswith unpleasant flavours irrespective of their mode of production.
Keywords: organic wines; liking; willingness to pay; off-flavours; halo effect
1. Introduction
In recent years, consumers have become increasingly concerned about the effects of conventionalagricultural production practices on both human and environmental health. Many agribusinesseshave responded to these concerns, attracting customers by differentiating their products in crowdedmarketplaces [1,2]. The growing demand for environmentally sustainable products has created a boom
Foods 2020, 9, 105; doi:10.3390/foods9010105 www.mdpi.com/journal/foods

Foods 2020, 9, 105 2 of 13
in the field of green products mainly in developed countries [3,4]. Schäufele and Hamm [5] studied theconsumers’ perceptions, preferences, and willingness to pay for wine with sustainability characteristics.The results suggested that producing and marketing wine with sustainability characteristics isa promising strategy for quality differentiation, particularly for wine that is both local and organic.
Among wine professionals, there is empirical evidence suggesting that the image of organicproducts has a stronger effect on consumer perception than the intrinsic characteristics [6]. The so-calledhalo or blurring effect can modify the sensory perception of products in terms of a positive imagefor organic and origin labelled food products and a negative one for more conventional products.In fact, Pagliarini et al. [7] found that consumers were not able to distinguish between organic andconventional wines in a blind tasting. Consumers preferred organic wine only in an informed situation.This indicates that the higher willingness to pay for organic wine may be due to consumers’ specificattitudes and involvement in sustainability issues. Furthermore, Wiedmann et al. [8] also showedthat information about health, safety, and environmental issues increased consumers’ evaluationof organic wine. This halo effect received another piece of supporting evidence from the workof Apaolaza et al. [9] who found that when the wine was labeled organic, the same wine was perceivedas having a finer, more intense, more floral and pleasurable fruity aroma, as well as a smoother textureand better body. This bias on hedonic evaluation and intention of purchase was totally mediatedby increases in sensory ratings and perceived healthiness, providing a psychological or emotionalexplanation for this effect. Overall, these works [7–9] indicate that organic wines, in comparisonwith conventional ones, were associated with a higher quality and that a halo effect stemmed fromstorytelling, regardless of consumer knowledge and attitude towards organic products.
The research performed so far resulted from the responses of consumers with different wineknowledge and tasting wines without apparent off-flavours. As far as we are aware, there are noreports on the preference for organic wines with aromatic flaws using highly skilled wine tasterspresumably more suited to detecting sensory differences between wines produced by both conventionaland organic processes. Therefore, the aim of the present work was to evaluate the liking, willingness topay and the sensory descriptors of organic wines using assessors with a high degree of wine knowledgeand tasting training.
2. Materials and Methods
2.1. Tasting Panel Selection and Tasting Conditions
The tasters were students of the first and second year of the Vinifera EuroMaster of Viticulture andOenology, held in Montpellier and in Lisbon, sharing a common descriptive language and knowledgeof wines. A total of 48 students residing in Lisbon were recruited based on their interest and availability.Another panel was constituted by 47 untrained tasters recruited from faculty staff and other students.All subjects gave their informed consent for inclusion before they participated in the study.
The tastings took place in a sensory classroom of the Instituto Superior de Agronomia, in Lisbon,Portugal. The wines (30 mL) were poured into odour-free INAO-approved wine glasses withappropriate and constant temperatures (10 ◦C for whites and 18 ◦C for reds). The glasses were labelledwith 3-digit codes and were covered by plastic Petri dishes, and the wine sequence was balanced amongtasters. Once the first glass was tasted and the panelist moved to the second one and was not allowedto come back to the first glass. The white wines were tasted before the red wines. Between each sample,the panelists were instructed to eat unsalted crackers and cleanse their mouth with mineral water.
2.2. Tasting Sessions
The wines were tasted blind during three sessions in November and December 2018. The consumersession took place in February 2019. In the first session, tasters were informed that they were tasting“conventional wines” and in the second session the information changed to “organic wines”. In the

Foods 2020, 9, 105 3 of 13
third session, assessors were asked to guess the mode of production. Unexperienced tasters wereinformed about the organic nature of the wines during their session.
The wines are listed in Table 1 and were chosen according to their different sensory characteristicsevaluated by 3 experts not participating in the study. Wines CB2016 and CT2015 represented organicwines with clean flavours, whereas the other 4 organic wines had different noticeable off-flavours.The conventional Burgundy wines (CC2013 and PN2015) were included as prototypes of classicalEuropean wines that are recognised as having initial off-flavours that disappear after leaving themto breathe [10]. Additional 4 conventional wines were included in the two first sessions to serveas distractors.
Table 1. Wine description.
Wine Colour Reference GrapeVariety Vintage Region a Production Method
White CB2016 Síria 2016 DOC Beira Interior OrganicSB2016 Blend 2016 Portugal OrganicVB2015 Blend 2015 Portugal Organic (not certified)CC2013 Chardonnay 2013 Chablis 1er Cru Conventional
Red CT2015 Blend 2015 DOC Beira Interior OrganicST2012 Blend 2012 Portugal OrganicST2014 Blend 2014 Portugal OrganicPN2015 Pinot Noir 2015 AOC Bourgogne Conventional
a DOC: controlled designation of origin; AOC: appellation d’origine contrôlé.
2.3. Tasting Questionnaire
The tasting sheet given to each individual included liking, familiarity scales, the willingness topay (WTP) range, and a free sensory description list. The liking was determined using a Likert scalewith the labels Dislike Very Much (1), Dislike (2), Neither Like nor Dislike (3), Like (4), and Like veryMuch (5). The participants were also asked to rate their familiarity from 1 (“I am not familiar with thiswine”) to 5 (“I am familiar with this wine”). The WTP was calculated using the ranges 0–5, 5–10, 10–20,20–30 €, >30 €, respectively. The average price was calculated by the sum of the product betweenthe midpoint (arithmetic mean between the lower and upper bounds) of each class by the absolutefrequency of the same class, divided by the sum of the frequencies.
Flavour descriptors were gathered according to similarity, and a frequency of citation was obtainedfollowing a free-choice profiling protocol [11], which assumed that panelists had previous commontraining [12].
2.4. Statistical Analysis
To compare the sensory acceptability, familiarity, and willingness to pay between the tastingsessions, a non-parametric pairwise Wilcoxon test was performed to determine whether twoindependent samples come from populations with the same distribution when the samples areindependent and when measurements can be sorted on an ordinal scale [13]. The test was developedunder the null hypothesis that the two samples have the same distribution at a significance level (α) of5%, which is the probability of rejecting the null hypothesis when it is true. The forcefulness of thenull hypothesis can be determined by calculating the p-value, which, when smaller than the chosensignificance level, rejects the null hypothesis. The difference between the frequencies of descriptors’citation was performed by a Pearson’s chi-squared test. The chi-squared statistic measures the differencebetween the actual counts and the expected counts (assuming validity of the null hypothesis that thecategories are independent of one another in a significance level of 5%) [14]. All the statistical analysiswas performed using R (https://www.r-project.org/).
Foods 2020, 9, 105 4 of 13
3. Results
3.1. Tasting Panel Characterization
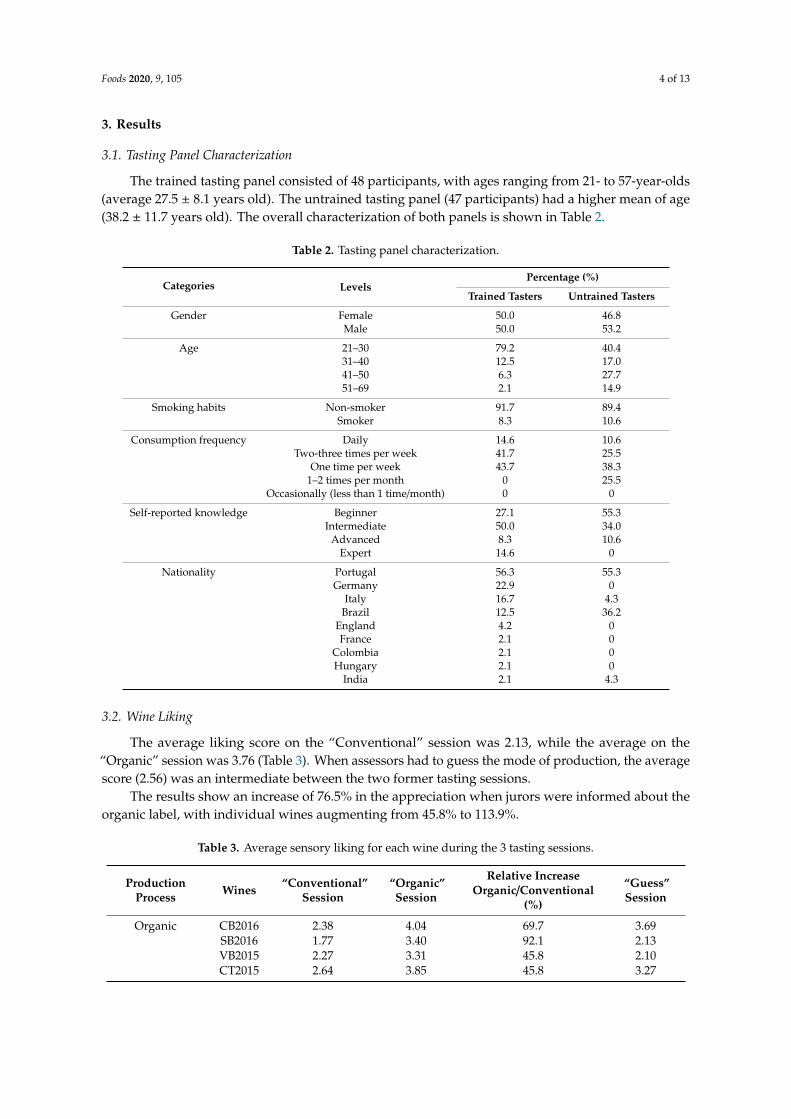
The trained tasting panel consisted of 48 participants, with ages ranging from 21- to 57-year-olds(average 27.5 ± 8.1 years old). The untrained tasting panel (47 participants) had a higher mean of age(38.2 ± 11.7 years old). The overall characterization of both panels is shown in Table 2.
Table 2. Tasting panel characterization.
Categories LevelsPercentage (%)
Trained Tasters Untrained Tasters
Gender Female 50.0 46.8Male 50.0 53.2
Age 21–30 79.2 40.431–40 12.5 17.041–50 6.3 27.751–69 2.1 14.9
Smoking habits Non-smoker 91.7 89.4Smoker 8.3 10.6
Consumption frequency Daily 14.6 10.6Two-three times per week 41.7 25.5
One time per week 43.7 38.31–2 times per month 0 25.5
Occasionally (less than 1 time/month) 0 0
Self-reported knowledge Beginner 27.1 55.3Intermediate 50.0 34.0
Advanced 8.3 10.6Expert 14.6 0
Nationality Portugal 56.3 55.3Germany 22.9 0
Italy 16.7 4.3Brazil 12.5 36.2
England 4.2 0France 2.1 0
Colombia 2.1 0Hungary 2.1 0
India 2.1 4.3
3.2. Wine Liking
The average liking score on the “Conventional” session was 2.13, while the average on the“Organic” session was 3.76 (Table 3). When assessors had to guess the mode of production, the averagescore (2.56) was an intermediate between the two former tasting sessions.
The results show an increase of 76.5% in the appreciation when jurors were informed about theorganic label, with individual wines augmenting from 45.8% to 113.9%.
Table 3. Average sensory liking for each wine during the 3 tasting sessions.
ProductionProcess Wines “Conventional”
Session“Organic”Session
Relative IncreaseOrganic/Conventional
(%)
“Guess”Session
Organic CB2016 2.38 4.04 69.7 3.69SB2016 1.77 3.40 92.1 2.13VB2015 2.27 3.31 45.8 2.10CT2015 2.64 3.85 45.8 3.27

Foods 2020, 9, 105 5 of 13
Table 3. Cont.
ProductionProcess Wines “Conventional”
Session“Organic”Session
Relative IncreaseOrganic/Conventional
(%)
“Guess”Session
ST2012 1.73 3.48 101.1 2.19ST2014 2.14 3.65 70.6 2.15
Conventional CC2013 1.94 4.15 113.9 2.58PN2015 2.15 4.21 95.8 2.52
Average - 2.13 3.76 76.5 2.56
3.3. Wine Familiarity
The reported wine familiarity is shown in Table 4. Jurors revealed different familiarities accordingto the given session information. There was a tendency to increase from the first to the second session,revealing that the organic label induced an increase in familiarity. However, this difference was onlyobserved for the wines CB2016, CR2015, and ST2012. The guess session yielded intermediate results.
Table 4. Average of familiarity for each wine during the 3 tasting sessions.
ProductionProcess Wines “Conventional”
Session“Organic”Session p-Value “Guess”
Session
Organic CB2016 3.08 3.42 0.1 3.42SB2016 2.10 2.50 0.009 2.25VB2015 2.02 2.46 0.009 2.10CT2015 2.83 2.98 0.2 3.10ST2012 2.56 2.73 0.2 2.60ST2014 2.57 2.88 0.04 2.42
Conventional CC2013 2.25 2.85 0.002 2.71PN2015 2.65 3.21 0.003 2.56
3.4. Willingness to Pay (WTP)
The average WTP on the “Conventional” session was 4.44, which increased to 8.29 in the “Organic”session (Table 5). The “guess” session yielded intermediate values. All wines increased significantlyfrom the first to the second tasting session (p < 0.05). In particular, the two Burgundy wines showedthe highest relative increases in the “organic” session.
Table 5. Average willingness to pay (€) for each wine during the 3 tasting sessions.
ProductionProcess Wines “Conventional”
Session“Organic”Session
Relative IncreaseOrganic/Conventional
(%)
“Guess”Session
Organic CB2016 4.23 8.49 100.7 6.88SB2016 3.65 8.07 121.1 4.48VB2015 4.27 6.15 44.0 3.75CT2015 6.25 8.23 31.7 6.46ST2012 3.85 6.78 76.1 4.48ST2014 4.01 6.77 68.8 4.32
Conventional CC2013 4.32 10.21 136.3 6.35PN2015 4.90 11.61 136.9 4.95
Average - 4.44 8.29 86.7 5.20
Foods 2020, 9, 105 6 of 13
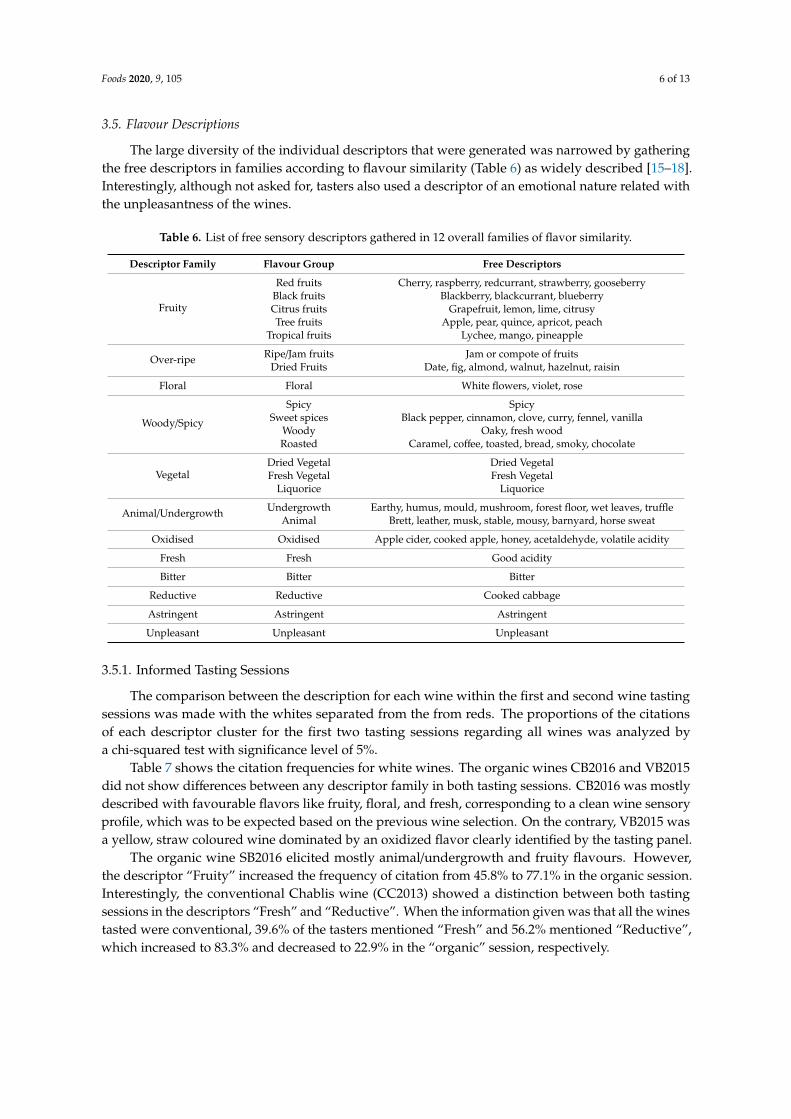
3.5. Flavour Descriptions
The large diversity of the individual descriptors that were generated was narrowed by gatheringthe free descriptors in families according to flavour similarity (Table 6) as widely described [15–18].Interestingly, although not asked for, tasters also used a descriptor of an emotional nature related withthe unpleasantness of the wines.
Table 6. List of free sensory descriptors gathered in 12 overall families of flavor similarity.
Descriptor Family Flavour Group Free Descriptors
Fruity
Red fruits Cherry, raspberry, redcurrant, strawberry, gooseberryBlack fruits Blackberry, blackcurrant, blueberryCitrus fruits Grapefruit, lemon, lime, citrusyTree fruits Apple, pear, quince, apricot, peach
Tropical fruits Lychee, mango, pineapple
Over-ripe Ripe/Jam fruits Jam or compote of fruitsDried Fruits Date, fig, almond, walnut, hazelnut, raisin
Floral Floral White flowers, violet, rose
Woody/Spicy
Spicy SpicySweet spices Black pepper, cinnamon, clove, curry, fennel, vanilla
Woody Oaky, fresh woodRoasted Caramel, coffee, toasted, bread, smoky, chocolate
VegetalDried Vegetal Dried VegetalFresh Vegetal Fresh Vegetal
Liquorice Liquorice
Animal/Undergrowth Undergrowth Earthy, humus, mould, mushroom, forest floor, wet leaves, truffleAnimal Brett, leather, musk, stable, mousy, barnyard, horse sweat
Oxidised Oxidised Apple cider, cooked apple, honey, acetaldehyde, volatile acidity
Fresh Fresh Good acidity
Bitter Bitter Bitter
Reductive Reductive Cooked cabbage
Astringent Astringent Astringent
Unpleasant Unpleasant Unpleasant
3.5.1. Informed Tasting Sessions
The comparison between the description for each wine within the first and second wine tastingsessions was made with the whites separated from the from reds. The proportions of the citationsof each descriptor cluster for the first two tasting sessions regarding all wines was analyzed bya chi-squared test with significance level of 5%.
Table 7 shows the citation frequencies for white wines. The organic wines CB2016 and VB2015did not show differences between any descriptor family in both tasting sessions. CB2016 was mostlydescribed with favourable flavors like fruity, floral, and fresh, corresponding to a clean wine sensoryprofile, which was to be expected based on the previous wine selection. On the contrary, VB2015 wasa yellow, straw coloured wine dominated by an oxidized flavor clearly identified by the tasting panel.
The organic wine SB2016 elicited mostly animal/undergrowth and fruity flavours. However,the descriptor “Fruity” increased the frequency of citation from 45.8% to 77.1% in the organic session.Interestingly, the conventional Chablis wine (CC2013) showed a distinction between both tastingsessions in the descriptors “Fresh” and “Reductive”. When the information given was that all the winestasted were conventional, 39.6% of the tasters mentioned “Fresh” and 56.2% mentioned “Reductive”,which increased to 83.3% and decreased to 22.9% in the “organic” session, respectively.

Foods 2020, 9, 105 7 of 13
Table 7. Frequency of citation for each sensory descriptor elicited by white wines during “Conventional” and “Organic” tasting sessions *.
Descriptors CB2016 SB2016 VO2015 CC2013
Conventional Organic Conventional Organic Conventional Organic Conventional Organic
Fruity 87.5 a 97.9 a 45.8 a 77.1 b 33.3 a 52.1 a 70.8 a 81.3 a
Floral 52.1 a 31.3 a 27.1 a 27.1 a 2.1 a 0.0 a 10.4 a 8.3 a
Oxidised 18.7 a 14.6 a 20.8 a 18.8 a 87.5 a 97.9 a 4.2 a 2.1 a
Reductive 0.0 a 0.0 a 0.0 a 6.3 a 0.0 a 0.0 a 56.3 a 22.9 b
Animal/Undergrowth 0.0 a 0.0 a 56.3 a 47.9 a 2.1 a 0.0 a 25.0 a 16.7 a
Woody/Spicy 14.6 a 12.5 a 31.3 a 16.7 a 29.2 a 33.3 a 16.7 a 31.3 a
Over-ripe fruits 8.3 a 0.0 a 2.1 a 0.0 a 35.4 a 35.4 a 0.0 a 2.1 a
Vegetal 0.0 a 0.0 a 10.4 a 22.9 a 0.0 a 2.1 a 4.2 a 2.1 a
Fresh 66.7 a 70.8 a 29.2 a 39.6 a 10.4 a 4.2 a 39.6 a 83.3 b
Bitter 6.3 a 4.2 a 16.7 a 8.3 a 18.8 a 6.3 a 0.0 a 0.0 a
Astringent 2.1 a 2.1 a 0.0 a 0.0 a 4.2 a 2.1 a 0.0 a 0.0 a
* Numbers followed by the same letter in a row are not significantly different.
Foods 2020, 9, 105 8 of 13
Overall, these results indicate that when wines were clearly clean (CB2016) or clearly faulty(VB2015), the description did not change according to the given information. When wines sharedpositive and negative flavours (SB2016 and CC2013), the organic label induced an increase the positivedescriptors (“Fresh”) and/or a decrease in the negative descriptors as (“Reductive”).
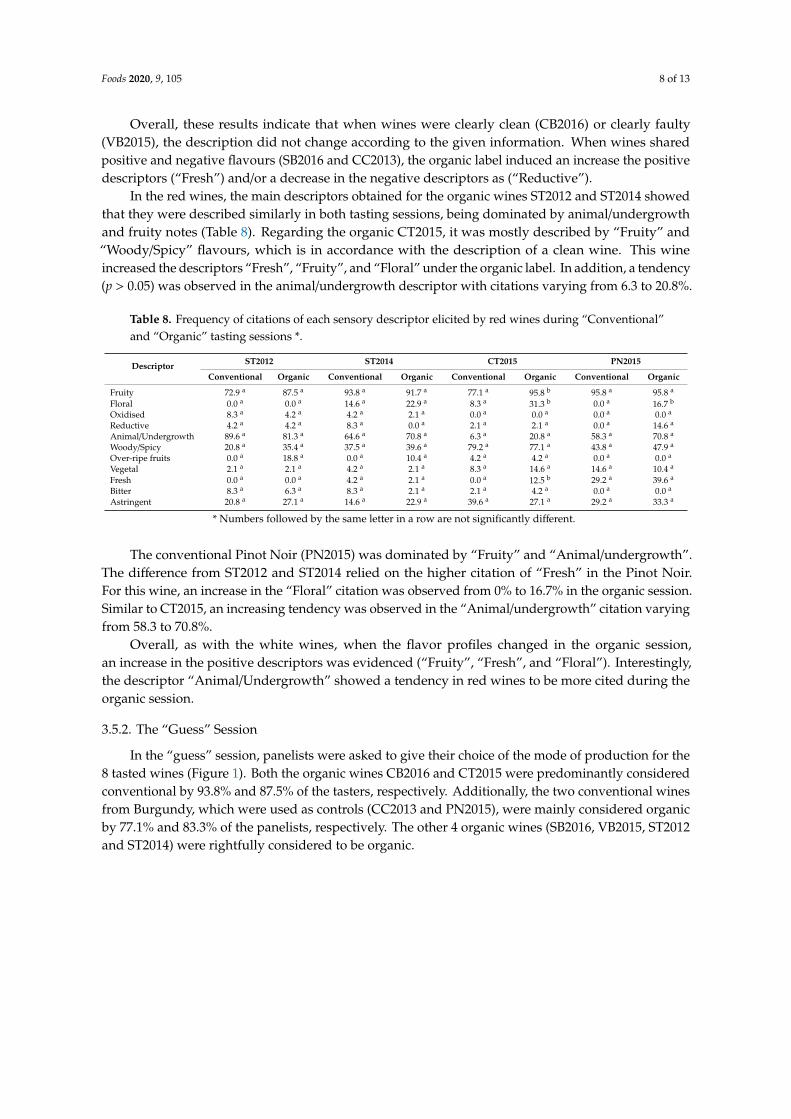
In the red wines, the main descriptors obtained for the organic wines ST2012 and ST2014 showedthat they were described similarly in both tasting sessions, being dominated by animal/undergrowthand fruity notes (Table 8). Regarding the organic CT2015, it was mostly described by “Fruity” and“Woody/Spicy” flavours, which is in accordance with the description of a clean wine. This wineincreased the descriptors “Fresh”, “Fruity”, and “Floral” under the organic label. In addition, a tendency(p > 0.05) was observed in the animal/undergrowth descriptor with citations varying from 6.3 to 20.8%.
Table 8. Frequency of citations of each sensory descriptor elicited by red wines during “Conventional”and “Organic” tasting sessions *.
Descriptor ST2012 ST2014 CT2015 PN2015
Conventional Organic Conventional Organic Conventional Organic Conventional Organic
Fruity 72.9 a 87.5 a 93.8 a 91.7 a 77.1 a 95.8 b 95.8 a 95.8 a
Floral 0.0 a 0.0 a 14.6 a 22.9 a 8.3 a 31.3 b 0.0 a 16.7 b
Oxidised 8.3 a 4.2 a 4.2 a 2.1 a 0.0 a 0.0 a 0.0 a 0.0 a
Reductive 4.2 a 4.2 a 8.3 a 0.0 a 2.1 a 2.1 a 0.0 a 14.6 a
Animal/Undergrowth 89.6 a 81.3 a 64.6 a 70.8 a 6.3 a 20.8 a 58.3 a 70.8 a
Woody/Spicy 20.8 a 35.4 a 37.5 a 39.6 a 79.2 a 77.1 a 43.8 a 47.9 a
Over-ripe fruits 0.0 a 18.8 a 0.0 a 10.4 a 4.2 a 4.2 a 0.0 a 0.0 a
Vegetal 2.1 a 2.1 a 4.2 a 2.1 a 8.3 a 14.6 a 14.6 a 10.4 a
Fresh 0.0 a 0.0 a 4.2 a 2.1 a 0.0 a 12.5 b 29.2 a 39.6 a
Bitter 8.3 a 6.3 a 8.3 a 2.1 a 2.1 a 4.2 a 0.0 a 0.0 a
Astringent 20.8 a 27.1 a 14.6 a 22.9 a 39.6 a 27.1 a 29.2 a 33.3 a
* Numbers followed by the same letter in a row are not significantly different.
The conventional Pinot Noir (PN2015) was dominated by “Fruity” and “Animal/undergrowth”.The difference from ST2012 and ST2014 relied on the higher citation of “Fresh” in the Pinot Noir.For this wine, an increase in the “Floral” citation was observed from 0% to 16.7% in the organic session.Similar to CT2015, an increasing tendency was observed in the “Animal/undergrowth” citation varyingfrom 58.3 to 70.8%.
Overall, as with the white wines, when the flavor profiles changed in the organic session,an increase in the positive descriptors was evidenced (“Fruity”, “Fresh”, and “Floral”). Interestingly,the descriptor “Animal/Undergrowth” showed a tendency in red wines to be more cited during theorganic session.
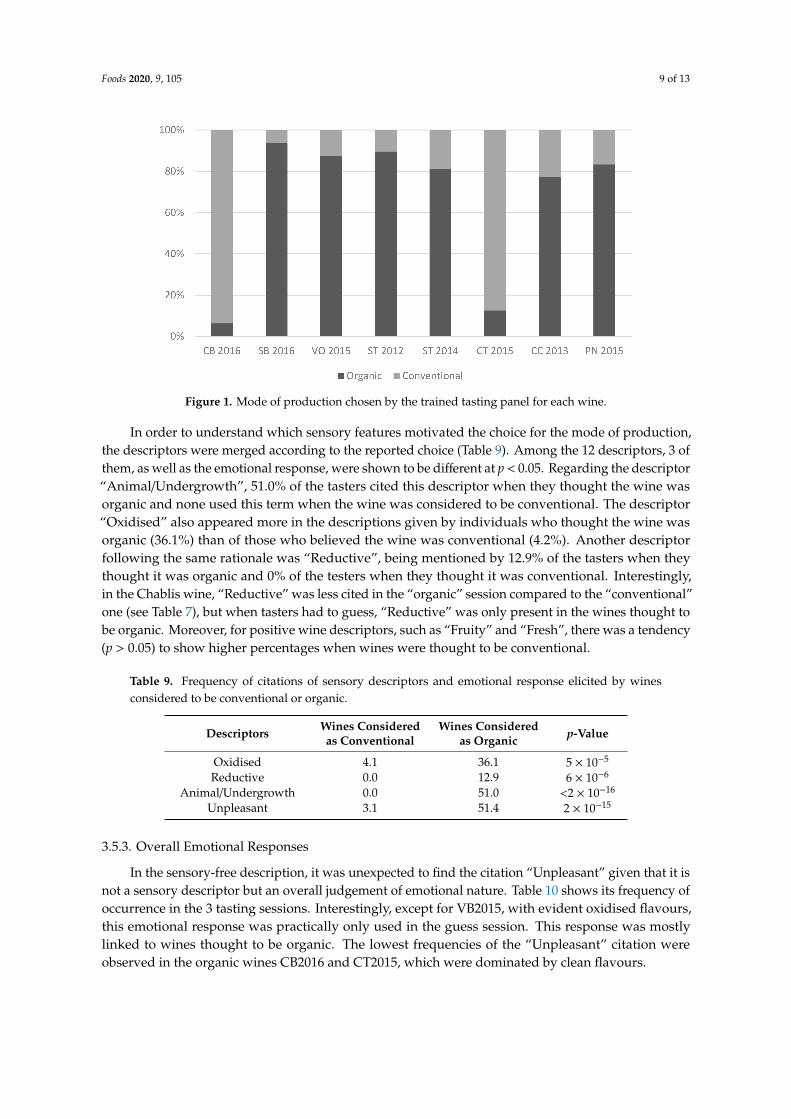
3.5.2. The “Guess” Session
In the “guess” session, panelists were asked to give their choice of the mode of production for the8 tasted wines (Figure 1). Both the organic wines CB2016 and CT2015 were predominantly consideredconventional by 93.8% and 87.5% of the tasters, respectively. Additionally, the two conventional winesfrom Burgundy, which were used as controls (CC2013 and PN2015), were mainly considered organicby 77.1% and 83.3% of the panelists, respectively. The other 4 organic wines (SB2016, VB2015, ST2012and ST2014) were rightfully considered to be organic.
Foods 2020, 9, 105 9 of 13
Figure 1. Mode of production chosen by the trained tasting panel for each wine.
In order to understand which sensory features motivated the choice for the mode of production,the descriptors were merged according to the reported choice (Table 9). Among the 12 descriptors, 3 ofthem, as well as the emotional response, were shown to be different at p < 0.05. Regarding the descriptor“Animal/Undergrowth”, 51.0% of the tasters cited this descriptor when they thought the wine wasorganic and none used this term when the wine was considered to be conventional. The descriptor“Oxidised” also appeared more in the descriptions given by individuals who thought the wine wasorganic (36.1%) than of those who believed the wine was conventional (4.2%). Another descriptorfollowing the same rationale was “Reductive”, being mentioned by 12.9% of the tasters when theythought it was organic and 0% of the testers when they thought it was conventional. Interestingly,in the Chablis wine, “Reductive” was less cited in the “organic” session compared to the “conventional”one (see Table 7), but when tasters had to guess, “Reductive” was only present in the wines thought tobe organic. Moreover, for positive wine descriptors, such as “Fruity” and “Fresh”, there was a tendency(p > 0.05) to show higher percentages when wines were thought to be conventional.
Table 9. Frequency of citations of sensory descriptors and emotional response elicited by winesconsidered to be conventional or organic.
Descriptors Wines Consideredas Conventional
Wines Consideredas Organic p-Value
Oxidised 4.1 36.1 5 × 10⁻⁵
Reductive 0.0 12.9 6 × 10⁻⁶
Animal/Undergrowth 0.0 51.0 <2 × 10⁻¹⁶
Unpleasant 3.1 51.4 2 × 10⁻¹⁵
3.5.3. Overall Emotional Responses
In the sensory-free description, it was unexpected to find the citation “Unpleasant” given that it isnot a sensory descriptor but an overall judgement of emotional nature. Table 10 shows its frequency ofoccurrence in the 3 tasting sessions. Interestingly, except for VB2015, with evident oxidised flavours,this emotional response was practically only used in the guess session. This response was mostlylinked to wines thought to be organic. The lowest frequencies of the “Unpleasant” citation wereobserved in the organic wines CB2016 and CT2015, which were dominated by clean flavours.

Foods 2020, 9, 105 10 of 13
Table 10. Percentage of citation of the emotional descriptor “Unpleasant” on each wine tasting sessionfor each wine *.
ProductionProcess Wines “Conventional”
Session“Organic”Session
“Guess”Session
Organic CB2016 00.0 a 00.0 a 04.2 a
SB2016 00.0 b 00.0 b 33.3 a
VB2015 22.9 b 10.4 b 45.8 a
CT2015 00.0 a 02.1 a 02.1 a
ST2012 00.0 b 00.0 b 47.9 a
ST2014 00.0 b 00.0 b 39.6 a
ConventionalCC2013 00.0 b 02.1 b 47.9 a
PN2015 00.0 b 00.0 b 47.9 a
* Numbers followed by the same letter in a row are not significantly different.
The responses given in the guess session may be considered as the psychological construct ofa wine supposed to be organic wine by trained and knowledgeable tasters. Gathering the flavourdescriptions and the emotional responses for white (Figure 2) and red wines (Figure 3) in a wordcloud (font size according to frequency of occurrence) it becomes evident what may be regarded as theflavour and emotional profile expected to characterize organic wines for an experienced cohort.
Figure 2. Word cloud of the descriptors elicited by the white wines considered to be organic (SB2016,VB2015, CC2013).
Figure 3. Word cloud of the descriptors elicited by the red wines considered to be organic (ST2012,ST2014, PN2015).
3.6. Untrained Tasters
The liking, familiarity and willingness to pay (WTP) given by the untrained panel is listedin Table 11. Information about the organic mode of production was given to the tasters and so theresults may be compared to the same wines tasted by the trained tasters in the “organic session”.Considering overall average scores, the unexperienced tasters either liked organic wines less or werewilling to pay less for organic wines (p < 0.05) when compared to experienced tasters (see Table 3).The free descriptors generated revealed a wide heterogeneity of aromatic features and either pleasantor unpleasant response reactions, such as “nice”, “horrible”, or “weird”, frequently comparing thewines amongst themselves, consistent with the absence of previous training.

Foods 2020, 9, 105 11 of 13
Table 11. Preference and willingness to pay (WTP) of the organic wines by consumers in aninformed session.
Wine Colour Wine Code Liking Familiarity WTP (€)
White CB2016 2.89 2.36 5.0SB2016 2.96 2.72 6.1VB2015 2.51 2.17 6.4
Red CT2015 2.89 2.53 7.1ST2012 2.83 2.66 5.5ST2014 2.64 2.45 5.9
Average - 2.79 2.48 6.0
4. Discussion
A significant increase in sensory liking and the willingness to pay (WTP) was observed whentrained tasters were informed about the organic mode of production. These results expose the influenceof the organic “halo effect” on the perception of a wine, in accordance with Apaolaza et al. [9].The novelty of the work here presented arises from the deliberate choice of tainted organic wines inorder to assess the response of an educated cohort of tasters.
The results clearly show that tasters scored and valued wines much better under the “organic” labeleven when off-flavours were recognised. This heightened preference should be a result of the anticipatedexpectations since familiarity did not seem to explain this behavior. Ristic et al. [19] reported that freshnesswas associated to a positive sensory character while reduction was considered a negative aroma. Accordingly,in the present study, tasters changed the flavour description of conventional wines that were supposed to beorganic or of flawless organic wines, increasing the citation of positive descriptors such as “fresh” or “fruity”and decreasing the citation of off-flavours like those associated with reduction. Thus, when tasters wereinformed about the mode of production, the positive perception of supposed organic wines was reflected inan increase of the perceived positive characters, as reported by Apaolaza et al. [9].
The most significant result was obtained with tainted organic wines and shows no significantdifference in the sensory description between the conventional and organic sessions. For these wines,positive descriptors were not increased in the “organic” tasting and negative descriptors (such as“Animal/Undergrowth”, “Reductive”, “Oxidised”, and “Astringent”) were also not significantlydecreased. It is likely that descriptors such as “Animal/Undergrowth” are not negative in the contextof organic wines. Therefore, for equivalent sensory perception, a significant increase in liking andWTP was observed in organic wines. These outputs suggest that the acceptance of faulty wines wasincreased in the presence of an organic bias in the context of blind tasting. Moreover, it was notsurprising that the classic European wines from Burgundy, used as prototypes for high reputationwines, usually not appreciated because of their initial off-flavours [10,20], were particularly liked inthe “organic” session and not on the “conventional” one. With regards to the “Reductive” descriptor,in the Chablis wine, it was less cited in the “organic” session, but this descriptor was a cue for the“organic” guess. We hypothetise that this dual behaviour is a reflection of the emotional attachmentthat blurs flavour description. When there was no guess effort, more pleasant descriptors were used,and when a guess was required, the off-flavour cue was essential for the choice.
The importance of off-flavours in the organic wine recognition received another strong piece ofevidence from the session where tasters had to guess the mode of production. Wines not presenting anysensory negative attributes were more likely to be identified as conventional by the tasters. The presenceof off-flavours and their unpleasant character, most of which were mentioned in the guess session,were both cues to recognize organic wines. Therefore, the mode of production was not guessed butthe presence of off-flavours was, which is to be expected from experienced individuals. Interestingly,the pleasantness evaluation was considered by Yeshurun and Sobel [21] to be an essential part of thesense of smell, being coined by these authors as an “emotional sense”. The organic label was worth
Foods 2020, 9, 105 12 of 13
more than the recognition of defects, as it bears a high affective load that overcomes the disgust causedof the flaws [22].
Spinelli et al. [23] evidenced the relations among sensory perception, liking, and emotions but thepossibility of associating liking with unpleasant emotions was not observed. Therefore, it was strikingthat, in the case of organic wines, the psychological attachment was so strong that even a correctlyrecognized faulty wine could be more appreciated and deserved a higher price. This behavior may beexplained under the frame of the top-down and bottom-up flavour brain processing mechanisms thatare characteristic of experts and non-experts, respectively [24]. The previous knowledge about organicwine production induced a heightened pleasantness probably due to a neuronal process similar tothat induced by other marketing actions [25]. On the contrary, non-experts using a bottom-up processdid not show a comparable liking for faulty wines, even when informed about the production mode.Therefore, non-experts’ responses were more consistent with the wine’s intrinsic quality than those ofexperienced enology students that were more influenced by the “organic” extrinsic cues. These resultswere obtained with a low number of wines, but these wines were chosen to encompass a representativesample of the most common off-flavours found in Portuguese organic wines. Future studies should beperformed with other off-flavours and with wines from other countries.
5. Conclusions
Overall, the results show that the “organic” concept is positively recognized by trained tasters,illustrating the well-known “halo effect” in sensory analysis, where, even before tasting, individualsare already prone to giving higher liking scores and willingness to pay ratings.
The novelty of this work stands in evidencing the acceptance of off-flavours when tasterswere informed about the organic label of the wines. Surprisingly, off-flavours obtained a beneficialconnotation as they were regarded as the cue for the recognition of organic wines. These results wereobtained with a cohort of enology students that recognized off-flavours properly but did not penalizewines simply because they had the organic label. This fact poses a challenge to all involved in sensoryanalysis education because it is contrary to the pursuit of aromatic purity made by the precursors ofwine science since the mid XXth century, including Maynard Amerine in the University of California(Davis) or Émyle Peynaud and Jean Ribéreau-Gayon in Bordeaux University (France).
Author Contributions: Conceptualization and writing, M.R., V.M. and M.M.-F.; statistical analysis: T.S., C.V.;practical work: M.R., M.H.; M.C. All authors have read and agreed to the published version of the manuscript.
Funding: This research was funded by FCT (Fundação para a Ciência e a Tecnologia) through the research unitUID/AGR/04129/2013 (LEAF) and the post-doctoral (M.C.) grant SFRH/BPD/70888/2010. M.H. was the recipient ofa PhD grant from the University of Lisbon. V.M. was a postdoctoral fellow supported by research Brasilian funds.
Conflicts of Interest: The authors declare no conflict of interest.
References
1. Laureati, M.; Pagliarini, E. Sustainability and Organic Wine Production. In Wine Safety, Consumer Preference,and Human Health; Moreno-Arribas, M., Suáldea, B., Eds.; Springer: Basel, Switzerland, 2016; pp. 183–199.
2. Forbes, S.L.; Cohen, D.A.; Cullen, R.; Wratten, S.D.; Fountain, J. Consumer attitudes regarding environmentallysustainable wine: An exploratory study of the New Zealand marketplace. J. Clean. Prod. 2009, 17, 1195–1199.[CrossRef]
3. Cravero, M.C. Organic and biodynamic wines quality and characteristics: A review. Food Chem. 2019, 295,334–340. [CrossRef] [PubMed]
4. Castellini, A.; Mauracher, C.; Troiano, S. An overview of the biodynamic wine sector. Int. J. Wine Res. 2017, 9,1–11. [CrossRef]
5. Schäufele, I.; Hamm, U. Consumers’ perceptions, preferences and willingness-to-pay for wine withsustainability characteristics: A review. J. Clean. Prod. 2017, 147, 379–394. [CrossRef]
6. Delmas, M.A.; Gergaud, O.; Lim, J. Does Organic Wine Taste Better? An Analysis of Experts’ Ratings.J. Wine Econ. 2016, 11, 329–354. [CrossRef]
Foods 2020, 9, 105 13 of 13
7. Pagliarini, E.; Laureati, M.; Gaeta, D. Sensory descriptors, hedonic perception and consumer’s attitudesto Sangiovese red wine deriving from organically and conventionally grown grapes. Front. Psychol. 2013,4, 896. [CrossRef] [PubMed]
8. Wiedmann, K.-P.; Hennigs, N.; Behrens, S.H.; Klarmann, C. Tasting green: An experimental design forinvestigating consumer perception of organic wine. Br. Food J. 2014, 116, 197–211. [CrossRef]
9. Apaolaza, V.; Hartmann, P.; Echebarria, C.; Barrutia, J.M. Organic label’s halo effect on sensory and hedonicexperience of wine: A pilot study. J. Sens. Stud. 2017, 32, 12243. [CrossRef]
10. Loureiro, V.; Brasil, R.; Malfeito-Ferreira, M. A New wine tasting approach based on emotional responses torapidly recognize classic european wine styles. Beverages 2016, 2, 6. [CrossRef]
11. Perrin, L.; Symoneaux, R.; Maitre, I.; Asselin, C.; Jourjon, F.; Pagès, J. Comparison of three sensory methodsfor use with the Napping® procedure: Case of ten wines from Loire valley. Food Qual. Prefer. 2008, 19, 1–11.[CrossRef]
12. Pérez, J.; Ángeles, M.; Lafuente, V. Descriptive sensory analysis in different classes of orange juice by a robustfree-choice profile method. Anal. Chim. Acta 2007, 595, 238–247. [CrossRef] [PubMed]
13. Larson, R.; Farber, B. Student Solutions Manual: Elementary Statistics: Picturing the World; Pearson PrenticeHall: Boston, MA, USA, 2009.
14. Siegel, A.F. Chi-Squared Analysis: Testing for Patterns in Qualitative Data. In Practical Business Statistics,7th ed.; Chapter 17; Siegel, A.F., Ed.; Academic Press: London, UK, 2016; pp. 509–524.
15. Thuillier, B.; Valentin, D.; Marchal, R.; Dacremont, C. Pivot© profile: A new descriptive method based onfree description. Food Qual. Prefer. 2015, 42, 66–77. [CrossRef]
16. Arroyo, B.L.; Roberts, R.P. How Specific Wine Tasting Descriptors Are? Procedia Soc. Behav. Sci. 2015, 198,287–299. [CrossRef]
17. Ferreira, V.; Sáenz-Navajas, M.-P.; Campo, E.; Herrero, P.; De La Fuente, A.; Fernández-Zurbano, P.;Arancha, D.-L.-F.-B. Sensory interactions between six common aroma vectors explain four main red winearoma nuances. Food Chem. 2016, 199, 447–456. [CrossRef]
18. Villière, A.; Symoneaux, R.; Roche, A.; Eslami, A.; Perrot, N.; Le Fur, Y.; Prost, C.; Courcoux, P.; Vigneau, E.;Thomas-Danguin, T.; et al. Comprehensive sensory and chemical data on the flavor of 16 red wines fromtwo varieties: Sensory descriptive analysis, HS-SPME-GC-MS volatile compounds quantitative analysis,and odor-active compounds identification by HS-SPME-GC-MS-O. Data Brief 2019, 24, 103725. [CrossRef]
19. Ristic, R.; Danner, L.; Johnson, T.; Meiselman, H.; Hoek, A.; Jiranek, V.; Bastian, S. Wine-related aromasfor different seasons and occasions: Hedonic and emotional responses of wine consumers from Australia,UK and USA. Food Qual. Prefer. 2018, 71, 250–260. [CrossRef]
20. Coste, A.; Sousa, P.; Malfeito-Ferreira, M. Wine tasting based on emotional responses: An expedite approachto distinguish between warm and cool climate dry red wine styles. Food Res. Int. 2018, 106, 11–21. [CrossRef]
21. Yeshurun, Y.; Sobel, N. An odor is not worth a thousand words: From multidimensional odors tounidemensional odour objects. Annu. Rev. Psychol. 2010, 61, 219–241. [CrossRef]
22. White, T.L.; Thomas-Danguin, T.; Olofsson, J.K.; Zucco, G.M.; Prescott, J. Thought for food: Cognitiveinfluences on chemosensory perceptions and preferences. Food Qual. Prefer. 2020, 79, 103776. [CrossRef]
23. Spinelli, S.; Monteleone, E.; Ares, G.; Jaeger, S.R. Sensory drivers of product-elicited emotions are moderatedby liking: Insights from consumer segmentation. Food Qual. Prefer. 2019, 78, 103725. [CrossRef]
24. Shepherd, G. Neuroenology, How the Brain Creates the Taste of Wine; Columbia University Press: New York,NY, USA, 2017.
25. Plassmann, H.; O’Doherty, J.; Shiv, B.; Rangel, A. Marketing actions can modulate neural representations ofexperienced pleasantness. Proc. Natl. Acad. Sci. USA 2008, 105, 1050–1054. [CrossRef] [PubMed]
© 2020 by the authors. Licensee MDPI, Basel, Switzerland. This article is an open accessarticle distributed under the terms and conditions of the Creative Commons Attribution(CC BY) license (http://creativecommons.org/licenses/by/4.0/).