for the period ended december 31, 2016 - ch energy … 2 ch energy group, inc. & central hudson...
TRANSCRIPT

Fnote 2
CH ENERGY GROUP, INC. &
CENTRAL HUDSON GAS & ELECTRIC CORP.
ANNUAL FINANCIAL REPORT
for the period ended
DECEMBER 31, 2016

Report of Independent Auditors
The Board of Directors of CH Energy Group, Inc.
We have audited the accompanying consolidated financial statements of CH Energy Group, Inc. and
subsidiaries, which comprise the consolidated balance sheets as of December 31, 2016 and 2015, and
the related consolidated statements of income, comprehensive income, equity and cash flows for the
years then ended, and the related notes to the consolidated financial statements.
Management’s Responsibility for the Consolidated Financial Statements
Management is responsible for the preparation and fair presentation of these consolidated financial
statements in conformity with U.S. generally accepted accounting principles; this includes the design,
implementation, and maintenance of internal control relevant to the preparation and fair presentation
of consolidated financial statements that are free of material misstatement, whether due to fraud or
error.
Auditor’s Responsibility
Our responsibility is to express an opinion on these consolidated financial statements based on our
audits. We conducted our audits in accordance with auditing standards generally accepted in the United
States. Those standards require that we plan and perform the audit to obtain reasonable assurance
about whether the consolidated financial statements are free of material misstatement.
An audit involves performing procedures to obtain audit evidence about the amounts and disclosures in
the consolidated financial statements. The procedures selected depend on the auditor’s judgment,
including the assessment of the risks of material misstatement of the consolidated financial
statements, whether due to fraud or error. In making those risk assessments, the auditor considers
internal control relevant to the entity’s preparation and fair presentation of the consolidated financial
statements in order to design audit procedures that are appropriate in the circumstances, but not for
the purpose of expressing an opinion on the effectiveness of the entity’s internal control. Accordingly,
we express no such opinion. An audit also includes evaluating the appropriateness of accounting
policies used and the reasonableness of significant accounting estimates made by management, as well
as evaluating the overall presentation of the consolidated financial statements.
We believe that the audit evidence we have obtained is sufficient and appropriate to provide a basis for
our audit opinion.

Opinion
In our opinion, the consolidated financial statements referred to above present fairly, in all material
respects, the consolidated financial position of CH Energy Group, Inc. and subsidiaries at December 31,
2016 and 2015, and the consolidated results of their operations and their cash flows for the years then
ended in conformity with U.S. generally accepted accounting principles.
Toronto, Canada
February 9, 2017

Report of Independent Auditors
The Board of Directors of Central Hudson Gas & Electric Corporation
We have audited the accompanying balance sheets of Central Hudson Gas & Electric
Corporation as of December 31, 2016 and 2015, and the related statements of income,
comprehensive income, equity and cash flows for each of the three years in the period ended
December 31, 2016. These financial statements are the responsibility of the Company's
management. Our responsibility is to express an opinion on these financial statements based
on our audits.
We conducted our audit in accordance with the auditing standards of the Public Company
Accounting Oversight Board (United States) and in accordance with auditing standards
generally accepted in the United States of America. Those standards require that we plan and
perform the audit to obtain reasonable assurance about whether the financial statements are
free of material misstatement. An audit includes examining, on a test basis, evidence
supporting the amounts and disclosures in the financial statements. An audit also includes
assessing the accounting principles used and significant estimates made by management, as
well as evaluating the overall financial statement presentation. We believe that our audit
provides a reasonable basis for our opinion.
In our opinion, the financial statements referred to above present fairly, in all material
respects, the financial position of Central Hudson Gas & Electric Corporation at December 31,
2016 and 2015, and the results of its operations and its cash flows for each of the three
years in the period ended December 31, 2016, in conformity with U.S. generally accepted
accounting principles.
We also have audited, in accordance with the standards of the Public Company Accounting
Oversight Board (United States), Central Hudson Gas & Electric Corporation's internal control
over financial reporting as of December 31, 2016, based on criteria established in Internal
Control-Integrated Framework issued by the Committee of Sponsoring Organizations of the
Treadway Commission (2013 framework) and our report dated February 9, 2017 expressed
an unqualified opinion thereon.
Toronto, Canada
February 9, 2017

Report of Independent Auditors
The Board of Directors of Central Hudson Gas & Electric Corporation
We have audited Central Hudson Gas & Electric Corporation’s internal control over financial reporting
as at December 31, 2016, based on criteria established in Internal Control—Integrated Framework
issued by the Committee of Sponsoring Organizations of the Treadway Commission (2013 framework)
(the COSO criteria). Central Hudson Gas & Electric Corporation’s management is responsible for
maintaining effective internal control over financial reporting, and for its assessment of the
effectiveness of internal control over financial reporting included in the accompanying Central Hudson
Report of Management on Internal Control over Financial Reporting. Our responsibility is to express an
opinion on the company’s internal control over financial reporting based on our audit.
We conducted our audit in accordance with the auditing standards of the Public Company Accounting
Oversight Board (United States) and in accordance with auditing standards generally accepted in the
United States of America. Those standards require that we plan and perform the audit to obtain
reasonable assurance about whether effective internal control over financial reporting was maintained
in all material respects. Our audit included obtaining an understanding of internal control over financial
reporting, assessing the risk that a material weakness exists, testing and evaluating the design and
operating effectiveness of internal control based on the assessed risk, and performing such other
procedures as we considered necessary in the circumstances. We believe that our audit provides a
reasonable basis for our opinion.
A company’s internal control over financial reporting is a process designed to provide reasonable
assurance regarding the reliability of financial reporting and the preparation of financial statements for
external purposes in accordance with generally accepted accounting principles. A company’s internal
control over financial reporting includes those policies and procedures that (1) pertain to the
maintenance of records that, in reasonable detail, accurately and fairly reflect the transactions and
dispositions of the assets of the company; (2) provide reasonable assurance that transactions are
recorded as necessary to permit preparation of financial statements in accordance with generally
accepted accounting principles, and that receipts and expenditures of the company are being made
only in accordance with authorizations of management and directors of the company; and (3) provide
reasonable assurance regarding prevention or timely detection of unauthorized acquisition, use, or
disposition of the company’s assets that could have a material effect on the financial statements.
Because of its inherent limitations, internal control over financial reporting may not prevent or detect
misstatements. Also, projections of any evaluation of effectiveness to future periods are subject to the
risk that controls may become inadequate because of changes in conditions, or that the degree of
compliance with the policies or procedures may deteriorate.
In our opinion, Central Hudson Gas & Electric Corporation maintained, in all material respects, effective
internal control over financial reporting as of December 31, 2016, based on the COSO criteria.

We also have audited, in accordance with the standards of the Public Company Accounting Oversight
Board (United States), the balance sheets of Central Hudson Gas & Electric Corporation as of
December 31, 2016 and 2015, and the related statements of income, comprehensive income, equity
and cash flows for each of the three years ended December 31, 2016 and our report dated February
9, 2017 expressed an unqualified opinion thereon.
Toronto, Canada
February 9, 2017

REPORT OF MANAGEMENT ON INTERNAL CONTROL OVER FINANCIAL REPORTING – CENTRAL HUDSON
The management of Central Hudson Gas & Electric Corporation (“management”) is responsible for establishing and maintaining adequate internal control over financial reporting for Central Hudson Gas & Electric Corporation (the “Corporation”) as defined in Rules 13a-15(f) and 15d-15(f) under the Securities Exchange Act of 1934. Internal control over financial reporting is a process designed to provide reasonable assurance regarding the reliability of financial reporting and the preparation of financial statements for external purposes in accordance with accounting principles generally accepted in the United States of America. Internal control over financial reporting includes those policies and procedures that:
pertain to the maintenance of records that, in reasonable detail, accurately and fairly reflect the transactions and dispositions of the assets of the Corporation;
provide reasonable assurance that transactions are recorded as necessary to permit preparation of financial statements in accordance with accounting principles generally accepted in the United States of America and that receipts and expenditures of the Corporation are being made only in accordance with authorization of management and directors of the Corporation; and
provide reasonable assurance regarding prevention or timely detection of unauthorized acquisition, use or disposition of assets that could have a material effect on the consolidated financial statements.
Internal control over financial reporting includes the controls themselves, monitoring (including internal auditing practices) and actions taken to correct deficiencies as identified.
Because of its inherent limitations, internal control over financial reporting may not prevent or detect misstatements. Also, projections of any evaluation of effectiveness to future periods are subject to the risk that controls may become inadequate because of changes in conditions, or that the degree of compliance with the policies or procedures may deteriorate.
Management assessed the effectiveness of the Corporation’s internal control over financial reporting as of December 31, 2016. Management based this assessment on criteria for effective internal control over financial reporting described in “Internal Control - Integrated Framework” issued by the Committee of Sponsoring Organizations of the Treadway Commission (COSO). Based on this assessment, management determined that, as of December 31, 2016, the Corporation maintained effective internal control over financial reporting.
The effectiveness of the Corporation’s internal control over financial reporting as of December 31, 2016, has been audited by Ernst & Young LLP, an independent registered public accounting firm, as stated in their report which appears herein.
/s/ Michael L. Mosher /s/ Christopher M. Capone
Michael L. Mosher Christopher M. Capone President and Chief Executive
Officer Executive Vice President and
Chief Financial Officer February 9, 2016

YEAR ENDED DECEMBER 31, 2016
TABLE OF CONTENTS FINANCIAL STATEMENTS CH Energy Group, Inc. PAGE Consolidated Statement of Income – Year Ended December 31, 2016, 2015 and 2014 3 Consolidated Statement of Comprehensive Income – Year Ended December 31, 2016, 2015 and 2014 3 Consolidated Statement of Cash Flows – Year Ended December 31, 2016, 2015 and 2014 4 Consolidated Balance Sheet – December 31, 2016 and 2015 5 Consolidated Statement of Equity – Year Ended December 31, 2016, 2015 and 2014 7
Central Hudson Gas & Electric Corporation Statement of Income – Year Ended December 31, 2016, 2015 and 2014 8 Statement of Comprehensive Income – Year Ended December 31, 2016, 2015 and 2014 8 Statement of Cash Flows – Year Ended December 31, 2016, 2015 and 2014 9 Balance Sheet – December 31, 2016 and 2015 10 Statement of Equity – Year Ended December 31, 2016, 2015 and 2014 12
NOTES TO FINANCIAL STATEMENTS 13

The Notes to Financial Statements are an integral part hereof.
- 9 -
Financial Statements
CH ENERGY GROUP CONSOLIDATED STATEMENT OF INCOME (In Thousands) Year Ended December 31, 2016 2015 2014 Operating Revenues Electric $ 510,762 $ 544,296 $ 579,757 Natural gas 128,886 146,562 163,005
Total Operating Revenues 639,648 690,858 742,762 Operating Expenses Operation: Purchased electricity and fuel used in electric generation 157,429 193,920 232,990 Purchased natural gas 32,898 53,890 78,765 Other expenses of operation - regulated activities 229,094 240,302 250,046 Other expenses of operation - non-regulated 639 75 7,129 Merger related costs - - 86 Depreciation and amortization 46,509 44,074 43,859 Taxes, other than income tax 63,367 58,065 55,497
Total Operating Expenses 529,936 590,326 668,372
Operating Income 109,712 100,532 74,390
Other Income and Deductions Income from unconsolidated affiliates 876 131 586 Interest on regulatory assets and other interest income 2,823 3,585 4,395 Regulatory adjustments for interest costs 341 653 1,259 Other - net 190 1,378 (700)
Total Other Income 4,230 5,747 5,540
Interest Charges Interest on long-term debt 24,211 23,549 23,528 Interest on regulatory liabilities and other interest 7,185 7,862 9,575
Total Interest Charges 31,396 31,411 33,103
Income before income taxes 82,546 74,868 46,827 Income Tax Expense 31,641 31,128 20,196
Net Income from Continuing Operations 50,905 43,740 26,631 Discontinued Operations Income from discontinued operations before tax - - 6,908 Gain from sale of discontinued operations - - 8,036 Income tax expense from discontinued operations - - 7,255
Net Income from Discontinued Operations - - 7,689 Net Income Attributable to CH Energy Group 50,905 43,740 34,320 Dividends declared on Common Stock 22,000 22,000 75,000
Change in Retained Earnings $ 28,905 $ 21,740 $ (40,680)
CH ENERGY GROUP CONSOLIDATED STATEMENT OF COMPREHENSIVE INCOME (In Thousands)
Year Ended December 31,
2016 2015 2014
Net Income $ 50,905 $ 43,740 $ 34,320
Other Comprehensive Income (Loss):
Net unrealized gain/(losses) on investments held by equity method investees -net of tax expense of $33, $210 and ($3), respectively. (50) (316) 6
Other comprehensive income (loss) (50) (316) 6
Comprehensive Income $ 50,855 $ 43,424 $ 34,326

The Notes to Financial Statements are an integral part hereof.
- 10 -
CH ENERGY GROUP CONSOLIDATED STATEMENT OF CASH FLOWS (In Thousands) Year Ended December 31, 2016 2015 2014
Operating Activities:
Net income $ 50,905 $ 43,740 $ 34,320 Adjustments to reconcile net income to net cash provided by operating activities:
Depreciation 41,985 40,830 40,702 Amortization 4,524 3,244 3,157
Deferred income taxes - net 34,575 23,065 15,741 Bad debt expense 4,181 7,598 6,645
Undistributed equity in earnings of unconsolidated affiliates (327) (131) 171 Pension expense 15,549 18,138 21,152
Other post-employment benefits ("OPEB") expense (2,536) 2,394 6,803 Regulatory liability - rate moderation (16,108) (6,173) -
Revenue decoupling mechanism recorded 14,952 10,468 3,245 Regulatory asset amortization - 27 4,554
Gain on sale of assets - - (8,073) Changes in operating assets and liabilities - net:
Accounts receivable, unbilled revenues and other receivables (10,522) 2,909 (25,700) Fuel, materials and supplies (5,226) (1,237) 1,209
Special deposits and prepayments (1,777) (823) (4,357) Income and other taxes 32,811 (22,139) (16,208)
Accounts payable 5,284 (8,978) 17,201 Accrued interest 306 (170) (221)
Customer advances (1,464) 3,810 (3,396) Pension plan contribution (1,072) (22,387) (16,986)
OPEB contribution (1,560) (1,536) (2,238) Revenue decoupling mechanism refunded - net (7,962) (1,258) (5,105)
Regulatory asset - storm deferral 132 (51) (5,108) Regulatory asset - site investigation and remediation ("SIR") (11,598) 2,873 4,202
Regulatory asset - temporary state assessment 784 (109) 1,185 Regulatory liability - energy efficiency programs 29,967 (2,079) 929
Deferred natural gas and electric costs (4,747) 20,095 (8,389) Other - net 15,911 (7,839) 22,136
Net cash provided by operating activities 186,967 104,281 87,571 Investing Activities: Proceeds from sale of assets - - 95,281
Additions to utility and other property and plant (175,894) (140,648) (113,321) Other - net (2,744) (4,311) 1,861
Net cash used in investing activities (178,638) (144,959) (16,179) Financing Activities: Redemption of long-term debt (9,314) (1,230) (21,651) Proceeds from issuance of long-term debt 54,000 20,000 30,000 Repayments of short-term borrowings (33,000) (20,000) - Proceeds from short-term borrowings 8,000 45,000 - Capital contributions 130 10,000 - Dividends paid on Common Stock (22,000) (22,000) (75,000) Other - net (420) (157) (207) Net cash (used in) provided by financing activities (2,604) 31,613 (66,858) Net Change in Cash and Cash Equivalents 5,725 (9,065) 4,534 Cash and Cash Equivalents at Beginning of Period 13,582 22,647 18,113
Cash and Cash Equivalents at End of Period $ 19,307 $ 13,582 $ 22,647
Supplemental Disclosure of Cash Flow Information:
Interest paid $ 23,959 $ 23,529 $ 24,147 Federal and state income taxes paid $ 765 $ 41,712 $ 17,000 Non-Cash Investing Activities:
Additions to utility plant assets included in liabilities $ 10,604 $ 12,010 $ 7,495

The Notes to Financial Statements are an integral part hereof.
- 11 -
CH ENERGY GROUP CONSOLIDATED BALANCE SHEET (In Thousands) December 31, December 31,
2016 2015
ASSETS
Utility Plant (Note 2)
Electric $ 1,289,880 $ 1,230,663
Natural gas 457,271 417,455
Common 227,052 201,193
Gross Utility Plant 1,974,203 1,849,311
Less: Accumulated depreciation 500,280 478,384
Net 1,473,923 1,370,927
Construction work in progress 73,273 51,517
Net Utility Plant 1,547,196 1,422,444
Non-utility property & plant 524 524
Net Non-Utility Property & Plant 524 524
Current Assets
Cash and cash equivalents 19,307 13,582
Accounts receivable from customers - net of allowance for doubtful accounts of $4.1 million and $5.6 million, respectively. 58,146 55,340
Accounts receivable - affiliates (Note 16) 501 195
Accrued unbilled utility revenues 19,775 28,216
Other receivables 7,173 7,873
Fuel, materials and supplies (Note 1) 24,009 18,783
Regulatory assets (Note 3) 25,989 30,788
Income tax receivable 5,636 38,139
Fair value of derivative instruments (Note 14) 3,311 -
Special deposits and prepayments 28,074 26,296
Total Current Assets 191,921 219,212
Deferred Charges and Other Assets
Regulatory assets - pension plan (Note 3) 52,251 94,488
Regulatory assets - other (Note 3) 137,340 140,166
Fair value of derivative instruments (Note 14) - 2,218
Investments in unconsolidated affiliates (Note 5) 7,719 1,417
Other investments (Note 15) 32,069 33,575
Other 5,183 3,514
Total Deferred Charges and Other Assets 234,562 275,378
Total Assets $ 1,974,203 $ 1,917,558

The Notes to Financial Statements are an integral part hereof.
- 12 -
CH ENERGY GROUP CONSOLIDATED BALANCE SHEET (CONT'D) (In Thousands, except share amounts)
December 31, December 31,
2016 2015
CAPITALIZATION AND LIABILITIES
Capitalization (Note 8)
CH Energy Group Common Shareholders' Equity
Common Stock (30,000,000 shares authorized: $0.01 par value; 15,961,400 shares issued and outstanding) $ 160 $ 160
Paid-in capital 336,036 335,906
Retained earnings 248,084 219,179
Accumulated other comprehensive income 144 194
Total Equity 584,424 555,439
Long-term debt (Note 9)
Principal amount 554,325 534,730
Unamortized debt issuance costs (4,022) (3,894)
Long-term debt less unamortized debt issuance costs 550,303 530,836
Total Capitalization 1,134,727 1,086,275
Current Liabilities
Current maturities of long-term debt (Note 9) 34,406 9,315
Short-term borrowings (Note 7) - 25,000
Accounts payable 41,942 39,305
Accrued interest 5,809 5,503
Accrued vacation and payroll 8,228 7,030
Customer advances 16,513 17,977
Customer deposits 7,639 8,366
Regulatory liabilities (Note 3) 31,536 42,429
Fair value of derivative instruments (Note 14) 1,198 10,142
Accrued environmental remediation costs (Note 12) 15,501 22,998
Other current liabilities 15,062 8,806
Total Current Liabilities 177,834 196,871
Deferred Credits and Other Liabilities
Regulatory liabilities - OPEB (Note 3) 26,966 25,663
Regulatory liabilities - other (Note 3) 162,526 132,988
Operating reserves 3,852 3,703
Fair value of derivative instruments (Note 14) 744 1,476
Accrued environmental remediation costs (Note 12) 57,385 69,121
Accrued OPEB costs (Note 10) 12,024 18,995
Accrued pension costs (Note 10) 39,270 59,570
Tax reserve (Note 4) 1,703 3,520
Other liabilities 20,167 19,910
Total Deferred Credits and Other Liabilities 324,637 334,946
Accumulated Deferred Income Tax (Note 4) 337,005 299,466
Commitments and Contingencies
Total Capitalization and Liabilities $ 1,974,203 $ 1,917,558

The Notes to Financial Statements are an integral part hereof.
- 13 -
CH ENERGY GROUP CONSOLIDATED STATEMENT OF EQUITY (In Thousands, except share amounts) CH Energy Group Common Shareholders
Common Stock
Shares Issued Amount Paid-In Capital Retained Earnings
Accumulated Other Comprehensive Income / (Loss) Total Equity
Balance at December 31, 2013 15,961,400 $ 160 $ 325,906 $ 238,119 $ 504 $ 564,689
Net income 34,320 34,320
Change in fair value: Investments 6 6
Dividends declared on common stock (75,000) (75,000)
Balance at December 31, 2014 15,961,400 $ 160 $ 325,906 $ 197,439 $ 510 $ 524,015
Net income 43,740 43,740
Capital Contribution 10,000 10,000
Change in fair value: Investments (316) (316)
Dividends declared on common stock (22,000) (22,000)
Balance at December 31, 2015 15,961,400 $ 160 $ 335,906 $ 219,179 $ 194 $ 555,439
Net income 50,905 50,905
Capital Contribution 130 130
Change in fair value: Investments (50) (50)
Dividends declared on common stock (22,000) (22,000)
Balance at December 31, 2016 15,961,400 $ 160 $ 336,036 $ 248,084 $ 144 $ 584,424

The Notes to Financial Statements are an integral part hereof.
- 14 -
CENTRAL HUDSON STATEMENT OF INCOME (In Thousands)
Year Ended December 31, 2016 2015 2014
Operating Revenues Electric $ 510,762 $ 544,296 $ 579,757 Natural gas 128,886 146,562 163,005
Total Operating Revenues 639,648 690,858 742,762 Operating Expenses Operation: Purchased electricity and fuel used in electric generation 157,429 193,920 232,990
Purchased natural gas 32,898 53,890 78,765 Other expenses of operation 229,094 240,302 250,046
Depreciation and amortization 46,509 44,074 43,859 Taxes, other than income tax 63,006 57,903 54,726
Total Operating Expenses 528,936 590,089 660,386
Operating Income 110,712 100,769 82,376
Other Income and Deductions Interest on regulatory assets and other interest income 2,795 3,551 4,355
Regulatory adjustments for interest costs 341 653 1,259 Other - net 812 1,869 (214)
Total Other Income 3,948 6,073 5,400
Interest Charges Interest on long-term debt 23,007 22,259 22,031
Interest on regulatory liabilities and other interest 7,177 7,849 9,540
Total Interest Charges 30,184 30,108 31,571
Income Before Income Taxes 84,476 76,734 56,205
Income Tax Expense 31,832 31,146 22,361
Net Income $ 52,644 $ 45,588 $ 33,844
CENTRAL HUDSON STATEMENT OF COMPREHENSIVE INCOME (In Thousands) Year Ended December 31,
2016 2015 2014
Net Income $ 52,644 $ 45,588 $ 33,844 Other comprehensive income 1 - - -
Comprehensive Income $ 52,644 $ 45,588 $ 33,844

The Notes to Financial Statements are an integral part hereof.
- 15 -
CENTRAL HUDSON STATEMENT OF CASH FLOWS (In Thousands) Year Ended December 31,
2016 2015 2014
Operating Activities: Net income $ 52,644 $ 45,588 $ 33,844 Adjustments to reconcile net income to net cash provided by operating activities: Depreciation 41,985 40,830 40,702
Amortization 4,524 3,244 3,157 Deferred income taxes - net 34,726 22,777 10,976
Bad debt expense 4,181 7,598 6,645 Pension expense 15,549 18,138 20,597
OPEB expense (2,536) 2,394 6,803 Regulatory liability - rate moderation (16,108) (6,173) -
Revenue decoupling mechanism recorded 14,952 10,468 3,245 Regulatory asset amortization - 27 4,554
Changes in operating assets and liabilities - net: Accounts receivable, unbilled revenues and other receivables (9,921) 1,923 (9,162)
Fuel, materials and supplies (5,226) (1,237) 1,086 Special deposits and prepayments (1,788) (825) (4,958)
Income and other taxes 29,576 (22,528) (8,289) Accounts payable 5,589 (8,930) 12,396
Accrued interest 311 (167) (132) Customer advances (1,464) 3,810 (834)
Pension plan contribution (1,072) (22,064) (16,986) OPEB contribution (1,560) (1,536) (2,238)
Revenue decoupling mechanism refunded - net (7,962) (1,258) (5,105) Regulatory asset - storm deferral 132 (51) (5,108)
Regulatory asset - SIR (11,598) 2,873 4,202 Regulatory asset - temporary state assessment 784 (109) 1,185
Regulatory liability - energy efficiency programs 29,967 (2,079) 929 Deferred natural gas and electric costs (4,747) 20,095 (8,389)
Other - net 14,521 (2,609) 15,498
Net cash provided by operating activities 185,459 110,199 104,618
Investing Activities: Additions to utility plant (175,894) (140,648) (113,190)
Other - net 3,266 (4,238) 1,703
Net cash used in investing activities (172,628) (144,886) (111,487)
Financing Activities: Redemption of long-term debt (8,000) - (14,000)
Proceeds from issuance of long-term debt 54,000 20,000 30,000 Repayments of short-term borrowings (35,000) (20,000) -
Proceeds from short-term borrowings 8,000 47,000 - Dividends paid to parent - CH Energy Group (24,524) (24,524) (5,000)
Other - net (420) (157) (207)
Net cash (used in) provided by financing activities (5,944) 22,319 10,793
Net Change in Cash and Cash Equivalents 6,887 (12,368) 3,924 Cash and Cash Equivalents - Beginning of Period 5,935 18,303 14,379
Cash and Cash Equivalents - End of Period $ 12,822 $ 5,935 $ 18,303
Supplemental Disclosure of Cash Flow Information: Interest paid $ 22,750 $ 22,235 $ 22,560 Federal and state income taxes paid $ 913 $ 44,798 $ 20,003
Non-Cash Investing Activities:
Additions to utility plant assets included in liabilities $ 10,604 $ 12,010 $ 7,495

The Notes to Financial Statements are an integral part hereof.
- 16 -
CENTRAL HUDSON BALANCE SHEET (In Thousands) December 31, December 31,
2016 2015
ASSETS
Utility Plant (Note 2)
Electric $ 1,289,880 $ 1,230,663
Natural gas 457,271 417,455
Common 227,052 201,193
Gross Utility Plant 1,974,203 1,849,311
Less: Accumulated depreciation 500,280 478,384
Net 1,473,923 1,370,927
Construction work in progress 73,273 51,517
Net Utility Plant 1,547,196 1,422,444
Non-Utility Property and Plant 524 524
Net Non-Utility Property and Plant 524 524
Current Assets
Cash and cash equivalents 12,822 5,935
Accounts receivable from customers - net of allowance for doubtful accounts of $4.1 million and $5.6 million, respectively. 58,146 55,340
Accrued unbilled utility revenues 19,775 28,216
Other receivables 7,052 8,047
Fuel, materials and supplies (Note 1) 24,009 18,783
Regulatory assets (Note 3) 25,989 30,788
Income tax receivable 5,620 35,196
Fair value of derivative instruments (Note 14) 3,311 -
Special deposits and prepayments 28,031 26,243
Total Current Assets 184,755 208,548
Deferred Charges and Other Assets
Regulatory assets - pension plan (Note 3) 52,251 94,488
Regulatory assets - other (Note 3) 137,340 140,166
Fair value of derivative instruments (Note 14) - 2,218
Other investments (Note 15) 31,322 32,779
Other 4,753 2,865
Total Deferred Charges and Other Assets 225,666 272,516
Total Assets $ 1,958,141 $ 1,904,032

The Notes to Financial Statements are an integral part hereof.
- 17 -
CENTRAL HUDSON BALANCE SHEET (CONT'D) (In Thousands, except share amounts) December 31, December 31,
2016 2015
CAPITALIZATION AND LIABILITIES
Capitalization (Note 8)
Common Stock (30,000,000 shares authorized: $5 par value; 16,862,087 shares issued and outstanding) $ 84,311 $ 84,311
Paid-in capital 239,952 239,952
Retained earnings 265,640 237,520
Capital stock expense (4,633) (4,633)
Total Equity 585,270 557,150
Long-term debt (Note 9)
Principal amount 538,950 517,950
Unamortized debt issuance costs (3,938) (3,894)
Long-term debt less unamortized debt issuance costs 535,012 514,056
Total Capitalization 1,120,282 1,071,206
Current Liabilities
Current maturities of long-term debt (Note 9) 33,000 8,000
Short-term borrowings (Note 7) - 27,000
Accounts payable 42,420 39,478
Accrued interest 5,762 5,451
Accrued vacation and payroll 8,228 7,025
Customer advances 16,513 17,977
Customer deposits 7,639 8,366
Regulatory liabilities (Note 3) 31,536 42,429
Fair value of derivative instruments (Note 14) 1,198 10,142
Accrued environmental remediation costs (Note 12) 15,501 22,998
Other current liabilities 13,282 8,644
Total Current Liabilities 175,079 197,510
Deferred Credits and Other Liabilities
Regulatory liabilities - OPEB (Note 3) 26,966 25,663
Regulatory liabilities - other (Note 3) 162,526 132,988
Operating reserves 3,852 3,703
Fair value of derivative instruments (Note 14) 744 1,476
Accrued environmental remediation costs (Note 12) 57,385 69,121
Accrued OPEB costs (Note 10) 12,024 18,995
Accrued pension costs (Note 10) 39,038 59,337
Tax reserve (Note 4) 1,703 3,520
Other liabilities 18,836 18,225
Total Deferred Credits and Other Liabilities 323,074 333,028
Accumulated Deferred Income Tax (Note 4) 339,706 302,288
Commitments and Contingencies
Total Capitalization and Liabilities $ 1,958,141 $ 1,904,032

The Notes to Financial Statements are an integral part hereof.
- 18 -
CENTRAL HUDSON STATEMENT OF EQUITY (In Thousands, except share amounts)
Central Hudson Common Shareholders
Common Stock
Shares Issued Amount Paid-In Capital
Capital Stock Expense
Retained Earnings
Accumulated Other Comprehensive Income / (Loss) Total Equity
Balance at December 31, 2013 16,862,087 $ 84,311 $ 239,952 $ (4,633) $ 187,612 $ - $ 507,242
Net income 33,844 33,844
Dividends declared on Common Stock to parent - CH Energy Group (5,000) (5,000)
Balance at December 31, 2014 16,862,087 $ 84,311 $ 239,952 $ (4,633) $ 216,456 $ - $ 536,086
Net income 45,588 45,588
Dividends declared on Common Stock to parent - CH Energy Group (24,524) (24,524)
Balance at December 31, 2015 16,862,087 $ 84,311 $ 239,952 $ (4,633) $ 237,520 $ - $ 557,150
Net income 52,644 52,644
Dividends declared on Common Stock to parent - CH Energy Group (24,524) (24,524)
Balance at December 31, 2016 16,862,087 $ 84,311 $ 239,952 $ (4,633) $ 265,640 $ - $ 585,270

- 19 -
NOTES TO FINANCIAL STATEMENTS
NOTE 1 – Summary of Significant Accounting Policies
Corporate Structure CH Energy Group is the holding company parent corporation of four principal, wholly owned subsidiaries, Central Hudson Gas & Electric Corporation (“Central Hudson”), Central Hudson Electric Transmission LLC (“CHET”), Central Hudson Enterprises Corporation (“CHEC”) and Central Hudson Gas Transmission LLC (“CHGT”). CH Energy Group’s common stock is indirectly owned by Fortis Inc. (“Fortis”), which is a leader in the North American regulated electric and gas utility industry. Central Hudson is a regulated electric and natural gas transmission and distribution utility. CHET was formed to engage in Federal Energy Regulatory Commission (“FERC”) transmission projects and has a 6.1% ownership interest in New York Transco LLC (“Transco”). In the first quarter of 2016, CHGT was formed to hold CH Energy Group’s ownership stake in possible gas transmission pipeline opportunities in New York State. As of December 31, 2016 there has been no activity at CHGT. CHEC has ownership interests in certain non-regulated subsidiaries that are less than 100% owned. Divestitures In March 2014, CHEC, the parent company of CH Energy Group’s non-regulated businesses and investments, completed the sale of its wholly owned operating subsidiary Griffith Energy Services, Inc. (“Griffith”) to Star Gas Partners, L.P. for approximately $102.0 million. Operating results for Griffith are reported as Discontinued Operations for the year ended December 31, 2014 in the Consolidated CH Energy Group Statement of Income. See Note 5 – “Investments in Unconsolidated Affiliates, Acquisitions and Divestitures” for further information. Basis of Presentation
This Annual Financial Report is a combined report of CH Energy Group and Central Hudson. The Notes to the Consolidated Financial Statements apply to both CH Energy Group and Central Hudson. CH Energy Group’s Consolidated Financial Statements include the accounts of CH Energy Group and its wholly owned subsidiaries, which include Central Hudson, CHET, CHGT and CHEC. All intercompany balances and transactions have been eliminated in consolidation. CHEC’s investments in limited partnerships (“Partnerships”) and limited liability companies and CHET’s investment in Transco are accounted for under the equity method. CHEC’s proportionate share of the change in fair value of available-for-sale securities held by the Partnerships is recorded in CH Energy Group’s Consolidated Statement of Comprehensive Income. The Financial Statements have been prepared in accordance with accounting principles generally accepted in the United States of America (“GAAP”), which for regulated public utilities, includes specific accounting guidance for regulated operations.

- 20 -
Regulatory Accounting Policies Regulated companies, such as Central Hudson, defer costs and credits on the balance sheet as regulatory assets and liabilities when it is probable that those costs and credits will be recoverable through the rate-making process in a period different from when they otherwise would have been reflected in income. For Central Hudson, these deferred regulatory assets and liabilities, and the related deferred taxes, are recovered from or reimbursed to customers either by offset as directed by the New York State Public Service Commission (“PSC”) or through incorporation in the determination of revenue requirement used to set new rates. Changes in regulatory assets and liabilities are reflected in the Consolidated Statement of Income in the period in which the amounts are reflected in rates. Current accounting practices reflect the regulatory accounting authorized in Central Hudson’s most recent rate order. See Note 3 – “Regulatory Matters” for additional information regarding regulatory accounting.
Rates, Revenues, and Cost Adjustment Clauses
Central Hudson’s electric and natural gas retail rates are regulated by the PSC. Transmission rates, facilities charges, and rates for electricity sold for resale in interstate commerce are regulated by the FERC. Central Hudson’s tariffs for retail electric and natural gas service include purchased electricity and purchased natural gas cost adjustment clauses by which electric and natural gas rates are adjusted to collect the actual purchased electricity and purchased natural gas costs incurred in providing these services.
Central Hudson’s delivery rate structure includes Revenue Decoupling Mechanisms (“RDMs”), which provide the ability to record revenues equal to those forecasted in the development of current rates for most of Central Hudson’s customers.
Use of Estimates
Preparation of the financial statements in accordance with GAAP includes the use of estimates and assumptions by management that affect the reported amounts of assets, liabilities and the disclosures of the contingent assets and liabilities at the date of the financial statements and the reported amounts of revenues and expenses during the reporting period. As with all estimates, actual results may differ from those estimated. Expense items most affected by the use of estimates are depreciation and amortization (including amortization of intangible assets), reserves for uncollectible accounts receivable, tax reserves, other operating reserves, unbilled revenues, pension and other post-retirement benefits, as well as, for certain commitments and contingencies.
Revenue Recognition Central Hudson records revenue on the basis of meters read. Effective July 1, 2016, in accordance with the 2015 Rate Order, Central Hudson implemented monthly billing to a majority of its customers. Based on the Order Approving Accounting Change with Modifications, issued and effective July 20, 2016, Central Hudson also records an estimate of unbilled revenue for service rendered to customers whose meters are not read on the last day of the month. Unbilled balances from the previous month reverse as current month actual bills

- 21 -
are processed. As a result, the net change to unbilled revenue is reflected on the income statement. Between the period from July 1, 2015 and July 1, 2016, prior to monthly billing and in accordance with the Order Approving Rate Plan (“2015 Rate Order”) in Cases 14-E-0318 and 14-G-0319, Central Hudson recorded an estimate of unbilled revenue for service rendered to bimonthly customers whose meters were read in the prior month. The estimate covered the 30 days subsequent to the meter read date while the remaining estimate of unbilled revenue exceeding 30 days, as defined under GAAP, was recorded with an offsetting regulatory liability balance. Prior to July 1, 2015, pursuant to regulatory requirements, the electric portion of unbilled electric revenues exceeding the 30-day estimate was not recorded at all. As of December 31, 2014, the portion of estimated electric unbilled revenues that was unrecognized in accordance with then current regulatory agreements was $13.1 million. See Note 3 – “Regulatory Matters” for additional information. Central Hudson records gross receipts tax revenues and expenses on a gross income statement presentation basis (i.e., included in both revenue and expenses). Total revenue taxes included in Operating Revenues are $7.5 million, $7.1 million and $7.2 million for the years ended December 31, 2016, 2015 and 2014, respectively. Sales and use taxes charged to customers on Central Hudson’s utility revenues are accounted for on a net basis (excluded from revenue).
Cash and Cash Equivalents CH Energy Group and Central Hudson consider temporary cash investments with a maturity (when purchased) of three months or less, to be cash equivalents. Restricted Cash Restricted cash in CH Energy Group and Central Hudson’s Balance Sheets in “Special Deposits and Prepayments” was $1.1 million at December 31, 2016 and $1.0 million at December 31, 2015. Restricted cash primarily consists of cash collected from developers and held in escrow related to a potential System Delivery upgrade project pursuant to terms and conditions of the New York Independent System Operator’s (“NYISO”) Open Access Transmission Tariff.
Accounts Receivable Receivables are carried at net realizable value. The allowance for doubtful accounts reflects management’s best estimate of uncollectible accounts receivable balances. Estimates for uncollectible accounts are based on customer accounts receivable aging data, as well as, consideration of various quantitative and qualitative factors, including special collection issues. Interest is charged on accounts receivable balances that have been outstanding for more than 30 days.

- 22 -
Fuel, Materials and Supplies
The following is a summary of CH Energy Group’s and Central Hudson’s fuel, materials and supplies valued using the average cost method (In Thousands): December 31, December 31, 2016 2015
Natural gas $ 4,054 $ 5,148 Fuel used in electric generation 462 482
Materials and supplies
19,493 13,153
Total $ 24,009 $ 18,783
Utility Plant - Central Hudson The regulated assets of Central Hudson include electric, natural gas and common assets, which are listed under the heading “Utility Plant” on CH Energy Group’s and Central Hudson’s Consolidated Balance Sheets. The accumulated depreciation associated with these regulated assets is also reported on the Balance Sheets. The cost of additions to utility plant and replacements of retired units of property are capitalized at original cost. Capitalized costs include labor, materials and supplies, indirect charges for such items as transportation, certain administrative costs, certain taxes, pension and other employee benefits, and allowances for funds used during construction (“AFUDC”); less contributions in aid of construction. AFUDC, is defined as the net cost of borrowed funds used for construction purposes and a reasonable rate on other funds when so used. The concurrent credit for the amount so capitalized is reported in the Consolidated Statement of Income as follows: the portion applicable to borrowed funds is reported as a reduction of interest charges while the portion applicable to other funds (the equity component) is reported as other income. The AFUDC rate was 5.7% in 2016, 6.2% in 2015 and 4.6% in 2014. The replacement of minor items of property is included in operating expenses. The original cost of property, together with removal cost less salvage, is charged to accumulated depreciation at the time the property is retired and removed from service as required by the PSC. For additional information see Note – 2 “Utility Plant – Central Hudson.”
Depreciation and Amortization
Central Hudson’s depreciation and amortization provisions are computed on the straight-line method using PSC approved rates based on studies of the estimated useful lives and estimated net salvage values of properties. The anticipated costs of removing assets upon retirement are generally provided for over the life of those assets as a component of depreciation expense and, for regulatory reporting purposes, is reflected in accumulated depreciation until the costs are incurred consistent with industry practice. Current accounting guidance related to asset retirement, precludes the recognition of expected future retirement obligations as a component of depreciation expense or accumulated depreciation. Central Hudson, however, is required to use depreciation methods and rates approved by the PSC

- 23 -
under regulatory accounting. These depreciation rates include a charge for the cost of future removal and retirement of fixed assets. Central Hudson performs depreciation studies periodically and, upon approval by the PSC, adjusts the depreciation rates of its various classes of depreciable property. Central Hudson’s composite rates for depreciation, inclusive of intangible amortization, were 2.71% in 2016, 2.73% in 2015 and 2.86% in 2014 of the original average cost of depreciable property. The ratio of the amount of accumulated depreciation to the original cost of depreciable property at December 31, 2016, 2015, and 2014 was 25.6%, 26.1% and 26.6%, respectively.
Asset Retirement Obligations Central Hudson records Asset Retirement Obligations (“AROs”) for the incremental removal costs, resulting from legal and environmental obligations associated with the retirement of certain utility plant assets, as a liability at fair value with a corresponding increase to utility capital assets, in the period in which the costs are known and estimable. The fair value of AROs is based on an estimate of the present value of expected future cash outlays, discounted at a credit-adjusted risk-free interest rate. AROs are adjusted at the end of each reporting period to accrete the liability for the passage of time and record any changes in the estimated future cash flows of the incremental obligation. Accretion and depreciation expense associated with AROs are recorded as regulatory assets. Actual costs incurred reduce the liability. The regulatory assets for accretion and depreciation are recovered through the accumulated depreciation reserve upon retirement of the asset. Impairment of Long-Lived Assets Central Hudson reviews long-lived assets for impairment, at least annually. Asset-impairment testing at the regulated utilities is carried out at the enterprise level to determine if assets are impaired. The recovery of regulated assets’ carrying value, including a fair rate of return, is provided through customer electricity and natural gas rates approved by the PSC. The net cash flows for regulated enterprises are not asset-specific, but are pooled for the entire regulated utility. Operating Leases CH Energy Group and its subsidiaries recognize operating lease payments as an expense in the Statement of Income on a straight line basis over the lease term.
Research and Development
Central Hudson is engaged in the conduct and support of research and development (“R&D”) activities that are focused on the improvement of existing energy technologies and the development of new technologies for the delivery and customer use of energy. R&D expenditures are provided for in Central Hudson’s rates charged to customers for electric and natural gas delivery service, with any differences between R&D expense and the rate allowances deferred for future recovery from or return to customers. See Note 6 – “Research and Development” for additional details.

- 24 -
Debt Issuance Costs Expenses incurred in connection with CH Energy Group’s or Central Hudson’s debt issuance and any discount or premium on debt are deferred and amortized over the lives of the related issues. When long-term debt is reacquired or redeemed, regulatory accounting permits deferral of related unamortized debt expense and reacquisition costs. These costs are being amortized over the remaining life of the original life of the debt issue retired. The amortization of debt costs for reacquired debt is incorporated in the revenue requirement for delivery rates as authorized by the PSC.
Income Tax CH Energy Group and its subsidiaries file consolidated federal income tax returns with their parent company and, depending on the state, either standalone or consolidated state income tax returns. Income taxes are deferred, for all differences between the financial statement and the tax basis of assets and liabilities, under the asset and liability method in accordance with current accounting guidance for income taxes. Certain deferred income taxes are recorded with offsetting regulatory assets or liabilities by Central Hudson to recognize that income taxes will be recovered or refunded through future rates. For federal and state income tax purposes, CH Energy Group and its subsidiaries use an accelerated method of depreciation and generally use the shortest life permitted for each class of assets. Central Hudson follows the normalization method of accounting, which spreads the tax benefits associated with utility assets over the same time period that the costs of those assets are recovered from customers. Normalization is required as a prerequisite for utilities claiming accelerated depreciation and certain tax credits. Deferred investment tax credits are amortized over the estimated life of the properties giving rise to the credits. For state income tax purposes, Central Hudson uses book depreciation for property placed in service in 1999 or earlier in accordance with transition property rules under Article 9-A of the New York State Tax Law. CHEC files state income tax returns in the states in which it conducts business. For more information, see Note 4 – “Income Tax”.
Post-Employment and Other Benefits Central Hudson sponsors a noncontributory Retirement Income Plan (“Retirement Plan”) for all management, professional and supervisory employees hired before January 1, 2008 and for all Union employees hired before May 1, 2008. Benefits are based on years of service and compensation. Central Hudson also provides Other Post-Employment Benefits (“OPEB”), which include certain health care and life insurance benefits for retirees hired within the same time period as stated above. Additionally, Central Hudson maintains a Supplemental Executive Retirement Plan (“SERP”) for certain members of management. Central Hudson recognizes the underfunded status of the defined benefit plans as a liability on its balance sheet. The underfunded status is measured as the difference between the fair value of the plans’ assets and the projected benefit obligation (“PBO”) for the plans. Central Hudson recognizes a regulatory asset for the underfunded amount because these future costs are probable for recovery from customers in future rates. Retirement Plan and SERP (collectively “Pension”) and OPEB benefit expenses are determined by actuarial valuations based on assumptions that Central Hudson evaluates at
- 25 -
least annually. The PSC has authorized deferral accounting treatment for any variations between actual pension and OPEB expenses and the amount included in the current delivery rate structure. Any unamortized balances related to net actuarial gains and losses, past service costs and transitional obligations, which would otherwise be recognized in accumulated other comprehensive income are subject to deferral accounting treatment. Central Hudson also sponsors a contributory 401(k) retirement plan (“401(k) plan”) for its employees. The 401(k) plan provides for employee tax-deferred salary deductions for participating employees and employer match contributions. For more information see Note 10 – “Post-Employment Benefits”.
Equity-Based Compensation Officers of CH Energy Group and Central Hudson were granted Share Unit Plan Shares (“SUPs”) under various plans as part of the officer’s long-term incentives. Compensation expense and the related liability associated with the SUPs is recorded based on the fair value at each reporting date until settlement reflecting expected future payout and time elapsed within the terms of the award, typically at the end of the three year vesting period. The fair value of the SUPs’ liability is based on Fortis’ common share 5 day volume weighted average trading price at the end of each reporting period. CH Energy Group and Central Hudson presently recognizes the effect of awards for which the requisite service is not rendered when the award is forfeited due to the limited number of participants in the equity-based compensation plans. For more information, see Note 11 – “Equity-Based Compensation”.
Common Stock Dividends CH Energy Group’s ability to pay dividends is affected by the ability of its subsidiaries to pay dividends. The Federal Power Act limits the payment of annual dividends by Central Hudson to its retained earnings. More restrictive is the PSC’s limit on the dividends Central Hudson may pay to CH Energy Group, which is 100% of the average annual income available for common stock, calculated on a two-year rolling average basis. See Note 8 – “Capitalization-Common and Preferred Stock” for additional information.
Derivatives From time to time, Central Hudson enters into derivative contracts in conjunction with the Company’s energy risk management program to hedge certain risk exposure related to its business operations. Central Hudson uses derivative contracts to reduce the impact of volatility in the supply prices of natural gas and electricity and to hedge exposure to volatility in interest rates for its variable rate long-term debt. Central Hudson records all derivatives at fair value with certain exceptions including those derivatives that qualify for the normal purchase and normal sales exception. The fair value of derivative instruments are estimates of the amounts that Central Hudson would receive or have to pay to terminate the outstanding contracts at the balance sheet dates.

- 26 -
Realized gains and losses on Central Hudson’s derivative instruments are conveyed to or recovered from customers through PSC-authorized deferral accounting mechanisms, with no material impact on cash flows, results of operations or liquidity. Realized gains and losses on Central Hudson’s energy derivative instruments are reported as part of purchased natural gas, purchased electricity and fuel used in electric generation in CH Energy Group’s and Central Hudson’s Statements of Income as the corresponding amounts are either recovered from or returned to customers through fuel cost adjustment clauses in revenues. See Note 14 – “Accounting for Derivative Instruments and Hedging Activities” for further details.
Normal Purchases and Normal Sales Central Hudson enters into forward energy purchase and sales contracts, including options, with counterparties that have generating capacity to support current load forecasts or counterparties that can meet Central Hudson’s load serving obligations. Central Hudson has elected the normal purchase or normal sales exception for these contracts, which are not required to be measured at fair value and are accounted for on an accrual basis. See Note 12 – “Commitments and Contingencies” for further details.
Reclassification Certain amounts in the prior year’s financial statements have been reclassified to conform to the 2016 presentation on CH Energy Group and Central Hudson’s financial statements.
Recently Adopted Accounting Policies Disclosures of Uncertainties about an Entity’s Ability to Continue as a Going Concern Effective January 1, 2016, CH Energy Group and Central Hudson adopted Accounting Standard Update (“ASU”) No. 2014-15. ASU 2014-15 provides guidance to management, with principles and definitions that are intended to reduce diversity in the timing and content of disclosures that are commonly provided today. The adoption of ASU 2014-15 was applied prospectively. There was no material impact on the financial condition, results of operations and cash flows of CH Energy Group and its subsidiaries upon adoption. Amendments to the Consolidation Analysis Effective January 1, 2016, CH Energy Group and Central Hudson adopted ASU No. 2015-02. ASU 2015-02 amends the consolidation requirements and significantly changes the consolidation analysis required. The ASU reduces the number of consolidation models from four to two, simplifies the Financial Accounting Standards Board (“FASB”) Accounting Standards Codification (“ASC”) and improves current GAAP by 1) placing more emphasis on risk of loss when determining a controlling financial; 2) reducing the frequency of the application of related-party guidance; and 3) changing consolidation conclusions for public and private companies in several industries that typically make use of limited partnerships or a variable interest entities (“VIE”). The adoption of ASU 2015-02 was applied retrospectively. There was no material impact on the financial condition, results of operations and cash flows of CH Energy Group and its subsidiaries upon adoption.
- 27 -
Customers Accounting for Fees Paid in a Cloud Computing Arrangement Effective January 1, 2016, CH Energy Group and Central Hudson adopted ASU No. 2015-05. ASU 2015-05 provides guidance for a customer to determine whether a cloud computing arrangement contains a software license or should be accounted for as a service contract. The adoption of ASU 2015-05 was applied prospectively to all arrangements entered into or materially modified after January 1, 2016. There was no material impact on the financial condition, results of operations and cash flows of CH Energy Group and its subsidiaries upon adoption. Disclosure for Investments in Certain Entities that Calculate Net Asset Value per Share (or its Equivalent) Effective January 1, 2016, CH Energy Group and Central Hudson adopted ASU No. 2015-07 that removes the requirement to categorize within the fair value hierarchy all investments for which fair value is measured using the net asset value per share practical expedient. The adoption of ASU 2015-07 was applied retrospectively to all periods presented. There was no material impact on the financial condition, results of operations and cash flows of CH Energy Group and its subsidiaries upon adoption. Defined Benefit Pension Plans: Fully Benefit-Responsive Investments Contracts(I), Plan Investment Disclosures(II) and Measurement Date Practical Expedient(III) Effective January 1, 2016, CH Energy Group and Central Hudson adopted ASU No. 2015-12 that simplifies the measurement, presentation and related disclosures for fully benefit-responsive investment contracts and disclosures about plan investments. The adoption of ASU 2015-12 was applied retrospectively to all periods presented. There was no material impact on the financial condition, results of operations and cash flows of CH Energy Group and its subsidiaries upon adoption. Compensation – Stock Compensation Effective January 1, 2016, CH Energy Group and Central Hudson adopted ASU No. 2016-09 which simplifies several aspects related to the accounting for income taxes, statutory holding requirements for forfeitures and classification on the statement of cash flows. The adoption of ASU 2016-09 related to the timing of when excess tax benefits are recognized, minimum statutory withholding requirements, forfeitures and intrinsic value was applied using the modified retrospective method. The adoption of ASU 2016-09 related to the presentation of employee taxes paid and the presentation of excess tax benefits on the statement of cash flows was applied retrospectively and the amendments requiring recognition of excess tax benefits/deficiencies in the income statement was applied prospectively. There was no material impact on the financial condition, results of operations and cash flows of CH Energy Group and its subsidiaries upon adoption.

- 28 -
NOTE 2 – Utility Plant - Central Hudson Utility Plant
The following summarizes the type and amount of assets included in the electric, natural gas, and common categories of Central Hudson’s utility plant balances: Estimated Depreciable December 31, Life in Years 2016 2015
Electric: (In Thousands)
Production 25-85 $ 38,945 $ 37,967
Transmission 30-80 317,900 299,078
Distribution 7-80 928,741 889,404
Other 40 4,294 4,214
Total $ 1,289,880 $ 1,230,663
Natural Gas:
Transmission 19-80 $ 55,974 $ 56,075
Distribution 28-95 400,854 360,938
Other N/A 443 442
Total $ 457,271 $ 417,455
Common:
Land and Structures 50 $ 74,036 $ 68,683
Office and Other Equipment, Radios and Tools 8-35 49,784 44,611
Transportation Equipment 10-12 61,530 57,381
Other 5-10 41,702 30,518
Total $ 227,052 $ 201,193
Gross Utility Plant $ 1,974,203 $ 1,849,311
For the years ended December 31, 2016, 2015 and 2014 the borrowed component of funds used during construction and recorded as a reduction of interest expense was $0.7 million, $0.6 million and $0.4 million, respectively, and the equity component reported as other income was $1.5 million for the year ended December 31, 2016, $1.2 million in 2015 and $0.6 million in 2014. Included in the Net Utility Plant balance of $1.5 billion and $1.4 billion at December 31, 2016 and 2015 is $72.0 million and $58.8 million of intangible utility plant assets, comprised primarily of computer software costs and land, transmission and water rights, and the related accumulated amortization of $30.7 million and $26.0 million, respectively. Amortization expense is estimated to average approximately $3.8 million annually for each of the next five years. As of December 31, 2016 and 2015 Central Hudson has reclassified from utility plant assets $46.8 million, and $46.6 million, respectively, of cost of removal recovered through the rate-making process in excess of amounts incurred to date as a regulatory liability. As of December 31, 2016 and 2015 AROs for Central Hudson were approximately $1.0 million, respectively. These amounts have been classified in the above chart under “Electric - Other” and “Common - Other” based on the nature of the ARO and are reflected as “Other - long-term liabilities” in the CH Energy Group and Central Hudson Balance Sheets.

- 29 -
NOTE 3 – Regulatory Matters
Summary of Regulatory Assets and Liabilities Based on previous, existing or expected regulatory orders or decisions, the following table sets forth amounts that are expected to be recovered from, or refunded to customers in future periods (In Thousands): December 31, December 31, 2016 2015 Regulatory Assets: Current: Deferred purchased electric costs $ 5,972 $ 8,154
Deferred purchased natural gas costs 8,162 1,233 Deferred unrealized losses on derivatives - Electric (Note 14) 1,198 9,152
Deferred unrealized losses on derivatives - Natural Gas (Note 14) - 990 PSC general and temporary state assessment and carrying charges 3,413 4,139
Deferred debt expense on re-acquired debt 521 520 Deferred and accrued costs - SIR (Note 12) 6,366 6,242
Other 357 358
$ 25,989 $ 30,788
Long-term: Deferred pension costs (Note 10) $ 52,251 $ 94,488
Carrying charges - pension reserve 2,892 1,181 Deferred unrealized losses on derivatives - Electric (Note 14) 744 1,476
Deferred and accrued costs - SIR and carrying charges (Note 12) 73,085 80,959 Deferred debt expense on re-acquired debt 3,418 3,938
Income taxes recoverable through future rates 23,334 29,734 Energy efficiency incentives and carrying charges 5,347 5,061
Deferred vacation pay accrual 6,726 5,909 Reforming the Energy Vision ("REV") and carrying charges 5,716 252
Deferred storm costs and carrying charges 4,714 5,281 Other 11,364 6,375
$ 189,591 $ 234,654 Total Regulatory Assets $ 215,580 $ 265,442
Regulatory Liabilities: Current:
Rate moderator - Electric $ 7,067 $ 12,655 Rate moderator - Natural Gas 5,269 3,411
RDM and carrying charges - Electric 14,582 5,419 RDM and carrying charges - Natural Gas 1,308 3,492
Deferred unrealized gains on derivatives - Electric (Note 14) 2,454 - Deferred unrealized gains on derivatives - Gas (Note 14) 856 -
Deferred unbilled electric and gas revenues (Note 1) - 17,452
$ 31,536 $ 42,429
Long-term: Rate moderator - Electric and carrying charges $ 35,794 $ 40,778
Rate moderator - Natural Gas and carrying charges 4,640 6,423 Customer benefit fund 4,032 5,665
Deferred cost of removal (Note 2) 46,757 46,561 Deferred unrealized gains on derivatives - Electric (Note 14) - 2,218
Income taxes refundable through future rates 18,682 23,810 Deferred OPEB costs 26,966 25,663
Carrying charges - OPEB reserve 3,984 1,384 Deferred unbilled revenues (Note 3) 5,082 -
Energy efficiency programs and carrying charges 33,028 3,061 Other 10,527 3,088
$ 189,492 $ 158,651 Total Regulatory Liabilities $ 221,028 $ 201,080
Net Regulatory Assets (Liabilities) $ (5,448)
$ 64,362

- 30 -
The significant regulatory assets and liabilities not referenced in other notes to the financial statement include:
Rate Moderator – Electric and Natural Gas: Under the terms of the 2015 Rate Order, certain regulatory assets and liabilities were identified for offset and a regulatory liability was established with the net balance, which will be used for future customer rate moderation (“Rate Moderator”). In addition, per the 2015 Rate Order, Central Hudson is required to defer actual delivery revenues associated with providing natural gas to Danskammer Generating Station which are to be used for future Rate Moderation. The current portion of the Rate Moderator represents the amount estimated to be used for rate moderation in the next twelve months related to customer electric and natural gas bill credits as prescribed in the 2015 Rate Order. PSC General and Temporary State Assessment: In April 2009, the PSC issued an order instituting a new Temporary New York State Assessment (“NYSA”) to be collected through utility bills as mandated by New York State (“NYS”) over five years from July 1, 2009 through June 30, 2014 and the authorization for deferral accounting on the assessments. In 2013, the NYSA was extended through March 31, 2017. In June 2014, the PSC issued subsequent orders which extended the recovery period through December 31, 2017. The last assessment to Central Hudson under PSL Section 18-a (6) for the state’s fiscal year of April 1, 2017 through March 31, 2018 will be collected from customers over the six month period of July 1, 2017 through December 31, 2017. Central Hudson is required to make bi-annual payments of this assessment, in conjunction with its payments of the PSC General Assessment, and to collect the amount from customers in subsequent months. Revenue Decoupling Mechanism (“RDMs”): Central Hudson’s delivery rate structure includes RDMs, which provide the ability to record revenues equal to those forecasted in the development of current rates for most of Central Hudson’s customers. The difference between actual revenues and forecasted revenues are deferred for future recovery from or refund to customers with the deferred balance subject to carrying charges at the Other Customer Deposit Rate approved annually by the PSC.
Deferred Debt Expense on Reacquired Debt: When long-term debt is reacquired or redeemed, regulatory accounting permits deferral of related unamortized debt expense and reacquisition costs. These costs are being amortized over the remaining life of the original life of the issue retired. The amortization of debt costs for reacquired or redeemed debt is incorporated in the revenue requirement for delivery rates as authorized by the PSC. Carrying Charges - Pension Reserve: Under the policy of the PSC regarding pension costs, carrying charges are accrued on cash differences between rate allowances and cash contributions to Central Hudson’s defined benefit pension plan. For further discussion regarding this plan, see Note 10 – “Post-Employment Benefits.”
Income Taxes Recoverable: This regulatory asset has been established to offset certain deferred tax liabilities because Central Hudson believes it is probable that they will be recoverable from customers. Energy Efficiency Incentives: In 2008, Central Hudson received approval through the Energy Efficiency Portfolio Standard (“EEPS”) proceedings to implement various programs for electric and natural gas residential and commercial customers. In December 2010, the PSC issued an

- 31 -
order combining energy savings targets to create a single 2009-2011 incentive target. In 2011, Central Hudson earned $2.7 million in incentives under the 2009-2011 defined targets. In 2012, the PSC issued a separate order establishing a single incentive target for 2012-2015. Central Hudson earned approximately $2.1 million of electric and $0.2 million of natural gas incentives during 2015 under the 2012-2015 defined targets. Deferred Storm Costs: Central Hudson is authorized to request and the PSC has historically approved deferral accounting for incremental storm restoration costs which meet the following criteria: (1) the expense must be incremental to the amount provided in rates, (2) the incremental costs must be material and extraordinary in nature, and (3) the Company’s earnings cannot be in excess of the authorized regulatory rate of return. As of December 31, 2015, Central Hudson has deferred $5.3 million of incremental costs incurred for the restoration of electric service to customers following the impact of the November 27, 2014 storm (“2014 Thanksgiving Storm” or “SnowBird”). Central Hudson filed a petition with the PSC on August 7, 2015 seeking Commission approval to recover the incremental electric storm restoration expense associated with SnowBird, with carrying charges. On January 21, 2016, under Case 15-E-0464, the PSC approved the deferral of incremental storm restoration costs together with carrying charges at the allowed pre-tax rate of return. Recovery of these costs has been postponed until the next rate filing. Income Taxes Refundable: This regulatory liability was established to offset certain deferred tax assets because Central Hudson believes it is probable that the related balances will be refundable to customers. Customer Benefit Fund: The 2010 Order prescribed the use of the residual balance to fund economic development. Carrying Charges - OPEB Reserve: Under the policy of the PSC regarding OPEB costs, carrying charges are accrued on cash differences between rate allowances and cash contributions to Central Hudson’s OPEB plan. For further discussion regarding this plan, see Note 10 – “Post-Employment Benefits.”
Deferred Vacation Pay Accrual: In accordance with Rate Order 84-2 a regulatory asset has been established to offset the accrued vacation liability since the accrued compensation is included in future allowable costs on an as paid basis and there is reasonable assurance of recovery. Reforming the Energy Vision (“REV”): This regulatory asset was established to defer costs associated with REV demonstration projects, as permitted under the 2015 Rate Order. The REV program was established by the PSC during 2014 in an effort to provide customers with the knowledge and tools for more effective management of their total energy use through the use of new technologies on both the utility and customer side. Energy Efficiency Programs: This regulatory liability has been established to fund costs of environmental policy associated with energy conservation programs and megawatt hour reduction goals which have been approved for funding by the PSC.

- 32 -
In terms of the expected timing for recovery, regulatory asset balances at December 31, 2016 and 2015 reflect the following (In Thousands):
December 31,
2016 December 31,
2015
Balances with offsetting accrued liability balances recoverable when future costs are actually incurred:
Deferred pension related to underfunded status $ 48,277 $ 91,161
Income taxes recoverable through future rates 23,334 29,734
Deferred unrealized losses on derivatives 1,942 11,618
Deferred costs - SIR sites 72,887 92,119
Other 6,726 5,909
$ 153,166 $ 230,541
Balances earning a return via inclusion in rates and/or the application of carrying charges:
Deferred pension costs undercollected(1)
$ 3,974 $ -
PSC general and temporary state assessment 3,231 4,015
Deferred storm costs 4,159 4,991
Reforming the Energy Vision 5,572 251
Actual SIR costs and recoveries 6,816 -
Deferred debt expense on re-acquired debt 3,939 4,458
Other(1)
10,226 4,705
$ 37,917 $ 18,420
Subject to current recovery:
Deferred purchased electric costs $ 5,972 $ 8,154
Deferred purchased natural gas costs 8,162 1,233
Other - 195
$ 14,134 $ 9,582
Other:
Energy efficiency incentives(1)
$ 4,984 $ 4,984
Other 1,037 193
$ 6,021 $ 5,177
Accumulated carrying charges:(1)
Pension reserve $ 2,892 $ 1,181
Other 1,450 541
$ 4,342 $ 1,722
Total Regulatory Assets $ 215,580 $ 265,442
(1) Subject to recovery in Central Hudson's future rate proceedings.
2013 Acquisition Order/2015 Rate Order
From July 1, 2010 through June 30, 2013, Central Hudson operated under the terms of the 2010 Rate Order. On June 26, 2013, the PSC issued its Order Authorizing Acquisition Subject to Conditions in Case 12-M-0192 (the “2013 Acquisition Order”), which was accepted on June 27, 2013. The 2013 Acquisition Order adopted the terms of the 2013 Joint Proposal dated January 25, 2013 for the acquisition of CH Energy Group, owner of Central Hudson, by Fortis along with additional commitments by the companies to enhance financial protection for ratepayers and other community and economic development benefits. The 2013 Acquisition Order included a two year rate freeze on electric and natural gas delivery rates and extended certain terms of the 2010 Rate Order through June 30, 2015. On June 17, 2015, the PSC issued an Order establishing the 2015 Rate Order, adopting the terms set forth in the April 22, 2015 Joint Proposal with minor modifications. The 2015 Rate Order became effective July 1, 2015, with Rate Year 1 (“RY1”), Rate Year 2 (“RY2”) and Rate Year 3 (“RY3”) defined as the twelve months ending June 30, 2016, June 30, 2017 and June 30, 2018, respectively.

- 33 -
A summary of the key terms of the 2013 Joint Proposal and 2015 Rate Order are as follows: 2015 Rate Order
Description 2013 Acquisition Order Rate Year 1 Rate Year 2 Rate Year 3
Electric delivery rate increases $0 through June 30, 2015 $15.3 Million $16.0 Million $14.1 Million
Natural gas delivery rate increases $0 through June 30, 2015 $1.8 Million $4.6 Million $4.4 Million
Return on Equity ("ROE") 10.00% 9.00% 9.00% 9.00%
Earnings sharing Yes(1)
Yes(2)
Yes(2)
Yes(2)
Capital structure – common equity 48% 48% 48% 48%
Positive benefit adjustments $35.0 million(3)
N/A N/A N/A
Community benefit fund $5.0 million(3)
N/A N/A N/A
Bill Credits - Electric N/A $13.0 Million $12.0 Million $2.0 Million
Bill Credits - Natural Gas N/A $2.548 Million $1.7 Million(5)
$0(5)
Major Storm Reserve - Electric N/A $0.7 Million $0.7 Million $0.7 Million
Synergy Savings $1.85 million(4)
N/A N/A N/A
RDMs – electric and natural gas Yes Yes Yes Yes
(1) ROE > 10.0% and up to 10.5%, 50% to customers, > 10.5%, 90% to customers. (2) ROE > 9.5% and up to 10.0%, 50% to customers, > 10.0% and up to 10.5%, 80% to customers, > 10.5%, 90% to customers. (3) To cover expenses typically recovered from rate payers, such as storm restoration costs and for economic development and low-
income customer assistance programs. (4) Guaranteed annual synergy savings of $1.85 million to ratepayers for 5 years. (5) In addition to natural gas bill credits, 50% of gas delivery revenues from the Danskammer Generating Station in RY1 will be refunded to
customers via bill credit in RY2. In addition, 50% of revenues from RY2 will be refunded as a natural gas bill credit in RY3.
Other key provisions of the 2015 Rate Order include:
The Rate Order provides for partial or full reconciliation of certain expenses including, but not limited to: property taxes; pensions/OPEBs; environmental site investigation and remediation costs; variable and fixed rate debt; and stray voltage. In addition, the Rate Order includes downward-only reconciliations for net plant; distribution and transmission right-of-way maintenance costs; security costs and rate case expenses. The Rate Order also authorizes a continuation of full cost recovery of electric and natural gas commodity costs.
Central Hudson’s Customer Service Quality Performance Mechanisms (consisting of the PSC Annual Compliant Rate, the Customer Satisfaction Index and Appointments Kept measures) and more stringent electric reliability and natural gas safety performance metrics continue. The Company will be subject to a negative revenue adjustment if it fails to meet specific metrics as set forth in the Rate Order.
The Rate Order directs Central Hudson to replace or eliminate 13 miles of leak prone pipe in calendar year 2016, 14 miles in 2017 and 15 miles in 2018. In the event the Company fails to meet its leak prone pipe target in any calendar year, the Company will be subject to an 8 basis point negative revenue adjustment. If the Company exceeds the mileage target, it is authorized to defer the incremental costs associated with the additional miles up to $1.4 million for every mile over 13 miles in 2016, up to $1.5 million for every mile over 14 miles in 2017 and up to $1.6 million for every mile above 15 miles in 2018. The Rate Order also provides the Company with an incentive to surpass its leak prone pipe target for a positive revenue adjustment for each mile replaced or eliminated in excess of the applicable target, capped at maximum of 5 miles for a total of 10 basis points per calendar year, which the Company would defer for future recovery.

- 34 -
The Rate Order provides for a $1 million annual program funding each Rate Year to provide additional incentives and support for customer conversion to natural gas. Central Hudson will receive an annual incentive in the form of 1 basis point for every 200 natural gas customers added above the combined total customer count forecast for residential and commercial customers for each Rate Year.
The Rate Order directs the Company to transition to monthly billing for all customers by July 2016.
The Rate Order provides for Network Strategy and Distribution Automation capital expenditures. Full implementation of the Network Strategy and Distribution Automation project beyond Rate Year 1 will be dependent upon the PSC’s agreement that the Company has successfully demonstrated the functional capability and operation/integration of these investments.

- 35 -
Other PSC Proceedings On August 7, 2015, Central Hudson filed a petition with the PSC seeking recovery of $5.284 million of incremental electric storm restoration expense plus carrying charges incurred during the twelve months ended June 30, 2015, from the 2014 Thanksgiving Storm. These incremental costs represent the amount Central Hudson deferred on its books based on actual costs incurred and bills received. On January 22, 2016, under Case 15-E-0464, the PSC approved the deferral of incremental storm restoration costs together with carrying charges at the allowed pre-tax rate of return. The method of recovery will be addressed in the Company’s next rate case filing. Deferral of incremental costs exceeding 2% of net income related to governmental mandates was authorized in the 2010 Rate Order, Case 09-E-0588, and was extended for two additional rate years in Case 12-M-0192. There are currently regulatory asset balances associated with two deferrals for costs under this provision included during the last rate year of the extended rate freeze:
On October 14, 2015, Central Hudson filed a deferral petition seeking approval and recovery of $2.2 million of incremental expense associated with new compliance and reporting requirements resulting from multiple Commission Orders stemming from a natural gas incident in Horseheads, New York. On February 5, 2016, Central Hudson received a letter from the PSC’s Office of Accounting, Audits and Finance indicating that the PSC had reviewed and audited the deferred balances and was in agreement with the amount deferred at December 31, 2015. The method of recovery will be addressed in the Company’s next rate case filing.
On September 1, 2015, Central Hudson filed a deferral petition with the PSC seeking approval and recovery of $1.0 million of incremental expense associated with new compliance requirements resulting from the North American Reliability Corporation’s (“NERC’s”) change to the definition of the Bulk Electric System, as approved by FERC. On February 5, 2016, Central Hudson received a letter from the PSC’s Office of Accounting, Audits and Finance indicating that the PSC had reviewed and audited the deferred balances and was in agreement with the amount deferred at December 31, 2015. The method of recovery will be addressed in the Company’s next rate case filing.
Petition for Accounting Change On April 28, 2016, the Company filed a Petition for Accounting Change related to the required treatment of unbilled revenues set forth in the Order Approving Rate Plan (“Order”), issued and effective June 17, 2015, in Cases 14-E-0318 and 14-G-0319, to provide better matching of revenues and expenses. This Order required Central Hudson to defer and recognize residual unbilled revenue as a regulatory liability (as described in the approved Joint Proposal under Section V, subpart A, 4(h)). Specifically, Central Hudson sought approval to record and recognize residual unbilled revenue as revenue on the income statement each month beginning with the month of July 2016. On July 20, 2016, the PSC issued the “Order Approving Accounting Change with Modification” allowing Central Hudson to realize unbilled revenue as revenue on the income statement citing conformity with GAAP and the accounting treatment at other utilities in NYS. However, the

- 36 -
Order also requires a portion of the unbilled revenues remain as a regulatory liability for the future benefit of customers. Approximately $14.1 million was recognized as unbilled revenues which occurred concurrent with the transition to monthly billing and provided an offset for the $9.0 million earnings impact that would have resulted from the RDM targets being set without consideration for the transition to monthly billing. The net impact on earnings of approximately $5.1 million was required to be deferred to ensure there was no net earnings impact that resulted from the transition to monthly billing. The deferral is included in “Regulatory Liabilities – other long-term” in CH Energy Group and Central Hudson’s Balance Sheets.
NOTE 4 – Income Tax
Uncertain Tax Positions In September of 2010, Central Hudson filed a request with the Internal Revenue Service (“IRS”) to change its tax accounting method related to costs to repair and maintain utility assets. The change was effective for the tax year ended December 31, 2009. This change allows Central Hudson to take a current tax deduction for a significant amount repair costs that were previously capitalized for tax purposes. In September 2012, Central Hudson filed corporate income tax returns for the year ended December 31, 2011. With that filing, Central Hudson included an election to adopt the provisions of Revenue Procedure 2011-43 (“Rev Proc”), which provided IRS guidance related to a repair deduction previously taken on electric transmission and distribution property. As such, tax reserves related to the electric transmission and distribution repair deductions, which were established prior to issuance of the Rev Proc, were reclassified to deferred tax liability accounts. IRS guidance, with respect to repair deductions taken on Gas Transmission and Distribution repairs is still pending. Therefore, remaining reserves related to the gas repair deduction continue to be shown as “Tax Reserve” under the Deferred Credits and Other Liabilities section of the CH Energy Group and Central Hudson Balance Sheet. Other than the uncertain tax position related to Central Hudson’s accounting method change for gas transmission and distribution repairs, there are no other uncertain tax positions. The decrease in the tax reserve for 2016 was primarily due to a reclassification of $3.4 million of the federal uncertain tax position to a deferred tax asset per ASU No. 2013-11, Presentation of an Unrecognized Tax Benefit When a Net Operating Loss (“NOL”) Carryforward, a Similar Tax Loss, or a Tax Credit Carryforward Exists. This decrease more than offset the increase related to current repair deductions for Gas Transmission and Distribution.
The following is a summary of activity related to uncertain tax positions (In Thousands): December 31,
2016 2015
Tax reserve balance at the beginning of the period 1 $ 3,520 $ 2,693
Adjustments related to current period activity 1,436 685
Change in NOL offset (3,253) 142
Tax reserve balance at the end of the period $ 1,703 $ 3,520

- 37 -
Income Tax Examinations Jurisdiction Tax Years Open for Audit
Federal 2013 – 2015
New York State 2013 – 2015
Components of Income Tax - CH Energy Group The following is a summary of the components of federal and state income taxes for CH Energy Group as reported in its Consolidated Statements of Income (In Thousands): Year Ended December 31,
2016 2015 2014
Federal income tax $ (3,038) $ 4,692 $ 3,778
State income tax 105 3,371 677
Deferred federal income tax 29,299 18,768 14,951
Deferred state income tax 5,275 4,297 790
Total income tax expense from Continuing Operations $ 31,641 $ 31,128 $ 20,196
Reconciliation - CH Energy Group The following is a reconciliation between the amount of federal income tax computed on income before taxes at the statutory rate and the amount reported in CH Energy Group’s Consolidated Statements of Income (In Thousands): Year Ended December 31,
2016 2015 2014
Net income from Continuing Operations $ 50,905 $ 43,740 $ 26,631
Federal income tax (3,038) 4,692 3,778
State income tax 105 3,371 677
Deferred federal income tax (1)
29,299 18,768 14,951
Deferred state income tax (1)
5,275 4,297 790
$ 82,546 $ 74,868 $ 46,827
Computed federal tax at 35% statutory rate $ 28,891 $ 26,204 $ 16,389
State income tax net of federal tax benefit 4,149 3,868 2,504
State income tax prior period adjustment (574) (797) -
State income tax rate change (78) 1,913 (1,203)
Depreciation flow-through 2,732 3,208 4,009
Cost of removal (2,655) (2,566) (2,347)
Nondeductible compensation expense - 8 1,756
Other (824) (710) (912)
Total income tax expense from Continuing Operations $ 31,641 $ 31,128 $ 20,196
Effective tax rate - federal 31.8% 31.3% 40.0%
Effective tax rate - state 6.5% 10.2% 3.1%
Effective tax rate - combined 38.3% 41.5% 43.1%
(1) In 2015, there was a change in presentation of the above chart related to federal and state deferred taxes. The federal benefit of state
deferred tax in 2016 and 2015 is shown on the “Deferred federal income tax” line, whereas in 2014, it was shown net within the “Deferred state income tax” line. If the federal and state effective tax rates for 2014 were presented in line with the current presentation, the federal and state effective tax rates for the year ended December 31, 2014 would have been 39.1% and 4.0%, respectively.

- 38 -
For 2016, the lower combined effective tax rate was driven by decreases in the book reserves, which are not considered income for tax purposes and the associated deferred taxes that are recorded with an offsetting regulatory asset or liability. For 2015, the higher the combined effective tax rate was driven by the one-time adjustments to long term NYS deferred tax assets to reflect the reduction in NYS corporate income tax rate from 7.1% to 6.5%, which was enacted into law on March 31, 2014 and effective January 1, 2016. The higher overall effective rate for 2014 is due to the 2014 impact of the nondeductible compensation expense related to the election of two CH Energy Group officers to resign under the Change in Control agreements, which was partially offset by a decrease to the effective rate from the one-time adjustments to long term NYS deferred tax liabilities to reflect the reduction in NYS tax rate.
The following is a summary of the components of deferred taxes as reported in CH Energy Group’s Consolidated Balance Sheets (In Thousands): December 31,
2016 2015
Accumulated Deferred Income Tax Asset:
Unbilled revenues $ 2,300 $ 7,000
Plant-related 5,713 5,405
Regulatory liability - future income tax 15,937 21,340
OPEB expense 20,267 22,328
NOL carryforwards(1)
1,924 -
Energy efficiency over/under collection 12,908 1,148
Rate moderator 20,699 25,063
Contributions in aid of construction 12,845 11,966
Directors and officers deferred compensation 12,919 11,980
Revenue decoupling mechanism 5,677 2,147
SIR cost and recovery - 1,895
Electric fuel costs - 245
R&D credit carryforward 168 -
Other 9,806 7,328
Accumulated Deferred Income Tax Asset $ 121,163 $ 117,845
Accumulated Deferred Income Tax Liability:
Depreciation $ 306,862 $ 281,499
Repair allowance 8,030 8,443
Pension expense 12,651 16,005
Change in tax accounting for repairs 85,968 73,195
Regulatory asset - future income tax 16,197 22,885
PSC assessments 1,139 1,411
Cost of removal 5,978 6,024
Medicare act subsidy 3,696 4,392
SIR cost and recovery 2,674 -
REV demonstration 2,186 99
Electric fuel costs 2,805 -
Pension reserve carrying charges 1,134 468
Natural gas costs 3,202 490
Storm deferrals 2,045 2,117
Other 3,601 283
Accumulated Deferred Income Tax Liability $ 458,168 $ 417,311
Net Deferred Income Tax Liability $ 337,005 $ 299,466
(1) Under ASU No. 2013-11, the presentation of uncertain tax positions when a NOL carryforward exists should be netted with the NOL carryforward. As of December 31, 2016, $3.4 million of uncertain tax positions have been netted with the NOL carryforward presented above. As of December 31, 2015, approximately $0.2 million of uncertain tax positions have been netted with the NOL carryforward.

- 39 -
Components of Income Tax - Central Hudson The following is a summary of the components of state and federal income taxes for Central Hudson as reported in its Statement of Income (In Thousands): Year Ended December 31,
2016 2015 2014
Federal income tax $ (2,374) $ 5,998 $ 10,718
State income tax (519) 2,371 667
Deferred federal income tax 29,379 18,420 9,921
Deferred state income tax 5,346 4,357 1,055
Total income tax expense $ 31,832 $ 31,146 $ 22,361
Reconciliation - Central Hudson The following is a reconciliation between the amount of federal income tax computed on income before taxes at the statutory rate and the amount reported in Central Hudson’s Statement of Income (In Thousands): Year Ended December 31, 2016 2015 2014
Net income $ 52,644 $ 45,588 $ 33,844 Federal income tax (2,374) 5,998 10,718 State income tax (519) 2,371 667 Deferred federal income tax
(1) 29,379 18,420 9,921
Deferred state income tax (1)
5,346 4,357 1,055
Income before taxes $ 84,476 $ 76,734 $ 56,205
Computed federal tax at 35% statutory rate $ 29,566 $ 26,857 $ 19,672 State income tax net of federal tax benefit 3,847 3,257 2,692 State income tax prior period adjustment (631) (797) - State income tax rate change (78) 1,913 (1,203) Depreciation flow-through 2,732 3,208 4,009 Cost of Removal (2,655) (2,566) (2,347) Other (949) (726) (462)
Total income tax expense $ 31,832 $ 31,146 $ 22,361
Effective tax rate - federal 32.0% 31.8% 36.7% Effective tax rate - state 5.7% 8.8% 3.1%
Effective tax rate - combined 37.7% 40.6% 39.8%
(1) In 2015, there was a change in presentation of the above chart related to federal and state deferred taxes. The federal benefit of state
deferred tax in 2016 and 2015 is shown on the “Deferred federal income tax” line, whereas in 2014, it was shown net within the “Deferred state income tax” line. If the federal and state effective tax rates for 2014 were presented in line with the current presentation, the federal and state effective tax rates for the year ended December 31, 2014 would have been 35.7% and 4.0%, respectively.
For 2016, the lower combined effective rate was driven by decreases in the book reserves, which are not considered income for tax purposes and the associated deferred taxes that are recorded with an offsetting regulatory asset or liability. For 2015, the higher combined effective tax rate was driven by the one-time adjustment to long term NYS deferred tax assets to reflect the reduction in the NYS corporate income tax rate from 7.1% to 6.5%, which was enacted into law on March 31, 2014 and effective January 1, 2016. For 2014, the one-time adjustments to long-term NYS deferred tax liabilities to reflect the reduction in NYS tax rates resulted in a decrease in the NYS effective tax rate.

- 40 -
The following is a summary of the components of deferred taxes as reported in Central Hudson’s Balance Sheet (In Thousands): December 31,
2016 2015
Accumulated Deferred Income Tax Asset:
Unbilled revenues $ 2,300 $ 7,000
Plant-related 5,713 5,405
Regulatory liability - future income tax 15,937 21,340
OPEB expense 20,267 22,328
NOL carryforwards(1)
1 - -
Energy efficiency over/undercollection 12,908 1,148
Rate moderator 20,699 25,063
Contributions in aid of construction 12,845 11,966
Directors and officers deferred compensation 12,919 11,980
Revenue decoupling mechanism 5,677 2,147
SIR cost and recovery - 1,895
Electric fuel costs - 245
R&D credit carryforward 168 -
Other 6,942 4,506
Accumulated Deferred Income Tax Asset $ 116,375 $ 115,023
Accumulated Deferred Income Tax Liability:
Depreciation $ 306,862 $ 281,499
Repair allowance 8,030 8,443
Pension expense 12,651 16,005
Change in tax accounting for repairs 85,968 73,195
Regulatory asset - future income tax 16,197 22,885
PSC assessments 1,139 1,411
Cost of removal 5,978 6,024
Medicare act subsidy 3,696 4,392
SIR cost and recovery 2,674 -
REV demonstration 2,186 99
Electric fuel costs 2,805 -
Pension reserve carrying charges 1,134 468
Natural gas costs 3,202 490
Storm deferrals 2,045 2,117
Other 1,514 283
Accumulated Deferred Income Tax Liability $ 456,081 $ 417,311
Net Deferred Income Tax Liability $ 339,706 $ 302,288
(1) Under ASU No. 2013-11, the presentation of uncertain tax positions when a NOL carryforward exists should be netted with the
NOL carryforward. As of December 31, 2016, approximately $3.4 million of uncertain tax positions have been netted with the NOL carryforward absorbing the entire NOL of $3.4 million. As of December 31, 2015, approximately $0.2 million of uncertain tax positions have been netted with the NOL carryforward.

- 41 -
NOTE 5 – Investments in Unconsolidated Affiliates, Acquisitions and Divestitures
Investments In the first quarter of 2016, CH Energy Group formed CHGT to hold an ownership stake in possible gas transmission pipeline opportunities in New York State. As of December 31, 2016 there has been no activity at CHGT. In 2014, CH Energy Group formed CHET to engage in electric transmission projects. The first undertaking of CHET was the execution of the Transco agreement. CHET’s ownership interest in Transco is 6.1%. In November 2015, Transco filed an Offer of Partial Settlement with FERC (”Transco’s Settlement”), resolving all issues in Transco’s Initial FERC Filing. FERC approved Transco’s Settlement in March 2016 and three projects were placed in service on June 1st, after receiving the remaining regulatory approvals in May 2016. The total estimated cost for the three projects included in Transco’s Settlement was approximately $203.0 million. During 2016, CHET made capital contributions to Transco of $6.5 million to fund these projects. As of December 31, 2016 and 2015, the value of CHET's investment in Transco was approximately $6.9 million and $0.3 million, respectively. CHEC has equity investments in partnerships, one of which holds investments in energy sector start-up companies. As of December 31, 2016 and 2015, the value of CHEC's equity investments were $0.8 million and $1.1 million, respectively. These investments are not considered to be a part of the core business; however, management intends to retain these investments at this time.
Acquisitions During the years ended December 31, 2016 and 2015, there were no acquisitions made by CH Energy Group or any of its subsidiaries. Divestitures In March of 2014 CHEC sold Griffith for net proceeds of approximately $95 million. The results of operations to the date of sale are presented as Discontinued Operations on the CH Energy Group Consolidated Statement of Income for the period ended December 31, 2014. Management has elected to include cash flows from discontinued operations of this investment with those from continuing operations in the CH Energy Group Consolidated Statement of Cash Flows. As a result of the disposal, earnings from discontinued operations of $7.0 million, $5.0 after tax, were recognized in the first quarter of 2014.
NOTE 6 – Research and Development Central Hudson’s R&D expenditures were $2.7 million in 2016, $4.0 million in 2015 and $3.3 million in 2014. These expenditures were for internal research programs and for contributions to research administered by New York State Energy Research and Development Authority (“NYSERDA”), the Electric Power Research Institute and other industry organizations.

- 42 -
NOTE 7 – Short-Term Borrowing Arrangements
CH Energy Group and Central Hudson borrowings under their unsecured committed and uncommitted short-term borrowing arrangements are as follows: Description CH Energy Group Central Hudson
Revolving Credit Facilities:(1)
Limit $50 million(2)
/ $200 million(3)
$200 million(3)
Expiration July 10, 2020 / October 15, 2020 October 15, 2020
Use of proceeds For general corporate purposes
For capital expenditures and
for general corporate purposes
For capital expenditures and for general corporate purposes
Letters of Credit: Available up to
$25 million(2)
Available up to
$15 million(3)
Available up to $15 million
(3)
CH Energy Group Central Hudson
December 31, December 31,
2016 2015 2016 2015
Outstanding (In Thousands):
Committed Credit $ - $ 12,000 $ - $ 12,000
Uncommitted Credit(4)
- 13,000 - 13,000
Intercompany Borrowing(5)
- - - 2,000
Total 1
$ - $ 25,000 $ - $ 27,000
Weighted Average Interest Rate 0.00% 1.16% 0.00% 1 1.15% (1) Providing committed credit. The credit facilities include a covenant that the total consolidated total funded debt to total capital of CH
Energy Group and total funded debt to total capital of Central Hudson, respectively shall not exceed 0.65 to 1.00. The credit facilities are all subject to certain restrictions and conditions, including there will be no event of default, and subject to certain exceptions, CH Energy Group and Central Hudson will not sell, lien, or otherwise encumber its assets and enter into certain transactions including those with affiliates. CH Energy Group and Central Hudson are also required to pay a commitment fee calculated at a rate based on the applicable Standards and Poor’s or Moody’s rating on the average daily unused portion of the credit facilities. CH Energy Group and Central Hudson are in compliance with all debt covenants.
(2) Participating banks in the credit facility for CH Energy Group are JPMorgan Chase Bank, N.A., Bank of America, N.A., Wells Fargo Bank, N.A. and KeyBank National Association. Included as part of the $50 million revolving credit facility is a $10 million Swingline Facility, whereby loans are available up to $10 million with a maturity of 14 days or less. If these lenders are unable to fulfill their commitments under these facilities, funding may not be available as needed.
(3) Participating banks in the credit facility for Central Hudson are JPMorgan Chase Bank, N.A., Bank of America, N.A., Wells Fargo Bank, N.A., KeyBank National Association, Bank of Nova Scotia, N.A. and Citizens Bank, N.A. If these lenders are unable to fulfill their commitments under these facilities, funding may not be available as needed.
(4) Participating banks related to $25 million in uncommitted credit arrangements for Central Hudson are Bank of America, N.A., and Citizens Bank, N.A. Proceeds from these credit arrangements will be used to diversify cash sources and provide competitive options to minimize Central Hudson's cost of short-term debt.
(5) Central Hudson uncommitted credit outstanding at December 31, 2015 included $2 million of intercompany debt from CH Energy Group.
NOTE 8 – Capitalization – Common and Preferred Stock On June 26, 2013, immediately prior to the completion of the Fortis acquisition and pursuant to the Order Authorizing Acquisition Subject to Conditions, Central Hudson issued one share of a new class of Limited Voting Junior Preferred Stock, $100 par value per share (“Junior Preferred Stock”), with no dividend rights. The share has a voting right solely with respect to whether Central Hudson may file a voluntary bankruptcy petition, a petition for receivership or institute any other liquidation or similar proceeding.

- 43 -
On June 27, 2013, at the effective time of the closing of the Fortis acquisition, all shares of CH Energy Group Common Stock that immediately prior to the effective time were issued and outstanding or held in treasury, were cancelled and ceased to exist. Subsequently, 14,961,400 shares of new common stock, $0.01 par value per share, were issued to FortisUS, Inc. (“FortisUS”) which became the sole shareholder of CH Energy Group. Following the closing of the transaction, FortisUS purchased an additional one million shares of the new common stock of CH Energy Group for $65.0 million. Other than the one share of a new class of Junior Preferred Stock mentioned above, Central Hudson has no outstanding preferred stock as of December 31, 2016 and 2015. On July 27, 2015, CH Energy Group received a capital infusion in the amount of $10 million from FortisUS. The contribution was recorded as paid in capital, see CH Energy Group Consolidated Statement of Equity.
Common Stock Dividends
CH Energy Group’s ability to pay dividends is affected by the ability of its subsidiaries to pay dividends. The Federal Power Act limits the payment of annual dividends by Central Hudson to its retained earnings. More restrictive is the PSC’s limit on the dividends Central Hudson may pay to CH Energy Group, which is 100% of the average annual income available for common stock, calculated on a two-year rolling average basis. Based on this calculation, Central Hudson is currently restricted to a maximum annual payment of $49.1 million in dividends to CH Energy Group. Central Hudson’s ability to pay dividends would be reduced to 75% of its average annual income in the event of a downgrade of its senior debt rating below “BBB+” by more than one rating agency, if the stated reason for the downgrade is related to any of CH Energy Group’s or Central Hudson’s affiliates. Further restrictions are imposed for rating downgrades below this level. In addition, Central Hudson would not be allowed to pay dividends if its average common equity ratio for the 13 months prior to a proposed dividend was more than 200 basis points below the ratio used in setting rates (currently 48%). CH Energy Group’s other subsidiaries do not have expressed restrictions on their ability to pay dividends. In 2016 and in 2015, the Board of Directors of CH Energy Group declared and paid dividends of $22 million, respectively, to FortisUS, the sole shareholder of CH Energy Group. The Board of Directors of Central Hudson declared and paid dividends of approximately $24.5 million to parent CH Energy Group in both 2016 and 2015.
NOTE 9 – Capitalization – Long-Term Debt
The majority of the long-term debt instruments are redeemable at the discretion of CH Energy Group and Central Hudson, at any time, at the greater of par or a specified price as defined in the respective long-term debt agreements, together with accrued and unpaid interest.

- 44 -
Details of CH Energy Group’s and Central Hudson’s long-term debt are as follows (In Thousands):
December 31, 2016 December 31, 2015
Unamortized Unamortized
Debt Issuance Debt Issuance
Series Maturity Date Principal Costs Principal Costs
Central Hudson: Promissory Notes: 2007 Series F (6.028%)
(5) Sep. 01, 2017 $ 33,000 $ 27 $ 33,000 $ 68
2004 Series E (5.05%)(4)
Nov. 04, 2019 27,000 60 27,000 80 2006 Series E (5.76%)
(4) Nov. 17, 2031 27,000 258 27,000 275
1999 Series B(1),(2)
Jul. 01, 2034 33,700 302 33,700 320 2005 Series E (5.84%)
(4) Dec. 05, 2035 24,000 188 24,000 198
2007 Series F (5.804%)(5)
Mar. 23, 2037 33,000 280 33,000 294 2009 Series F (5.80%)
(5) Nov. 01, 2039 24,000 248 24,000 259
2010 Series A (4.30%)(6)
Sep. 21, 2020 16,000 37 16,000 47 2010 Series B (5.64%)
(6) Sep. 21, 2040 24,000 119 24,000 124
2010 Series G (2.756%)(6)
Apr. 01, 2016 - - 8,000 4 2010 Series G (4.15%)
(6) Apr. 01, 2021 44,150 194 44,150 239
2010 Series G (5.716%)(6)
Apr. 01, 2041 30,000 250 30,000 261 2011 Series G (3.378%)
(6) Apr. 01, 2022 23,400 154 23,400 184
2011 Series G (4.707%)(6)
Apr. 01, 2042 10,000 109 10,000 114 2012 Series G (4.776%)
(6) Apr. 01, 2042 48,000 535 48,000 556
2012 Series G (4.065%)(6)
Oct. 01, 2042 24,000 321 24,000 334 2013 Series C (2.45%)
(7) Nov. 1, 2018 30,000 56 30,000 86
2013 Series D (4.09%)(7)
Dec. 2, 2028 16,700 125 16,700 135 2014 Series E
(7),(9) Mar. 30, 2024 30,000 150 30,000 171
2015 Series F (2.98%)(7)
Mar. 31, 2025 20,000 129 20,000 145 2016 Series G (2.16%)
(8) Sep. 21, 2020 24,000 165 - -
2016 Series H (2.56%)(8)
Oct. 28, 2026 10,000 90 - - 2016 Series I (3.63%)
(8) Oct. 28, 2046 20,000 141 - -
Total Central Hudson $ 571,950 $ 3,938 $ 525,950 $ 3,894 Less: Current Portion of Long-term Debt (33,000) (8,000)
Central Hudson Net Long-term Debt $ 538,950 $ 517,950
CH Energy Group: Promissory Notes: 2009 Series B (6.80%)
(3) Dec. 15, 2025 $ 16,781 $ 84 $ 18,095 $ 94
Less: Current Portion of Long-term Debt (1,406) (1,315)
CH Energy Group Net Long-term Debt $ 554,325 $ 4,022 $ 534,730 $ 3,988
(1) Promissory Notes issued in connection with the sale by NYSERDA of tax-exempt pollution control revenue bonds.
(2) Variable (auction) rate notes.
(3) The maturity date represents the final repayment date, principal repayments are due semi-annually.
(4) Issued pursuant to a 2004 PSC Order approving the issuance by Central Hudson prior to December 31, 2006, of up to $85 million of unsecured medium-term notes.
(5) Issued pursuant to a 2006 PSC Order approving the issuance by Central Hudson prior to December 31, 2009, of up to $120 million of unsecured medium-term notes.
(6) Issued pursuant to a 2009 PSC Order approving the issuance by Central Hudson prior to December 31, 2012, of up to $250 million of unsecured medium-term notes or other forms of long-term indebtedness.
(7) Issued pursuant to a 2012 PSC Order approving the issuance by Central Hudson prior to December 31, 2015, of up to $250 million of unsecured medium-term notes or other forms of long-term indebtedness.
(8) Issued pursuant to a 2015 PSC Order approving the issuance by Central Hudson prior to December 31, 2018, of up to $350 million of unsecured medium-term notes or other forms of long-term indebtedness.
(9) Variable rate notes.

- 45 -
On April 1, 2016, Central Hudson redeemed its maturing 2010 Series G medium term notes with a principal payment of $8.0 million. On June 27, 2016, Central Hudson issued $24.0 million of Series G medium term notes with an interest rate of 2.16%, per annum due September 21, 2020. Central Hudson used the proceeds from the sale of the notes to finance capital expenditures and for general corporate purposes. On October 28, 2016, Central Hudson issued $20.0 million of 30-year Series I notes with an interest rate of 3.63% per annum, maturing on October 28, 2046; and $10.0 million of 10-year Series H notes with an interest rate of 2.56% per annum maturing on October 28, 2026. Proceeds from the notes were used by Central Hudson to finance capital expenditures and for general corporate purposes. At December 31, 2016, Central Hudson has $30 million of 2014 Series E 10-year notes with a floating interest rate of 3 month LIBOR plus 1%. To mitigate the potential cash flow impact from unexpected increases in short-term interest rates, Central Hudson purchased a 3-year interest rate cap that will expire on March 26, 2017. The rate cap has a notional amount equal to the outstanding principal amount of the 2014 Series E notes and is based on the quarterly reset of the LIBOR rate on the quarterly interest payment dates. Central Hudson would receive a payout if the LIBOR rate exceeds 4% at the start of any quarterly interest period during the term of the cap. There has been no payout during the years ended December 31, 2016 and 2015.
The principal amount of Central Hudson’s outstanding 1999 Series B NYSERDA Bonds totaled $33.7 million at December 31, 2016. These are tax-exempt multi-modal bonds that are currently in a variable rate mode and mature in 2034. To mitigate the potential cash flow impact from unexpected increases in short-term interest rates on Series B NYSERDA Bonds, on March 24, 2016, Central Hudson purchased an interest rate cap. The rate cap has a notional amount equal to the outstanding principal amount of the Series B bonds and expires on April 1, 2019. The cap is based on the monthly weighted average of an index of tax-exempt variable rate debt, multiplied by 175%. Central Hudson would receive a payout if the adjusted index exceeds 5.0% for a given month. This interest rate cap replaces a similar interest rate cap that expired on April 1, 2016. There have been no payouts on these interest rate caps during the years ended December 31, 2016 and 2015.
In its 2015 Rate Order, the PSC has authorized the continued deferral accounting treatment for variations in the interest costs of the 1999 Series B NYSERDA Bonds and beginning July 1, 2015, the Series E 10-year notes. As such, variations between the actual interest rates on these bonds and the interest rate included in the current delivery rate structure for these bonds are deferred for future recovery from or refund to customers and therefore do not impact earnings. See Note 14 – “Accounting for Derivative Instruments and Hedging Activities” for fair value disclosures related to the recovery of these interest costs.
Long-Term Debt Maturities See Note 15 – “Fair Value Measurements” for a schedule of long-term debt maturing or to be redeemed during the next five years and thereafter.

- 46 -
Financing Petition On April 30, 2015, Central Hudson filed a petition with the PSC (Case 15-M-0251) seeking approval to: (a) enter into multi-year committed credit agreements to provide committed funding to meet expected liquidity needs in amounts not to exceed $200 million in the aggregate and with maturities not to exceed five years and (b) issue and sell long-term debt from time to time through December 31, 2018, in an amount not to exceed $350 million in the aggregate. On September 18, 2015, the PSC issued its Order Authorizing Issuance of Securities for Central Hudson in this proceeding. The Order grants the authorization requested for $200 million of committed credit; grants the authorization requested, with conditions, for $350 million of long-term debt; and revokes the authorization granted in the prior financing order, avoiding the overlap in orders (the prior financing order covered a period ending December 31, 2015 and the new order is effectively immediately). See Note 7 – “Short-Term Borrowing Arrangements” for additional information on the committed credit funding. A higher level of committed credit will provide greater liquidity to support construction forecasts, known seasonality, volatile energy markets, adverse borrowing environments, and other unforeseen events. The approval to issue and sell $350 million of long-term debt will support Central Hudson’s financing of its construction expenditures, refund maturing long-term debt, potentially refinance $33.7 million of multi-modal long-term NYSERDA bonds and refinance up to $30 million of other securities if economic and appropriate.
Debt Covenants CH Energy Group’s $16.8 million of privately placed notes require compliance with certain covenants including maintaining a ratio of total consolidated debt to total consolidated capitalization of no more than 0.65 to 1.00 and not permitting certain debt, other than the privately placed notes, associated with the unregulated operations of CH Energy Group to exceed 10% of total consolidated assets. Central Hudson, under the terms of the various note purchase agreements is subject to similar financial covenants and restrictions to that of CH Energy Group, including restrictions with respect to Central Hudson’s indebtedness and assets. As of December 31, 2016, CH Energy Group and Central Hudson are in compliance with all covenants.
NOTE 10 – Post-Employment Benefits
In its Orders, the PSC has authorized deferral accounting treatment for any variations between actual pension and OPEB expense and the amount included in the current delivery rate structure. As a result, expenses for post-employment benefit plans at Central Hudson do not have any impact on earnings. The information that follows is provided in accordance with current accounting requirements.

- 47 -
Pension Benefits
Central Hudson has a non-contributory Retirement Plan covering substantially all of its employees hired before January 1, 2008 and a non-qualified SERP for certain executives. The Retirement Plan is a defined benefit plan, which provides pension benefits based on an employee’s compensation and years of service. In 2007, Central Hudson amended the Retirement Plan to eliminate these benefits for managerial, professional, and supervisory employees hired on or after January 1, 2008. The Retirement Plan for unionized employees was similarly amended for all employees hired on or after May 1, 2008. As of December 31, 2016, 48% of all active employees were not eligible to participate in the Retirement Plan. The Retirement Plan’s assets are held in a trust fund (“Trust Fund”). Central Hudson has provided periodic updates to the benefit formulas stated in the Retirement Plan.
Decisions to fund Central Hudson’s Retirement Plan are based on several factors, including, but not limited to, the funded status, corporate resources, projected investment returns, actual investment returns, inflation, the value of plan assets relative to plan liabilities, regulatory considerations, interest rate assumptions and the Pension Protection Act of 2006 (“PPA”). Based on the funding requirements of the PPA, Central Hudson plans to make contributions that maintain the target funded percentage at 80% or higher.
Overall, Central Hudson’s unfunded liability decreased by approximately $20.3 million, resulting from an $18.9 million increase in plan assets coupled with a decrease in plan liabilities of $1.4 million. The increase in plan assets was primarily driven by the strength of the financial markets. As noted above, actual contributions could vary significantly based upon a range of factors that Central Hudson considers in its funding decisions. Central Hudson did not make any contributions in 2016 due to higher than expected 2015 contributions. Contributions of $21.3 million were made during the year ended December 31, 2015.
The balance of Central Hudson's accrued pension costs (i.e., the under-funded status) is as follows (In Thousands): December 31, December 31,
2016(1)
2015(1)
Accrued pension costs $ 40,320 $ 60,651 (1) Includes approximately $232K at December 31, 2016 and December 31, 2015 of accrued pension liability recorded at CH Energy Group as a
result of the resignation in 2014 of two CH Energy Group officers with change in control agreements.
Accrued pension costs include the difference between the PBO for pensions and the market value of the pension assets and any liability for the non-qualified SERP.
The following reflects the impact of the recording of funding status adjustments on the Balance Sheets of CH Energy Group and Central Hudson (In Thousands): December 31, December 31,
2016(1)
2015(1)
Prefunded pension costs prior to funding status adjustment $ 7,956 $ 30,510
Additional liability required (48,276) (91,161)
Total accrued pension costs $ (40,320) $ (60,651)
Total offset to additional liability - regulatory assets - pension plan $ 48,276 $ 91,161
(1)
Includes approximately $232K at December 31, 2016 and December 31, 2015 of accrued pension liability recorded at CH Energy Group as a result of the resignation in 2014 of two CH Energy Group officers with change in control agreements.

- 48 -
Gains or losses and prior service costs or credits that arise during the period, but that are not recognized as components of net periodic pension cost would typically be recognized as a component of other comprehensive income, net of tax. However, Central Hudson has PSC approval to record regulatory assets rather than adjusting comprehensive income to offset the additional liability.
The valuation of the current and prior year PBO was determined using discount rates of 4.20% for both December 31, 2016 and 2015, as determined from the Mercer Pension Discount Yield Curve reflecting projected pension cash flows. A 1.00% increase in the discount rate would affect the projection of the pension PBO by approximately $76.6 million. Central Hudson accounts for pension activity in accordance with PSC-prescribed provisions, which among other things, requires a ten-year amortization of actuarial gains and losses.
The 2015 Rate Order includes rate allowances for pension and OPEB expense which approximate the recent cost of providing these benefits. Authorization remains in effect for the deferral of any differences between rate allowances and actual costs under the 1993 PSC Policy to counteract the volatility of these costs. The 2015 Rate Order again authorized Central Hudson to offset a significant portion of deferred balances for pension and OPEB expense for the electric department with available deferred credit balances due to customers.
Retirement Plan Estimates of Long-Term Rates of Return The expected long-term rate of return on the Retirement Plan assets utilized in the calculation of the net periodic benefit cost for 2016 is 6.10%, net of investment expense. In determining the expected long-term rate of return on plan assets, Central Hudson considered forward-looking estimated returns evaluated in light of current economic conditions and based on internally consistent economic models. The expected long-term rate of return is a weighted average based on each plan's investment mix and the forward-looking estimated returns for each investment class. Central Hudson monitors actual performance against target asset allocations and adjusts actual allocations and targets in accordance with the Retirement Plan strategy. A 100 basis point decrease in the expected long-term rate of return would have increased the 2016 net periodic benefit cost by approximately $5.7 million.
Retirement Plan Policy and Strategy
Central Hudson’s Retirement Plan investment policy seeks to achieve long-term growth and income to match the long-term nature of its funding obligations. The investment policy also seeks to reduce the volatility of the plan’s funded status and the level of contributions by more closely aligning the characteristics of plan assets with liabilities. Due to market value fluctuations, Retirement Plan assets require rebalancing from time to time to maintain the asset allocation within target ranges. Central Hudson cannot guarantee that the Retirement Plan’s return objectives or funded status objectives will be achieved.

- 49 -
Asset allocation targets in effect as of December 31, 2016, as well as actual asset allocations as of December 31, 2016 and December 31, 2015, expressed as a percentage of the market value of Retirement Plan assets, are summarized in the table below:
Asset Class Minimum Target
Average Maximum December 31,
2016 December 31,
2015
Equity Securities 41% 50% 59% 51.5% 49.9%
Debt Securities 45% 50% 55% 46.7% 47.7%
Other(1)
0% 0% 10% 1.8% 2.4%
(1) Consists of temporary cash investments, as well as receivables for investments sold and interest and payables for investments purchased, which have not settled as of that date.
Retirement Plan Investment Valuation The Retirement Plan assets are valued under the current fair value framework. See Note 14 – “Accounting for Derivative Instruments and Hedging Activities” for further discussion regarding the definition and levels of fair value hierarchy established by accounting guidance.
The inputs or methodology used for valuing securities are not necessarily an indication of the risk associated with investing in those securities. Below is a listing of the major categories of plan assets held as of December 31, 2016 and 2015, as well as the associated level within the fair value hierarchy in which the fair value measurements in their entirety fall (Dollars in Thousands):
Investment Type Market Value at 12/31/16
% of Total
Market Value at 12/31/15
% of Total
Level 2:
Investment Funds - Equities(1)
$ 310,378 51.5 % $ 291,647 49.9 %
Investment Funds - Fixed Income(1)
281,969 46.8 278,471 47.7
Cash Equivalents(2)
8,816 1.4 12,265 2.1
Other Investments 1,868 0.3 1,780 0.3
$ 603,031 100.0 % $ 584,163 100.0 %
(1) Reported at net asset value, which equals redemption price on that date.
(2) Reported at stated value, which approximates fair value on that date.
Other Post-Retirement Benefits
Central Hudson also provides certain health care and life insurance benefits for certain retired employees through its post-retirement benefit plans. Substantially all of Central Hudson’s unionized employees and managerial, professional and supervisory employees (“non-union”) hired prior to January 1, 2008, may become eligible for these benefits if they reach retirement age while employed by Central Hudson. Central Hudson amended its OPEB programs for existing non-union and certain retired employees effective January 1, 2008. Benefit plans for non-union active employees were similarly amended in 2008 which eliminated post-retirement benefits for non-union employees hired on or after January 1, 2008. Plans were also amended to eliminate post-retirement benefits for union employees hired on or after May 1, 2008. Benefits for retirees and active employees are provided through insurance companies whose premiums are based on the benefits paid during the year.

- 50 -
The significant assumptions used to account for these benefits are the discount rate, the expected long-term rate of return on plan assets and the health care cost trend rate. Central Hudson currently selects the discount rate using the Mercer Pension Discount Yield Curve reflecting projected cash flows. The estimates of long-term rates of return and the investment policy and strategy for these plan assets are similar to those used for pension benefits previously discussed in this Note. The estimates of health care cost trend rates are based on a review of actual recent trends and projected future trends.
Central Hudson fully recovers its net periodic post-retirement benefit costs in accordance with the 1993 PSC Policy. Under these guidelines, the difference between the amounts of post-retirement benefits recoverable in rates and the amounts of post-retirement benefits determined by an actuarial consultant in accordance with current accounting guidance related to other post-employment benefits is deferred as either a regulatory asset or a regulatory liability, as appropriate.
Central Hudson’s liability (i.e. the under-funded status) for OPEB at December 31, 2016 and 2015, was $12.0 million and $19.0 million, respectively. The cumulative amount of net periodic benefit cost in excess of employer contributions at December 31, 2016 and December 31, 2015 was $38.0 million and $43.4 million, respectively. The difference between these amounts, $25.9 million at December 31, 2016 and $24.5 million at December 31, 2015, will be recognized in Central Hudson’s future expense and have been recorded as a regulatory asset in accordance with the 1993 PSC Policy.
OPEB Estimates of Long-Term Rates of Return The expected long-term rate of return on OPEB assets utilized in the calculation of the net periodic benefit cost for 2016 was 6.77%, net of investment expense. In determining the expected long-term rate of return on plan assets, Central Hudson considered forward-looking estimated returns for each asset class evaluated in light of current economic conditions. The expected long-term rate of return is a weighted average based on each plan's investment mix and the forward-looking estimated returns for each investment class. A 100 basis point decrease in the expected long-term rate of return would have increased the 2016 net periodic benefit cost by $1.2 million. Central Hudson monitors actual performance against target asset allocations and adjusts actual allocations and targets as deemed appropriate in accordance with the OPEB Plan’s strategy.
OPEB Policy and Strategy
Central Hudson currently funds its union OPEB obligations through a voluntary employee’s beneficiary association (“VEBA”), and funds its management OPEB liabilities through a 401(h) plan. The VEBA and 401(h) plan are both a form of trust fund. Central Hudson’s VEBA investment policy seeks to achieve a rate of return for the VEBA over the long term that contributes to meeting the VEBA’s current and future obligations, including interest and benefit payment obligations. The policy also seeks to earn long-term returns from capital appreciation and current income that at least keep pace with inflation over the long term. Central Hudson’s 401(h) plan is invested with the previously mentioned Retirement Plan’s investments. However, there are no assurances that the OPEB Plan’s return objectives will be achieved.

- 51 -
The asset allocation strategy employed in the VEBA reflects Central Hudson’s return objectives and what management believes is an acceptable level of short-term volatility in the market value of the VEBA's assets in exchange for potentially higher long-term returns. The mix of assets shall be broadly diversified by asset class and investment styles within asset classes, based on the following asset allocation targets, expressed as a percentage of the market value of the VEBA’s assets, summarized in the table below:
Due to market value fluctuations, the OPEB Plan assets require periodic rebalancing from time to time to maintain the asset allocation within target ranges.
Management uses outside consultants and outside investment managers to aid in the determination of the OPEB Plan’s asset allocation and to provide the management of actual plan assets, respectively.
OPEB Investment Valuation The OPEB Plan assets are valued under the current fair value framework. See Note 14 – “Accounting for Derivative and Hedging Activities” for further discussion regarding the definition and levels of fair value hierarchy established by guidance.
The inputs or methodology used for valuing securities are not necessarily an indication of the risk associated with investing in those securities. Below is a listing of the major categories of plan assets held as of December 31, 2016 and 2015, as well as the associated level within the fair value hierarchy in which the fair value measurements in their entirety fall.
401 (h) Plan Assets (Dollars in Thousands)
Investment Type Market Value at 12/31/16
% of Total
Market Value at 12/31/15
% of Total
Level 2: Investment Funds - Equities
(1) $ 11,428 51.5 % $ 10,257 49.8 %
Investment Funds - Fixed Income(1)
10,382 46.8 9,794 47.6 Cash Equivalents
(2) 324 1.4 431 2.1
Other Investments 69 0.3 96 0.5 $ 22,203 100.0 % $ 20,578 100.0 %
(1) Reported at net asset value, which equals redemption price on that date.
(2) Reported at stated value, which approximates fair value on that date.
Asset Class
Minimum
Target Average
Maximum
December 31, 2016
December 31, 2015
Equity Securities 55% 65% 75% 64.5% 64.9% Debt Securities 25% 35% 45% 34.3% 34.9% Other - % - % - % 1.2% 0.2%

- 52 -
Union VEBA Plan Assets (Dollars In Thousands)
Investment Type Market Value at 12/31/16
% of Total
Market Value at 12/31/15
% of Total
Level 1:
Investment Funds - Money Market Mutual Fund $ 1,162 1.2 % $ 245 0.2 %
Investment Funds - Fixed Income Mutual Funds 34,217 34.3 20,022 20.7
Investment Funds - Equity Securities Mutual Funds 64,393 64.5 43,426 44.9
Level 2:(1)
1
Fixed Income Commingled Fund - - 13,717 14.2
Investment Funds - Equity Securities Commingled Fund - - 19,339 20.0
$ 99,772 100.0 % $ 96,749 100.0 %
(1) The Level 2 funds do not have market data available; however, the underlying securities held by those funds do have published market data available.
Detail of Central Hudson’s change in pension and other post-retirement plans’ benefit obligations, fair value of plan assets and funded status as of and for the period ended December 31, 2016 and 2015 is as follows (In Thousands):
Pension Benefits Other Post Retirement
Benefits
2016 2015 2016 2015
Change in Benefit Obligation:
Benefit Obligation at beginning of year $ 644,814 $ 672,462 $ 136,321 $ 145,353
Service cost 11,385 12,808 2,027 2,312
Interest cost 26,777 26,020 5,741 5,425
Participant contributions - - 938 718
Benefits paid (31,448) (30,380) (6,407) (5,714)
Actuarial (gain)/loss (8,177) (36,096) (4,622) (11,773)
Benefit Obligation at end of year $ 643,351 $ 644,814 $ 133,998 $ 136,321
Change in Value of Plan Assets:
Fair Value of Plan Assets at beginning of year $ 584,163 $ 602,869 $ 117,326 $ 120,517
Adjustment / other - - (34) -
Actual return on plan assets 51,128 (8,998) 8,681 365
Employer contributions 1,072 22,387 1,560 1,536
Participant contributions - - 938 718
Benefits paid (31,448) (30,380) (6,407) (5,714)
Administrative expenses paid (1,884) (1,715) (90) (96)
Fair Value of Plan Assets at end of year $ 603,031 $ 584,163 $ 121,974 $ 117,326
Funded Status at end of year $ (40,320) $ (60,651) $ (12,024) $ (18,995)

- 53 -
The following table summarizes the employee future benefit assets and liabilities and their classifications on the Consolidated Balance Sheets at December 31 (In Thousands):
Pension Benefits Other Post Retirement
Benefits
2016 2015 2016 2015
Amounts Recognized on Balance Sheet:
Current liabilities $ (1,050) $ (1,081) $ - $ -
Noncurrent liabilities (39,270) (59,570) (12,024) (18,995)
Funded Status at end of year $ (40,320) $ (60,651) $ (12,024) $ (18,995)
Regulatory asset:
Net actuarial (gain)/loss $ 42,607 $ 84,011 $ (14,482) $ (8,101)
Prior service costs (credit) $ 5,669 $ 7,148 $ (11,459) $ (16,352)
The net benefit cost for the period ended December 31, 2016 and 2015 for Central Hudson's pension and other post-retirement benefit plans is as follows (In Thousands):
Pension Benefits Other Post Retirement
Benefits
2016 2015 2016 2015
Components of Net Periodic Benefit Cost:
Service cost $ 11,385 $ 12,808 $ 2,027 $ 2,312
Interest cost 26,777 26,020 5,741 5,425
Expected return on plan assets (33,666) (35,474) (7,748) (8,164)
Amortization of prior service cost (credit) 1,480 1,618 (4,894) (5,732)
Amortization of actuarial net loss (gain) 17,649 16,223 1,292 (437)
Net Periodic (Benefit) Cost $ 23,625 $ 21,195 $ (3,582) $ (6,596)

- 54 -
The following table provides the components recognized in net periodic benefit cost and as regulatory assets which otherwise would have been recognized in comprehensive income, as well as, the weighted average assumptions used in the periods (Dollars In Thousands):
Pension Benefits Other Post Retirement
Benefits
2016 2015 2016 2015 Other Changes in Plan Assets and Benefit Obligation Recognized in Regulatory Assets:
Net (gain)/loss $ (23,755) $ 10,091 $ (5,090) $ (3,921)
Amortization of actuarial net (loss) gain (17,649) (16,223) (1,292) 437
Amortization of prior service (cost) credit (1,480) (1,618) 4,894 5,732
Total recognized in regulatory asset $ (42,884) $ (7,750) $ (1,488) $ 2,248
Total recognized in net periodic benefit cost and regulatory asset $ (19,259) $ 13,445 $ (5,070) $ (4,348)
Weighted-average assumptions used to determine benefit obligations:
Discount rate 4.20% 4.20% 4.16% 4.20%
Rate of compensation increase (average) 4.00% 4.00% 4.00% 4.00%
Measurement date 12/31/16 12/31/15 12/31/16 12/31/15 Weighted-average assumptions used to determine net periodic benefit cost for years ended December 31:
Discount rate 4.20% 3.90% 4.20% 3.90%
Expected long-term rate of return on plan assets 6.10% 6.10% 6.77% 6.94%
Rate of compensation increase (average) 4.00% 4.00% 4.00% 4.00%
Assumed health care cost trend rates at December 31:
Health care cost trend rate assumed for next year N/A N/A 6.75% 7.07%
Rate to which the cost trend rate is assumed to decline (the ultimate trend rate) N/A N/A 4.50% 4.50%
Year that the rate reaches the ultimate trend rate N/A N/A 2038 2038 Pension plans with accumulated benefit obligations in excess of plan assets:
Projected Benefit Obligation $ 643,351 $ 644,814 N/A N/A
Accumulated Benefit Obligation $ 593,944 $ 596,116 N/A N/A
Fair Value of Plan Assets $ 603,031 $ 584,163 N/A N/A
The estimated net loss and prior service cost for the defined benefit pension plans that will be amortized from regulatory assets into net periodic benefit cost over the next fiscal year are $16.7 million and $1.2 million, respectively. The estimated net gain and prior service credit for the other defined benefit post-retirement plans that will be amortized from regulatory assets into net periodic benefit cost over the next fiscal year is $1.0 million and $4.6 million, respectively. The amount of transitional obligation to be amortized from regulatory assets is immaterial.
Assumed health care cost trend rates have a significant effect on the amounts reported for the health care plan. A 1% change in assumed health care cost trend rates would have the following effects (In Thousands):
One Percentage Point
Increase Decrease
Effect on total of service and interest cost components for 2016 $ 1,085 $ (866)
Effect on year-end 2016 post-retirement benefit obligation $ 14,013 $ (11,476)
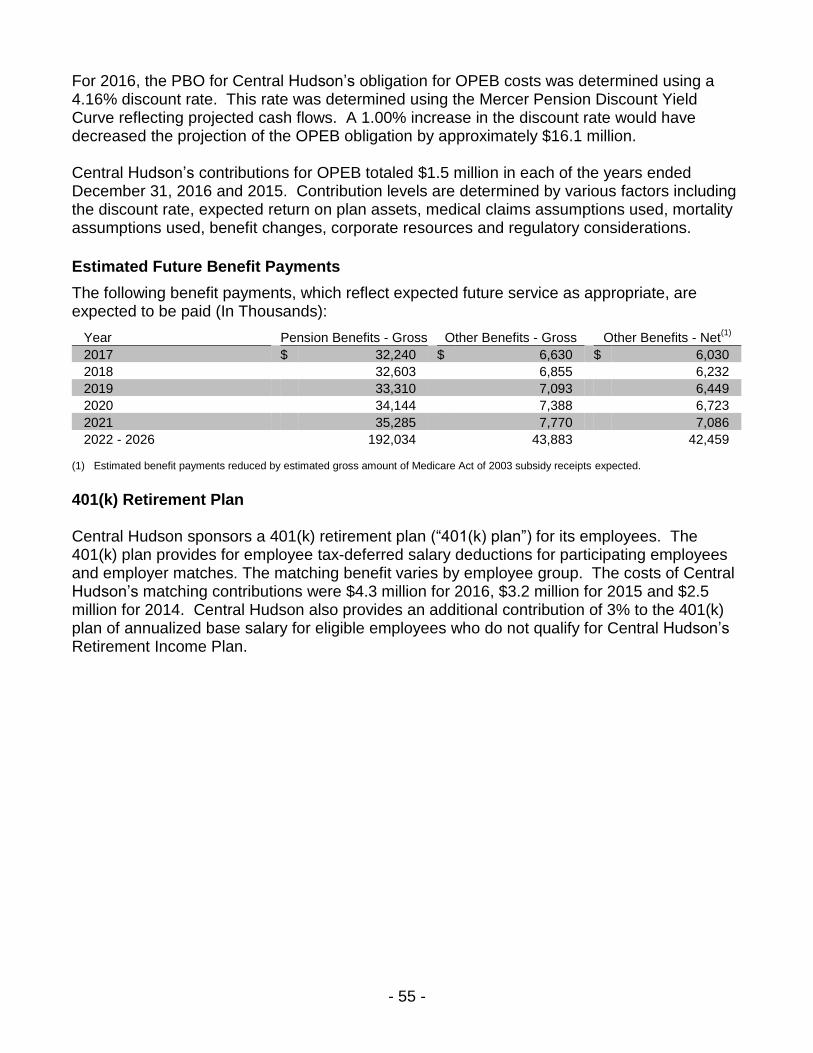
- 55 -
For 2016, the PBO for Central Hudson’s obligation for OPEB costs was determined using a 4.16% discount rate. This rate was determined using the Mercer Pension Discount Yield Curve reflecting projected cash flows. A 1.00% increase in the discount rate would have decreased the projection of the OPEB obligation by approximately $16.1 million. Central Hudson’s contributions for OPEB totaled $1.5 million in each of the years ended December 31, 2016 and 2015. Contribution levels are determined by various factors including the discount rate, expected return on plan assets, medical claims assumptions used, mortality assumptions used, benefit changes, corporate resources and regulatory considerations.
Estimated Future Benefit Payments
The following benefit payments, which reflect expected future service as appropriate, are expected to be paid (In Thousands):
Year Pension Benefits - Gross Other Benefits - Gross Other Benefits - Net
(1)
2017 $ 32,240 $ 6,630 $ 6,030
2018 32,603 6,855 6,232
2019 33,310 7,093 6,449
2020 34,144 7,388 6,723
2021 35,285 7,770 7,086
2022 - 2026 192,034 43,883 42,459
(1) Estimated benefit payments reduced by estimated gross amount of Medicare Act of 2003 subsidy receipts expected.
401(k) Retirement Plan Central Hudson sponsors a 401(k) retirement plan (“401(k) plan”) for its employees. The 401(k) plan provides for employee tax-deferred salary deductions for participating employees and employer matches. The matching benefit varies by employee group. The costs of Central Hudson’s matching contributions were $4.3 million for 2016, $3.2 million for 2015 and $2.5 million for 2014. Central Hudson also provides an additional contribution of 3% to the 401(k) plan of annualized base salary for eligible employees who do not qualify for Central Hudson’s Retirement Income Plan.

- 56 -
NOTE 11 – Equity-Based Compensation
Share Unit Plan Units On April 1, 2016, CH Energy Group adopted a 2016 Performance Share Unit Plan (“2016 PSUP”) and issued 18,806 Units to an officer of CH Energy Group. The 2016 PSUP Units are performance based and vest upon achievement of specified performance goals over the three-year performance period. Each 2016 PSUP Unit has an underlying value equivalent to the value of one common share of Fortis and if earned and vested is paid in cash. The foreign exchange rate utilized for cash payout in the US dollar equivalent corresponds to the exchange rate on the business day prior to the date of the 2016 PSUP Unit grant. Each 2016 PSUP Unit accrues notional dividend equivalents equal to the dividends declared by the Fortis Board of Directors on Fortis common shares.
Officers of CH Energy Group and Central Hudson were granted Units under the Central Hudson 2016 (“2016 SUP”), 2015 (“2015 SUP”) and 2014 (“2014 SUP”) Share Unit Plans, representing the officers’ long-term incentives. Two-thirds of the 2016 and 2015 SUP Units granted are performance based and vest at the end of the three-year performance period upon achievement of specified cumulative performance goals. The remaining 2016 and 2015 SUP Units that were granted are time-based and vest at the end of the three-year period without regard to performance. The 2014 SUP Units are one-half performance based and vest at the end of the three year period upon achievement of specified cumulative performance goals over the three year period. The remaining 2014 SUP Units that were granted are time-based and vest at the end of the three year period without regard to performance. For all grants issued, each SUP Unit is equivalent to the value of one common share of Fortis and if earned and vested is paid in cash. The foreign exchange rate utilized for cash payout in the US dollar equivalent for each plan corresponds to the exchange rate on the business day prior to the date of that SUP Unit grant. Each SUP Unit accrues notional dividend equivalents equal to the dividends declared by the Fortis Board of Directors on Fortis common shares.
CH Energy Group: Grant Date Time Based Performance Based
Grant Date Fair Value Granted Outstanding(4)
Granted Outstanding(4)
2016 PSUP(1)
April 1, 2016 $ 31.00 - - 18,806 19,527
Central Hudson: Grant Date Time Based Performance Based
Grant Date Fair Value Granted Outstanding(4)
Granted Outstanding(4)
2014 SUP(2)
January 1, 2014 $ 28.64 39,268 41,847 39,268 41,847
2015 SUP(3)
January 1, 2015 $ 33.47 15,795 15,950 31,591 34,041
2016 SUP(1), (3)
January 1, 2016 $ 27.26 23,352 22,980 46,704 31,512
(1)Upon establishing the CH Energy Group 2016 PSUP on April 1, 2016, Central Hudson rescinded 16,356 Performance Units issued under
Central Hudson’s 2016 SUP, resulting in a reduction in the total number of units granted under the Central Hudson 2016 SUP from 70,056 to 53,700 Units. (2)
In the third quarter of 2014, 2,969 2014 SUP units were forfeited following the resignation of an Officer. (3)
In the third quarter of 2016, per the 2015 and 2016 SUP agreement, 1,041 and 1,231 time based units were paid out related to an Officer who retired, at $32.71 and $27.47 per unit for approximately $0.1 million. (4)
Includes notional dividends accrued as of December 31, 2016.

- 57 -
Compensation Expense The following table summarizes expense for share unit plan units for the years ended December 31, 2016, 2015 and 2014 (In Thousands):
Year Ended December 31,
2016 2015 2014
CH Energy Group $ 2,491 $ 994 $ 1,390
Central Hudson $ 2,065 $ 1,074 $ 566
The liabilities associated with the SUPs are recorded at fair value at each reporting date until settlement, recognizing compensation expense over the vesting period on a straight line basis. The fair value of the SUPs' liabilities are based on the Fortis common share 5 day volume weighted average trading price at the end of each reporting period and the expected payout based on management's best estimate in accordance with the defined metrics of each grant. Under the SUP agreements, the amount of any outstanding awards payable to an employee who retires and who has 25 years or more of service with the Company under the terms of the 2014 SUP or 15 years of service under the terms of the 2015 SUP and 2016 SUP is determined as if the employee continued to be an employee through the end of the performance period. In accordance with ASU 2014-12, in this situation, compensation expense for that individual is recognized over the requisite service period, instead of the performance period. In addition, in 2015 and 2016, additional expense was recognized in accordance with ASU 2014-12 for Central Hudson officers that are retirement eligible under terms of the SUP agreement in which they have attained the required retirement age and met the required 15 years of service.
NOTE 12 – Commitments and Contingencies Electricity Purchase Commitments
Central Hudson meets its capacity and electricity obligations through contracts with capacity and energy providers, purchases from the NYISO energy and capacity markets and its own generating capacity. In 2016, Central Hudson entered into an agreement with Entergy Nuclear Power Marketing, LLC (“Entergy”) to purchase electricity, on a unit contingent basis at defined prices, from December 1, 2016 through March 31, 2017. The maximum commitment under this agreement is approximately $3.3 million. Energy supplied under this agreement cost approximately $0.5 million in 2016. In 2015, Central Hudson entered into an agreement with Entergy to purchase electricity on a unit contingent basis at defined prices from December 1, 2015 through March 31, 2016 and from June 1, 2016 through August 31, 2016. Energy supplied under the first agreement cost approximately $8.8 million, of which $7.2 million related to the first quarter of 2016. Energy supplied under the second agreement cost approximately $2.4 million in 2016.

- 58 -
In 2015, Central Hudson entered into an agreement with Entergy to purchase electricity on a unit contingent basis at defined prices from June 1, 2015 through August 31, 2015. Energy supplied under this agreement cost approximately $2.0 million in 2015. This contract expired on August 31, 2015 and was not renewed. In 2014, Central Hudson entered into two agreements with Entergy to purchase electricity on a unit contingent basis at defined prices from December 1, 2014 through March 31, 2015. Energy supplied under these agreements cost approximately $11.5 million, of which $8.5 million related to the first quarter of 2015. These contracts expired on March 31, 2015 and were not renewed. In November 2013, Central Hudson entered into a contract to purchase 200 megawatts of installed capacity from the Roseton Generating Facility from May 2014 through April 2017, with $2.7 million in purchase commitments remaining as of December 31, 2016. In June 2014, Central Hudson entered into a contract to purchase available installed capacity from the Danskammer Generating Facility from October 2014 through August 2018 with approximately $48.2 million in purchase commitments remaining as of December 31, 2016.
Energy Credit Purchase Obligations In August 2016, the PSC issued Order 15-E-0302 adopting a Clean Energy Standard that includes renewable energy credits (“RECs”) and zero-emissions credit (“ZECs”) requirements. Beginning in 2017, load serving entities (“LSEs”), which include Central Hudson, will be required to obtain RECs and ZECs in amounts determined by the PSC. LSEs may satisfy their REC obligation by either purchasing RECs acquired through central procurement by NYSERDA, by self-supply through direct purchase of tradable RECs, or by making alternative compliance payments. LSEs will purchase ZECs from NYSERDA at prices approved by the PSC. Central Hudson’s commitment to procure RECs in 2017 is less than $0.1 million and approximately $5.9 million for ZECs. In 2018, Central Hudson is committed to procure approximately $1.9 million in ZECs. The requirement to procure RECs and ZECs will continue through 2029. Operating Leases
CH Energy Group and its subsidiaries have entered into agreements with various companies which provide products and services to be used in their normal operations. These agreements include operating leases for the use of data processing equipment, office equipment and space and vehicles. The provisions of these leases generally provide for renewal options and some contain escalation clauses. Operating lease rental payment amounts charged to expense by CH Energy Group and Central Hudson were $1.4 million for both 2016 and 2015 and $1.5 million for 2014. Future minimum lease payments excluding executory costs, such as property taxes and insurance, are included in the following table of Commitments. All leases are non-cancelable and rent expense is recognized on a straight-line basis over the minimum lease term.

- 59 -
Natural Gas Commitments
Central Hudson meets its natural gas capacity and supply obligations through firm natural gas supply contracts with energy providers for the purchase of natural gas including peak demand supply. Gas supply contracts are generally short term in nature. Central Hudson also enters into contracts associated with natural gas interstate pipeline capacity, and supply contracts for storage of natural gas.
Commitments
The following is a summary of commitments for CH Energy Group and its affiliates as of December 31, 2016 (In Thousands):
Projected Payments Due By Period
Less than
1 year
Year Ending 2018
Year Ending 2019
Year Ending 2020
Year Ending 2021 Thereafter Total
Operating Leases $ 1,526 $ 1,505 $ 1,224 $ 1,183 $ 182 $ 356 $ 5,976 Purchased Electric Contracts
(1) 41,307 20,878 2,368 2,368 2,187 1,207 70,315
Energy Credit Purchase Agreements 5,889 1,944 - - - - 7,833 Purchased Natural Gas Contracts
(1) 30,554 27,428 13,157 6,456 6,062 12,305 95,962
Repayments of Long-Term Debt 34,406 31,503 28,607 41,718 45,987 406,510 588,731 Interest Obligations on Long-Term Debt 25,095 23,340 22,743 21,026 18,785 261,927 372,916
Total $ 138,777 $ 106,598 $ 68,099 $ 72,751 $ 73,203 $ 682,305 $ 1,141,733
(1) Purchased electric and purchased natural gas costs for Central Hudson are fully recovered via their respective regulatory cost adjustment mechanisms.
The following is a summary of commitments for Central Hudson as of December 31, 2016 (In Thousands):
Projected Payments Due By Period
Less than
1 year
Year Ending 2018
Year Ending 2019
Year Ending 2020
Year Ending 2021 Thereafter Total
Operating Leases $ 1,526 $ 1,505 $ 1,224 $ 1,183 $ 182 $ 356 $ 5,976 Purchased Electric Contracts
(1) 41,307 20,878 2,368 2,368 2,187 1,207 70,315
Energy Credit Purchase Agreements 5,889 1,944 - - - - 7,833 Purchased Natural Gas Contracts
(1) 30,554 27,428 13,157 6,456 6,062 12,305 95,962
Repayments of Long-Term Debt 33,000 30,000 27,000 40,000 44,150 397,800 571,950 Interest Obligations on Long-Term Debt 23,978 22,319 21,827 20,221 18,098 260,543 366,986
Total $ 136,254 $ 104,074 $ 65,576 $ 70,228 $ 70,679 $ 672,211 $ 1,119,022
(1) Purchased electric and purchased natural gas costs for Central Hudson are fully recovered via their respective regulatory cost adjustment mechanisms.

- 60 -
Other Commitments Capital Expenditures Central Hudson is a regulated utility and, as such, is obligated to provide service to customers within its service territory. Central Hudson’s capital expenditures are largely driven by the need to ensure continued and enhanced performance, reliability and safety of the electric and natural gas systems and to meet customer growth. Central Hudson’s capital expenditure program is forecasted to be approximately $170.4 million for 2017. Pension Benefit and Other Post Retirement Benefit Funding Contributions Central Hudson is required to meet its contractual benefit payment obligations. Decisions about how to fund the Retirement Plan to meet these obligations are made annually and are primarily affected by the discount rate used to determine benefit obligations, current asset values, corporate resources and the projection of Retirement Plan assets. Based on the funding requirements of the PPA, Central Hudson plans to make contributions that maintain the target funded percentage at 80% or higher. Central Hudson is expected to make contributions to the Retirement Plan of $13 million in January 2017, resulting in a funded status that meets Central Hudson’s objective. The actual 2017 contributions could vary significantly based upon economic growth, projected investment returns, inflation and interest rate assumptions. Actual funded status could vary significantly based on asset returns and changes in the discount rate used to estimate the present value of future obligations. In January 2017, Central Hudson is also expected to make a $1.5 million contribution for OPEB. See Note 18 – “Subsequent Events” for details on January payments. Parental Guarantee CHET was established to be an investor in Transco, which was created to develop, own and operate electric transmission projects in New York State. In December 2014, Transco filed an application with the FERC for the recovery through a formula rate, the cost of and a return on five high voltage transmission projects totaling $1.7 billion. CHET’s maximum commitment for these five projects is $182 million, which is the maximum budgeted amount for these projects at 100% equity. As of December 31, 2016, CHET’s investment in Transco was approximately $6.9 million. CH Energy Group issued a parental guarantee to Transco to assure the payment of CHET’s maximum commitment of $182 million. As of December 31, 2016, CH Energy Group is not aware of any existing condition that would require any payments under this guarantee.
- 61 -
Contingencies Environmental Matters Central Hudson
Site Investigation and Remediation Program
Central Hudson has been notified by the New York State Department of Environmental Conservation (“DEC”) that it believes Central Hudson or its predecessors at one time owned and/or operated manufactured gas plants (“MGPs”) to serve their customers’ heating and lighting needs, at seven sites in Central Hudson’s franchise territory. The DEC has further requested that Central Hudson investigate and, if necessary, remediate these sites under a Consent Order, Voluntary Cleanup Agreement, or Brownfield Cleanup Agreement. The DEC has placed all seven of these sites on the New York State Environmental Site Remediation Database. Central Hudson is performing environmental SIR at two other non-MGP sites within its service territory. Central Hudson accrues for remediation costs based on the amounts that can be reasonably estimated at a point in time. As of December 31, 2016, Central Hudson has accrued $72.9 million with respect to SIR activities, including operation, maintenance and monitoring costs (“OM&M”), of which $15.5 million is anticipated to be spent in the next twelve months. Based on a cost model analysis completed in 2014, Central Hudson believes there is a 90% confidence level that the total costs to remediate SIR sites will not exceed $168.7 million over the next 30 years. SIR can be divided into various stages of completion based on the milestones of activities completed and reports reviewed. These stages, the types of costs accrued during various stages and the sites currently in each stage include:
1. Investigation – Begins with preliminary investigations and is completed upon filing and
approval by DEC of a Remedial Investigation (“RI”) Report. Central Hudson accrues for estimated investigation costs.
2. Remedial Alternatives Analysis (“RAA”) – Engineering analysis of alternatives for remediation based on the RI is compiled into a RAA Report. Upon completion of the RAA and the filing with the DEC, management accrues for an estimate of remediation costs developed and quantified in the RAA based on DEC approved methods, as well as an estimate of post-remediation OM&M. These amounts represent a significant portion of the total costs to remediate and are subject to change based on further investigations, final remedial design and associated engineering estimates, regulatory comments and requests, remedial design changes/negotiations and changed or unforeseen conditions during the remediation or additional requirements following the remediation. Prior to the completion of the RAA, management cannot reasonably estimate what cost will be incurred for remediation or post-remediation activities.

- 62 -
3. Remedial Design - Upon approval of the RAA and final decision of remediation approach based on alternatives presented, a Remedial Design (“RD”) is developed and filed with the DEC for approval. Site #5 – North Water Street – RD in Progress
The DEC issued a Decision Document in March 2016 and approved the RAA Report in April 2016.
Central Hudson disseminated a Pre-Design/Remedial Design request for proposal to Environmental Engineering firms for competitive bidding in September 2016. A contract is expected to be executed in the first quarter of 2017 with Remedial Design activities likely commencing in the second quarter of 2017. Full-scale remediation is anticipated to commence in late 2017 to early 2018.
Approximately $61.1 million has been accrued as of December 31, 2016, based on the scope of work and cost estimate developed for remediation and OM&M activities, of which $8.5 million is expected to be spent in the next twelve months.
Site # 8 - Eltings Corners – RD in Progress
In June 2016, the DEC finalized the Permit Modification to the facility’s Hazardous Waste Storage Permit. Central Hudson will submit for approval, a Remedial Action Work Plan (“RAWP”) that details the implementation of the proposed remediation work activities. Pre-design investigation activities and submittal of the RAWP is anticipated to occur by the second quarter of 2017. Pending required regulatory approval of the RAWP, remedial activities are anticipated to be completed by the end 2017.
Approximately $2.3 million has been accrued as of December 31, 2016, based on the scope of work and cost estimate developed for remediation and OM&M activities, of which $2.2 million is expected to be spent in the next twelve months.
4. Remediation – Completion of the work plan as defined in the approved RD. Upon completion, final reports are filed with the DEC for approval and may include a Construction Completion Report (“CCR”), Final Engineering Report, or other reports required by the DEC based on the work performed. Site #6 – Kingston – Remediation in Progress
The RD Report was approved by the DEC in January 2016. A remedial construction “Design-Build” contract was executed with an Environmental Engineering Firm in February 2016. A revised Remedial Work Plan and required permit packages were submitted for regulatory agency review and were approved in June 2016.
Site preparation and remedial activities commenced in March and May 2016, respectively. Remedial activities are anticipated to be completed in the first quarter of 2017.
A 401 Water Quality Certification permit and State Pollutant Discharge Elimination System Equivalent permit were issued by the DEC in July 2016. Additionally, a Nationwide Permit No. 38 was issued by the United States Army Corps of Engineers in August 2016.

- 63 -
Approximately $7.0 million has been accrued as of December 31, 2016 based on the scope of work and estimated costs for remediation and OM&M activities, of which $4.6 million is expected to be spent over the next twelve months.
5. Post-Remediation Monitoring – Entails the OM&M as directed by the DEC based on the approved final report of remediation. The activities are typically defined in a Site Management Plan (“SMP”), which is approved by the DEC. The extent of activities during this phase may increase or decrease based on the results of ongoing monitoring being performed and future potential usage of the property.
Site #2 – Newburgh Area A – CCR and SMP in Progress
In 2012, Central Hudson retired and removed propane air facilities located on Area A. The RAWP for this site was approved by the DEC in June 2015 and remedial activities were completed between October 2015 and January 2016.
The CCR for Area A and draft SMP were submitted to the DEC for review and approval in May and August 2016, respectively. It is anticipated that the Environmental Easement for Area A will be submitted to the DEC for review and approval during the first quarter of 2017.
Site #2 – Newburgh Area B and C – Post-Remediation In Progress
A CCR associated with the remedial activities completed in Areas B & C was submitted to the DEC for review and approval in August 2016. Additionally, a draft SMP related to Area B was submitted to the DEC for review and approval in August 2016.
Site #3 – Laurel Street – Post-Remediation In Progress
In accordance with the January 2015 SMP, an annual site inspection documenting the status of the Engineering Controls (“ECs”) and the Institutional Controls (“ICs”), was performed in March 2016. No actionable findings were noted and the required Periodic Review Report (“PRR”), summarizing the status of the ECs and ICs, was submitted to the DEC for review in April 2016.
In October 2016, as per the request of the DEC, a revised/updated Site Management Plan was submitted for review and approval.
In November 2016, Central Hudson received a letter from the DEC stating that the Voluntary Cleanup Program will be terminated in March 2018. Central Hudson is currently working with the DEC to receive a Release Letter for this site prior to the termination of the program.
Site #4 – Catskill – Post-Remediation In Progress
In accordance with the December 2014 SMP, an annual site inspection documenting the status of the ECs and ICs was performed in March 2016. No actionable findings were noted and the required PRR summarizing the results was submitted to the DEC for review in April 2016 and approved.

- 64 -
No Action Required Site #1 – Beacon – No further costs are expected and no amounts are accrued related
to this site. If the building at this site were to be removed, further investigation and testing would be required related to the soil under the building, which may require additional remediation. Central Hudson cannot currently estimate the likelihood of the building being removed or the costs that may be incurred related to this.
Site #7 – Bayeaux Street – No further investigation or remedial action is currently
required. However, per the DEC, this site still remains on the list for potential future investigation.
Site # 9 – Little Britain Road - In November 2016 Central Hudson received a letter from the DEC stating that the Voluntary Cleanup Program will be terminated in March 2018. Central Hudson is currently reviewing the site internally to determine the next course of action.
Future remediation activities, including OM&M and related costs may vary significantly from the assumptions used in Central Hudson's current cost estimates and these costs could have a material adverse effect (the extent of which cannot be reasonably determined) on the financial condition, results of operations and cash flows of CH Energy Group and Central Hudson if Central Hudson were unable to recover all or a substantial portion of these costs via collection in rates from customers and/or through insurance. Central Hudson expects to recover its remediation costs from its customers. The current components of this recovery include:
As part of the 2015 Rate Order, Central Hudson maintained previously granted deferral authority and future recovery for the differences between actual Environmental SIR costs (both MGP and non-MGP) and the associated rate allowances, with carrying charges to be accrued on the deferred balances at the authorized pre-tax rate of return.
The 2015 Rate Order includes cash recovery of approximately $18.9 million during the three-year rate plan period ending June 30, 2018, with $9.2 million recovered through December 31, 2016.
The total spent in the years ended December 31, 2016 and 2015, related to site investigation and remediation, was approximately $18.2 million and $2.4 million.
The regulatory asset balance as of December 31, 2016 and 2015, was $79.5 million and $87.2 million, which represents the cumulative difference between amounts spent or currently accrued as a liability and the amounts recovered to date through rates or insurance recoveries, plus carrying charges accrued on deferred balances.
Central Hudson has put its insurers on notice and intends to seek reimbursement from its insurers for its costs. Certain of these insurers have denied coverage. Central Hudson had insurance recoveries of $0.4 million during the year ended December 31, 2016. There were no insurance recoveries in 2015. We do not expect insurance recoveries to offset a meaningful portion of total costs.

- 65 -
Other Matters Asbestos Litigation
Central Hudson is involved in various asbestos lawsuits. As of December 31, 2016, of the 3,363 asbestos cases brought against Central Hudson, 1,175 remain pending. Of the cases no longer pending against Central Hudson, 2,032 have been dismissed or discontinued without payment by Central Hudson and Central Hudson has settled 156 cases. Central Hudson is presently unable to assess the validity of the remaining asbestos lawsuits; however, based on information known to Central Hudson at this time, including Central Hudson’s experience in settling asbestos cases and in obtaining dismissals of asbestos cases, Central Hudson believes that the costs which may be incurred in connection with the remaining lawsuits will not have a material adverse effect on the financial position, results of operations or cash flows of either CH Energy Group or Central Hudson. Other Litigation CH Energy Group and Central Hudson are involved in various other legal and administrative proceedings incidental to their businesses, which are in various stages. While these matters collectively could involve substantial amounts, based on the facts currently known, it is the opinion of management that their ultimate resolution will not have a material adverse effect on either CH Energy Group’s or Central Hudson’s financial positions, results of operations or cash flows.
CH Energy Group and Central Hudson expense legal costs as incurred.

- 66 -
NOTE 13 – Segments and Related Information
CH Energy Group's reportable operating segments are the regulated electric utility business and regulated natural gas utility business of Central Hudson. Other activities of CH Energy Group, which do not constitute a business segment, include CHEC’s remaining energy investments, CHET’s investment in Transco (a regulated entity) and the holding company’s activities, which consist primarily of financing its subsidiaries, and are reported under the heading “Other Businesses and Investments.”
General corporate expenses and Central Hudson’s property common to both electric and natural gas segments have been allocated in accordance with practices established for regulatory purposes. From January 1, 2015 through June 30, 2015, the common allocation was 85% for electric and 15% for natural gas. Beginning July 1, 2015, per the terms of the 2015 Rate Order, the allocation changed to 80% for electric and 20% for gas.
In March 2014, CHEC completed the sale of Griffith to Star Gas Partners, L.P. Operating results for Griffith are reported as Discontinued Operations for the year ended December 31, 2014 in the Consolidated CH Energy Group Statement of Income. The segment information presented below for Griffith includes the operating results for this segment. The reclassification of these results to Discontinued Operations is presented in the Elimination column in order to reconcile the total to the amounts presented in the Consolidated CH Energy Group Statement of Income.
CH Energy Group Segment Disclosure
(In Thousands) Year Ended December 31, 2016
Segments Other
Central Hudson Businesses
Natural and
Electric Gas Investments Eliminations Total
Revenues from external customers $ 510,762 $ 128,886 $ - $ - $ 639,648
Intersegment revenues 19 184 - (203) -
Total revenues 510,781 129,070 - (203) 639,648
Energy supply costs 157,448 33,082 - (203) 190,327
Operating expenses 235,062 57,038 1,000 - 293,100
Depreciation and amortization 36,085 10,424 - - 46,509
Operating income (loss) 82,186 28,526 (1,000) - 109,712
Other income, net 3,601 347 284 (2) 4,230
Finance charges 23,245 6,939 1,214 (2) 31,396
Income (loss) before income taxes 62,542 21,934 (1,930) - 82,546
Income tax expense (benefit) 23,957 7,875 (191) - 31,641
Net Income (Loss) Attributable to CH Energy Group $ 38,585 $ 14,059 $ (1,739) $ - $ 50,905
Segment Assets at December 31, 2016 $ 1,458,855 $ 499,286 $ 16,754 $ (692) $ 1,974,203
Capital Expenditures $ 117,717 $ 58,178 $ - $ - $ 175,894

- 67 -
CH Energy Group Segment Disclosure
(In Thousands) Year Ended December 31, 2015
Segments Other
Central Hudson Businesses
Natural and
Electric Gas Investments Eliminations Total
Revenues from external customers $ 544,296 $ 146,562 $ - $ - $ 690,858
Intersegment revenues 14 224 - (238) -
Total revenues 544,310 146,786 - (238) 690,858
Energy supply costs 193,934 54,114 - (238) 247,810
Operating expenses 239,157 59,048 237 - 298,442
Depreciation and amortization 34,198 9,876 - - 44,074
Operating income (loss) 77,021 23,748 (237) - 100,532
Other income (expense), net 4,209 1,864 (326) - 5,747
Finance charges 23,906 6,202 1,303 - 31,411
Income (loss) before income taxes 57,324 19,410 (1,866) - 74,868
Income tax expense (benefit) 22,332 8,814 (18) - 31,128
Net Income (Loss) Attributable to CH Energy Group $ 34,992 $ 10,596 $ (1,848) $ - $ 43,740
Segment Assets at December 31, 2015 $ 1,445,143 $ 458,889 $ 15,181 $ (1,655) $ 1,917,558
Capital Expenditures $ 98,647 $ 42,001 $ - $ - $ 140,648
CH Energy Group Segment Disclosure
(In Thousands) Year Ended December 31, 2014
Segments Other
Central Hudson Businesses
Natural and
Electric Gas Griffith Investments Eliminations Total
Revenues from external customers $ 579,757 $ 163,005 $ 85,856
$ - $ (85,856) $ 742,762
Intersegment revenues 12 345 -
- (357) -
Total revenues 579,769 163,350 85,856
- (86,213) 742,762
Energy supply costs 233,002 79,110 67,025
- (67,382) 311,755
Operating expenses 245,023 59,749 11,489
8,310 (11,813) 312,758
Depreciation and amortization 33,844 10,015 -
- - 43,859
Operating income (loss) 67,900 14,476 7,342
(8,310) (7,018) 74,390
Other income (expense), net 4,688 712 (1,246)
9,746 (8,360) 5,540
Finance charges 24,858 6,713 425
1,541 (434) 33,103
Income (loss) before income taxes 47,730 8,475 5,671
(105) (14,944) 46,827
Income tax expense (benefit) 17,494 4,867 2,325
2,765 (7,255) 20,196
Net income from continued operations 30,236 3,608 3,346
(2,870) (7,689) 26,631
Net income from discontinued operations - - -
- 7,689 7,689
Net Income (Loss) Attributable to CH Energy Group $ 30,236 $ 3,608 $ 3,346
$ (2,870) $ - $ 34,320
Segment Assets at December 31, 2014 $ 1,343,127 $ 522,581 $ - $ 8,198 $ (1,615) $ 1,872,291
Capital Expenditures $ 80,380 $ 32,811 $ 129 $ - $ - $ 113,320

- 68 -
NOTE 14 – Accounting for Derivative Instruments and Hedging Activities Purpose of Derivatives Central Hudson enters into derivative contracts in conjunction with the Company’s energy risk management program to hedge certain risk exposure related to its business operations. The derivative contracts are typically either exchange-traded or over-the-counter (“OTC”) instruments. The primary risks the Company seeks to manage by using derivative instruments are interest rate risk, commodity price risk and adverse or unexpected weather conditions. Central Hudson uses derivative contracts to reduce the impact of volatility in the prices of natural gas and electricity and to hedge exposure to volatility in interest rates for its variable rate long-term debt. Derivative transactions are not used for speculative purposes. Central Hudson derivative activities consist of the following:
Interest rate caps are used to minimize interest rate risks and to improve the matching of assets and liabilities. An interest rate cap is an interest rate option agreement in which payments are made by the seller of the option when the reference rate exceeds the specified strike rate (or the set rate at which the option contract can be exercised). The purpose of these agreements is to reduce exposure to rising interest rates while still having the ability to take advantage of falling interest rates by putting a “cap” on the interest rate Central Hudson pays on debt for which such caps are purchased. See Note 9 - “Capitalization – Long-Term Debt” for further details regarding Central Hudson’s interest rate cap agreements.
Natural gas futures are used to minimize commodity price volatility for natural gas purchases. A natural gas futures contract is a standardized contract to buy or sell a specified commodity (natural gas) of standardized quality at a certain date in the future, at a market determined price (the futures price). Central Hudson’s reason for purchasing these contracts is to reduce price fluctuations for natural gas and the impact of volatility in the commodity markets on its customers.
Electricity swaps are used to minimize commodity price volatility for electricity purchases for Central Hudson’s full service customers. A swap contract or a contract for differences is the exchange of two payment streams between two counterparties where the cash flows are dependent on the price of the underlying commodity. In an effort to moderate commodity price volatility, Central Hudson enters into contracts to pay a fixed price and receive market price for a defined commodity and volume. These contracts are aligned with Central Hudson’s actual commodity purchases at market price, resulting in a net fixed price payment.
Central Hudson’s operations are seasonal in nature and weather sensitive. Demand for electricity typically peaks during the summer, while demand for natural gas typically peaks during the winter. Weather derivative contracts are used to hedge the effect of significant variances in weather conditions from normal patterns on purchased electricity and natural gas costs, and on the related revenues. Weather derivative contracts are accounted for in accordance with guidance specific to accounting for weather derivatives. Premiums paid for weather related instruments are amortized based on the pattern of normal purchases of electricity or natural gas

- 69 -
over the term of the contract and any payouts earned will be recorded as a reduction of the cost.
Energy Contracts Subject to Regulatory Deferral Central Hudson has been authorized to fully recover certain risk management costs through its natural gas and electricity cost adjustment charge clauses. Risk management costs are defined by the PSC as costs associated with transactions that are intended to reduce price volatility or reduce overall costs to customers. These costs include transaction costs and gains and losses associated with risk management instruments. The related gains and losses associated with Central Hudson’s derivatives are included as part of Central Hudson's commodity cost and/or price-reconciled in its natural gas and electricity cost adjustment charge clauses and are not designated as hedges. The percentage of Central Hudson’s electric and natural gas requirements covered with fixed price forward purchases at December 31, 2016 are as follows:
Central Hudson % of Requirement Hedged
(1)
Electric Derivative Contracts: 2.2 million MWh 2017 43.8% 2018 27.2% 2019 18.7% Natural Gas Derivative Contracts: 1.1 million Dth January 2017 – March 2017 32.3% (1) Projected coverage as of December 31, 2016.
In 2016, OTC derivative contracts covered approximately 43.1% of Central Hudson’s total electricity supply requirements as compared to 54.6% in 2015. Cash Flow Hedges Central Hudson has been authorized to fully recover the interest costs associated with its $33.7 million Series B NYSERDA Bonds and, beginning July 1, 2015, the $30.0 million of variable rate debt, which includes costs and gains or losses associated with its interest rate cap contracts. Derivative Risks The basic types of risks associated with derivatives are market risk (that the value of the derivative will be adversely impacted by changes in the market, primarily the change in commodity prices and interest rates) and credit risk (that the counterparty will not perform according to the terms of the contract). The market risk of the derivatives generally offset the market risk associated with the hedged commodity.
The majority of Central Hudson’s derivative instruments contain provisions that require Central Hudson to maintain specified issuer credit ratings and financial strength ratings. Should Central Hudson’s ratings fall below these specified levels, it would be in violation of the

- 70 -
provisions and the derivatives’ counterparties could terminate the contracts and request immediate payment.
To help limit the credit exposure of derivatives, Central Hudson enters into master netting agreements with counterparties whereby contracts in a gain position can be offset against contracts in a loss position. Of the eighteen total agreements held by Central Hudson, nine contain credit-risk related contingent features. As of December 31, 2016, there were thirteen open derivative contracts under these nine master netting agreements containing credit-risk related contingent features, one of which was in a liability position. The circumstances that could trigger these features, the aggregate fair value of the derivative contracts that contain contingent features and the amount that would be required to settle these instruments on December 31, 2016 if the contingent features were triggered, are described below.
Contingent Contracts (Dollars In Thousands)
As of December 31, 2016
Triggering Event
# of Contracts in a Liability Position Containing the
Triggering Feature
Gross Fair Value of Contract
Cost to Settle if Contingent Feature is Triggered
(net of collateral)
Central Hudson:
Credit Rating Downgrade 1 $ (10) $ (10)
Derivative Contracts CH Energy Group and Central Hudson have elected gross presentation for their derivative contracts under master netting agreements and collateral positions. On December 31, 2016 and December 31, 2015, Central Hudson did not have collateral posted against the fair value amount of derivatives.
The net presentation for CH Energy Group's and Central Hudson's derivative assets and liabilities as of December 31, 2016 and December 31, 2015 are as follows (In Thousands): Gross Net Amount
Amounts of Assets Gross Amounts Not Offset in the Gross Offset in the Presented in Statement of Financial Position
Amounts of Statement the Statement Cash Recognized of Financial of Financial Financial Collateral Net
Description Assets Position Position Instruments Received Amount
As of December 31, 2016
Derivative Contracts:
Central Hudson - electric $ 2,454 $ - $ 2,454 $ 1,674 $ - $ 780
Central Hudson - natural gas 857 - 857 - - 857
Total Central Hudson and CH Energy Group Assets $ 3,311 $ - $ 3,311 $ 1,674 $ - $ 1,637
As of December 31, 2015 Derivative Contracts:
Central Hudson - electric $ 2,218 $ - $ 2,218 $ 2,218 $ - $ -
Central Hudson - natural gas 1 - - - - - -
Total Central Hudson and CH Energy Group Assets $ 2,218 $ - $ 2,218 $ 2,218 $ - $ -

- 71 -
Gross Net Amount
Amounts of Liabilities Gross Amounts Not Offset in the
Gross Offset in the Presented in Statement of Financial Position
Amounts of Statement the Statement Cash
Recognized of Financial of Financial Financial Collateral Net
Description Liabilities Position Position Instruments Received Amount
As of December 31, 2016
Derivative Contracts:
Central Hudson - electric $ 1,942 $ - $ 1,942 $ 1,674 $ - $ 268
Total Central Hudson and CH Energy Group Liabilities $ 1,942 $ - $ 1,942 $ 1,674 $ - $ 268
As of December 31, 2015 Derivative Contracts:
Central Hudson - electric $ 10,628 $ - $ 10,628 $ 2,218 $ - $ 8,410
Central Hudson - natural gas 990 - 990 - - 990
Total Central Hudson and CH Energy Group Liabilities $ 11,618 $ - $ 11,618 $ 2,218 $ - $ 9,400
Gross Fair Value of Derivative Instruments
Current accounting guidance related to fair value measurements establishes a fair value hierarchy to prioritize the inputs used in valuation techniques based on observable and unobservable data, but not the valuation techniques themselves. Observable inputs are inputs that reflect the assumptions market participants would use in pricing the asset or liability. Unobservable inputs are inputs that reflect the reporting entity’s own assumptions about the assumptions market participants would use in pricing an asset or a liability. Classification of inputs is determined based on the lowest level input that is significant to the overall valuation. The fair value hierarchy prioritizes the inputs to valuation techniques into the three categories described below: Level 1 Inputs: Quoted prices (unadjusted) in active markets for identical assets or liabilities.
Level 2 Inputs: Directly or indirectly observable (market-based) information. This includes quoted prices for similar assets or liabilities in active markets and quoted prices for identical or similar assets or liabilities in markets that are not active.
Level 3 Inputs: Unobservable inputs for the asset or liability for which there is either no market data, or for which asset and liability values are not correlated with market value.

- 72 -
Derivative contracts are measured at fair value on a recurring basis. As of December 31, 2016 and 2015, CH Energy Group's and Central Hudson's derivative assets and liabilities by category and hierarchy level are as follows (In Thousands): Quoted Prices in Significant
Active Markets Other Significant
for Identical Observable Unobservable
Assets Inputs Inputs
Asset or Liability Category Fair Value (Level 1) (Level 2) (Level 3)
As of December 31, 2016(1)
Assets: Derivative Contracts: Central Hudson - electric $ 2,454 $ - 1 $ - $ 2,454 Central Hudson - natural gas 857 857 1 - -
Total CH Energy Group and Central Hudson Assets $ 3,311 $ 857 1 $ - $ 2,454
Liabilities: Derivative Contracts: Central Hudson - electric1 $ 1,942 $ - $ - $ 1,942
Total CH Energy Group and Central Hudson Liabilities $ 1,942 $ - $ - $ 1,942
As of December 31, 2015(1)
Assets: Derivative Contracts: Central Hudson - electric $ 2,218 $ - $ - $ 2,218
Total CH Energy Group and Central Hudson Assets $ 2,218 $ - $ - $ 2,218
Liabilities: Derivative Contracts: Central Hudson - electric $ 10,628 $ - $ - $ 10,628 Central Hudson - natural gas 990 990 - -
Total CH Energy Group and Central Hudson Liabilities $ 11,618 $ 990 $ - $ 10,628
(1) Interest rate cap agreements are not shown in the above chart. These are classified as Level 2 in the fair value hierarchy using SIFMA Municipal Swap Curves and 3 month US Dollar Libor rate forward curves. As of December 31, 2016 and December 31, 2015 the fair value was $0.
Central Hudson obtains forward pricing for Level 3 derivatives from an independent third party provider of derivative pricing. Significant unobservable inputs utilized in their pricing model are bi-lateral contracts and projected activity of certain major participants.

- 73 -
The table listed below provides a reconciliation of the beginning and ending net balances for assets and liabilities measured at fair value and classified as Level 3 in the fair value hierarchy (In Thousands):
December 31,
2016 2015
Balance at Beginning of Period $ (8,410) $ (5,303)
Unrealized gains/(losses) 8,922 (3,107)
Realized losses (18,232) (14,773)
Purchases 1 1 - 1 -
Issuances - 1 -
Sales and settlements 1 18,232 1 14,773
Transfers in and/or out of Level 3 1 - 1 -
Balance at End of Period $ 512 $ (8,410)
The amount of total gains or losses for the period included in earnings attributable to the change in unrealized gains or losses relating to derivatives still held at end of period $ - 1 $ -
There were no transfers into or out of Levels 1 or 2.
CH Energy Group and Central Hudson’s derivative contracts are typically either exchange-traded or OTC instruments. Exchange-traded and OTC derivatives are valued based on listed market prices. On December 31, 2016, Central Hudson’s derivative contracts were comprised of swap contracts for electricity and natural gas. Electric swap contracts through December 2016 are valued using the NYISO Day Ahead Market Locational Based Marginal Price for Zone G as posted on the NYISO website. The electric swap contracts from January 2017 through December 2019 are valued using NYISO forward prices provided by a broker, OTC Global Holdings, as posted on the S&P Global Market Intelligence website. All of the electric swap contracts have been classified as Level 3 assets in the fair value hierarchy, since NYISO pricing uses unobservable inputs, such as bi-lateral contracts, projected activity and pricing data from major market participants in its determination of the futures closing price and OTC Global Holdings provides pricing from its forward power curve. Management believes these prices approximate fair value for these instruments. Generally, a change in any of the underlying assumptions would result in a positively correlated change in the fair value measurement. The credit risk considered in the fair value assessment of contracts in a liability position is that associated with Central Hudson. Based on Central Hudson’s current senior unsecured debt ratings by Moody’s, S&P and Fitch, management has concluded that the credit risk associated with Central Hudson’s non-performance related to these instruments is not significant, and therefore, no adjustment was made to the fair value. For those contracts in an asset position, management believes the credit risk of non-performance by counterparties is not significant due to the fact that Central Hudson utilizes multiple counterparties, all of which have ratings by Moody’s, S&P and Fitch, which denote expectations of a low default risk. Additionally, unrealized gains and losses on Central Hudson’s derivative contracts have no impact on earnings. Based on the credit ratings by Moody’s, S&P and Fitch of the counterparty, management has concluded that the credit risk associated with the counterparty’s non-performance on call options in an asset position is not significant. Therefore, no adjustment related to credit risk has been made to the fair value of contracts in an asset position.

- 74 -
The Effect of Derivative Instruments on the Statements of Income
Realized gains and losses on Central Hudson’s derivative instruments are conveyed to or recovered from customers through PSC authorized deferral accounting mechanisms, with no material impact on cash flows, results of operations or liquidity. Realized gains and losses on Central Hudson’s energy derivative instruments are reported as part of purchased natural gas, purchased electricity and fuel used in electric generation in CH Energy Group’s and Central Hudson’s Statements of Income as the corresponding amounts are either recovered from or returned to customers through fuel cost adjustment clauses in revenues. For the years ended December 31, 2016, 2015 and 2014, neither CH Energy Group nor Central Hudson had derivatives designated as hedging instruments. The following table summarizes the effects of CH Energy Group and Central Hudson derivatives on the Statements of Income (In Thousands):
Amount of Gain(Loss) Recognized as Increase/(Decrease) in the Statements
of Income
Year Ended December 31,
2016 2015 2014 Location of Gain (Loss)
Central Hudson:
Electricity swap contracts $ (18,232) $ (14,773) $ 15,761 Regulatory (asset)/liability(1)
Natural gas futures contracts (1,247) (2,536) 889 Regulatory (asset)/liability(1)
Total CH Energy Group and Central Hudson $ (19,479) $ (17,309) $ 16,650
(1) Realized gains and losses on Central Hudson’s derivative instruments are conveyed to or recovered from customers through PSC authorized deferral accounting mechanisms, with an offset in revenue and on the balance sheet, and no impact on results of operations.
Other Hedging Activities Griffith Prior to the sale of Griffith on March 4, 2014, Griffith used weather derivative contracts to hedge the effect on earnings of significant variances in weather conditions from normal patterns, if such contracts can be obtained on reasonable terms. Weather derivative contracts are accounted for in accordance with guidance specific to accounting for weather derivatives. In the year ended December 31, 2014 approximately $1.3 million of expense was recorded related to Griffith’s weather derivatives. This amount was included in Income from Discontinued Operations in the CH Energy Group Consolidated Statement of Income. Central Hudson – Electric On September 23, 2016, Central Hudson entered into a weather option for the period December 1, 2016 through March 31, 2017, to hedge the effect of significant variances in weather conditions on electricity costs. For Central Hudson, this transaction will impact purchased electric expense and revenue, but will not have a net income impact due to the full deferral authority over commodity costs through its electric cost adjustment charge clause. The aggregate limit on the contract is $5 million. This contract will be accounted for in accordance with guidance specific to accounting for weather derivatives. The premium paid will be amortized to purchased electricity over the term of the contract and all payouts,

- 75 -
including the $0.2 million payout earned in December 2016, will be recorded as a reduction to purchased electricity in the Statements of Income. The unamortized balance of this contract at December 31, 2016 is $1.0 million and is currently included in the “special deposits and prepayments” line item of CH Energy Group’s and Central Hudson’s Balance Sheets. In 2015, Central Hudson entered into a similar weather option for the period December 15, 2015 through March 15, 2016. The aggregate limit on the contract was $10 million. The premium paid was amortized to purchased electricity over the term of the contract and payouts of $0.5 million were recorded as a reduction to purchased electricity in the Statement of Income. The unamortized balance of that contract at December 31, 2015 was $1.2 million and was included in the “special deposits and prepayments: line item of CH Energy Group and Central Hudson’s Balance Sheets. The fair value of the weather option as of December 31, 2016 and 2015, based on third-party marketer pricing for similar instruments, was approximately $1.5 million and $1.4 million, respectively. The third-party marketer’s price is based on significant unobservable inputs, including short term temperature forecast and historical temperature fluctuations in winter and, as such, would be a Level 3 valuation. Central Hudson – Natural Gas On September 7, 2016, Central Hudson entered into a weather option for the period December 1, 2016 through March 31, 2017, to hedge the effect of significant variances in weather conditions and price on natural gas costs. For Central Hudson, this will impact purchased natural gas expense and revenue, but will not have a net income impact due to the full deferral authority over commodity costs through its natural gas cost adjustment charge clause. The aggregate limit on the contract is $5 million. The terms of this contract include both a weather and natural gas price trigger. However, management believes weather is the predominant trigger for any payout that may be earned under the contract. Therefore, this contract will be accounted for in accordance with guidance specific to accounting for weather derivatives. The premium paid will be amortized to purchased natural gas over the term of the contract and any payouts earned will be recorded as a reduction to purchased natural gas in the Statement of Income. The unamortized balance of the option at December 31, 2016 is $1.0 million and is currently reflected in the “special deposits and prepayments” line item of CH Energy Group’s and Central Hudson’s Balance Sheets. In 2015, Central Hudson entered into a similar weather option for the period December 1, 2015 through March 31, 2016. The aggregate limit on the contract was $10 million. The premium paid was being amortized to purchased gas over the term of the contract and there were no associated payouts. The unamortized balance of the option at December 31, 2015 was $1.3 million and was reflected in the “special deposits and prepayments” line item of CH Energy Group’s and Central Hudson’s Balance Sheets. The fair value of the weather option as of December 31, 2016 and 2015, based on third-party marketer pricing for similar instruments, was approximately $1.1 million and $1.3 million, respectively. The third-party marketer’s price is based on an analysis, which includes significant unobservable inputs, specifically short-term weather forecasts, historical

- 76 -
temperature fluctuations and correlation between daily temperature fluctuations and natural gas prices in winter and, as such, would be a Level 3 valuation.
NOTE 15 – Other Fair Value Measurements Other Assets Recorded at Fair Value
In addition to the derivatives reported at fair value discussed in Note 14 – “Accounting for Derivative Instruments and Hedging Activities”, CH Energy Group and Central Hudson report certain other assets at fair value in the Consolidated Balance Sheets. The following table summarizes the amount reported at fair value related to these assets as of December 31, 2016 and 2015 (In Thousands):
Quoted Prices in Significant Significant
Active Markets for Observable Unobservable
Identical Assets Inputs Inputs
Fair Value (Level 1) (Level 2) (Level 3)
As of December 31, 2016:
Other Investments $ 8,602 $ 8,602 $ - $ -
As of December 31, 2015:
Other Investments $ 8,847 $ 8,847 $ - $ -
As of December 31, 2016 and 2015, a portion of the trust assets for the funding of SERP and as of December 31, 2016 for the funding of CH Energy Group Directors and the Executive Deferred Compensation Plan were invested in mutual funds and money market accounts, which are measured at fair value on a recurring basis. These investments are valued at quoted market prices in active markets and, as such, are Level 1 investments as defined in the fair value hierarchy. These amounts are included in the line titled “Other investments” within the “Deferred Charges and Other Assets” section of the CH Energy Group Consolidated and Central Hudson Balance Sheets. Other Fair Value Disclosure
Financial instruments are recorded at carrying value in the financial statements, however, the fair value of these instruments is disclosed below in accordance with current accounting guidance related to financial instruments.
The following methods and assumptions were used to estimate the fair value of each class of financial instruments for which it is practicable to estimate that value:
Cash and Cash Equivalents: Carrying amount
Short-Term Borrowings: Carrying amount Due to the short-term nature (typically one month or less) of these borrowings, the carrying value is equivalent to the current fair market value. Long-term Debt: Quoted market prices for the same or similar issues (Level 2)

- 77 -
Valuations were obtained for each issue using the observed Treasury market in conjunction with secondary market trading levels and recent new issuances of comparable companies. The following tables summarize the long-term debt maturing or to be redeemed during the next five years and thereafter, as well as the estimated fair value and current portion of both CH Energy Group and Central Hudson’s long-term debt at December 31, 2016 and 2015.
Long-term Debt Maturities and Fair Value - CH Energy Group
(Dollars in Thousands)
Fixed Rate Variable Rate Total Debt Outstanding
Expected Maturity Date Amount
Estimated Effective Interest
Rate Amount
Estimated Effective Interest
Rate Amount
Estimated Effective Interest
Rate
As of December 31, 2016:
2017 $ 34,406 6.13 % $ - - %
2018 31,503 2.67 % - - %
2019 28,607 5.21 % - - %
2020 41,718 3.20 % - - %
2021 45,987 4.30 % - - %
Thereafter 342,810 4.74 % 63,700 1.37 %
Total $ 525,031 4.70 % $ 63,700 1.37 % $ 588,731 4.34 %
Fair Value $ 581,099 $ 63,700 $ 644,799
As of December 31, 2015:
2016 $ 9,315 3.36 % $ - - %
2017 34,406 6.13 % - - %
2018 31,503 2.67 % - - %
2019 28,607 5.21 % - - %
2020 17,718 4.57 % - - %
Thereafter 358,796 4.94 % 63,700 0.70 %
Total $ 480,345 4.88 % $ 63,700 0.70 % $ 544,045 4.40 %
Fair Value $ 527,750 $ 63,700 $ 591,450

- 78 -
Long-term Debt Maturities and Fair Value - Central Hudson
(Dollars in Thousands)
Fixed Rate Variable Rate Total Debt Outstanding
Expected Maturity Date Amount
Estimated Effective Interest
Rate Amount
Estimated Effective Interest
Rate Amount
Estimated Effective Interest
Rate
As of December 31, 2016:
2017 $ 33,000 6.10 % $ - - %
2018 30,000 2.46 % - - %
2019 27,000 5.11 % - - %
2020 40,000 3.04 % - - %
2021 44,150 4.19 % - - %
Thereafter 334,100 4.68 % 63,700 1.37 %
Total $ 508,250 4.62 % $ 63,700 1.37 % $ 571,950 4.26 %
Fair Value $ 561,998 $ 63,700 $ 625,698
As of December 31, 2015:
2016 $ 8,000 2.78 % $ - - %
2017 33,000 6.10 % - - %
2018 30,000 2.46 % - - %
2019 27,000 5.11 % - - %
2020 16,000 4.33 % - - %
Thereafter 348,250 4.88 % 63,700 0.70 %
Total $ 462,250 4.81 % $ 63,700 0.70 % $ 525,950 4.31 %
Fair Value $ 507,345 $ 63,700 $ 571,045
NOTE 16 – Related Party Transactions Thompson Hine LLP serves as outside counsel to CH Energy Group and Central Hudson. One partner in that firm serves as each corporation’s General Counsel and Corporate Secretary. In addition, The Chazen Companies perform engineering services for Central Hudson. A partner in the firm serves as a director of Central Hudson. The following are fees paid by CH Energy Group and Central Hudson to Thompson Hine LLP and The Chazen Group, respectively, for the years ended December 31, 2016, 2015 and 2014 (In Thousands): Year Ended December 31, 2016 2015 2014
CH Energy Group (Thompson Hines LLP) $ 1,692 $ 1,347 $ 1,712 Central Hudson (Thompson Hines LLP) $ 1,544 $ 1,154 $ 1,461 Central Hudson (The Chazen Companies) $ 254 $ 446 $ 277
CH Energy Group and Central Hudson may provide general and administrative services (“services”) to and receive services from each other, Fortis and other subsidiaries of Fortis. The costs of these services are reimbursed by the beneficiary company through

- 79 -
accounts receivable and accounts payable, as necessary. CH Energy Group and Central Hudson may also incur charges from Fortis or each other for the recovery of general corporate expenses incurred by one another, Fortis or other affiliates. These transactions are in the normal course of business and are recorded at the United States exchange amounts. Related party transactions included in accounts receivable and accounts payable in the periods ended December 31, 2016 and 2015 are as follows (in Thousands): December 31, December 31,
2016 2015
CH Energy Group(1)
Fortis Fortis
Accounts Receivable $ 501 $ 195
Accounts Payable 1 $ - $ -
December 31, December 31,
2016 2015
Other Affiliates
Other Affiliates Central Hudson
(1) CHEG Fortis CHEG Fortis
Accounts Receivable $ - $ 34 $ - $ 65 $ 195 $ 9
Accounts Payable $ 625 $ - $ - $ 336 $ - $ - (1) Fortis amounts reported above include Fortis and all Fortis subsidiaries.
Related Party transactions in operating expense for the years ended December 31, 2016, 2015 and 2014 for CH Energy Group and Central Hudson are as follows (In Thousands):
December 31, 2016 December 31, 2015 December 31, 2014
CHEG Fortis(1)
CHEG Fortis(1)
CHEG Fortis(1)
CH Energy Group $ - $ 2,766 $ - $ 629 $ - $ 575
Central Hudson $ 3,155 $ - $ 1,119 $ - $ 980 $ -
(1) Fortis amounts reported above include Fortis and all Fortis subsidiaries.
NOTE 17 – Future Accounting Pronouncements To Be Adopted Soon to be adopted accounting guidance is summarized below, including explanations for any new guidance issued in 2016 (except that which is not currently applicable) and the expected impact on CH Energy Group and its subsidiaries. Revenue from Contract with Customers ASUs No. 2014-09, 2015-14, 2016-08, 2016-10, 2016-11, 2016-12 and 2016-20 - Revenue from Contracts with Customers and related issuances and clarifications replaces all current guidance and provides a unified model to determine when and how revenue is recognized. The ASU is effective for calendar years beginning January 2018; early adoption is permitted but for periods beginning before December 15, 2016. The new guidance permits two methods of adoption: (i) the full retrospective method, under which comparative periods would be restated, and the cumulative impact of applying the standard would be recognized as at

- 80 -
January 1, 2017, the earliest period presented; or (ii) the modified retrospective method, under which comparative periods would not be restated and the cumulative impact of applying the standard would be recognized at the date of initial adoption, January 1, 2018. CH Energy Group and its subsidiaries expects to use the modified retrospective approach, however, it continues to monitor industry developments. Any significant industry developments could change the expected method of adoption. The majority of the Central Hudson’s revenue is generated from energy sales to retail customers based on published tariff rates approved by the PSC and is considered to be in the scope of ASU No. 2014-09. Central Hudson does not expect that the adoption of this standard and all related ASUs will have a material impact on the recognition of revenue; however continues to closely monitor industry developments related to the new standard. Certain industry specific interpretative issues, including contributions in aid of construction, remain outstanding and the conclusions reached, if different than currently anticipated, could have a material impact on the consolidated financial statements and related disclosures. Inventory ASU No. 2015-11 Simplifying the Measurement of Inventory requires entities to measure most inventory “at the lower of cost and net realizable value” simplifying the current guidance and eliminating the need to determine replacement cost and evaluate whether it is above the ceiling or below the floor. The ASU is effective for calendar years beginning January 2017 and is to be applied prospectively. Early adoption is permitted. CH Energy Group and its subsidiaries do not expect that the amended guidance will have a material impact on its consolidated financials. Financial Instruments ASU No. 2016-01- Recognition & Measurement of Financial Assets and Liabilities which amends the guidance in U.S. GAAP on the classification and measurement of financial instruments. Although the ASU retains many current requirements, it significantly revises an entity’s accounting related to (1) the classification and measurement of investments in equity securities and (2) the presentation of certain fair value changes for financial liabilities measured at fair value. The ASU also amends certain disclosure requirements associated with the fair value of financial instruments. The ASU is effective for calendar years beginning January 2018 and is to be applied by means of cumulative effects adjustment to the balance sheet as of the beginning of the fiscal year of adoption. CH Energy Group and its subsidiaries are currently evaluating when to adopt the new standard, and the impact, if any, that the adoption of this standard will have on the financial condition, results of operations and cash flows. Leases ASU No. 2016-02- Leases introduces a new lessee model that brings substantially all leases onto the balance sheet. In addition, while the new standard retains most of the principles of the existing lessor model in U.S. GAAP, it aligns many of those principles with the FASB’s new revenue guidance. The ASU is effective for calendar years beginning January 2019 and is to be applied using a modified retrospective approach with practical expedient options. Early adoption is permitted. CH Energy Group and its subsidiaries are currently evaluating when to adopt the new standard, and the impact, if any, that the adoption of this standard will have on the financial condition, results of operations and cash flows.

- 81 -
Derivatives and Hedging ASU No. 2016-05 Effect of Derivative Contract Novation on Existing Hedge Accounting Relationships clarifies that “a change in the counterparty to a derivative instrument that has been designated as the hedging instrument under Topic 815 does not, in and of itself, require dedesignation of that hedging relationship provided that all other hedge accounting criteria. The ASU is effective for calendar years beginning January 2017 and is to be applied using a modified retrospective or prospective approach. Early adoption is permitted. ASU No. 2016-06 Contingent Put and Call Options on Debt Instruments clarifies that in assessing whether an embedded contingent put or call option is clearly and closely related to the debt host, an entity is required to apply only the four-step decision sequence in ASC 815-15-25-42. The entity does not have to separately assess whether the event that triggers its ability to exercise the contingent option is itself indexed only to interest rates or credit risk. The ASU is effective for calendar years beginning January 2017 and is to be applied using a modified retrospective or prospective approach. Early adoption is permitted. CH Energy Group and its subsidiaries do not expect that the amended guidance will have a material impact on its consolidated financials. Investment - Equity Method & Joint Venture ASU No. 2016-07 Simplifying the Transition to Equity Method of Accounting eliminates the
requirement that when an investment qualifies for use of the equity method as a result of an Increase in the level of ownership interest or degree of influence, an investor must adjust the investment, results of operations, and retained earnings retroactively on a step-by-step basis. Therefore, upon qualifying for the equity method of accounting, no retroactive adjustment of the investment is required. The ASU is effective for calendar years beginning January 2017 and is to be applied prospectively. Early adoption is permitted. CH Energy Group and its subsidiaries do not expect that the amended guidance will have a material impact on its consolidated financials. Financial Instruments ASU No. 2016-13 Measurement of Credit Losses on Financial Instruments adds to U.S. GAAP a new impairment model (known as the current expected credit loss (CECL) model) that is based on expected losses rather than incurred losses. Under the CECL model, an entity recognizes as an allowance its estimate of expected credit losses, which the FASB believes will result in more timely recognition of such losses. The ASU is also intended to reduce the complexity of U.S. GAAP by decreasing the number of credit impairment models that entities use to account for debt instruments. The ASU is effective for calendar years beginning January 2020 and is to be applied using a retrospective approach. If impracticable to apply retrospectively it should be applied prospectively. Early adoption is permitted. CH Energy Group and its subsidiaries are currently evaluating when to adopt the new standard, and the impact, if any, that the adoption of this standard will have on the financial condition, results of operations and cash flows. Statement of Cash Flows ASU No. 2016-15 Classification of Certain Cash Receipts and Payments which amends ASC 230 as it lacked consistent principles for evaluating the classification of cash payments and receipts in the statement of cash flows, which led to diversity in practice and, in certain

- 82 -
circumstances, financial statement restatements. The ASU is effective for calendar years beginning January 2018 and is to be applied retrospectively unless impracticable in which case prospective approach is required as of the earliest date practicable. Early adoption is permitted. CH Energy Group and its subsidiaries do not expect that the amended guidance will have a material impact on its consolidated financials. Statement of Cash Flows ASU No. 2016-18 amends ASC 230 and clarifies guidance on the classification and presentation of restricted cash in the statement of cash flows. Key requirements are (1) entity should include in its cash and cash-equivalent balances in the statement of cash flows those amounts that are deemed to be restricted cash and restricted cash equivalents. Entity should continue to provide appropriate disclosures about its accounting policies pertaining to restricted cash in accordance with other GAAP. (2) a reconciliation between the statement of financial position and the statement of cash flows must be disclosed when the statement of financial position includes more than one line item for cash, cash equivalents, restricted cash, and restricted cash equivalents (3) changes in restricted cash and restricted cash equivalents that result from transfers between cash, cash equivalents, and restricted cash and restricted cash equivalents should not be presented as cash flow activities in the statement of cash flows
and (4) an entity with a material balance of amounts generally described as restricted cash and restricted cash equivalents must disclose information about the nature of the restrictions. The ASU is effective for calendar years beginning January 2018 and is to be applied prospectively. Early adoption is permitted. CH Energy Group and its subsidiaries do not expect that the amended guidance will have a material impact on its consolidated financials.
NOTE 18 – Subsequent Events In addition to items disclosed in the footnotes, CH Energy Group has performed an evaluation of events subsequent to December 31, 2016 through the date the financial statements were issued and noted the following additional items to disclose. On January 15, 2017, CH Energy Group’s Board of Directors approved a $5.5 million dividend payment to parent FortisUS. On January 15, 2017, Central Hudson’s Board of Directors approved a $4.0 million dividend payment to CH Energy Group. On January 20, 2017, Central Hudson made contributions of $13.0 million and $1.5 million to the Retirement Plan and OPEB, respectively.

- 83 -
MANAGEMENT’S DISCUSSION and ANALYSIS of FINANCIAL CONDITION and RESULTS of OPERATIONS For the Year Ended December 31, 2016 This Management Discussion and Analysis of Financial Condition and Results of Operations (“MD&A”) should be read in conjunction with the 2015 Financial Statements and the notes thereto. Company: CH Energy Group is the holding company parent corporation of four principal, wholly owned subsidiaries, Central Hudson Gas & Electric Corporation (“Central Hudson”), Central Hudson Enterprises Corporation (“CHEC”), Central Hudson Electric Transmission LLC (“CHET”) and Central Hudson Gas Transmission LLC (“CHGT”). Central Hudson is a regulated electric and natural gas transmission and distribution utility. In 2014, CH Energy Group formed CHET to engage in electric transmission projects and CHET currently has a 6.1% ownership interest in New York Transco LLC (“Transco”), a partnership with affiliates of the other investor owned utilities in New York State; created to develop, own and operate electric transmission projects in New York State. In the first quarter of 2016, CHGT was formed to hold CH Energy Group’s ownership stake in possible gas transmission pipeline opportunities in New York State. All of CH Energy Group’s common stock is indirectly owned by Fortis Inc. (“Fortis”), which is a leader in the North American regulated electric and gas utility industry, with total assets of approximately CAD$47 billion, on a pro forma basis as at September 30, 2016 including the acquisition of ITC Holdings Corp. Fortis and its subsidiaries’ 8,000 employees serve utility customers in five Canadian provinces, nine U.S. states and three Caribbean countries. Central Hudson purchases, sells at wholesale and retail, and distributes electricity and natural gas at retail, in portions of New York State to approximately 300,000 and 79,000 electric and natural gas customers, respectively, and is subject to regulation by the New York Public Service Commission (“PSC” or “Commission”).
Mission and Strategy
Mission CH Energy Group’s mission is to provide electricity and natural gas to an expanding customer base in a safe, reliable, courteous and affordable manner; to produce growing financial returns for shareholders; to foster a culture that encourages employees to reach their full potential; and to be a good corporate citizen. CH Energy Group’s strategy is to:
Invest primarily in electric and gas transmission and distribution; and
Maintain a financial profile that supports a credit rating for Central Hudson in the “A” category.
Strategy Execution Management continues to focus on investment in Central Hudson’s electric and natural gas infrastructure as the core of its strategy. Central Hudson invested approximately $176 million

- 84 -
in 2016, and its five year forecast includes an average of approximately $200 million of capital expenditures per year. The long-term capital program provides for continued strengthening of existing electric and gas infrastructure, expansion of gas distribution systems, support for Reforming the Energy Vision (“REV”), and investments in technologies that will improve reliability and customer satisfaction. Central Hudson has effectively managed its operational challenges, including significant weather events, in the past few years. As part of CH Energy Group’s overall strategy to invest in electric transmission and distribution, CH Energy Group formed CHET to be an investor in Transco, a partnership with affiliates of the other investor owned utilities in New York (Con Edison, Orange & Rockland Utilities, National Grid, New York State Electric & Gas and Rochester Gas & Electric). Transco was created to develop, own and operate electric transmission projects in New York State. In December 2014, Transco filed an application with the Federal Energy Regulatory Commission (“FERC”) for the recovery through a formula rate of Transco’s cost and return on investment of five high voltage transmission projects totaling $1.7 billion (“Transco’s Initial FERC Filing”). CHET’s maximum commitment for these five projects is $182 million, which is the maximum budgeted amount for these projects at 100% equity. In November 2015, Transco filed an Offer of Partial Settlement with FERC (”Transco’s Settlement”), resolving all issues set for hearing or pending in requests for rehearing in Transco’s Initial FERC Filing. In March 2016, FERC approved rates for Transco and three projects costing approximately $209 million were placed in service during the second quarter of 2016. CHET made capital contributions to Transco of $6.8 million to fund these projects. Two of the projects included in Transco’s Initial FERC Filing (the “AC Projects”) are not subject to the terms of the Transco Settlement and are held in abeyance. The two AC Projects excluded from the Transco’s Settlement are part of the AC Transmission Proceeding with the PSC. In December 2015, the PSC issued an Order to move forward in the review of the AC Projects with the New York State Independent System Operator (“NYISO”). As part of the Order, the PSC requested that one of Transco’s projects be removed from the AC Transmission Proceeding. The total cost of this one project was approximately $250 million. In October 2016, the NYISO completed its review of the bids received for the AC Projects and issued its viability and sufficiency assessment report. Six developers submitted bids in the process. NY Transco and three other developers had projects declared as sufficient by the NYISO in the report. On June 24, 2017, the PSC issued an Order Addressing Public Policy Transmission Need for AC Transmission Upgrades (the “Order”) finding that the NYISO should proceed to a full evaluation of the proposed transmission solutions deemed viable and sufficient for purposes of addressing congestion across the Central East and UPNY/SENY interfaces. The NYISO should select as appropriate, the more efficient or cost-effective transmission solution to meet AC Public Policy Transmission Need. In the Order, the Commission also adopted the cost allocation methodology proposed by the NYISO in their analysis for recovering the costs and the transmission updates that the NYISO will file with the FERC. A final award for an AC Project is not expected until the fourth quarter of 2017.
- 85 -
Central Hudson
Business Description and Strategy Central Hudson is subject to regulation by the PSC. Central Hudson’s earnings are derived primarily from the revenue it generates from delivering energy to approximately 300,000 electric and 79,000 natural gas customers, with earnings growth coming primarily from increases in net utility plant. Central Hudson’s delivery rates are designed to recover the cost of providing safe and reliable service while affording the opportunity to earn a fair and reasonable return on its capital.
Central Hudson’s strategy is to provide exceptional value to its customers by:
Practicing continuous improvement in everything we do;
Investing in transmission and distribution infrastructure to enhance reliability, improve customer satisfaction and reduce risk;
Moderating cost pressures that increase customer bill levels and commodity exposures that cause customer bill variability;
Advocating on behalf of customers and other stakeholders; and
Investing in employee development to meet the business needs of today and the future.
Opportunities and Risks Central Hudson invests significant capital on an annual basis. Central Hudson’s investments enhance safety and reliability through cost-beneficial solutions, which are intended to improve customer satisfaction and reduce risk. Opportunities to enhance transmission and distribution systems and information systems technologies are evaluated and prioritized based on their expected benefits, projected costs and estimated risks. Central Hudson believes that there are continuing opportunities for further expansion of its current natural gas customer base due to natural gas’ advantage as an economic, clean, and abundant fuel. Central Hudson began implementing a natural gas expansion strategy in 2013 and increased its natural gas customer base by more than 2,700 customers over the past two years. Management believes the increase in natural gas customers during 2017 will be in line with recent annual increases. Central Hudson will continue to seek financing alternatives through private lenders and the New York State Energy Research & Development Authority (“NYSERDA”) in order to remove the cost barrier to customers converting to natural gas.
The key risks management sees in achieving its overall strategy are the regulatory environment, successful execution of its capital investment programs, customer bill pressures from significant capital investments, ability to achieve aggressive gas customer growth expansion targets used in the PSC approved rates and the economy in Central Hudson’s service territory.
Central Hudson’s ability to meet its financial objectives is largely dependent on supportive ratemaking practices by the PSC. Risks related to these practices include (1) reduced allowed returns on equity, (2) PSC-allowed revenues that result in less than full recovery of the legitimate costs of providing service, resulting in earned returns below authorized returns, (3) declining PSC support for strong capital structures and credit ratings, (4) NYS energy policy,

- 86 -
(5) changes in deferral accounting that increase the volatility of earnings and/or defer cash recovery of our costs, (6) elimination of RDMs, and (7) changes in the mechanisms currently in place for recovery of Central Hudson’s commodity purchases. Management believes Central Hudson’s commitments to providing safe and reliable service, customer satisfaction, operational excellence and promoting positive customer and regulatory relations are important for supportive regulatory relationships and obtaining full cost recovery and competitive returns on invested capital. The PSC Order Authorizing the Acquisition of CH Energy Group by Fortis provided an extension of the key provisions from the 2010 Rate Order, with a 2-year rate freeze through June 30, 2015 and setting aside $40 million of funds to benefit customers, primarily through offsets to regulatory assets in order to mitigate future rate increases. As a result of the 2-year rate freeze, Central Hudson did not earn a return on new capital investments in the utility of approximately $215 million and absorbed inflationary cost increases over this time period. Additionally, falling interest rates since the 2010 Rate Order led to a decrease in the authorized ROE in the 2015 Rate Order proceeding. A PSC Order establishing new rates became effective July 1, 2015. The key provisions of the current rate plan include an authorized regulatory return on equity of 9.0% and a 48% regulatory equity ratio; the continuation of RDMs; full recovery and deferral provisions for purchased electric and gas, SIR costs, pension and OPEB expenses. The rate plan also contains service quality thresholds, performance below or above which entails financial penalties or incentives. For additional discussion of the key terms of the 2015 Rate Order, see Regulatory Proceedings – “2015 Rate Order”. During the second quarter of 2014, Governor Cuomo and the Public Service Commission announced the commencement of its REV proceeding. REV is an initiative that aims to improve the efficiency of the electric system; reduce emissions; encourage greater development of clean generation, fuel diversity and energy efficiency measures; and provide customers with knowledge and tools for more effective management of their total energy use through the adoption of new technologies on both the utility and customer side of the meter. During the first quarter of 2015, the Commission issued the REV Track 1 “Order Adopting Regulatory Policy Framework and Implementation Plans”. The Order addresses the vision of the future for the industry, provides an overview of the Distributed System Platform Provider (“DSP”) and their role in integrated system planning, grid operations, and market operations; identifies and concludes that utilities will be required to serve as DSPs. Central Hudson expects to continue its efforts working with the other New York electric utilities and various stakeholders in the energy industry to develop policy positions in order to facilitate the implementation of REV. During 2015 Central Hudson formed the Energy Transformation & Solutions Division to lead its efforts associated with REV. The group’s first initiative was Cen Hub, which launched on April 3, 2016. Cen Hub is a web-based customer engagement platform that provides personalized information, energy efficiency tips and access to discounted energy-saving products and services. On Aug. 4, 2015, the PSC approved Cen Hub, as one of seven statewide demonstration projects. As of December 31, 2016, customers have logged in over 56,000

- 87 -
times, completed more than 22,000 energy efficiency tips, and purchased over 10,000 products. Along with Cen Hub, the Energy Transformation & Solutions Division is tasked with continuing the successful operation of Central Hudson’s energy efficiency efforts, maintaining a territory-wide Dynamic Load Management program, and managing a Targeted Demand Response program. The goal of the Targeted Demand Response program is to reduce peak demand in specific areas, which will allow Central Hudson to defer the need for capital investments and produce savings for its customers. The outcome of REV and the many related proceedings cannot be predicted at this time, but they could result in an increased or decreased scope of regulated activities, earnings potential, and risk. Another risk is the ability to effectively manage costs, which is a key component of Central Hudson’s strategy. The continued implementation of Lean Six Sigma techniques – a data-driven approach to develop processes that are faster, higher quality and less costly – to streamline existing business processes and foster innovation will play critical roles in managing the costs of doing business in a sustainable manner. The economy in Central Hudson’s service territory affects the growth of utility rate base and earnings through a direct relationship to customer additions and peak demand growth as well as affecting Central Hudson’s ability to collect receivables. Management believes the economy in Central Hudson’s service territory has good long-term growth prospects, but unexpected prolonged downturns could inhibit its ability to meet long-term business objectives. Central Hudson has an economic development program intended to increase job growth and income in its service territory.
CH Energy Group - Regulated Operations - Central Hudson
Financial Highlights
Period Ended December 31 Year to Date
2016 2015 Change
Electricity Sales (GWh) 5,112 5,132 (20) Natural Gas Sales (PJ) 24.0 23.5 0.5 (In millions)
Revenues $ 639.6 $ 690.9 $ (51.3)
Energy Supply Costs - Matched to Revenues 190.7 247.8 (57.1)
Operating Expenses - Matched to Revenues 79.9 94.7 (14.9)
Operating Expenses - Other 211.8 203.6 8.2
Depreciation and amortization 46.5 44.1 2.4
Other Income, net 4.0 6.1 (2.1)
Finance Charges 30.2 30.1 0.1
Income Taxes 31.8 31.1 0.7
Net income $ 52.6 $ 45.6 $ 7.0

- 88 -
Earnings: Earnings for 2016 as compared to 2015 increased by $7.0 million. Effective July 1, 2015 and July 1, 2016, Central Hudson’s earnings reflect the PSC approved increases in delivery rates which provide cost recovery for higher operating expenses and a return on additional capital invested in the business. The earnings in first six months of 2015, prior to the approved rate increase, were negatively impacted by the rate freeze in effect pursuant to the Order Authorizing the Acquisition of Central Hudson by Fortis, Inc. Additionally, the year over year earnings were favorably impacted by a decrease in the uncollectible reserve as a result of lower customer bills. These increases in earnings were partially offset by incremental amounts invested in tree trimming in 2016 and the impact of tax law changes, including the extension of bonus depreciation, at the end of 2015 which resulted in a reduction in the amount of capital invested in the business and per the current rate agreement, the return on this capital has been deferred for future refund to customers. In addition, 2015 earnings included energy efficiency incentives earned and the recovery of a tax gross-up billed to customers related to contributions in aid of construction (“CIAC”) on projects not required under the Central Hudson’s tariff. Energy supply costs reflect significantly lower commodity prices in 2016 when compared to 2015. This did not have a direct impact on earnings due to the full deferral of commodity costs and the revenue decoupling mechanism (“RDM”). However, lower revenues result in less revenue collected for bad debt and lower finance charge income. Electricity Sales & Natural Gas Sales: Year over year electricity sales were slightly lower primarily driven by significantly warmer weather in the first quarter of 2016 in comparison to that of 2015, partially offset by the impact of the transition to monthly billing. Natural Gas sales increased by 2.1% as a result of a colder weather in the latter part of 2016, partially offset by warmer than normal weather during the first quarter of 2016. Sales variations do not have a material impact on Central Hudson’s revenue as a result of its RDM structure. Depreciation and Amortization: Depreciation and amortization increased due to the increased investment in Central Hudson’s electric and gas infrastructure in accordance with its capital expenditure program. Other Income, net: Other income, net decreased year over year due to lower carrying charges related to an overall decrease in the underlying balances as a result of the offset of certain regulatory assets and liabilities per the 2015 Rate Order. Additionally, other income in 2015 included the tax gross up billed to a customer related to a customer contribution on a non-tariff project. Finance Charges: Finance charges (interest charges) were relatively unchanged. Corporate Taxes: The change in corporate taxes was primarily driven by an increase in taxable income in 2016 as compared to 2015, which was partially offset by the impact of the decrease in the New York State tax rate on deferred tax asset balances, which resulted in an increase in tax expense in 2015.

- 89 -
Central Hudson Revenues - Electric
Period Ended December 31
(In millions) Year to Date
2016 2015 Change
Revenues with Matching Expense Offsets:(1)
Recovery of commodity purchases $ 153.9 $ 190.0 $ (36.1)
Sales to others for resale 3.5 3.9 (0.4)
Other revenues with matching offsets 70.1 84.0 (13.9)
Subtotal 227.5 277.9 (50.4)
Revenues Impacting Earnings:
Customer sales 285.8 257.6 28.2
RDM and other regulatory mechanisms (9.8) (1.3) (8.5)
Energy efficiency incentives (0.1) 2.0 (2.1)
Revenue requirement of bonus depreciation (1.1) - (1.1)
Other revenues 8.5 8.1 0.4
Subtotal 283.3 266.4 16.9
Total Electric Revenues $ 510.8 $ 544.3 $ (33.5)
(1) Revenues with matching offsets do not affect earnings since they offset related costs, the most significant being energy cost adjustment
revenues, which provide for the recovery of purchased electricity costs. Other related costs include authorized business expenses recovered through rates and the cost of special programs authorized by the PSC and funded with certain available credits. Changes in revenues from electric sales to other entities for resale also do not affect earnings since any related profits or losses are returned or charged, respectively, to customers.
Central Hudson Revenues - Natural Gas
Period Ended December 31
(In millions) Year to Date
2016 2015 Change
Revenues with Matching Expense Offsets:(1)
Recovery of commodity purchases $ 23.4 $ 40.4 $ (17.0)
Sales to others for resale 9.9 13.6 (3.7)
Other revenues with matching offsets 9.6 13.6 (4.0)
Subtotal 42.9 67.6 (24.7)
Revenues Impacting Earnings:
Customer sales 74.5 69.4 5.1
RDM and other regulatory mechanisms 6.4 1.8 4.6
Revenue requirement of bonus depreciation (0.6) - (0.6)
Other revenues 5.7 7.8 (2.1)
Subtotal 86.0 79.0 7.0
Total Natural Gas Revenues $ 128.9 $ 146.6 $ (17.7)
(1) Revenues with matching offsets do not affect earnings since they offset related costs, the most significant being energy cost adjustment
revenues, which provide for the recovery of purchased natural gas costs. Other related costs include authorized business expenses recovered through rates and the cost of special programs authorized by the PSC and funded with certain available credits. For natural gas sales to other entities for resale, 85% of such profits are returned to customers.

- 90 -
Central Hudson’s revenues consist of two major categories: those that offset specific expenses in the current period (matching revenues) and those that impact earnings. Matching revenues recover Central Hudson’s actual costs for particular expenses (most notably, purchased electricity and purchased natural gas, pensions and OPEBs, the NYS Temporary State Assessment and NYS energy efficiency programs). Any difference between these revenues and the actual expenses incurred is deferred for future recovery from or refunded to customers and, therefore, does not impact earnings, with the exception of related carrying charges, which are recorded within other income or interest charges in the CH Energy Group and Central Hudson Statement of Income. Electric Revenue: The year over year decrease in electric revenue was primarily driven by lower wholesale prices for electricity. Additionally, in accordance with the 2015 Rate Order, Central Hudson is required to defer the revenue requirement effect of the bonus depreciation legislation enacted at the end of 2015, which resulted in a decrease in revenues in 2016. Further impacting the variation year over year were the energy efficiency incentives earned in 2015. Partially offsetting these decreases was an increase in customer delivery rates effective July 1, 2015 and July 1, 2016, as approved in the 2015 Rate Order. Gas Revenue: The decrease in gas revenue relative to the prior year was primarily driven by the lower natural gas commodity prices which more than offset the increase in delivery volumes in 2016. This impacted both the revenue recovered by Central Hudson for commodity purchases as well as revenues generated from natural gas sales for resale. Gas revenues also decreased as a result of the bonus depreciation legislation enacted at the end of 2015. As discussed above, Central Hudson is required to defer the revenue requirement effect of the bonus depreciation legislation enacted at the end of 2015, which resulted in a decrease in revenues in 2016. These decreases were partially offset by increases in customer delivery rates effective July 1, 2015 and July 1, 2016, as approved in the 2015 Rate Order.

- 91 -
Central Hudson Operating Expenses
Period Ended December 31 (In millions) Year to Date
2016 2015 Change
Expenses Currently Matched to Revenues:(1)
Purchased electricity $ 157.4 $ 193.9 $ (36.5)
Purchased natural gas 33.3 53.9 (20.6)
Pension & OPEB 12.7 20.3 (7.6)
NYS energy programs 34.2 42.3 (8.1)
Other matched expenses 33.1 32.1 1.0
Subtotal 270.7 342.5 (71.9)
Other Operating Expense Variations:
Tree trimming 16.5 14.4 2.1
Property and school taxes(2)
46.9 42.5 4.4
Weather related service restoration 4.0 3.6 0.4
Distribution maintenance 11.1 11.5 (0.4)
Uncollectible accounts and reserve 4.2 7.6 (3.4)
Depreciation and amortization 46.5 44.1 2.4
Other expenses 129.1 123.8 5.3
Subtotal 258.3 247.5 10.8
Total Operating Expenses $ 528.9 $ 590.0 $ (61.1)
(1) Includes expenses that, in accordance with the 2013 Joint Proposal and the 2015 Rate Order, are adjusted in the current period to equal the revenues earned for the applicable expenses and the differences are deferred.
(2) In accordance with the 2013 Joint Proposal and the 2015 Rate Order, Central Hudson is authorized to defer for the benefit of or recovery from customers 90% of any difference between actual property tax expense and the amounts provided in rates for each Rate Year. Central Hudson's portion is limited to 10%, with a maximum of approximately $0.5 million per Rate Year.
Operating Expenses: Operating expenses decreased primarily as a result of the lower commodity prices and a decrease in the uncollectible reserve in 2016 as a result of lower customer bills. Further impacting the decrease in expenses is a decrease in pension and OPEB expense resulting from a decrease in the amount collected in rates effective July 1, 2015 and July 1, 2016, as well as a decrease in the amount collected for energy efficiency programs in 2016 as mandated in the Clean Energy Fund Order. These decreases were partially offset by increases in property and school taxes, depreciation and amortization resulting from increased capital investments and increases in other operating expenses, which were covered by the increases in delivery rates effective July 1, 2015 and July 1, 2016, as authorized in the 2015 Rate Order. Additionally in 2016, incremental amounts were invested in tree trimming expense in an effort to improve reliability. Variations in purchased gas and electricity costs and other expenses currently matched to revenues do not have a direct impact on earnings due to Central Hudson’s regulatory mechanism for the full deferral of commodity costs.
CH Energy Group - Non-regulated and Holding Company Operations Financial Highlights Period Ended December 31 Year To Date
(In millions) 2016 2015 Change
Loss from continuing operations (1.7) (1.8) 0.1

- 92 -
Financial Position The following table outlines the significant changes in the Balance Sheet of Central Hudson as of December 31, 2016 CH Energy Group – Regulated – Central Hudson Significant Changes in the Balance Sheets as of December 31, 2016 (In millions) Balance Sheet Account
Increase (Decrease) Explanation
Accrued unbilled utility revenues
(8.4) Decrease reflects the impact of monthly billing and a decrease in sales volumes.
Fuel, materials and supplies
5.2
Increase due to equipment purchases related to the establishment of an internal communication network for utility plant assets.
Income tax receivable (29.6) Decrease primarily due to a tax refund received related to bonus depreciation, which was retroactively reinstated with legislation passed in December 2015.
Regulatory assets - related to pension plan costs
(42.2) Decrease primarily due to improved performance of plan assets and the amortization of prior service costs and actuarial losses.
Long term debt, net of current maturities
46.0 Increase due to the issuance of long-term debt in June 2016 and October 2016 where the proceeds were used to finance capital expenditures and general corporate purposes. Partially offsetting this increase was the settlement of long-term debt in April 2016.
Short-term borrowings (27.0) Decrease due to the repayment of short-term borrowings based on lower working capital needs.
Regulatory liabilities - current
(10.9) Decrease primarily due to a reduction in deferred unbilled revenue as a result of the transition to monthly billing, partially offset by the increase in RDMs as a result of current year billings in excess of targets.
Fair value of derivative instruments, (net)
(10.8) Decrease in the liability is due to higher unrealized mark-to-market gains related to open electric and gas derivative contracts primarily as a result of rising fuel costs.
Accrued environmental remediation costs
(19.2) Decrease primarily due to $16.5 million spent on remediation efforts at the Kingston site, as well as, decreases of $0.8 million and $0.5 million spent on OM&M at the Newburgh and Catskill sites, respectively.
Regulatory liabilities other-long term
29.5 Increase primarily due to continued collections for energy efficiency programs with delayed remittance to NYSERDA in accordance with the Clean Energy Fund Order ("CEF").
Accumulated deferred income tax
37.4 Increase primarily due to the accounting requirement to recognize deferred taxes for the difference between tax basis of assets and liabilities and the book basis. These amounts are fully deferred for future return to or recovery from customers.

- 93 -
Liquidity And Capital Resources
The following table outlines the summary of cash flow: CH Energy Group - Regulated, Non-regulated and Holding Company Summary of Cash Flow
Period Ended December 31, (In Millions) Year to Date
2016 2015
Cash, beginning of period $ 13.6 $ 22.6
Operating Activities 186.9 104.3
Investing Activities (178.6) (144.9)
Financing Activities (2.6) 31.6
Cash, end of period $ 19.3 $ 13.6
Dividends paid on Common Stock - CH Energy Group $ (22.0) $ (22.0) Dividends paid to parent - Central Hudson $ (24.5) $ (24.5)
Operating Activities: Operating activities generated more cash in 2016 primarily due to lower working capital requirements for wholesale energy purchases, a tax refund associated with bonus depreciation legislation enacted at the end of 2015 and collections related to energy efficiency programs under the CEF Order. The energy efficiency program collections are a pass-through and will be remitted to NYSERDA in future periods, based on program funding needs as defined in the CEF Order. Investing Activities: There was more cash used in investing activities in 2016 due to an increase in capital expenditures for Central Hudson’s electric and gas, transmission and distribution systems. Financing Activities: In 2016, cash from operations provided the capital necessary to pay down short term borrowings without the equity infusion that was required in 2015.
Anticipated Sources and Uses of Cash CH Energy Group’s cash flow is primarily generated by the operations of its utility subsidiary, Central Hudson. Generally, the subsidiary does not accumulate significant amounts of cash but rather provides cash to CH Energy Group in the form of dividends. Central Hudson expects to fund capital expenditures with cash from operations and a combination of short-term and long-term borrowings. Central Hudson may alter its plan for capital expenditures as its business needs require. Central Hudson intends to fund growth in its long-lived assets in a manner that maintains an equity ratio no less than 48%, excluding short-term debt balances. Central Hudson plans to utilize short-term debt to fund seasonal and temporary variations in working capital requirements. If wholesale energy prices increase, Central Hudson would expect a corresponding increase in its current level of working capital. CH Energy Group believes cash generated from operations and funds obtained from its financing program will be sufficient in 2017 and the foreseeable future to meet working capital

- 94 -
needs, pay dividends on its Common Stock, and fund investments to fulfill CHET’s investment in Transco and Central Hudson’s public service obligations and growth objectives.
CH Energy Group’s secondary sources of funds are its cash reserves and its credit facilities. CH Energy Group’s ability to use its credit facility is contingent upon maintaining certain financial covenants. CH Energy Group does not anticipate that those covenants will restrict its access to funds in 2017 or the foreseeable future.
Committed Credit Facilities Committed Credit Facilities for CH Energy Group and Central Hudson at December 31, 2016: (In Millions)
December 31, 2016
Credit Limit Outstanding Available Maturity
CH Energy Group (unregulated)
$ 250 $ - $ 250 July 10, 2020/October 15, 2020
Central Hudson (regulated) 200 - 200 October 15, 2020
CH Energy Group is well positioned with a strong balance sheet and strong liquidity.
On July 10, 2015, CH Energy Group entered into a Third Amended and Restated Credit Agreement with four commercial banks. The credit commitment of the banks under the facility is $50 million. By Order issued and effective September 18, 2015, the PSC authorized an increase in Central Hudson’s committed available credit to $200 million. On October 15, 2015, Central Hudson entered into a credit agreement with six commercial banks. Consolidated CH Energy Group committed credit as of December 31, 2016 is $250 million. Uncommitted Credit Central Hudson has uncommitted short-term credit arrangements with two commercial banks totaling $25 million of which there was no outstanding balance at December 31, 2016. At December 31, 2015, $13.0 million was outstanding. In addition, at December 31, 2015, Central Hudson had an intercompany short-term borrowing of $2.0 million from CH Energy Group.
Central Hudson’s Bond Ratings December 31, 2016 December 31, 2015
Rating(1)
Outlook Rating(1)
Outlook
S&P A- Stable A Stable
Moody’s A2 Stable A2 Stable
Fitch A- Stable A- Stable
(1) These senior unsecured debt ratings reflect only the views of the rating agency issuing the rating, are not recommendations to buy, sell, or hold securities of Central Hudson and may be subject to revision or withdrawal at any time by the rating agency issuing the rating. Each rating should be evaluated independently of any other rating.
On June 21, 2016, S&P lowered Central Hudson’s senior unsecured debt rating from A to A- and changed the outlook from negative to stable. The rationale for the downgrade was a change in S&P’s assessment of Central Hudson’s financial risk profile, which is now viewed as aligned with other New York State utility companies. S&P confirmed that Central Hudson’s

- 95 -
ringfencing warrants a two-notch rating separation from its ultimate parent, Fortis Inc. On July 12, 2016, Moody’s affirmed Central Hudson’s rating at A2. Central Hudson’s strong investment-grade credit ratings help facilitate access to long-term debt, however, management can make no assurance regarding the availability of financing or its terms and costs.
CH Energy Group's Capital Structure December 31, 2016 December 31, 2015
$millions % $millions %
Long-term Debt(1)
$ 588.7 50.2 $ 544.1 48.4
Short-term Debt1 - - 25.0 2.2
Common Equity 584.4 49.8 555.4 49.4
Total $ 1,173.1 100.0 $ 1,124.5 100.0
(1) Includes current maturities of long term debt.
Central Hudson's Capital Structure December 31, 2016 December 31, 2015
$millions % $millions %
Long-term Debt(1)
$ 571.9 49.4 $ 525.9 47.4
Short-term Debt1 - - 27.0 2.4
Common Equity 585.3 50.6 557.2 50.2
Total $ 1,157.2 100.0 $ 1,110.1 100.0
(1) Includes current maturities of long term debt.
Central Hudson's customer rates reflect a capital structure, excluding short-term debt, with 48% common equity. Central Hudson is currently managing its financing to maintain its common equity at no less than 48%. Central Hudson may change its long term capitalization targets to match the capital structure reflected in future customer rates. On April 1, 2016, Central Hudson redeemed its maturing 2010 Series G medium term notes with a principal payment of $8.0 million. On June 27, 2016, Central Hudson issued $24.0 million of Series G medium term notes with an interest rate of 2.16% per annum, due September 21, 2020. Central Hudson used the proceeds from the sale of the notes to finance capital expenditures and for general corporate purposes. On October 28, 2016, Central Hudson issued $20.0 million of Series I notes with an interest rate of 3.63% per annum, with a maturity date of October 28, 2046; and $10.0 million of Series H notes with an interest rate of 2.56% per annum, with a maturity date of October 28, 2026. Central Hudson meets its need for long-term debt financing primarily through privately placed debt. As a regulated electric and natural gas utility company, Central Hudson is required to obtain authorization from the PSC to issue securities with maturities greater than 12 months.

- 96 -
CH Energy Group and Central Hudson believe they will be able to meet their short-term and long-term cash requirements, assuming that Central Hudson’s future rate plans reflect the costs of service, including a reasonable return on invested capital.
Critical Accounting Estimates
The preparation of our consolidated financial statements requires us to make estimates that affect the reported amounts of assets, liabilities, revenue and expenses, and the related disclosure of contingent assets and contingent liabilities. We base our estimates on our historical experience and on various other assumptions that we believe are reasonable under the circumstances, the results of which form the basis for making estimates about the carrying values of assets and liabilities. The accuracy of these estimates and the likelihood of future changes depend on a range of possible outcomes and a number of underlying variables, many of which are beyond our control. Actual results may differ from these estimates under different assumptions or conditions. We believe the following judgments and estimates are critical in the preparation of our consolidated financial statements.
Depreciation and amortization is based on estimates of the useful lives and estimated net salvage value of properties.
Estimates for uncollectible accounts are based on customer accounts receivable aging data as well as consideration of various quantitative and qualitative factors, including special collection issues.
The tax reserve recorded by Central Hudson relates to a change in 2010 to its tax return methodology for claiming deductions for incidental repair and maintenance expenditures on its utility assets. Although Management believes that its methodology for claiming the deduction is consistent with the Internal Revenue Code and case law, Management cannot predict whether the Internal Revenue Service will accept the entirety of the deduction claimed.
The estimates for other operating reserves are based on assessments of future obligations related to injuries and damages and workers’ compensation claims.
Unbilled revenues are determined based on the estimated sales for service rendered to customers whose meters are not read on the last day of the month.
The significant assumptions and estimates used to account for the pension plan and other post-retirement benefit expenses and liabilities are the discount rate, the expected long-term rate of return on the retirement plan and post-retirement plan assets, the rate of compensation increase, the healthcare cost trend rate, mortality assumptions, and the method of amortizing gains and losses.
Estimates are also reflected for certain commitments and contingencies where there is sufficient basis to project a future obligation, including environmental remediation costs.

- 97 -
Regulatory Proceedings 2015 Rate Order On June 17, 2015, the Public Service Commission (“PSC”) issued an Order Approving Rate Plan (“Rate Order”) in Cases 14-E-0318 and 14-G-0319. The Rate Order adopted the terms set forth in the April 22, 2015 Joint Proposal. The Rate Order became effective July 1, 2015, with Rate Year 1 (“RY1”), Rate Year 2 (“RY2”) and Rate Year 3 (“RY3”) defined as the twelve months ending June 30, 2016, June 30, 2017 and June 30, 2018, respectively. Key provisions of the Rate Order include:
Electric delivery rate increases of $15.3 million, $16.0 million and $14.1 million in RY1, RY2 and RY3, respectively
Gas delivery rate increases of $1.8 million, $4.6 million and $4.4 million RY1, RY2 and RY3, respectively
To mitigate customer bill impacts from the delivery rate increases, Central Hudson (“the Company”) will utilize available regulatory liabilities as electric bill credits of $13.0 million in Rate Year 1, $12.0 million in Rate Year 2, and $2.0 million in Rate Year 3; and gas bill credits of $2.548 million in Rate Year 1 and $1.7 million in Rate Year 2. In addition, to the extent that the Company receives gas delivery revenues from the Danskammer Generating Station (“Danskammer”) in Rate Year 1, 50% of those revenues will be refunded via a bill credit to the Company’s gas customers in Rate Year 2. Similarly, 50% of the gas delivery revenues received from Danskammer in Rate Year 2 will be refunded via a bill credit to the Company’s gas customers in Rate Year 3. The remaining amounts will accrue carrying charges and be available to offset future rate increases.
The Company’s electric and gas revenue requirements reflect a common equity ratio of 48% and a return on equity (“ROE”) of 9.0%.
Earnings above 9.5% and up to 10.0% will be shared 50% / 50% between the shareholder and ratepayers. Earnings above 10.0% and up to 10.5% will be shared 20% / 80% between the shareholder and ratepayers. Earnings above 10.5% will be shared 10% / 90% between the shareholder and ratepayers.
The Rate Order includes the establishment of a major storm reserve for electric operations, with related deferral provisions, and provides $0.7 million each rate year as funding for the reserve.
The Rate Order provides for partial or full reconciliation of certain expenses including, but not limited to: property taxes, pensions/OPEBs, environmental site investigation and remediation costs, variable and fixed rate debt, and stray voltage. In addition, the Rate Order includes downward-only reconciliations for net plant, distribution and transmission right-of-way maintenance costs, security costs and rate case expenses. The Rate Order also authorizes a continuation of full cost recovery of electric and natural gas commodity costs.
- 98 -
Central Hudson will continue its revenue decoupling mechanisms (“RDMs”) for its electric and gas businesses. The structure and provisions of the RDMs will generally continue per Central Hudson’s 2010 Rate Order except that the provisions for annual and interim RDM periods will be replaced with provisions for semi-annual RDM periods.
Central Hudson’s Customer Service Quality Performance Mechanism (consisting of the PSC Annual Compliant Rate, the Customer Satisfaction Index and Appointments Kept measures) and associated reporting requirements will continue in accordance with the PSC’s Order issued on June 26, 2013 in Case 12-M-0192. The Company will be subject to a negative revenue adjustment if it fails to meet any metric as set forth in the Order.
To reduce service terminations, the PSC authorized an annual incentive in the form of a 5 basis point positive revenue adjustment for each Rate Year in which the Company reduces service terminations to residential customers in occupied buildings below 11,000.
The Rate Order modifies the electric reliability and gas safety performance measures, which generally hold the Company to more stringent standards and to a higher performance than those measures currently in place.
The Rate Order directs Central Hudson to replace or eliminate 13 miles of leak prone pipe in calendar year 2016, 14 miles in 2017, and 15 miles in 2018. In the event the Company fails to meet its leak prone pipe target in any calendar year, the Company will be subject to an 8 basis point negative revenue adjustment. The Rate Order provides the Company with an incentive to surpass its leak prone pipe target by providing for a positive revenue adjustment for each mile replaced or eliminated in excess of the applicable target, capped at maximum of 5 miles for a total 10 basis points per calendar year, which the Company will defer for future recovery.
The Rate Order directs the Company to transition to monthly billing for all customers from its current bi-monthly billing of certain customer classes by July 2016.
The Rate Order provides $1 million annual program funding each Rate Year to provide additional incentives and support for customer conversion to gas. Central Hudson will receive an annual incentive in the form of 1 basis point for every 200 gas customers added above the combined total customer count forecast for residential and commercial customers for each Rate Year.
The Rate Order provides for Network Strategy and Distribution Automation capital expenditures. Full implementation of the Network Strategy and Distribution Automation project beyond Rate Year 1 would be dependent upon PSC agreement that the Company remains on track for the successful demonstration of the functional capability and operation/integration of these investments.
The Rate Order reflects removal of energy efficiency funds (both electric and gas) from base delivery rates and recovers utility-run energy efficiency budgets via a surcharge mechanism. The internal labor component associated with energy efficiency portfolio budgets is included in base rates to facilitate integrating the administrative function of energy efficiency into base rates.

- 99 -
Approval of Central Hudson’s Non-Wire Alternative Project On July 17, 2015, Central Hudson filed details regarding its proposed cost recovery and incentive mechanisms for its non-wires-alternative project (“NWA”) pursuant to the directive in the June 17, 2015 Rate Order. The NWA Project is being pursued by the Company in order to delay significant traditional capital infrastructure investment that would otherwise be needed to accommodate the expected peak demand growth in three locations in Central Hudson’s service territory. On July 15, 2016, the Commission issued an “Order Implementing With Modification the Proposal for Cost Recovery and Incentive Mechanism for the Non-Wire Alternative Project”. The Commission directed Central Hudson to recover the costs of the NWA program by using a demand allocator that reflects the transmission and distribution (“T&D”) cost allocation of the traditional T&D investment being deferred and to collect these costs from customers through a demand charge for commercial and industrial customers and through an energy charge for residential customers. On December 21, 2016, the Commission issued an order approving the tariff filing made on September 15, 2016 and November 29, 2016 in compliance with the July 15, 2016 NWA cost recovery and incentive order. All costs under the NWA project will be incremental to any costs already reflected in base delivery rates and will include all expenditures for the demand response solutions, including the cost of competitive third party demand response providers, operations and maintenance costs, third party evaluator costs and Company administration costs. Costs will be amortized over a five year period. The NWA charge will be calculated every twelve months and will include reconciliation of the costs for the previous twelve months. The Commission approved an incentive mechanism whereby savings, defined as the difference between the net present value (“NPV”) of the revenue requirement of the traditional T&D investments over the deferral period and the NPV of the revenue requirement of the NWA program costs over the cost recovery period for each area, will be shared 70% to customers and 30% to shareholders. The NPV shall be calculated using the Company’s after-tax weighted average cost of capital as the discount rate. The incentive will be triggered based on achievement of two performance milestones: 50% of the incentive will be triggered at the achievement of 8 MW of demand response with the remaining 50% triggered at the achievement of the full targeted demand reduction of 16 MW. Wholesale generation capacity savings will be calculated annually based on actual measured and verified reductions and shared according to the 70/30 formula. This decision represents a positive outcome for Central Hudson providing the opportunity for increased earnings. Reforming the Energy Vision Proceeding In 2014, Governor Cuomo and the PSC announced the commencement of its Reforming the Energy Vision (“REV”) proceeding. REV is an initiative that aims to improve the efficiency of the electric system, reduce emissions, encourage greater development of clean generation, fuel diversity and energy efficiency measures, and provide customers with knowledge and tools for effective management of their total energy use through the adoption of new technologies on both the utility and customer side of the meter. During the first quarter of 2015, the PSC issued the REV Track 1 “Order Adopting Regulatory Policy Framework and Implementation Plans”. The Order addresses the vision of the future for the industry and the need for change, provides an overview of the Distributed System Platform Providers (“DSP”) and their role in integrated system planning, grid and market operations. The Order identifies and concludes that utilities will be required to serve as DSPs. Central Hudson expects to continue its efforts working with the other New York electric utilities and

- 100 -
various stakeholders in the energy industry to develop policy positions in order to facilitate the formation and implementation of REV. Additionally, during 2015 Central Hudson formed the Energy Transformation & Solutions Division, which has been formed to lead the Company’s efforts associated with REV. The group’s first initiative was CenHub, which launched on April 3, 2016. CenHub is a web-based customer engagement platform that provides personalized information, energy efficiency tips and access to discounted energy-saving products and services. On August 4, 2015, the PSC approved CenHub, as one of seven statewide demonstration projects. As of December 31, 2016, customers have logged in over 56,000 times, completed more than 22,000 energy efficiency tips, and purchased over 10,000 products. Along with CenHub, the Energy Transformation & Solutions Division is tasked with continuing the successful operation of Central Hudson’s energy efficiency efforts, maintaining a territory-wide Dynamic Load Management program, and managing a Targeted Demand Response program. The goal of the Targeted Demand Response program is to reduce peak demand in specific areas, which will allow Central Hudson to defer the need for capital investments and produce savings for its customers. On May 19, 2016, the PSC issued the REV Track 2 “Order Adopting a Ratemaking and Utility Revenue Model Policy Framework”. The Order is aimed at moving utilities towards a new business utility model by developing earning opportunities that are aligned with customer values and a more efficient and resilient distributed low-carbon electric grid. The Order presented two new earnings opportunities for utilities: Platform Service Revenues (“PSRs”) and Earnings Adjustment Mechanism (“EAMs”). PSRs are new utility revenues associated with the operation and facilitation of distribution markets such as customer origination, data analysis and transaction fees for goods and services. PSRs must be tariffed and regulated utilities must show that the function contemplated is inherently a monopoly function that cannot effectively be performed by non-utility parties and that the function’s principal effect is to facilitate growth and operation of markets. The PSC also sought to have utilities place shareholder money at risk for PSRs and suggested a 20% shareholder allocation of risk/reward for the provision of competitive services. EAMs are the second form of earning opportunities. EAMs are transitional incentives to achieve policy based outcomes for a time until market based revenues are available in scale and predictable. EAMs would be positive only incentives based on desired outcomes. The PSC suggested EAMs in the following areas: system efficiency, energy efficiency, customer engagement for utility innovative programs and interconnection.
The Order also addressed a number of other issues related to data access, commercial and industrial demand charges, standby charges and time of use rate design. In all, there are seventeen (17) compliance filings that the Company will need to make in relation to the Order beginning on August 1, 2016. On June 30, 2016, Central Hudson filed its Distributed System Implementation Plan (“DSIP”) and Benefit Cost Analysis Handbook (“BCAH”) pursuant to the Order Adopting Distributed System Implementation Plan Guidance issued and effective April 22, 2016, in the REV proceeding. Central Hudson’s DSIP describes its proposal for the development of a more transactional, distributed electric grid that meets the demands of a modern economy that includes improvements in system efficiency, resilience and carbon emission reductions. The

- 101 -
DSIP describes current practices in Distribution Planning, Distribution Grid Operations and Distribution Markets and the changes being made by Central Hudson to advance the functionality of these systems in direct response to the REV objectives. Central Hudson’s BCAH provides a framework for the evaluation of the monetary value that individual Distributed Energy Resources (“DERs”) or utility programs utilizing DERs can provide to the distribution grid. Central Hudson has completed several additional REV compliance filings. These filings include: 1) August 1, 2016 revised standby tariffs and December 20, 2016 compliance standby tariffs, 2) September 1, 2016 progress report on aggregated data reporting, 3) September 2, 2016 Joint Utilities’ submission of an Interconnection Survey Process and Proposed Earnings Adjustment Mechanism (“EAM”) and 4) December 1, 2016 Joint Utilities’ submission of potential metrics to be utilized within System Efficiency and Energy Efficiency EAMs. The outcome of REV and the many related proceedings cannot be predicted at this time, but they could result in an increased or decreased scope of regulated activities, earnings potential and risk. Clean Energy Standard (“CES”) Proceedings In June 2015, the Governor announced New York’s 2015 State Energy Plan (“SEP”) as a comprehensive roadmap to build a clean, resilient and affordable energy system for New York State. The SEP included three primary clean energy goals to be achieved by 2030:
50% generation of electricity from renewable energy sources, 40% reduction in greenhouse gas (“GHG”) emissions (from 1990 levels) and 23% decrease in energy consumption in buildings (from 2012 levels).
On January 21, 2016, the PSC issued an Order expanding the scope of the LSR proceeding to incorporate consideration and implementation of a CES that is designed to meet the Governor’s SEP 50 by 30 renewable mandate. The Order directed Staff to issue a Whitepaper for comment, developed in consultation with NYSERDA. The Whitepaper presented and addressed the issues associated with the design of a CES. On January 25, 2016, Staff issued its Clean Energy Standard Whitepaper, which outlines the policy objectives of a CES mandate and recommended elements for the CES.
o The Staff Whitepaper recommends: All electric retail load serving entities (“LSEs”) share the obligation of the CES
mandate in proportion to their annual retail electricity sales, including 'jurisdictional' LSEs, subject to the PSC's authority and all 'non-jurisdictional' LSEs (the New York Power Authority, or “NYPA”, and the Long Island Power Authority, or “LIPA”);
Establishment of CES tiers to support a growing quantity of new renewable generation, as well as continued contribution of existing renewables and zero emission resources;
Specification of eligibility requirements for resources within each tier (resource type, vintage, geographic, other);
For each tier, a firm set of requirements through 2020, with targets through 2030 to be developed in an implementation plan;
Tier 1 – New resources
Tier 2A (competitive) and 2B (non-competitive) – Existing resources

- 102 -
Tier 3 – Nuclear resources Demonstration of compliance through the use of tradable RECs for renewable
energy purchases and zero emission credits (“ZECs”) for qualified nuclear generation purchases, both as created and tracked within a newly designed New York Generation Attribute Tracking System (“NYGATS”);
Use of an alternative compliance payment (“ACP”) mechanism for each CES tier to cap REC and ZEC prices and provide for a flexible alternative means of compliance;
Competitive long-term procurements by NYSERDA and utilities, as needed, for specific tiers to support project financing, reduce compliance costs and provide both generators and customers with price stability;
A method for disposition of procured RECs and ZECs; Triennial program assessments by the PSC and Development of an Implementation Plan.
o On August 1, 2016, the Commission issued an Order Adopting a Clean Energy Standard. The Commission largely adopted the recommendations set forth in Staff’s January 25, 2016 Clean Energy Whitepaper but continued the Tier 2 maintenance program that existed under the RPS, rather than establishing the subcategories of competitive and non-competitive resources proposed by Staff.
o On September 1, 2016, a Clean Energy Standard Implementation Proposal as part of the proceeding’s implementation phase was issued in which Staff proposes that the Commission direct utilities to amend certain tariffs to allow for the recovery of the costs of Tier 1 compliant RECs, ZECs and ACPs incurred in compliance with the CES Order through volumetric supply charges collected from their retail commodity customers and to recover the costs of Tier 2 maintenance resources from all delivery customers on a volumetric basis. The proposal also addressed cost recovery that may be incurred by the utilities in their role as the financial backstop, as delineated in the August 1, 2016 CES Order.
o Central Hudson purchased its first compliance year REC and ZEC obligations in December 2016. The REC procurement covers the period of January 1, 2017 through December 31, 2017 and the ZEC procurement covers the period of April 1, 2017 through March 31, 2018. In 2017, Central Hudson’s purchase obligation for RECs is less than $0.1 million and approximately $5.9 million for ZECs. In 2018, Central Hudson’s purchase obligation is approximately $1.9 million for ZECs. The requirement to procure RECs and ZECs will continue through 2029.
No prediction can be made regarding the outcome of this matter or the potential impacts on Central Hudson at this time. Value of Distributed Energy Resources Proceeding – Value of “D” In December 2015, the Commission instituted a new proceeding, Case 15-E-0751, “In the Matter of the Value of Distributed Energy Resources” to propose valuation methods for distributed energy resources (“DER”). These compensation reforms are being considered as a reform to net metering. The proceeding is also expected to consider the issues related to interconnects, including grandfathering. In April 2016, the JUs filed their responses to a December 23, 2015 notice soliciting comments and proposals on the value of DER and options to establishing an interim methodology to successor net energy metering (“NEM”) tariffs. The JUs support an approach that will develop an alternative to NEM that properly values both DER and the distribution grid and provides for appropriate allocation of costs to all customers.

- 103 -
The JUs also joined comments filed by certain solar parties and collectively, filed comments as the Solar Progress Partnership on April 18, 2016. The JUs filed Reply Comments to the responses of other parties on June 10, 2016. A series of technical conferences and collaborative meetings were held beginning in May and continuing through June to provide parties an opportunity to formally present their proposals and establish a process and procedure for the approach to use in developing an interim methodology for valuing and compensating DER. The Administrative Law Judge adopted an informal and collaborative process with a series of additional technical conferences scheduled through October 2016. A Staff Straw Proposal was issued on October 27, 2016 for positions taken and the reasons therefore for the proposed interim methodology. Comments and Reply Comments were submitted by the Joint Utilities and many other interested parties. An order approving an interim methodology is expected during the first quarter of 2017. No prediction can be made regarding the outcome of this matter or the potential impacts on Central Hudson at this time. Petition of Central Hudson Gas & Electric Corporation for Commission Approval and Recovery of Deferred Incremental Costs Associated with the Commission’s Multiple Orders Requiring Risk Assessment and Remediation of New York Gas Facilities in Case 11-G-0565 (Cases 09-G-0589 and 12-M-0192)
On October 14, 2015, Central Hudson filed a deferral petition seeking approval and recovery of $2.2 million of incremental expense associated with new compliance and reporting requirements resulting from multiple PSC orders stemming from a natural gas incident in Horseheads, New York. On February 5, 2016, Central Hudson received a letter from the PSC’s Office of Accounting, Audits and Finance indicating agreement of the amount deferred at December 31, 2015. The method of recovery will be addressed in the Company’s next rate case filing. Petition of Central Hudson Gas & Electric Corporation for Commission Approval of Deferred Incremental Costs Associated with 2014 Thanksgiving “Snowbird” Storm (Case 15-E-0464)
On August 7, 2015, Central Hudson filed a petition with the PSC seeking approval for future recovery of $5.284 million of incremental electric storm restoration expense plus carrying charges incurred during the twelve months ended June 30, 2015, which is the third rate year established by the PSC in its approved Joint Proposal (Case 09-E-0588). These incremental costs represent the amount Central Hudson deferred on its books as of June 30, 2015, based on actual costs incurred, bills received and an estimate for bills outstanding. On January 22, 2016, the PSC approved deferral of incremental storm restoration costs together with carrying charges at the allowed pre-tax rate of return. The method of recovery will be addressed in the Company’s next rate case filing. Petition of Central Hudson Gas & Electric Corporation for Commission Approval for Recovery of Deferred Incremental Costs Associated with New Compliance Requirements Resulting from NERC’s Changes to the Bulk Electric System (Cases 09-E-0588 and 12-M-0192)
On September 1, 2015, Central Hudson filed a deferral petition seeking approval and recovery of $1.0 million of incremental expense associated with new compliance requirements resulting from the North American Reliability Corporation’s (“NERC’s”) change to the definition of the

- 104 -
Bulk Electric System, as approved by Federal Energy Regulation Committee (“FERC”). On February 5, 2016, Central Hudson received a letter from the PSC’s Office of Accounting, Audits and Finance indicating agreement of the amount deferred at December 31, 2015. The method of recovery will be addressed in the Company’s next rate case filing. Gas/Electric Energy Efficiency Programs On June 19, 2015, the PSC issued an Order authorizing Gas Energy Efficiency programs and their implementation for 2016 in Case 15-M-0252 and adopted budgets and targets for 2016. The electric 2016 targets and budgets had been included in the PSC’s REV Track 1 Order and are the same as the 2015 targets and budgets. Effective January 1, 2016, a new energy efficiency tracker was established for the recovery of costs (excluding labor). Comprehensive Management and Operations Audit On March 17, 2016, the PSC approved and issued a Request for Proposal (“RFP”) seeking a consultant to perform a comprehensive management and operation audit of Central Hudson. The audit will be performed in accordance with Public Service Law 66(19). At the July 14, 2016 PSC session, the Commission selected Overland Consulting (“Overland”) to perform the audit. Central Hudson presented a Management Audit Orientation to Overland on September 20, 2016 focusing on the seven topic areas identified in the audit scope. The audit is on track with the schedule proposed by Overland and we are currently in the discovery phase with a target to release a Final Report in June 2017. The last comprehensive audit of Central Hudson was conducted in 2010 and 2011 and Central Hudson completed implementation of the resulting recommendations in 2015. Low Income Proceeding On May 20, 2016, the PSC issued its Order Adopting Low Income Program Modifications and Directing Utility Filings, which has been ongoing since January 2015. In the Order, the PSC adopted a policy that an energy burden at or below 6% of household income shall be the target level for all 2.3 million low income households in New York and established a funding level such that the budget for each utility may not exceed 2% of total electric or gas revenues for sales to end-use customers. The PSC directed utilities to open their low income discount programs to all households that currently receive HEAP, regardless of fuel type or benefit type, requiring the utilities to establish new partnerships and ways to identify and enroll eligible customers. In addition, the Order authorized and directed Commission Staff to work with sister agencies to create an inter-agency task force to create greater low income program coordination. Statewide, the enhanced low income discount program will cost approximately $248 million, an increase of approximately 87% to existing programs. For Central Hudson, the low income budget program costs increased from $4.2 million to $12.1 million, an increase of nearly $8.0 million or 186%. The cost of the program will be borne by all classes of customers, with the specific mode of cost recovery determined in rate cases, where the total impacts of all revenue requirement changes can be considered. Customers enrolled in the utility discount program will also be enrolled in leveled or budget billing with an option to opt-out of budget billing. Arrears forgiveness may continue for utilities that see value in the program; however, funding for such programs is limited to no more than 10% of the program budget. Central Hudson filed its Low Income Implementation Plan with the Commission on September 16, 2016.
A number of parties have filed petitions for rehearing and reconsideration on a variety of topics set forth in the Order on the basis that the PSC erred in adopting very large increases to the

- 105 -
utilities’ residential low income programs without a hearing or sufficient record, erred in linking residential low-income increases to the low-income budgets to electric and gas commodity prices and failed to resolve cost allocation and cost recovery issues. The Commission issued a State Administrative Procedure Act (“SAPA”) Notice on October 5, 2016, seeking comments on Central Hudson’s proposed plan as well as the plans of all the other state utilities that made similar low income plan compliance filings. The 45-day public comment period for the SAPA Notice expired November 21, 2016. No prediction can be made regarding the outcome of this matter or the potential impacts on Central Hudson at this time. Central Hudson will likely address modifications to the low income program in its next rate filing. Petition for Accounting Change On April 28, 2016, the Company filed a Petition for Accounting Change related to the required treatment of unbilled revenues set forth in the Order Approving Rate Plan (“Order”), issued and effective June 17, 2015, in Cases 14-E-0318 and 14-G-0319, to provide better matching of revenues and expenses. This Order required Central Hudson to defer and recognize residual unbilled revenue as a regulatory liability (as described in the approved Joint Proposal under Section V, subpart A, 4(h)). Specifically, Central Hudson sought approval to record and recognize residual unbilled revenue as revenue on the income statement each month beginning with the month of July 2016. On July 20, 2016, the PSC issued the “Order Approving Accounting Change with Modification” allowing Central Hudson to realize unbilled revenue as revenue on the income statement citing conformity with GAAP and the accounting treatment at other utilities in NYS. However, the Order also requires a portion of the unbilled revenues remain as a regulatory liability for the future benefit of customers. Approximately $14.1 million was recognized as unbilled revenues which occurred concurrent with the transition to monthly billing and provided an offset for the $9.0 million earnings impact that would have resulted from the RDM targets being set without consideration for the transition to monthly billing. The net impact on earnings of approximately $5.1 million was required to be deferred to ensure there was no net earnings impact that resulted from the transition to monthly billing. Retail Access On December 16, 2016 the PSC reaffirmed its July 15, 2016 moratorium on energy service company (“ESCO”) enrollment of customers who are participants in utility low-income programs by issuing an order adopting a permanent prohibition on service to low-income customers by ESCOs. The order directs utilities to develop a number of communications for both ESCOs and their low-income customers informing them of the probation imposed by the PSC order. In addition, within 60 days of the order utilities are required to place a block on all low-income accounts preventing them from being enrolled with an ESCO. The PSC has also established evidentiary and collaborative tracks for consideration of whether ESCOs should be completely prohibited from serving their current products to mass-market customers and whether the regulatory regime, rules and Uniform Business Practices applicable to ESCOs need to be modified to implement such a prohibition, to provide additional guidance on acceptable rates and practices by ESCOs or to create enforcement mechanism to deter customer abuses and overcharging. The PSC is also interested in whether new ESCO

- 106 -
rules and products can be developed that would provide sufficient real value to mass-market customers such that new products could be provided to them by ESCOs in the future in a manner that could ensure just and reasonable rates. A Procedural Conference to provide further guidance is scheduled for January 26, 2017. Initial testimony and exhibits must be filed on or before April 7, 2017. Pipeline and Hazardous Materials Safety Administration (“PHMSA”) In the rulemaking Case PHMSA-2011-0023, the PHMSA, which operates under the auspices of the United States Department of Transportation (“DOT”), will be revisiting the requirements in the Pipeline Safety Regulations addressing integrity management principles for Gas Transmission pipelines. In particular, PHMSA will be reviewing the definition of an HCA (including the concept of a potential impact radius), the repair criteria for both High Consequence Areas (“HCA”) and non-HCA areas, requiring the use of automatic and remote controlled shut off valves, valve spacing, and whether applying the integrity management program requirements to additional areas would mitigate the need for class location requirements. Central Hudson expects PHMSA to issue its final rule during 2017. PHMSA has not established a timeline for implementation and compliance by affected utilities. Central Hudson expects that the rule will impact up to 160 mile of its transmission pipeline. Because Central Hudson’s transmission lines are intrastate, New York State Public Service Commission proceedings will be required before Central Hudson can implement the rule. Central Hudson currently estimates the potential financial expenditure for compliance to be between $100 and $200 million and expects these costs will be fully recoverable. No prediction can be made as to the outcome of this matter. Other Regulatory Proceedings There were no material updates to the Gas Plastic Fusion Practices Proceeding since the 2015 Annual Financial Report.
Risk Factors
The following is a description of what we consider the key challenges and risks confronting our business. Storms and other events beyond the Companies’ control: In order to conduct its business, Central Hudson must have access to natural gas and electric supplies and be able to utilize its electric and natural gas infrastructure. Any one or more of the following could impact Central Hudson’s ability to access supplies and/or utilize critical facilities: (1) storms, natural disasters, wars, terrorist acts, cyber incidents, failure of critical equipment and other catastrophic events occurring both within and outside the service territory (2) third-party facility owner or supplier financial distress, (3) unfavorable governmental actions or judicial orders, and (4) bulk power system and gas transmission pipeline system capacity constraints. Potential Impacts: Central Hudson could experience service disruptions leading to lower earnings and/or reduced cash flows if the situation is not resolved in a timely manner or the financial impacts of restoration are not alleviated through insurance policies and regulated rate recovery.

- 107 -
Recovery of costs through rates: Central Hudson’s retail delivery rates generally may not be changed during their respective terms, absent an increase that meets the PSC’s requirements for deferral accounting. Central Hudson’s current rate plan provides for full recovery of certain expenses through deferral accounting or rate adjustment mechanisms, including commodity costs, pension and OPEB expense, NYS Energy Efficiency Programs and all environmental SIR costs. Examples of costs that may not be fully recovered include: (1) higher expenses than reflected in current rates, (2) penalties for failing to achieve performance metrics or violation of PSC Orders, (3) higher capital project costs, and (4) a determination by the PSC that the cost to place a project in service is above a level which is deemed prudent. Potential Impacts: Central Hudson could have lower earnings and/or reduced cash flows if there were changes to the deferral accounting and adjustment mechanisms in the current rate plan and if cost management and/or regulatory relief are not sufficient to alleviate the higher costs for those costs not subject to deferral accounting. Asbestos litigation and Site Investigation and Remediation: Litigation has been commenced by third parties against Central Hudson arising from the use of asbestos at certain of its previously owned electric generating stations. Central Hudson is also involved in a number of environmental matters arising from contamination at former MGP and non-MGP sites. Potential Impacts: To the extent not covered by insurance or recovered through rates, remediation costs, court decisions and settlements could reduce earnings and cash flows.
FORWARD-LOOKING STATEMENTS Statements included in this Annual Financial Report, which are not historical in nature, are intended to be “forward-looking statements.” Forward-looking statements may be identified by words such as “anticipates,” “intends,” “estimates,” “believes,” “projects,” “expects,” “plans,” “assumes,” “seeks,” and other similar words and expressions. CH Energy Group is subject to risks and uncertainties that could cause actual results to differ materially from those indicated in the forward-looking statements. The risks and uncertainties include, but are not limited to: deviations from normal seasonal temperatures and storm activity, changes in energy and commodity prices, availability of energy supplies, changes in interest rates, poor operating performance, legislative and regulatory developments, the outcome of litigations, and the resolution of current and future environmental issues. Additional information concerning risks and uncertainties may be found in the “Management’s Discussion and Analysis of Financial Condition and Results of Operations” section of CH Energy Group’s Quarterly and Annual Financial Reports. These reports are available in the Financial Information section of the website of CH Energy Group, at www.CHEnergyGroup.com. CH Energy Group undertakes no obligation to update publicly any forward-looking statements, whether as a result of new information, future events, or otherwise.
- 108 -
ANNUAL FINANCIAL REPORT SUPPLEMENT
Holding Company Regulation CH Energy Group is a “holding company” under Public Utility Holding Company Act of 2005 (“PUHCA 2005”) because of its ownership interests in Central Hudson and CHEC. CH Energy Group, however, is exempt from regulation as a holding company under PUHCA 2005, because it derives substantially all of its public utility company revenues from business conducted within a single state, the State of New York. At the present time, CH Energy Group cannot predict whether and when its circumstances may change such that it no longer qualifies for exemption from PUHCA 2005.
Central Hudson
Central Hudson (the “Company”) is a New York State natural gas and electric corporation formed in 1926. Central Hudson purchases, sells at wholesale and retail, and distributes electricity and natural gas at retail in portions of New York State. Central Hudson also generates a small portion of its electricity requirements.
Central Hudson serves a territory comprising approximately 2,600 square miles in the Hudson Valley. Electric service is available throughout the territory, and natural gas service is provided in and about the cities of Poughkeepsie, Beacon, Newburgh, and Kingston, New York, and in certain outlying and intervening territories. The number of Central Hudson employees at December 31, 2016 was 992.
Central Hudson’s territory reflects a diversified economy, including manufacturing industries, governmental agencies, public and private institutions, wholesale and retail trade operations, research firms, farms and resorts. Regulation Central Hudson is subject to regulation as follows:
PSC – services rendered (including the rates charged), major transmission facility siting, accounting treatment of certain items, and issuance of securities. For certain restrictions imposed by the Settlement Agreement, see Note 3 – “Regulatory Matters” of the Company’s 2016 Annual Report.
FERC (under the Federal Power Act) – accounting and the acquisition and disposition of property.
North American Electric Reliability Corporation – ownership, operation and use of a bulk power system.
DEC – ownership, operation and use of hydroelectric facilities Central Hudson is not subject to the Natural Gas Act and its hydroelectric facilities are not required to be licensed under the Federal Power Act.

- 109 -
Rates PSC – Costs of service, both for electric and gas delivery service and supply costs, are recovered from customers through PSC approved tariffs, subject to a standard of prudency. For further information, see Note 1 – “Summary of Significant Accounting Policies” under the caption “Rates, Revenues and Cost Adjustment Clauses” and Note 3 – “Regulatory Matters” under the caption “2013 Joint Petition/2015 Rate Order” of the Company’s 2015 Annual Report.
Customer classes – Residential and non-residential.
Retail electricity services – Various service classifications covering delivery service and full service (which includes electricity supply).
Retail natural gas services – Various service classifications covering transport, retail access service, and full service (which includes natural gas supply).
RDMs – Central Hudson’s rates have included RDMs which are intended to minimize the earnings impact resulting from reduced energy consumption as energy efficiency programs are implemented by breaking the link between energy sales and utility revenues and profits. Central Hudson’s RDMs allow the Company to recognize electric delivery revenues and natural gas sales per customer at the levels approved in rates for most of Central Hudson’s electric and natural gas customer classes.
Commodity costs – Costs of electric and natural gas commodity purchases are recovered from customers, without earning a profit on these costs. Rates are reset monthly based on Central Hudson’s actual costs to purchase the electricity and natural gas needed to serve its full service customers.
FERC – Transmission rates and rates for electricity sold for resale which involve interstate commerce. During 2016, the average price of electricity for full service customers was 15.15 cents per kWh as compared to an average of 16.36 cents per kWh in 2015. The average delivery price in 2016 was 6.59 cents per kWh compared with 6.36 cents per kWh in 2015. The increase in delivery price was primarily due to an increase in base delivery revenue pursuant to the 2015 Rate Order, increased revenue due to the transition to monthly billing, and a reduction in the pass back of revenue realized from transmission congestion rents.
During 2016, the average price of natural gas for full-service customers was $11.54 per Mcf as compared to an average of $12.64 per Mcf in 2015. The average delivery price for natural gas for retail and full service in 2016 was $6.56 per Mcf compared with $5.98 per Mcf in 2015. The increase in delivery price was primarily due to a decrease in the refund of base delivery revenue in excess of the regulatory target and an increase in weather normalization adjustment collections resulting from warmer than normal weather conditions. Cost Adjustment Clauses and RDMs: For information regarding Central Hudson’s electric and natural gas cost adjustment clauses and RDMs, see Note 1 – “Summary of Significant Accounting Policies” under the caption “Rates, Revenues and Cost Adjustment Clauses.”

- 110 -
Electric Central Hudson owns hydroelectric and gas turbine generating facilities as described below.
Type of Electric Generating Plant Year Placed in Service/Refurbished MW(1)
Net Capability
Hydroelectric (3 stations) 1920-1986 22.4
Gas turbine (2 stations) 1969-1970 42.5
Total 64.9 (1) Reflects the name plate rating of Central Hudson’s electric generating plants and therefore does not include firm purchases or sales.
Central Hudson owns substations having an aggregate transformer capacity of 5.9 million kilovolt amperes. Central Hudson’s electric transmission system consists of 600 pole miles of line. The electric distribution system consists of approximately 7,200 pole miles of overhead lines and 1,600 trench miles of underground lines, as well as customer service lines and meters.
Electric Load and Capacity Central Hudson’s maximum one-hour demand for electricity within its own territory for the year ended December 31, 2016, occurred on August 13, 2016, and amounted to 1088 MW. Central Hudson’s highest peak electric demand reached 1,295 MW on August 2, 2006. Central Hudson’s current maximum one-hour demand for electricity within its own territory for the 2016-2017 winter capability occurred on December 15, 2016, and amounted to 862 MW.
Central Hudson owns minimal generating capacity and relies on purchased capacity and energy from third-party providers to meet the demands of its full service customers. For more information, see Note 12 – “Commitments and Contingencies.”
Natural Gas Central Hudson’s natural gas system consists of 165 miles of transmission pipelines and 1,275 miles of distribution pipelines, as well as customer service lines and meters. For the year ended December 31, 2016, the total amount of natural gas purchased by Central Hudson from all sources was 9,999,839 Mcf. The peak daily demand for natural gas of Central Hudson’s customers for the year ended December 31, 2016, occurred on February 13, 2016, and amounted to 136,709 Mcf, which is also Central Hudson’s all-time highest winter period daily peak. Peak demand for the 2016-2017 heating season occurred on December 19, 2016 and was 111,409 Mcf. Central Hudson’s firm peak day natural gas capability in 2016-2017 heating season was 134,719 Mcf.

- 111 -
Purchased Power and Generation Costs
For the year ended December 31, 2016, the sources and related costs of purchased electricity and electric generation for Central Hudson were as follows (In Thousands):
Sources of Energy Aggregate Percentage of Energy
Requirements Costs in 2016
Purchased Electricity 98.5 % $ 156,269 Hydroelectric and Other 1.5 70 Deferred Electricity Cost 1,090 Total 100.0 % $ 157,429
Other Central Hudson Matters
Labor Relations: Central Hudson has an agreement with Local 320 of the International Brotherhood of Electrical Workers for its 588 unionized employees, representing construction and maintenance employees, customer service representatives, service workers, and clerical employees (excluding persons in managerial, professional, or supervisory positions). This agreement remains effective through April 30, 2017. Property Additions: During the three-year period ended December 31, 2016, Central Hudson made gross property additions of $418.6 million and property retirements and adjustments of $63.1 million, resulting in a net increase (including construction work in progress) in gross utility plant of $355.5 million, or 21%.
Environmental Quality Regulation
Central Hudson is subject to regulation by federal, state, and local authorities with respect to the environmental effects of their operations. Environmental matters may expose Central Hudson to potential liability, which, in certain instances, may be imposed without regard to fault or may be premised on historical activities that were lawful at the time they occurred.
Central Hudson monitors its activities in order to determine their impact on the environment and to comply with applicable environmental laws and regulations.
The principal environmental areas relevant to Central Hudson (air, water and industrial and hazardous wastes) are described below. Unless otherwise noted, all required permits and certifications have been obtained by the applicable company. Management believes that Central Hudson was in material compliance with these permits and certifications during 2016. For further discussions related to environmental matters see Note 12 – “Commitments and Contingencies”.
Air Quality The Clean Air Act Amendments of 1990 address attainment and maintenance of national air quality standards and impact Central Hudson electric generating facilities in South Cairo and Coxsackie, NY.

- 112 -
Water Quality The Clean Water Act established the basic framework for federal and state regulation of water pollution control and requires facilities that discharge waste or storm water into the waters of the United States to obtain permits. Central Hudson has permits regulating pollutant discharges for relevant locations.
Industrial & Hazardous Substances and Wastes Central Hudson is subject to federal, state and local laws and regulations relating to the use, handling, storage, treatment, transportation, and disposal of industrial, hazardous, and toxic wastes. See Note 12 − “Commitments and Contingencies” under the caption “Environmental Matters” for additional discussion regarding, among other things, Central Hudson’s former MGP facilities, Eltings Corners and Little Britain Road.
Environmental Expenditures 2016 actual and 2017 estimated expenditures attributable in whole or in substantial part to environmental considerations are detailed in the table below (In Millions):
2016 2017
Central Hudson $ 18.8 $ 16.2
The decrease in 2017 estimated expenditures relates primarily to Site Investigation and Remediation activities at the Kingston site. For further discussion of these activities, see Note 12 – “Commitments and Contingencies” under caption “Site Investigation and Remediation Program”. Central Hudson is also subject to regulation with respect to other environmental matters, such as noise levels, protection of vegetation and wildlife, and limitations on land use, and is in compliance with regulations in these areas. Regarding environmental matters, except as described in Note 12 - “Commitments and Contingencies” under the caption “Environmental Matters,” neither CH Energy Group nor Central Hudson are involved as defendants in any material litigation, administrative proceeding, or investigation and, to the best of their knowledge, no such matters are threatened against any of them.