for specialists and primary care clinicians treating …€¦ · care continuum acoustic...
TRANSCRIPT

1
MODALITIES . CONCEPTS . MANAGEMENT
FOR SPECIALISTS AND PRIMARY CARE CLINICIANS TREATING HEART FAILURE
®
review paper
The Utility of Heart Sounds and Systolic Intervals Across the Care ContinuumW. Frank Peacock, MD; Alex Harrison, MD; Alan S. Maisel, MD
original papers
Hemodynamic Correlates of the Third Heart Sound and Systolic Time IntervalsSanjiv J. Shah, MD; Andrew D. Michaels, MD, MAS
Systolic Dysfunction: Correlation of Acoustic Cardiography With Doppler EchocardiographyMichel Zuber, MD; Peter Kipfer, MD; Christine Attenhofer Jost, MD
Acoustic Cardiographic Parameters and Their Relationship to Invasive Hemodynamic Measurements in Patients With Left Ventricular Systolic DysfunctionMarkus Roos, MD; Stefan Toggweiler, MD; Michel Zuber, MD; Peiman Jamshidi, MD; Paul Erne, MD
Optimization of Cardiac Resynchronization Devices Using Acoustic Cardiography: A Comparison to EchocardiographyAyesha Hasan, MD; William T. Abraham, MD; Lori Quinn-Tate, RN, MN; Lei Brown, RDCS, RVT Ali Amkieh, MD
Clinical and Economic Benefits of Using AUDICOR S3 Detection for Diagnosis and Treatment of Acute Decompensated Heart FailureW. Frank Peacock, MD; Alex Harrison, MD; Donald Moffa, MD
case reports
Optimization of Atrioventricular and Interventricular Delay With Acoustic Cardiography in Biventricular PacingStefan Toggweiler, MD; Michel Zuber, MD; Paul Erne, MD
Acoustic Cardiography in the Differential Diagnosis of DyspneaW. Frank Peacock, MD
july . august 2006 volume 12 . issue 4 . supplement 1
selected content also available from www.lejacq.com
Acoustic Cardiography and Heart Failure: Advancing Diagnosis and Treatment
Supplement to Congestive Heart Failure
publishing . symposia . patient education . trials review series
®

Congestive Heart Failure® (ISSN 1527-5299) is published bimonthly (Feb., April, June, Aug., Oct., Dec.) by Le Jacq, Three Parklands Drive, Darien, CT 06820-3652. Subscription rates per year: INDIVIDUAL: US $90. All other countries $105. INSTITUTIONAL: US $105. All other countries $120. Single copies: US $14. All other countries $16. Periodicals postage paid at Darien, CT 06820 and additional mailing offices. Publication of an advertisement or other product mention in Congestive Heart Failure® should not be construed as an endorsement of the product or the manufacturer’s claims by the Publisher. Postmaster: Send change of address to Le Jacq, Three Parklands Drive, Darien, CT 06820-3652.The facts, opinions, ideas, and information presented in the Journal belong to the authors of such material and not to the Journal, its Publisher, or the Editorial Board. No responsibility is assumed by the Publisher for any damage and/or injury of any nature occurring from any use, misuse, or omission of any of the information contained in the Journal. Advertising displayed in the Journal does not constitute endorsement, verification, or guarantee of the item or services advertised and the Publisher does not assume responsibility for any information contained in such advertising. Copyright ©2006 by Le Jacq, all rights reserved. No part of this publication may be reproduced or transmitted in any form or by any means, electronic, or mechanical, including photocopy, recording, or any information storage and retrieval system, without permission in writing from the publishers.
Congestive Heart Failure® is indexed in Index Medicus/MEDLINE
Editorial DirectorElizabeth FerrettiManaging EditorSarah D. StaatsProduction DirectorDominic Francese
Art & Web Services DirectorGary SpencerGraphics DepartmentRyan Boyle Scott Bouchard
CopyeditorsJanet Bedol Elizabeth HolcombProofreaderPatrice Hibbard
PresidentT. Anthony Howell Executive Vice PresidentGene P. Snyder
General ManagerSarah HowellAccounting ManagerEdward J. Fitzgerald
Meeting PlannerRenée DeschaineFounderLouis F. Le Jacq
EDITORIAL PUBLISHING
Le Jacq • Three Parklands Drive • Darien, CT 06820 USA • Tel (203) 656-1711 • Fax (203) 656-1717 • www.lejacq.com
Medical Sales Representative • Lisa Piedimonte • (914) 674-5929 • [email protected]
publishing . symposia . patient education . trials review series
®

contents july . august 2006 . supplement 1 1
FOR SPECIALISTS AND PRIMARY CARE CLINICIANS TREATING HEART FAILURE
®
Electronic versions of articles (in Adobe® PDF format) can be downloaded from www.lejacq.com using the search page. The article’s corresponding ID number (indicated by the symbol) may be used to locate the article.
review paper
The Utility of Heart Sounds and Systolic Intervals Across 2 the Care ContinuumW. Frank Peacock, MD; Alex Harrison, MD; Alan S. Maisel, MD
original papers
Hemodynamic Correlates of the Third Heart Sound and 8 Systolic Time IntervalsSanjiv J. Shah, MD; Andrew D. Michaels, MD, MAS
Systolic Dysfunction: Correlation of Acoustic Cardiography 14 With Doppler EchocardiographyMichel Zuber, MD; Peter Kipfer, MD; Christine Attenhofer Jost, MD
Acoustic Cardiographic Parameters and Their Relationship to 19 Invasive Hemodynamic Measurements in Patients With Left Ventricular Systolic DysfunctionMarkus Roos, MD; Stefan Toggweiler, MD; Michel Zuber, MD; Peiman Jamshidi, MD Paul Erne, MD
Optimization of Cardiac Resynchronization Devices Using 25 Acoustic Cardiography: A Comparison to EchocardiographyAyesha Hasan, MD; William T. Abraham, MD; Lori Quinn-Tate, RN, MN Lei Brown, RDCS, RVT; Ali Amkieh, MD
Clinical and Economic Benefits of Using AUDICOR S3 32 Detection for Diagnosis and Treatment of Acute Decompensated Heart FailureW. Frank Peacock, MD; Alex Harrison, MD; Donald Moffa, MD
case reports
Optimization of Atrioventricular and Interventricular Delay With Acoustic Cardiography in Biventricular Pacing 37Stefan Toggweiler, MD; Michel Zuber, MD; Paul Erne, MD
Acoustic Cardiography in the Differential Diagnosis of Dyspnea 41W. Frank Peacock, MD
july . august 2006 volume 12 . issue 4 . supplement 1
Sponsored by Winthrop-University Hospital and supported by an unrestricted educational grant from Inovise Medical, Inc.
Acoustic Cardiography and Heart Failure: Advancing Diagnosis and Treatment
publishing . symposia . patient education . trials review series
®

acoustic cardiography in HF diagnosis and management july . august 2006 . supplement 12
www.lejacq.com ID:5766
W. Frank Peacock, MD;1 Alex Harrison, MD;2 Alan S. Maisel, MD3
From the Department of Emergency Medicine, Cleveland Clinic, Cleveland, OH;1 the Division of Cardiology, Department of Medicine, University of California, Irvine Medical Center, Orange, CA;2 and the Department of Medicine, Veterans Affairs San Diego Healthcare System and University of California, San Diego, San Diego, CA3
Address for correspondence: Alex Harrison, MD, Division of Cardiology, Department of Medicine, University of California, Irvine, 101 The City Drive, Building 53, Route 81, Room 100, Orange, CA 92868-4080E-mail: [email protected]
Heart failure (HF) currently affects over 5 million Americans, with
roughly 500,000 new cases each year. It accounts for 12–15 million office visits and 6.5 million hospital days annually. Despite new and improved treatments, HF results in 300,000 deaths each year as a primary or contributory cause. The rapid growth of HF has made it a disease of epidemic proportions that has a tremendous clinical and financial impact on the US health care system. With 5-year mortality rates approach-ing 50%, it is the most common cause of hospitalization in patients older than 65 years and is the single most expen-sive diagnosis in the United States. In 2001, there were almost one million hospital discharges for decompensated HF, at a cost of more than $20 billion. The average hospital loses more than $1000 per HF admission.1
HF care in 2006 has shown dra-matic progress over the past several years, and many more options are currently available than was the case as recently as the early 1990s. With the discovery and clinical application of new biomarkers, such as B-type natriuretic peptide (BNP) and the rapidly expanding field of implant-able devices, HF care has become an emergent subspecialty within the field of cardiology. However, despite the progress made within the HF arena, there remains significant unmet clini-cal need. Because HF occurs most frequently in the elderly, a population with many simultaneous comorbidi-ties, it can be a challenging diagnosis in the emergency department (ED). Moreover, since its most common presentation is dyspnea, a symptom that is common to many diseases,
misdiagnosis is routine. Even in the BNP era, accurate diagnosis of acute decompensated HF (ADHF) at ED presentation remains difficult. BNP has aided in “ruling out” ADHF with its high negative predictive value, but due to the limited positive predictive value and specificity of abnormal BNP values, problems with accurately “rul-ing in” ADHF persist. Results from a large prospective blinded study have shown that 18.5% of ED HF diagnoses are inaccurate.2
Medical therapies, such as angio-tensin-converting enzyme inhibitors, β blockers, and spironolactone, have led to marked improvements in both symptom control and overall survival in patients with HF.3–5 The addition of devices such as implantable cardio-verter-defibrillators and pacemakers have also proven beneficial.6 Some HF
R E V I E W P A P E R
The Utility of Heart Sounds and Systolic Intervals Across the Care Continuum
Acoustic cardiography is an exciting, new, easy-to-use, modernized technology that incorporates already proven techniques of phonocardiography. Application of acoustic cardiography to clinical practice can improve diagnosis and management of heart failure patients. Its clinical use should help address some of the need for robust, inexpensive, and widely accessible technology for proactive heart failure diagnosis and management. Acoustic cardiographically recorded measurements have been correlated with both cardiac catheterization and echocardiographically determined hemodynamic parameters. Heart sounds captured by acoustic cardiograms have proven to assist clinicians in assessing dyspneic patients in the emergency department by utilizing the strong specificity of an S3 for detecting acute decompensated heart failure. Acoustic cardiography offers a cost-efficient, easy-to-use method to optimize the devices used in cardiac resyncronization therapy. The rapidly and easily obtainable information gathered by acoustic cardiography should foster its more widespread use in diagnosis and treatment of heart failure, including
cardiac resyncronization therapy device optimization. (CHF. 2006;12(4 suppl 1):2–7) ©2006 Le Jacq
publishing . symposia . patient education . trials review series
®

acoustic cardiography in HF diagnosis and management july . august 2006 . supplement 1 3
patients benefit from simultaneous pacing of both ventricles (biventricu-lar, or BiV, pacing) or of one ventricle in patients with bundle branch block. This approach is referred to as car-diac resynchronization therapy (CRT) and is recommended in advanced HF (usually New York Heart Association class III or IV), severe systolic dysfunc-tion (e.g., ejection fraction ≤35%), and intraventricular conduction delay (e.g., QRS >120 milliseconds).7–11 The rationale behind CRT is that it improves pump performance and reverses ventricular remodeling. Importantly, when BiV pacing is used, the delay between atrial and ventricu-lar stimulation (the AV delay) should be adjusted to achieve the maximum attainable cardiac output. Studies have suggested that the optimal AV delay can be defined by Doppler echo-cardiography12; however, this is a lim-ited resource in many environments.
Unfortunately, expensive and highly programmable CRT devices have been shown in real-world practice to have a 30% nonresponder rate.13 This may be largely attributable to the fact that only 10% of CRT devices are optimized and is in stark contrast to the random-ized controlled clinical trials that led to the approval of CRT devices.7–11 There continues to be a tremendous need for robust, inexpensive, widely accessible, and easy-to-use technology that is highly specific for proactive HF diagnosis and management.
Heart sounds and systolic time intervals recorded in an acoustic car-diogram may improve the areas of weakness in the current HF era and have proven valuable in assisting clini-cal diagnostic and management chal-lenges encountered during HF care.
Heart Sounds and Systolic Time IntervalsAuscultation of heart sounds has been a diagnostic tool employed by clini-cians to detect abnormalities asso-ciated with cardiac dysfunction for centuries. Potain14 first described abnormal diastolic cardiac sounds in the literature in 1880. With relatively
normal heart rates, S3, also known as a ventricular gallop, occurs 0.12–0.16 sec after the S2 in early diastole.15 The most likely explanation for the extra sound producing the S3 is that vigorous and excessively rapid fill-ing of blood into a stiff ventricle is suddenly halted, causing vibrations audible as the S3.
16 The S4, also known as an atrial gallop, occurs after P-wave onset and before the S1 in the cardiac cycle. The S4 occurs as blood enters a relatively noncompliant ventricle late in diastole because of atrial contrac-tion and causes vibrations of the left ventricular (LV) muscle, mitral valve apparatus, and LV blood mass.17
The auscultated S3 and S4 have long been used as clinical signs of heart disease with both diagnostic and prognostic importance.18–23 However, the value of these physical findings has been diminished by reports of poor accuracy and a large degree of interob-server variability.24,25 In addition, it has been well documented that physi-cian physical examination skills have deteriorated and are not emphasized during training as much as they once were.26 The phonocardiogram has
traditionally been the gold standard tool for the detection of extra heart sounds because it produces objective data that is reproducible and quanti-fiable. Phonocardiography has been used to understand the mechanisms and associated clinical characteristics of diastolic sounds,27–30 and results of phonocardiography have been used to determine the accuracy of physician auscultation.25 In addition to provid-ing objective measures of heart sounds, phonocardiography used in conjunc-tion with a carotid pulse tracing allows for the collection of valuable data about systolic time intervals.31,32 While phonocardiography provides reliable and objective information, obtaining the data has proven difficult, timely, and cumbersome and requires a tech-nician with specialized skill to operate the device. Consequently, its use has been supplanted by echocardiography.
With the invention of new technol-ogy, the phonocardiogram has recently been reincarnated as a newer modern version of the older proven technique. This newly renovated phonocardio-gram is called an acoustic cardiogram. By replacing the standard V3 and V4
Figure 1. Placement of the AUDICOR sensors (Inovise Medical, Inc., Portland, OR)
publishing . symposia . patient education . trials review series
®

acoustic cardiography in HF diagnosis and management july . august 2006 . supplement 14
leads with newly designed sensors, both sound and electrical information can be gathered. To process the acous-tic cardiogram data, Inovise Medical, Inc. (Portland, OR) has developed the AUDICOR technology. This is a sys-tem that records, stores, displays, and algorithmically interprets the simul-taneous digital electrocardiographic
(ECG) and acoustical data (Figure 1). The strengths of this system are that it does not require a pulse sensor, works in noisy environments (e.g., in an ED where accurate auscultation may be difficult), and has relatively forgiving sensor placement. Computer algorithms allow for rapid, reproducible, and objec-tive data to be generated and analyzed
for prompt clinical use. Acoustic car-diography can provide objective mea-surements of heart sounds as well as valuable information about systolic time intervals that have proven useful in a variety of clinical settings (Figure 2, Table). A detailed investigation and discussion of the hemodynamic corre-lates of the S3 and systolic time interval follows in this supplement.33
Acoustic Cardiography and Its Correlation to Gold StandardsAcoustic cardiography is a validated, rapid, and noninvasive means to assess cardiac hemodynamics. It has been compared with cardiac catheteriza-tion, an invasive procedure that rep-resents the gold standard of cardiac hemodynamics. Acoustic cardiography has also been compared with echo-cardiography, a similarly noninvasive method to assess cardiac hemody-namics. However, both cardiac cath-eterization and echocardiography are much more costly, time-consuming, and highly limited resources.
Recent studies demonstrated the relationship between various measure-ments of cardiac hemodynamics. In one report, 100 subjects each under-went acoustic cardiography, echocar-diography, BNP measurement, and left heart catheterization within a 4-hour period. These studies demonstrated that there was a strong association between the presence of an S3 and a number of parameters, including the incidence of HF diagnosis, depressed LV ejection fraction, elevated LV end-diastolic pressure, abnormal ventricular
Table. Definitions of Diastolic Time IntervalsABBREVIATION CARDIAC CYCLE TERMINOLOGY DEFINITION
EMAT Electromechanical activation time Time from the Q-wave onset to mitral valve closure (S1)LVST Left ventricular systolic time Time from mitral valve closure (S1) to aortic valve closure (S2); includes the IVCTPEP Pre-ejection period Time from Q-wave onset to aortic valve opening; includes the IVCTLVET Left ventricular ejection time Time when the left ventricle is actively ejecting blood into the aorta (time from aortic
valve opening to aortic valve closure)IVRT Isovolumic relaxation time Time when the left ventricle relaxes during early diastole before any filling occurs
(time after the aortic valve closes and before the mitral valve opens)IVCT Isovolumic contraction time Time during contraction of the ventricle after the mitral valve closes and before the
aortic valve opens
Figure 2. Heart sounds and systolic time interval data provided by the AUDICOR device (Inovise Medical, Inc., Portland, OR). (Pressure waveforms are pro-vided here for convenience of reference and are not part of the AUDICOR data.) ECG=electrocardiogram; Ao=aorta; LA=left atrium; LV=left ventricle; PEP=pre-ejection period; LVET=left ventricular ejection time; IVCT=isovolumic contraction time; IVRT=isovolumic relaxation time; EMAT=electromechanical activation time; LVST=left ventricular systolic time
publishing . symposia . patient education . trials review series
®

acoustic cardiography in HF diagnosis and management july . august 2006 . supplement 1 5
relaxation, and tissue Doppler imaging assessments indicative of ventricular dysfunction (e.g., increased decelera-tion rate of early mitral valve inflow patterns).34,35 While BNP values per-formed well in predicting the absence of HF, they fared poorly in predicting depressed LV ejection fraction and elevated LV end-diastolic pressure. Therefore, acoustic cardiography can help “rule in” certain diagnoses with its high specificity for ventricular dys-function and abnormal cardiac hemo-dynamics,35 thus supplementing the clinical impression in precisely the range where BNP performs poorly. In addition, systolic time interval data have proven to correlate well with hemodynamic measures: the LV sys-tolic time correlates well with the LV ejection fraction, and the electro-mechanical activation time correlates with measures of cardiac contractil-ity (dP/dt).35,36 This easily and rapidly obtainable information has been prov-en to assist clinicians in assessing dys-pneic patients in the ED and in other areas of HF management and could be widely implemented to help proactive HF diagnosis and management.
Clinical Applications of Acoustic CardiographyEmergency Department. Although HF may be readily diagnosed in its advanced stages, it can be difficult to diagnose clinically in its earlier stages.37 HF has many nonspecific signs and symptoms that can present diagnostic and management ambiguities. Also, the ED can be a challenging environ-ment for detecting an S3 by routine auscultation. Even in the BNP era, an accurate diagnosis of ADHF within the ED remains poor, with 18.5% of cases of ADHF being undiagnosed.2 Recent studies evaluating the clinical utility of acoustic cardiography in the ED setting have found that the detec-tion of S3 is significant and aids physi-cians in accurate diagnosis. While not sensitive enough to be used as a screening tool, the detection of an S3 is highly specific for abnormal cardiac function.22 Studies have demonstrated
the additive information garnered by S3 heart sounds detected by acoustic cardiograms and the combined util-ity it serves with BNP values when evaluating dyspneic patients in the ED.38,39 These studies illustrate that an S3 detected by acoustic cardiography is highly specific for ADHF and is ide-ally suited for use in combination with BNP to improve diagnostic accuracy in ED patients with dyspnea of unclear etiology (Figure 3).
The implementation of BNP testing has improved the diagnostic accuracy of detecting ADHF;2 however, the non-diagnostic values of BNP between 100–500 pg/mL, the range referred to as the “gray zone,” are found in an important portion of dyspneic patients. Acoustic cardiography has been shown to help resolve a significant amount of these indeterminate BNP values and can substantially improve the diagnostic evaluation of patients with gray-zone BNP values. In doing so, acoustic car-diography can increase the confidence with which physicians initiate treat-ment for clinically significant ADHF, as recently corroborated by M. Zuber, MD (unpublished data, May 2006). Moreover, the presence of an S3 in combination with a BNP value >500 pg/mL virtually assures the presence of
ADHF as depicted by the infinite posi-tive likelihood ratio in Figure 3.39
The clinical advantages of an early accurate diagnosis of ADHF are apparent. Interestingly, there appears to be a significant fiscal penalty for an inaccurate initial ED diagnosis miss-ing HF when it is present. According to a study appearing later in this supplement, patients who were mis-diagnosed as non-ADHF (most often chronic obstructive pulmonary disease and pneumonia) at ED presentation accrued hospital charges that were sig-nificantly higher than those correctly diagnosed: $10,508 vs. $7977, respec-tively. The difference of more than $2500 represented a 32% increase in charges and resulted in a near dou-bling of the financial loss experienced by the hospital.39
Because acoustic cardiography can be performed at the time of the ECG (a test routinely obtained within min-utes in the ED as compared with cen-tral laboratory testing, which can take hours), it can help solve some of the unmet clinical need for more rapid and accurate diagnosis. As a result, fewer missed diagnoses, more rapid and accurate initial diagnoses, and valuable risk assessment should allow prompt initiation of appropriate treatment and
Figure 3. Synergy between acoustic cardiography–detected S3 and B-type natri-uretic peptide (BNP) (pg/mL). ADHF=acute decompensated heart failure; LR=likelihood ratio
publishing . symposia . patient education . trials review series
®

acoustic cardiography in HF diagnosis and management july . august 2006 . supplement 16
early risk stratification. This translates to better clinical outcomes and more economically sound delivery of health care. The Acute Decompensated Heart Failure National Registry (ADHERE) database40,41 has collected data on over 100,000 patient cases and has taught us that earlier diagnosis and initiation of appropriate treatment renders bet-ter outcomes and more cost-efficient care. A review and analysis of the existing literature surrounding acoustic cardiography and its role in assisting ED diagnosis of ADHF appears in this supplement, along with original articles and case studies demonstrating the powerful utility of this application.
Inpatient Hospital Setting. The appearance, disappearance, or change in the S3 intensity in response to maneuvers or therapies, e.g., vasodila-tors or diuretics, has been well studied. Dynamic changes may reveal signifi-cant information about clinical status regarding treatment response.42 The baseline data obtained in the ED may then be utilized to assist in determin-ing therapeutic efficacy throughout a patient’s hospital stay. As well, while few data currently exist for diagnos-ing ADHF that occurs as a second-ary event during a hospitalization, one could speculate that having a baseline or BNP and acoustic cardiogram on admission could significantly aide in this diagnosis. Should an elevation in BNP occur and/or an S3 appear that was not initially present, the diagnosis of a new, or exacerbation of an existing, cardiac dysfunction should be consid-ered and investigated. Similarly, knowl-edge of the dry weight acoustic status at discharge could help at follow-up and subsequent outpatient assessments.
Outpatient Cardiology Offices and HF Clinics. The utility of acoustic cardiograms in outpatient settings for monitoring has been hypothesized as a means to detect early signs of ADHF, because an S3 occurs before the onset of symptoms. This may potentially help to identify patients who require prompt medical intervention, as opposed to the
more stable patient for whom a routine check-up with an HF nurse practitioner or physician’s assistant could be sched-uled. In doing so, early adjustments in medications and/or further evaluation may help prevent an episode of ADHF requiring hospitalization. This rapidly and easily obtainable information can be gathered at the time of arrival at the clinician’s office when baseline vital signs and ECG are recorded. This infor-mation is much easier and faster to obtain than any laboratory test, includ-ing the BNP value, which requires phlebotomy and laboratory analysis.
CRT and Outpatient Optimization. One of the most exciting and promis-ing new uses of acoustic cardiography is its rapid and easy use in CRT opti-mization. Expensive and highly pro-grammable CRT devices have been shown in real-world practice to have a 30% nonresponder rate, which may be largely attributable to the fact that only 10% of CRT devices are optimized.13 This is in stark contrast to the random-ized controlled clinical trials that led to the approval of CRT devices for treat-ing HF. All of these trials implemented optimization strategies.7–11
The paucity of CRT optimization in clinical practice stems from the labor- and time-intensive echocardiography protocols. These procedures are costly and require an expensive echocar-diogram machine and a skilled echo-cardiographer. Acoustic cardiography offers a cost-efficient, easy-to-use meth-od to optimize CRT patients. Acoustic cardiography has been compared with other optimization techniques employ-ing echocardiographic protocols and has proven comparable.43 In this study, 22 CRT patients had independently obtained recommendations for best AV delays through echocardiography and acoustic cardiography, revealing that both technologies yield equivalent clinical results. Echocardiographic opti-mization strategies attempt to achieve optimal AV delay by coordinating the end of the A wave (indicating the end of the atrial contribution of LV fill-ing) with the onset of systolic mitral
regurgitant flow (indicating the onset of ventricular contraction).12 Acoustic cardiography can optimize the settings of the CRT device by creating the shortest electromechanical activation time, defined as the time from the onset of the QRS complex (ventricu-lar depolarization), to the S1, indicat-ing ventricular systole and closure of the mitral valve. In doing so, the LV systolic time—the interval from S1 to S2—can be maximized, which has been shown to correlate well with maximiz-ing ejection fraction.33 In addition, the strength of the S3, as measured by AUDICOR, can be minimized, thereby lowering LV end-diastolic pressure if initially above the detection threshold. All of this can be performed easily, rap-idly, at the point of care, and without the need for expensive devices and skilled technicians. A detailed analysis of benefits of acoustic cardiography in CRT optimization appears later in this supplement, along with the echocar-diography equivalency study43 and case studies demonstrating the applicability of this technique in CRT optimization.
The easy-to-use and rapidly obtain-able information gathered by acoustic cardiography should foster more wide-spread CRT optimization. This could allow for real-world experience with CRT to approach the success rates seen in the large randomized con-trolled trials.
Summary and ConclusionsAcoustic cardiography is an exciting new modernized technology imple-menting the already proven techniques of phonocardiography and systolic time intervals. When applied to clini-cal practice, acoustic cardiography can improve diagnosis and management of HF patients. Its clinical use should help address some of the need for robust, inexpensive, widely accessible, and easy-to-use technology for proac-tive HF diagnosis and management. Heart sounds and systolic time inter-vals captured by acoustic cardiograms have proven valuable in assisting clini-cal diagnostic and management chal-lenges encountered in HF care.
publishing . symposia . patient education . trials review series
®

acoustic cardiography in HF diagnosis and management july . august 2006 . supplement 1 7
REFERENCES 1 Hunt SA, Baker DW, Chin MH, et al. ACC/
AHA guidelines for the evaluation and management of chronic heart failure in the adult: a report of the American College of Cardiology/American Heart Association Task Force on Practice Guidelines (Committee to revise the 2001 Guidelines for the Evaluation and Management of Heart Failure). J Am Coll Cardiol. 2005;46:e1–e82.
2 Maisel AS, Krishnaswamy P, Nowak RM, et al. Rapid measurement of B-type natriuretic peptide in the emergency diagnosis of heart failure. N Engl J Med. 2002;347:161–167.
3 Effect of enalapril on mortality and the devel-opment of heart failure in asymptomatic patients with reduced left ventricular ejection fractions. The SOLVD Investigators. N Engl J Med. 1992;327:685–691.
4 Brophy JM, Joseph L, Rouleau JL. Beta-blockers in congestive heart failure. A Bayesian meta-analy-sis. Ann Intern Med. 2001;134:550–560.
5 Pitt B, Zannad F, Remme WJ, et al. The effect of spironolactone on morbidity and mortality in patients with severe heart failure. Randomized Aldactone Evaluation Study Investigators. N Engl J Med. 1999;341:709–717.
6 Bardy GH, Lee KL, Mark DB, et al. Amiodarone or an implantable cardioverter-defibrillator for congestive heart failure. N Engl J Med. 2005;352:225–237.
7 Leclercq C, Kass DA. Retiming the failing heart: principles and current clinical status of cardiac resynchronization. J Am Coll Cardiol. 2002;39:194–201.
8 Abraham WT, Hayes DL. Cardiac resynchro-nization therapy for heart failure. Circulation. 2003;108:2596–2603.
9 Auricchio A, Abraham WT. Cardiac resynchroni-zation therapy: current state of the art: cost versus benefit. Circulation. 2004;109:300–309.
10 Leclercq C, Hare JM. Ventricular resynchro-nization: current state of the art. Circulation. 2004;109:296–299.
11 Jarcho JA. Resynchronizing ventricular con-traction in heart failure. N Engl J Med. 2005;352:1594–1597.
12 Meluzin J, Novak M, Mullerova J, et al. A fast and simple echocardiographic method of determination of the optimal atrioventricular delay in patients after biventricular stimulation. Pacing Clin Electrophysiol. 2004;27:58–64.
13 Leon AR. Cardiac resynchronization ther-apy devices: patient management and fol-low-up strategies. Rev Cardiovasc Med. 2003;4(suppl 2):S38–S46.
14 Potain C. Les bruits de galop. Sem Med. 1900;20:175.
15 Sokolow M. Clinical Cardiology. 5th ed. Norwalk, CT: Appleton & Lange; 1990.
16 Joshi N. The third heart sound. South Med J. 1999;92:756–761.
17 Abrams J. Current concepts of the genesis of heart sounds. II. Third and fourth sounds. JAMA. 1978;239:2790–2791.
18 Arevalo F, Meyer EC, Maccanon DM, et al. Hemodynamic correlates of the third heart sound. Am J Physiol. 1964;207:319–324.
19 Stefadouros MA, Little RC. The cause and clinical significance of diastolic heart sounds. Arch Intern Med. 1980;140:537–541.
20 Patel R, Bushnell DL, Sobotka PA. Implications of an audible third heart sound in evaluating cardi-ac function. West J Med. 1993;158:606–609.
21 Rihal CS, Davis KB, Kennedy JW, et al. The utility of clinical, electrocardiographic, and roentgenographic variables in the prediction of left ventricular function. Am J Cardiol. 1995;75:220–223.
22 Drazner MH, Rame JE, Stevenson LW, et al. Prognostic importance of elevated jugular venous pressure and a third heart sound in patients with heart failure. N Engl J Med. 2001;345:574–581.
23 Drazner MH, Rame JE, Dries DL. Third heart sound and elevated jugular venous pressure as markers of the subsequent development of heart failure in patients with asymptom-atic left ventricular dysfunction. Am J Med. 2003;114:431–437.
24 Ishmail AA, Wing S, Ferguson J, et al. Interobserver agreement by auscultation in the presence of a third heart sound in patients with congestive heart failure. Chest. 1987;91:870–873.
25 Lok CE, Morgan CD, Ranganathan N. The accuracy and interobserver agreement in detecting the ‘gallop sounds’ by cardiac aus-cultation. Chest. 1998;114:1283–1288.
26 Jauhar S. The demise of the physical exam. N Engl J Med. 2006;354:548–551.
27 Ozawa Y, Smith D, Craige E. Origin of the third heart sound, II. Studies in human sub-jects. Circulation. 1983;67:399–404.
28 Glower DD, Murrah RL, Olsen CO, et al. Mechanical correlates of the third heart sound. J Am Coll Cardiol. 1992;19:450–457.
29 Kono T, Rosman H, Alam M, et al. Hemodynamic correlates of the third heart sound during the evolution of chronic heart failure. J Am Coll Cardiol. 1993;21:419–423.
30 Manson AL, Nudelman SP, Hagley MT, et al. Relationship of the third heart sound to trans-mitral flow velocity deceleration. Circulation. 1995;92:388–394.
31 Friedman SA, Davison ET. The phonocardio-graphic assessment of myocardial function in the aged. Am Heart J. 1969;78:752–756.
32 Weissler AM, Harris WS, Schoenfeld CD. Systolic time intervals in heart failure in man. Circulation. 1968;37:149–159.
33 Shah SJ, Michaels AD. Hemodynamic cor-relates of the third heart sound and systolic time intervals. Congest Heart Fail. 2006;12(4 suppl 1):8–13.
34 Moyers B, Shapiro M, Marcus GM, et al. The performance of phonoelectrocardio-graphic left ventricular systolic time intervals and B-type natriuretic peptide levels in the diagnosis of left ventricular dysfunction. Ann Noninvasive Electrocardiol. In press.
35 Marcus GM, Gerber IL, McKeown BH, et al. Association between phonocardiographic third and fourth heart sounds and objective measures of left ventricular function. JAMA. 2005;293:2238–2244.
36 Zuber M, Kipfer P, Attenhofer Jost C. Systolic dysfunction: correlation of acoustic cardiogra-phy with Doppler echocardiography. Congest Heart Fail. 2006;12(4 suppl 1):14–18.
37 Stevenson LW, Perloff JK. The limited reli-ability of physical signs for estimating hemo-dynamics in chronic heart failure. JAMA. 1989;261:884–888.
38 Collins SP, Lindsell CJ, Peacock WF, et al. The combined utility of an S3 heart sound and BNP levels in emergency department patients with dyspnea. J Card Fail. 2006;12:286–292.
39 Peacock WF, Harrison A, Moffa D. Clinical and economic benefits of using AUDICOR S3 detection for diagnosis and treatment of acute decompensated heart failure. Congest Heart Fail. 2006;12(4 suppl 1):32–36.
40 Acute Decompensated Heart Failure National Registry (ADHERE) database. Available at: http://www.adhereregistry.com. Accessed May 14, 2006.
41 Peacock WF, Emerman CL, Costanzo MR, et al. Early initiation of intravenous therapy improves heart failure outcomes: an analysis from the ADHERE registry database. Ann Emerg Med. 2003;42:S26.
42 Collins SP, Lindsell CJ, Peacock WF IV, et al. The effect of treatment on the presence of abnormal heart sounds in emergency depart-ment patients with heart failure. Am J Emerg Med. 2006;24:25–32.
43 Hasan A, Abraham W, Quinn-Tate L, et al. Optimization of cardiac resynchronization devices using acoustic cardiography: a com-parison to echocardiography. Congest Heart Fail. 2006;12(4 suppl 1):25–31.
publishing . symposia . patient education . trials review series
®

S3 and systolic time interval hemodynamics july . august 2006 . supplement 18
www.lejacq.com ID:5767
Sanjiv J. Shah, MD;1 Andrew D. Michaels, MD, MAS2
From the Division of Cardiology, Department of Medicine, University of California, San Francisco, San Francisco, CA;1 and the Division of Cardiology, Department of Medicine, University of Utah, Salt Lake City, UT2 Address for correspondence: Andrew D. Michaels, MD, MAS, Division of Cardiology, Department of Medicine, University of Utah, 30 North 1900 East, Room 4A100, Salt Lake City, UT 84132-2401E-mail: [email protected]
With the advent of increasingly complex diagnostic modali-
ties in cardiovascular medicine, it is remarkable that simple bedside diag-nostic tests such as cardiac auscultation and electrocardiography (ECG) remain essential.1,2 Bedside diagnosis is invalu-able because of the importance of rapid diagnosis and triage, the continual con-straints on health care resources, and the improvement in outcomes that occurs when proper diagnostic deci-sions are made early in the course of treatment. This is especially true in the diagnosis and treatment of heart failure, because the epidemic of heart failure continues to grow and because its manifestations can be protean.3,4 Cardiac auscultation and the timing of heart sounds have been central to bedside noninvasive diagnosis of heart failure over the past century.
Cardiac auscultation began long before Theophile Laennec’s fortu-itous discovery of the stethoscope in
1818; descriptions of cardiac sounds date back to Hippocrates’ writings, circa 400 BC.5 However, it was not until the latter half of the 19th cen-tury and the early 20th century, with the description and timing of heart sounds and murmurs and the rise of phonocardiography, that the full potential of cardiac auscultation was realized. During that important time, Carl Pierre Potain described the S3, and Willem Einthoven, Otto Frank, and Carl Wiggers played key roles in the development of modern phono-cardiography, with its graphic depic-tion of heart sounds.5,6 Later, through the work of Aubrey Leatham7 and William Evans in the late 1940s (with the creation of a novel phonocardio-gram with the additional capability of recording simultaneous carotid pulse tracings and ECG data) and Weissler and colleagues8,9 in the 1960s (with the correlation of abnormal systolic time intervals [STIs] with left ven-
tricular [LV] dysfunction), ausculta-tive and phonocardiographic bedside diagnosis came into its golden age.7–11 Within the realm of auscultation and phonocardiography, both the S3 and STIs have been among the most useful and best-studied diagnostic tools.
Methodology and DefinitionsAlthough bedside cardiac diagnosis remains important, the practice of the cardiac physical examination has dete-riorated significantly over time.12,13 In addition, although STIs historically have provided a rapid bedside diag-nostic method to evaluate LV func-tion, the need for skilled personnel and simultaneous carotid pulse trac-ings has limited the usefulness of this method, especially after the emer-gence of echocardiography.
Newer technology allows the auto-mated detection of heart sounds and the measurement of STIs in a simple,
O R I G I N A L P A P E R
Hemodynamic Correlates of the Third Heart Sound and Systolic Time Intervals
Bedside diagnostic tools remain important in the care of patients with heart failure. Over the past two centuries, cardiac auscultation and phonocardiography have been essential in understanding cardiac pathophysiology and caring for patients with heart disease. Diastolic heart sounds (S3 and S4 ) and systolic time intervals have been particularly useful in this regard. Unfortunately, auscultation skills have declined considerably, and systolic time intervals have traditionally required carotid pulse tracings. Newer technology allows the automated detection of heart sounds and measurement of systolic time intervals in a simple, inexpensive, noninvasive system. Using the newer system, the authors present data on the hemodynamic correlates of the S3 and abnormal systolic time intervals. These data serve as the foundation for using the system to better understand the test characteristics and pathophysiology of the S3 and systolic time intervals, and help to define their use in improving the
bedside diagnosis and management of patients with heart failure. (CHF. 2006;12(4 suppl 1):8–13) ©2006 Le Jacq
publishing . symposia . patient education . trials review series
®

S3 and systolic time interval hemodynamics july . august 2006 . supplement 1 9
inexpensive system (AUDICOR, Inovise Medical, Inc., Portland, OR). This acoustic cardiograph records, stores, displays, and interprets simul-taneous digital ECG and heart sound data, using unique dual-purpose sensors that acquire both electrical and acoustic data from the V3 and V4 positions. The AUDICOR system’s computerized algo-rithm uses wavelet-based signal process-ing techniques combined with a hidden Markov model to identify normal and abnormal heart sounds, and it deter-mines the timing of heart sounds in the cardiac cycle by comparing the sounds to the onset of the P wave and QRS complexes in the simultaneously record-ed ECG. The algorithm was developed using files annotated by phonocardiog-raphy experts, and it has been clinically validated using Doppler echocardiog-raphy and invasive hemodynamic data from patients with a variety of cardiac abnormalities. The AUDICOR system produces a variety of measurements, including the presence and strength of heart sounds (such as the S3) and the duration of STIs.
The S3 is a low-pitched sound that occurs in early diastole, approximately 120–160 milliseconds after the S2, dur-ing rapid LV filling.14 The AUDICOR system determines the presence of the S3, and, based on the intensity and persistence of the sound, provides a value of S3 strength with a range of 1–10. If this value equals or exceeds 5.0, the algorithm declares that an S3 is present.
Figure 1 displays the conventional LV STIs, which include the electro-mechanical activation time (EMAT; Q-S1 interval), isovolumic contrac-
tion time (IVCT), pre-ejection peri-od (PEP), LV ejection time (LVET), and electromechanical systole (Q-S2 interval). The PEP is comprised of
Table. Third Heart Sounds and Systolic Time Intervals in Asymptomatic Individuals by AgeAGE (YR) N EMAT (MS) %EMAT* LVST (MS) %LVST* EMAT/LVST<30 171 73.2±10.8 8.0±1.7 339±25 36.7±5.5 0.22±0.04<40 253 73.7±11.3 8.2±1.8 338±28 37.3±5.1 0.22±0.0431–40 86 74.4±12.1 8.7±1.9** 335±33 38.7±4.0** 0.22±0.0541–50 114 77.2±14.9** 8.7±2.5** 343±31 38.0±5.8 0.23±0.0651–60 210 82.2±17.8** 9.1±2.4** 344±29** 38.0±5.1 0.24±0.06**61–70 189 82.4±15.9** 9.7±2.6** 340±30 40.0±4.0** 0.25±0.06**71–80 289 86.0±18.4** 9.7±2.5** 348±35** 38.9±4.3** 0.25±0.07**>80 130 85.9±16.1** 9.8±3.1** 342±47 38.9±7.2** 0.25±0.06**≥40 941 83.3±17.2** 9.5±2.6** 344±34** 38.7±5.1** 0.25±0.06**Data are presented as mean ± SD. EMAT=electromechanical activation time (Q-S1 interval); LVST=left ventricular systolic time (S1-S2 interval); *%EMAT and %LVST refer to the percentage of each interval as a portion of the total cardiac cycle duration (R-R interval); **p<0.05 compared with group younger than 40 years. Data source is Inovise Medical, Inc., Portland, OR, on file.
Figure 1. Illustration of systolic time intervals in relation to the cardiac cycle depicted via electrocardiographic (ECG) and pressure waveforms (pressure waveforms are dis-played here for convenience of reference and are not part of the AUDICOR [Inovise Medical, Inc., Portland, OR] data.). Traditional systolic time intervals include the pre-ejection period (PEP) and the left ventricular ejection time (LVET). The PEP encompasses the electromechanical activation time (EMAT; Q-S1 interval) and the isovolumic contraction time (IVCT). The AUDICOR system measures the EMAT and left ventricular systolic time (LVST; S1-S2 interval). Isovolumic relaxation time (IVRT) may be measured by invasive left heart catheterization or echocardiography. Ao=aorta; LA=left atrium; LV=left ventricle
publishing . symposia . patient education . trials review series
®

S3 and systolic time interval hemodynamics july . august 2006 . supplement 110
the EMAT and the IVCT, and the Q-S2 is comprised of the PEP and LVET. Another important STI measurement is the PEP/LVET ratio. Since the PEP and LVET intervals vary equally at heart rates <110 bpm, the PEP/LVET ratio avoids the necessity of employ-ing a heart-rate correction to the STIs.15 It is the PEP/LVET ratio that has been most used to diagnose LV dysfunction.10,15
Of note, the STIs measured by the AUDICOR system are different from those conventionally measured. The AUDICOR system measures the Q-S1, Q-S2, and S1-S2 (LV systolic time [LVST]) intervals. In the traditional method, the PEP contains the IVCT, whereas in the AUDICOR method, the LVST contains the IVCT. Since the AUDICOR system does not mea-sure PEP, it avoids the necessity of obtaining carotid pulse tracings, which allows for AUDICOR’s rapid bed-side use with minimal training. The AUDICOR system also calculates the %EMAT and %LVST, which describe each interval as a percentage of the entire cardiac cycle (R-R interval).
Prevalence and Normal RangesUsing previously collected data from a cross-sectional sample, Collins et al.16 determined the prevalence of the S3 (Figure 2). Using these same record-
ings, the normal ranges of STIs using the AUDICOR system were calculated. The study sample comprised 1194 indi-viduals (age, 57.8±20.3 years; range, 18–94 years; 732 [61.3%] women) who were all asymptomatic from a cardiac standpoint. Figure 2 shows the preva-lence of the S3 by decade of age. There is a high prevalence of physiologic S3 in individuals up to the age of 30 years, after which there is a rapid decline, with <10% prevalence in asymptom-atic older subjects. The Table lists the mean STIs per decade. The EMAT, LVST, and EMAT/LVST all increase slightly with age.
Hemodynamic CorrelatesThird Heart Sound. The S3 has diagnostic and prognostic value in a variety of conditions, including LV dysfunction,17–21 valvular heart dis-ease,22,23 acute myocardial infarction,24 and in the perioperative period.25 Phonocardiography has traditionally been the gold standard for detection of the S3, a finding that was thought to be highly sensitive and specific for LV dysfunction. Physiologically, it is thought that an abrupt limitation of LV inflow during early diastole causes vibration of the entire cardio-hemic system, resulting in the S3.
24,26–28 An increase in mitral inflow in early diastole, followed by a rapid cessa-tion of that inflow, appears to be the
ideal setting in which the pathologic S3 becomes audible.26 These hemody-namic conditions increase the decel-eration rate of early mitral inflow, a finding that has been associated with the S3.
29–31
Using the AUDICOR system, we sought to better understand the test characteristics and physiology of the phonocardiographic S3 in a cohort of 90 patients undergoing cardiac catheterization. All patients under-went computerized phonocardio-graphic heart sound analysis with the AUDICOR system, B-type natriuretic peptide (BNP) testing, echocardiogra-phy, and invasive LV pressure measure-ment within a 4-hour period. Mean LV end-diastolic pressure and BNP were higher, and LV ejection fraction (LVEF) was lower, in those with an S3. The sensitivities of the S3 to detect abnormalities in LV function were only 30%–50%. However, specificity for detecting elevated LV end-diastolic pressure, elevated BNP, and decreased LVEF were high, at 92%, 87%, and 92%, respectively. Therefore, although it has limited sensitivity, the S3 detect-ed by the AUDICOR system is highly specific in detecting LV dysfunction.32
In the same cohort of 90 patients, we hypothesized that tissue Doppler imaging would provide insight into the physiology of the pathologic S3. Tissue Doppler imaging determines the velocity of myocardium, and the ratio of early mitral inflow to early diastolic velocity of the mitral annulus (E/E′) has been shown to correlate with LV filling pressures.33,34 Since E/E′ takes into account the volume and pressure of mitral inflow (E) as well as stiffness of the myocardium (E′), we hypoth-esized that the E/E′ ratio would be independently associated with the S3.
In this study, we found that subjects with an S3 had higher BNP (p=0.0008), higher LV early- and mid-diastolic fill-ing pressures (p<0.0001), and high-er LV end-diastolic filling pressures (p=0.009). On echocardiography, we found that those with an S3 had lower LVEF (p=0.0006), and higher E veloc-ity (p=0.002), E deceleration time
Figure 2. Prevalence of the S3 by age in asymptomatic individuals. Prevalence of the S3 decreases markedly in subjects older than 30 years. Adapted with permission from Congest Heart Fail. 2005;11:242–247.16
0
01
02
03
04
05
06
07
08
09
001
08>08–1707–1606–1505–1404–1303 <
)sraey( egA
Prev
alen
ce o
f S3 (
%)
publishing . symposia . patient education . trials review series
®
S3 and systolic time interval hemodynamics july . august 2006 . supplement 1 11
(p=0.003), and E/E′ (p<0.0001). On multivariate analysis, we found that of the echocardiographic parameters, only E/E′ was independently associated with the S3 (p=0.009).35 In addition, E/E′ was independently associated with S3 when controlling for LV filling pressures at any point during diastole (p<0.02 for all points in diastole). This is an important finding, because it shows that elevated filling pressure alone does not account for the association between S3 and E/E′. Based on these findings, the pathologic S3 seems to be due to abrupt decelera-tion of high-pressure mitral inflow acting in concert with decreased velocity of the mitral annulus.
Systolic Time Intervals. The STIs were the first quantitative, nonin-vasive method for determining LV function. Realizing that the timing of events in the cardiac cycle was previ-ously neglected in the study of LV performance, Weissler and colleagues8,9 studied and popularized the use of STIs in detecting LV dysfunction. Although they found that the PEP increases and LVET decreases with LV dysfunction, these parameters varied with heart rate, necessitating a correction fac-tor. In addition, since PEP increases with both increased QRS duration and increased IVCT (due to diminished rate of pressure rise during isovolumic contraction), prolongation of the PEP may not be an indicator of LV dysfunc-tion in patients with intraventricular conduction delay.15 The ratio of PEP/LVET, which has been shown to be less sensitive to heart rate and changes in QRS duration, is therefore best suited to diagnose LV dysfunction.
Abnormal STIs have been shown to predict decreased cardiac out-put, stroke volume, and LVEF, and increased LV end-diastolic volume.8–
10,36,37 In the past, STIs were used for evaluation of LV performance in car-diomyopathy, coronary disease, hyper-tension, valvular heart disease, and in the study of clinical pharmacology.36–42 More recent studies have shown an association between N-terminal pro-BNP and abnormal STIs.43
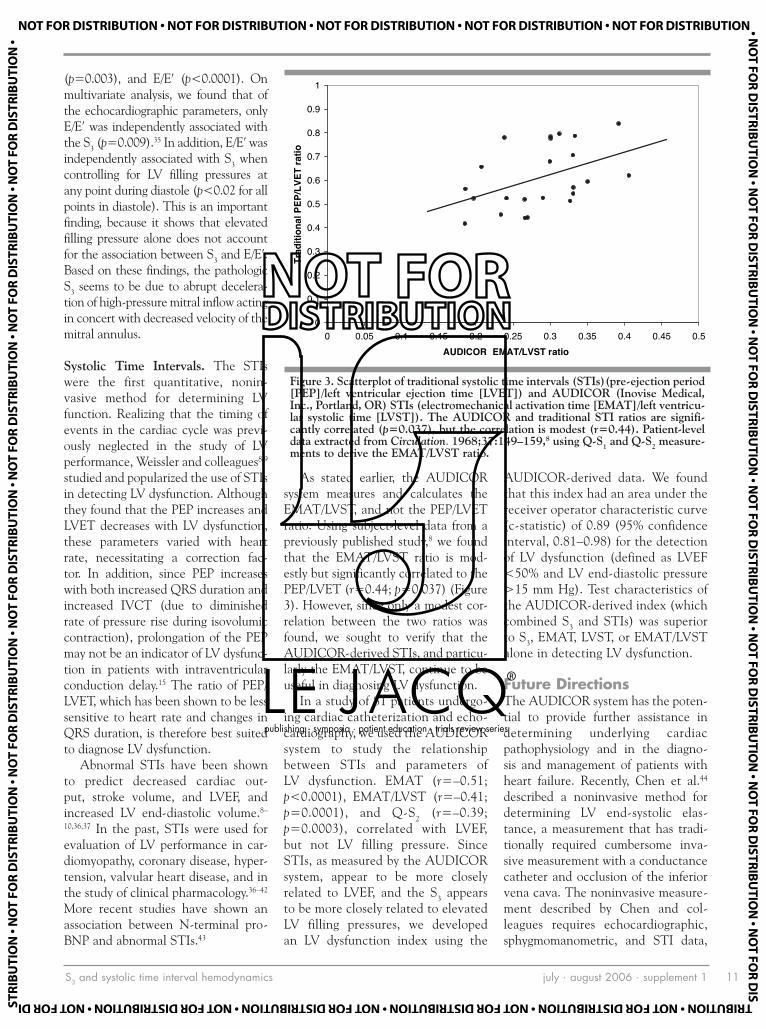
As stated earlier, the AUDICOR system measures and calculates the EMAT/LVST, and not the PEP/LVET ratio. Using subject-level data from a previously published study,8 we found that the EMAT/LVST ratio is mod-estly but significantly correlated to the PEP/LVET (r=0.44; p=0.037) (Figure 3). However, since only a modest cor-relation between the two ratios was found, we sought to verify that the AUDICOR-derived STIs, and particu-larly the EMAT/LVST, continue to be useful in diagnosing LV dysfunction.
In a study of 81 patients undergo-ing cardiac catheterization and echo-cardiography, we used the AUDICOR system to study the relationship between STIs and parameters of LV dysfunction. EMAT (r=–0.51; p<0.0001), EMAT/LVST (r=–0.41; p=0.0001), and Q-S2 (r=–0.39; p=0.0003), correlated with LVEF, but not LV filling pressure. Since STIs, as measured by the AUDICOR system, appear to be more closely related to LVEF, and the S3 appears to be more closely related to elevated LV filling pressures, we developed an LV dysfunction index using the
AUDICOR-derived data. We found that this index had an area under the receiver operator characteristic curve (c-statistic) of 0.89 (95% confidence interval, 0.81–0.98) for the detection of LV dysfunction (defined as LVEF <50% and LV end-diastolic pressure >15 mm Hg). Test characteristics of the AUDICOR-derived index (which combined S3 and STIs) was superior to S3, EMAT, LVST, or EMAT/LVST alone in detecting LV dysfunction.
Future DirectionsThe AUDICOR system has the poten-tial to provide further assistance in determining underlying cardiac pathophysiology and in the diagno-sis and management of patients with heart failure. Recently, Chen et al.44 described a noninvasive method for determining LV end-systolic elas-tance, a measurement that has tradi-tionally required cumbersome inva-sive measurement with a conductance catheter and occlusion of the inferior vena cava. The noninvasive measure-ment described by Chen and col-leagues requires echocardiographic, sphygmomanometric, and STI data,
Figure 3. Scatterplot of traditional systolic time intervals (STIs)(pre-ejection period [PEP]/left ventricular ejection time [LVET]) and AUDICOR (Inovise Medical, Inc., Portland, OR) STIs (electromechanical activation time [EMAT]/left ventricu-lar systolic time [LVST]). The AUDICOR and traditional STI ratios are signifi-cantly correlated (p=0.037), but the correlation is modest (r=0.44). Patient-level data extracted from Circulation. 1968;37:149–159,8 using Q-S1 and Q-S2 measure-ments to derive the EMAT/LVST ratio.
0
1.0
2.0
3.0
4.0
5.0
6.0
7.0
8.0
9.0
1
5.054.04.053.03.052.02.051.01.050.00oitar TSVL/TAMEAUDICOR
Tra
ditio
nal P
EP/L
VET
ratio
publishing . symposia . patient education . trials review series
®

S3 and systolic time interval hemodynamics july . august 2006 . supplement 112
the latter of which could be measured with the AUDICOR system. Thus, the AUDICOR system may be able to play a role in determining LV end-systolic elastance, a load-independent measure of LV stiffness, which may be useful in future studies of ventricu-lar–vascular coupling.
The addition of AUDICOR-derived data such as the S3 and abnormal STIs to BNP testing may also assist in the diagnosis of LV dysfunction. Preliminary data from a study of 90 patients undergoing cardiac catheter-ization, echocardiography, BNP, and AUDICOR testing show that in the range of 100–500 pg/mL, BNP has poor discriminatory value in the diag-nosis of LV dysfunction. However, the addition of AUDICOR data to BNP significantly improves the positive and negative likelihood ratios for ruling
in and ruling out LV dysfunction, especially in the gray zone of BNP levels of 100–500 pg/mL.45 Thus, the AUDICOR system could potentially be used to improve the emergency diagnosis of heart failure.
Finally, AUDICOR analysis of heart sounds and STIs may have yet another role in the field of cardiac resynchro-nization therapy (CRT). Although a number of studies have shown clinical improvement and mortality benefit with CRT,46–48 optimization of CRT is an area of active investigation, because refining patient selection, increasing response rates, and controlling costs are of prime importance.49 Baker and colleagues50 recently reported their findings of altered STIs in a study of patients pre- and post-treatment with CRT. Therefore, monitoring STIs pre- and post-CRT and using this data to
help optimize CRT is another poten-tial use of the system.
ConclusionsBedside diagnosis remains a vital tool in the diagnosis and treatment of heart failure. The AUDICOR system provides a simple, inexpensive, and quantitative method to determine the presence of the S3 and abnormal STIs. This technology has provided insight into the physiology of the S3 and the correlation of S3 and STIs with abnor-mal cardiac hemodynamics. Since the S3 appears to be highly specific for elevated LV end-diastolic pressure, and abnormal EMAT/LVST appears to be specific for low LVEF, the com-bination of the two in the AUDICOR system may be particularly helpful in improving the bedside diagnosis and management of heart failure patients.
REFERENCES 1 Rame JE, Dries DL, Drazner MH. The prog-
nostic value of the physical examination in patients with chronic heart failure. Congest Heart Fail. 2003;9:170–175, 178.
2 Zimetbaum PJ, Josephson ME. Use of the elec-trocardiogram in acute myocardial infarction. N Engl J Med. 2003;348:933–940.
3 Jessup M, Brozena S. Heart failure. N Engl J Med. 2003;348:2007–2018.
4 McMurray JJ, Pfeffer MA. Heart failure. Lancet. 2005;365:1877–1889.
5 Selig MB. Stethoscopic and phonoaudio devices: historical and future perspectives. Am Heart J. 1993;126:262–268.
6 Pierre-Carl Potain (1825–1901) cardiovascu-lar physician. JAMA. 1966;196:1086.
7 Leatham A. Auscultation of the Heart and Phonocardiography. 2nd ed. Edinburgh, Scotland: Churchill Livingstone; 1975.
8 Weissler AM, Harris WS, Schoenfeld CD. Systolic time intervals in heart failure in man. Circulation. 1968;37:149–159.
9 Weissler AM, Harris WS, Schoenfeld CD. Bedside technics for the evaluation of ven-tricular function in man. Am J Cardiol. 1969;23:577–583.
10 Lewis RP, Rittogers SE, Froester WF, et al. A critical review of the systolic time intervals. Circulation. 1977;56:146–158.
11 Silverman ME. Aubrey Leatham: twentieth century pioneer in auscultation. Clin Cardiol. 1999;22:155–157.
12 Jauhar S. The demise of the physical exam. N Engl J Med. 2006;354:548–551.
13 Mangione S, Nieman LZ. Cardiac ausculta-tory skills of internal medicine and family practice trainees. A comparison of diagnostic proficiency. JAMA. 1997;278:717–722.
14 Sokolow M. Physical examination. In: Sokolow M, McIlroy MB, eds. Clinical Cardiology. 5th ed. Norwalk, CT: Appleton & Lange; 1990.
15 Craige E. Heart sounds: phonocardiography; carotid, apex, and jugular venous pulse trac-ings; and systolic time intervals. In: Braunwald E, ed. Heart Disease. 2nd ed. Philadelphia, PA: WB Saunders Co; 1984:40–67.
16 Collins SP, Arand P, Lindsell CJ, et al. Prevalence of the third and fourth heart sound in asymptomatic adults. Congest Heart Fail. 2005;11:242–247.
17 Drazner MH, Rame JE, Dries DL. Third heart sound and elevated jugular venous pressure as markers of the subsequent development of heart failure in patients with asymptom-atic left ventricular dysfunction. Am J Med. 2003;114:431–437.
18 Drazner MH, Rame JE, Stevenson LW, et al. Prognostic importance of elevated jugular venous pressure and a third heart sound in patients with heart failure. N Engl J Med. 2001;345:574–581.
19 Perloff JK. Importance of elevated jugular venous pressure and a third heart sound in asymptomatic left ventricular dysfunction. Am J Med. 2003;114:499–500.
20 Unverferth DV, Magorien RD, Moeschberger ML, et al. Factors influencing the one-year mortality of dilated cardiomyopathy. Am J Cardiol. 1984;54:147–152.
21 Glover DR, Littler WA. Factors influencing survival and mode of death in severe chronic ischaemic cardiac failure. Br Heart J. 1987;57:125–132.
22 Folland ED, Kriegel BJ, Henderson WG, et al. Implications of third heart sounds in patients with valvular heart disease. The Veterans Affairs Cooperative Study on Valvular Heart Disease. N Engl J Med. 1992;327:458–462.
23 Abdulla AM, Frank MJ, Erdin RA Jr, et al. Clinical significance and hemodynamic correlates of the third heart sound gallop in aortic regurgitation. A guide to optimal timing of cardiac catheteriza-tion. Circulation. 1981;64:464–471.
24 Joshi N. The third heart sound. South Med J. 1999;92:756–761.
25 Goldman L, Caldera DL, Nussbaum SR, et al. Multifactorial index of cardiac risk in non-cardiac surgical procedures. N Engl J Med. 1977;297:845–850.
26 Mehta NJ, Khan IA. Third heart sound: gen-esis and clinical importance. Int J Cardiol. 2004;97:183–186.
27 Braunwald E, Perloff JK. Physical examination
of the heart and circulation. In: Braunwald E, ed. Braunwald’s Heart Disease. 7th ed. New York, NY: Elsevier; 2005:817–818.
28 Manson AL, Nudelman SP, Hagley MT, et al. Relationship of the third heart sound to trans-mitral flow velocity deceleration. Circulation. 1995;92:388–394.
29 Van de Werf F, Boel A, Geboers J, et al. Diastolic properties of the left ventricle in normal adults and in patients with third heart sounds. Circulation. 1984;69:1070–1078.
30 Van de Werf F, Geboers J, Kesteloot H, et al. The mechanism of disappearance of the physi-ologic third heart sound with age. Circulation. 1986;73:877–884.
31 Pozzoli M, Febo O, Tramarin R, et al. Pulsed Doppler evaluation of left ventricular filling in subjects with pathologic and physiologic third heart sound. Eur Heart J. 1990;11:500–508.
32 Marcus GM, Gerber IL, McKeown BH, et al. Association between phonocardio-graphic third and fourth heart sounds and objective measures of left ventricular function. JAMA. 2005;293:2238–2244.
33 Dokainish H. Tissue Doppler imaging in the evaluation of left ventricular diastolic function. Curr Opin Cardiol. 2004;19:437–441.
34 Ho CY, Solomon SD. A clinician’s guide to tis-sue Doppler imaging. Circulation. 2006;113:e396–e398.
35 Shah SJ, Marcus GM, Gerber IL, et al. Physiology of the third heart sound: novel insights from tissue Doppler imaging and inva-sive left ventricular hemodynamics [abstract]. J Am Soc Echocardiogr. 2006;19:582.
36 Garrard CL Jr, Weissler AM, Dodge HT. The relationship of alterations in systolic time inter-vals to ejection fraction in patients with cardiac disease. Circulation. 1970;42:455–462.
37 Stack RS, Sohn YH, Weissler AM. Accuracy of systolic time intervals in detecting abnormal left ventricular performance in coronary artery disease. Am J Cardiol. 1981;47:603–609.
38 Hamosh P, Cohn JN, Engelman K, et al. Systolic time intervals and left ventricular func-tion in acute myocardial infarction. Circulation.
publishing . symposia . patient education . trials review series
®

S3 and systolic time interval hemodynamics july . august 2006 . supplement 1 13
1972;45:375–381. 39 Lewis RP, Boudoulas H, Welch TG, et al. Usefulness
of systolic time intervals in coronary artery dis-ease. Am J Cardiol. 1976;37:787–796.
40 Leier CV, Magorien RD, Boudoulas H, et al. The effect of vasodilator therapy on sys-tolic and diastolic time intervals in congestive heart failure. Chest. 1982;81:723–729.
41 Lewis RP, Boudoulas H, Leier CV, et al. Usefulness of the systolic time intervals in cardiovascular clinical cardiology. Trans Am Clin Climatol Assoc. 1981;93:108–120.
42 Wanderman KL, Goldberg MJ, Stack RS, et al. Left ventricular performance in mitral regurgitation assessed with systolic time inter-vals and echocardiography. Am J Cardiol. 1976;38:831–835.
43 Cheng HM, Chuang SY, Hsu PF, et al. Systolic time intervals revisited: correlations with N-terminal pro-brain natriuretic peptide in a community population. Heart Vessels. 2005;20:256–263.
44 Chen CH, Fetics B, Nevo E, et al. Noninvasive single-beat determination of left ventricular end-systolic elastance in humans. J Am Coll Cardiol. 2001;38:2028–2034.
45 Michaels A, Marcus G, Jordan M, et al. Audioelectric parameters are superior to BNP for detecting hemodynamic evidence of heart failure [abstract]. J Am Coll Cardiol. 2006;47(suppl A):67A.
46 Abraham WT, Fisher WG, Smith AL, et al. Cardiac resynchronization in chronic heart fail-ure. N Engl J Med. 2002;346:1845–1853.
47 Cleland JG, Daubert JC, Erdmann E, et al. The effect of cardiac resynchronization on morbidity and mortality in heart failure. N Engl J Med. 2005;352:1539–1549.
48 Bristow MR, Saxon LA, Boehmer J, et al. Cardiac-resynchronization therapy with or without an implantable defibrillator in advanced chronic heart failure. N Engl J Med. 2004;350:2140–2150.
49 Doshi RN. Optimizing resynchronization therapy: can we increase the number of true responders? J Cardiovasc Electrophysiol. 2005;16(suppl 1):S48–S51.
50 Baker C, Love CJ, Moeschberger ML, et al. Time intervals of cardiac resynchroniza-tion therapy in heart failure. Am J Cardiol. 2004;94:1192–1196.
publishing . symposia . patient education . trials review series
®

acoustic cardiography vs. echocardiography july . august 2006 . supplement 114
www.lejacq.com ID:5768
Michel Zuber, MD;1 Peter Kipfer, MD;2 Christine Attenhofer Jost, MD3
From the Cardiology Outpatient Clinic, Othmarsingen, Switzerland;1 the Cardiology Outpatient Clinic, Frauenfeld, Switzerland;2 and Cardiovascular Center Zürich, Klinik im Park, Zürich, Switzerland3 Address for correspondence: Michel Zuber, MD, Bahnhofstrasse 8, 5504 Othmarsingen, SwitzerlandE-mail: [email protected]
The ability to detect left ventricu-lar systolic dysfunction (LVSD) is
important because it frequently pro-vides the pathophysiologic substrate for heart failure, a major cause of disability and death. Although echo-cardiographic and radionuclide studies are noninvasive tests used to measure left ventricular (LV) function, these tests are expensive and are not always readily available.1 Consequently, a reli-able, convenient, and cost-effective method to detect impaired LV func-tion is desirable. To address this prob-lem, physicians have widely adopted other tests for heart failure, such as the measurement of B-type natriuretic peptide (BNP). However, the inverse relationship between sensitivity and specificity for heart failure across the commonly encountered range val-ues of BNP has limited the diagnos-tic value of this test.2 To provide a more suitable diagnostic method, Inovise Medical, Inc. (Portland, OR)
has developed the AUDICOR sys-tem. This is a system that records, stores, displays, and algorithmically interprets simultaneous digital electro-cardiographic (ECG) and sound (i.e., acoustic cardiographic) data, includ-ing the S3, by using proprietary, dual-purpose sensors placed in the V3 and V4 positions. Previous work has shown that the S3 identified algorithmically by AUDICOR has high specificity for detecting hemodynamic evidence of heart failure and is diagnostically supe-rior to auscultation.3 Since the system records acoustic cardiographic data throughout the entire cardiac cycle, it permits the measurement of systolic time intervals (STIs) as diagnostic parameters in addition to the S3.
The purpose of this study was to investigate the relationships of acous-tic cardiographic findings to Doppler echocardiographic evidence of LVSD in patients with known or suspected heart disease.
MethodsSubjects. We enrolled 171 ambulatory patients who had been referred to a cardiology clinic for Doppler echo-cardiographic evaluation of known or suspected cardiac disease. Of these, we excluded 10 patients for the follow-ing reasons: three were missing acous-tic cardiograms, two lacked sufficient echocardiographic data to evaluate LV function, three were missing BNP data, and two had acoustic cardiograms that were not analyzable due to poor qual-ity. The analyses were performed on the remaining 161 patients.
All patients gave written informed consent before enrollment in the study, which was approved by the local medi-cal ethics committees of Aargau and Zurich, Switzerland.
Within 1 hour of the Doppler echo-cardiographic study, each patient had acoustic cardiographic data record-ed and BNP (Biosite Triage, Biosite, Incorporated, San Diego, CA) and
O R I G I N A L P A P E R
Systolic Dysfunction: Correlation of Acoustic Cardiography With Doppler Echocardiography
For detection of left ventricular (LV) systolic dysfunction in the outpatient setting, simultaneous electrocardiographic and heart sound data have been shown to be helpful. In 161 patients with suspected or known cardiac disease, echocardiography and acoustic cardiography were performed. Acoustic cardiographic parameters correlated to echocardiography included: presence or absence of S3, electromechanical activation time (EMAT), LV systolic time (LVST), and EMAT/LVST. LV ejection fraction was ≥50% in 82 patients (S3 present in 9.8%) and <50% in 79 patients (S3 present in 30.4%; the <50% group also had a greater EMAT, EMAT/LVST, and lower mean LVST [p<0.05]). Patients with an S3 had a lower ejection fraction, larger mean left atrial and LV dimensions, and an increased proportion of diastolic dysfunction. Acoustic cardiography allows reli-able detection of the S3, which correlates with echocardiographic evidence of impaired LV function, and the EMAT/LVST ratio reflects reduced ejection fraction, providing an affordable, accessible means to assess LV dysfunction in the outpatient setting.
(CHF. 2006;12(4 suppl 1):14–18) ©2006 Le Jacq
publishing . symposia . patient education . trials review series
®

acoustic cardiography vs. echocardiography july . august 2006 . supplement 1 15
serum creatinine (Roche Diagnostics Reflotron, Hoffman-La Roche, Basel, Switzerland) measured.
Echocardiographic Data. Following the guidelines of the American Society of Echocardiography, each patient had a complete two-dimensional and Doppler echocardiographic examina-tion. The investigators who interpreted the Doppler echocardiographic find-ings were blinded to other clinical and acoustic cardiographic data. We defined LVSD as LV ejection fraction (LVEF) of <50%. LV diastolic function was evaluated using the diastolic filling pat-tern and tissue Doppler examination of the lateral mitral annulus (for E′) to determine the E/A ratio, E/E′ ratio, the deceleration time of the E wave, and the pulmonary venous flow pat-tern. Diastolic function was graded as normal, delayed relaxation, pseudonor-mal, or restrictive. It can be difficult to categorize patients into a diastolic fill-ing group due to inconsistent Doppler data and length of atrial reversal in some patients—for example, those with mitral insufficiency. The presence of elevated LV filling pressure was deter-mined using the method described by Ommen and Nishimura.4
Acoustic Cardiogram Data. A 10-second AUDICOR recording was obtained from each patient and ana-lyzed by the computerized algorithm using measurements generated for the S3 and for various systolic param-eters. The system evaluates the pos-sible presence of an S3 by measuring the intensity and persistence of the energy of sounds that have the appro-priate frequency and timing for an S3. It expresses the resultant value in the range of 1–10 and declares S3 to be present in a patient if the value equals or exceeds five. Electromechanical activation time (EMAT) is measured by the algorithm as the time from the onset of the Q wave to the mitral component of the S1. The value of EMAT in milliseconds reflects the time required for the left ventricle to generate sufficient force to close the
mitral valve. LV systolic time (LVST) is measured as the time from the mitral component of the S1 to the aortic component of the S2. The ratio EMAT/LVST was computed as the simple ratio of these two components.
Statistical Analyses. Continuous data are reported as mean ± SD. Categoric data are presented as percentages of their respective subgroups. We tested the null hypothesis for the continuous variables using the Student t test and for the dichotomous variables using chi-square analysis.
ResultsThe mean age was 64.4±12.8 years (range, 19–88 years), and 109 (68%) were male. Mean BNP was 161±221 pg/mL (range, 4–1270 pg/mL). Eighteen patients (11%) had left bundle-branch block, and 25% had a QRS duration ≥130 milliseconds (mean, 115±29 milliseconds; range, 80–221 milliseconds). An LVEF of <50% was present in 79 patients; the mean was 49%, ranging from 10% to 82%. The remainder of the findings are shown in the tables and figures.
Table I shows that among the 161 study patients, 82 had LVEF ≥50%
Table I. Comparison of Findings in Patients With Left Ventricular (LV) Ejection Fraction ≥50% vs. <50%
LV EJECTION FRACTION
≥50% (N=82) <50% (N=79)LV ejection fraction (%) 62±7 34±10*Age (yr) 66±13 63±12Heart rate (bpm) 63±10 67±13*Left bundle-branch block (%) 1.2 21.5*QRS duration (ms) 101±17 129±31*B-type natriuretic peptide (pg/mL) 110±176 214±249*E/A 0.96±0.48 1.01±0.74E/E′ 7.0±3.4 9.9±4.5*Deceleration time (ms) 214±55.0 201±63.5Diastolic filling pattern (%)
Normal 20.0 14.9Delayed relaxation 69.3 64.2Pseudonormal 9.3 14.9Restrictive 1.3 6.0
S3 present (%) 9.8 30.4*Electromechanical activation time (EMAT) (ms) 84±13 100±20*LV systolic time (LVST) (ms) 361±33 345±35*EMAT/LVST 0.23±0.04 0.3±0.07*Data are mean ± SD except as noted. *Significant at p<0.01
Table II. Comparison of Doppler Echocardiographic Findings in Patients Without vs. With an Electronically Detected S3
S3 ABSENT
(N=129)S3 PRESENT
(N=32)Left ventricular ejection fraction (%) 51±17 40±14*Left atrial dimension (mm) 22±5 25±8Left ventricular end-diastolic dimension (mm) 53±9 60±10*E/A 0.8±0.4 1.6±1.0*E/E′ 7.8±4.1 10.0±4.4**Deceleration time (ms) 213±56 180±68Elevated left ventricular end-diastolic pressure (%) 16.9 63.6*Abnormal diastolic filling pattern (pseudonormal
or restrictive) (%)7 52*
Data are mean ± SD except as noted. *Significant at p<0.01; **significant at p<0.05
publishing . symposia . patient education . trials review series
®

acoustic cardiography vs. echocardiography july . august 2006 . supplement 116
(group A) and 79 had LVEF <50% (group B). Although we did not per-form the study in an acute setting, the patients in group B had higher mean heart rates and levels of BNP. In addition, the patients in group B had greater mean QRS durations, with a higher prevalence of left bundle-branch block. Although the mean E/A ratios were similar, group B had a high-er mean E/E′. The patients in group B had significantly higher proportions of pseudonormal and restrictive fill-ing patterns. Regarding the acoustic cardiogram parameters, the patients in group B had a higher prevalence of electronically detected S3, a greater mean EMAT and EMAT/LVST, and a lower mean LVST.
Table II compares the echocardio-graphic findings in all the patients in which an electronically detected S3 was absent vs. those in which it was pres-ent. It shows that the patients with an S3 have a lower mean LVEF and higher LV diastolic dimensions. Regarding parameters of LV filling, the patients with an S3 have greater mean E/A and E/E′ ratios and a higher proportion of abnormal diastolic filling patterns.
Table III shows the differences in the findings in Group B for each of the four types of filling patterns. In general, the patients with abnormal diastolic filling tend to be older, have wider QRS complexes, a higher preva-lence of left bundle branch block, higher mean values of BNP, a lower mean LVEF, a higher mean E/E′ ratio, a higher prevalence of elevated left ventricular end-diastolic pressure, and a higher prevalence of S3. Especially noteworthy is the finding that the prevalence of the S3 is by far the low-est in the patients with the pattern of delayed relaxation and the highest in the patients with a pseudonormal and restrictive filling patterns.
Figure 1 graphically demonstrates these relationships. It shows that only four patients with delayed LV relaxation had sufficient S3 strength to exceed the detection threshold. Conversely, of all the patients with pseudonormal or restrictive filling
Figure 1. S3 strength vs. diastolic filling pattern in patients with left ventricular ejection fraction <50%. 1=normal filling; 2=delayed relaxation; 3=pseudonormal pattern; 4=restrictive pattern
0
1
2
3
4
5
6
7
8
9
01
43210
Diastolic filling pattern
S 3 stre
ngth
detection 3Sthreshold
Figure 2. Temporal relationship between the S3 and a prominent E wave
publishing . symposia . patient education . trials review series
®

acoustic cardiography vs. echocardiography july . august 2006 . supplement 1 17
patterns, conditions characterized by vigorous early passive diastolic filling patterns, only two patients failed to exceed this detection threshold.
Figure 2 also demonstrates the relationship between vigorous early diastolic filling, i.e., a prominent E wave, and the S3. It represents an example of simultaneous acoustic cardiogram and Doppler echocardio-graphic recordings in a patient with an atrioventricular sequential pace-maker. The figure shows that the S3 occurs immediately following the peak of a prominent E wave.
Figure 3 demonstrates the ability of a systolic acoustic cardiogram param-eter to discriminate between patients with vs. without LVSD. It shows that values of LVST/EMAT ratio >0.35 are highly specific for LVEF <50%.
DiscussionDespite recent advances, such as pro-BNP assays and cardiac resynchroniza-tion therapy, diagnosis and treatment of systolic dysfunction with clinical heart failure and its underlying abnor-malities remain challenging. There is a continued need for simple, low-cost tests that aid in initial heart fail-ure diagnosis and monitoring patient progress. Our data show that such tests should include the detection of abnormal diastolic sounds and the
measurement of STIs. Although no longer as widely used as they have been in the past, STIs have recently been validated as a method to detect and monitor LV dysfunction in con-junction with cardiac resynchroni-zation therapy.5 Abnormal diastolic heart sounds, especially the S3, have long been associated with hemody-namic abnormalities that underlie heart failure.3,6,7
Generation and Occurrence of the S3. Our findings are consistent with the observations of others that the S3 is specific, but not highly sensitive, for heart failure associated with LVSD.3,6,7 The S3 is believed to occur during the rapid, passive phase of ventricular filling early in diastole. The kinetic energy of the incoming blood is trans-duced into the acoustical energy asso-ciated with an S3. While it is tempting
Table III. Comparisons of Findings Among the Four Diastolic Filling Patterns in Patients With Left Ventricular (LV) Ejection Fraction <50%FILLING PATTERN
NORMAL
(N=10)DELAYED RELAXATION
(N=43)PSEUDONORMAL
(N=10)RESTRICTIVE
(N=4)Age (yr) 53.8±15.2 65.7±9.1* 65.2±10.0 66.3±14.2Heart rate (bpm) 63.1±17.8 67.6±10.2 65.4±14.8 72.3±16.8Left bundle branch block (%) 10.0 23.3 30.0 25.0QRS duration (ms) 117±25 130±33 138±33 132±28B-type natriuretic peptide (pg/mL) 147±133 171±214 466±238* 348±217*LV ejection fraction (%) 42.6±5.7 33.3±10.9* 28.1±6.7* 30.8±8.1*E/A 1.2±0.4 0.7±0.2* 1.5±0.2 3.1±1.6*E/E′ 7.8±1.7 9.3±4.8 14.4±3.0* 12.1± 1.6*Elevated LV end-diastolic pressure (%) 11.1 17.6 100* 100*S3 present (%) 40 9.3* 80 100.0*Electromechanical activation time (EMAT) (ms) 96±26 100±19 98±13 114±24LV systolic time (LVST) (ms) 351±35 348±36 343±35 326±22EMAT/LVST 0.28±0.09 0.29±0.06 0.29±0.05 0.35±0.07Data are mean ± SD except as noted. *Significant at p<0.05 compared with the normal filling group
Figure 3. Electromechanical activation time (EMAT)/left ventricular systolic time (LVST) vs. left ventricular ejection fraction (LVEF)(%)
0
50.0
1.0
51.0
2.0
52.0
3.0
53.0
4.0
54.0
5.0
0908070605040302010
FEVL
EMAT/LVST
publishing . symposia . patient education . trials review series
®

acoustic cardiography vs. echocardiography july . august 2006 . supplement 118
to dichotomize “systolic” and “dia-stolic” heart failure, the data shown in Table III and in Figure 1 show that many patients with LVSD also have delayed diastolic relaxation. In this group, only 9.3% of the patients with LVSD had an S3, compared with 80% and 100%, respectively, of the patients with Doppler echocardiographic evi-dence of vigorous passive early inflow. Figure 2 illustrates the close temporal relationship between the peak of this early inflow and an S3. Therefore, patients with impaired early diastolic filling, even in the presence of LVSD, would not be expected to have an S3.
Systolic Time Intervals. Consequently, it would be desirable to have parameters for detecting ventricular dysfunction in addition to the S3. A possible set of diagnostic parameters that can fulfill this role are STIs. Traditionally, STIs required the recordings of the ECG, phonocardiogram, and the carotid pulse tracing. The resultant diagnostic parameters included electromechani-cal systole (Q onset to S2), LV ejection time (LVET), and pre-ejection period (PEP, the time from Q onset to begin-ning of ejection from the left ventri-cle). PEP consists of both the EMAT and the isovolumetric contraction time (IVCT). Since the measurement of these intervals required manual measurements of analog recordings, the process was time-consuming and labor intensive.
Due to the influence of heart rate on LVET and PEP, researchers devel-oped regression formulas to study indexed values.8,9 However, the ratio of PEP/LVET has been shown to be less sensitive to heart rate. Normal ranges have been established for the STIs, and values outside the normal range have been correlated with LV dysfunc-tion (cardiac output, stroke volume, LV end-diastolic pressure).10–12 LVEF was shown to be highly correlated with PEP/LVET and useful in diag-nosing heart failure.8,11 As a result of LVSD, the LVET shortens and the PEP lengthens, primarily due to a diminished rate of LV pressure rise during isovolumetric contraction.13
The parameters of systolic function that the AUDICOR system provides are similar to the traditional STIs. The difference is that PEP contains IVCT, whereas EMAT does not. The AUDICOR LVST contains IVCT, whereas LVET does not. Since the AUDICOR system generates both EMAT and LVST, it does not matter in which of these two parameters the IVCT is included. Furthermore, the AUDICOR system is advantageous because its recordings can be obtained as easily as a standard ECG, and a computerized algorithm makes the measurements on the digital data that generate these recordings.
The data in Table I show that not only the electronically recorded S3, but also the systolic parameters
EMAT, LVST, and EMAT/LVST, dis-criminate between patients with vs. without LVSD. Thus, the array of systolic and diastolic parameters that acoustic cardiogram parameters pro-vide increases the likelihood of detec-tion of LVSD.
Limitations of the Study. The number of patients in this study is relatively small, particularly when separate analy-ses are performed for the patients in groups A and B. Therefore, our findings should be corroborated on a larger set of data. The diagnosis of heart failure is of great clinical interest, and ventricu-lar dysfunction and heart failure are not synonymous. However, the detection of LVSD in the appropriate clinical con-text is very important in the process of diagnosing heart failure.
ConclusionsWe conclude that acoustic cardiogra-phy allows reliable detection of the S3 and the ratio EMAT/LVST, and these parameters correlate with echocardio-graphic evidence of LV dysfunction. This could be a helpful, affordable, and easily accessible means to assess patients with dyspnea in the outpatient setting.
We also conclude that in patients with LVSD, a filling pattern of impaired relaxation is common and diminishes the prevalence of the S3. Therefore, the use of parameters of systolic func-tion is a useful adjunct to the evalua-tion of these patients.
REFERENCES 1 American Heart Association. Heart Disease
and Stroke Statistics—2005 Update. Dallas, TX: American Heart Association; 2005.
2 Mueller C, Scholer A, Laule-Kilian K, et al. Use of B-type natriuretic peptide in the evaluation and management of acute dyspnea. N Engl J Med. 2004;350:647–654.
3 Marcus GM, Gerber IL, McKeown BH, et al. Association between phonocardio-graphic third and fourth heart sounds and objective measures of left ventricular function. JAMA. 2005;293:2238–2244.
4 Ommen SR, Nishimura RA. A clinical approach to the assessment of left ventricular diastolic function by Doppler echocardiogra-phy: update 2003. Heart. 2003;89(suppl III):iii18–iii23.
5 Baker C, Love CJ, Moeschberger ML, et al. Time intervals of cardiac resynchroniza-tion therapy in heart failure. Am J Cardiol. 2004;94:1192–1196.
6 Drazner MH, Rame JE, Stevenson LW, et al. Prognostic importance of elevated jugular venous pressure and a third heart sound in patients with heart failure. N Engl J Med. 2001;345:574–581.
7 Lok CE, Morgan CD, Ranganathan N. The accuracy and interobserver agreement in detecting the ‘gallop sounds’ by cardiac aus-cultation. Chest. 1998;114:1283–1288.
8 Lewis RP, Rittogers SE, Froester WF, et al. A critical review of the systolic time intervals. Circulation. 1977;56:146–158.
9 Weissler AM, Harris WS, Schoenfeld CD.
Bedside technics for the evaluation of ven-tricular function in man. Am J Cardiol. 1969;23:577–583.
10 Stack RS, Sohn YH, Weissler AM. Accuracy of systolic time intervals in detecting abnormal left ventricular performance in coronary artery disease. Am J Cardiol. 1981;47:603–609.
11 Weissler AM, Harris WS, Schoenfeld CD. Systolic time intervals in heart failure in man. Circulation. 1968;37:149–159.
12 Garrard CL, Weissler AM, Dodge HT. The rela-tionship of alterations in systolic time intervals to ejection fraction in patients with cardiac disease. Circulation. 1970;42:455–462.
13 Braunwald E. Heart Disease: A Textbook of Cardiovascular Medicine. Philadelphia, PA: WB Saunders Co; 1980:56.
publishing . symposia . patient education . trials review series
®

acoustic cardiography and LV dysfunction july . august 2006 . supplement 1 19
www.lejacq.com ID:5769
Markus Roos, MD; Stefan Toggweiler, MD; Michel Zuber, MD; Peiman Jamshidi, MD; Paul Erne, MDFrom the Division of Cardiology, Kantonsspital Luzern, Lucerne, SwitzerlandAddress for correspondence: Paul Erne, MD, Head of Division of Cardiology, Kantonsspital Luzern, 6004 Luzern, SwitzerlandE-mail: [email protected]
Despite recent advances in its man-agement, the prevalence of heart
failure is increasing as the population ages, and heart failure remains a major cause of disability and death. The optimal management of heart failure requires not only its accurate diagno-sis, but reliable methods to determine with specificity the hemodynamic abnormalities in individual patients. These determinations will permit the most effective treatment to be select-ed for each patient. Similarly, it is important to be able to measure the effectiveness of such treatment and to determine whether it should modified in any way. To benefit as many patients as possible, the methods of evaluation of hemodynamic function should be safe, reliable, widely available, and cost-effective.
Although left ventricular systolic dysfunction (LVSD) is not synony-
mous with the clinical entity of heart failure, the demonstration of LVSD in the appropriate clinical context, e.g., a patient with acute or chronic dyspnea, is strong prima facie evidence that systolic heart failure is responsible for the patient’s symptoms. A technology that could facilitate the detection of LVSD is the AUDICOR test (Inovise Medical, Inc., Portland, OR). The AUDICOR system records, stores, dis-plays and algorithmically interprets simultaneous digital electrocardiogra-phy (ECG) and sound (i.e., acoustic cardiographic) data by using propri-etary dual-purpose sensors placed in the V3 and V4 positions. The acous-tic cardiographic data include the S3 recorded during diastole and vari-ous other parameters that are closely related to the traditional systolic time intervals. These are established meth-ods for evaluating cardiac function.1
In the present study, we tested the hypothesis that acoustic cardiographic parameters are quantitatively related to invasive measurements of left ven-tricular (LV) cardiac function.
MethodsSubjects. We enrolled 37 patients (33 men) with a mean age of 62.6 years (range, 42–79 years), who had been referred to the Kantonsspital Luzern, Lucerne, Switzerland. All car-diac catheterizations were performed in the postabsorptive state and under mild sedation. The hemodynamic measurements obtained included measurements of LV ejection frac-tion (LVEF), LV end-diastolic pressure (LVEDP), pulmonary capillary wedge pressure, and LV contractility (dP/dt) and maximum contractility (dP/dtmax), using manometer-tipped catheters in 22 patients and fluid-filled catheters
O R I G I N A L P A P E R
Acoustic Cardiographic Parameters and Their Relationship to Invasive Hemodynamic Measurements in Patients With Left
Ventricular Systolic Dysfunction
Data obtained at cardiac catheterization were used to evaluate the utility of acoustic cardiographic data in assessing the hemodynamic abnormalities associated with left ventricular systolic dysfunction (LVSD). Thirty-seven patients (mean age, 62.6 years) underwent catheterization, and hemodynamic data were recorded. Acoustic cardiographic recordings were obtained using a system that records and algorithmically interprets diastolic heart sounds and parameters analogous to traditional sys-tolic time intervals. Seventeen patients had LVSD (defined as ejection fraction <50%). The 17 patients with LVSD composed the cohort for analysis. There were strong associations between acoustic cardiographic parameters and left ventricular end-dia-stolic pressure, ejection fraction, and maximum contractility. Heart rate tended to influence the strength of these correlations. The authors conclude that acoustic cardiographic data can be used in the evaluation of patients with known or suspected LVSD, and specifically in the selection of patients for cardiac resynchronization therapy and the optimization of the settings
of implanted resynchronization devices. (CHF. 2006;12(4 suppl 1):19–24) ©2006 Le Jacq
publishing . symposia . patient education . trials review series
®
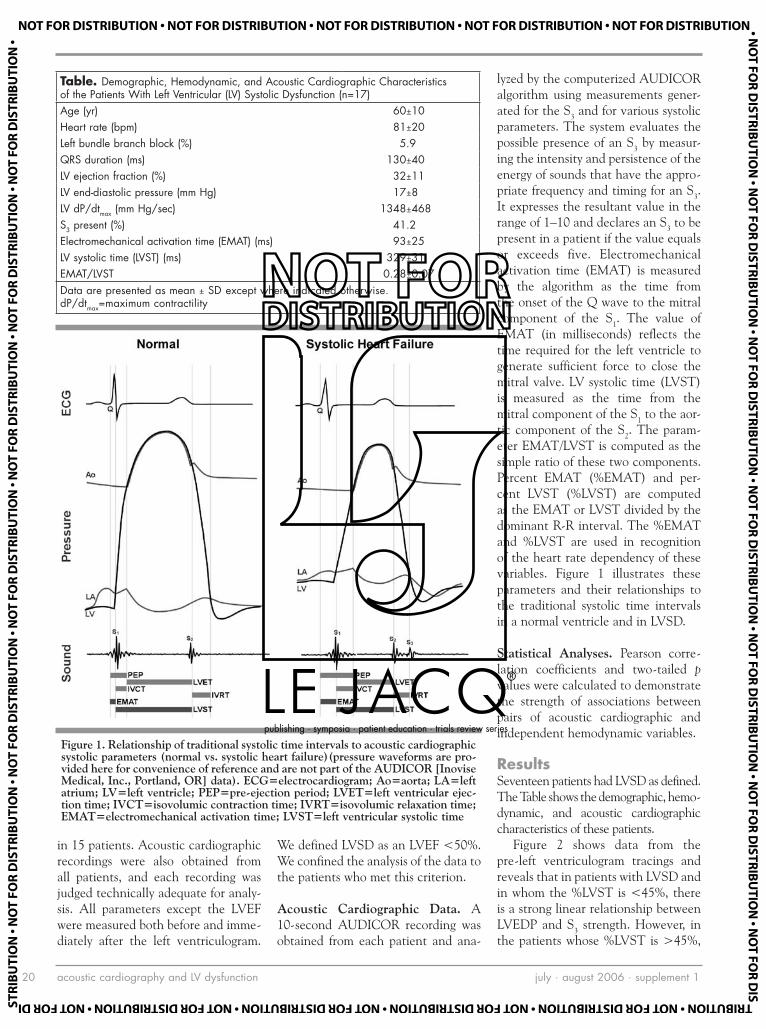
acoustic cardiography and LV dysfunction july . august 2006 . supplement 120
in 15 patients. Acoustic cardiographic recordings were also obtained from all patients, and each recording was judged technically adequate for analy-sis. All parameters except the LVEF were measured both before and imme-diately after the left ventriculogram.
We defined LVSD as an LVEF <50%. We confined the analysis of the data to the patients who met this criterion.
Acoustic Cardiographic Data. A 10-second AUDICOR recording was obtained from each patient and ana-
lyzed by the computerized AUDICOR algorithm using measurements gener-ated for the S3 and for various systolic parameters. The system evaluates the possible presence of an S3 by measur-ing the intensity and persistence of the energy of sounds that have the appro-priate frequency and timing for an S3. It expresses the resultant value in the range of 1–10 and declares an S3 to be present in a patient if the value equals or exceeds five. Electromechanical activation time (EMAT) is measured by the algorithm as the time from the onset of the Q wave to the mitral component of the S1. The value of EMAT (in milliseconds) reflects the time required for the left ventricle to generate sufficient force to close the mitral valve. LV systolic time (LVST) is measured as the time from the mitral component of the S1 to the aor-tic component of the S2. The param-eter EMAT/LVST is computed as the simple ratio of these two components. Percent EMAT (%EMAT) and per-cent LVST (%LVST) are computed as the EMAT or LVST divided by the dominant R-R interval. The %EMAT and %LVST are used in recognition of the heart rate dependency of these variables. Figure 1 illustrates these parameters and their relationships to the traditional systolic time intervals in a normal ventricle and in LVSD.
Statistical Analyses. Pearson corre-lation coefficients and two-tailed p values were calculated to demonstrate the strength of associations between pairs of acoustic cardiographic and independent hemodynamic variables.
ResultsSeventeen patients had LVSD as defined. The Table shows the demographic, hemo-dynamic, and acoustic cardiographic characteristics of these patients.
Figure 2 shows data from the pre-left ventriculogram tracings and reveals that in patients with LVSD and in whom the %LVST is <45%, there is a strong linear relationship between LVEDP and S3 strength. However, in the patients whose %LVST is >45%,
Table. Demographic, Hemodynamic, and Acoustic Cardiographic Characteristics of the Patients With Left Ventricular (LV) Systolic Dysfunction (n=17) Age (yr) 60±10Heart rate (bpm) 81±20Left bundle branch block (%) 5.9QRS duration (ms) 130±40LV ejection fraction (%) 32±11LV end-diastolic pressure (mm Hg) 17±8LV dP/dtmax (mm Hg/sec) 1348±468S3 present (%) 41.2Electromechanical activation time (EMAT) (ms) 93±25LV systolic time (LVST) (ms) 329±31EMAT/LVST 0.28±0.07Data are presented as mean ± SD except where indicated otherwise. dP/dtmax=maximum contractility
Figure 1. Relationship of traditional systolic time intervals to acoustic cardiographic systolic parameters (normal vs. systolic heart failure)(pressure waveforms are pro-vided here for convenience of reference and are not part of the AUDICOR [Inovise Medical, Inc., Portland, OR] data). ECG=electrocardiogram; Ao=aorta; LA=left atrium; LV=left ventricle; PEP=pre-ejection period; LVET=left ventricular ejec-tion time; IVCT=isovolumic contraction time; IVRT=isovolumic relaxation time; EMAT=electromechanical activation time; LVST=left ventricular systolic time
publishing . symposia . patient education . trials review series
®

acoustic cardiography and LV dysfunction july . august 2006 . supplement 1 21
the relationship between S3 strength and LVEDP is much weaker.
Figure 3 shows the stability of the relationship between LVEDP and S3 strength. It displays data from the pre- and post-left ventriculogram trac-ings in patients with LVSD and LVST <45%. The effects of the left ven-triculogram had a negligible influence on the relationship between LVEDP and S3 strength.
Figure 4 shows that in patients with LVSD, values of EMAT >100 mil-liseconds are associated with LV dP/dtmax <1000 mm Hg/sec. It therefore demonstrates the relationship between an additional acoustic cardiographic parameter and another fundamental measure of LV function.
Figure 5 reveals that in patients with LVSD, LVST increases as LVEF increases. However, if the heart rate exceeds 75 bpm, the LVST is generally shorter at any value of LVEF than it is at slower heart rates.
Figure 6 shows that the quantita-tive relationship between LV diastolic time (LVDT) and heart rate differs in patients with vs. without LVSD. In each group of patients, LVDT falls as the heart rate increases. However, especially at heart rates ≥70 bpm, the LVDT at each heart rate tends to be shorter in patients with LVSD vs. without LVSD.
Figure 7 demonstrates that in con-trast to LVST (Figure 5), the values of %LVST decrease as LVEF increases. This is because of the higher heart rates that often prevail in patients with low LVEF. More specifically, Figure 7 also shows that patients with LVSD have higher values of %LVST at each increment of ejection fraction if their heart rates exceed 75 bpm than do patients with slower heart rates.
DiscussionOur data show that acoustic cardio-graphic parameters are quantitatively related to invasive measurements of ventricular function. In patients with LVSD, there is a positive linear rela-tionship between S3 strength and LVEDP (Figure 2). In addition, Figure
3 reveals that despite the perturbations imposed by a rapid injection of angio-graphic dye into the left ventricle, the linear relationship between S3 strength and LVEDP persists. This relationship illustrates the value of expressing evi-
dence of an S3 as a continuous variable. This is more robust than treating it as a dichotomous variable, as is the case for S3 detection by auscultation.
As also shown in Figure 2, how-ever, the linear relationship between
Figure 2. S3 strength vs. left ventricular end-diastolic pressure (LVEDP) in the patients with left ventricular systolic dysfunction; pre-ventriculogram recordings. Filled circles=left ventricular systolic time (LVST) <45% of R-R interval (R=0.982; p<0.0001); empty circles=LVST >45% of R-R interval (R=–0.071; p=0.881)
0
1
2
3
4
5
6
7
8
9
01
0453035202510150
PDEVL
S 3 str
engt
h
Figure 3. S3 strength vs. left ventricular end-diastolic pressure (LVEDP) in the patients with left ventricular systolic dysfunction and left ventricular systolic time <45% of R-R interval. Filled circles=pre-ventriculogram (R=0.982; p<0.0001); empty circles=post-ventriculogram (R=0.956; p<0.025)
0
1
2
3
4
5
6
7
8
9
01
540453035202510150
PDEVL
S 3 str
engt
h
publishing . symposia . patient education . trials review series
®

acoustic cardiography and LV dysfunction july . august 2006 . supplement 122
S3 strength and LVEDP disappears if the LVST exceeds 45% of the cardiac cycle. A likely explanation for this is that an increase in LVST occurs at the expense of the proportion of time spent in diastole. A reduction in the duration of diastole can prevent early passive diastolic filling of the ven-tricle from being sufficiently vigorous
to produce an S3. This is because both the isovolumic relaxation and the active filling periods impinge on the time available for passive filling. This, in turn, helps explain why, despite its high specificity for heart failure in the appropriate clinical setting, the corresponding sensitivity of the S3 for systolic dysfunction is only moderate.2
Despite the presence of LVSD, many patients may have sufficient impair-ment of early passive diastolic filling to prevent an S3 from occurring. An implication of these observations is that if a patient with heart failure has a detectable S3, a goal of therapy would be to reduce its strength. However, if the patient does not have an S3, an alternate goal would be to modify the %LVST appropriately.
As shown in Figure 4, the decreased force of LV contraction revealed by a low dP/dtmax is associated with a pro-longed EMAT. Thus, EMAT is an additional diagnostic parameter that can discriminate between patients with intact vs. impaired LV systolic function. As a measure of LV function, dP/dtmax is especially relevant because it is highly sensitive to abnormalities of contractility.3 Since dP/dtmax typically occurs during isovolumic contraction, it is not affected by alterations in after-load unless especially severe LVSD is present or if aortic diastolic pressure is very low. Conversely, dP/dtmax is very sensitive to changes in preload, especially if contractility is increased.3 Measuring dP/dtmax is most useful for evaluating directional changes in contractility during interventions in which acute changes in preload can be assessed.
Patients with LVSD tend to have shorter LVSTs because ventricles with impaired contraction require more time to generate enough force to open and keep open the aortic valve. As shown in Figure 5, LVST is related to LVEF, and this relationship is affected by the patient’s heart rate. At higher heart rates, the LVST is generally shorter at each level of LVEF because of the diminished time for diastolic filling at these rates. Figure 6 confirms this by demonstrating the relationship between LVDT (the complement of LVST) and heart rate in patients with vs. without LVSD. Above a heart rate of about 70, patients with LVSD gen-erally spend less time in diastole for each increment in heart rate than do patients without LVSD. Compounding this effect on the Starling mechanism,
Figure 4. Relationship of electromechanical activation time (EMAT) to left ven-tricular (LV) maximum contractility (dP/dt) in the patients with left ventricular systolic dysfunction (R=–0.961; p=0.063)
0
02
04
06
08
001
021
041
061
000300520002005100010050
td/Pd mumixaM VL
EMA
T
Figure 5. Left ventricular systolic time (LVST) vs. ejection fraction (EF) in patients with left ventricular systolic dysfunction, by heart rate subgroups. R is nonsignificant for each subgroup. Filled circles=heart rate ≤75 bpm; empty circles=heart rate >75 bpm
0
05
001
051
002
052
003
053
004
0605040302010
FE
LVST
publishing . symposia . patient education . trials review series
®

acoustic cardiography and LV dysfunction july . august 2006 . supplement 1 23
as Meiler et al.4 showed, such a reduc-tion in the time for diastolic filling can reduce subendocardial perfusion and further impair ventricular function in patients with heart failure. In a thera-peutic application of these principles, Baker et al.5 studied systolic and dia-stolic time intervals in 11 patients before and after implantation of car-diac resynchronization therapy (CRT) devices. They found that appropriate settings of the CRT devices shortened LV systole and concomitantly length-ened diastole.
As Figure 1 indicates, the ratio-nales upon which the systolic acoustic cardiographic parameters are based are similar to that of traditional sys-tolic time intervals. Abnormal systolic time intervals have been correlated with measures of LV dysfunction such as low cardiac output, stroke volume, and LV end-diastolic volume. The relation between the pre-ejection peri-od and LV ejection time was shown to be highly correlated with LVEF and to be useful in diagnosing heart failure.6–9 As a result of LV failure, the LV ejec-tion time shortens and the pre-ejec-tion period lengthens, primarily due to a diminished rate of LV pressure rise during isovolumic contraction.10 These changes are respectively analo-gous to a shortening of LVST and prolongation of EMAT. Determination of the traditional systolic time inter-vals required labor-intensive mea-surements by experts who examined analog tracings of the simultaneously recorded ECG, phonocardiogram, and carotid pulse. In contrast, the acoustic cardiographic parameters are obtained through automated measurements of digital data and require no more time or effort to record than does a stan-dard ECG.
As suggested above, one of the appli-cations for which acoustic cardiography is particularly well-suited is CRT. CRT devices are intended to improve the hemodynamic status of patients with systolic heart failure by permitting the adjustment of the atrioventricular and/or ventriculoventricular intervals of implanted pacemakers. If properly per-
formed, these adjustments can improve cardiac efficiency by optimizing the tim-ing and sequence of cardiac activation. However, before selecting a patient for CRT, it is first necessary to determine that LVSD is a plausible explanation of the symptoms. Not only can pulmonary
disease mimic the symptoms of heart failure, but not all cases of heart failure are associated with LVSD. Therefore, when they are available, echocardio-graphic, radionuclide, and angiographic tests of LVEF are often used. Although tests such as the echocardiogram and
Figure 6. Left ventricular diastolic time vs. heart rate in patients without vs. with left ventricular systolic dysfunction, defined as ejection fraction (EF) <50%. Black=EF ≥50% (R=–0.952; p<0.0001); white=EF <50% (R=–0.985; p<0.0001)
R2 7969.0 =
R2 3609.0 =
0
002
004
006
008
0001
0021
0041
061041021001080604020
etar traeH
LVD
T
Figure 7. Relationship between left ventricular systolic time as a percentage of the R-R interval (%LVST) and ejection fraction (EF) in patients with left ventricular systolic dysfunction, by heart rate subgroups. Filled circles=heart rate ≤75 bpm; empty circles=heart rate >75 bpm
0
01
02
03
04
05
06
07
0605040302010
FE
% L
VST
publishing . symposia . patient education . trials review series
®

acoustic cardiography and LV dysfunction july . august 2006 . supplement 124
radionuclide studies can be used to confirm the presence of LVSD, their high cost and limited availability make them unsuitable for widespread use as screening tests.11 Also, although the echocardiogram has been used to help optimize pacemaker settings following implantation of the CRT device, its use in this context is cumbersome, time-consuming, and highly dependent on the skill of the operator. As shown by their ease of use and their quantitative
relationships to well-accepted invasive measures of LV function, acoustic car-diographic parameters could be ideal for CRT optimization.5
Limitations of the Study. The number of patients in this study is small, and the findings must be corroborated using a larger set of data. A larger set of data will also be required to determine appropri-ate heart rate corrections for the various acoustic cardiographic parameters.
ConclusionsWe conclude that easily obtained acoustic cardiographic data may be used to detect and assess the sever-ity of LVSD, as shown by the rela-tionship of acoustic cardiographic data to invasive measurements of LV function. Acoustic cardiography can also be applied in the selection of patients for CRT and the optimi-zation of the settings of implanted CRT devices.
REFERENCES 1 Shah SJ, Michaels AD. Hemodynamic correlates
of the third heart sound and systolic time intervals. Congest Heart Fail. 2006;12(4 suppl 1):8–13.
2 Marcus GM, Gerber IL, McKeown BH, et al. Association between phonocardiographic third and fourth heart sounds and objective measures of left ventricular function. JAMA. 2005;293:2238–2244.
3 Little WC. The left ventricular dP/dtmax-end-diastolic volume relation in closed-chest dogs. Circ Res. 1985;56:808–815.
4 Meiler SE, Boudoulas H, Unverferth DV, et al. Diastolic time in congestive heart failure. Am
Heart J. 1987;114:1192–1198. 5 Baker C, Love CJ, Moeschberger ML, et al.
Time intervals of cardiac resynchronization therapy in heart failure. Am J Cardiol. 2004;94:1192–1196.
6 Weissler AM, Harris WS, Schoenfeld CD. Bedside technics for the evaluation of ven-tricular function in man. Am J Cardiol. 1969;23:577–583.
7 Stack RS, Sohn YH, Weissler AM. Accuracy of systolic time intervals in detecting abnormal left ventricular performance in coronary artery disease. Am J Cardiol. 1981;47:603–609.
8 Garrard CL, Weissler AM, Dodge HT. The rela-tionship of alterations in systolic time intervals to ejection fraction in patients with cardiac disease. Circulation. 1970;42:455–462.
9 Lewis RP, Rittogers SE, Froester WF, et al. A critical review of the systolic time intervals. Circulation. 1977;56:146–158.
10 Weissler AM, Harris HS, Schoenfeld CD. Systolic time intervals in heart failure in man. Circulation. 1968;37:149–159.
11 American Heart Association. Heart Disease and Stroke Statistics—2005 Update. Dallas, TX: American Heart Association; 2005.
publishing . symposia . patient education . trials review series
®

acoustic cardiography in cardiac resynchronization july . august 2006 . supplement 1 25
www.lejacq.com ID:5770
Ayesha Hasan, MD;1 William T. Abraham, MD;1 Lori Quinn-Tate, RN, MN;2 Lei Brown, RDCS, RVT;2 Ali Amkieh, MD2
From the Division of Cardiology, The Ohio State University, Columbus, OH;1 and the Heart & Vascular Clinic, Louisiana Heart Hospital, Lacombe, LA2
Address for correspondence: Ayesha Hasan, MD, Division of Cardiovascular Medicine, The Ohio State University, 473 West 12th Avenue, Room 200 DHLRI, Columbus, OH 43210E-mail: [email protected]
To maximize the benefits of cardiac resynchronization therapy (CRT),
a fast and cost-effective method of atrioventricular (AV) delay optimi-zation that also fits into the stan-dard pacemaker follow-up workflow is desirable. Despite the clinical accep-tance of echocardiography in CRT optimization, practical aspects such as availability, time, cost, and the need for a well-trained echocardiographer limit the application of AV optimiza-tion to only a small percentage of CRT patients. This, in turn, may limit the effectiveness of CRT, since key outcome studies demonstrating the benefits of CRT routinely utilized such techniques of AV optimization.1,2
A promising, fast, and inexpensive method for device optimization in CRT
is acoustic cardiography. One approach to acoustic cardiography (AUDICOR, Inovise Medical, Inc., Portland, OR) records, stores, displays, and algorithmi-cally interprets simultaneous electrocar-diographic (ECG) and acoustic data. These data are collected using propri-etary ECG/sound sensors placed in the standard precordial V3 and V4 positions, i.e., near the left ventricular (LV) apex. The assessment of cardiac function is achieved by the detection and automat-ed analysis of systolic and diastolic heart sounds and their temporal relationships to the ECG. The primary acoustic cardi-ography parameters of relevance for the management of systolic heart failure are (see also Figure 1):• S3 strength: a measurement of the
overall acoustic energy of the S3
in a 10-second time interval. This parameter exhibits values in a range of 0–10 units.
• Electromechanical activation time (EMAT): the interval in millisec-onds measured from the onset of the QRS complex to the mitral com-ponent of the S1. This parameter reflects the time required for the left ventricle to generate sufficient force to close the mitral valve and shows an increased value in patients with systolic heart failure.
• LV systolic time (LVST): the inter-val in milliseconds measured from S1 to S2. This interval is reduced in patients with LV dysfunction.Previous studies have shown that
acoustic cardiography accurately detects clinical heart failure and specific
O R I G I N A L P A P E R
Optimization of Cardiac Resynchronization Devices Using Acoustic Cardiography: A Comparison to Echocardiography
Optimization of pacemaker settings for cardiac resynchronization therapy (CRT) remains challenging and problematic. Several noninvasive methods are offered to customize the programmed parameters for individual patients, but so far only echocardiographic imaging has established itself as an accepted method. The authors examined the value of acoustic car-diography as a fast and more cost-efficient alternative to established echocardiographic imaging techniques for the optimi-zation of CRT devices. The atrioventricular delay in 22 subjects with implanted CRT devices was independently optimized using echocardiography (Doppler transmitral flow) as well as acoustic cardiography, and the recommended settings from each method were later compared. Doppler echocardiography and acoustic cardiography recommendations matched within a mean value ± SD of 17±16 milliseconds and gave a correlation coefficient of r=0.90 (p<0.001). In 17 of the 22 cases (77.3%), the difference between echocardiographic and acoustic cardiogram CRT optimization results was ≤20 milliseconds. Furthermore, the echocardiographic transmitral flow pattern was not significantly different for the setting independently chosen by the echocardiographic expert and the acoustic cardiographer for the cases with a difference of >20 milliseconds (22.7%). In addition, it took less time for the acoustic cardiogram to collect sufficient information to make a recommendation, and it was found that the acoustic cardiogram data trend is easier to interpret. (CHF. 2006;12(4 suppl 1):25–31) ©2006 Le Jacq
publishing . symposia . patient education . trials review series
®

acoustic cardiography in cardiac resynchronization july . august 2006 . supplement 126
hemodynamic abnormalities known to be associated with heart failure.3,4 In particular, the comparison of acoustic cardiography parameters with relevant hemodynamic parameters obtained during left heart catheterization studies have shown that: 1) S3 strength corre-lates well with the absolute value of the LV end-diastolic pressure (LVEDP); 2) a prolonged EMAT is associated with reduced LV maximum contractility; and 3) reduced LVST values correlate to reduced LV ejection fraction (LVEF) in patients with systolic dysfunction.5
We tested the hypothesis that acoustic cardiography provides a fast, easy-to-use, and, therefore, cost-effec-tive method to optimize CRT settings, and that acoustic cardiogram param-eters produce very similar recommen-dations for the best AV delay settings in CRT devices compared with estab-lished echocardiographically-guided optimization methods.
MethodsPatient Population. Twenty-two sub-jects (14 men; mean age, 72 years; range, 62–87 years), mean preimplan-tation LVEF of 25% (range, 10%–40%), mean current LVEF of 37% (range, 15%–68%) with implanted CRT devices scheduled for an echo-cardiographically guided AV optimiza-tion were included in the study.
Exclusion criteria for participation in the study were the presence of atrial fibrillation or any other pace-maker-related issue at the time of pre-sentation that would have prevented a successful AV delay optimization using echocardiography.
All subjects fulfilled the classic cri-teria for receiving CRT at the time of implantation. All patients had a CRT device implanted for at least 3 months and had undergone at least one echo-cardiographically guided AV optimiza-tion before enrollment in this study.
Study Design. After written patient con-sent was obtained, all subjects underwent a regular follow-up of their pacemak-er/implantable cardioverter-defibrillator before optimization of their AV delay.
Figure 1. Relationship of traditional systolic time intervals to acoustic cardiographic systolic parameters (normal vs. systolic heart failure). (Pressure waveforms are pro-vided here for convenience of reference and are not part of the AUDICOR [Inovise Medical, Inc., Portland, OR] data.) ECG=electrocardiogram; Ao=aorta; LA=left atrium; LV=left ventricle; PEP=pre-ejection period; LVET=left ventricular ejec-tion time; IVCT=isovolumic contraction time; IVRT=isovolumic relaxation time; EMAT=electromechanical activation time; LVST=left ventricular systolic time
Figure 2. Flow chart used to determine the best atrioventricular (AV) delay dur-ing cardiac resynchronization therapy optimization using acoustic cardiography. LVST=left ventricular systolic time; EMAT=electromechanical activation time
publishing . symposia . patient education . trials review series
®

acoustic cardiography in cardiac resynchronization july . august 2006 . supplement 1 27
Doppler Echocardiography. The echo-cardiographic studies were performed with a Hewlett Packard (Palo Alto, CA) 4500 Ultrasound system in Doppler transmitral flow mode. For the echocar-diographically guided AV optimization, patients were placed in the left lateral position. The selection of the appropri-ate AV delays to test, as well as the total range and separation between the tem-porarily programmed AV delays, were determined by the clinician based on clinical judgment. For each temporarily programmed AV delay, an echocardio-graphic image of the Doppler transmitral flow pattern was recorded on video-tape, then analyzed and recorded in the patient chart. At the end of the record-ing, the clinician determined the best AV delay for the patient based on the review of all echocardiographic images and noted the optimal settings in the patient chart.
Acoustic Cardiography. After com-pletion of the echocardiographically guided AV optimization, the subject was placed in the supine position and connected to an AUDICOR TS device to record and trend acoustic cardio-graphic parameters. The subject’s AV delays were temporarily changed and programmed to the same temporary settings as used during the echocardio-graphic evaluation. For each temporary AV delay, a full 10-second AUDICOR test was recorded, analyzed for the S3 strength, EMAT, and LVST, and trended against the AV delay changes. After taking all AUDICOR tests, the patient’s AV delay was permanently programmed based on the results of the echocardiographic evaluation.
After the patient was discharged, two clinical specialists trained in inter-preting acoustic cardiographic trends were asked to independently review the data and produce a recommended AV delay. The specialists were blinded to the patient information as well as the echo-cardiographic data and recommended AV setting. Based on the results of echocardiographic and hemodynamic studies of the relationship between the absence of an S3 with impaired
relaxation in diastole (E/A <1.0), the strength of an S3 correlating well with
LVEDP in LV systolic dysfunction, and the relationships between LVST and
Table. Echocardiographic (Echo) and Acoustic Cardiographic Optimal Atrioventricular Delay Setting Recommendations (ms) for All Study SubjectsSUBJECT Δ (ECHO, ACOUSTIC CARDIOGRAPHY NO. DOPPLER ECHO ACOUSTIC) CONSENSUS EXPERT I EXPERT II1 130 30 160 160 1602 60 20 80 80 803 225 0 225 225 2504 100 0 100 100 1005 150 10 160 160 1606 210 20 230 230 2307 160 0 160 160 1608 140 10 150 150 1509 190 30 220 190 22010 280 70 210 240 21011 200 20 220 220 22012 200 20 220 220 22013 130 20 150 150 15014 180 10 170 170 17015 230 40 270 270 27016 200 10 210 210 21017 200 0 200 200 20018 180 30 150 150 15019 70 10 80 80 10020 170 0 170 170 17021 110 20 130 130 13022 190 10 180 180 180Mean ± SD 168±53 17±16 175±50 175±50 177±50Δ=difference
Figure 3. Relationship of the recommended atrioventricular (AV) delays obtained through independent, blinded over-read of the AUDICOR TS (Inovise Medical, Inc., Portland, OR) trends by two clinical experts
0
05
001
051
002
052
003
003052002051001050
I (ms)I trepxE yb yaled VA
AV
dela
y by
Exp
ert I
(ms)
79.0 =r59.0 = ²r
100.0< = p
publishing . symposia . patient education . trials review series
®

acoustic cardiography in cardiac resynchronization july . august 2006 . supplement 128
LVEF, and EMAT and LV contractility, the flow chart in Figure 2 was devised and used by the two clinical special-ists in interpreting the acoustic cardio-graphic trends for the various AV delays per patient.5,6 In those cases where the specialists disagreed with respect to the recommended AV setting, the dis-agreement was documented, and both were asked to agree on a recommended consensus AV setting by reviewing the blinded data together.
Statistical Analyses. The recommenda-tion for a best AV delay (as obtained through the individual review of the acoustic cardiography trends and the consensus recommendation) were compared against the final AV delays obtained through the echocardiographi-cally guided procedure. Correlation coef-ficients for the over-read results from the two clinical specialists, as well as for the comparison between acoustic cardiogra-phy and echocardiography recommen-dations, were calculated using standard linear regression analysis. Significance was determined by p<0.05.
ResultsComparison of AV Delays Recom-mended by the Two Reviewers. The Table contains the detailed AV delay recommendations for all subjects based
on the independent interpretation of the two experts in acoustic cardiogra-phy, and Figure 3 shows the correla-tion between the AV delays recom-mended by the two reviewers. There was excellent agreement between the two reviewers (r=0.97; p<0.001). For the settings about which both experts initially disagreed, the corresponding acoustic cardiogram parameters did not differ significantly.
Comparison of AV Delays Recom-mended by Acoustic Cardiography and Echocardiography. The Table shows the echocardiographically and acoustic cardiographically determined AV settings as well as the difference between both methods for each sub-ject. For the 22 subjects included in the study, recommendations from both methods matched for 17 (77.3%) sub-jects within 20 ms and for 21 (95.5%) subjects within 40 ms, while the dis-crepancy for one patient was 70 ms. A review of the Doppler transmitral flow images for subjects where the discrep-ancy was >30 ms revealed that the dif-ferences for the AV settings picked by one or the other optimization method were marginal at best.
Figure 4 shows the correlation of the echocardiography and acoustic cardiog-raphy AV delay recommendations for all
subjects. The correlation coefficient is r=0.90 (p<0.001). The mean value for the echocardiography-based recommen-dation was 168±53 milliseconds, and for the acoustic cardiography-based analysis it was 175±50 milliseconds, which is not significantly different.
DiscussionThe key focus during AV optimization is to maximize preload through opti-mal synchronization of the atrial con-tribution to LV filling at the onset of LV systole.1 Using the Doppler trans-mitral flow pattern to optimize the AV delay, the most common approach is to improve the passive inflow pattern (maximize E-wave height and width, if possible, and reduce the deceleration time) and to increase the atrial contri-bution to LV filling through maximiz-ing the A-wave height and width, as well as its timing with respect to the mitral valve closure.1 The achieved increase in preload leads to two posi-tive effects: 1) an increase in effective filling pressure, with a consequent increase in LV end-diastolic volume and increase in stroke volume via the Frank-Starling mechanism; and 2) an overall reduction in LVEDP, and thereby improvements in the LV dia-stolic function as reflected by chang-es in the E/A ratio and, potentially, a reduction in diastolic dysfunction class.7 In particular, in postimplanta-tion patients, the reduction in LVEDP is important to support the reverse remodeling process.8
It was shown in left heart cath-eterization studies that acoustic car-diographic parameters correlate well with relevant hemodynamic param-eters that are key in the optimization of CRT devices in patients with sys-tolic heart failure. As Roos et al.5 have shown, the S3 strength is correlated in a linear fashion to LVEDP, and there-fore can be used to optimize preload in CRT patients. As shown in Doppler echocardiographic and catheterization studies on patients with systolic heart failure, the strength of the S3 can be reduced by either severely impaired passive filling at high heart rates or in
Figure 4. Relationship of recommended atrioventricular (AV) delays obtained through echocardiography and acoustic cardiography (consensus over-read) patient evaluation
0
05
001
051
002
052
003
003052002051001050
y (ms)hargoidrac citsuoca yb yaled VA
AV
dela
y by
ech
ocar
diog
raph
y (m
s)
09.0 = r18.0 = ²r
100.0< = p
publishing . symposia . patient education . trials review series
®

acoustic cardiography in cardiac resynchronization july . august 2006 . supplement 1 29
patients with an abnormal relaxation pattern, with an E/A ratio of <1.0.5,6 In particular, in the latter patients, the S3 strength might not show sufficient variation during the AV optimization, so one can obtain additional guid-ance for the AV optimization through systolic time intervals, namely EMAT and LVST. EMAT will increase with a reduction in LV maximum contrac-tility, while LVST decreases with a reduction in LVEF.5,9
The relationship among EMAT, LVST, and the Doppler transmitral flow pattern in CRT patients is illus-trated in Figure 5. For short AV times, the atrial contribution to LV filling is often reduced due to the closure of the mitral valve before the end of the atrial systole. As a result, the peak of the A wave in the transmitral flow pattern is strongly reduced and, in some cases, the A wave is truncated by the closure of the mitral valve. In this situation, EMAT is strongly prolonged and LVST is reduced. For longer, more optimal AV times, the peak of the A wave in the transmitral flow pattern is increased to its maximum point and the tail end of the A wave is aligned with the closure of the mitral valve. In this setting, EMAT will be shortened, while LVST is lengthened.
As an example, Figure 6 shows the Doppler transmitral flow patterns and Figure 7 shows the acoustic cardio-graphic trend for one of the patients in this study. In this case, both the echocardiographically guided optimi-zation as well as the acoustic cardio-graphic evaluation yielded conclusions that the best setting for that subject is an AV delay of 225 milliseconds. Advanced pattern recognition skills are needed to identify the best AV setting through the Doppler trans-mitral flow pattern. In this case, the acoustic cardiogram trend offers clear guidance to the best AV setting (per Figure 2, low S3 strength [<5.0], so the best setting is determined through the maximum LVST and a low EMAT, while making sure that the setting is not too close to the intrinsic PR inter-val). Note that the low S3 strength
is consistent with the pattern of E/A <1.0 in the transmitral flow patterns.
The simplicity of interpreting the acoustic cardiographic trends is under-scored by how closely the two clinical specialists who interpreted the acous-tic cardiogram trends produced simi-lar recommended AV delays for the enrolled subjects.
Besides being virtually equivalent to measuring Doppler transmitral flow for optimization of CRT, acoustic car-diography has the advantages of being less time consuming for the physician and less burdensome for the patient. For example, AV optimization using acoustic cardiography took no lon-ger than 15 minutes for any of the
patients, whereas echocardiography required more than an hour for several of the patients. In addition, unlike the case for performing echocardiography, obtaining the acoustic cardiographic data does not require the patient to be lying in an uncomfortable left lateral position for a prolonged period. It is likely that by providing greater ease and comfort to physicians and their patients, adopting acoustic cardiogra-phy will lead to wider acceptance of the optimization of CRT devices.
Limitations of the Study. This study has certain limitations. During the echocardiographic evaluation, only a limited number of AV settings were
Figure 5. Illustration of electrocardiographic, AUDICOR (Inovise Medical, Inc., Portland, OR) systolic time intervals (electromechanical activation time [EMAT], left ventricular systolic time [LVST]), and echo Doppler transmitral flow pattern in a cardiac resynchronization therapy patient for short and long atrioventricular (AV) delays. With a shorter AV delay, there is fusion of the E and A wave, resulting in reduced passive filling (shorter diastolic filling time). With a longer AV delay, there is separation of the E and A waves, with atrial contraction ending with onset of systole or QRS.
publishing . symposia . patient education . trials review series
®
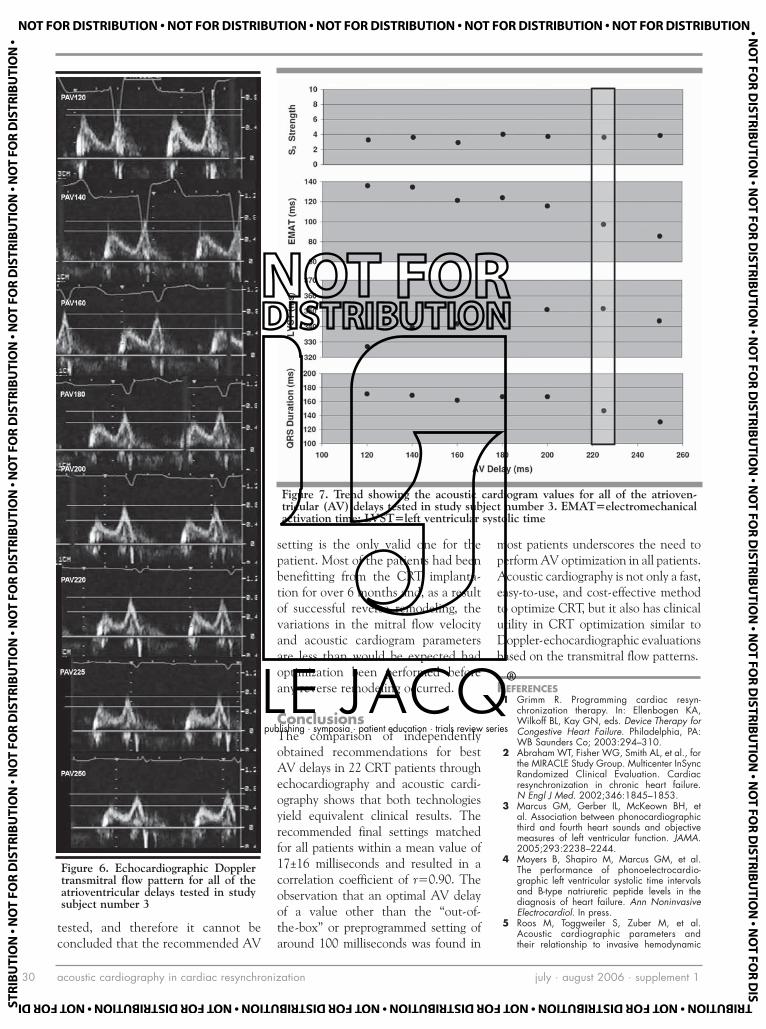
acoustic cardiography in cardiac resynchronization july . august 2006 . supplement 130
tested, and therefore it cannot be concluded that the recommended AV
setting is the only valid one for the patient. Most of the patients had been benefitting from the CRT implanta-tion for over 6 months and, as a result of successful reverse remodeling, the variations in the mitral flow velocity and acoustic cardiogram parameters are less than would be expected had optimization been performed before any reverse remodeling occurred.
ConclusionsThe comparison of independently obtained recommendations for best AV delays in 22 CRT patients through echocardiography and acoustic cardi-ography shows that both technologies yield equivalent clinical results. The recommended final settings matched for all patients within a mean value of 17±16 milliseconds and resulted in a correlation coefficient of r=0.90. The observation that an optimal AV delay of a value other than the “out-of-the-box” or preprogrammed setting of around 100 milliseconds was found in
most patients underscores the need to perform AV optimization in all patients. Acoustic cardiography is not only a fast, easy-to-use, and cost-effective method to optimize CRT, but it also has clinical utility in CRT optimization similar to Doppler-echocardiographic evaluations based on the transmitral flow patterns.
REFERENCES 1 Grimm R. Programming cardiac resyn-
chronization therapy. In: Ellenbogen KA, Wilkoff BL, Kay GN, eds. Device Therapy for Congestive Heart Failure. Philadelphia, PA: WB Saunders Co; 2003:294–310.
2 Abraham WT, Fisher WG, Smith AL, et al., for the MIRACLE Study Group. Multicenter InSync Randomized Clinical Evaluation. Cardiac resynchronization in chronic heart failure. N Engl J Med. 2002;346:1845–1853.
3 Marcus GM, Gerber IL, McKeown BH, et al. Association between phonocardiographic third and fourth heart sounds and objective measures of left ventricular function. JAMA. 2005;293:2238–2244.
4 Moyers B, Shapiro M, Marcus GM, et al. The performance of phonoelectrocardio-graphic left ventricular systolic time intervals and B-type natriuretic peptide levels in the diagnosis of heart failure. Ann Noninvasive Electrocardiol. In press.
5 Roos M, Toggweiler S, Zuber M, et al. Acoustic cardiographic parameters and their relationship to invasive hemodynamic
Figure 6. Echocardiographic Doppler transmitral flow pattern for all of the atrioventricular delays tested in study subject number 3
Figure 7. Trend showing the acoustic cardiogram values for all of the atrioven-tricular (AV) delays tested in study subject number 3. EMAT=electromechanical activation time; LVST=left ventricular systolic time
publishing . symposia . patient education . trials review series
®

acoustic cardiography in cardiac resynchronization july . august 2006 . supplement 1 31
measurements in patients with left ventricu-lar systolic dysfunction. Congest Heart Fail. 2006;12(4 suppl 1)19–24.
6 Zuber M, Kipfer P, Attenhofer Jost C. Systolic dysfunction: correlation of acoustic cardiogra-phy with Doppler echocardiography. Congest Heart Fail. 2006;12(4 suppl 1):14–18.
7 Ommen SR, Nishimura RA. A clinical approach to the assessment of left ventricu-lar function by Doppler echocardiography: update 2003. Heart. 2003;89(suppl III):iii18–iii23.
8 Ellenbogen K, Saxon L. Clinical trials of resynchronization therapy. In: Ellenbogen KA,
Wilkoff BL, Kay GN, eds. Device Therapy for Congestive Heart Failure. Philadelphia, PA: WB Saunders Co; 2003:47–91.
9 Shah SJ, Michaels AD. Hemodynamic cor-relates of the third heart sound and systolic time intervals. Congest Heart Fail. 2006;12(4 suppl 1):8–13.
publishing . symposia . patient education . trials review series
®

clinical and economic advantages of AUDICOR S3 detection in HF care july . august 2006 . supplement 132
www.lejacq.com ID:5772
W. Frank Peacock, MD;1 Alex Harrison, MD;2 Donald Moffa, MD1
From the Department of Emergency Medicine, Cleveland Clinic, Cleveland, OH;1 and the Division of Cardiology, Department of Medicine, University of California, Irvine Medical Center, Orange, CA2
Address for correspondence: Alex Harrison, MD, Division of Cardiology, Department of Medicine, University of California, Irvine, 101 The City Drive, Building 53, Route 81, Room 100, Orange, CA 92868-4080E-mail: [email protected]
Patients presenting to the emergen-cy department (ED) with undiffer-
entiated dyspnea represent a challeng-ing diagnostic dilemma. Because heart failure (HF) occurs most frequently in the elderly, a population with many simultaneous comorbidities, it can be a difficult diagnosis. And, since its most common presentation is dyspnea, a symptom that is common to many diseases, misdiagnosis is not unusual. The diagnostic accuracy of history and physical examination for HF is often unreliable.1 Chest radiography, while helpful when demonstrating signs of congestion, is often nondiagnostic, especially in patients with an acute exacerbation of chronic HF.2–4
The introduction of B-type natri-uretic peptide (BNP) has been useful for excluding HF in acutely dyspneic ED patients, with its high sensitiv-
ity when concentrations are <100 pg/mL. However, the specificity of BNP is poor (76%) at this level.5 BNP levels become useful as a confirmatory marker of an acute HF exacerbation only when levels are >500 pg/mL, when its specificity rises above 90%.6–8 Thus, an indeterminate “gray zone” between 100–500 pg/mL exists where BNP levels are neither sufficiently sensitive to be used as a screening test, nor sufficiently specific to “rule in” HF. This may contribute to the high acute decompensated HF (ADHF) misdi-agnosis rate, estimated in the range of 10–20%.2,9,10 The addition of an S3 detected by the AUDICOR system (Inovise Medical, Inc., Portland, OR) as a second, more specific test to gray-zone BNP levels has been shown to improve accurate initial diagnosis and decision making in HF patients.11
The consequences of HF misdiag-nosis are significant and well docu-mented. The Acute Decompensated HF National Registry (ADHERE database)12,13 has collected data on more than 100,000 patient cases and has demonstrated that earlier diagno-sis and initiation of appropriate treat-ment is associated with fewer intensive care unit (ICU) admissions, shorter hospitalizations, fewer invasive proce-dures, and lower acute mortality. By emphasizing more rapid and accurate initial diagnosis of ADHF in the ED, better clinical outcomes and more economically sound delivery of health care will follow.
We sought to further elaborate on the addition of electronically detected heart sounds to the diagnostic arma-mentarium of the ED physician who treats patients with undifferentiated
O R I G I N A L P A P E R
Clinical and Economic Benefits of Using AUDICOR S3 Detection for Diagnosis and Treatment of Acute
Decompensated Heart Failure
Because many of the signs and symptoms of acute decompensated heart failure (ADHF) are nonspecific (e.g., dyspnea), accurate diagnosis can be challenging. Highly specific indicators of ADHF can assist in early and accurate diagnosis, therefore providing a potential for better outcomes and cost efficiency. Demographic, clinical, laboratory, and electroni-cally detected S3 data (Inovise Medical, Inc., Portland, OR) were collected in 340 emergency department patients with suspected ADHF. After hospital discharge, two blinded cardiologists determined whether ADHF was present. Total hospital charges were also recorded. The overall ED misdiagnosis rate was 14.0%, of which over 90% were a failure to recognize ADHF when it was present. The S3 was highly specific (94%) for ADHF and was valuable in combination with BNP values to improve the diagnostic accuracy in undifferentiated emergency department dyspenic patients. Misdiagnosed ADHF patients accrued over $2500 more in hospital charges than patients correctly diagnosed with ADHF, a 32% increase.
(CHF. 2006;12(4 suppl 1):32–36) ©2006 Le Jacq
publishing . symposia . patient education . trials review series
®

clinical and economic advantages of AUDICOR S3 detection in HF care july . august 2006 . supplement 1 33
dyspnea or other symptoms sugges-tive of HF. We hypothesized that the electronic detection of heart sounds would improve diagnostic accuracy for ADHF, especially in diagnostically challenging subgroups, and wanted to assess the fiscal impact of inaccurate initial HF diagnoses.
MethodsStudy Design and Setting. Between September 2003 and June 2004, a prospective convenience sample was obtained in 340 patients who present-ed with signs or symptoms of decom-pensated HF at four EDs. Detailed methods and descriptions of the analy-sis have been previously reported.11,14 Subjects were evaluated for potential participation if they were older than 18, had an electrocardiogram (ECG) ordered, and had signs or symptoms of ADHF (dyspnea, extremity edema, fatigue). Subjects were excluded if more than 1 hour had passed since they had received vasodilators or diuretics for ADHF. All subjects gave written informed consent, and the Institutional Review Board approved the study at all enrolling hospitals.
Methods of Measurement. The meth-ods of measurement are the same as those in our previous work11,14 and are explained as follows. After study enroll-ment, clinical study assistants (CSAs) collected demographic data, past medi-cal history, and electronic heart sound data using the AUDICOR device. The treating physician, blinded to electron-ic heart sound data, documented the presence or absence of jugular venous distension, lower extremity edema, and an S3 detected by auscultation before receiving laboratory and radi-ology results. Chest radiography (as interpreted by radiology staff), labora-tory variables, BNP levels, automat-ed ECG results, in-hospital data, and in-hospital events were collected by chart review. A study nurse, blinded to AUDICOR results, performed the chart review using a standardized data collection form with predetermined data definitions. CSAs obtained 30-day
follow-up by telephone interview. The Social Security Administration’s Death Master File online service and medical records were reviewed for all patients. All clinical data were double entered into an electronic database for subse-quent analysis.
The presence of an S3 was deter-mined using the AUDICOR system, an acoustic cardiogram that replaces the standard V3 and V4 leads with sensors for collecting both sound and electrical data. Sound data from both leads are analyzed using a signal-pro-cessing algorithm to detect the S3. The algorithm has been validated by comparison to blinded consensus over heart sound tracings read by expert phonocardiographers and in clinical studies comparing the algorithm to hemodynamic measurements obtained during left heart catheterization.15,16 For study purposes, the AUDICOR sensors were placed on subjects by a trained CSA. Acoustic cardiographic data were collected for a 10-sec time period, saved to a compact disc, and shipped to Inovise Medical, Inc. for processing. Raw data were supplied to allow for signal processing using the most updated algorithm. The presence or absence of an S3 was recorded in an electronic spreadsheet (Microsoft Excel, Microsoft Corporation, Redmond, WA) and subsequently linked to the clinical data for analysis.
Methods for Cost Analysis. The CSAs obtained the total hospital charges for each subject’s hospital stay from the hospital billing depart-ment. In addition, the final discharge diagnosis-related group (DRG) coded was obtained from the coding depart-ment for each subject. This allowed a cost analysis based on the presence or absence of an accurate initial ED diagnosis and an assessment of any consequent fiscal outcomes.
Criterion Standard for HF. The cri-terion standard for ADHF is the same as that stated in our previous work11,14 and is explained as follows. On com-pletion of all data collection, and 9
months after the final patient follow-up was completed, the entire medical record for each enrolled patient was copied. The records were reviewed by CSAs to remove all heart sound data and BNP values. Then, two board-prepared cardiologists reviewed all the available documentation to determine the patient’s HF status during their acute ED presentation. HF status was defined as HF present (primary HF) and non-HF (non-HF). Primary HF was defined as ADHF. Non-HF was determined to occur when a patient was judged not to have HF or to have a medical history of HF, but to be well compensated at presentation. If the cardiologist’s reviews were discordant, the diagnosis was adjudicated by the principal investigator.
Primary Data Analysis. Data are described using median and range for continuous data and frequencies and percents for categoric data. Measures of diagnostic accuracy (sensitivity, specificity, and likelihood ratios [LRs]) are reported with 95% confidence intervals. Positive LRs were calculated by positive LR = sensitivity / (1-speci-ficity) = (true positive / (true positive + false negative) / (false positive / (false positive + true negative).
Subgroup Analysis. Analysis was also performed on various subgroups. The entire dataset was divided into three challenging subgroups based on clini-cally relevant diagnostic and risk strati-fication parameters. Group 1 consisted of subjects who were misdiagnosed as non-HF by ED physicians but were later determined by the cardiologist panel to have ADHF. Group 2 con-sisted of subjects having a BNP value <500 pg/mL and at least one of the following: no history of HF, history of chronic obstructive pulmonary disease (COPD), prior ejection fraction (EF) >40%, or no prior admissions for HF. Group 3 was defined as patients who, irrespective of BNP values, had at least one of the following: no history of HF, history of COPD, prior EF >40%, or no prior admissions for HF. Finally, data
publishing . symposia . patient education . trials review series
®
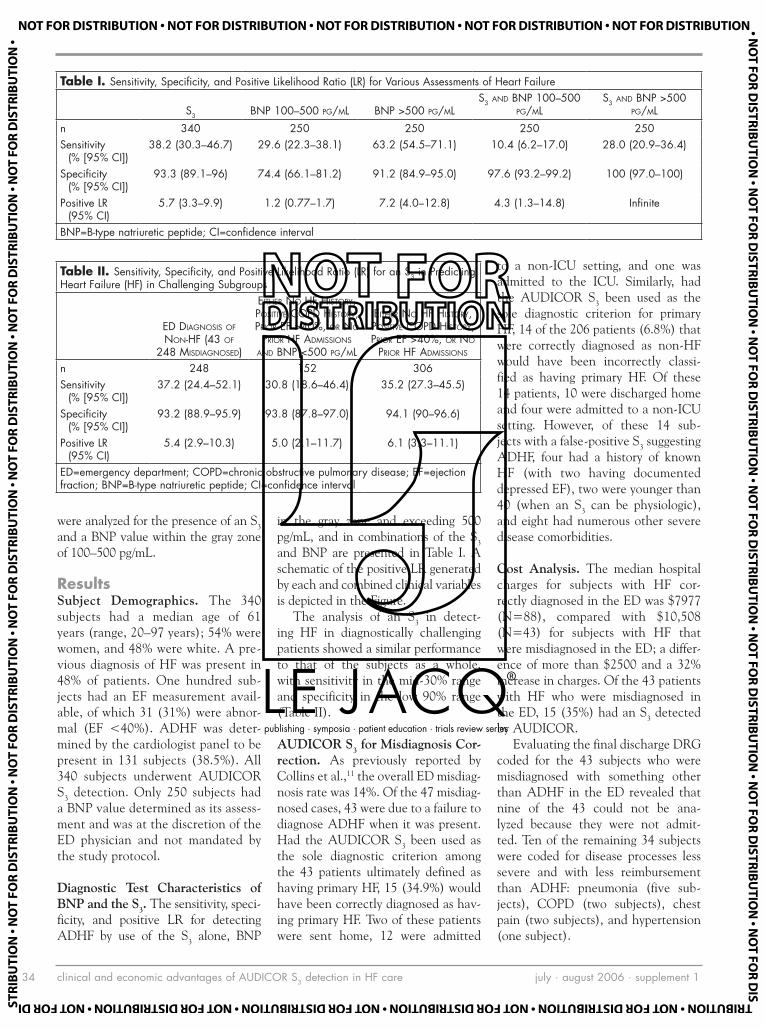
clinical and economic advantages of AUDICOR S3 detection in HF care july . august 2006 . supplement 134
were analyzed for the presence of an S3 and a BNP value within the gray zone of 100–500 pg/mL.
ResultsSubject Demographics. The 340 subjects had a median age of 61 years (range, 20–97 years); 54% were women, and 48% were white. A pre-vious diagnosis of HF was present in 48% of patients. One hundred sub-jects had an EF measurement avail-able, of which 31 (31%) were abnor-mal (EF <40%). ADHF was deter-mined by the cardiologist panel to be present in 131 subjects (38.5%). All 340 subjects underwent AUDICOR S3 detection. Only 250 subjects had a BNP value determined as its assess-ment and was at the discretion of the ED physician and not mandated by the study protocol.
Diagnostic Test Characteristics of BNP and the S3. The sensitivity, speci-ficity, and positive LR for detecting ADHF by use of the S3 alone, BNP
in the gray zone and exceeding 500 pg/mL, and in combinations of the S3 and BNP are presented in Table I. A schematic of the positive LR generated by each and combined clinical variables is depicted in the Figure.
The analysis of an S3 in detect-ing HF in diagnostically challenging patients showed a similar performance to that of the subjects as a whole, with sensitivity in the mid-30% range and specificity in the low 90% range (Table II).
AUDICOR S3 for Misdiagnosis Cor-rection. As previously reported by Collins et al.,11 the overall ED misdiag-nosis rate was 14%. Of the 47 misdiag-nosed cases, 43 were due to a failure to diagnose ADHF when it was present. Had the AUDICOR S3 been used as the sole diagnostic criterion among the 43 patients ultimately defined as having primary HF, 15 (34.9%) would have been correctly diagnosed as hav-ing primary HF. Two of these patients were sent home, 12 were admitted
to a non-ICU setting, and one was admitted to the ICU. Similarly, had the AUDICOR S3 been used as the sole diagnostic criterion for primary HF, 14 of the 206 patients (6.8%) that were correctly diagnosed as non-HF would have been incorrectly classi-fied as having primary HF. Of these 14 patients, 10 were discharged home and four were admitted to a non-ICU setting. However, of these 14 sub-jects with a false-positive S3 suggesting ADHF, four had a history of known HF (with two having documented depressed EF), two were younger than 40 (when an S3 can be physiologic), and eight had numerous other severe disease comorbidities.
Cost Analysis. The median hospital charges for subjects with HF cor-rectly diagnosed in the ED was $7977 (N=88), compared with $10,508 (N=43) for subjects with HF that were misdiagnosed in the ED; a differ-ence of more than $2500 and a 32% increase in charges. Of the 43 patients with HF who were misdiagnosed in the ED, 15 (35%) had an S3 detected by AUDICOR.
Evaluating the final discharge DRG coded for the 43 subjects who were misdiagnosed with something other than ADHF in the ED revealed that nine of the 43 could not be ana-lyzed because they were not admit-ted. Ten of the remaining 34 subjects were coded for disease processes less severe and with less reimbursement than ADHF: pneumonia (five sub-jects), COPD (two subjects), chest pain (two subjects), and hypertension (one subject).
Table I. Sensitivity, Specificity, and Positive Likelihood Ratio (LR) for Various Assessments of Heart Failure
S3 BNP 100–500 PG/ML BNP >500 PG/MLS3 AND BNP 100–500
PG/MLS3 AND BNP >500
PG/MLn 340 250 250 250 250Sensitivity
(% [95% CI])38.2 (30.3–46.7) 29.6 (22.3–38.1) 63.2 (54.5–71.1) 10.4 (6.2–17.0) 28.0 (20.9–36.4)
Specificity (% [95% CI])
93.3 (89.1–96) 74.4 (66.1–81.2) 91.2 (84.9–95.0) 97.6 (93.2–99.2) 100 (97.0–100)
Positive LR (95% CI)
5.7 (3.3–9.9) 1.2 (0.77–1.7) 7.2 (4.0–12.8) 4.3 (1.3–14.8) Infinite
BNP=B-type natriuretic peptide; CI=confidence interval
Table II. Sensitivity, Specificity, and Positive Likelihood Ratio (LR) for an S3 in Predicting Heart Failure (HF) in Challenging Subgroups
ED DIAGNOSIS OF NON-HF (43 OF
248 MISDIAGNOSED)
EITHER NO HF HISTORY, POSITIVE COPD HISTORY, PRIOR EF >40%, OR NO
PRIOR HF ADMISSIONS AND BNP <500 PG/ML
EITHER NO HF HISTORY, POSITIVE COPD HISTORY, PRIOR EF >40%, OR NO
PRIOR HF ADMISSIONS
n 248 152 306Sensitivity
(% [95% CI])37.2 (24.4–52.1) 30.8 (18.6–46.4) 35.2 (27.3–45.5)
Specificity (% [95% CI])
93.2 (88.9–95.9) 93.8 (87.8–97.0) 94.1 (90–96.6)
Positive LR (95% CI)
5.4 (2.9–10.3) 5.0 (2.1–11.7) 6.1 (3.3–11.1)
ED=emergency department; COPD=chronic obstructive pulmonary disease; EF=ejection fraction; BNP=B-type natriuretic peptide; CI=confidence interval
publishing . symposia . patient education . trials review series
®

clinical and economic advantages of AUDICOR S3 detection in HF care july . august 2006 . supplement 1 35
DiscussionThis study corroborates the results of previous analyses showing that the presence of an S3 is highly specific for ADHF.11,14,16 One could propose, given the >93% specificity of an S3 for ADHF, that when an S3 is detected in an ED patient with signs and symptoms of decompensated HF, very little further diagnostic testing may be required before treatment can be initiated. This is espe-cially true if a BNP level exceeds 500 pg/mL, since the positive LR for ADHF with this combination (S3 and BNP >500 pg/mL) was infinite. Our findings suggest that the high specificity of the AUDICOR S3 alone is a useful adjunct and is complementary to BNP measure-ment. While indeterminate BNP levels (100–500 pg/mL) had a poor positive LR for predicting ADHF (1.2; 95% confidence interval, 0.77–1.73), the presence of an AUDICOR S3 in these subjects increased the positive LR to 4.3 (95% confidence interval, 1.3–14.8).
Highly specific tests are useful because their positive LRs and posi-tive predictive values help “rule in” specific diagnoses. The high specificity of the AUDICOR S3 can be helpful to diagnose HF when it is suspected in acutely dyspneic ED patients. Among the subjects who had an ED misdiag-nosis and were subsequently found to have presented with ADHF, over one third could have been appropriately diagnosed and treated in the ED had an AUDICOR S3 been utilized. This should be balanced, however, given the approximately 7% false-positive rate observed, and each case should be analyzed individually within the clinical context.
Of particular clinical relevance is the fact that the strong specificity of an AUDICOR S3 to predict ADHF persisted in the challenging diagnostic subgroups. Some have postulated that an S3 is present only in severe cases of ADHF where the clinical signs and symptoms of HF are already apparent. This was not the case in our study. Of the 43 missed diagnoses of ADHF in the ED, 15 (35%) had an S3 present. These cases were sufficiently subtle
or complicated such that the correct diagnosis of ADHF went unrecognized in the ED. In addition, an S3 proved highly specific and useful in diagnos-ing ADHF in subjects who had either no prior history of HF, had a history of COPD, had a prior EF >40%, or had no previous admissions for HF, and an indeterminate BNP of <500 pg/mL. It is also important to note the positive LR of an S3 alone (5.7) in detecting ADHF, because in real-time, an AUDICOR-detected S3 will likely become known 60 minutes before a BNP result can return, even under optimal circumstances. It has been demonstrated in large clinical trials that the average turn-around time for laboratory tests in the ED is 63 minutes for point-of-care platforms and 116 minutes for centrally processed labora-tory tests.17 This positive LR for an S3 alone could allow physicians an early and more accurate diagnosis of ADHF to allow for initiation of appropriate treatment. In doing so, the earlier diagnosis and initiation of appropriate treatment may provide the opportu-nity for better clinical outcomes and more cost-efficient care.12,13
Examining the fiscal impact of a misdiagnosis of ADHF in the ED suggests opportunities for improved
accuracy. Hospital charges for those incorrectly diagnosed as having non-primary HF (most often pneumonia or COPD), when they actually pre-sented with ADHF, were significantly higher than those who were correctly diagnosed with ADHF; $10,508 vs. $7977, respectively. This difference of more than $2500 represents a 32% increase in charges. The difference in cost becomes magnified when one considers that the national average reimbursement for the HF DRG is approximately $5000, thus making the missed diagnosis a near doubling of the fiscal loss for the hospital.
In addition, the assessment of the final discharge DRG in the misdiag-nosed HF patients revealed that 10 of 34 (29.4%) were incorrectly labeled and undercoded. The 10 miscoded subjects, who were later determined to have origi-nally presented with ADHF, were coded for less severe diagnoses. Misdiagnoses included pneumonia, COPD, chest pain, and hypertension, which have national reimbursement rates of roughly $4900, $4100, $2350, and $2600, respectively. This creates a potential scenario where even greater fiscal losses accrue for a hospital since these misdiagnoses rep-resent a functional down-coding of the HF population.
Figure. Positive likelihood ratio (LR) for primary acute decompensated heart failure (ADHF) generated by each and combined clinical variables. BNP=B-type natriuretic peptide (pg/mL)
publishing . symposia . patient education . trials review series
®

clinical and economic advantages of AUDICOR S3 detection in HF care july . august 2006 . supplement 136
LimitationsThe limitations of this study are simi-lar to those reported in our previ-ous work.11,14 This study enrolled an observational cohort of patients with signs or symptoms of HF. We are only able to report the test characteristics of heart sounds in patients that are representative of our sampling. There is a possibility that, due to selection bias, the true test characteristics of abnormal heart sounds in ED patients with primary HF are different than those we have reported.
Work-up bias could also be present; patients who were considered low-risk based on initial signs and symptoms may have had fewer subsequent tests.
This lack of testing could have result-ed in a missed diagnosis of primary HF. Furthermore, those patients who were considered too unstable to consent and be enrolled by the treating phy-sician may have had different heart sound test characteristics. However, increased severity of illness, likely due to worse underlying HF, would have likely increased the yield of our test characteristics since previous work has demonstrated the high specificity for detecting elevated left ventricular end-diastolic pressure.16
ConclusionsOur findings suggest that an S3 is highly specific for ADHF. The high specificity
and positive LR of an S3 may allow phy-sicians to make an early and accurate diagnosis of ADHF so that appropriate therapy can be instituted in a timely manner. Furthermore, the use of the highly specific S3 appears to be ideally suited for use in combination with BNP to improve diagnostic accuracy in ED patients with undifferentiated dyspnea. In this analysis, the S3 proved highly specific for diagnosing ADHF even in challenging subsets of patients. There is a demonstrable clinical benefit for increased accuracy in early diagnosis of ADHF, and it appears that there is also a significant fiscal penalty for inaccu-rate initial diagnosis that misses ADHF when it is present.
REFERENCES 1 Stevenson LW, Perloff JK. The limited reli-
ability of physical signs for estimating hemo-dynamics in chronic heart failure. JAMA. 1989;261:884–888.
2 Collins SP, Lindsell CJ, Storrow AB, et al., ADHERE Scientific Advisory Committee, Investigators and Study Group. Prevalence of negative chest radiography in the emergency department patient with decompensated heart failure. Ann Emerg Med. 2006;47:13–18.
3 Mahdyoon H, Klein R, Eyler W, et al. Radiographic pulmonary congestion in end-stage congestive heart failure. Am J Cardiol. 1989;63:625–627.
4 Kono T, Suwa M, Hanada H, et al. Clinical sig-nificance of normal cardiac silhouette in dilat-ed cardiomyopathy—evaluation based upon echocardiography and magnetic resonance imaging. Jpn Circ J. 1992;56:359–365.
5 Maisel AS, Krishnaswamy P, Nowak RM, et al. Rapid measurement of B-type natriuretic peptide in the emergency diagnosis of heart failure. N Engl J Med. 2002;347:161–167.
6 Knudsen CW, Clopton P, Westheim A, et al. Predictors of elevated B-type natriuretic pep-tide concentrations in dyspneic patients with-out heart failure: an analysis from the breath-
ing not properly multinational study. Ann Emerg Med. 2005;45:573–580.
7 Maisel AS, Clopton P, Krishnaswamy P, et al. Impact of age, race, and sex on the ability of B-type natriuretic peptide to aid in the emer-gency diagnosis of heart failure: results from the Breathing Not Properly (BNP) multinational study. Am Heart J. 2004;147:1078–1084.
8 McCullough P, Steg PG, Aumont MC, et al. What causes elevated B-type natriuretic pep-tide in patients without heart failure? [abstract]. J Am Coll Cardiol. 2003;41:278A.
9 Dao Q, Krishnaswamy P, Kazanegra R, et al. Utility of B-type natriuretic peptide in the diagnosis of congestive heart failure in an urgent-care setting. J Am Coll Cardiol. 2001;37:379–385.
10 McCullough PA, Nowak RM, McCord J, et al. B-type natriuretic peptide and clinical judgment in emergency diagnosis of heart failure: analysis from Breathing Not Properly (BNP) Multinational Study. Circulation. 2002;106:416–422.
11 Collins SP, Lindsell CJ, Peacock WF, et al. The combined utility of an S3 heart sound and B-type natriuretic peptide levels in emergency department patients with dyspnea. J Card Fail.
2006;12:286–292. 12 Acute decompensated heart failure national
registry (ADHERE) database. Available at: http://www.adhereregistry.com. Accessed May 14, 2006.
13 Peacock WF, Emerman CL, Costanzo MR, et al. Early initiation of intravenous therapy improves heart failure outcomes: an analysis from the ADHERE registry database. Ann Emerg Med. 2003;42:S26.
14 Collins SP, Lindsell CJ, Peacock WF IV, et al. The effect of treatment on the presence of abnormal heart sounds in emergency depart-ment patients with heart failure. Am J Emerg Med. 2006;24:25–32.
15 Inovise Medical, Inc. AUDICOR-FDA. 2003;510(k) (number K031182).
16 Marcus GM, Gerber IL, McKeown BH, et al. Association between phonocardiographic third and fourth heart sounds and objective measures of left ventricular function. JAMA. 2005;293:2238–2244.
17 Peacock WF, Roe MT, Chen AY, et al. Vein-to-brain time: an emergency department quality of care marker for non-ST-segment elevation acute coronary syndrome [abstract]. Acad Emerg Med. 2004;11:569–570.
publishing . symposia . patient education . trials review series
®
case report july . august 2006 . supplement 1 37
www.lejacq.com ID:5771
Stefan Toggweiler, MD; Michel Zuber, MD; Paul Erne, MDFrom the Division of Cardiology, Kantonsspital Luzern, Lucerne, SwitzerlandAddress for correspondence: Paul Erne, MD, Head of Division of Cardiology, Kantonsspital Luzern, 6004 Luzern, SwitzerlandE-mail: [email protected]
Cardiac resynchronization therapy (CRT) improves hemodynamic
and echocardiographic parameters, symptoms, quality of life, morbidity, and mortality in patients with medi-cally refractory congestive heart fail-ure associated with a prolonged QRS duration.1–5 To fully exhaust the ben-efits of CRT, it is important to optimize atrioventricular (AV) and interven-tricular (VV) conduction delays to achieve optimal mechanical synchro-nization of the heart chambers.6 This has mainly been done using param-eters obtained by Doppler echocar-diography, but also by measuring left ventricular (LV) dP/dtmax.
7–11 However, an experienced echocardiographer and a stable patient are needed to get reproducible results. These exami-nations are time-consuming, and no standard parameter for optimization is yet available. For these and cost reasons, even today, only a minority of CRT devices are optimized after implantation. Acoustic cardiography (AUDICOR, Inovise Medical Inc., Portland, OR) has been developed to measure time intervals very precisely and with reproducible results. Due to the fact that the strength of the S3 and the electromechanical activation time (EMAT) correlate well with LV function, we used acoustic cardiog-raphy for optimizing the VV and AV delays in a patient with a biventricular pacemaker.12,13 Five weeks after this optimization, we also investigated the
effects on the Doppler echocardio-graphic parameters, B-type natriuretic protein (BNP) value, and the func-tional capacity of this patient.
Case ReportA 67-year-old man presented with New York Heart Association (NYHA) class II dyspnea and a markedly reduced ejection fraction (EF) of 28% follow-ing a prior aortic valve replacement in 2001, at which time his EF was nor-mal. The electrocardiogram showed a left bundle branch block morphol-ogy and a QRS duration of 180 mil-liseconds. Doppler echocardiography revealed a VV contraction delay of 40 milliseconds, measured as the dif-ference between the onset of the pul-monary ejection wave and the aortic ejection wave, and an intraventricular septal-posterolateral delay of 200 mil-liseconds measured with displacement imaging and autotracking (Aplio, Toshiba Medical Systems, New York, NY). There was eccentric LV hyper-trophy with an end-diastolic diameter of 67 mm (normal <60 mm) and an LV mass index of 212 g/m2 (normal <134 g/m2). The patient had known arterial hypertension, which was medi-cally well controlled. No malignant arrhythmias were induced during elec-trophysiology studies, and a biven-tricular pacemaker device (Stratos LV, BIOTRONIK, Inc., Berlin, Germany) was implanted. The coronary sinus was cannulated using an electrophysi-
ology catheter, and the optimal pos-terolateral vein could be identified and cannulated. Postimplantation, medical therapy consisted of an angio-tensin-converting enzyme inhibi-tor, a β blocker, spironolactone, loop diuretics, digoxin, and amiodarone. The patient was orally anticoagulated due to reduced LV function. Medical therapy was not changed during the observation period. There were no clinical signs of congestive heart fail-ure postimplantation.
The patient was enrolled in our CRT optimization program 5 weeks after the implantation. The AV delay was set at 120 milliseconds, and simul-taneous ventricular pacing was pro-grammed to a baseline VV setting. Rate-dependent shortening of the AV interval was turned off because the benefit of this feature has been questioned recently in biventricular pacemakers.14 During optimization and the follow-up period, the patient was in sinus rhythm. Sitting blood pressure was 93/70 mm Hg. Cardiac examination showed no clinical signs of congestive heart failure. After the baseline programming, the patient was sent home for 6 weeks. Eleven weeks postimplantation, the patient’s CRT device was optimized using acous-tic cardiography (AUDICOR tech-nology). The acoustic cardiography data were obtained using AUDICOR sensors attached to the V3 and V4 positions. For each CRT AV and VV
C A S E R E P O R T
Optimization of Atrioventricular and Interventricular Delay With Acoustic Cardiography in Biventricular Pacing
publishing . symposia . patient education . trials review series
®

case report july . august 2006 . supplement 138
delay combination, a full AUDICOR test (10-second data recording) was recorded and analyzed, and the results were trended for interpretation. The recorded data included the presence and strength of the S3, the EMAT (the interval from the onset of the Q wave of the electrocardiogram to the S1), and the LV systolic time (the interval from S1 to S2). Forty-five different settings were programmed for evalua-tion using the AUDICOR data (with possible combinations of 100, 125, 150, 175, 200, 225, 250, 275, and 300 milliseconds for AV delays and RV40, RV20, 0, LV20, and LV40 millisec-onds for VV delays). Then, Doppler echocardiographic and AUDICOR data were collected for the baseline programming and intrinsic conduction without pacing. The Doppler echocar-diographic parameters are summarized in the Table.
The septal-posterolateral intraven-tricular delay was measured with new displacement imaging software with
autotracking. Displacement curves are used by integrating myocardial Doppler velocities of the medial and lateral mitral annulus, thus forming an apical four-chamber view (Aplio). A full-volume acquisition of the left ventricle (transthoracic three-dimen-sional echocardiography) was ana-lyzed offline to create global and segmental time-volume curves. A systolic dyssynchrony index was cre-ated based on the dispersion of times to minimum volume for each seg-ment (iE 33 system, Philips Medical Systems, Andover, MA). BNP was measured after a resting period of at least 1 hour and, thereafter, symp-tom-limited spiroergometry was per-formed. The patient was discharged with the optimized AV and VV delays for another 6 weeks using the lowest EMAT as a surrogate for optimal con-tractility and timing (right ventricu-lar stimulation 40 milliseconds before LV stimulation and an AV delay of 250 milliseconds). Because the
best parameter combination could not be programmed permanently in the Stratos LV, optimization was per-formed by programming a VV delay of –40 milliseconds and the highest possible AV delay of 160 millisec-onds. Seventeen weeks postimplan-tation, AUDICOR and echocardio-graphic data were taken again, BNP was measured, and symptom-limited spiroergometry was carried out.
Doppler echocardiographic data and results from the other exami-nations with intrinsic, standard, and optimized programming are shown in the Table. Maximum exercise capacity was 103 W with standard program-ming and 115 W with optimized pro-gramming. Oxygen uptake rose from 22.4 mL/min/kg to 26.9 mL/min/kg. Three-dimensional EF increased from 32% to 45%, and better synchroniza-tion was obvious just by looking at the apical four-chamber view. In addition, the BNP value decreased from 99 ng/L to 69 ng/L.
Table. Doppler Echocardiography Data and End Points With Intrinsic Conduction, Standard, and Optimized Programming*
PROGRAMMING INTRINSIC
AV 120 MS,VV 0 MS
AV 160 MS,VV –40 MS
Sitting blood pressure (mm Hg) — 93/70 109/55Functional NYHA class — II IIQRS duration (ms) 186 186 187Heart rate during echocardiography (bpm) 62 70 70dP/dt of mitral regurgitation continuous wave Doppler
spectrum (mm Hg/sec)744 800 865
VTI LVOT (cm) 11.1 14.3 12.5Emax (cm/sec) 71 66 37Amax (cm/sec) 65 58 64E/A 1.08 1.13 0.58A duration (ms) 131 100 127E deceleration time (ms) 304 193 427VV delay (ms) 141 85 28Ejection fraction (three-dimensional, %) 27 32 45End-diastolic volume (mL) 106 112 132End-systolic volume (mL) 78 77 73Tmsv 6 (ms) 335 143 35Tmsv 12 (ms) 335 474 35Exercise capacity (W) — 103 115Maximum oxygen uptake (mL/min/kg) — 22.4 26.9B-type natriuretic protein (ng/L) — 99 69AV=atrioventricular; VV=interventricular; NYHA=New York Heart Association; VTI=velocity time integral; LVOT=left ventricular outflow tract; Tmsv 6/12=time to minimal systolic volume of basal (6) and basal/midventricular segments (12) in three-dimensional echocardiography volume. *Both biventricular stimulation settings were programmed 6 weeks before measuring all data, whereas for intrinsic values, the pacemaker was set to VVI with a base rate of 30 bpm just before examination.
publishing . symposia . patient education . trials review series
®

case report july . august 2006 . supplement 1 39
DiscussionEncouraging studies comparing AUDICOR data with invasive mea-surements obtained during LV cath-eterization indicate that EMAT cor-relates with dP/dtmax in subjects with signs of dyssynchrony (i.e., wide QRS complexes) and LV systolic time cor-relates with EF.15 Thus, EMAT was used as a primary parameter to deter-mine the best AV/VV delay combina-tion (Figure). The hypothesis that minimizing EMAT might be beneficial is supported by the work of Jansen and colleagues,16 which showed that the time to onset of systolic velocity measured with tissue Doppler imaging might be a better parameter to predict reverse remodeling than the time to peak velocity. In this case, we were able to achieve a better hemodynamic state through optimized program-ming, and exercise capacity, maximum oxygen uptake, and ejection fraction were improved by achieving better synchronization. Also, the BNP level decreased, indicating lower filling pres-sure after optimized delays, although the patients remained in NYHA class II before pacemaker implantation and throughout the entire observation period. The relatively low BNP value (<100 ng/L) before delay optimiza-tion documents the optimal medical therapy in these patients.17 Therefore, this case report also underlines that clinical judgment alone is not suf-ficient for evaluating the effects of synchronization therapy.
In comparison with Doppler echocar-diography, optimization of biventricular pacing seems to be achievable through
the fast and easy use of acoustic cardi-ography (AUDICOR device), yielding results that are easy to interpret, and importantly, independent of the person operating the device. This case report indicates the potential of this new acous-tic cardiography approach to optimizing biventricular pacemakers for heart fail-ure therapy. However, there might be a remodeling process following not just
CRT implantation, but also changes to the AV and VV interval programming. We therefore suggest waiting several weeks before carrying out exercise tests after optimizing AV and VV delays.
Acknowledgment: We acknowledge the assistance of Dr. Peter Bauer, Inovise Medical, Inc., Portland, OR, for data analysis support.
Figure. Schematic of acoustic cardiography and left ventricular pressure tracings for a normal patient and a heart failure patient showing a phonocardiographic S3, an increased electromechanical activation time (EMAT) (Q–S1), reduced left ventricular systolic time (LVST) (S1–S2), and a higher left ventricular diastolic pressure. ECG=electrocardiogram; Ao=aorta; LA=left atrium; LV=left ventricle; PEP=pre-ejection period; LVET=left ventricular ejection time; IVCT=isovolumic contraction time; IVRT=isovolumic relaxation time
REFERENCES 1 Cleland JG, Daubert JC, Erdmann E, et al.,
the Cardiac Resynchronization-Heart Failure (CARE-HF) Study Investigators. The effect of cardiac resynchronization on morbidity and mortality in heart failure. N Engl J Med. 2005;352:1539–1549.
2 Abraham WT, Fisher WG, Smith AL, et al. Cardiac resynchronization in chronic heart fail-ure. N Engl J Med. 2002;346:1845–1853.
3 Cazeau S, Leclercq C, Lavergne T, et al. Effects of multisite biventricular pacing in patients with heart failure and intraven-tricular conduction delay. N Engl J Med. 2001;344:873–880.
4 Auricchio A, Stellbrink C, Block M, et al. Effect of pacing chamber and atrioven-
tricular delay on acute systolic function of paced patients with congestive heart failure. The Pacing Therapies for Congestive Heart Failure Study Group. The Guidant Congestive Heart Failure Research Group. Circulation. 1999;99:2993–3001.
5 Auricchio A, Stellbrink C, Sack S, et al. Long-term clinical effect of hemodynamically optimized cardiac resynchronization therapy in patients with heart failure and ventricu-lar conduction delay. J Am Coll Cardiol. 2002;39:2026–2033.
6 Abraham WT, Fisher WG, Smith AL, et al., MIRACLE Study Group. Multicenter InSync Randomized Clinical Evaluation. Cardiac resynchronization in chronic heart failure. N
Engl J Med. 2002;346:1845–1853. 7 Sawhney NS, Waggoner AD, Garhwal S,
et al. Randomized prospective trial of atrio-ventricular delay programming for cardiac resynchronization therapy. Heart Rhythm. 2004;1:562–567.
8 Sogaard P, Egeblad H, Pedersen AK, et al. Sequential versus simultaneous biventricular resynchronization for severe heart failure: eval-uation by tissue Doppler imaging. Circulation. 2002;106:2078–2084.
9 Meluzin J, Novak M, Mullerova J, et al. A fast and simple echocardiographic method of determination of the optimal atrioventricular delay in patients after biventricular stimulation. Pacing Clin Electrophysiol. 2004;27:58–64.
publishing . symposia . patient education . trials review series
®

case report july . august 2006 . supplement 140
10 Cristina Porciani M, Fantini F, Musilli N, et al. A perspective on atrioventricular delay optimization in patients with a dual cham-ber pacemaker. Pacing Clin Electrophysiol. 2004;27:333–338.
11 van Gelder BM, Bracke FA, Meijer A, et al. Effect of optimizing the VV interval on left ven-tricular contractility in cardiac resynchronization therapy. Am J Cardiol. 2004;93:1500–1503.
12 Marcus GM, Gerber IL, McKeown BH, et al. Association between phonocardiographic third and fourth heart sounds and objective measures of left ventricular function. JAMA. 2005;293:2238–2244.
13 Moyers B, Shapiro M, Marcus GM, et al. The performance of phonoelectrocardio-graphic left ventricular systolic time intervals and B-type natriuretic peptide: levels in the diagnosis of heart failure. Ann Noninvasive Electrocardiol. In press.
14 Scharf C, Li P, Muntwyler J, et al. Rate-dependent AV delay optimization in car-diac resynchronization therapy. Pacing Clin Electrophysiol. 2005;28:279–284.
15 Roos M, Toggweiler S, Zuber M, et al. Acoustic cardiographic parameters and their relationship to invasive hemodynamic mea-surements in patients with left ventricular
systolic dysfunction. Congest Heart Fail. 2006;12(4 suppl 1):19–24.
16 Jansen AH, Bracke F, van Dantzig JM, et al. Optimization of pulsed wave tissue Doppler to predict left ventricular reverse remodeling after cardiac resynchronization therapy. J Am Soc Echocardiogr. 2006;19:185–191.
17 Toda N, Ishikawa T, Nozawa N, et al. Doppler index and plasma level of atrial natriuretic hormone are improved by opti-mizing atrioventricular delay in atrioven-tricular block patients with implanted DDD pacemakers. Pacing Clin Electrophysiol. 2001;24:1660–1663.
publishing . symposia . patient education . trials review series
®

case report july . august 2006 . supplement 1 41
www.lejacq.com ID:5773
W. Frank Peacock, MDFrom the Department of Emergency Medicine, The Cleveland Clinic Foundation, Cleveland, OHAddress for correspondence: W. Frank Peacock, MD, Department of Emergency Medicine (E19), The Cleveland Clinic Foundation, 9500 Euclid Avenue, Cleveland, OH 44195E-mail: [email protected]
The prevalence of heart failure (HF) is increasing as the US population ages
and large numbers of patients with acute HF present to the emergency depart-ment (ED) each year.1,2 Despite the array of diagnostic tests available to phy-sicians, as many as 18% of ED patients with acute HF are misdiagnosed.3,4 When HF coexists with diseases such as chronic obstructive pulmonary disease (COPD) or pneumonia, its diagnosis is missed in the prehospital environment in as many as 46% of patients.5 The prompt and accurate detection of HF is important because the early provision of appropriate treatment significantly reduces mortality and the duration and cost of hospitalization.6,7
B-type natriuretic peptide (BNP) is often used to evaluate patients with possible HF, but its lack of specificity in commonly encountered ranges of values has limited its diagnostic use-fulness.8 To improve the diagnosis of acute and chronic HF, Inovise Medical, Inc. (Portland, OR) has developed the AUDICOR test. This is a system that records, stores, displays, and algorith-mically interprets simultaneous digi-tal electrocardiography (ECG) and sound. The device records both the cardiographic and acoustic data and the S3 with the assistance of propri-etary dual-purpose sensors placed in the V3 and V4 positions. Previous work has shown that data from acoustic cardiograms are highly specific for the hemodynamic abnormalities known to be associated with HF.9
This case study illustrates how data from an acoustic cardiogram can improve the ability to detect HF in the presence of multiple possible causes of dyspnea.
Case DescriptionA 75-year-old obese African-American woman with a remote and recent his-tory of cigarette smoking, chronic atri-al fibrillation, coronary artery disease including previous coronary bypass surgery, type 2 diabetes mellitus, and systemic and pulmonary hypertension presented to the ED of the Cleveland Clinic Foundation with increasing dyspnea and chest tightness. At the time of her presentation, the patient had been hospitalized at a subacute nursing care facility for management of an exacerbation of COPD. During this hospitalization, she was noted to have developed hemoptysis and increasing requirements for supple-mental oxygen. Consequently, she was transported to the ED for further evaluation and possible readmission to a general medicine service. Her medi-cations included albuterol, atenolol, glyburide, and prednisone.
Physical examination at the time of her evaluation revealed that she was afebrile, but tachycardic and tachy-pneic (heart rate, 101 bpm; respira-tory rate, 30 BPM; blood pressure, 130/79 mm Hg). She was in moder-ate respiratory distress and was using her accessory muscles of respiration. Examination of her lungs showed
diffuse wheezes and right-sided basilar rales. Cardiac examination revealed a rapid, irregular heart rate and a 2/6 systolic murmur but no S3 or S4 by aus-cultation. The abdominal examination was unremarkable and the extremities showed bilateral 2+ pitting edema.
Laboratory evaluation was remark-able for a white blood cell count of 24.8 and hemoglobin of 6.6. Arterial blood gases on a 40% Venturi mask revealed a PO2 of 68, an O2 saturation of 92%, and a PCO2 of 59. The BNP was 200 pg/mL. The chest x-ray showed moderate cardiomegaly, a particularly dense infiltrate in the right upper lobe, and a more diffuse infiltrative pattern possibly compatible with generalized pulmonary edema. The 12-lead ECG indicated atrial fibrillation, possible prior anteroapical myocardial infarc-tion, an indeterminate QRS axis, bor-derline low voltage, persistent precor-dial S waves, and nonspecific ST-T abnormalities. An acoustic cardiogram was obtained using the AUDICOR device, which revealed an S3.
The patient was admitted to the medical service and treated with broad-spectrum antibiotics, multiple trans-fusions, repeat doses of furosemide, corticosteroids, and bronchodilators. Despite the use of bilevel positive airway pressure and high-flow oxygen, she continued to retain CO2 and her oxygenation worsened. Despite these therapeutic efforts, the patient died in the hospital and her family declined a request to perform an autopsy.
C A S E R E P O R T
Acoustic Cardiography in the Differential Diagnosis of Dyspnea
publishing . symposia . patient education . trials review series
®
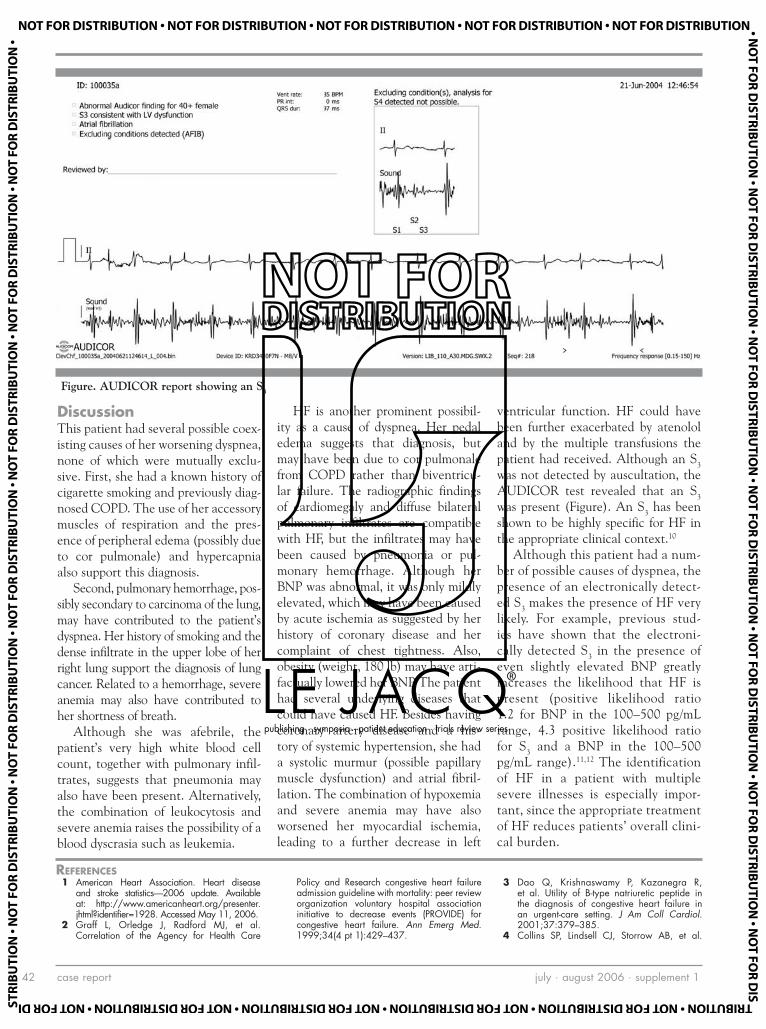
case report july . august 2006 . supplement 142
DiscussionThis patient had several possible coex-isting causes of her worsening dyspnea, none of which were mutually exclu-sive. First, she had a known history of cigarette smoking and previously diag-nosed COPD. The use of her accessory muscles of respiration and the pres-ence of peripheral edema (possibly due to cor pulmonale) and hypercapnia also support this diagnosis.
Second, pulmonary hemorrhage, pos-sibly secondary to carcinoma of the lung, may have contributed to the patient’s dyspnea. Her history of smoking and the dense infiltrate in the upper lobe of her right lung support the diagnosis of lung cancer. Related to a hemorrhage, severe anemia may also have contributed to her shortness of breath.
Although she was afebrile, the patient’s very high white blood cell count, together with pulmonary infil-trates, suggests that pneumonia may also have been present. Alternatively, the combination of leukocytosis and severe anemia raises the possibility of a blood dyscrasia such as leukemia.
HF is another prominent possibil-ity as a cause of dyspnea. Her pedal edema suggests that diagnosis, but may have been due to cor pulmonale from COPD rather than biventricu-lar failure. The radiographic findings of cardiomegaly and diffuse bilateral pulmonary infiltrates are compatible with HF, but the infiltrates may have been caused by pneumonia or pul-monary hemorrhage. Although her BNP was abnormal, it was only mildly elevated, which may have been caused by acute ischemia as suggested by her history of coronary disease and her complaint of chest tightness. Also, obesity (weight, 180 lb) may have arti-factually lowered her BNP. The patient had several underlying diseases that could have caused HF. Besides having coronary artery disease and a his-tory of systemic hypertension, she had a systolic murmur (possible papillary muscle dysfunction) and atrial fibril-lation. The combination of hypoxemia and severe anemia may have also worsened her myocardial ischemia, leading to a further decrease in left
ventricular function. HF could have been further exacerbated by atenolol and by the multiple transfusions the patient had received. Although an S3 was not detected by auscultation, the AUDICOR test revealed that an S3 was present (Figure). An S3 has been shown to be highly specific for HF in the appropriate clinical context.10
Although this patient had a num-ber of possible causes of dyspnea, the presence of an electronically detect-ed S3 makes the presence of HF very likely. For example, previous stud-ies have shown that the electroni-cally detected S3 in the presence of even slightly elevated BNP greatly increases the likelihood that HF is present (positive likelihood ratio 1.2 for BNP in the 100–500 pg/mL range, 4.3 positive likelihood ratio for S3 and a BNP in the 100–500 pg/mL range).11,12 The identification of HF in a patient with multiple severe illnesses is especially impor-tant, since the appropriate treatment of HF reduces patients’ overall clini-cal burden.
Figure. AUDICOR report showing an S3
REFERENCES 1 American Heart Association. Heart disease
and stroke statistics—2006 update. Available at: http://www.americanheart.org/presenter.jhtml?identifier=1928. Accessed May 11, 2006.
2 Graff L, Orledge J, Radford MJ, et al. Correlation of the Agency for Health Care
Policy and Research congestive heart failure admission guideline with mortality: peer review organization voluntary hospital association initiative to decrease events (PROVIDE) for congestive heart failure. Ann Emerg Med. 1999;34(4 pt 1):429–437.
3 Dao Q, Krishnaswamy P, Kazanegra R, et al. Utility of B-type natriuretic peptide in the diagnosis of congestive heart failure in an urgent-care setting. J Am Coll Cardiol. 2001;37:379–385.
4 Collins SP, Lindsell CJ, Storrow AB, et al.
publishing . symposia . patient education . trials review series
®

case report july . august 2006 . supplement 1 43
Prevalence of negative chest radiography results in the emergency department patient with decompensated heart failure. Ann Emerg Med. 2006;47:13–18.
5 Pozner CN, Levine M, Shapiro N, et al. Concordance of field and emergency depart-ment assessment in the prehospital manage-ment of patients with dyspnea. Prehosp Emerg Care. 2003;7:440–444.
6 Peacock WF, Emerman CL, Costanzo MR, et al. Early initiation of intravenous therapy improves heart failure outcomes: an analysis from the ADHERE Registry Database. Ann Emerg Med. 2003;42:S26.
7 Wuerz RC, Meador SA. Effects of prehospital medications on mortality and length of stay in congestive heart failure. Ann Emerg Med. 1992;21:669–674.
8 Mueller C, Scholer A, Laule-Kilian K, et al. Use of B-type natriuretic peptide in the evaluation and management of acute dyspnea. N Engl J Med. 2004;350:647–654.
9 Marcus GM, Gerber IL, McKeown BH, et al. Association between phonocardiographic third and fourth heart sounds and objective measures of left ventricular function. JAMA. 2005;293:2238–2244.
10 Drazner MH, Rame JE, Stevenson LW, et
al. Prognostic importance of elevated jugular venous pressure and a third heart sound in patients with heart failure. N Engl J Med. 2001;345:574–581.
11 Collins SP, Lindsell CJ, Peacock WF, et al. Combination of BNP and automated heart sounds improves heart failure diagnostic accuracy. Acad Emerg Med. 2005;12(5 suppl 1):97.
12 Peacock WF, Harrison A, Moffa D. Clinical and economic benefits of using AUDICOR S3 detection for diagnosis and treatment of acute decompensated heart failure. Congest Heart Fail. 2006;12(4 suppl 1):32–36.
publishing . symposia . patient education . trials review series
®

CME questions july . august 2006 . supplement 144
Peacock, Harrison, and Maisel (pages 2–7) 1. In the appropriate clinical setting, the detection of
an S3 is highly specific for abnormal cardiac function.
2. The majority of cardiac resynchronization therapy (CRT) devices implanted in clinical practice are optimized.
Shah and Michaels (pages 8–13) 3. The S3 occurs early in systole.
4. Abnormal systolic time intervals correlate with other markers of left ventricular (LV) dysfunction.
Zuber, Kipfer, and Jost (pages 14–18) 5. The presence of an S3 is specific, but not highly
sensitive for LV systolic dysfunction.
6. The presence of impaired relaxation in patients with LV systolic dysfunction reduces the prevalence of an S3.
Roos, Toggweiler, Zuber, et al. (pages 19–24) 7. The data in this study do not support a correlation
between acoustic cardiography and invasive hemo-dynamic data.
8. Heart rate appears to have no effect on the ability to detect an S3 in patients with LV dysfunction.
Hasan, Abraham, Quinn-Tate, et al. (pages 25–31) 9. The current standard for optimizing atrioventricu-
lar (AV) delay is analysis of the Doppler transmitral flow pattern by echocardiography.
10. The study showed poor correlation between echo-cardiography and acoustic cardiography in opti-mizing the AV delay.
Peacock, Harrison, and Moffa (pages 32–36)11. The use of acoustic cardiography to assess for the
presence of an S3 did not appear to aid in the di-agnosis of acute decompensated heart failure when combined with a clinical evaluation and B-type na-triuretic peptide (BNP) levels.
12. The accurate diagnosis of emergency department pa-tients with dyspnea appears to result in cost savings.
Toggweiler, Zuber, and Erne (pages 37–40)13. The echocardiographic parameters for interven-
tricular (VV) optimization of CRT devices are well established and standardized.
14. Electromechanical activation time obtained by acoustic cardiography may be useful in determin-ing the best AV/VV settings.
Peacock (pages 41–43)15. The misdiagnosis of emergency department pa-
tients with dyspnea rarely occurs.
16. BNP levels are both highly sensitive and specific when used to diagnose the etiology of dyspnea.
CME QuestionsTodd C. Kerwin, MD, CME Editor Winthrop Cardiology Associates, Mineola, NY
INSTRUCTIONS FOR COMPLETING THIS FORM: Read the papers and answer all the true/false questions that follow. Please place your selection on the answer grid. YOU MUST ALSO COMPLETE THE CME EVALUATION SECTION and return the form within 6 months of the papers’ publication to receive credit. Letters of credit will be mailed to participants biannually.
ACCREDITATION STATEMENT: Winthrop-University Hospital (WUH) is accredited by the Accreditation Council for Continuing Medical Education (ACCME) to sponsor continuing medical education for physicians. WUH designates this Continuing Medical Education activity for a maximum of (4) credit hours in Category 1 credit towards the AMA Physicians’ Recognition Award. Each physician should claim only those hours of credit that he/she actually spent in the educational activity. WUH relies upon faculty participants in its CME programs to provide educational information that is objective and as free of bias as possible. In this spirit, and in accordance with the guidelines of the program sponsor, faculty participants are expected to indicate any commercial relationship that might be perceived as a real or apparent conflict of interest.
EDITOR DISCLOSURES: Dr. Kerwin is on the Speaker’s Bureau for Aventis and Takeda Pharmaceuticals.
AUTHOR DISCLOSURES: Andrew D. Michaels, MD: Inovise Medical, Inc.—Unrestricted educational grant, Research grant, Speaker’s bureau; Abbott Laboratories—Research grant; Scios Inc.—Research grant. W. Frank Peacock, MD: Inovise Medical, Inc.—Research grant recipient, Advisory Board Member. William T. Abraham, MD: Amgen, Biotronik, CHF Solutions, GlaxoSmithKline, Heart Failure Society of America, Inovise Medical, Inc., National Institutes of Health, Medtronic, Inc., Myogen Inc., Orqis Medical, Otsuka Maryland Research Institute, Paracor Inc., Scios Inc.—Grants/Research support; Amgen, Astra Zeneca, Boehringer Ingelheim, CHF Solutions, GlaxoSmithKline, Guidant Corp., Medtronic Inc., Merck & Co., Inc., Pfizer, ResMed, Respironics, Scios Inc., St. Jude Medical—Consultant/Speaker’s Bureau; CardioKine, CardioKinetix Inc., CHF Solutions, Department of Veterans Affairs Cooperative Studies Program, Inovise Medical, Inc., National Institutes of Health, Savacor Inc.—Advisory Board membership; Astra Zeneca, Boehringer Ingelheim, GlaxoSmithKline, Guidant Corp., Medtronic Inc., Merck & Co., Inc., Pfizer, ResMed, Respironics, Scios Inc., St. Jude Medical—Honorarium recipient; Congestive Heart Failure, Current Cardiology Reviews, Current Heart Failure Reports, Expert Review of Cardiovascular Therapy, Journal Watch Cardiology, Pacing and Clinical Electrophysiology (PACE), The American Heart Hospital Journal, Journal of Cardiac Failure—Editorial Board involvement. Nothing to disclose: Donald Moffa, MD; Ayesha Hasan, MD; Ali M. Amkieh, MD; Peter Kipfer, MD; Christine Attenhofer Jost, MD, FESC; Michel Zuber, MD, FESC; Alan S. Maisel, MD; Peiman Jamshidi, MD; Stefan Toggweiler, MD; Paul Erne, MD; Markus Roos, MD; Alex Harrison, MD; Lei Brown, RDCS, RVT; Lori Quinn-Tate, RN, MN; Sanjiv J. Shah, MD.
OBJECTIVE AND TARGET AUDIENCE: All health care practitioners are eligible to receive credit. At the conclusion of this activity, participants should be able to: 1) summarize the important points discussed in the paper reviewed; 2) identify patients to whom the paper is relevant; 3) modify management practices as new information is learned; and 4) identify deficiencies in their knowledge base.
CME Answers are available on the Congestive Heart Failure page at www.lejacq.com
publishing . symposia . patient education . trials review series
®

Agree Disagree
1. My knowledge was enhanced by this activity. 1.__ 2.__ 3.__ 4.__ 5.__
2. The activity helped to clarify issues specific to heart failure patients. 1.__ 2.__ 3.__ 4.__ 5.__
3. The information obtained from this exercise will have an impact on my care of patients. 1.__ 2.__ 3.__ 4.__ 5.__
4. The format of the exercise was useful. 1.__ 2.__ 3.__ 4.__ 5.__
5. Suggestions for future topics:
CME Answer Grid
CME Evaluation
Please print all information.
SEND TO:Office of Academic AffairsWinthrop University Hospital259 First StreetMineola, NY 11501
Re: Acoustic cardiography and heart failure: advancing diagnosis and treatment. Congest Heart Fail. 2006;12(4 suppl 1):1–44.
Name: _____________________________________________________________________________
Address: ___________________________________________________________________________
___________________________________________________________________________________
___________________________________________________________________________________
Where to Send the Completed CME Form
1. o T o F
2. o T o F
3. o T o F
4. o T o F
5. o T o F
6. o T o F
7. o T o F
8. o T o F
9. o T o F
10. o T o F
11. o T o F
12. o T o F
13. o T o F
14. o T o F
15. o T o F
16. o T o F
This activity is sponsored by Winthrop-University Hospital and is supported by an unrestricted educational grant from Inovise Medical, Inc.
publishing . symposia . patient education . trials review series
®

publishing . symposia . patient education . trials review series
®