for-profit higher education and community...
TRANSCRIPT
National Center for Postsecondary Improvement Page 1
Thomas Bailey
Director, Community College Research Center
Teachers College, Columbia University
Norena Badway
Patricia J. Gumport
National Center for Postsecondary ImprovementStanford UniversitySchool of Education
520 Galvez Mall, 508 CERASStanford, CA 94305-3084
The work reported herein was supported in part by the Educational Research and Development Center program, agreement
number R309A60001, CFDA 84.309A, as administered by the Office of Educational Research and Improvement (OERI),
U.S. Department of Education. The findings and opinions expressed in the report do not reflect the position or policies of
OERI or the U.S. Department of Education. NCPI Technical Report Number x-xx.
For-Profit Higher
Education and
Community Colleges
National Center for Postsecondary Improvement Page 2
Acknowledgements ......................................................................................................... i
Preface ............................................................................................................................... ii
Introduction ...................................................................................................................... 1
Goals and Outline ........................................................................................................ 3
Three Arguments about the For-Profits ........................................................................ 4
For-Profit Postsecondary Education: An Historical Perspective .............................. 7
The Size, Growth, and Characteristics of For-Profit, Public, and Private Non-profitPostsecondary Institutions ......................................................................................... 9
Case Studies of a For-Profit College and Public Community Colleges ................. 16
Institutional Missions ................................................................................................ 18Selectivity in Admissions.......................................................................................... 21Curriculum Development and Faculty Role ......................................................... 22Faculty Hiring ............................................................................................................ 25Curricula and Instruction ......................................................................................... 26Course Sequencing .................................................................................................... 29Student Services ......................................................................................................... 30Flexibility and Scheduling ........................................................................................ 33Data Driven Decision making.................................................................................. 36Facilitating Transfer ................................................................................................... 37Summary .................................................................................................................... 39
Perceptions of competition .......................................................................................... 41
Conclusion: Review of the Three Arguments ............................................................ 43
The competitive threat of the for-profits ................................................................ 43Convenient, responsive, and customer oriented education46Educational Quality................................................................................................... 48
Community college and for-profit student outcomes .............................................. 50
Implications for Community Colleges and Further Research ................................ 52
References ....................................................................................................................... 58
Tables ............................................................................................................................... 61

National Center for Postsecondary Improvement Page 3
AcknowledgementsWe would like to thank the faculty, administrators, and students who gave us
their time, and information at TECH COLLEGE and the community colleges that westudied. Much of what is new and valuable in this study comes from the insights thatthey so generously shared with us.
We also want to thank Greg Kienzl for his assistance with the data analysis.Vanessa Smith Morest, Kathleen Keane, John Jennings and Tina Gridiron also helped uswith the field work. Tia Dole and Gretchen Koball gave us valuable assistance in theproduction of the report.
We presented a draft of this paper at the meeting of the NCPI Board of SeniorScholars at Stanford in March 2001 and at the American Association of CommunityCollege Convention in Chicago in April 2001 and we benefited from the reactions andideas of those who participated in those sessions. Jim Jacobs, Davis Jenkins, ChuiTsang, and Bob Zemsky read earlier drafts and their comments have significantly im-proved the work.
During his participation in the project, Thomas Bailey has been the Director ofthe Community College Research Center (CCRC) at Teachers College Columbia Univer-sity. In that capacity he has been able to draw on, for this report, material and fieldwork gathered by the Center. The CCRC is supported by a generous grant from theAlfred P. Sloan Foundation.
Finally, we want to acknowledge OERI for funding this project. The work re-ported herein is supported under the Educational Research and Development Centerprogram, agreement number R309A60001, CFDA 84.309A, as administered by the Officeof Educational Research and Improvement (OERI), U.S. Department of Education. Thefindings and opinions expressed in this report do not reflect the position or policies ofOERI or the U.S. Department of Education.
National Center for Postsecondary Improvement Page 4
PrefaceThis report presents the findings from a two-year project co-directed by Thomas
Bailey, Community College Research Center, and Patricia J. Gumport, Stanford Institutefor Higher Education Research and National Center for Postsecondary Improvement.
The purpose of the project was to develop a better understanding of how for-profits compare to public community colleges with respect to their students and pro-grams and to evaluate the extent to which the for-profit colleges compete directly withcommunity colleges. Our research strategy relied upon an exploratory design, drawingupon available national data for context and then conducting a set of comparative casestudies.
This report addresses contemporary concerns about the competitive threat fromfor-profit educational institutions, contrasts national data on for-profits with nationaldata on private non-profit and public post-secondary institutions, and examines casestudy data comparing a for-profit chain to three public community colleges located nearbranches of the chain. The data analysis suggests that for-profits have only a smallshare of enrollments in two- or four-year institutions and the for-profit share of twoyear enrollments did not grow during the middle part of the 1990s (the latest period forwhich we have data). For-profit institutions tend to have a limited range of courseofferings that have strong links to students’ skill and career aspirations. As a group, thefor-profits are concentrated in a limited number of business and technical fields. Al-though they may compete with community colleges in those specific areas, the smallsize of the for-profit sector will limit the overall competitive effect. Moreover, some ofthe four-year for-profit institutions target upper division students and actively recruitcommunity college graduates, so in this sense, these institutions are complements ratherthan competitors to community colleges. Community college leaders and staff do notperceive for-profits as a competitive threat, characterizing their missions as more com-prehensive and their curricula as broader in scope. We did find important differencesbetween the two types of institutions and the community colleges may find lessons infor-profit institutions’ emphasis on customer service, extensive support for employmentplacement, and degree completion rate.
National Center for Postsecondary Improvement Page 5
Introduction
In the last five years, the growth of for-profit educational providers has been one
of the most watched trends in higher education (Blumenstyk, 2000; Burd, 1998; Selingo,
1999; Strosnider, 1998). During the mid 1990s, public educational institutions in many
states faced increasing criticism and tight-fisted state legislatures. For example, the
share of state budgets going to higher education in general and community colleges in
particular shrunk from 12.2 percent in 1990 to 10.1 percent in 2000 (National Association
of States Budget Officers [NASBO], 2000). Like many state systems, the California pub-
lic higher education system went through a severe budget crisis early in the decade, and
while the economic recovery brought some improvements to state universities and
colleges, that improvement did not keep pace with overall economic growth.
Thus in the early years of the 21st century, as the economy faltered, public higher educa-
tion systems in many states were once again under scrutiny from public officials who
fund them. Urban systems in particular were criticized for low standards and poor
performance. The so-called Schmidt Commission (1999) in New York published a
report on the City University of New York (CUNY) in which the title clearly signaled
the conclusions—An Institution Adrift (Schmidt 1999; Klein and Orlando, 1999). Increas-
ingly, legislatures in South Carolina and Florida sought to hold public colleges to higher
standards by implementing accountability regulations that tied at least some funding to
the performance of the institution (Burke, Rosen, Minassians and Lessard, 2000). Other
states increased the reporting requirements for their public colleges as a step to encour-
age greater efficiency and accountability. Influential analysts foresee radically chang-
ing and much more competitive higher education landscape in which the traditional
established institutions are threatened by burgeoning new educational providers and
new forms of educational technologies. Thus Frank Newman, the past President of the
National Center for Postsecondary Improvement Page 6
Education Commission of the States, in an article subtitled: “The End of the Status Quo
and the Rise of the Market in Higher Education” argues that, “Competition is forcing a
hard reexamination of the purpose and effectiveness of every activity—from how well
and often faculty interact with students, to whether expenditures on student life actu-
ally create a learning community, to the issue of costs and wise use of resources.”
(Newman 2001, p. 9)
The for-profit sector is certainly not the only source of new competition in higher
education. Growing competition for research funding and the fierce battles for US New
and World Report rankings are indications of competition among the public and tradi-
tional non-profit private institutions. New technologies are also expected to play a
pivotal role. Nevertheless, the highly publicized growth of some for-profit institutions
has been an integral part of the discussions of the new educational environment and
indeed has generated growing anxiety among both private non-profit and public col-
leges and universities. The University of Phoenix, which grew from under 10,000 un-
dergraduate students in 1990 to about 45,000 in 2000 (http://www.phoenix.edu/
factbook/pg21.htm), has also been the subject of widespread media attention. (See for
example Arenson 2000, Blumenstyk 2000, Selingo 1999, Wyatt 1999, Strosnider 1998.)
Tony Zeiss (1998), the President of Piedmont Community College in Charlotte, North
Carolina, and a former President of the American Association of Community Colleges,
posed a question that identified a core concern: “Will our students become theirs?” and
he warned with some urgency that proprietary colleges “already have the jump” on
meeting the needs and expectations of a broad cross section of community college
students. A 2001 report by the Education Commission of the States (ECS) suggests
explosive growth in the sector by pointing out a 78 percent growth in the number of for-
profit two-year degree granting institutions between 1989 and 1999. In the same period,

National Center for Postsecondary Improvement Page 7
the number of for-profit four-year institutions grew by an impressive 266 percent (Kelly
2001). According to the National Center for Education Statistics (NCES) data quoted in
the ECS report, by the end of the 1990s, 28 percent of all two-year degree granting
institutions were for-profits. As we shall see, a more meaningful, in our opinion, exami-
nation of enrollment patterns presents a different picture. Nevertheless, these types of
statements are indicative of the powerful influence that the growth of the for-profits has
had on the thinking of educators and educational analysts.
Goals and Outline
Despite widespread public attention and growing anxiety in some segments of
the postsecondary enterprise, considerable confusion remains about the size and nature
of the for-profit sector: Exactly how many students are enrolled in the for-profits? How
much has that number grown? Are there differences between the types of students who
enroll in the for-profits and those found in the publics? What are the differences be-
tween the academic programs, services, and pedagogy of the for-profit colleges and
other public and private institutions of higher education? What is the relationship
between public and for-profit institutions? Is there some sense in which one type of
institution is more effective or efficient than the other? There is a growing body of
research and information on the for-profits (Kelley 2001; Moe, Bailey, and Lau 1999;
NCES 1999; The Futures Project 2000). We are building on that literature both by mak-
ing a detailed analysis of available data, especially from the Integrated Postsecondary
Education Data System (IPEDS), and through an explicit comparison between a large
and successful for-profit institution and potentially competing community colleges.
The purpose of this report is to strengthen the empirical foundation for an in-
formed discussion of the for-profit phenomenon, especially as it relates to public com-
National Center for Postsecondary Improvement Page 8
munity colleges. In order to do this, we first present three common arguments about
the for-profits and their relationship to public institutions of higher education. We then
provide some background on the history and nature of for profit higher education and
then examine the size and characteristics of the for-profit higher education sector, using
national data. In the following section, we make a detailed comparison between one
successful for-profit institution with several branches, and three community colleges
located near some of those branches. We then present conclusions including responses
to the three broad arguments that we outlined above and a discussion of student out-
comes for the two types of institutions. We end with recommendations, including
some suggestions about what community colleges can learn from the experience of the
for-profits and some ideas for additional research.
Three Arguments about the For-Profits
Three broad arguments are common in the extensive discussion of the growth of
the for-profit sector, and we use these arguments to organize our discussion of the for-
profit sector. As we have seen, one influential argument is that the for-profits are a
competitive threat to community colleges and other sectors of higher education.
According to the second, the for-profits have developed a more flexible and responsive
system of delivering post-secondary educational services, especially to adult students.
And according to the third, the for-profits provide a lower quality “training” in contrast
to broader “education” imparted by the community colleges and public and non-profit
four-year schools. We have already discussed the competitive threat argument, but we
will discuss the last two of these arguments in more detail in the following paragraphs.
This report evaluates all three arguments, focusing particularly on how they relate to
public community colleges.
National Center for Postsecondary Improvement Page 9
The for-profits provide more flexible, convenient, and responsive education
than community colleges: What is the source of the for-profits’ potential competitive
advantage? Critics of the community colleges contrast the entrepreneurial spirit of the
for-profits with the supposedly tradition-bound inflexibility of the colleges. The Uni-
versity of Phoenix, for example, appeared to have developed a more streamlined model
of education designed to cater to working adults. According to this perspective, freed
from the traditional academic schedules and even from many of the fixed costs of infra-
structure and expensive facilities, the University is able to offer courses at more conve-
nient times and in more convenient locations (for example, malls near the intersections
of interstates). Thus the for-profits are believed to have the ability to respond to market
shifts and provide services that are attuned to particular needs of a variety of students.
In addition to their flexibility, the for-profits appear to have an important advan-
tage in their access to venture capital (Ortmann, 1998). This capital would allow them
to absorb the large up-front costs needed to design courses and develop the sophisti-
cated web-based systems of distance education. How could public institutions who
have to go either to state legislatures or directly to taxpayers (through bond issues) for
their “venture capital” possibly compete?
Community colleges seem particularly vulnerable, especially in those states in
which tuition has been rising. After all, community colleges have long prided them-
selves on serving the adult, part-time and returning student, precisely that market that
the for-profits appear to be aggressively recruiting and successfully serving. Thus, in
this report we ask whether the for-profits have indeed developed a more convenient,
flexible, and consumer oriented approach to post-secondary education.
The for-profits “train” while community colleges “educate”: The current
anxiety about the potential competitive threat from for-profits would seem incompre-
National Center for Postsecondary Improvement Page 10
hensible to education analysts of the 1980s. Proprietary schools were best known to
much of the public through their advertisements on matchbook covers and subways.
The public perceived the schools as institutions set up to take advantage of public
financial assistance – offering only narrow “training” at best.
Although the best-known for-profit institutions today enjoy a much better repu-
tation, many educators still believe that the for-profits are less committed to the human-
istic educational objectives of the broader higher education enterprise. Critics of for-
profit schools suggest that McEducation turns the transmission of knowledge into just
another market transaction that can be priced like any other service, inevitably debasing
the quality of education.1 They doubt that commercial institutions that have to satisfy
stockholders can do as good a job academically as public or non-profit ones. Others
worry that profit-driven schools place all of higher education under accountability for a
singular output measure–the employability of graduates. Thus students may gain
access to short-term occupational rewards at the expense of a solid educational founda-
tion for long-term career development.
The contrast between a broad education and narrow training is a strong current
that runs through the perceptions of many of the community college faculty and admin-
istrators we interviewed for this project.2 For example, one stated that, “There’s a
difference between training and education. At community colleges, we focus on long
term goals of the AAS so students are secure for the long term.” Another said, “Propri-
etary schools exist to do some skills only. We educate much more broadly. We have a
diverse staff and most of our faculty holds doctorates. They [proprietary schools] are
arrogant if they think they can compete with us.” Thus many people continue to argue
that for-profit institutions impart a lower quality “training.”

National Center for Postsecondary Improvement Page 11
For-Profit Postsecondary Education: An Historical Perspective
The growing positive regard for some for-profit institutions contrasts to the
negative image of the proprietaries that dominated the discussion during the 1980s and
earlier. That widespread disregard and skepticism about the for-profits was probably
too negative, as some high quality for-profit schools did exist in the 1970s and 1980s.
Nevertheless, during those decades, proprietary schools operated under few constraints
in recruiting and training students. The for-profit sector burgeoned in urban areas
where low-income students could qualify for federal Pell grants and guaranteed stu-
dent loans. By the early 1990s, the majority of proprietary schools were referred to as
trade schools, preparing students for a specific craft. Of these, two-thirds offered shorter
programs that were under one year: one-third of programs were less than six months
duration and about one quarter were shorter than three months. Nearly two thirds of
proprietary schools offered training in business, marketing or cosmetology, with cosme-
tology accounting for 40 percent of all proprietary schools and 14 percent of proprietary
students (Apling, 1993).
When scandals arose over fraudulent recruiting practices, high loan default rates,
and low completion, placement and wage outcomes, Congress mandated stricter eligi-
bility requirements for institutions participating in Title IV federal student loan assis-
tance programs.3 The 1992 regulations increased the minimum length of eligible pro-
grams, decreased institutional reliance on Title IV funding sources, tightened recruiting
and admissions procedures, and established more stringent accreditation standards.
These changes resulted in an increase in what we refer to as Accredited Career
Colleges (ACC). ACCs are for-profit postsecondary schools that are accredited to award
associates, baccalaureate, masters, or doctorate degrees. They may be regionally accred-
ited, or accredited by one of two other common accrediting agencies—the Association
National Center for Postsecondary Improvement Page 12
of Independent Colleges and Schools (AICS) and the National Association of Trade and
Technical Schools (NATTS). In one sample of 2 and 4-year degree granting proprietary
schools, Bender (1991) found that just over one fifth of all ACCs were accredited by
regional accrediting agencies.4 Although the ACCs maintain an emphasis on applied
education for career preparation, they also incorporate general education into their
technical degree programs, and offer developmental education, English as a Second
Language, and at times extensive student support services. Many of these reformed
schools have come to resemble their public two- and four-year counterparts. Thus
accreditation and financial aid requirements pushed some of the for-profits to increase
offerings of degree programs that incorporated general education and improved stu-
dent services and also resulted in changing attitudes about the for-profits. Kelly (2001)
characterized this as a change from “disparagement to emulation.” Still many of the
attitudes about proprietary schools are based on influential research about the pre-1992
era (Grubb, 1993; Friedlander, 1980; Hanson and Parker, 1977; Wilms,1973, 1974, 1975;
Apling and Aleman, 1990; Lee and Merisotis, 1990).
The Size, Growth, and Characteristics of For-Profit, Public, and Private Non-profit Postsecond-
ary Institutions
In this section, we present national data on enrollments, degrees, and tuition to
provide some baseline comparison among three sectors—public, private not-for-profit,
and for-profit institutions. Each of these sectors are in turn divided among two-year
and four-year institutions. A two-year institution is one in which the associates degree
is the highest degree granted. And institutions granting both a BA and an AA would be
categorized as a four-year institution. The data are from the Integrated Postsecondary
Educational Data System (IPEDS), which is collected and maintained by the National
Center for Education Statistics (NCES). According to the NCES website, completion of
National Center for Postsecondary Improvement Page 13
an IPEDS survey is mandatory for “all institutions that participate or are applicants for
participation in any Federal financial assistance program authorized by Title IV of the
Higher Education Act of 1965, as amended.” NCES reports a 90 percent response rate
for the survey.
Institutional characteristics are displayed in Table 1. Several characteristics
revealed in these data are worth emphasizing. First, minorities, especially blacks and
Hispanics, account for a larger share of for-profit enrollments than they do in either of
the other two sectors. The 1999 NCES report on students in the for-profits also found
that blacks and Hispanics were over-represented in the for-profits. Second, women are
concentrated among the two-year, for-profits.5 This may reflect the large number of
cosmetology programs in this sector, although the accuracy of these data may be sus-
pect since many for-profits did not report data on gender. Third, most students at the
for-profits, according to these data, attend full- time. Indeed, the public two-year col-
leges—the community colleges—are by far the most important providers of education
for part-time students. Finally, the for-profits have slightly lower acceptance rates than
the public.6
Table 2 presents data on tuition and financial aid. Not surprisingly, the average
“sticker price” or the published tuition is much higher for the for-profits than for either
the two-year or four-year public institutions. The for-profit students do get more finan-
cial aid than students in public institutions, but the net tuition (published tuition minus
financial aid) is still about $4000 higher for the two-year for-profits and over $5000
higher for the four-year for-profits. It is worth noting that the private non-profits have a
higher net tuition, higher income per student, and higher levels of outside financial aid
than the for-profits.
Table 3 presents data on enrollments in two-year institutions in the three sectors

National Center for Postsecondary Improvement Page 14
(public, private non-profit, and for-profit) in the 1992-93 and 1997-98 school years. The
public community colleges are in the two-year public category. These data suggest that
the for-profit sector remains only a minor player among the two-year institutions.
Moreover, for-profit enrollments actually dropped during this five-year period and
while total enrollment among two-year institutions also fell, the for-profits accounted
for a smaller share of enrollments in 1997 than they did in 1992. It is also clear from this
table that a large majority of the students in two-year for-profit institutions are still in
schools that are not regionally accredited.
Table 4 displays similar data on public, private non-profit, and for-profit four-
year schools. Although the for-profits account for less than 2 percent of four-year en-
rollments, at least in this case, total for-profit enrollments and enrollment shares actu-
ally grew between 1992 and 1997. Moreover, in sharp contrast to the two-year for prof-
its, about 60 percent of the students in four-year for-profits are enrolled in regionally
accredited institutions.
The growth rate of the for-profits, especially the four-year for-profits, does give
the impression that the for-profits present a serious and growing competitive threat.
For example, the Education Commission of the States report (Kelley 2001) points out
that for-profit enrollment grew by 59 percent between 1989 and 1999, while enrollment
in the public institutions (both two- and four-year) grew by only 6 percent. While this is
certainly a large difference, the growth of the for-profits started from such a low base
that the 6 percent growth in the public sector enrollments actually represents a larger
number of students (600 thousand) than the total for-profit enrollment even after the
growth (366 thousand). An emphasis on the growth rate of the number of institutions is
even more misleading, since enrollment trends give such a different picture. Thus while
the for-profit share of two-year institutions grew from 19 to 28 percent during the ten
National Center for Postsecondary Improvement Page 15
years following 1989 (Kelley 2001), we have seen that the for-profit share of enrollment
among two-year institutions actually fell from 4.1 to 3.9 percent from 1993 to 1998.7
Table 5 presents data on degrees and certificates awarded by two-year institu-
tions in each of the three sectors. For example, it shows that the publics account for 87
percent of the associates and 84 percent of the sum of all associates degrees and certifi-
cates conferred by two-year institutions. This table makes clear that certificates are
much more important for the for-profits than they are for the publics. Certificates
account for 232,000 of the 662,000 degrees and certificates (35 percent—not shown in the
table) awarded by public two-year colleges, while certificates account for 57 percent of
all degrees and certificates awarded by the two-year for profits.8 Although we do not
have data from IPEDS on enrollments by degree objective, it is still useful to consider
the enrollment data from Table 3 in light of these degree data in Table 5. According to
Table 3, the for-profits account for only 3.8 percent of the total enrollments in two-year
institutions, but we know from Table 3 that the for-profits emphasize certificates more
than associates degrees. Therefore, we can conclude that the 3.8 percent for-profit
enrollment share is an overestimate of the students pursing an associates degree. In-
deed, among all two-year institutions, the for-profits enroll a very small percent of the
students pursuing an associates degree.
A comparison of data from Tables 3 and 5 can also provide a rough sense of the
percent of students enrolled in the different types of institutions who earn a credential—
the completion rate. Table 3 shows that the for-profits accounted for only 3.8 percent of
the more than 5.7 million students enrolled in all two-year institutions in the 1997-98
school year. But Table 5 indicates that the for-profits accounted for almost 13 percent of
the total degrees and certificates awarded by all two-year institutions. The for-profits
accounted for 9 percent of the associates degrees even though we argued above that
National Center for Postsecondary Improvement Page 16
they accounted for less than 3.8 percent of the students who were enrolled with the goal
of earning an AA. This suggests that completion rates for the for-profits are higher than
they are for the public community colleges. One reason may be that, as we saw in Table
1, students in the publics are much more likely to be attending part-time and part-time
students are less likely to complete degrees.
Table 6 presents data on degrees and certificates awarded by four-year colleges. It
is clear from this table that the for-profits account for a very small share of degrees
awarded by four-year institutions. In the 1997-98 school year, they accounted for only
two percent of all degrees and certificates awarded by four-year institutions, and less
than one percent of all Bachelors degrees. The most interesting information from this
table concerns the number of associates degrees awarded by the four-year for-profit
colleges. While about 12,000 students received Baccalaureate degrees from four-year
for-profit colleges, those colleges actually awarded over 13,000 associates degrees. Thus
a typical for-profit college is much more likely than their public or private non-profit
counterparts to confer both associates and bachelors degrees.
Data based on the Beginning Postsecondary Student (BPS) survey presented in
The Futures Project (2000) report on the for-profits also suggests a higher, or at least a
more rapid completion rate for both associates degrees and certificates for the for-
profits. For example, three years after enrolling in a certificates program, 31 percent of
those at a for-profit and 40 percent of those at a public institution had left without a
degree. But 54 percent of those at the for-profits and only 30 percent of those at the
publics had earned their certificate. The rest, 14 percent for the for-profits and 29 per-
cent for the publics, were either still enrolled at their first institutions or had transferred.
The data give a similar comparison of experience in associate degrees. After 3 years, 34
percent of students in both types of institutions had left school with no degree. But 40
National Center for Postsecondary Improvement Page 17
percent of the for-profit students and only 10 percent of the public students had earned
degrees. The rest, 27 percent for the for-profits and 56 percent for the publics, were still
enrolled at their first institutions or had transferred (The Futures Project 2000, Figure 8,
p. 11). As we have pointed out, a much larger percentage of the for-profit students are
full-time, and this could explain some of the faster completion rates and after a longer
time period, the public completion rates will probably partly catch up. Nevertheless,
both the IPEDS data we presented above and the BPS data presented by The Futures
Project do suggest that more for-profit than public students complete their degrees or
certificates.
What do the data presented in Tables 1-6 suggest so far about the relationship
between the for-profit sector and public community colleges? Given the widespread
discussion and anxiety about the competitive threat of the for-profits, the enrollment
numbers seem low, even if there is a significant underreporting among the for-profits.
Enrollments in two-year for-profit institutions actually fell during the middle part of the
1990s, and while enrollment in the four-year for profits did grow, it started from a very
low base. Although the University of Phoenix has attracted a great deal of attention as
its undergraduate enrollment nationwide grew to over 40,000 in 2000 (www/
phoenix.edu/factbook/ pg21.html). But Maricopa Community College District en-
rolled over 180,000 undergraduate students in credit bearing courses in Phoenix, Ari-
zona alone (http://www.maricopa.edu/information/facts.html). This was over four
times the undergraduate enrollment of the University of Phoenix in the entire country.
But before community college administrators dismiss the for-profit phenomenon as a
media-generated exaggeration, three issues deserve more attention.
The first is that the for-profit two-year institutions account for a much higher
share of completed degrees and certificates than of enrollments—this is a rough indica-
National Center for Postsecondary Improvement Page 18
tion that degree and certificate completion rates are higher among the for-profits. It is
not clear whether this higher completion rate results from lower standards, greater
initial selectivity, or better services. Table 5 indicates that the institutions that are not
regionally accredited, although they are accredited by other agencies, confer most of
these degrees and certificates. Also, a much higher share of the students in the public
two-year schools are enrolled part time, which could account for some of the difference.
Second, community college administrators and faculty argue that many students
do not come to community colleges looking for degrees. Rather they are seeking spe-
cific skills that they can learn in courses and shorter certificate programs. Whether or
not this is true, it is clear that the for-profit two-year schools are very significant players
in the market for shorter-term credentials. This suggests that students in for-profit
institutions looking for a package of skills rather than a full degree may be more likely
to leave with some formal credentials than they would if they enrolled in a public
community college.
Third, it is interesting that the four-year, for-profit sector, which grew during the
mid-1990s, confers as many associates as bachelors degrees. This may be relevant to the
ongoing discussion in the public sector about whether community colleges should
begin to offer applied bachelors degrees and whether the four-year colleges should
confer associates degrees. 9
Case Studies of a For-Profit College and Public Community Colleges
How do for-profit institutions and community colleges compare? Our discussion
will be based on a comparison between TECH COLLEGE, a for-profit college with
branches in several states and three community colleges located near at least one of
TECH’s branches.

National Center for Postsecondary Improvement Page 19
At TECH COLLEGE, we interviewed the members of senior management at the
national headquarters including the CEO, the vice president for academic affairs, and
managers responsible for curriculum development in several areas. We also visited two
campuses, interviewing the president and senior staff on each campus. We chose one
campus, in a large city, and spent three days there. We conducted eleven interviews
with administrators and faculty. We observed twelve classes, and spoke informally with
students in the cafeteria. The college provided us with documents, including cata-
logues, curriculum guides, and data on enrollments and student characteristics. The
college is regionally accredited and enjoys a strong reputation. It has experienced
significant growth over the last few years and is considered both a successful educa-
tional and business organization.
We chose to study a well-respected for-profit organization so that we could
examine the potential of for-profit higher education. Moreover, to the extent that the
operation of for-profit organizations holds lessons for community colleges, those les-
sons are most likely to be found in successful colleges. Thus TECH COLLEGE may not
be representative, and indeed we suspect that it is among the higher quality for-profit
colleges.
In order to compare this college to community colleges, we studied three colleges
that operate close to branches of TECH COLLEGE. We spent at least one day at each of
these colleges interviewing administrators, faculty, and students, and observing classes.
One of these was an urban college in a large city with an ethnically diverse enrollment
(73 percent minority enrollment ). A second was a suburban college with about 30,000
students (20 percent minority) near a large city. The third was in a smaller city and
enrolls approximately 16,000, about 32 percent of whom are minority students (US
Department of Eudcation, 1999) We chose these colleges both because they operated in

National Center for Postsecondary Improvement Page 20
the same markets as the TECH COLLEGE branches, and because they varied in the size
and the make-up of their enrollments. In addition to information from these three
comparison colleges, we draw on our knowledge accumulated from research and tech-
nical assistance conducted by the authors over the last five years at over 50 community
colleges in more than two dozen states.
This section of the report is organized to contrast basic institutional characteris-
tics including missions, selectivity, methods of curriculum development, faculty culture,
course sequencing, student services, course scheduling, transfer functions, and the use
of data in decision making. For each of these dimensions, we compare and contrast the
characteristics of TECH COLLEGE to those of the comparison community colleges.
Institutional Missions
For-profit colleges are usually specialized organizations delivering a limited
scope of programs. They target students and attract their greatest enrollment in busi-
ness administration and accounting, computer science, electronics and allied health
(Bender, 1991).
TECH COLLEGE has a similarly limited scope. It offers nine degree programs
(both associates and bachelors degrees) in technology, telecommunications, and busi-
ness (with a strong technology emphasis). The college catalog offers a straightforward
mission statement:The mission of [TECH COLLEGE] is to provide high quality, career orientedhigher education programs in business and technology to a diverse studentpopulation. These programs integrate general education to enhance graduates’personal development and career potential.
The contrast with the mission statement of one of our comparison community
colleges is marked:The college is committed to offering career, as well as liberal arts and science
National Center for Postsecondary Improvement Page 21
curricula, developmental education and transfer preparation, cooperative educa-tion internships, continuing education classes, and training programs servingindividuals, business and public agencies.
Another of our comparison colleges stated, “our mission is to provide lower division
academic instruction, career programs, and continuous workforce improvement to
advance [the state’s] economic growth and global competitiveness.”
In these brief statements, the differences in the target constituencies and the
scope of objectives is clear. The TECH COLLEGE statement emphasizes preparing
students or graduates for careers in a limited number of areas. Both community colleges,
in contrast, identify career preparation as one objective among others. Moreover, the
community colleges define their constituencies in much broader terms, including indi-
viduals, business, and public agencies. One of the community colleges includes the growth
and competitiveness of the state’s economy as one of its objectives.
These distinctions become even more obvious in the more detailed elaborations
of each institution’s mission published in their catalogues. TECH COLLEGE states that
its goals are:• To offer applications-oriented programs developed by faculty and staff through regu-lar assessment and consultations with other educators and business leaders.• To offer a variety of scheduling options to accommodate the distinctive needs of bothtraditional and nontraditional students.• To assist students in realizing their potential by establishing basic skills assessmentand developmental services.• To provide student services that contribute to student success and achievement.• To provide career-development strategies and employment assistance to facilitatestudents’ successful transition to careers.• To provide highly motivated and qualified graduates to meet the current projectedneed of the work force.
Each one of these objectives is purported to enhance individual student success,
primarily career success. This contrasts with the detailed statement of the objectives of
National Center for Postsecondary Improvement Page 22
one of the community colleges:• to respond creatively to changes in student population, technology, and the globaleconomy;• to provide extensive support services and opportunities for a highly diverse studentpopulation;• to uphold high standards through a focus on program assessment and innovativeapproaches to teaching and learning;• to maintain a dedicated, highly qualified faculty and staff, while promoting theirprofessional development;• to prepare students to become full participants in the economic and civic life of thecity, the nation, and the world; and• to cultivate partnerships with business, community groups, government, and publicschools to enhance the economic, social, cultural, and educational development of [thecity].
Once again, the community college has a much broader set of objectives and
constituencies. Career preparation is hardly mentioned directly, although “full partici-
pation in the economic ... life” would certainly cover such preparation. The statement
also emphasizes concurrent preparation for civic life in the “city, nation, and the world”
as well as a commitment to serve a diverse student population, and to maintain stan-
dards that support high quality and innovation in teaching. The authors of this state-
ment also see the faculty as an independent constituency, rather than primarily the
means to provide services to students, and the college, hopes to “enhance the economic,
social, cultural, and educational development” of the city in which it is located. Com-
paring this to the more exclusive focus on individual career preparation found in the
for-profit institution, the community colleges state a much more ambitious and compre-
hensive mission than TECH COLLEGE.
This comprehensiveness is reflected in the services, curriculum, and programs
offered by the community college. As is typical of many community colleges, all three
of our comparison colleges offer dozens of AA, AS, AAS, and certificate programs and

National Center for Postsecondary Improvement Page 23
many non-credit offerings. For example, one has an extensive program of contract and
customized training. It provides adult basic education and GED preparation and it
enrolls many non-matriculated students in continuing education and non-credit
courses. On a headcount basis, this community college has as many non-credit as it has
credit-earning students. In contrast, TECH COLLEGE offers nine structured degree
programs and limited opportunities for electives. It has no customized training, no
continuing education, and no non-credit offerings.
Selectivity in Admissions
The differences in overall missions are also reflected in the admissions policies of
community colleges and the for-profits. The IPEDS data presented above reflect a
slightly lower acceptance rate for public community colleges than for-profit institutions.
However this is misleading, since students at community colleges are usually accepted
on a first-come-first-serve basis up to the capacity of the institution. Thus students are
not “rejected” based on their qualifications. Moreover, community colleges have an
obligation to provide services to students who are not prepared for college level work
(even if those students cannot matriculate), while the for-profits have no such obliga-
tion.
The admissions policy at TECH COLLEGE reflects this approach. Using a place-
ment exam in arithmetic, algebra, reading and writing, students are categorized into
one of three groups. The first group includes those who have passed all of these exams.
They are admitted to the regular courses. The second group, “developmental” students,
includes those who are deficient in algebra and/or either reading or writing. These
students are required to enroll in the college’s developmental education program.
Finally, those who are deficient in more than two areas, or deficient in both reading and
National Center for Postsecondary Improvement Page 24
writing, or deficient in basic arithmetic are denied admission, although the college does
refer students to Adult Education or developmental classes at a local community col-
lege. The TECH COLLEGE staff has concluded that these deficiencies are so serious
that they cannot be resolved through the college’s developmental education sequence.
Approximately 25 percent of the applicants at the branch we visited were “out placed”
in this way. Thus TECH COLLEGE has defined an academic minimum, and their
judgment is that they cannot successfully work with students who do not meet that
minimum.
Public community colleges, in contrast, are open-admissions institutions; stu-
dents demonstrate an “ability to benefit” from postsecondary education by holding a
high school diploma, a GED certificate, or demonstrating academic competency
through grades, SAT/ACT or Advanced Placement Exam scores. However, there are
some restrictions. The majority of community colleges (58 percent) mandate assessment
of all students in reading, writing and mathematics and 75 percent require that students
be placed in remedial or developmental education based on the assessment scores.10
Most colleges set limits on the number of times a student may enroll in remediation by
increasing tuition after multiple attempts, restricting students from taking additional
remedial courses, ending nonfederal student aid, and by limiting the number of times a
student can retake the assessment test. On the other hand, most colleges allow students
to enroll in college-level courses while taking remedial courses.11
Curriculum Development and Faculty Role
Just as the mission and goals of the for-profits and public community colleges
differ, so do their approaches to meet them. At all the comparison community colleges,
individual instructors make nearly all curriculum and pedagogy decisions. The disci-
National Center for Postsecondary Improvement Page 25
plinary division prescribes course content and texts with few exceptions. Individual
faculty control final exams, grading scales, student learning assignments and methods
of instruction.
In contrast, curriculum and course content are developed centrally at TECH
COLLEGE. Standardized materials guide the content of each course and teaching
methods. Standard Curriculum Guides for each course typically consist of a catalog
description, a list of appropriate topics to be explored, the level within the sequence of
courses, the rationale for the course, teaching suggestions for using multimedia or other
audiovisuals, and suggested teaching methods for each of the course objectives. TECH
COLLEGE offers a limited set of programs and similar courses at all of its branch col-
leges. This standardization affords students the possibility of taking a consistent se-
quence of courses even though they may attend different branch campuses or need to
change from day to evening classes..
TECH COLLEGE calls on experienced faculty to develop the standardized cur-
riculum guides Each instructor may deviate from suggested methods as long as the
designated objectives are met. Department heads at TECH COLLEGE suggest that
centralization is a benefit to new and part-time faculty who can use this framework to
design student learning activities. Thus the curriculum guides become incorporated
into the professional development program for new instructors. During our observa-
tions in classes, most instructors were generally adhering to the topics and methods
found in the Curriculum Guides.
It should be noted that, contrary to the impression that for-profit colleges can
alter curriculum easily and quickly, the TECH COLLEGE course development process
takes several months. But the process is likely to be even longer at public community
colleges. For example, at one of the comparison colleges, the engineering department
National Center for Postsecondary Improvement Page 26
and employers asked for an applied technical algebra course. Once the math and engi-
neering faculty had designed the content, the new course had to be approved by the
math and engineering department curriculum committees, the college-wide curriculum
committee, the academic senate and then the State Department of Higher Education.
Most new courses encounter these same kinds of hurdles: a departmental-level ap-
proval process, then a campus approval process, then an academic senate approval, and
then some external review by a state or regional entity charged with avoiding duplica-
tion or with constraining courses to a catalog of approved content.
On the other hand, community college faculty members are often imaginative
about circumventing some of these complications. At one of the comparison colleges,
faculty modified the content and pedagogy of a course while retaining common course
outcomes without changing the name, thereby avoiding the delay in obtaining state-
level approval.
Centralization of curriculum and other decision-making common at for-profit
institutions tends to conflict with practices of faculty governance that characterize
community colleges. TECH COLLEGE does pay attention to faculty development, but
administrators view centralized curriculum development as the means to strengthen
quality and guarantee a standardized, well-defined service. Students who take a par-
ticular course at any of the branches know what they will be learning, and the for-profit
colleges in general see this transparency as an advantage to consumers (Ortmann,
1998). TECH COLLEGE staff also suggest that this standardization helps their students
find employment. As one professor stated,TECH COLLEGE is a known quantity in industry. Employers know what TECHCOLLEGE does and they have a good idea what our students know when theycome out. The practical knowledge that we teach is what industry is looking forand our students have very little trouble finding jobs because of our reputation.
National Center for Postsecondary Improvement Page 27
Community college faculty saw advantages in decentralized curriculum devel-
opment. At one college, faculty stated that it was both a way to tap the energy and
enthusiasm of the faculty and a better way to respond to the needs of the community.
Thus one faculty member stated that “[college] faculty are encouraged to design courses
that respond to a need, and often the administration will allow the faculty member to
generate the enthusiasm and passion around the course.” Indeed, such flexibility and
autonomy of faculty within community colleges is a major contrast to for-profit institu-
tions.
Faculty Hiring
From the point of view of the college administration, faculty hiring at TECH
COLLEGE is more flexible than at most community colleges. Since they are not part of
a state or regional civil service system and faculty are not unionized, as they are in
many community colleges, TECH COLLEGE can make hiring decisions independent of
outside influences (other than federal and state employment law). When TECH antici-
pates the need for hiring part-time or full-time faculty, it advertises in local newspapers
and minimizes the number of decision-makers involved. Only one or two staff mem-
bers are involved in the hiring decision. This process is more expedient than the typical
community college practice of shared governance in hiring decisions, in which a team of
instructors and administrators “paper screens” applications, determines which candi-
dates to interview, conducts a group interview process, and then discusses impressions
among the faculty.
But if the process for hiring is different at TECH COLLEGE than at most public
institutions, the requirements for employment are not. To meet regional accreditation
standards, instructors at the public and proprietary colleges we studied must hold a
National Center for Postsecondary Improvement Page 28
master’s degree in the field in which they will teach. Neither training in pedagogy nor
experience in teaching was formally required at TECH COLLEGE or the comparison
community colleges. TECH prefers applicants who have had industry experience and
an appreciation for the advantages of applied learning.
Curricula and Instruction
For-profit colleges emphasize the practical nature of their curricula. According to
promotional literature and its website, students at one chain of for-profits schools (not
TECH COLLEGE) “learn and apply,” because “unlike many traditional colleges, where
students spend most of their time listening to lectures, [our] students also spend consid-
erable time in the lab where they are encouraged to apply what was taught in the class-
room and see for themselves how, why and what makes things work.” The same spirit
seems evident at TECH COLLEGE.
As we indicated, TECH COLLEGE starts its articulation of purposes with the
statement, “To offer applications-oriented programs...” One administrator elaborated
what he sees as TECH COLLEGE’s special approach to instruction:TECH COLLEGE is different because of how we teach. TECH COLLEGE pro-vides an education for students who are not that theoretically oriented to math-ematics but who want to pursue a career in technology. Due to these students’particular orientation, they do best in a hands-on environment… I think peopledifferentiate themselves into different learning environments. Someone who isvery concrete learns best in a hands-on environment… We do have theory here,but we try to make the theory easier to understand through the use of lots ofexperiments [labs]… Students look through our curriculum and they see lots oflabs and they say ‘Oh, I can learn from labs’.
Students at TECH COLLEGE perceive this emphasis as well. As one stated,TECH COLLEGE is more into it. Some of these teachers were actually out in thefield before they became teachers. At some places I’ve gone, the teachers justteach out of the teacher’s book. Here they really know accounting.
National Center for Postsecondary Improvement Page 29
Labs are a component of nearly every technical course and several academic
courses offered at TECH COLLEGE, whereas, in community colleges labs are typically
delayed until the second or third course. For example, at one of the comparison special-
ized technical courses some science courses are accompanied by labs, but introductory
courses tend to be large, lecture classes which focus on general concepts. At TECH
COLLEGE a lab requirement accompanies every technical course in the Electronics
Technician program, as well as all general education courses in Composition, Physics,
Quantitative Methods, and Statistics.
TECH COLLEGE instructors also make a particular effort to tie general educa-
tion courses to practical applications. While introductory general education courses are
usually taught as stand-alone courses, second-level courses and some electives are
integrated with the career fields. These integrated courses include Motivation and
Leadership; Professional, Business, or Technical Writing; Technology and Ethics; and
Social Issues in Technology.
Entries in the Curriculum Guide for an Ethics course illustrate this point. Stu-
dents are asked to carry out the following written tasks:Given an industrial process, provide descriptions of several alternative ways toperform the process and develop a justification for the recommended approachthat includes both technical and ethical considerations.
In building a power supply with three output voltages (12v DC, 5v DC, 120v DC),you can choose a different style of connector for each voltage and eliminate thepossibility of making a mistake in hooking the wrong power to a module in thesystem, or use identical connectors and get a price break on the connectors byordering a larger volume of one style. Justify your recommendation.
Many community colleges have also developed integrated curricula. The website
at one of our comparison colleges states that the Electronics program emphasizes
hands-on learning through experiments that are selected and paced to reinforce the
National Center for Postsecondary Improvement Page 30
theoretical material. The program offers a low-cost, high-quality education and hands-
on classes with much personal attention. Applied academics and linkages between
academic and occupational courses are typical strategies used at community colleges,
nevertheless, research suggests that these are still very much the exception in commu-
nity colleges.
Although TECH COLLEGE did emphasize applications through course linkages
and labs, the specific pedagogy used in the classroom is not distinguishable from the
typical teaching styles evident at community colleges. All of the classroom teaching
that we observed (in both developmental and regular classes) was characterized by
lectures with some limited discussion based on questions and answers—what educators
usually refer to as the “chalk and talk” method.
Finally, TECH COLLEGE students take a much more structured curriculum than
community college students. While students at TECH COLLEGE are immersed in
programs with a limited number of electives, at community colleges the selection of
electives is vast and students are permitted, even encouraged, to sample among them.
In contrast to TECH COLLEGE, curricular coherence at community colleges is achieved
through the majors, and students for the most part meet graduation requirements
through a distribution of credits across a number of disciplines. Even within majors, the
general education requirements can be met by taking a wide variety of courses. Stu-
dents also have significant choices within their specific occupational fields. In many
community colleges, students are not even required to declare a major. Overall, com-
munity college students have greater choice and discretion in their course selection than
students at TECH COLLEGE.

National Center for Postsecondary Improvement Page 31
Course Sequencing
TECH COLLEGE sequences courses in such a way as to purposefully delay gen-
eral education courses that might discourage students. The first two terms are com-
posed of technical courses. This has two advantages over emphasizing the general
education courses in the first semesters. First, many students are more likely to be
interested and motivated by the concrete applied courses, than by the more abstract
academic courses. Second, students who need developmental level work can complete
it while they are taking their introductory technical courses. Students who arrive with
academic deficiencies have much more trouble with the general education courses
which generally require composition skills, for example. With this sequencing, students
can get started on the applied field courses while they strengthen their academic skills.
Students enroll in English during their third term, which is commonly referred to as the
killer-semester because the failure rate for English is high (as it is among community
college students). By third term, students are heavily invested in the program and more
likely to repeat the course than if they failed it during their first term.
Overall, the teaching at TECH COLLEGE and at the community colleges was
similar, particularly for instruction taking place in the classroom. The commitment of
TECH COLLEGE to applied instruction was most evident in its greater use of labs and
in its efforts to integrate general education and specific occupational courses. Table 7
summarizes the contrast between instruction at TECH COLLEGE and the general
approach to instruction at the comparison colleges.
Student Services
TECH COLLEGE places a great deal of emphasis on admissions, counseling, and
student services. Marketing is central to the admissions process. An integrated market-
ing strategy introduces potential customers to all areas of the campus. Recruiters go to
students’ homes and make presentations to families or school groups. The college also

National Center for Postsecondary Improvement Page 32
has an extensive print marketing program. The college’s emphasis on admissions is
evident in the appearance of the admissions office. The reception area has a corporate
feel, with matching carpets and sofas and motivational signs on the walls. Admissions
counselors are young, professionally dressed and well spoken. In contrast, the admis-
sions process at all of the comparison community colleges was more passive.
However many community colleges are becoming more active and focusing on
marketing. Following some regulatory changes at the state level in 1995, one of the
comparison community colleges had experienced a decline in enrollment, which
prompted the college to embark on an extensive marketing campaign that included
expanded high school outreach and the development of publications and other market-
ing materials.
In the past, for-profit colleges have been criticized for over-aggressive marketing
to students who had little chance of success. This was a possible explanation for the
low completion rates and high loan default rates that were common among many for-
profit colleges in the 1980s. To be sure, schools that depend on tuition for revenues do
have an incentive to lower admissions standards. However, TECH COLLEGE did
require initial assessment tests and did reject students who did not pass those tests, a
process that provided a check to overenthusiastic marketing. Moreover, the passing
scores on the placement tests had just been raised at the TECH COLLEGE campus that
we studied. Finally, under some circumstances, the admissions staff also got bonuses
based on the completion rates of the students who they recruited, giving them an incen-
tive to find better-prepared students. It is also worth noting that community colleges
may be seen as having an incentive to increase enrollments by accepting students who
have little chance of success, since FTE enrollments generate tuition, state, and some-
times local revenue.
National Center for Postsecondary Improvement Page 33
As part of its marketing strategy, TECH COLLEGE seeks to project a professional
and technologically sophisticated image. One strategy that it uses involves its state-of-
the-art computer laboratory. This highly visible centerpiece of the TECH COLLEGE
campus houses 300 new PCs in 1500 square feet. The wall between the lab and a
heavily traveled hallway is nearly all glass, so that most students look into or attend
class in this lab on a daily basis. The lab is full of students working individually and in
small groups on a myriad of software and networking projects. A number of instructors
and student aides move through the lab providing individuals with assistance. In
addition, many of the students converse, comparing answers for project assignments
and software challenges. The lab evokes an aura of professionalism and orderliness.
Admissions, financial aid, assessment, advisement and registration are closely
linked at TECH COLLEGE, so that students remain under the same set of administra-
tive practices for the first several terms. Students work with financial aid advisors to
complete registration and financial aid forms online which smoothes the student entry
experience. Academic advisors help students schedule classes, complete registration
procedures and monitor their academic achievement for the first two terms, after which
the student is assigned to a program area (major) advisor. By smoothing the entry
experience for students, college officials hope to improve persistence and achievement.
TECH COLLEGE is proud of its career counseling and job placement services.
Nationally, the college employs about 5 full-time counselors per campus whose job it is
to help students find part-time employment while enrolled and full-time work after
graduation. Every student is encouraged to start their employment search well before
graduation, and alumni can continue to use the placement services after graduation.
TECH COLLEGE provides extensive support for the career search of students and
alumni through a national database of employers, national advertising, career seminars,

National Center for Postsecondary Improvement Page 34
and career fairs.
TECH does track the employment experience of its graduates. Indeed, these data
are published on the college website and they indicate that for graduates in 2000, about
95 percent of those who looked for work found work in education-related fields within
six months of graduation. Average starting salaries for the different degrees, including
all taxable compensation, ranged from $31 to $48 thousand. The data combine results
from both two and four year programs.
In contrast, admissions, counseling, and placement are far less integrated at
community colleges. In most colleges, students usually have to go to different offices
or people for financial aid, credit transfer, course selection, and career planning. Overall
counseling at community colleges is notoriously uneven, with very low counselor to
student ratios (Grubb, 2001). At one of our comparison colleges, a student interested in
discussing the possibility of studying in an information technology program had to wait
a week to meet with a counselor. The college relied heavily on its website to answer
student questions. At another comparison college, an exasperated faculty member
stated:Some of our students might not be willing to jump through all the hoops to getinto the College and go through the student services processes. They have to fillout the application form without any help, make an appointment to go throughadvising where the counselors try to talk you into taking general educationcourses, get scheduled so they can sit through orientation, schedule a time to takean assessment test, go to another office to pay their fees… we make it kind ofdifficult for students.
Job finding and placement is usually a haphazard process. To be sure, many high
quality community colleges have good relationships with employers, but often this is
not a prominent institutional commitment as it is at TECH COLLEGE. Instead student
employment placement for a community college is based on a case by case system of
National Center for Postsecondary Improvement Page 35
individual faculty or staff using employment relationships for the students in their
programs. As a result, while some success stories exist, it is more common that the
quality of these relationships varies across programs, and the overall placement of
students is inconsistent and sporadic. Idiosyncratic placement services at the periphery,
are unlikely to have the type of focus and economies of scale that have contributed to
the coordinated services and the highly publicized job placement results for graduates
of TECH COLLEGE. At one of the comparison community colleges, a faculty member
who had also taught at the local TECH COLLEGE campus acknowledged that TECH’s
career assistance process was much more extensive and that the community college did
not have the extensive network of contacts and alumni that TECH could draw upon in
job placement.
Flexibility and Scheduling
Scheduling is another area in which TECH COLLEGE hopes to provide some
extra value for their students. For-profits in general tend to have frequent entry and
exit options, allowing students to blend study with work and family responsibilities.
TECH COLLEGE starts program sequences three times a year. Faculty are available to
assist students during evening and weekend hours. Computer labs are open seven
days a week and library materials are available online. TECH COLLEGE, like many of
its public competitors, also has several different weekly scheduling options. For ex-
ample, students can attend classes in the morning, the afternoon, or two different
evening time slots.
In addition to flexibility, the accelerated time to program completion is an attrac-
tive feature offered by many well-known for-profits. One for-profit college (not TECH
COLLEGE) advertises that “by attending class just one night a week, you can earn your
National Center for Postsecondary Improvement Page 36
degree years before you could at a traditional university—without interrupting your
career!” Another states that their year-round schedule “helps students complete their
education and enter the workforce sooner.” And at TECH COLLEGE, an administrator
said that the “single greatest strength of the Electronics Technician program is that
students are able to complete the program in a year and eight months.”
In order to reach new types of students TECH COLLEGE now offers accelerated
programs for working students who have completed an associate’s degree. In attempt-
ing to respond to students’ desire for more autonomy and power over their academic
careers, TECH COLLEGE designed an accelerated delivery system for just a few stu-
dents, the system has become so popular that it has been expanded to several majors
and is now open to many high performing, mature students. Thus TECH COLLEGE
has broadened attendance options, so that students can move from full to part time if
their employment situation changes, and from day to evening, thus enabling students to
switch from traditional to alternative enrollment patterns.
Many community colleges also pride themselves on their flexibility and their
willingness to accommodate working students. As we have seen, a student at a for-
profit college is far more likely than a community college student to be attending full-
time. Moreover, if a community college student attends summer school and takes a full
load of courses, he/ she can certainly finish an associate’s degree in less than two years.
And the staff at one of the comparison community colleges point out that, in many
respects, their school had many of the convenient features of the for-profits. The school
has set up a satellite campus in addition to the main campus; courses are offered on-line
as well as during the day and evening; students get individual attention from counse-
lors. Another comparison college also emphasized convenient scheduling, with classes
offered in the morning, early afternoon, evenings and weekends.
National Center for Postsecondary Improvement Page 37
But there are three distinctions between the for-profits and community colleges
concerning scheduling that are worth noting. First, most community colleges face more
difficulties than TECH COLLEGE does in developing non-traditional schedules. For
example, the faculty contract in one city precluded the college from offering regular
classes on Friday. Another community college cancelled some summer vocational
offerings because they appeared to reduce fall enrollments in those classes. Second, as a
result of the restrictions they face, many community colleges try to provide flexibility
through continuing education and non-credit courses. TECH COLLEGE offers no such
courses. Although many students may be seeking specific skills that can be most effi-
ciently learned in a non-credit or stand-alone course, such courses are not suitable for
students who want a degree. Third, while it is possible to accelerate the time to degree
completion at a community college, an accelerated sequence is the norm at TECH COL-
LEGE where course sequencing and scheduling is designed explicitly to facilitate accel-
erated graduation.
Data Driven Decision making
An institution can be more responsive to student needs if it has good information
about what those needs are. More so than at the comparison community colleges,
TECH COLLEGE monitors data on student progress to make curricular and program-
matic decisions. During one of our interviews at TECH, the entire wall of the meeting
room was covered with graphs of student retention by week across the five terms of an
associate’s degree program. Because the administrators had identified a dip in retention
during the term in which students traditionally had enrolled for Composition (second
term), the sequence of the program was shifted so that students would take Composi-
tion third term when they had done some writing in technical courses and had devel-

National Center for Postsecondary Improvement Page 38
oped a greater commitment to the program. Other graphs showed course taking pat-
terns and movement among developmental education and subsequent credit courses.
Moreover, as we have seen, TECH COLLEGE also makes concerted efforts to
track the employment experience of their graduates. These data can be used to assess
trends in the effectiveness of the college placement services.
Public community colleges have recently come under increased federal, state and
accreditation student performance accountability requirements, requiring increased
data collection. Nonetheless, it is rare for individual faculty to review retention-within-
course and across-program data or to use such data to change curriculum or sequences
of courses. Moreover, most community colleges do not systematically keep track the
employment experience of their graduates. Community college staff tend to rely on
feedback from local employers and from students to get a sense of the employment
success of their graduates. An institutional researcher at one of our sites argued that
the increased reporting burden resulting from the accountability movement has actually
diverted very scarce resources away from the type of useful analysis that we saw at
TECH COLLEGE. He stated that “currently there are only two people at the district
level that address the issue of institutional research, and they are overwhelmed by the
required mandatory reports that must be completed for the district.” Thus TECH COL-
LEGE had more information than the comparison colleges to evaluate the outcomes of
their programs, and was therefore in a better position to use such information for pro-
gram improvement.
Facilitating Transfer
We have emphasized that for-profit institutions of higher education offer both 2-
and 4-year degrees. Indeed, in the last year (1997-98) for which we had data, four-year
National Center for Postsecondary Improvement Page 39
for-profit colleges conferred more associates than bachelors degrees. TECH COLLEGE
is this type of hybrid institution. Combining two- and four- year programs within one
college does facilitate transfer. TECH COLLEGE has created articulation between its
Electronic Technician (associate degree) and Electronics Engineering Technology (bacca-
laureate degree) programs. Nevertheless, TECH COLLEGE administrators voiced some
of the same frustrations about fitting together two and four year programs that one
frequently hears at public four-year colleges. That is, it is difficult to convert all of the
courses of a two-year terminal degree into the first two years of a four-year degree.
Therefore, while the electronic technician courses do transfer, this is something that the
college is still trying to improve.
The presence of the two-year program at the college does give TECH COLLEGE
more options when counseling applicants for the baccalaureate degree. The associate
degree Electronics Technician program accepts lower placement scores than do other
programs, and students wanting to enroll in a program for which they fail the entry
scores are counseled to enroll in the ET program until they improve their skills suffi-
ciently to apply to one of the higher skill programs.
TECH COLLEGE staff report that these students, as well as students who apply
directly to the ET program, are most likely to go to full-time work immediately after
earning their associate’s degree, and may return later if they perceive a need for an
additional credential.
TECH COLLEGE has also worked hard to attract transfer students from commu-
nity colleges. The college has recently relaxed some of its credit transfer guidelines. As
one administrator said,We’ve just relaxed our policy in that regard [transfer] to be we think morethoughtful about how students come to us. So for example we used to have arequirement that transfer credit was from courses that were essentially the sameas ours. English 101 for us had to be the same as English 101 from a community

National Center for Postsecondary Improvement Page 40
college. We’ve moved away from that and have said the intent of our havingEnglish 101 is to have, say a literary experience or a writing experience. If youhave a similar experience somewhere else, designed to accomplish the sameobjective, that’s fine.
Students from every area community college could look at the TECH COLLEGE
website and find a list of courses that correspond to specific TECH COLLEGE courses.
Thus a quarter of TECH COLLEGE students enters with some community college
credits. The University of Phoenix is also well known for its articulation agreements
with local community colleges.
While for-profit colleges work hard to attract transfer students from public com-
munity colleges, students at many for-profit colleges have difficulty transferring their
credits to public four-year colleges. This problem is most serious for those for-profits
that are not regionally accredited (Borrego 2001). The four-year colleges will simply
not accept the credits. Since TECH COLLEGE is regionally accredited, this is less of a
problem for their students.
Because TECH COLLEGE students increasingly put together their program of
study with components from a variety of sources, the traditional structured progression
has been altered. This may be an example of “unbundling,” in which students separate
the packages of courses that colleges provide, taking some courses at one college and
others from a different institution. Such an unbundling creates new pathways for
students to reach their academic and career goals, at the same time that it creates new
forms of competition, including the possibilities of subcontracting. For the last few
years, community college staff and state policy makers have been discussing the possi-
bility of subcontracting some remediation (Hebel 2001). And a community college in
Chicago has actually explored the possibility of contracting with a for-profit school to
provide instruction for their IT and business programs. Understanding how these

National Center for Postsecondary Improvement Page 41
disjointed patterns contribute to a national system of job training and education is
important.
Summary
In this section we have identified several important distinctions between TECH
COLLEGE and the comparison community colleges:
1) The most important distinction has to do with the goals and mission of the
different types of colleges. TECH COLLEGE conceptualized its mission in much nar-
rower terms than any community college. Its goal is to prepare students for careers in a
very limited number of technical careers. This goal is only one among dozens of objec-
tives and functions of community colleges.
2) A second fundamental difference has to do with the nature of an academic
culture. This has particular implications for the activities and role of the faculty. At
TECH COLLEGE, the tradition of shared governance and faculty professional preroga-
tives is much weaker than at the community colleges.
3) The curriculum development process at TECH is centralized. College depart-
ments and individual faculty members have much more responsibility for program and
course development in the community colleges.
4) TECH COLLEGE places much greater emphasis on degrees. TECH faculty and
administrators emphasize that they have programs that lead to degrees and that the
various parts of those programs fit together. In contrast, community college degree
programs tend to be less structured, and community colleges are more likely to argue
that many of their students do not want degrees and instead seek specific skills that can
be learned in one or a small number of either credit-bearing or non-credit courses.
5) In terms of instruction, we found that the technical training, and even some of
National Center for Postsecondary Improvement Page 42
the academic courses in TECH COLLEGE made more use of labs and tended to tie their
academic courses to practical applications and to the occupational curriculum.
6) Student services such as admissions, counseling, and career placement are
more integrated and better developed at TECH COLLEGE than at the comparison
community colleges.
7) TECH COLLEGE places more emphasis on collecting and using data on stu-
dent outcomes such as course completion and graduate employment.
Perceptions of competition
What are the perceptions of community college administrators about potential
competition from the for-profit sector? We asked administrators and faculty at our
comparison colleges to name the institutions that they considered their primary com-
petitors. We also drew on results from fieldwork carried out at six additional commu-
nity colleges for a different project by the Community College Research Center. At those
colleges, presidents, other administrators, and faculty were asked to list their competi-
tor institutions. These results are displayed in Table 8. Comparison sites are indicated
with a “CS” label. The table first lists all of the institutions identified by administrators
at the college as creating the most significant competition for the community college.
The second panel lists all other mentioned competitors.
In only one case, did community college personnel identify a local for-profit institution
as among the most important competitors. In all but two cases, community college staff
cited the local four-year public college or university. One exception was a very academi-
cally oriented community college in New York City, and the staff there perceived a local
private, not-for profit college as providing the most serious competition. Two colleges
said that both local four-year public and local community colleges were the most impor-
National Center for Postsecondary Improvement Page 43
tant competitors, and one listed a four-year public and a local private not-for profit.
In reviewing the perceptions of community college personnel, it is important to
note that misperceptions about the for-profits are common at community colleges.
Some personnel did not realize that they granted bachelor’s degrees and others thought
that they did not teach any general or developmental education courses.
But some respondents are more knowledgeable than others. For example, a
faculty member at one of the comparison colleges had also taught at TECH COLLEGE.
He believed that the quality of education at the community college was just as good but
that TECH had four specific advantages compared to his college. First, it could be more
responsive in academic program change, whereas bureaucracy hampered the commu-
nity college. Second, TECH COLLEGE provides access to a more extensive program-
specific career network. Third, in their specific substantive areas, TECH COLLEGE
provides focused training widely recognized by industry as meeting industry needs.
This community college is actively trying to strengthen its collaboration with industry.
And fourth, TECH COLLEGE simply has more advanced computers and technology in
general, giving students better access to computers and facilitating the most up-to-date
technical training.
Community college faculty view the comprehensiveness of the community
colleges as another advantage, at least for many students. For example community
colleges offer a much more extensive variety of liberal arts courses. Even for students
who do want a technical degree, community college faculty emphasize that their col-
leges offer more opportunities for cultural enrichment and for a diverse and compre-
hensive educational experience. TECH COLLEGE and other focused for-profits are not
seen as good places for students who do not know what field they want to study. As
one community college administrator argued, “[Our college] is more suited to allow

National Center for Postsecondary Improvement Page 44
students to participate in the exploration process of education rather than getting locked
into a program before they have a chance to really know what they want. [Our college]
provides students with options, not simply a job.”
Thus community college staff do not perceive that for-profit institutions are a
significant threat to their college’s enrollment. They also tend to hold traditional views
about the narrowness and generally low quality of for-profit education, although in
most cases, they have little direct knowledge of the specific programs or students at the
for-profits.
Conclusion: Review of the Three Arguments
We started this report with three arguments about the for-profit sector in higher
education. The first was that for-profits are a competitive threat to community colleges.
The second proposed that for-profits provide a more flexible, convenient, and respon-
sive education than community colleges. Finally, we considered the suggestion that the
for-profits “train” while community colleges “educate” The data analysis presented in
this report provides a foundation to re-examine those questions.
The competitive threat of the for-profits
At least through 1998, the last date for which the national sample of post-second-
ary institutions is available from IPEDS, for-profit institutions enrolled a very small
share of total higher education students. Among the two-year schools, for profit enroll-
ments accounted for less than 5 percent of all students and less than one percent of
enrollments in regionally accredited institutions. And enrollments in the two-year for-
profits actually dropped during the middle part of the decade. Enrollments in four-year
for-profits accounted for an even smaller share of the student market, although in this
case, the for-profit market for all four-year institutions and for the regionally accredited
National Center for Postsecondary Improvement Page 45
colleges did grow slightly.
These numbers hardly reflect a strong competitive threat, although this compla-
cent view needs to be tempered by some important observations. First, it is likely that
the numbers have grown since the 1997-98 school year. Second, it is possible that
underreporting of enrollments is greater for the for-profits. Nevertheless, we suspect
that this may be more the case for those that are not regionally accredited and those that
are not seeking financial aid for their students. Such schools would also be the least
likely to pose a threat to community colleges. Third, the for-profits account for a much
larger share of completed certificates and associates degrees than their share of enroll-
ments. This suggests that for-profit students are more likely than community college
students to complete degrees. Finally, the four-year for-profits confer as many associ-
ates degrees as they do bachelors degrees. Thus in evaluating the potential for competi-
tion, the community colleges need to think about the four-year schools as well. More-
over, hybrid schools—those that confer both two and four year schools may have im-
portant advantages over community colleges for promoting transfer. (As we have
pointed out, there is an on-going controversy about this issue among community col-
lege personnel.)
But in addition to the low number of enrollments, there are other reasons to
believe that the for-profits do not represent a fundamental direct threat to community
colleges. Community college faculty and staff do not perceive a threat from the for-
profits. To be sure, they may not necessarily perceive a threat that is actually there, but
they do have a well attuned sense of competition from other sources—the four-year
public colleges in particular.
The tuition levels also provide a huge buffer for the community colleges. In most
states, the for-profits are still many thousands of dollars more expensive than the com-
National Center for Postsecondary Improvement Page 46
munity colleges, even though the students at for-profits do get disproportionately more
financial aid. However, for-profits have greater access to capital, which allows for
larger up-front investments in equipment, course development, and technology.
As illustrated by our case study data, the focused course offerings offered by
TECH COLLEGE also mitigate the direct competition between it and surrounding
community colleges. So long as the demand for the technology fields for which TECH
educates workers continues to grow, it is unlikely that TECH COLLEGE or other
schools like it will have a significant negative influence on community college enroll-
ments. The significant point here is that this college has a specific focus, and while it is
providing education that community colleges also serve, it is only a very small part of
the overall activities and functions of the public institutions. Indeed, TECH COLLEGE
would not serve the interests of the large majority of community college students,
because they are interested in fields of study that TECH does not offer, because they are
still undecided about what they want to do, or because they simply can not afford the
tuition. Of course it is possible that many narrowly focused colleges will be created
and, as a group, begin to compete with many of the college’s functions. If this is hap-
pening, we have not seen much evidence of it. Data on overall enrollments do not
suggest a broad growth of for-profits and for the most part, the for-profits that have
grown recently are concentrated in the technology and business fields.
The for-profits are still for the most part pursuing what might be called a niche
strategy. Certainly, for the community college programs in those niches, the for-profits
present potential competition. But so far, the for-profits appear to be concentrated in a
limited number of niches, and in any case, the much lower tuition at community col-
leges continues to provide a significant buffer to competition.
Our study suggests that, rather than characterize the relationship between the
National Center for Postsecondary Improvement Page 47
for-profits and community colleges as one of competition, it would be more accurate to
characterize the relationship as a division of labor with a few areas of overlap. This
situation arises partly from the highly focused strategies pursued by the for-profits,
thereby, at least so far, limiting the fields in which direct competition could take place.
Moreover, in many cases, the four-year for-profits see the community colleges as a
source of students and appear to have worked harder than their four-year public coun-
terparts to attract community college transfer students. This is important from the point
of view of the community colleges because it is the four-year sector among the for-
profits that has grown most rapidly Given this trend, it is possible that the growth of
four-year for-profits that have transfer agreements with community colleges may ben-
efit these public institutions.
Convenient, responsive, and customer oriented education
One of the common themes in the discussion of the growth of the for-profits is
that they have developed a more streamlined, responsive and customer oriented ap-
proach to delivering post-secondary educational services. Our case study evidence
does suggest that this contrast holds for TECH COLLEGE in relation to the three com-
parison colleges.
TECH COLLEGE does emphasize convenient scheduling and accelerated degree
completion, although even with this flexibility we found that the basic structure of
TECH COLLEGE did not radically depart from the more traditional curricular ap-
proaches typically used by community colleges. TECH COLLEGE is also trying to
develop more convenient scheduling and has recently started a much more flexible and
self-directed program that is small but growing rapidly. TECH’s recent efforts to attract
transfer students are another indication of their interest in facilitating more flexible
National Center for Postsecondary Improvement Page 48
options for students. But TECH’s course development system is not particularly flex-
ible. The centralized process that emphasized consultation with businesses took up to a
year to run its course, so TECH also takes time to respond to shifts in the educational
needs of the fields in which it is involved.
TECH COLLEGE does emphasize accelerated degree completion through year-
round study. Community college students in some states may attend school year-
round, but while this may be common among certain self-motivated students at the
community college, it is considered the norm at TECH COLLEGE. The differences in
the nature of the faculty roles and contracts give the for-profits more flexibility in sched-
uling and sequencing, although it is important to note that community colleges are
working hard to address this as well. Moreover, the public comparison institutions are
much more likely to seek convenience and flexibility through offering continuing and
non-credit education as well as customized training. But these entrepreneurial activities
operate on the periphery of the degree-granting core of the community college.12 As we
have pointed out, TECH COLLEGE does not even offer these more peripheral activities.
The contrast between TECH COLLEGE and the community colleges included in
this study is perhaps greatest in the area of student services. This is ironic because
community colleges themselves often contend that they provide more personalized and
caring student services than their four-year public counterparts. Yet, it does appear that
student services from admissions to job placement are more integrated and focused at
TECH COLLEGE than at the comparison community colleges. The process of enroll-
ment, course selection, credit transfer, and financial aid are coordinated, and the coun-
seling system is simplified. Even staff at the community colleges we studied acknowl-
edge that the job placement services and the alumni network at TECH COLLEGE are
more effective. In the end, TECH COLLEGE does emphasize convenience, accelerated
National Center for Postsecondary Improvement Page 49
completion, and coordinated student services more than the comparison community
colleges.
Educational Quality
Critics of the for-profits argue that they “train” while community college “edu-
cate”. By going to a for-profit college students trade off access to short-term technical
skill development at the expense of a solid educational foundation for long-term career
(and personal) development. Much of the research on which the negative reputation of
proprietary schools is based was carried out during the 1970s and 1980s—before the
1992 changes in the Higher Education Act. As we have suggested in this study, at this
time, today’s most successful and well-known for-profits institutions share more charac-
teristics with public community colleges and four year colleges than the typical propri-
etaries of earlier decades.
Nevertheless, the more focused strategy of TECH COLLEGE and many of the
other for-profits does have implications for the nature of the education their students
receive. TECH COLLEGE would appear to be most effective for a student who has
definitely chosen a career in one of a small number of technical fields. If “education”
means providing an environment in which undecided students can explore a variety of
fields, then there is no question that community colleges provide more of that. And
even for students headed for technology careers, the public institutions offer many more
options for educational experiences outside of their chosen career area. But for the
student who has chosen a general career direction, this study leaves open the question
whether TECH COLLEGE is any more or less effective in preparing students for long-
term career development than the nearby community colleges. TECH COLLEGE does
have fewer course options, but it is not clear that a larger selection of electives and
National Center for Postsecondary Improvement Page 50
academic courses offered at a community college would provide a stronger, broader and
more flexible foundation for long-term career development within that chosen field. On
the one hand, a student who wants to pursue a more flexible long-term career develop-
ment strategy could get a broader and more diverse intellectual experience at a commu-
nity college. At the same time though it is possible that some students, especially stu-
dents who do not have a strong educational background, may be more successful in
structured programs such as those at TECH COLLEGE rather than in a more loosely
related set of courses and options that characterize many community college programs.
At TECH COLLEGE many of the academic courses are related to practical
courses, but this reflects a commitment to an applied pedagogy. A significant number
of educators believe that this is a more effective pedagogy.13 Although the benefits of
applied learning and the integration of academic and vocational education remain
controversial, there certainly is no general consensus that they are inferior pedagogic
strategies. Given these differences in opinion, at best our research suggests that stu-
dents can achieve an educational foundation on which to build a long-term career both
at TECH COLLEGE and at neighboring community colleges. Students who have al-
ready decided on a career in one of the areas in which TECH COLLEGE offers degrees,
may find extra leverage by attending TECH COLLEGE rather than a community col-
lege.
Community college and for-profit student outcomes
Have the for-profit institutions developed a more effective post-secondary educa-
tional strategy? TECH COLLEGE emphasizes a coordinated and comprehensive
approach to student services and greater attention to measuring and analyzing out-
comes. It is difficult to argue against these measures, especially for the types of stu-

National Center for Postsecondary Improvement Page 51
dents who are most likely to attend either TECH of local community colleges, although
a comprehensive assessment would have to balance the extra costs of these programs
against the benefits. Other features of the TECH COLLEGE strategy such as more
applied instruction, more focused and structured curricula, and a greater emphasis on
degrees are also attractive for many students. But community college staff argue that
their institutions provide a more thorough commitment to general education and the
liberal arts.
Critics of community colleges have been chiding the colleges for many years for
their attempts to be “all things to all people.”14 More than 15 years ago, the influential
community college scholar Pat Cross asked , “Can any college perform all of those
functions with excellence—or even adequately in today’s climate of scarce resources
and heavy competition for students?” (Cross, 1985, p. 35) The leaders of TECH COL-
LEGE would probably agree. Moreover, it is logical that a more focused mission can
facilitate curriculum planning, student services, career counseling and job placement.
For example, job placement counselors can focus on a much more limited list of poten-
tial employers and student advisors have many fewer options about which to advise.
On the other hand, community college faculty argue that their institutions offer a wider
set of choices which is especially appropriate for students who are still exploring a
variety of career options.
Unfortunately, definitive empirical analysis of these alternative approaches is not
available. The data that we have presented on enrollments and degree completions in
Tables 3 through 6 provide a rough measure of completion rates, and they do suggest
that students who enroll in for-profit institutions are more likely to leave with a degree
or formal certificate of completion. NCES longitudinal data on students who started
post-secondary education in 1995 are also consistent with this. While we think that
National Center for Postsecondary Improvement Page 52
these data are suggestive, such comparisons might be misleading since the characteris-
tics of the students in the two types of schools might be different, nevertheless, the
higher minority enrollments in the for-profit institutions hints that the higher comple-
tion rates are not simply a reflection of greater selectivity in admissions and enrollment.
TECH COLLEGE does publish data on its website on the employment experience
of its graduates, and these data suggest that the large majority of TECH graduates get
jobs at good salaries. Indeed, in some programs 99 percent of graduates who looked for
work found jobs in areas related to their education within six months of leaving the
college. Unfortunately, our comparison community colleges, and indeed most commu-
nity colleges, do not keep comparable information on employment of their graduates.
Thus we are left sense that TECH COLLEGE students have success in the labor
market, but unfortunately we do not have a good comparison between the student
outcomes for community colleges and for the for-profits. Our judgments about the
effectiveness of the institutions must therefore be based on our assessments of the value
and strength of the various policies that make up the overall strategies used by the
different institutions. Based on that, our assessment is that community colleges have a
good deal to learn from successful for-profit institutions.
Implications for Community Colleges and Further Research
What are the implications of this analysis for community colleges? The for-
profits are a growing segment of the higher education enterprise, and they provide
education at the associate degree level. Nevertheless, their share of enrollments remains
tiny, and the most robust and fastest growing for-profit post-secondary institutions are
in the four-year segment. This certainly does not mean that the for-profits are not
competitors in some sectors and for some programs. Rather, unless trends change

National Center for Postsecondary Improvement Page 53
drastically, their overall impact, at least for the next decade, will not be large.
But this certainly does not mean that all is well with community colleges. While
exaggerating the competitive threat of the for-profits might be a useful motivation for
reform in the public sector, a more measured assessment of that threat does not imply
that reform is not necessary. For-profit institutions have been able to attract many of the
same types of students who enroll in community colleges despite higher tuition. This
alone would suggest that college administrators might find useful lessons in the opera-
tions of the for-profits.15
The much more focused mission and programs at TECH COLLEGE are key
factors that differentiate TECH from the surrounding community colleges. Community
colleges, as we have emphasized, have a more comprehensive and ambitious mission
and we have argued that this complexity creates many difficulties. Does this suggest
that community colleges should also seek to narrow their missions and focus on a much
smaller number of activities or “core competencies?” Although this is an interesting
question, at this point there is no definitive answer; and in any case, strong current
incentives push community colleges to continue to take on more functions and activi-
ties. Thus despite many calls over the last two decades to narrow college missions, all
of the current trends indicate that the community colleges will become even more
comprehensive and complex. Community colleges would find it extremely difficult to
significantly simplify their mission without abandoning many of the legitimate func-
tions that state legislatures and indeed the public expect from them.16 Therefore, com-
munity colleges must look for lessons in the context of their own comprehensive and
expanding missions.
One approach might be to try to create more focused schools or programs within
a particular community college. Academic courses and professors and student services
National Center for Postsecondary Improvement Page 54
personnel could be attached to these programs and therefore allow them to tailor their
activities to the particular substantive field.17 Some centralization of course develop-
ment might also be achieved in multi-campus colleges or within multi-college districts.
But this would only be feasible for large programs that are able to justify the expense of
their own independent administrative service structure. As an alternative, smaller
programs might share some of these services to achieve greater specialization, even if
minimal.
Our analysis suggests some additional changes that community colleges could
make even within their comprehensive structures and missions. Student services are
notoriously lacking at public colleges. Students complain that community colleges
package information for administrative rather than student convenience. The colleges’
breadth and diversity do complicate the delivery of high quality student services, but
they make such services that much more important. The choice and variety available to
students may be assets that allow students to discover their interests and broaden their
education, but they will not be very effective if students are not provided adequate
information and guidance to help them navigate the complexity and make informed
choices. This is particularly true for students commonly found in community colleges,
who have weak academic skills, who have not had much success in their previous
schooling, who have little information about what they need to do to achieve particular
occupational goals, and whose personal networks may not be effective in helping them
find jobs. Nevertheless, advising and students services are often only minor activities at
community colleges. Thus community colleges can certainly learn from the more coor-
dinated and intensive student services and counseling found at TECH COLLEGE and
other high quality for-profits.
Many community college administrators believe that faculty prerogatives and
National Center for Postsecondary Improvement Page 55
the traditional academic practices as well as state regulations stand in the way of better
student services and more entrepreneurial behavior. It does appear that these tradi-
tions (and even contractual arrangements, especially where there are faculty unions) do
complicate schedule flexibility and restrict the type of centralized curriculum develop-
ment that we observed at TECH COLLEGE.
Three questions are important to address in evaluating the implications of the
traditional faculty culture. First, what difference does centralized curriculum develop-
ment make? As we have seen, advocates of both centralized and decentralized ap-
proaches have reasonable arguments, but we need better research to determine the
conditions under which one or the other might be more effective or efficient. Second, it
would be interesting to understand more about the faculty culture at the for-profit
institutions. Unlike some for-profits that use many adjuncts, TECH COLLEGE relies
primarily on full-time faculty. How do they view their jobs and their professional
prerogatives? How different are their perspectives from those in public institutions?
Third, it is important to understand how to achieve flexibility within the current faculty
culture, including on those campuses where faculty are unionized. Unions in the pri-
vate sector have demonstrated they can work with their employers in innovative and
more flexible work arrangements without compromising the interests of their members.
Community colleges do keep a great deal of data, but it is rarely kept in a form
through which it can be easily used as a foundation for program improvement. For
example, community college staff often argue that many students enroll in the colleges
with no intention of graduating—they are simply in search of skills and when they
acquire those skills, they leave. The implication of this is that low graduation rates,
according to this view, should not be taken as an indication of institutional failure. But
most students, when asked, do say that they want degrees, and indeed the majority of
National Center for Postsecondary Improvement Page 56
community college students say that they want bachelors degrees (Schneider and
Stevenson 1999). These may be unrealistic expectations, but community college staff
have trouble backing up their arguments because most community colleges have no
systematic data on the educational and employment experience of their students after
they leave. The studies that would produce this type of data are difficult to conduct,
nevertheless, TECH COLLEGE is able to track its graduates for at least six months after
they leave. A commitment to comprehensive data collection and its analysis for pro-
gram improvement is something else that community colleges can learn from the for-
profits.
The role of certificates in education and employment is another area that needs
much more attention. If there is a large demand for packages of skills that do not re-
quire a full two years to learn, then it would make sense to develop formal credentials
that would certify those packages of skills. But we have very little systematic informa-
tion about the content and educational and economic effect of these credentials. We
have seen that the for-profits in general, although not TECH COLLEGE, make propor-
tionately much more use of certificates than the community colleges. Therefore, once
again, community colleges may have something to learn from the more extensive expe-
rience the for-profits have with certificates.
These conclusions are based on an examination of the programs and services
offered at a few institutions that are arguably not representative. For more generaliz-
able conclusions and deeper levels of analysis, additional research based on national
data is needed to better understand the educational and economic benefits of for-profit
versus non-profit public and private institutions. Such information would help both
students and employers make better informed decisions. Current data available from
the National Center for Education Statistics (NCES) do not allow a definitive analysis of
National Center for Postsecondary Improvement Page 57
these issues. One reason is that in the nationally representative population surveys, the
sample size of for-profits is too small as a result of their small enrollments. Second,
categorizations of for-profit schools often fail to distinguish between accredited schools
that are most likely to compete with public institutions and the lower quality institu-
tions that were more common before the 1992 amendments to the Higher Education
Act. Third, the quality of the self-reported data provided by the proprietary schools,
especially to the Integrated Postsecondary Data Systems (IPEDS), has questionable
reliability. NCES will need to make progress on these issues before we can gain more
definitive answers about the relative effectiveness of these different types of educational
institutions.
In the meantime, researchers could make headway pursuing case study projects
that examine the organizational issues that facilitate and constrain the rearrangement of
student services and the potential for decentralized functions within larger organiza-
tions. In addition, an important line of research is to study the potential for collabora-
tion between community colleges and local for-profits, including the potential benefits
and liabilities of emerging organizational arrangements (such as sub-contracting and
outsourcing.) We need to understand how the phenomenon of unbundling educational
services creates new pathways for students to reach their academic and career goals,
and how students can be best supported to take advantage of the full range of resources
provided by community colleges and their for-profit counterparts.
National Center for Postsecondary Improvement Page 58
References
Apling, R. (1993). Proprietary schools and their students. Journal of Higher Education64:4, pp. 379-416.
Apling, R. & Aleman, S. (1990). Proprietary schools: a description of institutions and stu-dents. (Report No, 90-428EPW). Washington, DC.: Library of Congress, CongressionalResearch Service.
Arenson, K.W. (2000). DeVry gives career training the old college try. New York Times,B12. January 12.
Bailey, T. R. (2001). Community colleges in the 21st century: challenges and opportunities.Paper presented at the Workshop on the Impact of the Changing Economy on the Edu-cation System. Nevzer Stacy (ed.). Washington DC: National Academy of Sciences.
Bailey, T.R. & Averianova, I.E. (1998). Multiple Missions of Community Colleges: Con-flicting or Complementary. Community College Research Center: Teachers College,Columbia University.
Bender, L.W. (1991). Applied associate degree transfer phenomenon: Proprietaries andpublics. Community College Review 19:3, pp. 22-28.
Blumenstyk, G. (2000). How for-profit institutions chase community college students.Chronicle of Higher Education. December 8.
Borego, A. (2001). For many for-profit colleges, the transfer-of-credit blues. The Chronicleof Higher Education, June 8.
Borego, A. and G. Blumenstyk (2001). As Wall Street took a dive, higher educationstocks rebounded. The Chronicle of Higher Education, May 11.
Breneman, D.W., and Nelson, S.C. (1981). Financing Community Colleges. Washington,DC: Brookings Institution.
Burd, S. (1998). For-Profit Trade Schools Win New Respect in Congress. Chronicle ofHigher Education. September.
Burke, J.C., Rosen, J., Minassians, H. & Lessard, T. (2000). Performance Funding and Bud-geting: An Emerging Merger? The Fourth Annual Survey. Albany, NY: Nelson A.Rockefeller Institute of Government, State University of New York. ED 445626 http://
National Center for Postsecondary Improvement Page 59
www.rockinst.org/higheduc.html
Cross, K. Patricia. 1985. “Determining missions and priorities for the fifth generation.”in W.L. Deegan & D. Tillery (Ed) Renewing the American Community College: Priorities andStrategies for Effective Leadership. San Francisco: Jossey-Bass, Pp. 34-52.
Friedlander, M.C. (1980). Characteristics of students attending proprietary schools and factorsinfluencing their institutional choice. Cincinnati, Ohio: SouthWestern.
The Futures Project: Policy for Higher Education in a Changing World (2000). A briefingon for-profit higher education. Providence, RI: The Futures Project, Brown University.
Grubb, W.N. (1993). The long-run effects of proprietary schools on wages and earnings:Implications for federal policy. Educational Evaluation and Policy Analysis 15:1, pp. 17-33.
Grubb, W.N. (2001). From black box to Pandora’s box: Evaluating remedial/developmentaleducation. New York: Community College Research Center, Teachers College ColumbiaUniversity.
Grubb, W.N. (Ed.). (1995). Education through Occupations in American High Schools. NewYork, NY: Teachers College Press.
Hanson, G.A. & Parker, E.C. (1977). The vocational education industry, in W.G. Meyer(Ed), Vocational Education and the Nation’s Economy. Washington, DC: American Voca-tional Association.
Hebel, S. (2001). Mayor asks that CUNY outsource remediation. Chronicle of HigherEducation. May 11.
Kelly, K. F (2001). Meeting needs and making profits: the rise of for-profit degree-grantinginstitutions. ECS Issue Paper. Denver, CO: Economic Commission of the States.
Klein, S.P. and Orlando, M. (1999). CUNY’s Testing Program: Characteristics, Resources andImplications for Policy and Research. Report prepared for the Mayor’s Advisory Task Forceon the City University of New York. Santa Monica, CA: RAND.
Lee, J.B. & Merisotis, J.P. (1990). Proprietary schools: Programs, policies, and prospects.ASHE-ERIC Higher Education Report No. 5. Washington, DC: Association for the Studyof Higher Education (ED 331 337).
Moe, M.T., Bailey, K., Lau, R., (1999). The Book of Knowledge: Investing in the GrowingEducation and Training Industry. New York: Merrill Lynch & Co.

National Center for Postsecondary Improvement Page 60
Newman, F. (2001) “Interesting times: the end of the status quo and the rise of the mar-ket in higher education.” Providence, RI: The Futures Project: Policy for Higher Educa-tion in a Changing World, Brown University.
National Association of State Budget Officers. (2000). State Expenditure Report. Wash-ington, DC: NASBO.
National Center for Education Statistics (1999). Students at private, for-profit institutions.NCES 2000-175. Washington, DC: GPO.
Ortmann, A. (1998, August 31). The emergence of the for-profit higher education sector:Recent developments and some prognostications. Uncirculated Draft, Bowdoin CollegeEconomics Department.
Schneider, B. and Stevenson D. (1999). The amtitious generation: America’s teenagers, moti-vated but directionless. New Haven, CT: Yale University Press.
Schmidt, B.C., et al. (1999). The City University of New York: An institution adrift. NewYork: Mayor’s Advisory Task Force on the City University of New York.
Selingo, J. (1999). For-Profit Colleges Aim to Take a Share of State Financial-Aid Funds.Chronicle of Higher Education. September 24.
Shults, C. (2000). Remedial Education: Practices and Policies in Community Colleges. Wash-ington, DC: American Association of Community Colleges.
Strosnider, K. (1998). For-profit higher education sees booming enrollments and rev-enues. The Chronicle of Higher Education. January 23. A36.
U.S. Department of Education. (1999). National Center for Education Statistics. Inte-grated Postsecondary Education Data System (IPEDS) Institutional Characteristics 1997-98 survey. Electronic datafile.
Wilms, W.W. (1973). Proprietary Versus Public Vocational Education. Berkeley: Center forResearch and Development in Higher Education, University of California.
Wilms, W.W. (1974). Proprietary and public vocational students. Collegiate and Univer-sity Bulletin 26: 7, pp. 3-6.
Wilms, W.W, (1975). Public and Proprietary Vocational training: A Study of Effectiveness.Lexington, MA: D.C. Heath.
National Center for Postsecondary Improvement Page 61
Wyatt, e. (1999). Investors see room for profit in the demand for education. The NewYork Times. November 4, p. A1.
Zeiss, T. (1998). Will our students become theirs? Community College Journal 68:6. June/July, p8.
1 See Ortmann, (1998) for a discussion of this criticism.
2 The sample of respondents and the nature of these interviews is discussed in the case study section of
this report.
3 In order to be eligible for federal financial aid, students must be enrolled in an program or institutions
authorized under Title IV of the Higher Education Act of 1965. Such institutions are referred to as “TitleIV eligible institutions.” To be Title IV eligible, institutions must be accredited by an accreditation agency
approved by the U.S. Department of Education.
4 Regional accreditation is considered the gold standard of accreditation. Although Bender identified 23
percent of baccalaureate and associate degree granting proprietary institutions as accredited by a regional
accrediting agency, our study shows a much smaller proportion (see Tables 5 and 6).
5While females are the majority at most for-profits, they are the minority at the proprietary institution we
studied in this report — an institution that emphasizes technical careers.
6 It is perhaps surprising that the acceptance rate at public two-year schools is as low as 86 percent, but
this partly reflects capacity constraints. Some community colleges, receive more applicants than theyhave places. When this is true, students are accepted on a first-come first-serve basis. It is also possiblethat students who fail assessment tests and are required to take non-credit developmental education
course before matriculating are not considered to have been accepted.
7 While the periods are not the same, the implications of these two trends are so different that it is un-
likely that analyses based on the same periods could make that much difference.
8 On the other hand, the small number of regionally accredited two-year for-profits look much more like
their public sector counterparts.
9 Advocates argue that there is a market for the applied BA, especially among students who start out at
National Center for Postsecondary Improvement Page 62
community colleges. Critics worry that if community colleges start to emphasize BAs, that they will losesight of their mission to provide wide access to post-secondary education for all students. The for-profits
are less constrained by these considerations.
10 A significant exception to mandatory placement in remediation occurs in California where remediation
is recommended — not required. For a study of institutional policies and practices related to assessmentand delivery of remedial education see Shults, C. (2000). Remedial Education: Practices and Policies in
Community Colleges. Washington, DC: American Association of Community Colleges. p. 5
11 ibid, p. 8-9.
12 Many community college staff argue that it is a mistake to focus too much on credit courses and
degrees. According to this view, many students, perhaps the large majority, are not seeking degrees andtheir needs are being met by non-credit courses or by sequences of credit courses that do not necessarilyresult in degrees. An over-preoccupation with degrees fails to recognize and accommodate specific
student needs.
13 See Grubb 1995 Education Through Occupations and the articles included in the publication for argu-
ments in favor of the integration of academic and vocational education.
14 See for example Breneman and Nelson (1981) and see Bailey and Averianova (2000) for a review of this
issue.
15 It is also interesting that for-profit institutions of higher education continued to be attractive to inves-
tors even after the sharp declines in stock market indices in 2000 and 2001 (Borrego and Blumenstyk,
2001).
16 See Bailey (2001) for a discussion of why community colleges continue to take on more functions.
17 Many popular programs in community colleges such as those in nursing already follow this approach.
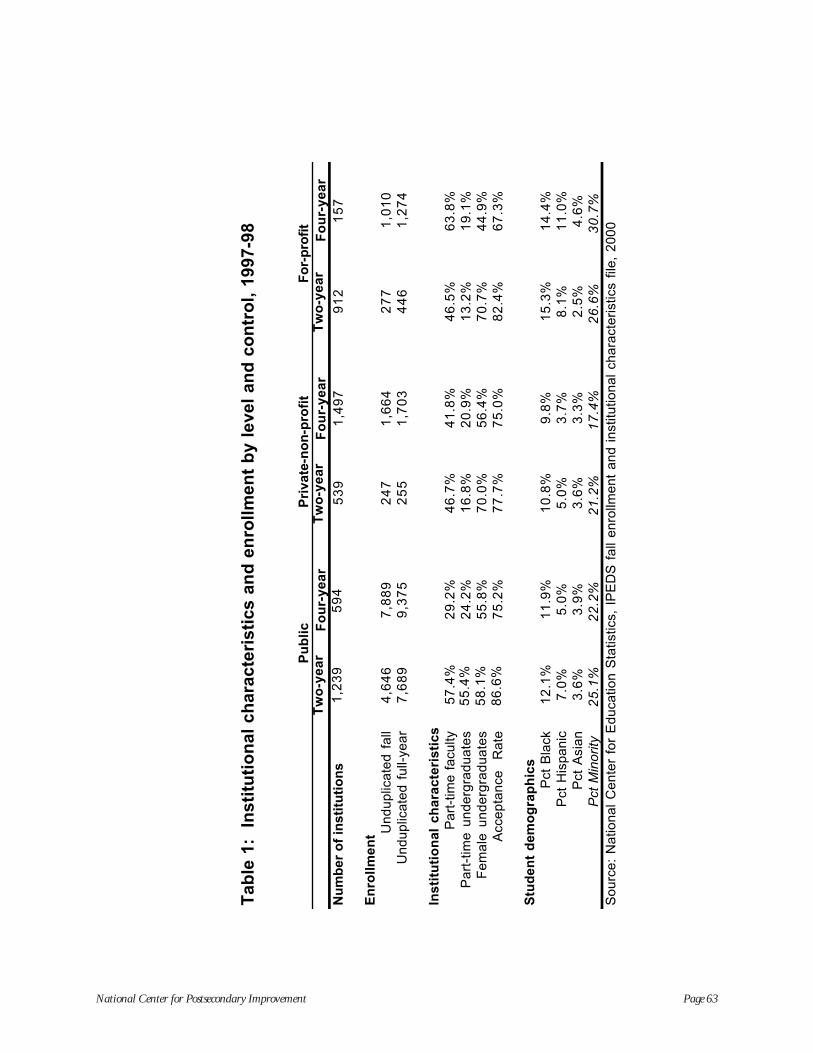
National Center for Postsecondary Improvement Page 63
Tab
le 1
: I
nst
itu
tio
nal
ch
arac
teri
stic
s an
d e
nro
llm
ent
by
leve
l an
d c
on
tro
l, 1
997-
98
Tw
o-y
ea
rF
ou
r-y
ea
rT
wo
-ye
ar
Fo
ur-
ye
ar
Tw
o-y
ea
rF
ou
r-y
ea
rN
um
ber
of
inst
itu
tio
ns
1,2
39
59
45
39
1,4
97
91
21
57
En
roll
me
nt U
nd
up
lica
ted
fa
ll4
,64
67
,88
92
47
1,6
64
27
71
,01
0U
nd
up
lica
ted
fu
ll-ye
ar
7,6
89
9,3
75
25
51
,70
34
46
1,2
74
Ins
titu
tio
na
l c
ha
rac
teri
sti
cs
Pa
rt-t
ime
fa
culty
57
.4%
29
.2%
46
.7%
41
.8%
46
.5%
63
.8%
Pa
rt-t
ime
un
de
rgra
du
ate
s5
5.4
%2
4.2
%1
6.8
%2
0.9
%1
3.2
%1
9.1
%F
em
ale
un
de
rgra
du
ate
s5
8.1
%5
5.8
%7
0.0
%5
6.4
%7
0.7
%4
4.9
%A
cce
pta
nce
R
ate
86
.6%
75
.2%
77
.7%
75
.0%
82
.4%
67
.3%
Stu
de
nt
de
mo
gra
ph
ics
Pct
Bla
ck1
2.1
%1
1.9
%1
0.8
%9
.8%
15
.3%
14
.4%
Pct
His
pa
nic
7.0
%5
.0%
5.0
%3
.7%
8.1
%1
1.0
%P
ct A
sia
n3
.6%
3.9
%3
.6%
3.3
%2
.5%
4.6
%P
ct M
inor
ity2
5.1
%2
2.2
%2
1.2
%1
7.4
%2
6.6
%3
0.7
%S
ou
rce
: N
atio
na
l C
en
ter
for
Ed
uca
tion
Sta
tistic
s, I
PE
DS
fa
ll e
nro
llme
nt
an
d i
nst
itutio
na
l ch
ara
cte
rist
ics
file
, 2
00
0
Pu
bli
c
Pri
vate
-no
n-p
rofi
tF
or-
pro
fit
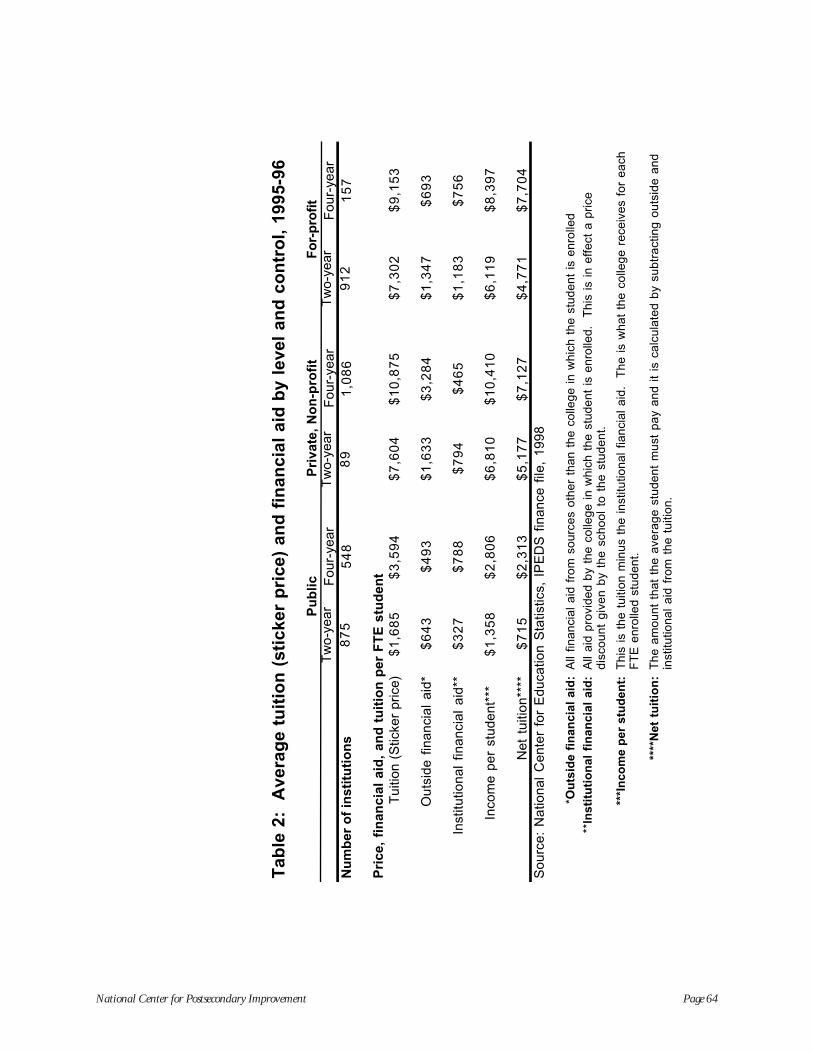
National Center for Postsecondary Improvement Page 64
Tab
le 2
: A
vera
ge
tuit
ion
(st
icke
r p
rice
) an
d f
inan
cial
aid
by
leve
l an
d c
on
tro
l, 1
995-
96
Tw
o-ye
arF
ou
r-ye
ar
Tw
o-ye
arF
ou
r-ye
ar
Tw
o-ye
arF
ou
r-ye
ar
Nu
mb
er o
f in
stit
uti
on
s8
75
54
88
91
,08
69
12
15
7
Pri
ce,
fin
anci
al a
id,
and
tu
itio
n p
er F
TE
stu
den
tT
uitio
n (S
ticke
r pr
ice)
$1
,68
5$
3,5
94
$7
,60
4$
10
,87
5$
7,3
02
$9
,15
3
Ou
tsid
e f
ina
nci
al
aid
*$
64
3$
49
3$
1,6
33
$3
,28
4$
1,3
47
$6
93
Inst
itutio
na
l fin
an
cia
l a
id**
$3
27
$7
88
$7
94
$4
65
$1
,18
3$
75
6
Inco
me
pe
r st
ud
en
t***
$
1,3
58
$2
,80
6$
6,8
10
$1
0,4
10
$6
,11
9$
8,3
97
Ne
t tu
itio
n**
**$
71
5$
2,3
13
$5
,17
7$
7,1
27
$4
,77
1$
7,7
04
So
urc
e:
Na
tion
al
Ce
nte
r fo
r E
du
catio
n S
tatis
tics,
IP
ED
S f
ina
nce
file
, 1
99
8
*Ou
tsid
e fi
nan
cial
aid
:
**In
stit
uti
on
al f
inan
cial
aid
:
***I
nco
me
per
stu
den
t:
****
Ne
t tu
itio
n:
All
aid
pro
vid
ed
by
the
co
lleg
e i
n w
hic
h t
he
stu
de
nt
is e
nro
lled
. T
his
is
in e
ffe
ct a
pri
ce
dis
cou
nt
giv
en
by
the
sch
oo
l to
th
e s
tud
en
t.
All
fina
nci
al
aid
fro
m s
ou
rce
s o
the
r th
an
th
e c
olle
ge
in
wh
ich
th
e s
tud
en
t is
en
rolle
d
Th
e a
mo
un
t th
at
the
ave
rag
e s
tud
en
t m
ust
pa
y a
nd
it
is c
alc
ula
ted
by
sub
tra
ctin
g o
uts
ide
an
d
inst
itutio
na
l a
id f
rom
th
e t
uiti
on
.
Th
is i
s th
e t
uiti
on
min
us
the
in
stitu
tion
al
fian
cia
l a
id.
Th
e i
s w
ha
t th
e c
olle
ge
re
ceiv
es
for
ea
ch
FT
E e
nrol
led
stud
ent.
Pu
bli
c
Pri
vate
, N
on
-pro
fit
Fo
r-p
rofi
t
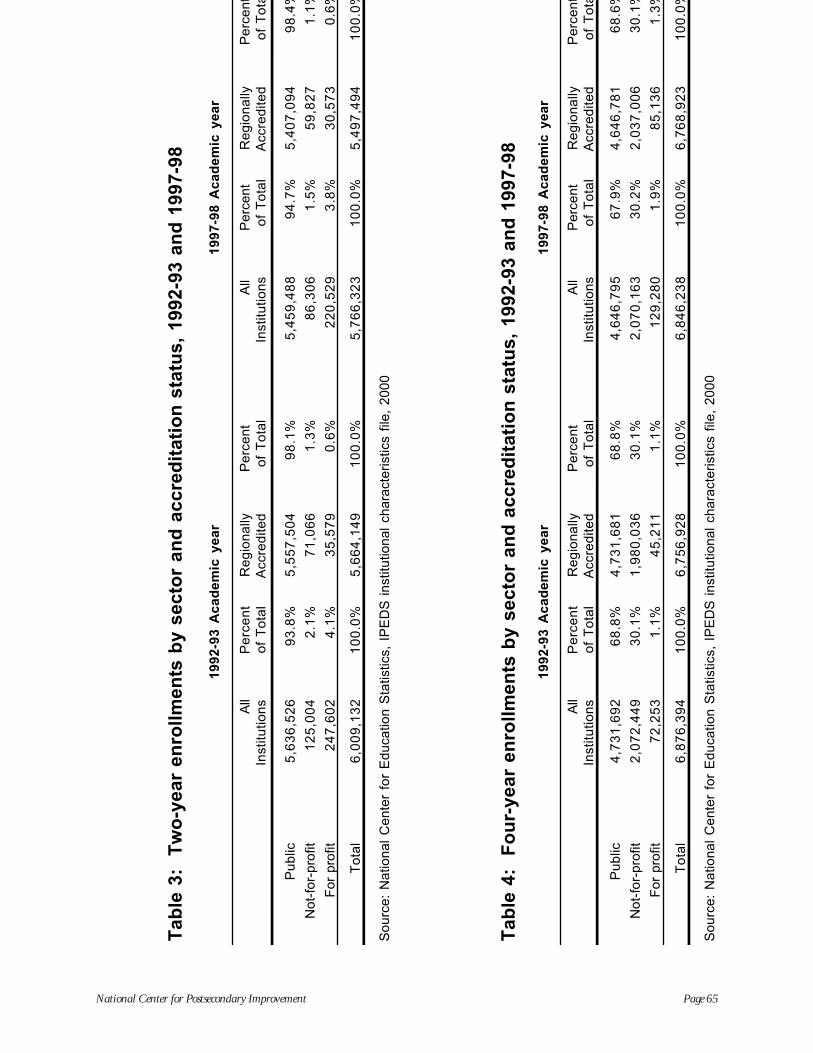
National Center for Postsecondary Improvement Page 65
Ta
ble
4:
Fo
ur-
ye
ar
en
roll
me
nts
by
se
cto
r a
nd
ac
cre
dit
ati
on
sta
tus
, 1
99
2-9
3 a
nd
19
97
-98
All
Pe
rce
nt
Re
gio
na
llyP
erc
en
t A
ll P
erc
en
t R
eg
ion
ally
Pe
rce
nt
Inst
itutio
ns
of
To
tal
Acc
red
ited
of
To
tal
Inst
itutio
ns
of
To
tal
Acc
red
ited
of
To
ta
Pu
blic
4,7
31
,69
26
8.8
%4
,73
1,6
81
68
.8%
4,6
46
,79
56
7.9
%4
,64
6,7
81
68
.6%
No
t-fo
r-p
rofit
2,0
72
,44
93
0.1
%1
,98
0,0
36
30
.1%
2,0
70
,16
33
0.2
%2
,03
7,0
06
30
.1%
For
pro
fit7
2,2
53
1.1
%4
5,2
11
1.1
%1
29
,28
01
.9%
85
,13
61
.3%
To
tal
6,8
76
,39
41
00
.0%
6,7
56
,92
81
00
.0%
6,8
46
,23
81
00
.0%
6,7
68
,92
31
00
.0%
So
urc
e:
Na
tion
al
Ce
nte
r fo
r E
du
catio
n S
tatis
tics,
IP
ED
S i
nst
itutio
na
l ch
ara
cte
rist
ics
file
, 2
00
0
19
97
-98
Ac
ad
em
ic y
ea
r1
99
2-9
3 A
ca
de
mic
ye
ar
Ta
ble
3:
Tw
o-y
ea
r e
nro
llm
en
ts b
y s
ec
tor
an
d a
cc
red
ita
tio
n s
tatu
s,
19
92
-93
an
d 1
99
7-9
8
All
Pe
rce
nt
Re
gio
na
llyP
erc
en
t A
ll P
erc
en
t R
eg
ion
ally
Pe
rce
nt
Inst
itutio
ns
of
To
tal
Acc
red
ited
of
To
tal
Inst
itutio
ns
of
To
tal
Acc
red
ited
of
To
ta
Pu
blic
5,6
36
,52
69
3.8
%5
,55
7,5
04
98
.1%
5,4
59
,48
89
4.7
%5
,40
7,0
94
98
.4%
No
t-fo
r-p
rofit
12
5,0
04
2.1
%7
1,0
66
1.3
%8
6,3
06
1.5
%5
9,8
27
1.1
%
For
pro
fit2
47
,60
24
.1%
35
,57
90
.6%
22
0,5
29
3.8
%3
0,5
73
0.6
%
To
tal
6,0
09
,13
21
00
.0%
5,6
64
,14
91
00
.0%
5,7
66
,32
31
00
.0%
5,4
97
,49
41
00
.0%
So
urc
e:
Na
tion
al
Ce
nte
r fo
r E
du
catio
n S
tatis
tics,
IP
ED
S i
nst
itutio
na
l ch
ara
cte
rist
ics
file
, 2
00
0
19
97
-98
Ac
ad
em
ic y
ea
r1
99
2-9
3 A
ca
de
mic
ye
ar
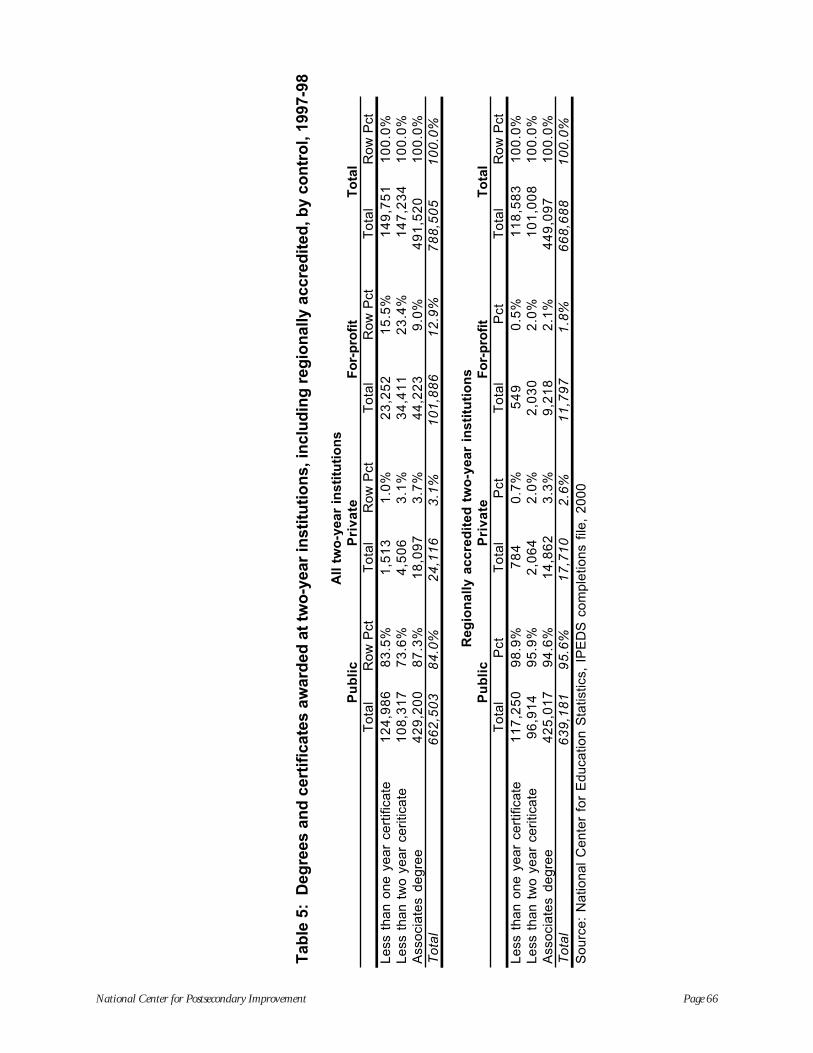
National Center for Postsecondary Improvement Page 66
Tab
le 5
: D
egre
es a
nd
cer
tifi
cate
s aw
ard
ed a
t tw
o-y
ear
inst
itu
tio
ns,
incl
ud
ing
reg
ion
ally
acc
red
ited
, by
con
tro
l, 19
97-9
8
To
tal
Row
Pct
To
tal
Row
Pct
To
tal
Row
Pct
To
tal
Row
Pct
Le
ss t
ha
n o
ne
ye
ar
cert
ifica
te1
24
,98
68
3.5
%1
,51
31
.0%
23
,25
21
5.5
%1
49
,75
11
00
.0%
Le
ss t
ha
n t
wo
ye
ar
ceri
tica
te1
08
,31
77
3.6
%4
,50
63
.1%
34
,41
12
3.4
%1
47
,23
41
00
.0%
Ass
oci
ate
s d
eg
ree
42
9,2
00
87
.3%
18
,09
73
.7%
44
,22
39
.0%
49
1,5
20
10
0.0
%T
ota
l6
62
,50
38
4.0
%2
4,1
16
3.1
%1
01
,88
61
2.9
%7
88
,50
51
00
.0%
To
tal
Pct
To
tal
Pct
To
tal
Pct
To
tal
Row
Pct
Le
ss t
ha
n o
ne
ye
ar
cert
ifica
te1
17
,25
09
8.9
%7
84
0.7
%5
49
0.5
%1
18
,58
31
00
.0%
Le
ss t
ha
n t
wo
ye
ar
ceri
tica
te9
6,9
14
95
.9%
2,0
64
2.0
%2
,03
02
.0%
10
1,0
08
10
0.0
%A
sso
cia
tes
de
gre
e4
25
,01
79
4.6
%1
4,8
62
3.3
%9
,21
82
.1%
44
9,0
97
10
0.0
%T
ota
l6
39
,18
19
5.6
%1
7,7
10
2.6
%1
1,7
97
1.8
%6
68
,68
81
00
.0%
So
urc
e:
Na
tion
al
Ce
nte
r fo
r E
du
catio
n S
tatis
tics,
IP
ED
S c
om
ple
tion
s fil
e,
20
00
To
tal
To
tal
All
tw
o-y
ear
inst
itu
tio
ns
Re
gio
na
lly
ac
cre
dit
ed
tw
o-y
ea
r in
sti
tuti
on
sP
ub
lic
Pri
va
teF
or-
pro
fit
Pu
bli
cP
riv
ate
Fo
r-p
rofi
t
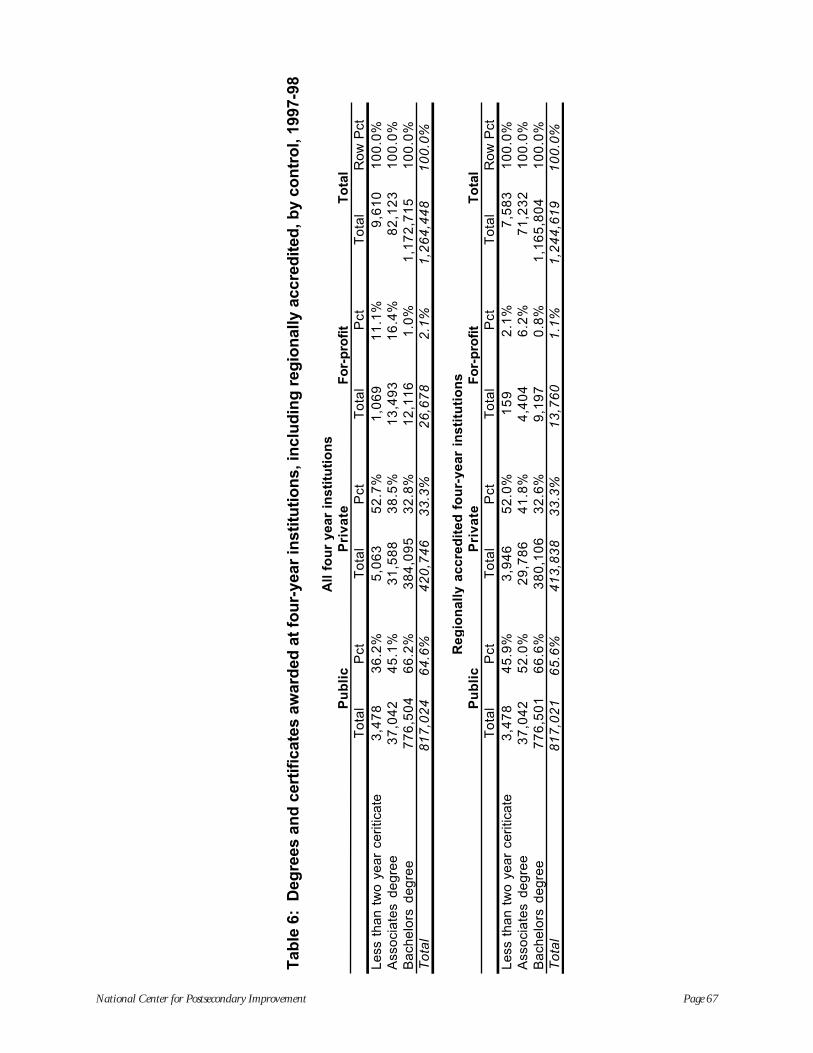
National Center for Postsecondary Improvement Page 67
Tab
le 6
: D
egre
es a
nd
cer
tifi
cate
s aw
ard
ed a
t fo
ur-
year
inst
itu
tio
ns,
incl
ud
ing
reg
ion
ally
acc
red
ited
, by
con
tro
l, 19
97-9
8
To
tal
Pct
To
tal
Pct
To
tal
Pct
To
tal
Row
Pct
Le
ss t
ha
n t
wo
ye
ar
ceri
tica
te3
,47
83
6.2
%5
,06
35
2.7
%1
,06
91
1.1
%9
,61
01
00
.0%
Ass
oci
ate
s d
eg
ree
37
,04
24
5.1
%3
1,5
88
38
.5%
13
,49
31
6.4
%8
2,1
23
10
0.0
%B
ach
elo
rs d
eg
ree
77
6,5
04
66
.2%
38
4,0
95
32
.8%
12
,11
61
.0%
1,1
72
,71
51
00
.0%
To
tal
81
7,0
24
64
.6%
42
0,7
46
33
.3%
26
,67
82
.1%
1,2
64
,44
81
00
.0%
To
tal
Pct
To
tal
Pct
To
tal
Pct
To
tal
Row
Pct
Le
ss t
ha
n t
wo
ye
ar
ceri
tica
te3
,47
84
5.9
%3
,94
65
2.0
%1
59
2.1
%7
,58
31
00
.0%
Ass
oci
ate
s d
eg
ree
37
,04
25
2.0
%2
9,7
86
41
.8%
4,4
04
6.2
%7
1,2
32
10
0.0
%B
ach
elo
rs d
eg
ree
77
6,5
01
66
.6%
38
0,1
06
32
.6%
9,1
97
0.8
%1
,16
5,8
04
10
0.0
%T
ota
l8
17
,02
16
5.6
%4
13
,83
83
3.3
%1
3,7
60
1.1
%1
,24
4,6
19
10
0.0
%
To
tal
To
tal
All
fo
ur
year
in
stit
uti
on
s
Pu
bli
cP
riv
ate
Fo
r-p
rofi
t
Pu
bli
cP
riv
ate
Fo
r-p
rofi
t
Re
gio
na
lly
ac
cre
dit
ed
fo
ur-
ye
ar
ins
titu
tio
ns
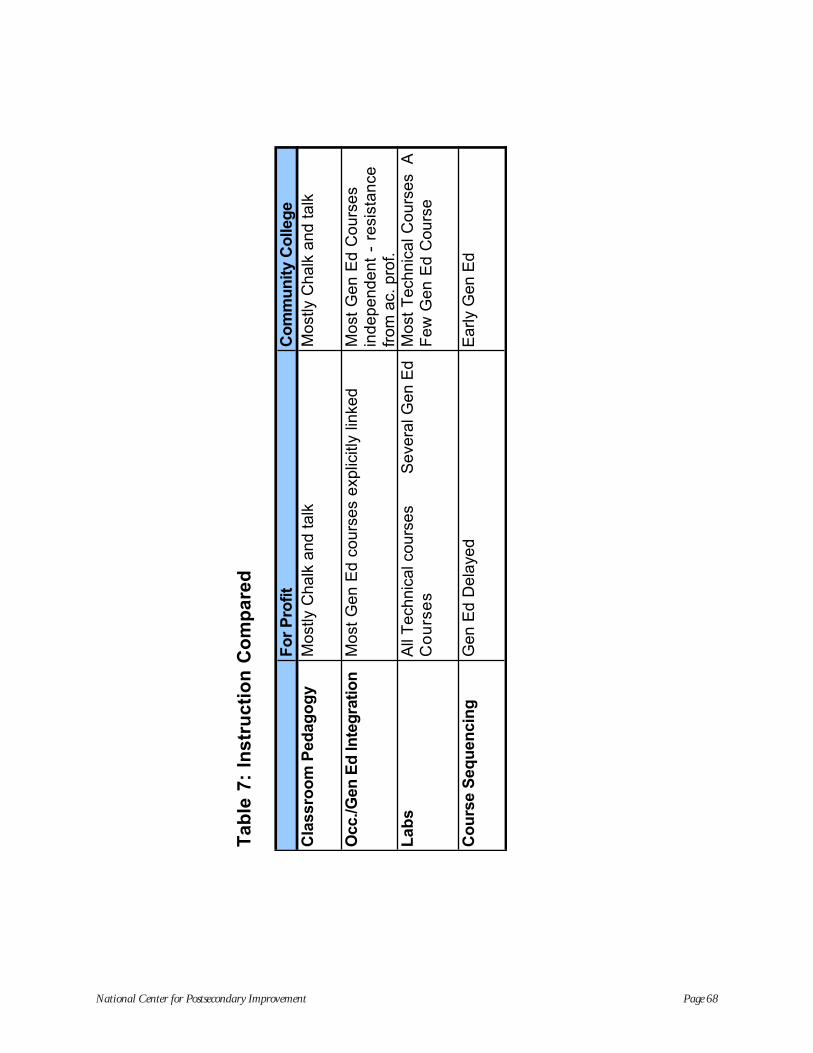
National Center for Postsecondary Improvement Page 68
Fo
r P
rofi
tC
om
mu
nit
y C
olle
ge
Cla
ssro
om
Ped
ago
gy
Mos
tly C
halk
and
tal
kM
ostly
Cha
lk a
nd t
alk
Occ
./Gen
Ed
Inte
gra
tio
nM
ost
Gen
Ed
cour
ses
expl
icitl
y lin
ked
Mos
t G
en E
d C
ours
es
ind
ep
en
de
nt
- re
sist
an
ce
from
ac.
pro
f.L
abs
All
Tec
hnic
al c
ours
es
Sev
eral
Gen
Ed
Co
urs
es
Mos
t T
echn
ical
Cou
rses
A
F
ew G
en E
d C
ours
e
Co
urs
e S
equ
enci
ng
Gen
Ed
Del
ayed
Ear
ly G
en E
d
Ta
ble
7:
Ins
tru
cti
on
Co
mp
are
d
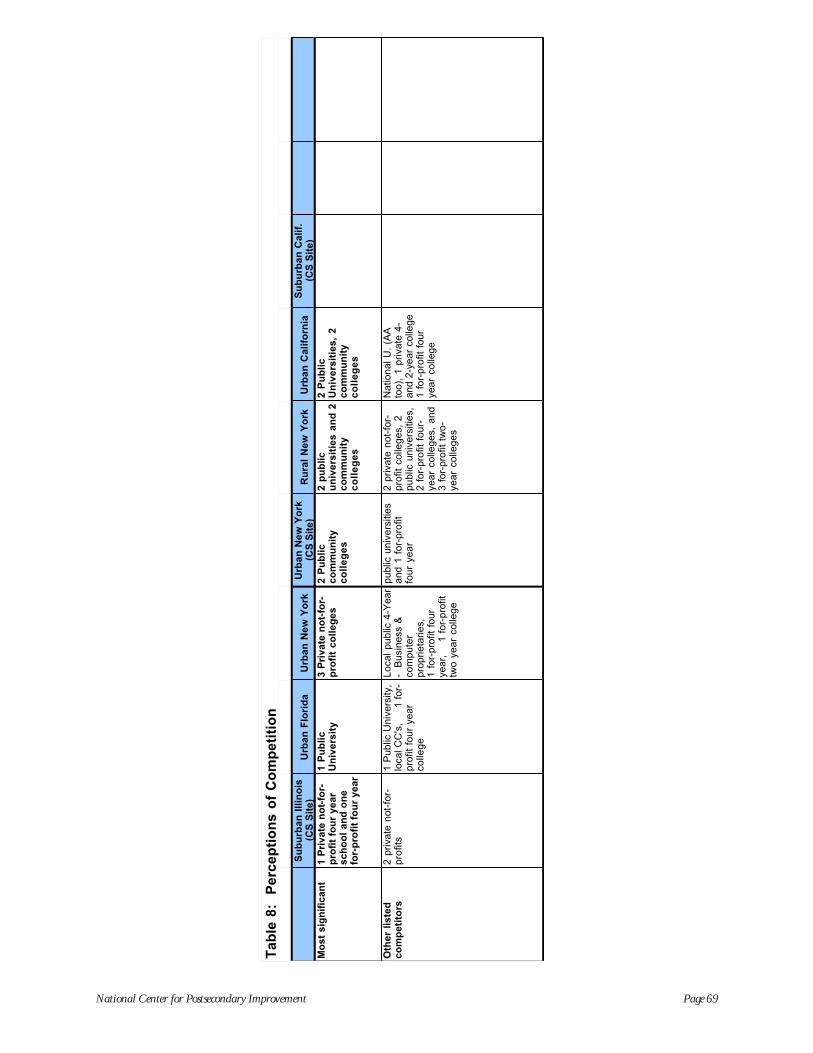
National Center for Postsecondary Improvement Page 69
Su
bu
rba
n I
llin
ois
(C
S S
ite)
Urb
an F
lori
da
Urb
an N
ew Y
ork
Urb
an N
ew Y
ork
(C
S S
ite)
Ru
ral
New
Yo
rkU
rban
Cal
ifo
rnia
Su
bu
rban
Cal
if.
(CS
Sit
e)M
ost
sig
nif
ican
t 1
Pri
vate
no
t-fo
r-p
rofi
t fo
ur
year
sc
ho
ol
and
on
e fo
r-p
rofi
t fo
ur
year
1 P
ub
lic
U
niv
ers
ity
3
Pri
vate
no
t-fo
r-p
rofi
t c
oll
eg
es
2 P
ub
lic
co
mm
un
ity
co
lle
ge
s
2 p
ub
lic
un
ive
rsit
ies
an
d 2
co
mm
un
ity
co
lle
ge
s
2 P
ub
lic
U
niv
ers
itie
s,
2
com
mu
nit
y c
oll
eg
es
Oth
er l
iste
d
co
mp
eti
tors
2 p
riva
te n
ot-
for-
pro
fits
1 P
ublic
Uni
vers
ity,
loca
l CC
's,
1 fo
r-p
rofit
fo
ur
yea
r co
lleg
e
Lo
cal
pu
blic
4-Y
ea
r -
Bus
ines
s &
co
mp
ute
r pr
oprie
tarie
s,
1
fo
r-p
rofit
fo
ur
year
,
1 f
or-p
rofit
tw
o y
ea
r co
lleg
e
pu
blic
un
ive
rsiti
es
an
d 1
fo
r-p
rofit
fo
ur
yea
r
2 p
riva
te n
ot-
for-
pro
fit c
olle
ge
s, 2
p
ub
lic u
niv
ers
itie
s,
2 f
or-
pro
fit f
ou
r-ye
ar
colle
ge
s, a
nd
3
for-
prof
it tw
o-ye
ar
colle
ge
s
Nat
iona
l U.
(AA
to
o),
1 p
riva
te 4
- an
d 2-
year
col
lege
1
fo
r-p
rofit
fo
ur
yea
r co
lleg
e
Ta
ble
8:
Pe
rce
pti
on
s o
f C
om
pe
titi
on