for personal use only - tpg telecom · this presentation contains certain forward-looking and...
TRANSCRIPT

For
per
sona
l use
onl
y

FY19 SUMMARY RESULTS
Reported Underlying1
FY19 FY182 FY19 FY182 Growth
Revenue $m 2,477.4 2,496.1 2,477.4 2,496.1 (<1%)
EBITDA$m 809.4 826.7 818.4 826.7 (1%)
BAU4 EBITDA $m 823.8 828.1 823.8 828.1 (<1%)
NPAT5 $m 173.8 396.4 376.2 432.1 (13%)
EPS5 cps 18.7 42.8 40.5 46.7 (13%)
(1) Refer to slide 3 for reconciliation between reported and underlying results
(2) Re-stated for implementation of AASB 15
(3) Impairment arising from decision to cease Australian mobile network build
(4) Business as Usual (‘BAU’) excludes Singapore and Australia mobile and transaction costs relating to planned
merger, the same basis as on which BAU EBITDA guidance for FY19 was provided
(5) The decline in underlying NPAT and EPS in FY19 reflects the impact of commencing the amortisation of the Group’s
Australian spectrum licences from 2H19. Reported NPAT and EPS for FY19 are also impacted by the impairment3.
2
(before impairment3)
For
per
sona
l use
onl
y

RECONCILIATION OF REPORTED TO UNDERLYING & BAU RESULTS
FY19 FY182
$m EBITDA NPAT EBITDA NPAT
Reported 572.6 173.8 826.7 396.4
Add: Transaction costs re planned merger with VHA 9.0 6.3 - -
Add: Australian mobile network and spectrum impairment1 236.8 165.7 - -
Add: Acquired customer base intangible amortisation - 30.4 - 35.7
Underlying 818.4 376.2 826.7 432.1
Add: Singapore mobile loss 2.7 1.4
Add: Australian mobile loss 2.7 -
Business as Usual (‘BAU’) 823.8 828.1
3
(1) Impairment arising from decision to cease Australian mobile network build.
(2) Re-stated for implementation of AASB 15
For
per
sona
l use
onl
y

FY19 RESULTS vs GUIDANCE
4
FY19
Guidance
FY19
Actual
BAU EBITDA 800-820 823.8
BAU capex 180-220 198.7
For
per
sona
l use
onl
y

FY18 → FY19 BAU EBITDA BRIDGE
5
(1) Restated for implementation of AASB15.
(2) FY19 actual ‘other growth’ of $57m comprises growth of $72m partly offset by a $15m decline in profitability of the
Group’s existing NBN subscriber base in the year.
FY19 Guidance >> $828m1($50m) ($15m) $37-57m $800-820m
FY19 Actual >> $828m1($47m) ($14m) $57m2
$824m
FY18 DSL-->NBN iiNet Other FY19BAU GP margin home phone growth BAU
EBITDA reduction GP decrease EBITDA
For
per
sona
l use
onl
y

FY19 GROUP SEGMENT ANALYSIS
1H16
REVENUE $m Consumer Corporate SingaporeAust
mobileOther TOTAL
FY19 1,719.0 758.4 - - - 2,477.4
FY182 1,742.3 753.8 - - - 2,496.1
Movement (23.3) 4.6 - - - (18.7)
EBITDA $m Consumer Corporate SingaporeAust
mobileOther TOTAL
FY19 457.3 367.1 (2.7) (2.7) (0.6) 818.4
FY182 499.1 329.7 (1.4) - (0.7) 826.7
Movement (41.8) 37.4 (1.3) (2.7) 0.1 (8.3)
EBITDA % Consumer Corporate SingaporeAust
mobileOther TOTAL
FY19 27% 48% - - - 33%
FY182 29% 44% - - - 33%
(1) Results shown in the table are ‘underlying’ results incorporating the adjustments set out on slide 3
(2) Restated for implementation of AASB15
6
For
per
sona
l use
onl
y

FY19 CONSUMER SEGMENT PRODUCT ANALYSIS
1H16
Consumer Segment
$m Broadband Fixed Voice Mobile Other Total
FY19
Revenue 1,459.1 71.1 108.1 80.7 1,719.0
Gross Profit 627.1 20.1 22.3 45.9 715.4
Gross Profit % 43% 28% 21% 57% 42%
Overheads (258.1)
Overheads % 15%
EBITDA 457.3
EBITDA % 27%
FY182
Revenue 1,425.3 114.9 111.6 90.5 1,742.3
Gross Profit 670.1 33.1 25.3 49.5 778.0
Gross Profit % 47% 29% 23% 55% 45%
Overheads (278.9)
Overheads % 16%
EBITDA 499.1
EBITDA % 29%
7
(1) Results shown in the table are ‘underlying’ results incorporating the adjustments set out on slide 3
(2) Restated for implementation of AASB15
For
per
sona
l use
onl
y

FY19 CORPORATE SEGMENT
Corporate Segment Revenue
$m Data/Internet VoiceLegacy
iiNetTotal
FY19 592.2 115.4 50.8 758.4
FY18 562.7 130.4 60.7 753.8
FY19 growth 29.5 (15.0) (9.9) 4.6
$m
Corporate
Segment
EBITDA
FY19 367.1
FY18 329.7
FY19 growth 37.4
8
30%
40%
50%
60%
70%
1H18 2H18 1H19 2H19
Corporate Segment Margin Growth
GP % EBITDA %
For
per
sona
l use
onl
y

FY19 CASH FLOW
1H16
FY19 FY18
Operating Cash Flow 836.3 868.3
Tax (128.6) (194.5)
Capex – Australia – BAU (198.7) (258.0)
Capex – Australia – mobile spectrum (352.4) (597.3)
Capex – Australia – mobile network (86.1) (38.7)
Capex – Singapore – mobile network (80.1) (62.3)
IRU/finance lease payments (5.5) (34.1)
Operating Cash Flow less Capex (15.1) (316.6)
$m
‘Capex’ includes payments for property, plant and equipment plus intangible assets.
9
For
per
sona
l use
onl
y

FY19 NON OPERATING CASH FLOWS
1H16 1H15
FY19 FY18
Operating Cash Flow less Capex (15.1) (316.6)
Transaction costs re planned merger (6.6) -
Net drawdown of bank debt 87.8 430.8
Debt facility amendment & extension costs - (10.8)
Interest payments (net) (60.2) (44.6)
Dividend payments (37.1) (23.0)
Other 0.4 0.1
(Decrease)/increase in cash balance (30.8) 35.9
$m
10
For
per
sona
l use
onl
y

FY19 NET DEBT
1H16
$m
Net debt1 as at 31 July 2018 1,271.3
Net increase during FY19 182.9
Net debt1 as at 31 July 2019 1,454.2
Spectrum commitments as at 31 July 2019
- 700MHz spectrum final instalment due 31-Jan-20
- 3.6GHz spectrum payment due March 2020
352.4
131.7
2
3
Net debt1 + spectrum commitments as at 31 July 2019 1,938.3
Leverage ratio as at 31-July-19: ~2.4x (calculated on a net debt + spectrum commitments to last twelve months underlying EBITDA basis).
1. For the purpose of the table above, ‘Net debt’ comprises bank debt, derivative financial liabilities
and finance lease liabilities less cash.
2. Disclosed as a spectrum liability in the 31-July-19 balance sheet at its discounted value as at that
date of $344.2m.
3. Disclosed within capital commitments in the notes to the 31-July-19 financial statements.
11
For
per
sona
l use
onl
y

GROUP BROADBAND SUBSCRIBERS
FY19 movement includes +358k NBN and +10k FTTB
12
For
per
sona
l use
onl
y

TPG Rated #1 for NBN Average Download Speed
13
For
per
sona
l use
onl
y

TPG NBN Reliability
14
For
per
sona
l use
onl
y

Small Office Phone Solution
15
For
per
sona
l use
onl
y

iiNet Internet Service Provider of the Year
16
For
per
sona
l use
onl
y

GROUP MVNO SUBSCRIBERS
444 421 422 430 410
-
50
100
150
200
250
300
350
400
450
Jul-17 Jan-18 Jul-18 Jan-19 Jul-19
Su
bscrib
ers
(00
0s)
Group MVNO Subscribers
2H19 movement reflects increased competitive intensity in mobile
17
For
per
sona
l use
onl
y
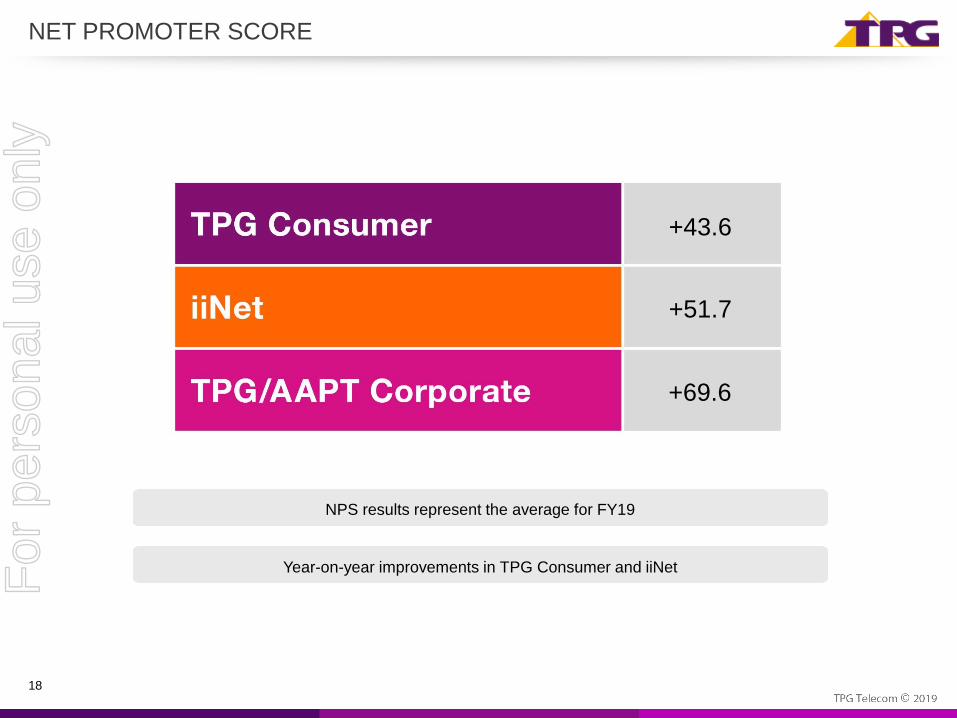
NET PROMOTER SCORE
+43.6
+51.7
+69.6
18
NPS results represent the average for FY19
Year-on-year improvements in TPG Consumer and iiNetFor
per
sona
l use
onl
y

SINGAPORE UPDATE
19
• Outdoor service coverage at 99.69% at July 2019.
• On track to meet IMDA indoor service milestone.
• MRT and road tunnels coverage progressing.
• Signups for free trial now close to 300k.
• Continued positive feedback on network coverage and quality.
• Free unlimited roaming to Malaysia and Indonesia launched. Free roaming to India to start in Sept 2019.
For
per
sona
l use
onl
y

FINAL DIVIDEND
1H16
2.0 cents per share final FY19 dividend
Payable 19 November 2019
Record date 15 October 2019
20
Dividend Reinvestment Plan currently suspended
For
per
sona
l use
onl
y

FY20 GUIDANCE
$mFY19
Actual
FY20
Guidance
BAU EBITDA 823.8 735-750
BAU capex 198.7 200-240
‘BAU EBITDA’ relates to existing Consumer and Corporate Division operations. It excludes Singapore
EBITDA and Australian mobile network operating costs.
‘BAU capex’ excludes any expenditure in relation to the Singapore mobile network build and also
excludes spectrum payments.
‘BAU EBITDA’ and capex guidance takes no account of any impact from the planned merger with VHA.
Transaction costs relating to the planned merger are also excluded.
‘BAU EBITDA’ guidance is provided on an excluding AASB16 basis. AASB16 will be effective from the
start of FY20 and is expected to have the effect of increasing EBITDA by moving certain operating lease
expenditure out of EBITDA and into amortisation and financing costs.
21
For
per
sona
l use
onl
y

FY20 GUIDANCE: BAU EBITDA BRIDGE
Guidance
22
$824m (~$75m) (~$10m) (~$25m) $21-36m $735-750m
FY19A DSL-->NBN iiNet Decline in Other FY20FBAU GP margin fixed voice profitability growth BAU
EBITDA reduction GP decrease of existing EBITDANBN base
For
per
sona
l use
onl
y

VHA MERGER UPDATE
23
30 August 2018: Announcement of planned merger of equals, subject to regulatory and shareholder approvals.
8 May 2019: ACCC announces decision to oppose the proposed merger.
24 May 2019: Proceedings lodged with Federal Court of Australia by the merger parties seeking orders that the
proposed merger will not have the effect, or likely effect, of substantially lessening competition.
10 September 2019: Federal Court hearing scheduled to commence. Scheduled to complete within three weeks.
For
per
sona
l use
onl
y

THANK YOU
Q&A
For
per
sona
l use
onl
y

APPENDIX 1: ARPU & Fixed Voice Subscribers
ARPU shown is the weighted average
across all brands. Excludes GST and any
one-off charges.
ARPU for NBN and On Net ADSL includes
revenue from bundled home phone voice.
iiNet fixed voice subscribers represent
standalone home phone services which
are declining as they are replaced by NBN
services.
347
292
238 201
156
-
50
100
150
200
250
300
350
Jul-17 Jan-18 Jul-18 Jan-19 Jul-19
Subscribers
(000s)
iiNet Fixed Voice Subscribers
67.4
53.0 49.7
63.3
31.0
67.0
53.1 49.7
63.3
28.7
0.0
10.0
20.0
30.0
40.0
50.0
60.0
70.0
80.0
NBN On-net ADSL Off-net ADSL On-netFTTB/HFC/VDSL
Fixed Phone
ARPU ($/mth)
1H19 2H19
For
per
sona
l use
onl
y

APPENDIX 2: Acquired Customer Base Intangible Amortisation
$mFY19
Actual
FY20
F’cast
FY21
F’cast
FY22
F’cast
FY23
F’cast
FY24
F’cast
Acquired customer base
intangible amortisation43.5 31.7 20.8 15.3 11.2 8.4
The expected pre-tax P&L expense in relation to the Group’s acquired customer base intangible amortisation is
shown above. There are no cashflows associated with this expense.
For
per
sona
l use
onl
y

This presentation contains certain forward-looking and unaudited information.
Such information is based on estimates and assumptions that, whilst considered
reasonable by the Company, are subject to risks and uncertainties. Actual results
and achievements could be significantly different from those expressed in
or implied by this information.
DISCLAIMERF
or p
erso
nal u
se o
nly