for personal use only - asx · the optimised open pit shells is shown in table 4. 3d...
TRANSCRIPT

28 AUGUST 2014
VISCARIA COPPER-IRON PROJECT
UPDATED SCOPING STUDY REINFORCES
ROBUST PROJECT DEVELOPMENT OPTIONS
Highlights
Updated Scoping Study of Viscaria Project, completed by independent mining consultants HDR Salva, delivers a robust copper-iron project proposition with demonstrable upside;
The study considers only that portion of Mineral Resources that occur within the optimised open pit shells;
Assumes the production of both a copper concentrate and a premium quality, 69% iron magnetite concentrate;
An estimated Net Present Value (NPV, 10% real, pre-tax discount rate) of $248M, with pre-production Project Capital Cost estimated to be $199M;
An annual copper production rate range of 14,300 to 22,800 tonnes of copper in concentrate over the 10.4 years of production;
An annual magnetite concentrate production rate range of 0.4 – 1.3 million DMT over the 8.4 years of magnetite concentrate production;
Forecast C1 copper cash costs, net of magnetite credits, in the range of $0.44 to $1.36/lb Copper using $120/t and $80/t price for 69% iron magnetite concentrate respectively;
Of the Mineral Resource considered in the Scoping Study, 16% is Measured, 51% is Indicated and 33% is Inferred classification, according to JORC 2012 guidelines;
Future potential for underground development identified, demonstrated through positive cash margin at D Zone;
Updated Scoping Study has identified several opportunities to potentially add value that will be further evaluated during further studies. These include: Potential underground development of A Zone, B Zone and
Discovery Zone Mineral Resources beneath the floor of the open pit shells (in addition to D Zone);
Consideration of by-product credits, such as gold in the Discovery Zone;
Consideration of the viability and value of an oxide copper circuit; and
Resource additions at depth and along strike for all deposits.
For
per
sona
l use
onl
y
Cautionary Statement
The Scoping Study referred to in this announcement is based on lower-level technical and economic
assessments and is insufficient to support estimation of Ore Reserves, or to provide assurance of an
economic development case at this stage, or to provide certainty that the conclusions of the Scoping Study
will be realised.
The Scoping Study is preliminary in nature as its conclusions are drawn on Measured Resource (16%),
Indicated Resource (51%) and Inferred Resource (33%) classification, according to JORC 2012 guidelines.
There is a low level of geological confidence associated with Inferred Mineral Resources and there is no
certainty that further exploration work will result in the determination of Indicated Mineral Resources or that
the production target itself will be realised. The stated production target is based on the Company’s current
expectations of future results or events and should not be solely relied upon by investors when making
investment decisions. Further evaluation work and appropriate studies are required to establish sufficient
confidence that this target will be met.
Further, the Company cautions that there is no certainty that the forecast financial information derived from
production targets will be realised. All material assumptions underpinning the production targets and
forecast financial information derived from the production targets are set out in this announcement.
The estimated mineral resources underpinning the Scoping Study production targets have been prepared
by competent persons in accordance with the current JORC Code 2012 Edition and the current ASX Listing
Rules.
Avalon Minerals Ltd (‘Avalon’ or ‘Company’) (ASX: AVI) is pleased to announce the results of an update
to the Viscaria Copper-Iron Project Scoping Study previously announced on 9 July 2013 (Figure 1 and 2).
Avalon commissioned HDR Salva Pty Ltd (‘HDR Salva’), recognised internationally as specialists in mining
project evaluations and independent to Avalon, to conduct the update. The update incorporates the recently
announced significant upgrade to the Discovery Zone Mineral Resource and JORC 2012 revisions for the
A Zone, B Zone and D Zone Mineral Resources, as well as revisions to assumed capital costs and
commodity prices.
The Company’s Managing Director, Mr Malcolm Norris, said “the results of this updated Scoping Study are
very pleasing and continue to reinforce the quality of the Viscaria Copper-Iron Project. These results,
together with recently announced positive metallurgical results which demonstrate the likelihood of
producing premium products, continue to strengthen and de-risk the project. The Viscaria Project is one of
a select few moderate sized copper projects which demonstrate robust results across the commodity price
cycle, but which only require moderate amounts of capital expenditure to put into production.
Avalon Minerals is advancing technical components of the Pre-Feasibility Study and is focussed on
engaging with all stakeholders to develop an appropriate project plan and permitting path.
Avalon Minerals is also developing a disciplined exploration program to assess several high quality
exploration targets within the belt that hosts the Viscaria Project mineralisation. These targets will be
advanced and drill targets defined during 2014.”
For
per
sona
l use
onl
y

Mineral Resources and Open Pit Optimisations
The Updated Scoping Study reassessed the viability and potential value of an Open Pit Mining Scenario
exploiting a portion of the currently defined Mineral Resources on the Viscaria Project. The Viscaria Project
is based upon updated JORC 2012 Mineral Resources previously announced to the ASX (see Table 1 and
2). As the Discovery Zone Mineral Resource has materially changed since the July 2013 Scoping Study,
HDR Salva completed a re-optimisation of the Discovery Zone open pit mining potential using an updated
resource model (as announced on the 09/04/2014) and the revised pit optimisation parameters and revenue
assumptions as outlined in Table 3. However, as the A Zone, B Zone and D Zone Mineral Resources have
not materially changed since the July 2013 Scoping Study, HDR Salva did not update these pit shell
optimisations but instead reassessed the pit shell and cut-off selection, resulting in some minor adjustments
to the optimal pit shells selected. The tonnage and grade of the Mineral Resources captured with each of
the optimised open pit shells is shown in Table 4. 3D representations of the optimised open pit shells
generated along the near-surface trends of the A Zone, B Zone and D Zone Mineral Resources are shown
in Figure 3 and the Discovery Zone Mineral Resource in Figure 4.
Table 1: Currently Defined Mineral Resource for Copper reported on the Viscaria Project above a
0.4% Cu cut-off.
Resource Name Classification Tonnes (t)
Cu Grade (%)
Cu Metal (t)
A Zone
Measured 14,439,000 1.7 240,000
Indicated 4,690,000 1.2 57,200
Inferred 2,480,000 1.0 25,500
Subtotal 21,609,000 1.5 322,700
B Zone
Measured 123,000 1.3 1,600
Indicated 4,118,000 0.7 29,700
Inferred 15,410,000 0.8 118,700
Subtotal 19,651,000 0.8 149,000
D Zone Cu Resource
Measured 1,000,000 1.25 12,000
Indicated 4,200,000 1.02 43,000
Inferred 8,500,000 0.96 81,000
Subtotal 13,600,000 1.00 136,000
Discovery Zone Cu Resource
Indicated 2,800,000 0.89 25,000
Inferred 6,100,000 0.75 46,000
Subtotal 9,000,000 0.80 71,000
Overall Cu Total 63,860,000 1.05 680,000
For
per
sona
l use
onl
y

Table 2: Currently Defined Mineral Resource for Iron reported on the Viscaria Project above a 15%
Mass Recovery cut-off.
Resource Name Classification Tonnes (Million Tonnes)
Fe Grade (%)
Mass Recovery
(%)
Estimated recoverable iron (Million
Tonnes)
D Zone Fe Resource
Measured 2.0 28.7 35.1 0.5
Indicated 9.7 27.2 33.1 2.2
Inferred 13.9 25.7 31.0 3.0
Subtotal 25.6 26.5 32.1 5.7
Discovery Zone Fe Resource
Indicated 3.0 40.6 53.2 1.1
Inferred 6.7 37.7 49.0 2.3
Subtotal 9.7 38.5 50.3 3.4
Overall Fe Total 35.3 29.8 37.1 9.1
Note: The A Zone and B Zone JORC 2012 Mineral Resources were announced to the ASX on 1 July
2014.
The D Zone JORC 2012 Mineral Resource was announced to the ASX on 22 May 2014.
The Discovery Zone JORC 2012 Mineral Resource was announced to the ASX on 9 April 2014.
All Copper Mineral Resource estimates are reported above a block cut-off Grade of 0.4% Cu.
All Iron Mineral Resource estimates are reported above a block cut-off of 15% Mass Recovery.
Estimated recoverable iron is based on Davis Tube Recovery test work at a 75 micron grind size.
Estimated recoverable iron is: tonnes x mass recovery % x Fe % in concentrate (69% Fe).
Total D Zone Measured, Indicated and Inferred Mineral Resource reported for the Copper above
a cut-off grade of 0.4% Cu and Iron above 15% Mass Recovery are broadly spatially coincident.
However, they are modelled and reported separately to avoid mixing geological domains.
Total Discovery Zone Indicated and Inferred Mineral Resource reported for Copper-Gold above
0.4% Cu cut-off and for Iron above 15% Mass Recovery are broadly spatially coincident. However,
they are modelled and reported separately to avoid mixing geological domains.
Any discrepancies in the sums and weighted averages are introduced by rounding.
For
per
sona
l use
onl
y

Table 3: Pit Optimisation Parameters and Revenue Assumptions
Parameter Unit Value Comments
Overall pit slope angle Degrees 60
Copper Price US$/t US$6,614 US$3.00/lb Cu
Fe Concentrate Price US$/t US$100 69% Fe Iron Ore Concentrate
Mining Cost (ore) US$/t US$4.00
Mining Cost (waste) US$/t US$3.00
Mining Recovery % 95%
Mining Dilution % 5%
Metallurgical Recovery % Cu 85%
% Fe variable Mass recovery = %Fe x 1.4 - 5
Concentrate Grade % Cu 25%
% Fe 69%
Processing Costs US$/t ore US$9.39
Admin Costs US$/t ore US$3.08
Payable Copper % Cu contained 96.5%
Copper Concentrate Treatment Charge (TC)
cents/lb Cu 90
Copper Concentrate Refining Charge (RC)
cents/lb Cu 9
Royalties % 1.0/1.5 Viscaria/ Discovery
For
per
sona
l use
onl
y

Figure 3: 3D representation of the pit optimisation shells for A Zone, B Zone and D Zone.
Figure 4: 3D representation of the pit optimisation shell for Discovery Zone.
For
per
sona
l use
onl
y

Table 4: Breakdown of Mineral Resources and Waste Rock within each Optimised Open Pit Shell.
Source Tonnes
(Mt)
Grade Waste Tonnes
(Mt)
Strip Ratio
Measured Resource Included
Indicated Resource Included
Inferred Resource Included %Cu %Fe
A Zone 4.0 1.25 - 37 9.3 72% 24% 4%
B Zone 3.2 0.67 - 8 2.5 2% 78% 20%
D Zone 15.3 0.52 25 64 4.2 14% 61% 25%
Discovery Zone
9.4 0.66 39 43 4.6 0% 38% 62%
Total Project 31.9 0.67 23 152 4.8 16% 51% 33%
Production Target
A number of mining scenarios have been evaluated using the Mineral Resources within the open pit shells (Table 4) with the Production Target Profile shown in Figure 5 and Table 5 selected as the most optimal. This Production Target has only been estimated at a high-level, with all sources scheduled at their average grade and waste mining at average stripping ratios. Maximum pit production rates have been limited to an average of three benches per year. Waste has been scheduled on a pro-rata basis and with a lead-time of six months until any ore is mined. It must also be noted that this Production Target contains some Inferred Mineral Resources. There is a low level of confidence associated with Inferred Mineral Resources and there is no certainty that further exploration work will result in the determination of Indicated Mineral Resources or that the Production Target itself will be realised.
No stockpiling or selective treatment of ore has been assumed with all ore treated in the same period it is mined. No magnetite production is envisaged from the A Zone and B Zone pits, with a copper concentrate only produced in the final two years of operation.
Project start-up has been assumed to commence late in Year 2, with pre-stripping of waste for the D Zone pit commencing 6 months earlier. No ramp-up to full production has been allowed for as this is not considered material at this level of study. In practice, it would be expected that some ore would be mined and stockpiled during the pre-strip operation, with commissioning and ramp-up over a period of 3 months.
For
per
sona
l use
onl
y

Figure 5: Scoping Study Mine Production Target Profile by Open Pit
Table 5: Production Target Summary
Year Tonnes Mined (Mt)
Cu % Fe % Copper Conc. (kDMT)
Contained Copper (kt)
Magnetite Conc. (kDMT)
Contained Iron (kt)
Year 0
Year 1
Year 2 3.5 0.50 23.5 59.0 14.7 976 673
Year 3 3.5 0.50 23.5 59.0 14.7 976 673
Year 4 3.5 0.55 29.4 65.6 16.4 1266 874
Year 5 3.5 0.55 29.4 65.6 16.4 1266 874
Year 6 3.5 0.55 29.4 65.6 16.4 1266 874
Year 7 3.5 0.58 28.4 69.1 17.3 1217 840
Year 8 3.5 0.73 22.8 87.1 21.8 944 651
Year 9 3.5 0.77 16.9 91.3 22.8 655 452 Year 10 2.8 0.80 12.3 77.1 19.3 381 263
Year 11 1.9 0.90 57.0 14.3
Year 12 0.9 0.91 26.9 6.7
Total 33.6 0.63 22 723 181 8,933 6,173
0.0
0.5
1.0
1.5
2.0
2.5
3.0
3.5
4.0
Year 0
Year 1
Year 2
Year 3
Year 4
Year 5
Year 6
Year 7
Year 8
Year 9
Year 10
Year 11
Year 12
Year 13
Year 14
Mine Production (Mtpa)
D Zone Pit
A ZonePit
Discovery PitB ZonePit
For
per
sona
l use
onl
y

Capital & Operating Cost Estimates
Project Development Assumptions
HDR Salva has used the following project development assumptions:
Contract mining operation with all mining equipment supplied by the contractor; New process plant constructed at Viscaria with a capacity to treat 3.5mtpa; Trucking of ore from Discovery to Viscaria for processing; Copper concentrates railed/trucked to a local smelter; and Magnetite concentrate to be purchased by the customer at the mine gate.
Capital Cost
The total capital cost estimate for the initial development and ramp-up of the facilities at the Viscaria Project including mining, logistics and associated infrastructure is estimated to be under US$200M, with a total Life-of-Mine expenditure in the order of US $270M (Table 6). These estimates are to a concept study level of accuracy only (nominally ±35%). While preparing these estimates, HDR Salva has relied on industry benchmarks, its internal database and expertise, as well as internal studies on the Viscaria Project and the previous estimates from earlier studies. Estimates of major capital cost elements are based on escalated historical Pre-Feasibility Study results and can be considered preliminary estimates.
Table 6: Capital Cost Estimates
Item Cost including contingency
of 10% (US$M) Comments
Processing Plant 170 Cross referenced against similar projects in region
Pit D site establishment 3 Includes provision of site services and access roads
Pre-Strip 21 Based on a mining cost of $3/t waste
Tailings Storage Facility
5 Provisional allowance only
Pre-Production Total 199
Pit A site establishment 2 Includes provision for site services and access roads
Pit B site establishment 2 Includes provision for site services and access roads
Discovery Zone
Site establishment 15
Includes provision for site services, access roads, surface water berm, etc.
Replacement Capital 33 A provision of $1/t has been made to cover replacement capital (excludes mining activities–included in mining contractor operating cost).
Closure Costs 20
Life of Mine Total 271
For
per
sona
l use
onl
y
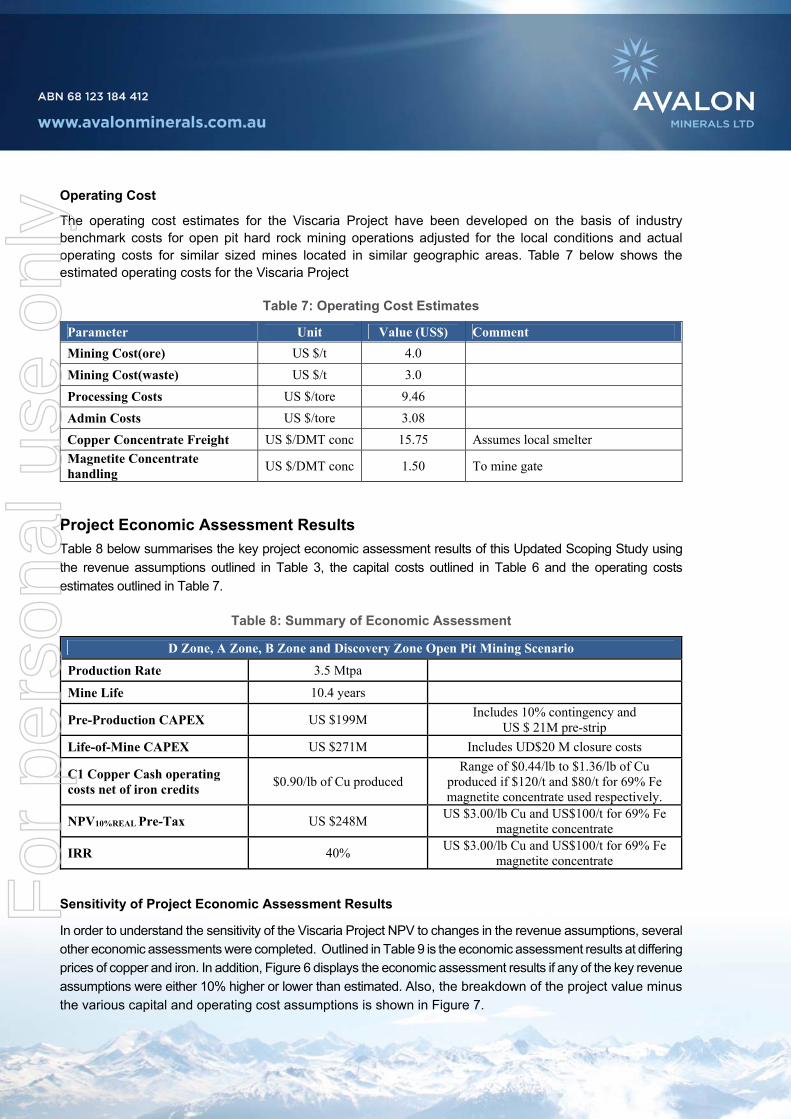
Operating Cost
The operating cost estimates for the Viscaria Project have been developed on the basis of industry benchmark costs for open pit hard rock mining operations adjusted for the local conditions and actual operating costs for similar sized mines located in similar geographic areas. Table 7 below shows the estimated operating costs for the Viscaria Project
Table 7: Operating Cost Estimates
Parameter Unit Value (US$) Comment
Mining Cost(ore) US $/t 4.0
Mining Cost(waste) US $/t 3.0
Processing Costs US $/tore 9.46
Admin Costs US $/tore 3.08
Copper Concentrate Freight US $/DMT conc 15.75 Assumes local smelter
Magnetite Concentrate handling
US $/DMT conc 1.50 To mine gate
Project Economic Assessment Results
Table 8 below summarises the key project economic assessment results of this Updated Scoping Study using
the revenue assumptions outlined in Table 3, the capital costs outlined in Table 6 and the operating costs
estimates outlined in Table 7.
Table 8: Summary of Economic Assessment
D Zone, A Zone, B Zone and Discovery Zone Open Pit Mining Scenario
Production Rate 3.5 Mtpa
Mine Life 10.4 years
Pre-Production CAPEX US $199M Includes 10% contingency and
US $ 21M pre-strip
Life-of-Mine CAPEX US $271M Includes UD$20 M closure costs
C1 Copper Cash operating costs net of iron credits
$0.90/lb of Cu produced Range of $0.44/lb to $1.36/lb of Cu
produced if $120/t and $80/t for 69% Fe magnetite concentrate used respectively.
NPV10%REAL Pre-Tax US $248M US $3.00/lb Cu and US$100/t for 69% Fe
magnetite concentrate
IRR 40% US $3.00/lb Cu and US$100/t for 69% Fe
magnetite concentrate
Sensitivity of Project Economic Assessment Results
In order to understand the sensitivity of the Viscaria Project NPV to changes in the revenue assumptions, several
other economic assessments were completed. Outlined in Table 9 is the economic assessment results at differing
prices of copper and iron. In addition, Figure 6 displays the economic assessment results if any of the key revenue
assumptions were either 10% higher or lower than estimated. Also, the breakdown of the project value minus
the various capital and operating cost assumptions is shown in Figure 7.
For
per
sona
l use
onl
y

Table 9: NPV Sensitivity – Commodity Price Assumptions (NPV10% REAL, Pre Tax)
Magnetite Price (US $/t concentrate)
Cu Price (US $/lb) 80 100 120
2.75 $98 $200 $301
3 $147 $248 $349
3.25 $195 $297 $398
3.5 $244 $345 $447
Figure 6: NPV sensitivity with respect to a 10% change in key revenue assumptions.
168 188 208 228 248 268 288 308 328
Opex
Fe Grade %
Cu Grade %
Cu Recovery %
Fe Recovery %
Disount Rate
Capex
NPV US $M
Increased by 10% Reduced by 10%
For
per
sona
l use
onl
y

Figure 7: Project Value Breakdown
Comparison with Previous Scoping Study
The main differences between this Updated Scoping Study and the previous Scoping Study as announced
in July 2013 are:
A significant upgrade to the Discovery Zone Mineral Resource;
The A Zone, B Zone, D Zone and Discovery Zone Mineral Resources are now JORC 2012
compliant;
The capital costs have been increased to include 10% contingency;
The capital costs have been increased to include US$20M closure costs;
Payable copper contained in the concentrate was decreased to 96.5% from 98%;
Trucking costs for ore from the Discovery Zone Open Pit to the process plant were decreased to
$8.5/tonne of ore from $10/tonne based on industry comparables;
Magnetite pricing methodology was changed to a direct price for the magnetite concentrate product
assumed to be produced at Viscaria, rather than incorporating the iron ore pellet price and then
assuming a treatment charge for pelletising.
The individual and accumulative effects of each of these assumption differences to the value of the project
is displayed in Figure 8. For
per
sona
l use
onl
y

Figure 8: Project Value comparison with July 2013 Scoping Study Result (US $M)
Potential Value Opportunities and Risks
Mine design
All of the scenarios have included some Inferred Mineral Resource estimates. Ongoing exploration drilling
and subsequent re-estimation may result in changes to the economically minable portions of the resource.
This may result in an increase or decrease in the tonnage and/or grade estimates.
When undertaking final designs from an optimised pit shell, practical mining considerations may require
additional waste to be mined and/or ore to be left behind. In the absence of geotechnical studies into pit
wall stability, pit angles have been assumed (60 degrees). Any change in pit wall angles is likely to materially
impact on the strip ratio and pit economics.
The D-Zone pit has been optimised as a standalone pit on the assumption that there will be no underground
mining. A preliminary assessment has shown that part of the remaining resource below the pit may be
economic to mine by underground methods. If ongoing work substantiates this, then a combined open pit
and underground optimisation is recommended. This is likely to result in a smaller pit with additional material
mined from underground.
D Zone Underground Mining Potential
A preliminary assessment was completed on the portion of the D Zone Mineral Resource under the open
pit shell that could be extracted by underground mining methods. Wireframes were constructed around
high grade areas based on a cut-off value of US$70 Net Smelter Return (NSR) to simulate underground
stopes with a minimum mining width of 4.0m. These stopes contained a total of 4.7 million tonnes @ 0.92%
Cu and 25% Fe, which was composed of 15% Indicated Mineral Resources and 85% Inferred Mineral
0
50
100
150
200
250
300
350
400
450 DiscoveryResource
UpdateFe Price
$150 to $100
Payable Cu 98% to 96.5%
Fe TC to Pellet $28/t to $0/t
Discovery Trucking Cost $10/t to $8.5/t
CapexIncrease
Scheduling
For
per
sona
l use
onl
y

Resources. It must be noted that there is a low level of geological confidence associated with Inferred
Mineral Resources and there is no certainty that further exploration work will result in the determination of
Indicated Mineral Resources or that the Production Target itself will be realised. The stated Production
Target is based on the Company’s expectation of future results or events and should not be solely relied
upon by investors when making investment decisions. Further evaluation work and appropriate studies are
required to establish sufficient confidence that this Production Target will be met.
Additional CAPEX for the underground development has been estimated at US$30M and includes the ramp
development (two declines 560m in length), access cross cuts, mine establishment, pumping, ventilation
and egress. The average NSR is US$82/ tonne of ore at a copper recovery of 90%, a copper price of
US$3.25/lb and a magnetite concentrate price of US$120/tonne. The operating costs have been estimated
using US$65/tonne of mined material and $4500/m for underground development for a total OPEX of
US$64M. Accounting for both the CAPEX and OPEX, this gives a net cash margin of US$35M.
The value of the underground mining potential at D Zone has not been included in the NPV calculation as
it does not materially impact the NPV calculation. This is due to the fact that underground mining cannot
begin until the D Zone open pit has finished and will require some higher value ore (from lower cost open
pits) to be displaced in order to maintain mill throughput. However, it is very likely that the D Zone
underground would be mined near the end of the open pit mine life and therefore remains an upside of
US$35M net cash margin to the project.
Scheduling and stockpiling
At this level of mining study, the production scheduling undertaken has been set at a fixed rate and average
grades with no allowance for production ramp-up or build-up of stockpiles ahead of the process plant. Open
pit waste material is scheduled at a constant rate six months in advance of ore production. In reality, there
would be a ramp-up period as the process plant is commissioned, operators trained and recoveries and
throughput optimised. A three-month ramp-up period would be typical for an operation of this scale.
An operating mine would normally optimise the mining schedule by targeting higher grade ore early in the
mine life in order to increase revenue in the early years, with the stockpiling of lower grade ore as required.
Optimising the ore mining sequence would be expected to add further value.
Processing
In this Scoping Study it has been assumed that all ore types will be treated through the same process plant
configuration with an average ore blend. All material has been assumed to pass through the comminution
and copper flotation stages of the plant but only the D Zone and Discovery Zone mineralisation would then
pass through the magnetic separation section to recover the magnetite. There may be opportunity to add
further value by optimising the plant by batch processing different ore types, with the plant configured
specifically for each ore type rather than a blend. In addition to maximising payable metal recovery, there
may be savings in plant operating and capital costs.
In this economic evaluation a fixed recovery for copper has been applied. In practice, the recovery will
improve with head grade and applying a fixed recovery will tend to overstate recovery for low-grade ore
and understate recovery for high-grade ore.
For
per
sona
l use
onl
y

Satellite deposits
There may be opportunity to process ore from other deposits within trucking distance of the proposed plant.
This may result from Avalon’s ongoing exploration efforts in the area and/or negotiation with third parties to
toll treat ore, or purchase/joint venture, separately owned resource assets. Value adding options would be
to extend the operating life of the project and/or increase the processing capacity to achieve cost savings
due to economies of scale.
For further information please visit www.avalonminerals.com.au or contact:
Mr Malcolm Norris
Managing Director
Avalon Minerals Ltd
Tel: 07 3368 9888
Email: [email protected]
Competent Persons Statement
The information in this report that relates to mining project evaluations is based upon information compiled by, or under the supervision of Manish Garg B.Eng. (Hons.), Master of Applied Finance, MAusIMM, MAICD; Tim Horsley B.Sc. (Hons) (Mining Engineering), MAusIMM; and Trevor Ellice B.Sc. (Hons), M.Sc. (Geology), MAusIMM. Mr. Garg, Mr. Horsley, and Mr. Ellice have sufficient technical and techno-economic assessment experience, which is relevant to the activity that they are undertaking, to qualify as an Experts as defined in the 2005 Edition of the “Code for the Technical Assessment and Valuation of Mineral and Petroleum Assets and Securities for Independent Expert Reports” (VALMIN Code).
The information in this report that relates to the A Zone and B Zone Mineral Resources are based on the information compiled by Dr Bielin Shi who is a Member of the Institute of Mining and Metallurgy and is a full time employee of CSA Global Pty Ltd (CSA). CSA are an independent mining consultancy who have been engaged by Avalon Minerals Limited to perform geological consulting on a fee for service basis. Dr Bielin Shi has sufficient experience that is relevant to the style of mineralisation being considered and to the activity being undertaken to qualify as a competent person as defined in the 2012 Edition of the Australasian Code for Reporting of Exploration Results, Mineral Resources and Ore Reserves. Dr Shi consents to the inclusion in this report of the matters based on his information in the form and context in which it appears.
The information in this report that relates to the D Zone and Discovery Zone Mineral Resources are based on the information compiled by Trevor Ellice who is a Member of the Institute of Mining and Metallurgy and is a full time employee of Salva Resources Pty Ltd (“HDR | Salva”). HDR | Salva is an independent mining consultancy engaged by Avalon Minerals Limited to perform geological consulting on a fee for service basis. Mr Ellice has sufficient experience that is relevant to the style of mineralisation being considered and to the activity being undertaken to qualify as a competent person as defined in the 2012 Edition of the Australasian Code for Reporting of Exploration Results, Mineral Resources and Ore Reserves. Mr Ellice consents to the inclusion in this report of the matters based on his information in the form and context in which it appears.
The information in this report that relates to exploration results is based upon information reviewed by Dr Quinton Hills who is a Member of the Australasian Institute of Mining and Metallurgy. Dr Hills is a full time employee of Avalon Minerals Ltd and has sufficient experience which is relevant to the style of mineralisation and type of deposit under consideration and to the activity which he is undertaking to qualify as a Competent Person as defined in the 2012 Edition of the “Australasian Code for Reporting of Exploration Results, Mineral Resources and Ore Reserves”. Dr Hills consents to the inclusion in the report of the matters based on his information in the form and context in which it appears.
For
per
sona
l use
onl
y

Figure 1 – Project Location
For
per
sona
l use
onl
y

Figure 2 – Location of Mineral Resources on the Viscaria Copper-Iron Project
For
per
sona
l use
onl
y