for personal use only - asx · main event half year commentary total revenue grew 22.6% to us$75.5...
TRANSCRIPT
Ardent Leisure Group
2016 Half Year Results
For
per
sona
l use
onl
y
HY16 HY15
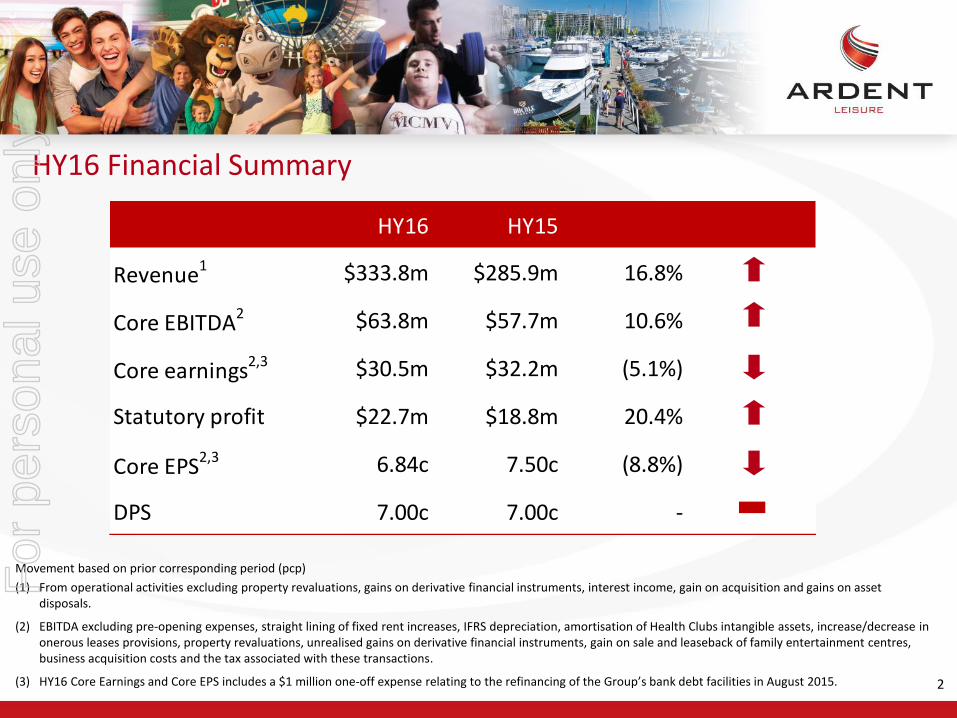
Revenue1 $333.8m $285.9m 16.8%
Core EBITDA2 $63.8m $57.7m 10.6%
Core earnings2,3 $30.5m $32.2m (5.1%)
Statutory profit $22.7m $18.8m 20.4%
Core EPS2,3 6.84c 7.50c (8.8%)
DPS 7.00c 7.00c -
HY16 Financial Summary
Movement based on prior corresponding period (pcp)
(1) From operational activities excluding property revaluations, gains on derivative financial instruments, interest income, gain on acquisition and gains on asset disposals.
(2) EBITDA excluding pre-opening expenses, straight lining of fixed rent increases, IFRS depreciation, amortisation of Health Clubs intangible assets, increase/decrease in onerous leases provisions, property revaluations, unrealised gains on derivative financial instruments, gain on sale and leaseback of family entertainment centres, business acquisition costs and the tax associated with these transactions.
(3) HY16 Core Earnings and Core EPS includes a $1 million one-off expense relating to the refinancing of the Group’s bank debt facilities in August 2015. 2
For
per
sona
l use
onl
y
Ardent Leisure – HY16 Key Highlights
3
Group Revenue of $333.8 million up 16.8%.
Group Core EBITDA of $63.8 million up 10.6%.
Core earnings of $30.5 million down 5.1% impacted by higher depreciation, tax and interest, which includes a $1 million one-off expense relating to the refinancing of the Group’s bank debt facilities.
Statutory profit of $22.7 million up 20.4%.
Main Event US dollar revenue up 22.6% and EBITDA up 12.9%, driven by robust performances across the portfolio and expansion.
Health Clubs generated exceptional membership growth positioning the business to deliver over 10% EBITDA growth in the second half.
Bowling delivered an outstanding performance with EBITDA up 20.5%, driven by the transition to multi-faceted entertainment centres.
For
per
sona
l use
onl
y
4
Theme Parks revenue of $58.4 million up 6.6% and EBITDA up 4.0% benefiting from unique new attractions, improved food and beverage and extended trading hours.
Marinas impacted by redevelopment at The Spit marina interrupting occupancy and fuel sales in the first half year.
The Group’s full year performance is weighted towards the second half with growth to be driven by:
Two new Main Event centres that opened at the end of the first half and five new centres scheduled to open in the second half; and
Strong second half growth in Health Clubs.
Current indications are that the Group expects to see continued improvement in results as the turnaround of the Australian businesses and expansion of Main Event continues.
Ardent Leisure – HY16 Key Highlights (cont’d)
For
per
sona
l use
onl
y

Ardent Leisure – It’s All About The Customer
More People, to Visit More Often and Spend More Per Visit
Strategy
Group
Disciplined deployment of capital focused on maximising return on investment.
Aggregate Group wide customer data to facilitate cross promotion, targeted digital marketing and loyalty.
Main Event
Consolidate brand leadership in Texas and simultaneously expand US footprint to grow into adjacent geographies.
Broaden real estate strategy to include high profile mall locations and lifestyle precincts.
New Chief Marketing Officer to drive the creation of an iconic national brand.
Investment in amusement games, new attractions and ongoing core menu evolution to drive dwell time, guest spend and guest satisfaction.
5
For
per
sona
l use
onl
y

Ardent Leisure – It’s All About The Customer
More People, to Visit More Often and Spend More Per Visit
Strategy
Health Clubs
Focus on driving longer duration, premium memberships.
Complete conversion to 24.7 and enhanced customer service and facilities.
Digital transformation – web, e-commerce, integration with wearable technology.
Bowling
Improve customer offerings with better food and beverage, more amusement games and diversified entertainment attractions.
Expand through acquiring stand-alone games arcades, exit underperforming centres.
Drive marketing initiatives (themed birthdays, corporate events), enhance customer experience and increase underutilised capacity.
6
For
per
sona
l use
onl
y

Ardent Leisure – It’s All About The Customer
More People, to Visit More Often and Spend More Per Visit
Strategy
Theme Parks
Capture traffic from tourism growth and adjacent domestic developments.
Develop and invest in unique attractions.
React positively to changing customer expectations across retail, food and beverage.
Marinas
Secure long term asset tenure.
Review growth potential and development opportunities, improve land content and update underdeveloped facilities.
7
For
per
sona
l use
onl
y

Ardent Leisure Group
Business Unit Results
For
per
sona
l use
onl
y
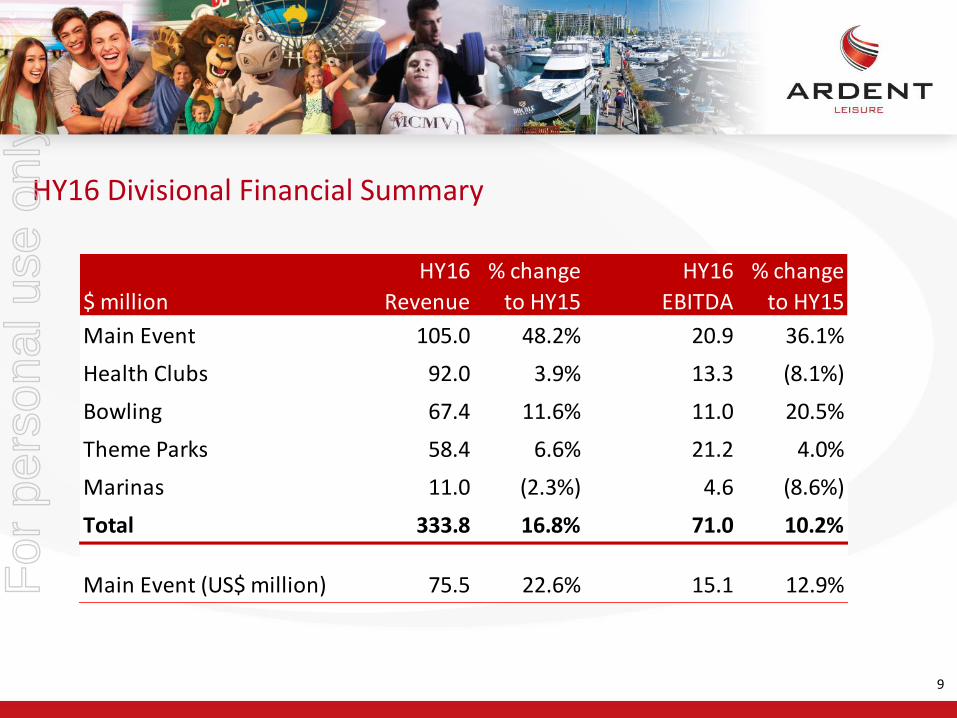
HY16 Divisional Financial Summary
9
$ million
HY16
Revenue
% change
to HY15
HY16
EBITDA
% change
to HY15
Main Event 105.0 48.2% 20.9 36.1%
Health Clubs 92.0 3.9% 13.3 (8.1%)
Bowling 67.4 11.6% 11.0 20.5%
Theme Parks 58.4 6.6% 21.2 4.0%
Marinas 11.0 (2.3%) 4.6 (8.6%)
Total 333.8 16.8% 71.0 10.2%
Main Event (US$ million) 75.5 22.6% 15.1 12.9%For
per
sona
l use
onl
y
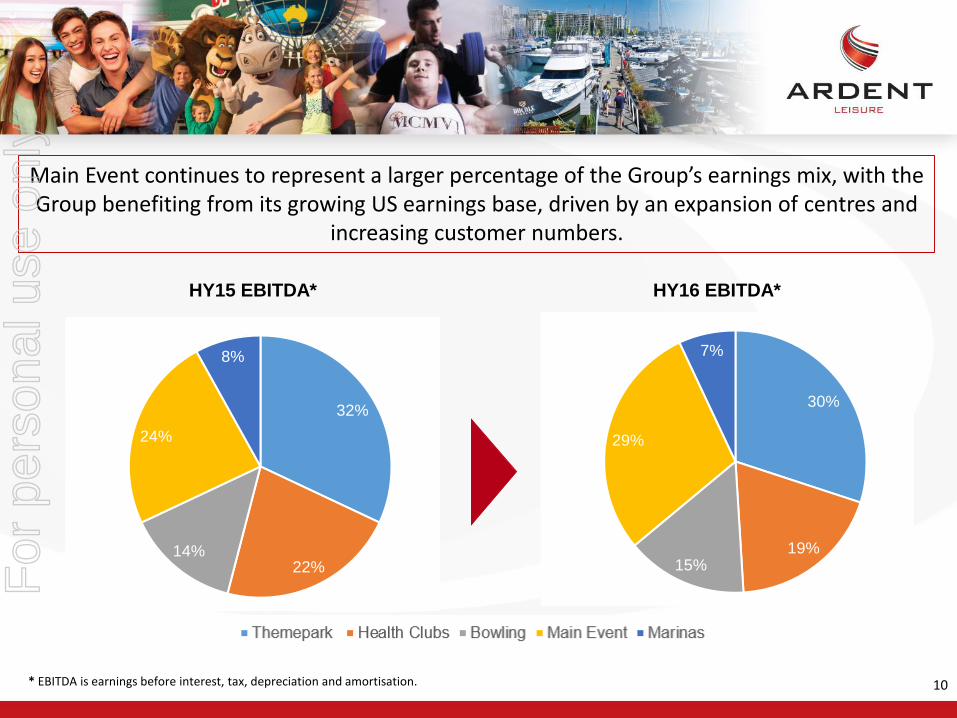
Main Event continues to represent a larger percentage of the Group’s earnings mix, with the Group benefiting from its growing US earnings base, driven by an expansion of centres and
increasing customer numbers.
* EBITDA is earnings before interest, tax, depreciation and amortisation.
HY15 EBITDA* HY16 EBITDA*
10
32%
22%14%
24%
8%
30%
19%15%
29%
7%
For
per
sona
l use
onl
y
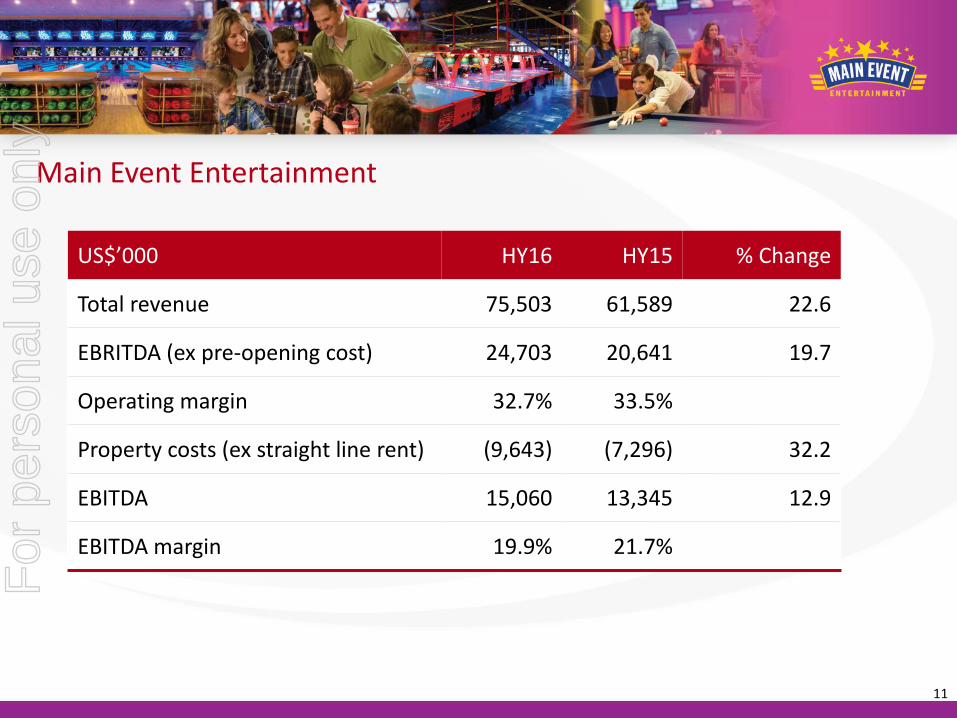
US$’000 HY16 HY15 % Change
Total revenue 75,503 61,589 22.6
EBRITDA (ex pre-opening cost) 24,703 20,641 19.7
Operating margin 32.7% 33.5%
Property costs (ex straight line rent) (9,643) (7,296) 32.2
EBITDA 15,060 13,345 12.9
EBITDA margin 19.9% 21.7%
Main Event Entertainment
11
For
per
sona
l use
onl
y
12
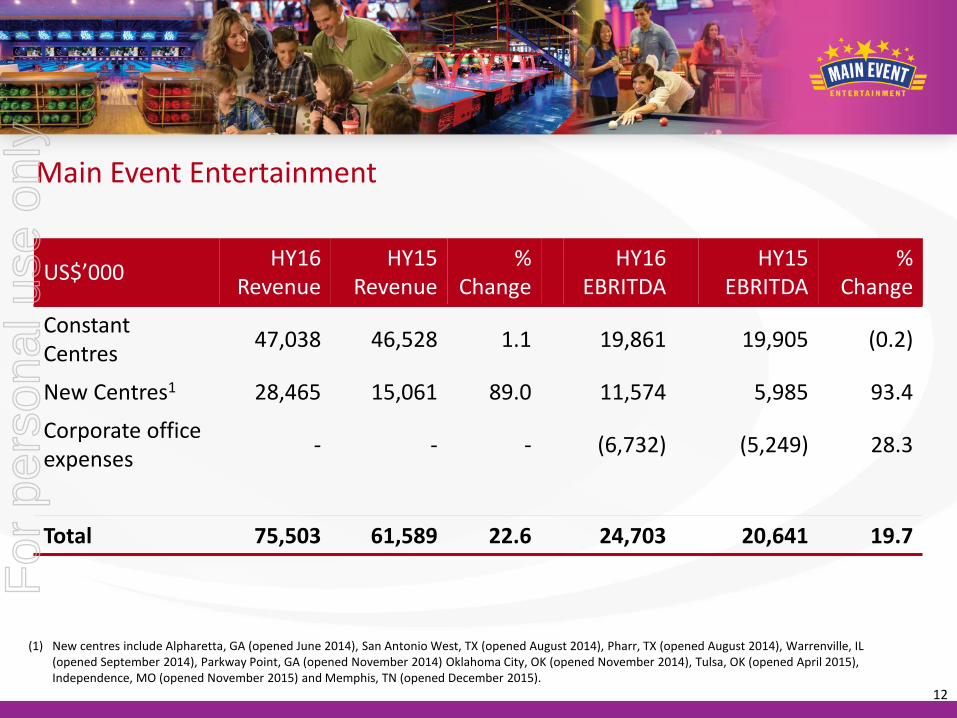
Main Event Entertainment
US$’000HY16
RevenueHY15
Revenue%
ChangeHY16
EBRITDAHY15
EBRITDA%
Change
Constant Centres
47,038 46,528 1.1 19,861 19,905 (0.2)
New Centres1 28,465 15,061 89.0 11,574 5,985 93.4
Corporate office expenses
- - - (6,732) (5,249) 28.3
Total 75,503 61,589 22.6 24,703 20,641 19.7
(1) New centres include Alpharetta, GA (opened June 2014), San Antonio West, TX (opened August 2014), Pharr, TX (opened August 2014), Warrenville, IL (opened September 2014), Parkway Point, GA (opened November 2014) Oklahoma City, OK (opened November 2014), Tulsa, OK (opened April 2015), Independence, MO (opened November 2015) and Memphis, TN (opened December 2015).
For
per
sona
l use
onl
y
Main Event Half Year Commentary
Total revenue grew 22.6% to US$75.5 million compared to US$61.6 million for the first half of FY15.
EBITDA increased 12.9% to US$15.1 million compared to US$13.3 million for the first half of FY15.
EBITDA margin was impacted by property costs for two centres which were sold and leased back in FY15 and by the investment in corporate costs to support second half new centre openings.
Footprint expansion on track with two centres opened ahead of schedule at the end of the first half - Independence, MO and Memphis, TN. Both trading ahead of expectations.
All centres1 opened since September 2007 are on track to deliver an average annual EBITDA return on investment of over 35%.
Five new centres are scheduled to open during the second half of FY16 with a total of 27 centres by end of FY16, a 35% increase in centre numbers on the prior year.
13(1) Excludes Independence, MO (opened November 2015) and Memphis, TN (opened December 2015) due to their limited trading history in HY16.
For
per
sona
l use
onl
y

Main Event Half Year Commentary (cont’d) Constant centre revenue increased 1.1% for the first half year, with growth of 0.5% in
Q1 and 1.8% in Q2, representing the 23rd and 24th consecutive quarters of growth.
Overall constant centre performance was impacted by materially lower revenue at one centre in San Antonio (North) (SAN) due to a combination of:
The opening of a second Main Event in San Antonio (West) as part of a strategic move to secure the market; and
A number of indirect competitors entering the local market.
Excluding SAN, constant centre revenue grew 3.1% for the half year, in line with expectations.
The combined EBITDA return on investment for the two San Antonio centres is expected to exceed 40% in FY16.
Constant centre revenue was also impacted by milder Texan summer weather and the less favourable timing of three major holidays which fell on weekends.
Main Event completed two sale and leaseback transactions and two progressive financing arrangements in HY16, with total proceeds of US$33 million.
14
For
per
sona
l use
onl
y
Main Event Outlook Main Event is now the category leader for bowling-anchored entertainment in the US
with average unit volumes and sales growth well ahead of competitors.
Proven success of eight centres outside of Texas (at December 2015) underscores the concept for a successful national roll-out and geographic diversification of the portfolio.
Two centres (Avondale, AZ and Fort Worth (North), TX) opened in February 2016. An additional three locations (representing three new markets) are scheduled to open in Q4 (Louisville, KY, Albuquerque, NM and West Chester, OH).
A minimum of eight sites planned for FY17, including three under construction at Olathe (KS), Hoffman Estates (IL) and Orlando (FL). This represents a 30% increase in centre numbers on prior year.
Main Event is exploring sites in shopping malls and lifestyle precincts to increase the number of potential locations in existing high traffic areas to provide a further avenue for roll-out opportunities.
To assist in the creation of an iconic national brand, US restaurant industry marketing specialist, Rebeca Johnson, has been added to the leadership team in the newly created role of Chief Marketing Officer.
15
For
per
sona
l use
onl
y
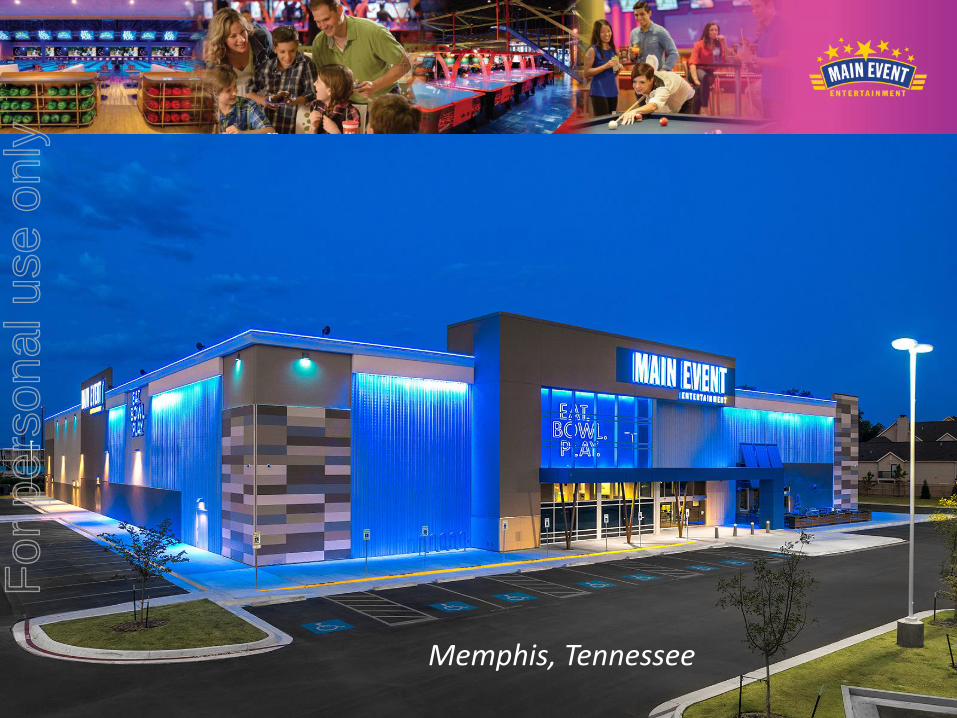
Memphis, Tennessee
For
per
sona
l use
onl
y
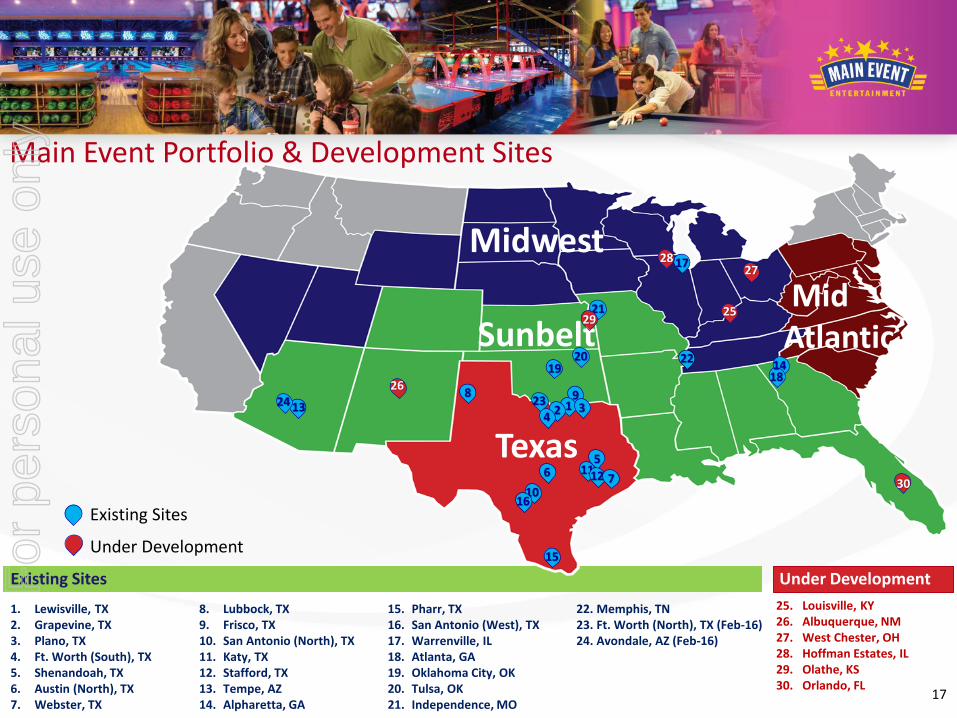
25. Louisville, KY26. Albuquerque, NM27. West Chester, OH28. Hoffman Estates, IL29. Olathe, KS30. Orlando, FL
Under DevelopmentExisting Sites
1. Lewisville, TX2. Grapevine, TX3. Plano, TX4. Ft. Worth (South), TX5. Shenandoah, TX6. Austin (North), TX7. Webster, TX
8. Lubbock, TX9. Frisco, TX10. San Antonio (North), TX11. Katy, TX 12. Stafford, TX13. Tempe, AZ14. Alpharetta, GA
15. Pharr, TX16. San Antonio (West), TX17. Warrenville, IL 18. Atlanta, GA19. Oklahoma City, OK20. Tulsa, OK21. Independence, MO
22. Memphis, TN23. Ft. Worth (North), TX (Feb-16)24. Avondale, AZ (Feb-16)
23 912 3
4
8
65
10
13
15
1112
Midwest
Sunbelt
Texas
16
17
7
MidAtlantic
22
25
24
21
181419
20
17
Existing Sites
Under Development
Main Event Portfolio & Development Sites
27
26
29
28
30
For
per
sona
l use
onl
y
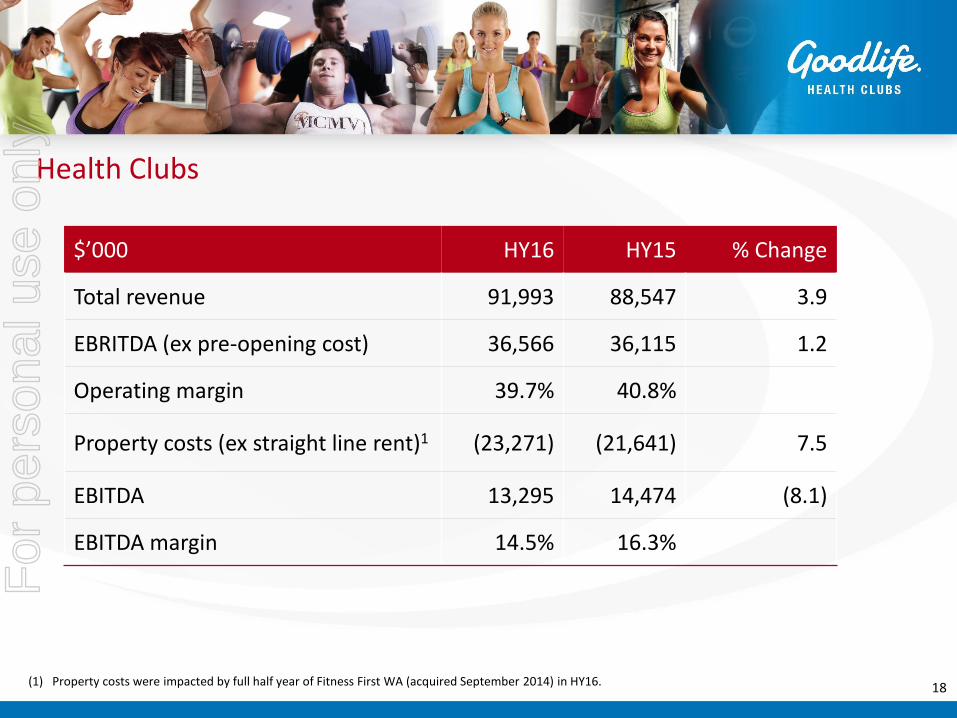
Health Clubs
$’000 HY16 HY15 % Change
Total revenue 91,993 88,547 3.9
EBRITDA (ex pre-opening cost) 36,566 36,115 1.2
Operating margin 39.7% 40.8%
Property costs (ex straight line rent)1 (23,271) (21,641) 7.5
EBITDA 13,295 14,474 (8.1)
EBITDA margin 14.5% 16.3%
18(1) Property costs were impacted by full half year of Fitness First WA (acquired September 2014) in HY16.
For
per
sona
l use
onl
y
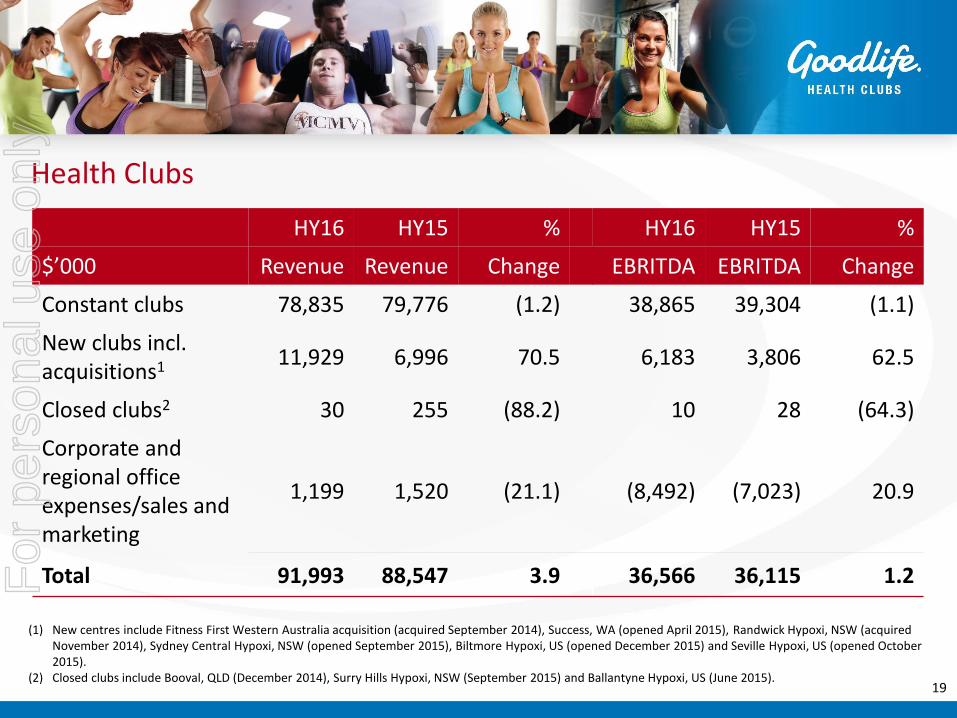
Health Clubs
HY16 HY15 % HY16 HY15 %
$’000 Revenue Revenue Change EBRITDA EBRITDA Change
Constant clubs 78,835 79,776 (1.2) 38,865 39,304 (1.1)
New clubs incl. acquisitions1 11,929 6,996 70.5 6,183 3,806 62.5
Closed clubs2 30 255 (88.2) 10 28 (64.3)
Corporate and regional office expenses/sales and marketing
1,199 1,520 (21.1) (8,492) (7,023) 20.9
Total 91,993 88,547 3.9 36,566 36,115 1.2
19
(1) New centres include Fitness First Western Australia acquisition (acquired September 2014), Success, WA (opened April 2015), Randwick Hypoxi, NSW (acquired November 2014), Sydney Central Hypoxi, NSW (opened September 2015), Biltmore Hypoxi, US (opened December 2015) and Seville Hypoxi, US (opened October 2015).
(2) Closed clubs include Booval, QLD (December 2014), Surry Hills Hypoxi, NSW (September 2015) and Ballantyne Hypoxi, US (June 2015).
For
per
sona
l use
onl
y
Health Clubs Half Year Commentary
Q2 EBITDA of $6.8 million up 20.9% on prior corresponding period, representing a significant trend reversal on Q1 driven by exceptional membership growth of over 8,300 members during the first half.
Membership yield has been maintained through management of product and price mix, with premium memberships representing 45% of all sales.
December closing membership is now higher than the previous peak in September 2014 positioning the business to deliver EBITDA growth of over 10% in the second half.
Strong momentum in the business underpinned by the following initiatives, which have combined to significantly increase sales volumes and lower average monthly attrition levels to 3.7% for the first half (down from 4.2% in the prior corresponding period):
Conversion of clubs to 24.7 operations, with 37 clubs converted at the end of the first half, which have delivered a 25.8% uplift in sales and 15.7% reduction in attrition on prior corresponding periods since conversion. We expect to exceed 45 converted clubs by June 2016;
Sales of higher value, longer term, 12 and 18 month memberships;20
For
per
sona
l use
onl
y
Health Clubs Half Year Commentary (cont’d)
Digital transformation including web, e-commerce and a new app providing the ability to personalise the customer experience and membership interaction; and
Investment in tactical marketing and media partnerships, including partnerships with Network Ten and Emily Skye, one of Australia’s leading online fitness personalities.
Hypoxi USA established with two operating studios in Phoenix, AZ. Trading is in line with expectations.
Hypoxi Australia continues to roll-out Goodlife in-club studio concepts, with 12 at the end of the half year.
Hypoxi membership subscription pricing model providing consistent revenue and EBITDA contributions.
Higher corporate costs reflect the full half year impact of Fitness First WA acquisition support costs and tactical investments in marketing and technology to drive increased membership growth.
21
For
per
sona
l use
onl
y
Health Clubs Outlook
Record membership growth of over 3,200 members in January 2016.
Second half EBITDA earnings expected to be in the range of $15m to $16m, an increase of over 10% on the prior corresponding period.
Sustained membership growth and improved margins are expected to provide a strong earnings base for FY17.
Goodlife remains in a market leading position for further growth as:
The Australian fitness industry continues to increase market penetration from 11.7% in 2011 to 14.8%1 in 2015;
The “wearables” phenomenon drives interest in activity and health club usage; and
Social media sharing provides increase in market reach and sales leads.
22(1) Source: The IHRSA Asia Pacific Health Club Report, 2015 and IHRSA 2011 Global Report
For
per
sona
l use
onl
y
Health Clubs Outlook (cont’d)
Goodlife’s digital transformation and marketing strategies are capitalising on these trends through new release of apps across connected wearables, member check-in, enhanced timetable and booking functionality, together with web and e-commerce enhancements.
Commencement of Goodlife/Coles Flybuys partnership reaching over seven million households is expected to provide improved retention through loyalty and rewards programs. The partnership will provide Goodlife with leading analytics to strategically target members through location and demographic profiling.
Further extension of Emily Skye partnership to exclusive in-class programs will increase member engagement.
23
For
per
sona
l use
onl
y
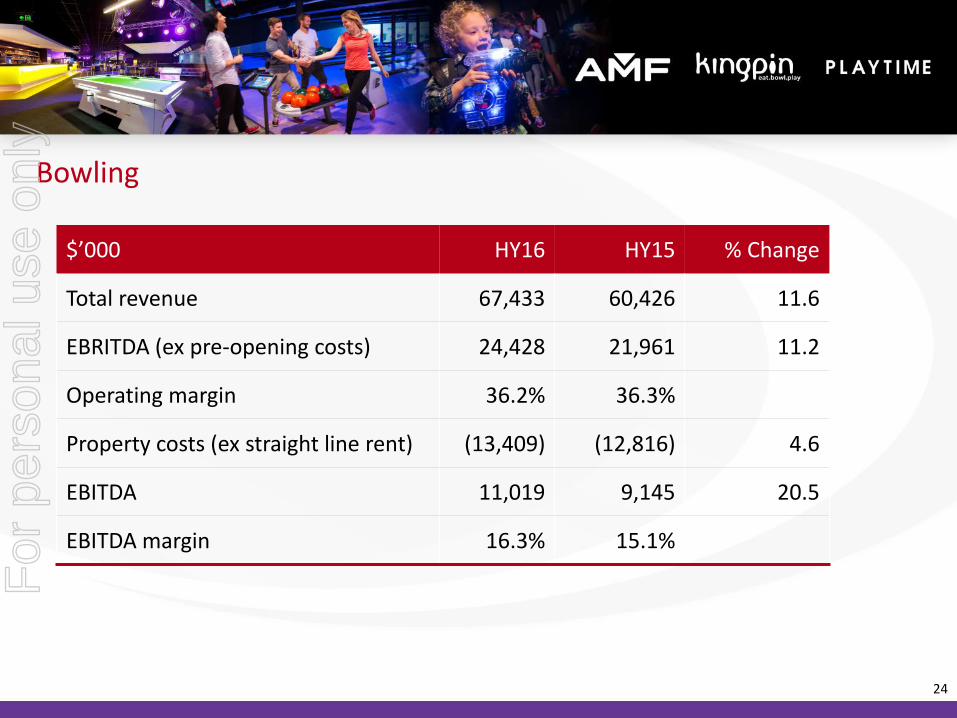
Bowling
24
$’000 HY16 HY15 % Change
Total revenue 67,433 60,426 11.6
EBRITDA (ex pre-opening costs) 24,428 21,961 11.2
Operating margin 36.2% 36.3%
Property costs (ex straight line rent) (13,409) (12,816) 4.6
EBITDA 11,019 9,145 20.5
EBITDA margin 16.3% 15.1%
For
per
sona
l use
onl
y
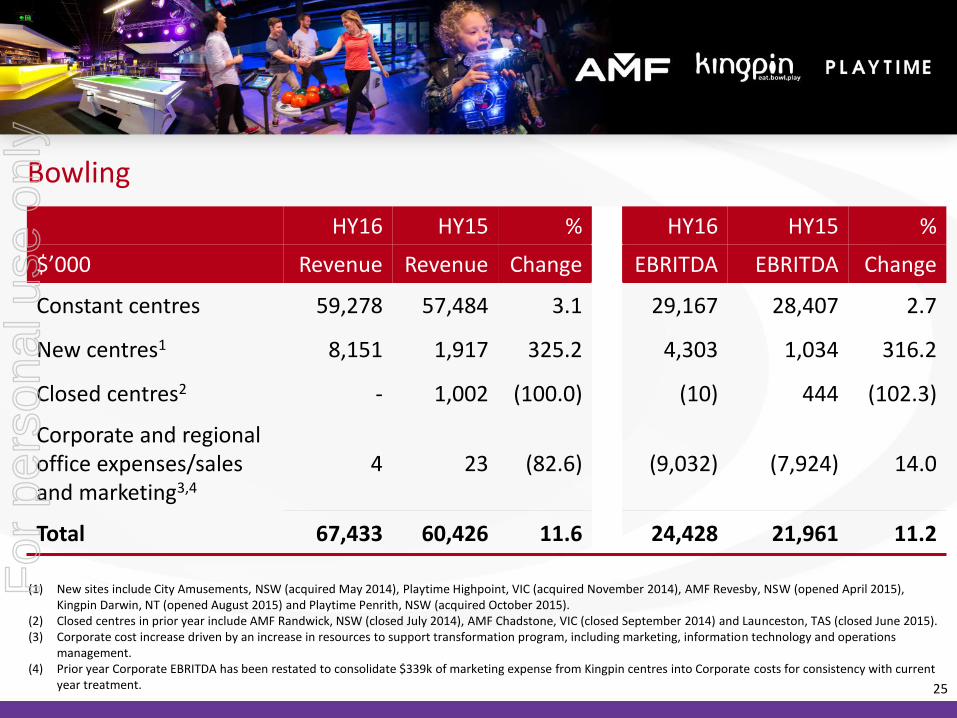
Bowling
25
HY16 HY15 % HY16 HY15 %
$’000 Revenue Revenue Change EBRITDA EBRITDA Change
Constant centres 59,278 57,484 3.1 29,167 28,407 2.7
New centres1 8,151 1,917 325.2 4,303 1,034 316.2
Closed centres2 - 1,002 (100.0) (10) 444 (102.3)
Corporate and regional office expenses/sales and marketing3,4
4 23 (82.6) (9,032) (7,924) 14.0
Total 67,433 60,426 11.6 24,428 21,961 11.2
(1) New sites include City Amusements, NSW (acquired May 2014), Playtime Highpoint, VIC (acquired November 2014), AMF Revesby, NSW (opened April 2015), Kingpin Darwin, NT (opened August 2015) and Playtime Penrith, NSW (acquired October 2015).
(2) Closed centres in prior year include AMF Randwick, NSW (closed July 2014), AMF Chadstone, VIC (closed September 2014) and Launceston, TAS (closed June 2015).(3) Corporate cost increase driven by an increase in resources to support transformation program, including marketing, information technology and operations
management.(4) Prior year Corporate EBRITDA has been restated to consolidate $339k of marketing expense from Kingpin centres into Corporate costs for consistency with current
year treatment.
For
per
sona
l use
onl
y
Bowling Half Year Commentary
26
Total revenue up 11.6%, delivering EBITDA growth of 20.5%.
Revenue growth of 3.1% for constant centres was underpinned by investment in amusement games, together with continuing innovation in food and beverage, creating a genuine multi-faceted entertainment offering.
Two new venues were added to the portfolio during the first half; Kingpin Darwin, NT (opened August 2015) and Playtime Penrith, NSW (acquired October 2015) with both exceeding expectations.
During December and January, AMF participated in a successful national television campaign with the Sydney Thunder cricket team and Ten Connect which has contributed to double digit revenue growth for the summer school holidays.
The business continues to invest in the customer booking experience, including enhancements to the call centre and websites, and the introduction of live chat sessions.
For
per
sona
l use
onl
y
Bowling Outlook
New Playtime venue at Miranda NSW opened in February 2016, along with the launch of a website to support the Playtime brand.
AMF and Kingpin venues will continue to drive revenue through enhanced Food and Beverage menus, improved amusement games and expanded entertainment offerings.
An exclusive new partnership between AMF and DreamWorks Animation, the well known Hollywood studio, will be launched in February to offer character themed birthday parties at selected centres.
Extensive refurbishment of the division's flagship Kingpin centre, at Crown Casino, Melbourne’s pre-eminent entertainment complex, will commence in Q4 FY16.
The Bowling division will continue to execute on its strategy of developing and acquiring stand-alone amusement game facilities, exiting underperforming legacy centres and refurbishing selected key locations as multi-faceted entertainment destinations.
27
For
per
sona
l use
onl
y
Theme Parks
28
$’000 HY16 HY15 % Change
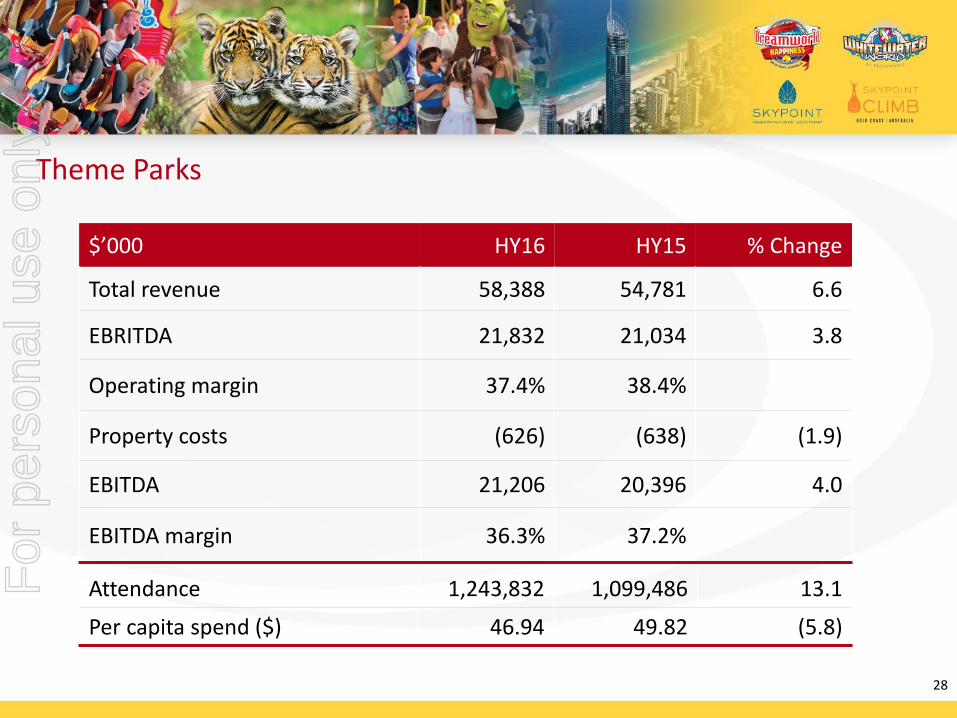
Total revenue 58,388 54,781 6.6
EBRITDA 21,832 21,034 3.8
Operating margin 37.4% 38.4%
Property costs (626) (638) (1.9)
EBITDA 21,206 20,396 4.0
EBITDA margin 36.3% 37.2%
Attendance 1,243,832 1,099,486 13.1
Per capita spend ($) 46.94 49.82 (5.8)
For
per
sona
l use
onl
y
Strong result with revenue up 6.6% and EBITDA up 4.0%.
High attendance growth was driven by domestic and international markets (Chinese attendance up over 80% on prior corresponding period).
Investment in the guest experience, including park presentation, entertainment and extended hours of trade over summer drove record January revenue (unaudited), up over 9% on prior corresponding period.
Roll-out of food and an expanded focus on exclusive merchandise and retail brands are increasing in-park spend.
Three tiger cubs were born in the first half as part of a successful breeding program at Tiger Island further strengthening one of Dreamworlds unique points of difference.
Theme Parks Half Year Commentary
29
For
per
sona
l use
onl
y
A new motorsport precinct launched on Boxing Day including ‘Brock’s Garage’ V8 Supercars, new ‘Grid Burger’ food outlet, ‘Trackside’ retail and ‘Hot Wheels’ themed rollercoaster.
New virtual queuing system ‘Ride Express’ was launched at Dreamworld in December featuring a tiered pricing model with significant guest take-up and revenue increase.
Theme Parks Half Year Commentary (cont’d)
30
For
per
sona
l use
onl
y
The SkyPoint business continues to perform well, with attendances boosted by the international market and continued growth in Events and Climb revenue.
Membership payment plans will be launched in March 2016 including tiered pricing model and benefits to drive per capita yield.
Growth in domestic and international visitors is expected to continue, driven by improving domestic travel trends, increased international air capacity to the Gold Coast and a more favourable exchange rate.
Continued roll-out of the food and retail strategy is expected to increase in-park spend and improve the guest experience.
One of the most popular areas of Dreamworld, Tiger Island, is set to undergo a major refurbishment commencing in March 2016. Guests will enjoy a world class animal exhibit focused on conservation and breeding programs for endangered species.
Theme Parks Outlook
31
For
per
sona
l use
onl
y
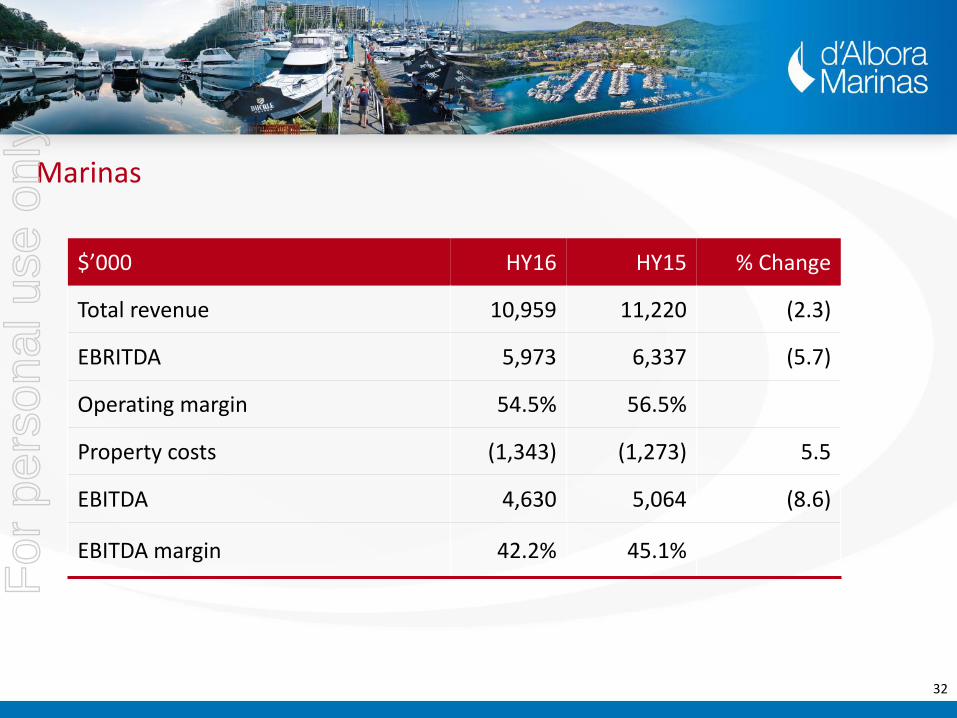
Marinas
32
$’000 HY16 HY15 % Change
Total revenue 10,959 11,220 (2.3)
EBRITDA 5,973 6,337 (5.7)
Operating margin 54.5% 56.5%
Property costs (1,343) (1,273) 5.5
EBITDA 4,630 5,064 (8.6)
EBITDA margin 42.2% 45.1%
For
per
sona
l use
onl
y
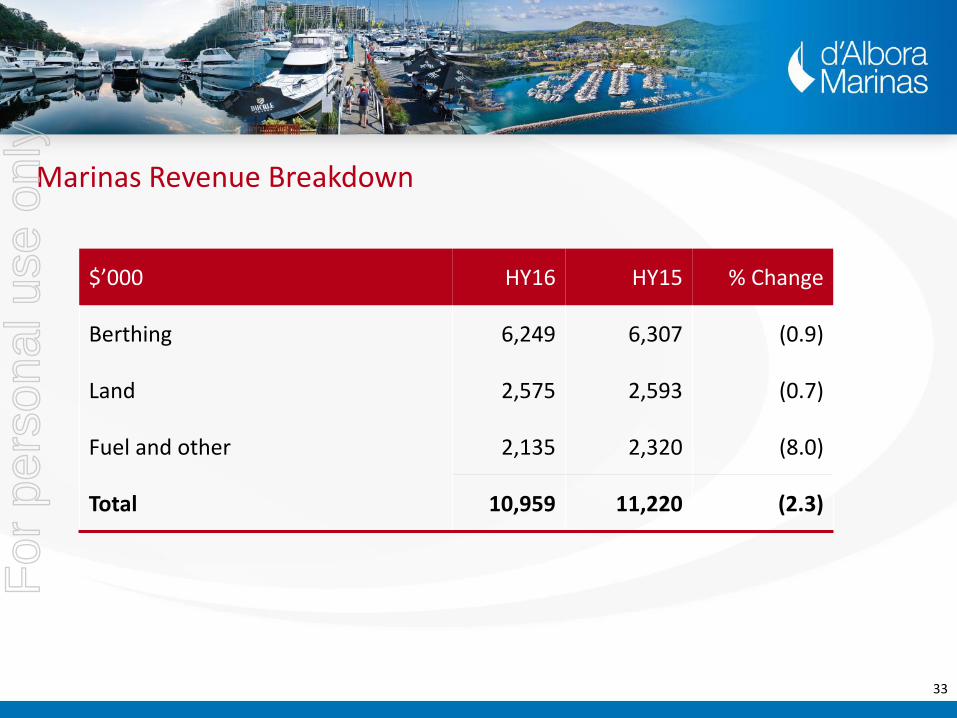
Marinas Revenue Breakdown
33
$’000 HY16 HY15 % Change
Berthing 6,249 6,307 (0.9)
Land 2,575 2,593 (0.7)
Fuel and other 2,135 2,320 (8.0)
Total 10,959 11,220 (2.3)
For
per
sona
l use
onl
y
Marinas Half Year Commentary
Revenue and EBITDA were down for the first half year, affected by a number of
abnormal factors which are now being resolved:
Berth and fuel revenue were adversely impacted during the major redevelopment of The Spit (NSW) marina;
Adjacent building construction negatively impacted Victoria Harbour (VIC) berthing occupancies; and
The start up costs of a new function centre at Nelsons Bay (NSW).
Overall berthing occupancy remains solid at 82% for the first half year.
34
For
per
sona
l use
onl
y
Marinas Half Year Outlook
Overall marina business fundamentals are robust and it is expected that there will be an
overall improvement in the next financial year as the effect of the abnormal factors that
impacted the first half lessen.
35
For
per
sona
l use
onl
y
Group Financial Results for the Half Year Ended 31 December 2015
For
per
sona
l use
onl
y
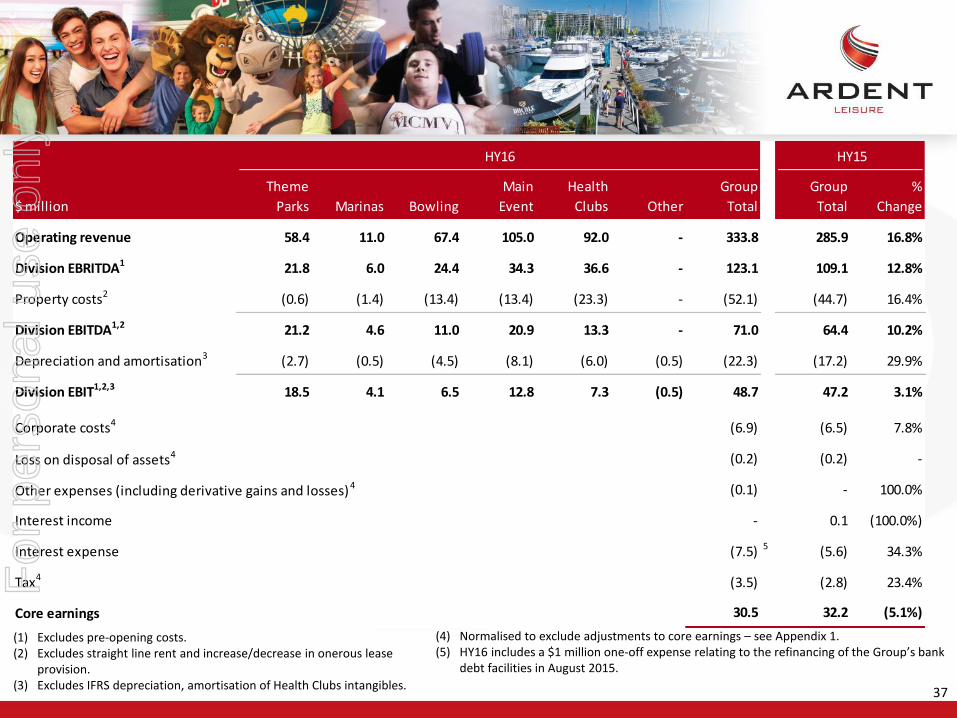
37
(1) Excludes pre-opening costs.(2) Excludes straight line rent and increase/decrease in onerous lease
provision.(3) Excludes IFRS depreciation, amortisation of Health Clubs intangibles.
$ million
Theme
Parks Marinas Bowling
Main
Event
Health
Clubs Other
Group
Total
Group
Total
%
Change
Operating revenue 58.4 11.0 67.4 105.0 92.0 - 333.8 285.9 16.8%
Division EBRITDA1 21.8 6.0 24.4 34.3 36.6 - 123.1 109.1 12.8%
Property costs2 (0.6) (1.4) (13.4) (13.4) (23.3) - (52.1) (44.7) 16.4%
Division EBITDA1,2 21.2 4.6 11.0 20.9 13.3 - 71.0 64.4 10.2%
Depreciation and amortisation3 (2.7) (0.5) (4.5) (8.1) (6.0) (0.5) (22.3) (17.2) 29.9%
Division EBIT1,2,3 18.5 4.1 6.5 12.8 7.3 (0.5) 48.7 47.2 3.1%
Corporate costs4 (6.9) (6.5) 7.8%
(0.2) (0.2) -
(0.1) - 100.0%
Interest income - 0.1 (100.0%)
Interest expense (7.5) 5 (5.6) 34.3%
Tax4 (3.5) (2.8) 23.4%
30.5 32.2 (5.1%)
HY16 HY15
Loss on disposal of assets4
Other expenses (including derivative gains and losses)4
Core earnings
(4) Normalised to exclude adjustments to core earnings – see Appendix 1.(5) HY16 includes a $1 million one-off expense relating to the refinancing of the Group’s bank
debt facilities in August 2015.
For
per
sona
l use
onl
y
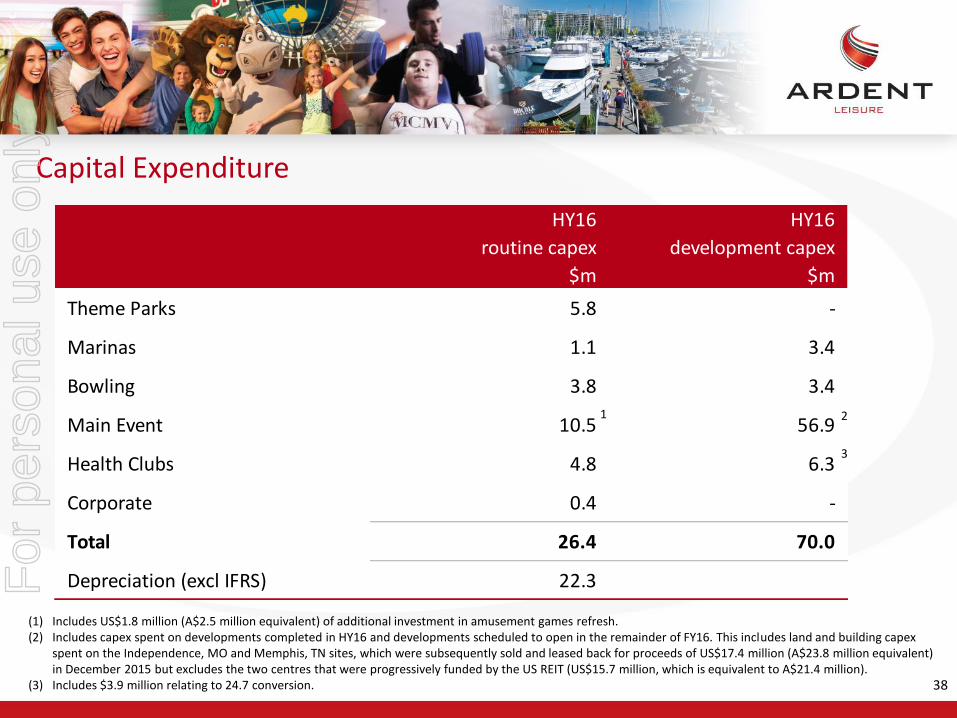
Capital Expenditure
38
(1) Includes US$1.8 million (A$2.5 million equivalent) of additional investment in amusement games refresh.(2) Includes capex spent on developments completed in HY16 and developments scheduled to open in the remainder of FY16. This includes land and building capex
spent on the Independence, MO and Memphis, TN sites, which were subsequently sold and leased back for proceeds of US$17.4 million (A$23.8 million equivalent) in December 2015 but excludes the two centres that were progressively funded by the US REIT (US$15.7 million, which is equivalent to A$21.4 million).
(3) Includes $3.9 million relating to 24.7 conversion.
HY16 HY16
routine capex development capex
$m $m
Theme Parks 5.8 -
Marinas 1.1 3.4
Bowling 3.8 3.4
Main Event 10.5 56.9
Health Clubs 4.8 6.3
Corporate 0.4 -
Total 26.4 70.0
Depreciation (excl IFRS) 22.3
21
3
For
per
sona
l use
onl
y

39
Consolidated group ($ million) 31 December 2015 30 June 2015
Assets
Theme Parks 276.0 262.7
Excess land 1.5 1.9
Marinas 113.1 109.9
Bowling 142.7 140.9
Main Event 289.2 217.9
Health Clubs 252.4 250.4
Other 12.8 12.8
Total Assets 1,087.7 996.5
Liabilities
Bank debt 328.5 278.6
Other 166.6 138.4
Total Liabilities 495.1 417.0
Net Assets 592.6 579.5
For
per
sona
l use
onl
y
The Group should be viewed in two distinct geographical parts – Australia and the United States:
The Australian Group is more mature, lower growth and less capex intensive.
The US Group (Main Event) has a national roll-out opportunity, which will require significant capital investment to realise.
Documentation has been executed on the Main Event development funding facility provided by an institutional real estate investor. In the first half, Main Event utilised this facility to progressively fund two centres for a total of US$15.7 million and to sell and lease back a further two centres for proceeds of US$17.4 million.
In August 2015, the Group increased and extended its syndicated Australian and US dollar banking facilities which included an additional US$120 million debt capacity to fund the US growth.
Capital Management
40
For
per
sona
l use
onl
y
As part of the Group’s capital management plan, the Group will continue to use the Distribution Reinvestment Plan. At the half year, the Group also underwrote the balance of the half year distribution.
Going forward, the Group will look to retain a higher percentage of US earnings to contribute to funding the growth of Main Event.
This will result in a lower Group distribution payout ratio, however, the Group’s intention is not to lower the absolute cents payable per security from the prior year.
Capital Management (cont’d)
41
For
per
sona
l use
onl
y
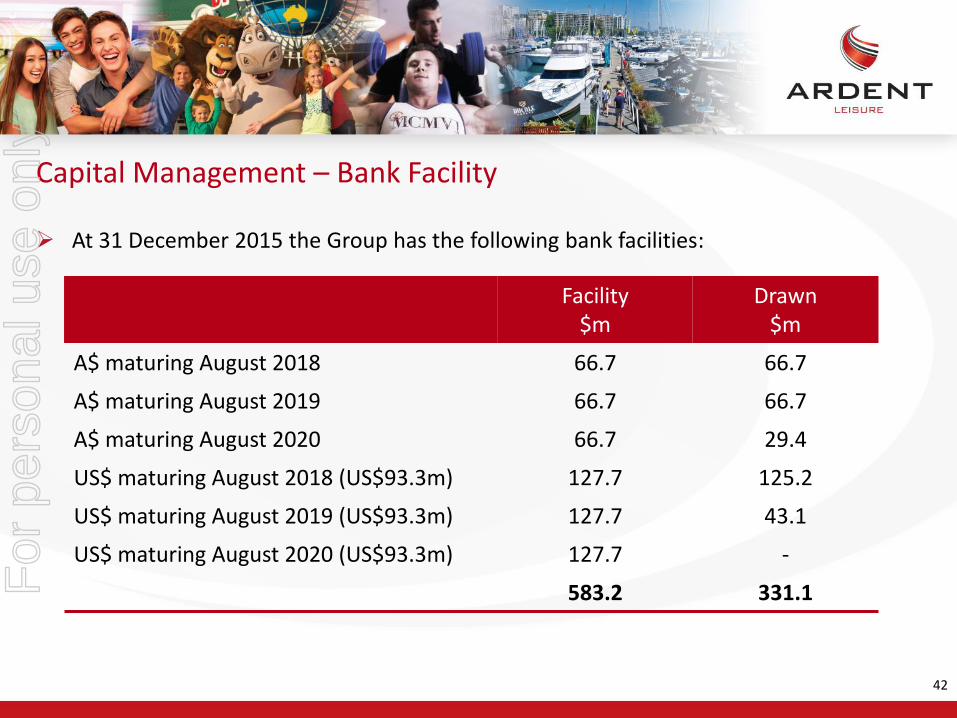
At 31 December 2015 the Group has the following bank facilities:
Facility$m
Drawn$m
A$ maturing August 2018 66.7 66.7
A$ maturing August 2019 66.7 66.7
A$ maturing August 2020 66.7 29.4
US$ maturing August 2018 (US$93.3m) 127.7 125.2
US$ maturing August 2019 (US$93.3m) 127.7 43.1
US$ maturing August 2020 (US$93.3m) 127.7 -
583.2 331.1
Capital Management – Bank Facility
42
For
per
sona
l use
onl
y
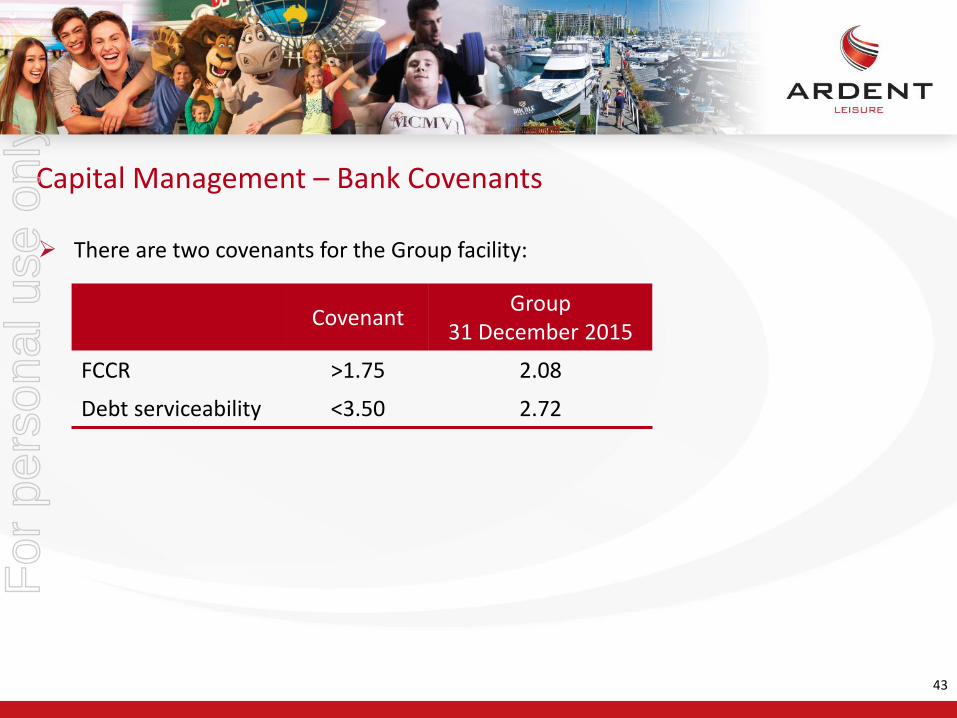
There are two covenants for the Group facility:
CovenantGroup
31 December 2015
FCCR >1.75 2.08
Debt serviceability <3.50 2.72
Capital Management – Bank Covenants
43
For
per
sona
l use
onl
y
At 31 December 2015, the Group had 63.4% of interest on debt facilities fixed through interest rate swaps.
At 31 December 2015, the weighted average rate, including margin, was 4.39% for AUD debt and 2.36% for USD debt.
US earnings are 100% unhedged and will benefit from any further strengthening of USD.
Capital Management – Interest & Foreign Exchange
44
For
per
sona
l use
onl
y
Group Outlook
For
per
sona
l use
onl
y
The Group will:
Continue to execute and benefit from the national roll-out opportunity for Main Event in the US (35 centres by 30 June 2017) and target low single digit long term revenue growth for constant centres.
Complete conversion of all potential 24.7 Goodlife health clubs and take advantage of digital transformation and social media to drive ongoing membership growth and EBITDA growth of over 10% in the second half.
Continue to execute on the Bowling division’s strategy of developing and acquiring stand-alone amusement facilities, exiting underperforming legacy centres and refurbishing selected key locations as multi-faceted entertainment destinations.
Invest strategically in unique attractions and an improved customer experience at Dreamworld to capitalise on increased domestic and international tourism to the Gold Coast.
Increase occupancy at d’Albora marinas and extend leases to maximise full asset value. 46
Ardent Leisure – It’s All About The Customer
More People, to Visit More Often and Spend More Per Visit
For
per
sona
l use
onl
y

Appendices
For
per
sona
l use
onl
y
48
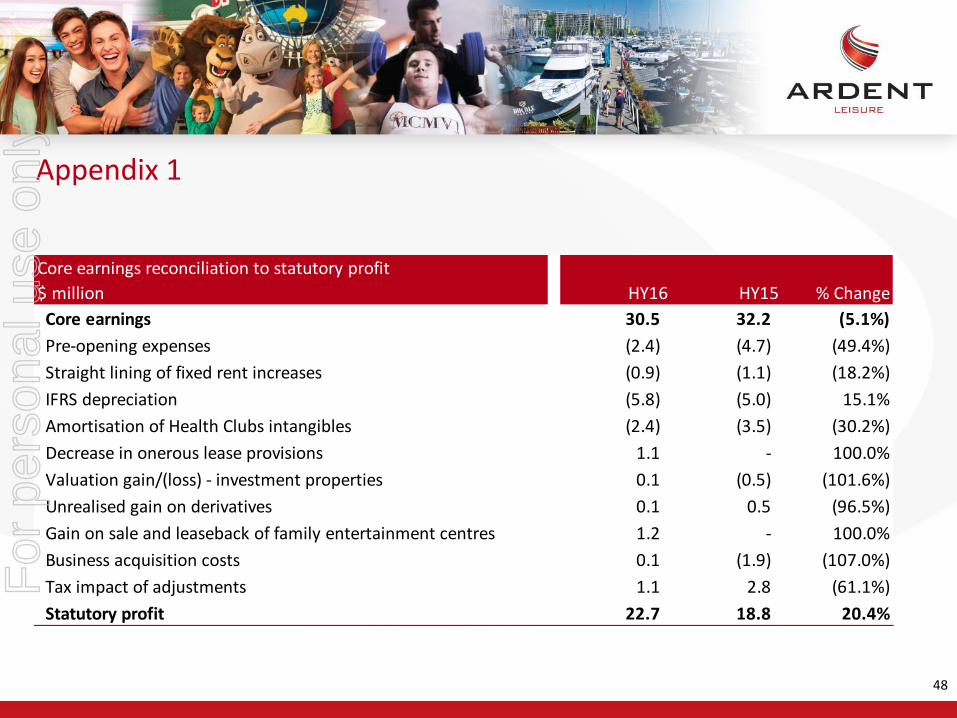
Appendix 1
Core earnings reconciliation to statutory profit
$ million HY16 HY15 % Change
Core earnings 30.5 32.2 (5.1%)
Pre-opening expenses (2.4) (4.7) (49.4%)
Straight lining of fixed rent increases (0.9) (1.1) (18.2%)
IFRS depreciation (5.8) (5.0) 15.1%
Amortisation of Health Clubs intangibles (2.4) (3.5) (30.2%)
Decrease in onerous lease provisions 1.1 - 100.0%
Valuation gain/(loss) - investment properties 0.1 (0.5) (101.6%)
Unrealised gain on derivatives 0.1 0.5 (96.5%)
Gain on sale and leaseback of family entertainment centres 1.2 - 100.0%
Business acquisition costs 0.1 (1.9) (107.0%)
Tax impact of adjustments 1.1 2.8 (61.1%)
Statutory profit 22.7 18.8 20.4%
For
per
sona
l use
onl
y
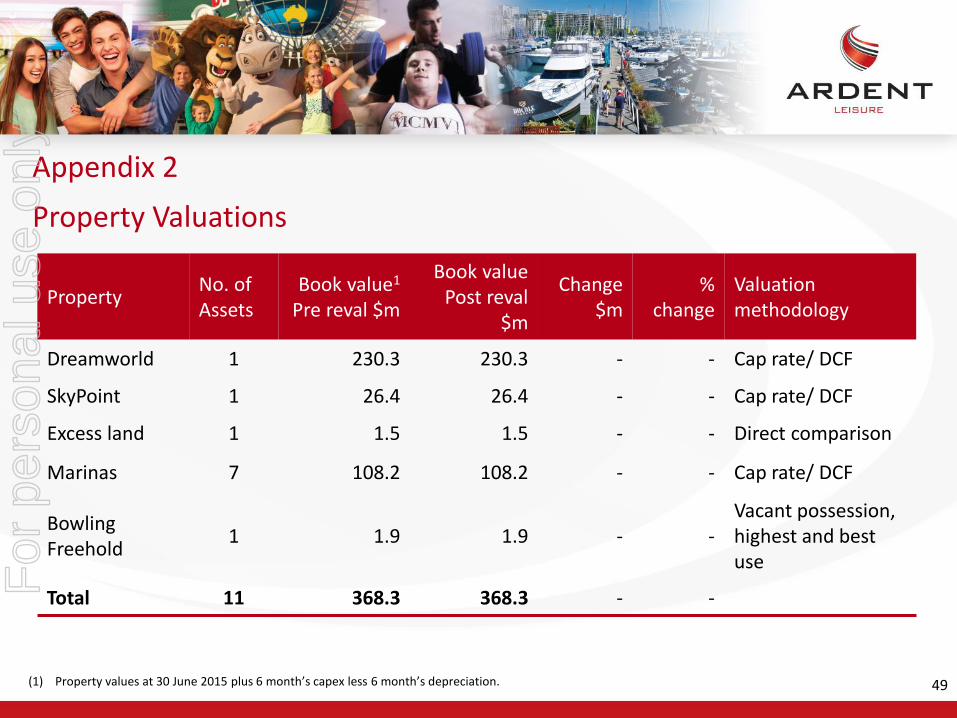
PropertyNo. of Assets
Book value1
Pre reval $m
Book value Post reval
$m
Change $m
% change
Valuation methodology
Dreamworld 1 230.3 230.3 - - Cap rate/ DCF
SkyPoint 1 26.4 26.4 - - Cap rate/ DCF
Excess land 1 1.5 1.5 - - Direct comparison
Marinas 7 108.2 108.2 - - Cap rate/ DCF
Bowling Freehold
1 1.9 1.9 - -Vacant possession, highest and best use
Total 11 368.3 368.3 - -
(1) Property values at 30 June 2015 plus 6 month’s capex less 6 month’s depreciation.
Appendix 2
49
Property Valuations
For
per
sona
l use
onl
y
Disclaimer
This information has been prepared for general information purposes only, is not general financial product advice and has been prepared by Ardent Leisure Management Limited ABN 36 079 630 676 (ALML), without taking into account any potential investors’ personal objectives, financial situation or needs.
Past performance information provided in this presentation may not be a reliable indication of future performance.
Due care and attention has been exercised in the preparation of forecast information, however, forecasts, by their very nature, are subject to uncertainty and contingencies many of which are outside the control of ALML and Ardent Leisure Limited (ALL). Actual results may vary from forecasts and any variation may be materially positive or negative.
ALML provides a limited $5 million guarantee to the Australian Securities and Investments Commission in respect of ALML's Corporations Act obligations as a responsible entity of managed investment schemes. Neither ALML nor any other Ardent Leisure Group entity otherwise provides assurances in respect of the obligations of any entity within Ardent Leisure Group.
The information contained herein is current as at the date of this presentation unless specified otherwise.
For
per
sona
l use
onl
y