for personal use only - elanor investorselanorinvestors.com/erf/images/erf2017annrespres.pdf · for...
TRANSCRIPT

ELANOR RETAIL PROPERTY FUNDFY17 Results Presentation
21 August 2017
For
per
sona
l use
onl
y

Contents
[ 2 ]
1 FY17 Results Highlights 3
2 ERF Strategy and Value Proposition 6
3 Fund Overview 19
4 FY17 Financial Results 23
5 Outlook 27
6 Appendix 29
For
per
sona
l use
onl
y

FY17 Results Highlights
For
per
sona
l use
onl
y

FY17 Results Highlights
[ 4 ]
1. Net debt / total assets less cash2. At market close on 30 June 2017
Core Earnings $8.67m • Core Earnings in line with PDS forecast
Distributions PerSecurity 6.40c
• Distributions per stapled security in line with PDS forecast
• 95% Core Earnings payout ratio
NTA Per Security $1.42• Listed 9 November 2016 with 128.7m stapled
securities. NTA per security has increased from $1.25 to $1.42, or 13.8%, since listing
Portfolio AvgCap Rate 7.2%
• Portfolio of 5 high investment quality retail shopping centres
• Portfolio value increased by $17.5m to $260.8m at 30 June 2017
Gearing1 29.3% • Below target range of between 30% and 40%
Security Price2 $1.37 • Increase from listing price of $1.35
For
per
sona
l use
onl
y
ERF Delivers Fund Strategy and Performance
[ 5 ]
Nov-16 Dec-16 Jan-17 Feb-17 Mar-17 Apr-17 May-17 Jun-17 Jul-17
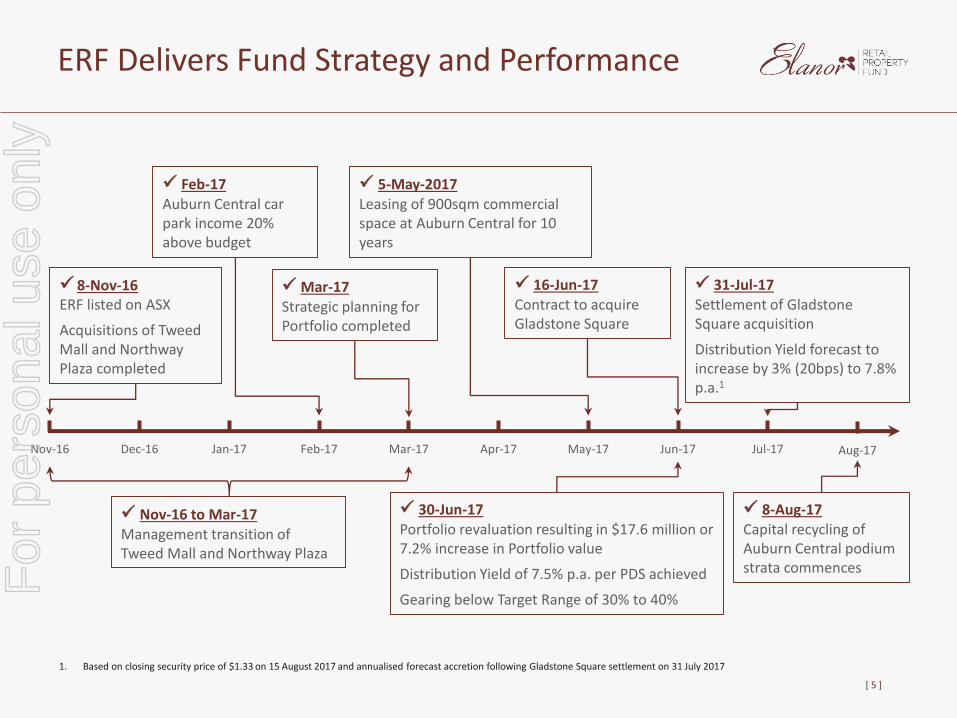
8-Nov-16ERF listed on ASX
Acquisitions of Tweed Mall and Northway Plaza completed
Feb-17Auburn Central car park income 20% above budget
5-May-2017Leasing of 900sqm commercial space at Auburn Central for 10 years
16-Jun-17Contract to acquire Gladstone Square
30-Jun-17Portfolio revaluation resulting in $17.6 million or 7.2% increase in Portfolio value
Distribution Yield of 7.5% p.a. per PDS achieved
Gearing below Target Range of 30% to 40%
31-Jul-17Settlement of Gladstone Square acquisition
Distribution Yield forecast to increase by 3% (20bps) to 7.8% p.a.1
Aug-17
8-Aug-17Capital recycling of Auburn Central podium strata commences
Nov-16 to Mar-17Management transition of Tweed Mall and Northway Plaza
Mar-17Strategic planning for Portfolio completed
1. Based on closing security price of $1.33 on 15 August 2017 and annualised forecast accretion following Gladstone Square settlement on 31 July 2017
For
per
sona
l use
onl
y
ERF Strategy and Value Proposition
For
per
sona
l use
onl
y

Fund Strategy and Investment Philosophy
[ 7 ]
Invest
Invest in retail properties that provide
strong and stable earnings from a
diversified retail tenant mix, with a focus on non-discretionary
retailers
Active Asset Management
Implement active leasing and other asset management initiatives to grow the income and
value of the Portfolio
High Quality Acquisitions
Acquire additional high investment quality Sub-
Regional and Neighbourhood
shopping centres with a significant component of non-discretionary
retailers
Reposition Assets
Implement development and
repositioning strategies in the Portfolio
properties and in any additional properties acquired in the future
Capital Structure
Management
Maintain a conservative capital structure with a target gearing range of between 30% and 40%
to deliver…
Low Risk-Adjusted
Cash Flows
Operational Upside
Strategic Upside
Growth
resulting in a…
Low Risk Retail REIT with significant NTA Value Upside
For
per
sona
l use
onl
y

ERF Presents Value
[ 8 ]
Risk focused investment philosophy and active asset management approach to deliver strong performance from its high investment quality Portfolio
Attractive relative to peers
– Low risk Retail REIT with NTA value upside
– Trading at significant discount to NTA
– Significantly higher Distribution Yield
– Significantly higher Portfolio capitalisation rate to Sub-Regional and Neighbourhood shopping centre market and peers
Low risk-adjusted cash flows – investment in Sub-Regional and Neighbourhood shopping centres
– Focus on lower risk, non-discretionary expenditure
– Generate strong risk adjusted returns
Operational and Strategic upside
– Strong operational and strategic upside potential in each Portfolio asset
– Active asset management approach to continue to deliver value
– Significant strategic value add opportunities
– Discount Department Stores (DDS) represent a net value add opportunity across the ERF Portfolio; currently representing only 15% of rental income
Accretive Growth
– Acquisition of Gladstone Square will increase Distribution Yield by 3% to 7.8% per annum1
– Asset recycling will enable further accretive acquisitions of high investment quality shopping centres
1. Based on closing security price of $1.33 on 15 August 2017 and annualised forecast accretion following Gladstone Square settlement on 31 July 2017
For
per
sona
l use
onl
y

7.6%
6.1%
6.5%
7.1%
6.0%
5.5%
6.8%
ERF SCP VCX CQR BWP SCG AVN
Average Direct Comparables (6.5%)
Average Other Retail Comparables (6.1%)
(6.3%)
0.5%
(2.8%)(1.5%)
6.9%
9.0%
4.0%
ERF SCP VCX CQR BWP SCG AVN
Average Direct Comparables (-1.3%)
Average Other Retail Comparables (6.6%)
ERF Represents Value Relative to Peers
[ 9 ]
Trading at NTA discount1 Higher Distribution Yield than Peers1
1. Based on closing security price of $1.33 on 15 August 2017 and using latest available NTA for peers2. Annualised forecast accretion following Gladstone Square settlement on 31 July 2017
0.2%
7.8%
Gladstone Square accretion2
For
per
sona
l use
onl
y

5.50%
6.00%
6.50%
7.00%
7.50%
8.00%
8.50%
Jun
-13
Sep
-13
De
c-1
3
Mar
-14
Jun
-14
Sep
-14
De
c-1
4
Mar
-15
Jun
-15
Sep
-15
De
c-1
5
Mar
-16
Jun
-16
Sep
-16
De
c-1
6
Mar
-17
Jun
-17
Neighbourhood Sub-Regional
ERF Represents Value Relative to Peers (cont’d)
[ 10 ]
Source: Colliers Research and ASX
ERF Weighted Average Portfolio Capitalisation Rate is substantially higher than the Sub-Regional and Neighbourhood shopping centre market and peers
ERF (Dec-16): 7.5%
ERF: 7.2%
SCP: 6.5%
CQR: 6.3%
VCX: 5.6%
For
per
sona
l use
onl
y

ERF has Low Risk-Adjusted Cash Flows
[ 11 ]
Source: JLL Research, MSCI / IPD
7.50%
8.50%
9.50%
10.50%
11.50%
12.50%
1.50% 2.00% 2.50% 3.00% 3.50% 4.00% 4.50%
Sub-Regional Retail
IndustrialDistributionSuper & Major
RegionalRetail
RegionalRetail
Large FormatRetail
Industrial Warehouse
Neighbourhood Retail
Non-CBD Office
Industrial High Tech
CBDOffice
IndustrialEstate
Non discretionary focussed Sub-Regional and Neighbourhood shopping centres provide strongrisk-adjusted returns relative to other real estate asset classes
Risk
Tota
l Ret
urn
For
per
sona
l use
onl
y
1%
1%
1%
2%
3%
3%
6%
8%
9%
14%
Sunshine Fruit
Lincraft
Australia Post
Alpha Omega Senior College
Amcal
Cornett's Supa IGA / Metcash
Target
Coles
Big W
Woolworths
ERF has Stable and Secure Rental Income
[ 12 ]
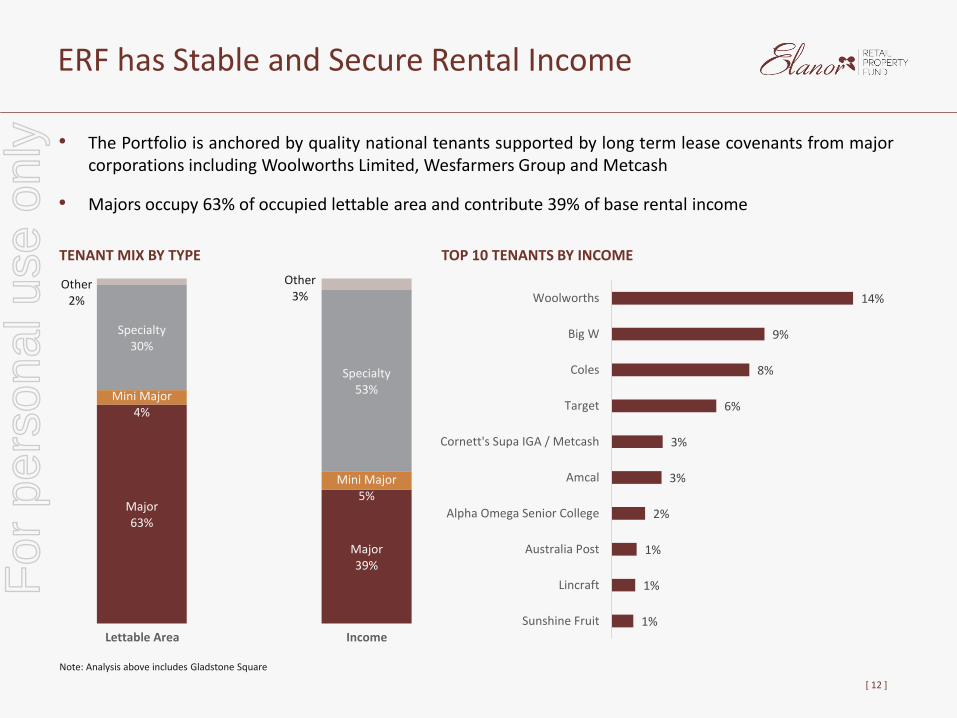
• The Portfolio is anchored by quality national tenants supported by long term lease covenants from majorcorporations including Woolworths Limited, Wesfarmers Group and Metcash
• Majors occupy 63% of occupied lettable area and contribute 39% of base rental income
Major63%
Major39%
Mini Major4%
Mini Major5%
Specialty30%
Specialty53%
Other2%
Other3%
Lettable Area Income
TENANT MIX BY TYPE TOP 10 TENANTS BY INCOME
Note: Analysis above includes Gladstone Square
For
per
sona
l use
onl
y

1%6% 8%
51%
2%4%
4%
4%
5%
10%
1%
1%
1%3%
6%5%
11%
4%
13%
61%
Vacancy /Holdover
FY18 FY19 FY20 FY21 FY22+
Major / Mini Major Specialty Other Vacant Rental Guarantee
ERF has Stable and Secure Rental Income (cont’d)
[ 13 ]
• The Portfolio has a strong exposure to non-discretionary spending providing a secure income base
• Portfolio 99.1% occupied1 with Portfolio WALE of 5.4 years by Portfolio lettable area and 4.8 years by Portfolio base rental income
LEASE EXPIRY2
28%
57%
15% Discretionary
Non-Discretionary
DDS
Note: Analysis above includes Gladstone Square1. By Lettable Area and includes Rental Guarantees2. By base rental income
NON-DISCRETIONARY EXPOSURE2
For
per
sona
l use
onl
y

Strong Operational and Strategic Upside
[ 14 ]
Short Term<12 months
Medium Term1 – 3 years
Long Term3 years +
Auburn Central
Asset Recycling Development
Divest non-core podium strata lotsRepositioning of DDS space
Tweed Mall
Leasing DevelopmentDevelopment
Introduction of new mini-major and specialty remixMixed-ese concept master-planning and stagingMixed-use development partnership and delivery
Manning Mall
LeasingDevelopment
Introduction of new Mini Major(s)Introduction of fast food restaurant
Gladstone Square
LeasingOperational
Specialty leasing and remixing of tenanciesCar park management
Glenorchy Plaza
Asset Recycling Consider divestment of non-core asset
Northway Plaza
DevelopmentAsset Recycling
Develop pad sitesSell pad sites
Portfolio Operational Manage electricity and other operating costs
Portfolio Acquisitions Acquisition of accretive, high investment quality shopping centres from capital recycling proceeds
AcquisitionsLeasing Development Operational Asset Recycling
For
per
sona
l use
onl
y

Active Asset Management Track Record
[ 15 ]
CASE STUDY: AUBURN CENTRAL
• Acquired in May 2015 for $68.0 million (8.1% cap rate)
• $1 million investment in significant specialty remixing strategy focussing on introduction of non-discretionary retailers – generating ROI of 45% and improving centre sales performance
• $1 million investment in car park management system and refurbishment to increase turnover and improve utilisation of car park –generating ROI of 36% and improving centre sales performance
• New college occupying 900m2
commercial tenancy on a 10 year lease, providing further activation of casual dining precinct
• Independent valuation of $95.0 million (6.5% cap rate) at 30 June 2017
Further asset management opportunities:
• Capital recycling from sales of non-core podium strata tenancies, generating proceeds of approximately $21 million to be invested in additional high investment quality shopping centre assets with a strong non-discretionary retail component and significant asset management opportunities
• Improve sales performance from DDS retail tenancy
For
per
sona
l use
onl
y

DDS Represent a Net Value Add for ERF
[ 16 ]
DDS sales performance and productivity remains challenging
DDS represent a net value add opportunity across the ERF Portfolio
Only 15% of ERF’s rental income is
derived from DDS
ERF’s DDS pay a low rental
rate, providing inherent
income upside opportunities
Alternative uses (retail and other) are
available for the majority of
ERF’s DDS tenancies
Net upside across ERF’s DDS space
For
per
sona
l use
onl
y
Growth Opportunities
[ 17 ]
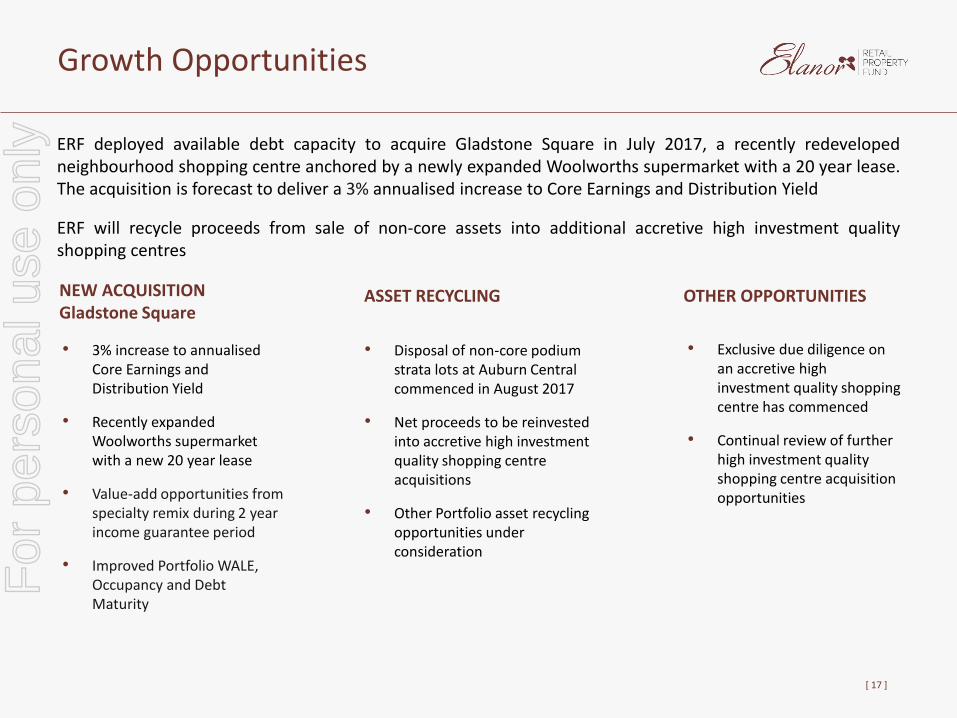
ERF deployed available debt capacity to acquire Gladstone Square in July 2017, a recently redevelopedneighbourhood shopping centre anchored by a newly expanded Woolworths supermarket with a 20 year lease.The acquisition is forecast to deliver a 3% annualised increase to Core Earnings and Distribution Yield
ERF will recycle proceeds from sale of non-core assets into additional accretive high investment qualityshopping centres
OTHER OPPORTUNITIES
• Exclusive due diligence on an accretive high investment quality shopping centre has commenced
• Continual review of further high investment quality shopping centre acquisition opportunities
ASSET RECYCLING
• Disposal of non-core podium strata lots at Auburn Central commenced in August 2017
• Net proceeds to be reinvested into accretive high investment quality shopping centre acquisitions
• Other Portfolio asset recycling opportunities under consideration
NEW ACQUISITION Gladstone Square
• 3% increase to annualised Core Earnings and Distribution Yield
• Recently expanded Woolworths supermarket with a new 20 year lease
• Value-add opportunities from specialty remix during 2 year income guarantee period
• Improved Portfolio WALE, Occupancy and Debt Maturity
For
per
sona
l use
onl
y
New Acquisition: Gladstone Square
[ 18 ]
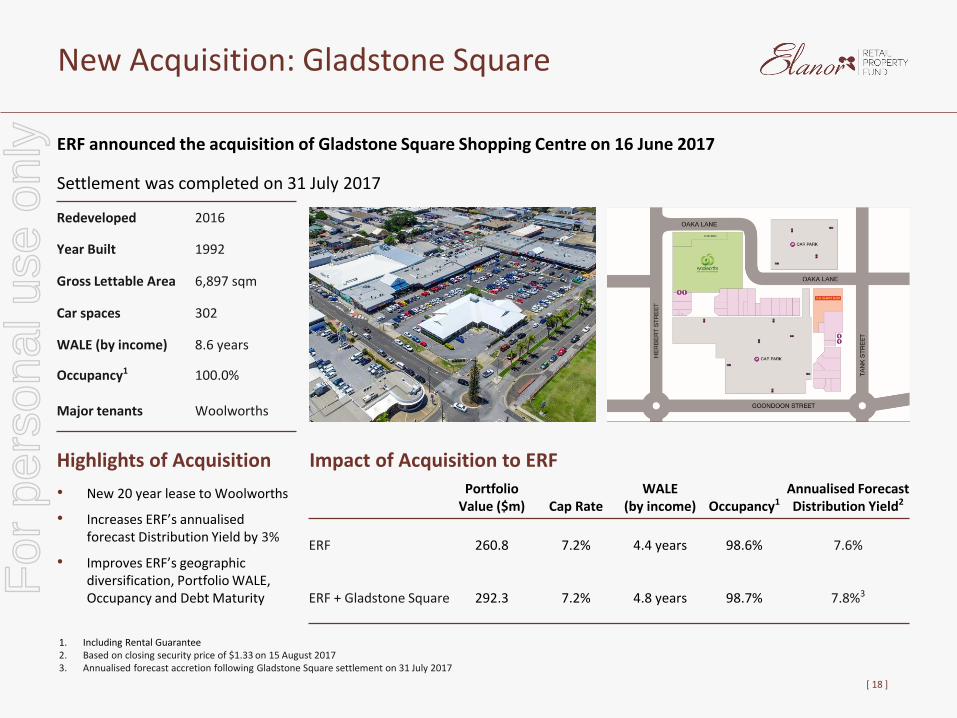
ERF announced the acquisition of Gladstone Square Shopping Centre on 16 June 2017
Settlement was completed on 31 July 2017
Redeveloped 2016
Year Built 1992
Gross Lettable Area 6,897 sqm
Car spaces 302
WALE (by income) 8.6 years
Occupancy1 100.0%
Major tenants Woolworths
Impact of Acquisition to ERFPortfolio
Value ($m) Cap RateWALE
(by income) Occupancy1Annualised Forecast Distribution Yield2
ERF 260.8 7.2% 4.4 years 98.6% 7.6%
ERF + Gladstone Square 292.3 7.2% 4.8 years 98.7% 7.8%3
Highlights of Acquisition
• New 20 year lease to Woolworths
• Increases ERF’s annualised forecast Distribution Yield by 3%
• Improves ERF’s geographic diversification, Portfolio WALE, Occupancy and Debt Maturity
1. Including Rental Guarantee2. Based on closing security price of $1.33 on 15 August 20173. Annualised forecast accretion following Gladstone Square settlement on 31 July 2017
For
per
sona
l use
onl
y

Fund Overview
For
per
sona
l use
onl
y

$243m
$292m
$32m
$18m
1H17 GladstoneSquare
Acquisition
Valuationgrowth
FY17
Portfolio Overview
ERF’s Portfolio is currently valued at $292.3m
• As at 30 June 2017, the Portfolio comprised of five high investment quality retail shopping centre assetsvalued at $260.8m
• As announced on 16 June 2017, ERF exchanged contracts to acquire Gladstone Square Shopping Centre for$31.5m. Settlement was completed on 31 July 2017
[ 20 ]
PORTFOLIO VALUE MOVEMENTS
95.0
86.5
43.0
19.8
16.5
31.5
PORTFOLIO BY VALUE
$292.3m
Glenorchy Plaza
Manning Mall
Northway Plaza
Auburn Central
Tweed Mall
Gladstone Square
18,339
23,329
10,747
8,727
4,045
6,897
PORTFOLIO BY LETTABLE AREA
72,084 sqm
Glenorchy Plaza
Manning Mall
Northway Plaza
Auburn Central
Tweed Mall
Gladstone Square
Note: Analysis above includes Gladstone Square
For
per
sona
l use
onl
y

Portfolio Summary
[ 21 ]
4
Type of Shopping CentreNumber of
Centres Valuation ($m) Cap RateLettable Area
(sqm) Occupancy1WALE
(Income)
Sub-Regional 4 244.3 7.2% 61,142 99.0% 4.4yrs
Neighbourhood 2 48.0 7.4% 10,942 100.0% 7.0yrs
Total 6 292.3 7.2% 72,084 99.1% 4.8yrs
Note: Analysis above includes Gladstone Square1. By Lettable Area and includes the impact of Rental Guarantees. See slide 30 for more information2. By asset value3. By lettable area4. By base rent
GEOGRAPHIC DIVERSIFICATION2
77%
16%
7%
NSW
QLD
TAS
63%4%
31%
MajorMini Major
Specialties
Other (2%)
TENANT MIX BY TYPE3
18%
8%
6%
4%61%
KEY TENANTS4
Woolworths
Coles
Target
Big W
SupaIGA(3%)
Other Specialties
The Portfolio reflects strong, risk-adjusted returns with significant NTA value upside
For
per
sona
l use
onl
y

Portfolio Revaluation
[ 22 ]
Active asset management has resulted in a strong uplift in the most recent valuation of the Portfolio
• Auburn Central, Tweed Mall and Northway Plaza were independently valued as at 30 June 2017
• The Portfolio Value1 increased by $17.6 million representing 7.2% growth2
• The Weighted Average Cap Rate1 for the Portfolio firmed by 50 basis points from 7.7% at IPO to 7.2%
Value ($m) Cap Rate
Property Centre Type State Dec-16 Jun-17 Variance Dec-16 Jun-17
Auburn Central Sub-Regional NSW 85.2 95.0 11.5% 7.2% 6.5%
Tweed Mall Sub-Regional NSW 81.3 86.5 6.5% 8.3% 7.8%
Manning Mall Sub-Regional NSW 43.0 43.0 - 7.3% 7.3%
Glenorchy Plaza Sub-Regional TAS 19.8 19.8 - 7.6% 7.6%
Northway Plaza Neighbourhood QLD 14.0 16.5 7.3% 8.5% 7.3%
Total (Jun-17) 243.2 260.8 7.2% 7.7% 7.2%
1. Excluding Gladstone Square2. This represents a 10% increase on the assets that were independently valued
For
per
sona
l use
onl
y

FY17 Financial Results
For
per
sona
l use
onl
y

Adjusted Profit and Loss1
[ 24 ]
• Statutory net profit of $11.7m for the 12 months ended 30 June 2017
• Adjusted net profit of $13.8m for the period 9 November 2016 (listing date) to 30 June 2017
• Core Earnings of $8.7m or 6.73 cents per security in line with the PDS forecast
• Distribution of 6.40 cents per security (representing 95% of Core Earnings), in line with PDS forecast
IncomeIPO to Jun-17
$’000
Rental income 17,182
Interest income 26
Net fair value decrements and transaction costs 5,559
Total income 22,767
Expenses
Rates, taxes and other outgoings 4,873
Borrowing costs 2,500
Investment management fees 1,036
Other expenses 540
Total expenses 8,949
Adjusted net profit post IPO 13,818
Reconciliation to Core Earnings
Adjusted net profit post IPO 13,818
Transaction and establishment costs 10,294
Fair value adjustments on investment properties (15,854)
Straight lining of rental income (228)
Amortisation expense 638
Core Earnings 8,668
1. Statutory net profit has been restated to reflect results post IPO from 9 November 2016 to 30 June 2017
For
per
sona
l use
onl
y

Adjusted Balance Sheet
[ 25 ]
• Net tangible asset value per security of $1.42 at 30 June 2017
• Interest bearing debt less cash of $77.3m at 30 June 2017
• Gearing ratio of 29.3% is below ERF’s target range of between 30% and 40%
Balance Sheet as at 30 June 2017 $’000
Assets
Cash 4,448
Receivables 1,208
Other current assets 2,047
Investment properties 260,750
Total assets 268,453
Liabilities
Payables 2,993
Rent received in advance 385
Interest bearing liabilities 81,740
Derivative financial instruments 480
Total liabilities 85,598
Net assets 182,855
Number of securities (‘000) 128,730
NAV per security $1.42
NTA per security $1.42
Gearing (ND / TA less cash) 29.3%
For
per
sona
l use
onl
y

-
10
20
30
40
50
FY18 FY19 FY20 FY21 FY22
Drawn Debt Maturity Profile ($m)
Debt and Capital Management
[ 26 ]
30 June 2017
Post Gladstone
Square
Facility limit ($m) 90.0 124.1
Drawn debt (net of cash) ($m) 78.1 108.9
Gearing 29.3% 36.6%
% debt fixed or hedged 90.7% 93.4%
Weighted average cost of debt 3.8% 3.9%
Average debt facility maturity (years) 2.2 2.9
Average swap / hedge maturity (years) 3.1 3.7
Interest cover ratio 6.0x n/a
• Gearing of 29.3% is below ERF’s target gearing range of between 30% and 40%
• Post-Gladstone Square acquisition, ERF’s gearing increases to 36.6%
• Debt is 90.7% hedged in line with PDS forecast
– Target range for fixed interest rate exposure of between 70% and 100% of drawn debt
– Average swap / hedge maturity increases from 3.1 years to 3.7 years post-Gladstone Square acquisition
• Weighted average cost of debt is approximately 3.8% per annum and the weighted average term to maturity of the Fund’s debt is 2.2 years (with no expiry until December 2018)
– Post-Gladstone Square, ERF’s weighted average term to maturity increases to 2.9 years
• Common Terms structure to facilitate the introduction of new lenders on individual commercial terms
• Key Covenants
– Loan-to-value ratio (LVR)1 ≤ 50%
– Interest Cover Ratio (ICR)2 ≥ 2.00x, assessed semi-annually
1. LVR is calculated as drawn debt divided by the value of the Portfolio2. ICR is calculated as net rental income from the properties in the Portfolio divided by interest expense3. Represents new debt facility for the acquisition of Gladstone Square, which settled on 31 July 2017
3For
per
sona
l use
onl
y

Outlook
For
per
sona
l use
onl
y

Outlook
[ 28 ]
Core Earnings
• ERF confirms forecast Core Earnings as disclosed in the PDS for the period ending 31 December 2017
• The annualised Distribution Yield is forecast to increase by 3% (20 basis points) to 7.8% per annum following the Gladstone Square settlement on 31 July 2017
ERF is strongly positioned to enhance value for security holders
• Active asset management of the existing portfolio generating improved operational performance and returns
• Increased capital value from implementation of strategic initiatives
For
per
sona
l use
onl
y

Appendix
For
per
sona
l use
onl
y

Detailed Assets Summary
[ 30 ]
1. By Lettable Area and includes the impact of Rental Guarantees. Occupancy excluding Rental Guarantees for the Portfolio, Tweed Mall and Northway Plaza is 97.0% (97.3% including Gladstone), 94.6% and 98.1%, respectively
2. Rental Guarantees valued at $1.17m in place for Tweed Mall and Northway Plaza to provide income on nominated vacancies until November 20183. Includes Majors, Mini-Majors, Discount Department Stores, Specialties and Other (Kiosks, ATMs, Carwashes, Offices, Roof top leases to telecommunication providers)
Property Name Centre Type StateValue($m)
Cap RateLettable Area
(sqm)Base Rent
($m)Occupancy1 WALE
(by Area)WALE
(by Base Rent)No. of
TenanciesNo. of
Tenants3
Auburn Central Sub-Regional NSW 95.0 6.5% 18,339 7.8 99.9% 5.8yrs 4.9yrs 68 70
Tweed Mall Sub-Regional NSW 86.5 7.8% 23,329 7.3 100.0%2 4.1yrs 3.8yrs 62 78
Manning Mall Sub-Regional NSW 43.0 7.3% 10,747 3.8 96.2% 3.6yrs 3.7yrs 32 38
Glenorchy Plaza Sub-Regional TAS 19.8 7.6% 8,727 1.8 97.5% 6.8yrs 6.1yrs 14 16
Northway Plaza Neighbourhood QLD 16.5 7.3% 4,045 1.4 100.0%2 4.0yrs 3.9yrs 12 13
TOTAL (Jun-17) 260.8 7.2% 65,187 22.2 99.0% 4.9yrs 4.4yrs 188 215
Gladstone Square Neighbourhood QLD 31.5 7.5% 6,897 2.8 100.0% 10.0yrs 8.6yrs 26 33
TOTAL 292.3 7.2% 72,084 25.0 99.1% 5.4yrs 4.8yrs 214 248
For
per
sona
l use
onl
y

Retail Comparable Sales Performance1
[ 31 ]
1. Limited to retailers who have traded and consistently reported sales for the 24 months ended 30 June 20172. Excludes non retailers categories of Travel Agents, Post Offices, Gyms, Medical / Veterinary and Offices3. Insufficient specialty retailer sales data4. 13.8% for Single DDS Sub-Regional Shopping Centres per Urbis / Location IQ (2016)
1
• Portfolio retailer sales stable and expected to grow
• Specialty Occupancy Costs are below benchmark4 reflecting upside potential in specialty rents
Auburn Central Tweed Mall Manning Mall Glenorchy Plaza Northway Plaza
Annual Retail Sales ($m) 83.0 114.9 66.2 17.9 23.1
Centre Sales ($ / sqm p.a) 5,922 5,842 7,194 2,470 7,618
Supermarket Sales ($ / sqm p.a) 12,516 8,664 12,405 n/a 8,149
YoY change (%) 2.9% 0.2% 0.5% n/a (1.5%)
Specialty Sales2 ($psqm / p.a) 7,835 5,567 7,116 n/a3 n/a3
YoY change (%) 1.5% (1.8%) 3.7% n/a3 n/a 3
Specialty Occupancy Cost2 12.9% 13.3% 10.0% n/a3 n/a3
For
per
sona
l use
onl
y

Disclaimer
[ 32 ]
This presentation has been prepared by Elanor Funds Management Limited As Responsible Entity For Elanor Retail Property Fund I (ARSN 615 291 220) and Elanor FundsManagement Limited As Responsible Entity For Elanor Retail Property Fund II (ARSN 615 291 284), collectively Elanor Retail Property Fund (‘ERF’ or ‘the Fund’).
This presentation contains selected summary information relating to the consolidated financial report for ERF for the year ended 30 June 2017 (“Fund’s Results”) and doesnot purport to be all-inclusive or to contain all of the information that may be relevant to any particular investor or which a prospective investor may require in evaluationsfor a possible investment in the Fund. It should be read in conjunction with the Fund’s continuous disclosure announcements lodged with the Australian Securities Exchangeincluding the Fund’s Results, which are available at www.asx.com.au. The recipient acknowledges that circumstances may change and that this presentation may becomeoutdated as a result. This presentation and the information in it are subject to change without notice and the Fund is not obliged to update this presentation.
This presentation is provided for general information purposes only. It is not a product disclosure statement, prospectus or any other disclosure document for the purposesof the Corporations Act and has not been, and is not required to be, lodged with the Australian Securities & Investments Commission. It should not be relied upon by therecipient in considering the merits of the Fund or the acquisition of securities in the Fund. Nothing in this presentation constitutes investment, legal, tax, accounting or otheradvice and it is not to be relied upon in substitution for the recipient’s own exercise of independent judgment with regard to the operations, financial condition andprospects of the Fund. The information contained in this presentation does not constitute financial product advice. Before making an investment decision, the recipientshould consider its own financial situation, objectives and needs, and conduct its own independent investigation and assessment of the contents of this presentation,including obtaining investment, legal, tax, accounting and such other advice as it considers necessary or appropriate. This presentation has been prepared without takingaccount of any person’s individual investment objectives, financial situation or particular needs. It is not an invitation or offer to buy or sell, or a solicitation to invest in orrefrain from investing in, securities in the Fund or any other investment product.
The information in this presentation has been obtained from and based on sources believed by the Fund to be reliable. To the maximum extent permitted by law, the Fundand its other affiliates and their respective directors, officers, employees, consultants and agents make no representation or warranty, express or implied, as to the accuracy,completeness, timeliness or reliability of the contents of this presentation. To the maximum extent permitted by law, no member of the Fund accepts any liability (including,without limitation, any liability arising from fault or negligence on the part of any of them) for any loss whatsoever arising from the use of this presentation or its contents orotherwise arising in connection with it.
All dollar values are in Australian dollars ($A or AUD) unless stated otherwise.
This presentation may contain forward-looking statements, guidance, forecasts, estimates , prospects, projections or statements in relation to future matters (‘ForwardStatements’). Forward Statements can generally be identified by the use of forward looking words such as “anticipate”, “estimates”, “will”, “should”, “could”, “may”,“expects”, “plans”, “forecast”, “target” or similar expressions in this presentation. Forward Statements including indications, guidance or outlook on future revenues,distributions or financial position and performance or return or growth in underlying investments are provided as a general guide only and should not be relied upon as anindication or guarantee of future performance. No independent third party has reviewed the reasonableness of any such statements or assumptions. No member of the Fundrepresents or warrants that such Forward Statements will be achieved or will prove to be correct or gives any warranty, express or implied, as to the accuracy, completeness,likelihood of achievement or reasonableness of any Forward Statement contained in this presentation. Except as required by law or regulation, the Fund assumes noobligation to release updates or revisions to Forward Statements to reflect any changes.
For
per
sona
l use
onl
y