for personal use only - asx · company’s 4q15 results capped off an impressive year‐as...
TRANSCRIPT

Quarterly ReportDecember 2015
ContactsLonestar Resources, Ltd. 11 Ventnor Ave, Ground FloorWest Perth, WA 6009+61‐8‐6355‐6888
Lonestar Resources America, Inc.600 Bailey Avenue, Suite 200Fort Worth, Texas 76107+1‐817‐546‐6400
www.lonestarresources.com
ManagementManaging Director & Chief Executive OfficerFrank D. Bracken, III
Chief Operating OfficerBarry D. Schneider
Senior Vice PresidentTom H. Olle
Vice President ‐ GeosciencesJana Payne
Chief Financial OfficerDouglas W. Banister
Company SecretaryMitchell Wells
Lonestar Resources, Ltd. (ASX:LNR, OTCQX: LNREF) is pleased to provide an update on itsfinancial and operational results for the three months ended December 31, 2015 (4Q15).
Fourth Quarter Highlights • Lonestar Resources set a new production record, reporting a 31% increase in net oil and
gas production to 7,639 BOEPD in 4Q15, vs. 5,816 BOEPD in 4Q14. Lonestar’s 4Q15 salesvolumes also represented a 15% sequential increase over 3Q15 production levels. In thefourth quarter, 72% of the Company’s production was crude oil and NGL’s. Productionwas higher than the top end of its guidance thanks to excellent performance of itsHorned Frog wells, and achieved despite deferring two well completions.
• The Company’s Eagle Ford Shale properties registered a 38% increase in net oil and gasproduction over 4Q14 results, to 7,039 BOEPD, and 18% growth sequentially.
• EBITDAX was $19.4 million for 4Q15 vs. $27.3 million for 4Q14, as increased productionvolumes and incremental revenues from crude oil hedges helped offset a 42% decrease inWest Texas Intermediate oil prices. EBITDAX dropped just 10% against 3Q15 results asproduction growth significantly offset a $4.25 per barrel drop in WTI1.
• Lonestar reported a net loss of $4.9 million for 4Q15 vs. a net Income of $25.4 million in4Q14. This is before an expected impairment charge, which the Company expects to beincluded in its audited full‐year results.
• At December 31, 2015, $87 million was outstanding on the facility on its $180 millionSenior Secured facility, currently leaving $93 million undrawn and available.
• Lonestar is making progress towards its corporate objective of moving the Company’sdomicile and public equity listing to the United States. On December 24, 2015 Lonestarsubmitted its Scheme of Arrangement with the Australian Securities & InvestmentCommission (“ASIC”) to commence a process intended to move Lonestar’s domicile tothe United States. On December 31, 2015, Lonestar filed its Form 10 with the U.S.Securities & Exchange Commission (“SEC”) with the intention of registering its equitysecurities in the U.S. Lastly, on January 8, 2016, Lonestar filed an application for listing onthe NASDAQ: NMS and reserved the ticker “LONE” for trading in the United States,which when effective, will coincide with a delisting from the Australian Stock Exchange.
1 Please see the Notes & Disclosures on page 10 and at the end of this document
For
per
sona
l use
onl
y

Page 2‐ Quarterly Report‐ December 31, 2015
Lonestar Resources, Ltd. is pleased to announce its operational and unaudited financial results for the quarter ended December 31, 2015.
OVERVIEWLonestar Resources, Ltd. (“Lonestar” or the “Company”) is listed on the Australian Securities Exchange (ASX) and the OTCQX in the UnitedStates, and is headquartered in Fort Worth, Texas. Lonestar Resources is focused on the acquisition, development and production ofunconventional resources in the United States. While optimizing cash flows from its Conventional assets, Lonestar is focusing its attention andcapital to continuing its growth strategy in the Eagle Ford Shale. Lonestar currently operates 100% of over 35,000 net acres in the Eagle Ford,and continues to expand its leasehold. Lonestar believes it is capitalized to fund the development of its existing Eagle Ford Shale drillinginventory through internal means. Lonestar is also engaged in an early‐stage project in the Bakken Petroleum System, where it has assembleda 52,559 acre leasehold (34,163 net acres) and tested light oil from the Bakken, Three Forks and Lower Lodgepole formations.
CORPORATE HIGHLIGHTSCorporateLonestar continues to make strides towards its core goal of expanding its resource base during the current downturn in commodity prices.Lonestar’s preference is to use its flexible drilling schedule and its $100 million Joint Development Agreement (“JDA”) with IOG Capital, LLC togain access to additional leasehold and reserves in proven areas via farm‐in, supplemented by primary term leases. This strategy allowsLonestar to grow its asset base without straining its liquidity, as the Company continues to endeavor to retain unused borrowing base.
Strategic
In partnership with Schlumberger, Lonestar’s last 7 operated wells have employed significant new technologies intended to improve geo‐targeting within the Eagle Ford Shale formation while using advanced thru‐bit logging to total depth coupled with fracture stimulationmodeling to assist in setting non‐geometric perforations to optimize completion efficiencies. These efforts, implemented at the Company’sHorned Frog and Beall Ranch properties, are achieving significant productivity gains over offset wells not using these technologies. Theseresults are detailed in the Operations Review on page 3 of this report. Seeking to build on this success, Lonestar has entered into an expandedtechnical partnership with Schlumberger which will employ an even larger suite of technologies and services intended to drive furtherimprovements in well performance.
2016 Spending
In the current commodity price environment, Lonestar has adopted a highly flexible capital spending plan for 2016 with a principal focus onmaintaining current debt levels and maximizing liquidity while continuing to avail the Company to new leasehold opportunities. Lonestarcurrently plans to drill and complete a total of 6 to 7 net wells (9 to 10 gross wells) at today’s NYMEX strip prices, with a focus on Dimmit,LaSalle and Gonzales Counties. This budget should result in no change in the Company’s net debt position over the course of 2016 and yieldproduction which Lonestar estimates would range from flat to an increase of up to 10% over 2015 results. Importantly, Lonestar has nocommitment wells in 2016, and may utilize funds from its $100 million JDA with IOG Capital to gain access to new farm‐in opportunities whilemaintaining its capital budget. As market conditions change, Lonestar remains flexible in its ability to modify its spending in alignment that isin the best interests of its shareholders.
Operational• Lonestar set another production record in the fourth quarter of 2015, registering sequential production growth of 15% over 3Q15 levels. The
Company’s net production for the fourth quarter of 2015 also represented a 31% increase over 4Q14 levels, rising to 7,639 BOEPD.Lonestar’s Eagle Ford Shale drilling program continues to be the driver for the Company’s record‐setting production. Fourth quarter 2015volumes were comprised of 4,011 barrels of oil per day, 1,472 barrels of NGL’s per day, and 12,937Mcf of natural gas per day. TheCompany’s 4Q15 results capped off an impressive year‐ as full‐year 2015 production averaged 6,407 BOEPD, an increase of 43% over 2014results.
• During the fourth quarter of 2015, Lonestar achieved considerable improvement in its lease operating expenses. Total Company leaseoperating expenses were $7.35 per BOE on unit of production basis, a reduction of 6% sequentially from third quarter 2015 results and areduction of 22% from the second quarter of 2015, when LOE per BOE averaged $9.43 per BOE. In a commodity price environment wheremargins are paramount, Lonestar is achieving unit‐cost reductions through a combination of increased sales volumes, industry‐widereductions in energy service costs, and a focused internal effort to optimize the Company’s chemicals program. Lonestar believes thatcontinued cost reduction efforts should further reduce LOE per BOE in the first quarter of 2016.
• Crude oil hedging continues to be an important element of Lonestar’s strategy, providing visibility to cash flow streams and associatedliquidity in the current crude oil price environment. Currently, the Company has West Texas Intermediate (WTI) swaps covering 2,276barrels of oil per day for calendar 2016 at an average strike price of $77.15 per barrel. For 2017, The Company has three‐way collars covering1,000 bopd, which provide an effective floor of $55.25 per barrel with WTI prices between $40.00 per barrel and $60.00 per barrel but alsogives upside to $80.25 per barrel. At December 31, 2015, the mark‐to‐market value of Lonestar’s hedge portfolio was $32.6 million, and atJanuary 31, 2016, the mark‐to‐market value of the portfolio is estimated at $32.8 million.
Management’s Discussion and Analysis
For
per
sona
l use
onl
y

Operations Review
EAGLE FORD SHALE TREND‐WESTERN REGION• Asherton‐ In central Dimmit County, no new wells were completed during the quarter. However, production rates from the 4
producing wells continued to outperform the third‐party engineering projections. The Asherton leasehold is Held by Production, andLonestar does not plan drilling activity here in 2016.
• Beall Ranch‐ In Dimmit County, Lonestar continues to benefit from refined geo‐steering targets and engineered completions. Through196 days of production, Lonestar’s #26H‐#28H have cumulatively produced an average per well of 44,810 barrels of oil from an average2,990‐foot perforated intervals, or 14,003 bbls per 1,000 feet. These results are 42% better than the directly offsetting #32H‐#34H wells ,which were treated with a similar amount of proppant. Building on this success, Lonestar began drilling the Beall Ranch #20H‐22H wellsduring the fourth quarter of 2015. As of this report, Lonestar has drilled and cased the Beall Ranch #22H & #23H. The #22H was drilled toa total depth of 13,450 feet in 11 days while the #21H was drilled to a total depth of 14,600 feet in 10 days. The #20H is currently beingdrilled with a projected total depth of 15,900 feet. Lonestar has a 97.7% working interest in these wells which will have an averageperforated interval of 6,150 feet and an average AFE of $4.4 million.
• Burns Ranch Area‐ In northern La Salle County, Lonestar successfully executed a primary term lease on an additional 440 gross/220 netacres on the Burns Ranch. Since its initial entry into the area as part of its acquisition of properties from Clayton Williams Energy, Inc.,Lonestar has increased its leasehold position in the Greater Burns Ranch Area from 1,280 gross / 800 net acres in January, 2013 to itscurrent position of 3,857 gross / 3,125 net acres at December 31, 2015. Importantly, this acreage is configured in a manner that allowsLonestar to drill 8,000‐foot laterals, which it believes are necessary to achieve attractive internal rates of return in the current priceenvironment. Lonestar is pleased with the results of its initial 8,000’ laterals it drilled on the Burns Ranch in 2015, and has permitted 3additional wells on this property in 2016.
• Horned Frog‐ In La Salle County, Lonestar drilled and completed the Horned Frog A #1H & B #1H with an average perforated interval of8,233 feet. After registering impressive Max‐30 day production rates of 1,438 BOEPD and 1,315 BOEPD, respectively, the Horned FrogA#1H and B#1H continue to perform well. The Horned Frog A#1H has produced a total of 142,896 BOE in its first 4 months of productionand the Horned Frog B#1H has produced a total of 134,307 BOE in the same period. To date, these wells rank as the top two performersamong 107 offset wells. Further, these wells have outperformed the 107 well average by 85% on a per‐foot basis. In the fourth quarter of2015, Lonestar drilled and completed the Horned Frog D#1H & E #1H to an average total measured depth of 18,300 feet. The Horned FrogD #1H tested 369 bopd and 4,447 Mcfgpd, or 1,395 BOEPD on a processed three‐stream basis on a 21/64” choke and averaged 1,242BOEPD over its Max‐30. The Horned Frog E #1H, which had a perforated interval of 5,553 feet, tested 344 bopd and 3,815 Mcfgpd, or1,218 BOEPD on a processed three‐stream basis on a 20/64” choke, and averaged 1,050 BOEPD. The D and E wells produced a higherpercentage of oil when compared to the A and B wells, and may ultimately yield better returns. Lonestar utilized the IOG Capital JointVenture. Accordingly, Lonestar is paying 10% of the well costs and will have an initial 15.0% working interest in these wells. Uponachievement of a specified IRR, Lonestar’s working interest would increase to 57.5%.
EAGLE FORD SHALE TREND‐ CENTRAL REGION• Pirate Area‐ In southwest Wilson County, Lonestar has drilled the Pirate #M1H and Pirate #N1H wells and cased them to an average
measured depth of approximately 16,100 feet. Lonestar has a 100% working interest and an average 76.4% net revenue interest in thesetwo wells. These wells are being held in inventory awaiting fracture stimulation. Lonestar will continue to weigh allocating capital tocompletion of these wells versus other projects in the Company which compete for capital.
• Southern Gonzales County‐ In Gonzales County, Lonestar’s Harvey Johnson #1H‐#6H continue to perform well, with production fromthe six wells averaging 1,582 gross / 593 net BOEPD in the fourth quarter of 2015. Lonestar’s success at Harvey Johnson in accessingEagle Ford Shale acreage which has been Held By Production by Austin Chalk wells has prompted additional efforts to expand theCompany’s drilling inventory. In the current oil price environment, Austin Chalk wells are increasingly uneconomic and incapable ofholding Eagle Ford Shale rights, and Lonestar is seeking to take advantage of this trend by accessing additional acreage either via farm‐in or low‐cost lease acquisition. To date, Lonestar has leased a total of 1,130 net acres which will accommodate 10 gross laterals withaverage lateral lengths of 7,200 feet and has top‐leased an additional 1,726 net acres associated with marginally economic Austin Chalkunits. If executed, Lonestar’s total leasehold of 2,856 net acres would accommodate a total of 31 gross laterals with an average laterallength of 7,000 feet. Lonestar estimates that remaining potential leasehold expenditures are less than $1.9 million.
EAGLE FORD SHALE TREND‐ EASTERN REGION• Brazos & Robertson Counties – In Central Brazos County, Lonestar has permitted two 8,000‐foot laterals with the Texas Railroad
Commission and is currently finalizing its operations permits with the City of College Station. Lonestar anticipates approval of thesepermits within the next 30 days. The Company is encouraged by the results of offset drilling by a leading operator, who recentlyannounced impressive 30‐day production rates on four wells immediately offsetting Lonestar’s leasehold, which have ranged from 1,587to 1,973 BOE per day.
Page 3‐ Quarterly Report‐ December, 2015
For
per
sona
l use
onl
y

Page 4‐ Quarterly Report‐ December 31, 2015
Management’s Discussion and Analysis
Net Production (after royalties)
Lonestar established a new company production record in the fourth quarter of 2015, with volumes averaging 7,639 BOE per day(BOEPD), representing a 31% increase over year‐ago results and a 15% increase sequentially over 3Q15 results. Fourth quarter 2015volumes were comprised of 4,011 barrels of oil per day, 1,472 barrels of NGL’s per day, and 12,937 Mcf of natural gas per day, with 72% ofthe Company’s sales volumes derived from liquids, and 53% of total volumes coming from crude oil. Lonestar’s drilling program, whichhas generated excellent results across its portfolio, is responsible for the Company’s continued growth in production.
• Fourth quarter 2015 Eagle Ford Shale volumes represented an increase of 38% compared to the fourth quarter of 2014 and a 18%sequential increase over third quarter 2015 volumes. Lonestar’s net production from its Eagle Ford Shale assets averaged a record7,039 BOEPD during the fourth quarter of 2015, and was comprised of 3,660 barrels of oil per day, 1,460 barrels of NGL’s per day, and11,513 Mcf of natural gas per day. For the quarter, 73% of the Company’s Eagle Ford production was derived from liquidhydrocarbons, 52% of which was derived from crude oil.
• Lonestar’s net production from its Conventional assets averaged 600 BOEPD during the fourth quarter of 2015, and was comprisedof 351 barrels of oil per day, 12 barrels of NGL’s per day, and 1,425 Mcf of natural gas per day. 60% of the Company’s Conventionalproduction was from liquid hydrocarbons. Fourth quarter volumes represented a decrease of 17% compared to the fourth quarter of2014 due to: 1) decreased natural gas sales in West Texas caused by a plant interruption equating to approximately 200 Mcf per day,2) natural declines and 3) Lonestar is not conducting drilling operations on its Conventional assets, limiting capital to workover andwell optimizations.
All figures are unaudited. All figures are in US dollars unless noted otherwise
2015 2014 % Change 2015 2014 % ChangeWestern Eagle Ford ShaleCrude Oi l (bbls/day) 2,456 1,948 26% 2,384 1,817 31%Natura l Gas Liquids (bbls/day) 1,392 450 209% 795 399 99%Natura l Gas (Mcf/day) 11,146 3,632 207% 5,873 3,149 87%Oil Equivalent (BOE/day) 5,706 3,003 90% 4,157 2,741 52%
Central Eagle Ford ShaleCrude Oi l (bbls/day) 854 949 ‐10% 943 623 51%Natura l Gas Liquids (bbls/day) 46 1 5127% 35 0 8311%Natura l Gas (Mcf/day) 263 4 7099% 175 2 8828%Oil Equivalent (BOE/day) 943 950 ‐1% 1,007 624 62%
Eastern Eagle Ford ShaleCrude Oi l (bbls/day) 350 1,030 ‐66% 516 393 32%Natura l Gas Liquids (bbls/day) 22 61 ‐64% 33 24 41%Natura l Gas (Mcf/day) 104 272 ‐62% 176 126 40%Oil Equivalent (BOE/day) 390 1,135 ‐66% 579 437 32%
Total Eagle Ford ShaleCrude Oi l (bbls/day) 3,660 3,926 ‐7% 3,843 2,832 36%Natura l Gas Liquids (bbls/day) 1,460 511 185% 864 424 104%Natura l Gas (Mcf/day) 11,513 3,907 195% 6,224 3,277 90%Oil Equivalent (BOE/day) 7,039 5,089 38% 5,744 3,802 51%
ConventionalCrude Oi l (bbls/day) 351 385 ‐9% 373 434 ‐14%Natura l Gas Liquids (bbls/day) 12 27 ‐56% 13 13 3%Natura l Gas (Mcf/day) 1,425 1,889 ‐25% 1,662 1,387 20%Oil Equivalent (BOE/day) 600 727 ‐17% 664 679 ‐2%
Total CompanyCrude Oi l (bbls/day) 4,011 4,312 ‐7% 4,216 3,267 29%Natura l Gas Liquids (bbls/day) 1,472 538 173% 877 436 101%Natura l Gas (Mcf/day) 12,937 5,796 123% 7,887 4,664 69%Oil Equivalent (BOE/day) 7,639 5,816 31% 6,407 4,480 43%
Twelve months endedDecember 31,
Three months endedDecember 31,
For
per
sona
l use
onl
y

Page 5‐ Quarterly Report‐ December 31, 2015
Management’s Discussion and AnalysisWellhead Commodity Price Realizations
Lonestar’s average wellhead commodity price realization for 4Q15 was $26.03 per BOE, which was 55% lower than the $57.89 per BOEaverage price realized in the fourth quarter of 2014. Reported wellhead realizations were driven lower by large declines in both thecrude oil and natural gas benchmarks. Year‐over‐year, West Texas Intermediate fell 42%, or $30.97 per barrel to $42.18 per barrelwhile Henry Hub natural gas prices were 44% lower, falling $1.67 per Mcf to $2.11 per Mcf in the current quarter. While benchmarkprices fell sharply, Lonestar’s revenues were bolstered by its crude oil hedge positions, which added $25.40 per barrel to its crude oilrealizations of $64.06 per barrel.
• On its Eagle Ford Shale assets, Lonestar recorded energy equivalent wellhead price realization of $25.81 per BOE during 4Q15, a56% decrease compared to 4Q14. Reduced West Texas Intermediate and Henry Hub pricing was primarily responsible for thereduction in realizations.
• On its Conventional assets, Lonestar recorded an average wellhead price realization of $28.62 per BOE during 4Q15, down 43%versus 4Q14. Reduced West Texas Intermediate and Henry Hub pricing was primarily responsible for the reduction in realizations.
All figures are unaudited. All figures are in US dollars unless noted otherwise
2015 2014 % Change 2015 2014 % ChangeWestern Eagle Ford ShaleCrude Oi l ($/bbl ) $38.52 $70.48 ‐45% $45.75 $89.64 ‐49%Natural Gas Liquids ($/bbl ) $11.63 $21.83 ‐47% $12.37 $29.32 ‐58%Natural Gas ($/Mcf) $1.99 $3.71 ‐46% $2.30 $4.09 ‐44%Western Eagle Ford Shale ($/BOE) $23.30 $53.47 ‐56% $31.84 $68.38 ‐53%
Central Eagle Ford ShaleCrude Oi l ($/bbl ) $38.80 $67.22 ‐42% $45.80 $85.46 ‐46%Natural Gas Liquids ($/bbl ) $17.60 $23.36 ‐25% $18.46 $24.17 ‐24%Natural Gas ($/Mcf) $2.19 $3.44 ‐36% $2.63 $3.73 ‐29%Central Eagle Ford Shale ($/BOE) $36.58 $67.14 ‐46% $43.97 $85.39 ‐49%
Eastern Eagle Ford ShaleCrude Oi l ($/bbl ) $39.23 $71.57 ‐45% $47.20 $79.70 ‐41%Natural Gas Liquids ($/bbl ) $10.88 $20.68 ‐47% $10.96 $25.03 ‐56%Natural Gas ($/Mcf) $2.13 $2.54 ‐16% $2.07 $2.70 ‐23%Eastern Eagle Ford Shale ($/BOE) $36.45 $66.61 ‐45% $43.35 $73.70 ‐41%
Total Eagle Ford ShaleCrude Oi l ($/bbl ) $38.65 $69.98 ‐45% $45.96 $87.34 ‐47%Natural Gas Liquids ($/bbl ) $11.81 $21.69 ‐46% $12.56 $29.08 ‐57%Natural Gas ($/Mcf) $1.99 $3.63 ‐45% $2.30 $4.04 ‐43%Total Eagle Ford Shale ($/BOE) $25.81 $58.95 ‐56% $35.13 $71.78 ‐51%
ConventionalCrude Oi l ($/bbl ) $38.75 $70.85 ‐45% $45.61 $87.89 ‐48%Natural Gas Liquids ($/bbl ) $16.52 $30.66 ‐46% $18.87 $35.06 ‐46%Natural Gas ($/Mcf) $2.38 $4.52 ‐47% $2.71 $5.59 ‐52%
Conventional ($/BOE) $28.62 $50.42 ‐43% $32.82 $68.37 ‐52%
Total Company WellheadCrude Oi l ($/bbl ) $38.66 $70.05 ‐45% $45.93 $87.41 ‐47%Natural Gas Liquids ($/bbl ) $11.84 $22.14 ‐47% $12.66 $29.26 ‐57%Natural Gas ($/Mcf) $2.04 $3.92 ‐48% $2.39 $4.50 ‐47%Total Company Wellhead ($/BOE) $26.03 $57.89 ‐55% $34.89 $71.27 ‐51%
Total Company Hedging RevenuesCrude Oi l ($/bbl ) $25.40 $11.31 125% $23.61 $1.02 2214%Hedging Revenues ($/BOE) $13.34 $8.38 59% $15.54 $0.74 1989%
Total Company Net Oil & Gas RevenuesCrude Oi l ($/bbl ) $64.06 $81.36 ‐21% $69.54 $88.44 ‐21%Natural Gas Liquids ($/bbl ) $11.84 $22.14 ‐47% $12.66 $29.26 ‐57%Natural Gas ($/Mcf) $2.04 $3.92 ‐48% $2.39 $4.50 ‐47%Net Oil & Gas Revenues ($/BOE) $39.37 $66.27 ‐41% $50.43 $72.01 ‐30%
Three months endedDecember 31,
Twelve months endedDecember 31,
For
per
sona
l use
onl
y
Page 6‐ Quarterly Report‐ December 31, 2015
Management’s Discussion and AnalysisWellhead Oil & Gas Revenues
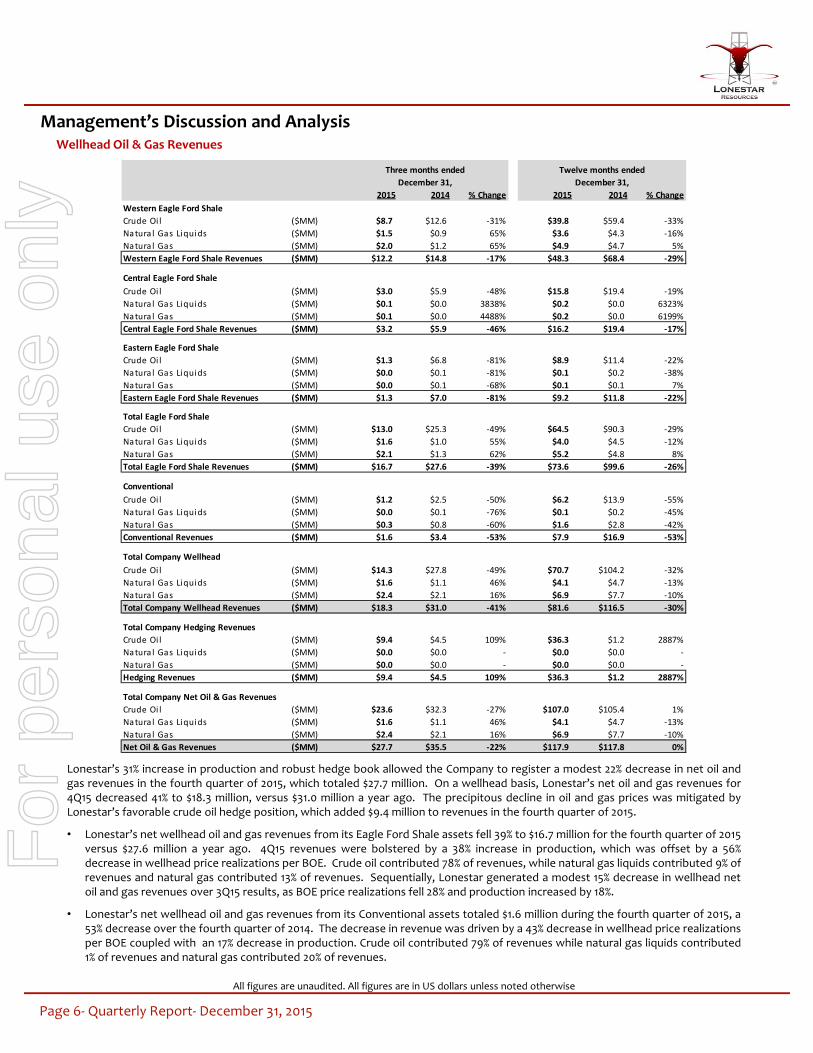
Lonestar’s 31% increase in production and robust hedge book allowed the Company to register a modest 22% decrease in net oil andgas revenues in the fourth quarter of 2015, which totaled $27.7 million. On a wellhead basis, Lonestar’s net oil and gas revenues for4Q15 decreased 41% to $18.3 million, versus $31.0 million a year ago. The precipitous decline in oil and gas prices was mitigated byLonestar’s favorable crude oil hedge position, which added $9.4 million to revenues in the fourth quarter of 2015.
• Lonestar’s net wellhead oil and gas revenues from its Eagle Ford Shale assets fell 39% to $16.7 million for the fourth quarter of 2015versus $27.6 million a year ago. 4Q15 revenues were bolstered by a 38% increase in production, which was offset by a 56%decrease in wellhead price realizations per BOE. Crude oil contributed 78% of revenues, while natural gas liquids contributed 9% ofrevenues and natural gas contributed 13% of revenues. Sequentially, Lonestar generated a modest 15% decrease in wellhead netoil and gas revenues over 3Q15 results, as BOE price realizations fell 28% and production increased by 18%.
• Lonestar’s net wellhead oil and gas revenues from its Conventional assets totaled $1.6 million during the fourth quarter of 2015, a53% decrease over the fourth quarter of 2014. The decrease in revenue was driven by a 43% decrease in wellhead price realizationsper BOE coupled with an 17% decrease in production. Crude oil contributed 79% of revenues while natural gas liquids contributed1% of revenues and natural gas contributed 20% of revenues.
All figures are unaudited. All figures are in US dollars unless noted otherwise
2015 2014 % Change 2015 2014 % ChangeWestern Eagle Ford ShaleCrude Oi l ($MM) $8.7 $12.6 ‐31% $39.8 $59.4 ‐33%Natura l Gas Liquids ($MM) $1.5 $0.9 65% $3.6 $4.3 ‐16%Natura l Gas ($MM) $2.0 $1.2 65% $4.9 $4.7 5%Western Eagle Ford Shale Revenues ($MM) $12.2 $14.8 ‐17% $48.3 $68.4 ‐29%
Central Eagle Ford ShaleCrude Oi l ($MM) $3.0 $5.9 ‐48% $15.8 $19.4 ‐19%Natura l Gas Liquids ($MM) $0.1 $0.0 3838% $0.2 $0.0 6323%Natura l Gas ($MM) $0.1 $0.0 4488% $0.2 $0.0 6199%Central Eagle Ford Shale Revenues ($MM) $3.2 $5.9 ‐46% $16.2 $19.4 ‐17%
Eastern Eagle Ford ShaleCrude Oi l ($MM) $1.3 $6.8 ‐81% $8.9 $11.4 ‐22%Natura l Gas Liquids ($MM) $0.0 $0.1 ‐81% $0.1 $0.2 ‐38%Natura l Gas ($MM) $0.0 $0.1 ‐68% $0.1 $0.1 7%Eastern Eagle Ford Shale Revenues ($MM) $1.3 $7.0 ‐81% $9.2 $11.8 ‐22%
Total Eagle Ford ShaleCrude Oi l ($MM) $13.0 $25.3 ‐49% $64.5 $90.3 ‐29%Natura l Gas Liquids ($MM) $1.6 $1.0 55% $4.0 $4.5 ‐12%Natura l Gas ($MM) $2.1 $1.3 62% $5.2 $4.8 8%Total Eagle Ford Shale Revenues ($MM) $16.7 $27.6 ‐39% $73.6 $99.6 ‐26%
ConventionalCrude Oi l ($MM) $1.2 $2.5 ‐50% $6.2 $13.9 ‐55%Natura l Gas Liquids ($MM) $0.0 $0.1 ‐76% $0.1 $0.2 ‐45%Natura l Gas ($MM) $0.3 $0.8 ‐60% $1.6 $2.8 ‐42%Conventional Revenues ($MM) $1.6 $3.4 ‐53% $7.9 $16.9 ‐53%
Total Company WellheadCrude Oi l ($MM) $14.3 $27.8 ‐49% $70.7 $104.2 ‐32%Natura l Gas Liquids ($MM) $1.6 $1.1 46% $4.1 $4.7 ‐13%Natura l Gas ($MM) $2.4 $2.1 16% $6.9 $7.7 ‐10%Total Company Wellhead Revenues ($MM) $18.3 $31.0 ‐41% $81.6 $116.5 ‐30%
Total Company Hedging RevenuesCrude Oi l ($MM) $9.4 $4.5 109% $36.3 $1.2 2887%Natura l Gas Liquids ($MM) $0.0 $0.0 ‐ $0.0 $0.0 ‐Natura l Gas ($MM) $0.0 $0.0 ‐ $0.0 $0.0 ‐Hedging Revenues ($MM) $9.4 $4.5 109% $36.3 $1.2 2887%
Total Company Net Oil & Gas RevenuesCrude Oi l ($MM) $23.6 $32.3 ‐27% $107.0 $105.4 1%Natura l Gas Liquids ($MM) $1.6 $1.1 46% $4.1 $4.7 ‐13%Natura l Gas ($MM) $2.4 $2.1 16% $6.9 $7.7 ‐10%Net Oil & Gas Revenues ($MM) $27.7 $35.5 ‐22% $117.9 $117.8 0%
Three months endedDecember 31,
Twelve months endedDecember 31,
For
per
sona
l use
onl
y

Page 7‐ Quarterly Report‐ December 31, 2015
Management’s Discussion and Analysis
Field Operating Expenses
Lonestar’s field operating expenses (lease operating expenses plus production taxes) for the fourth quarter of 2015 were $5.9 million,an increase of only 4% over 4Q14 field operating expenses of $5.7 million, despite a 31% increase in oil and gas production. Combinedwith increased volumes, the Company reduced total field operating expenses by 21% on a unit of production basis from 4Q14 to $8.45per BOE. Lonestar’s 4Q15 results also represented a 3% sequential reduction in field operating expenses. Lease Operating Expense(“LOE”) was $5.2 million for 4Q15, and increased 30% above 4Q14 levels on an absolute dollar basis, but remained flat on a BOE basisat $7.35 per BOE. Production taxes were $0.8 million for the fourth quarter of 2015, a 56% decrease over comparable levels in 2014,and a 67% decrease to $1.11 per BOE. Reduced production taxes were primarily due to realized reductions to Ad Valorem taxes versusestimates utilized for accrual purposes in previous quarters.
• Lonestar’s field operating expenses from its Eagle Ford Shale assets totaled $5.0 million during the fourth quarter of 2015, a 10%increase over the fourth quarter of 2014. However, on a unit of production basis, field operating expenses decreased 20% to $7.65per BOE, year‐over‐year. Direct lease operating expenses totaled $4.3 million in 4Q15, or $6.68 per BOE, a modest increase of 3%on a per unit basis. Production taxes were $0.6 million, or $0.96 per BOE, compared to $1.5 million, or $3.12 per BOE in the year‐ago quarter. More importantly, Lonestar was successful in sequentially decreasing Eagle Ford Shale lease operating expenses by6% on a per‐BOE unit basis. Reduced production taxes were primarily due to realized reductions to Ad Valorem taxes versusestimates utilized for accrual purposes in previous quarters.
• Lonestar’s field operating expenses from its Conventional assets totaled $1.0 million during the fourth quarter of 2015, a 21%decrease versus the fourth quarter of 2014. On a unit of production basis, field operating expenses decreased 4% to $17.90 perBOE. In total, LOE was $0.8 million, or $15.13 per BOE, compared to $0.9 million, or $13.90 per BOE in 4Q14. Sequential, Lonestarwas able to achieve reductions in LOE on an absolute‐dollar basis by 2%. Production taxes were $0.2 million, or $2.77 per BOE,compared to $0.3 million, or $4.72 per BOE in the quarter a year ago.
All figures are unaudited. All figures are in US dollars unless noted otherwise
2015 2014 % Change 2015 2014 % ChangeWestern Eagle Ford ShaleLease Operating Expense ($/BOE) $6.37 $7.42 ‐14% $7.25 $8.26 ‐12%Production Taxes ($/BOE) $1.15 $3.13 ‐63% $1.88 $4.07 ‐54%Western Eagle Ford Shale ($/BOE) $7.52 $10.55 ‐29% $9.13 $12.33 ‐26%
Central Eagle Ford ShaleLease Operating Expense ($/BOE) $8.15 $7.71 6% $7.29 $9.59 ‐24%Production Taxes ($/BOE) $0.08 $2.73 ‐97% $2.61 $4.47 ‐42%Central Eagle Ford Shale ($/BOE) $8.23 $10.44 ‐21% $9.91 $14.06 ‐30%
Eastern Eagle Ford ShaleLease Operating Expense ($/BOE) $7.77 $2.91 167% $6.96 $4.85 43%Production Taxes ($/BOE) $0.36 $3.42 ‐89% $2.45 $4.36 ‐44%Eastern Eagle Ford Shale ($/BOE) $8.14 $6.33 29% $9.41 $9.21 2%
Total Eagle Ford ShaleLease Operating Expense ($/BOE) $6.68 $6.47 3% $7.23 $8.08 ‐11%Production Taxes ($/BOE) $0.96 $3.12 ‐69% $2.07 $4.17 ‐50%Total Eagle Ford Shale ($/BOE) $7.65 $9.59 ‐20% $9.30 $12.25 ‐24%
ConventionalLease Operating Expense ($/BOE) $15.13 $13.90 9% $14.61 $18.12 ‐19%Production Taxes ($/BOE) $2.77 $4.72 ‐41% $2.64 $5.41 ‐51%Conventional ($/BOE) $17.90 $18.61 ‐4% $17.25 $23.54 ‐27%
Total CompanyLease Operating Expense ($/BOE) $7.35 $7.40 ‐1% $7.99 $9.60 ‐17%Production Taxes ($/BOE) $1.11 $3.32 ‐67% $2.13 $4.36 ‐51%Total Company ($/BOE) $8.45 $10.72 ‐21% $10.12 $13.96 ‐28%
Twelve months endedDecember 31,
Three months endedDecember 31,
For
per
sona
l use
onl
y

Lonestar’s field netback for the fourth quarter of 2015 was $12.4 million, a decrease of 51% over the field netback of $25.2 million in 4Q14.Despite strong volume growth and meaningful field‐level cost reductions, field netbacks declined 63% to $17.58 per BOE in the fourthquarter of 2015 vs. $47.17 in the fourth quarter of 2014. The decrease in the per BOE field netback is entirely driven by a 42% decrease inWTI pricing and a 44% decrease in Henry Hub natural gas pricing compared to 4Q14, and in spite of a 21% reduction in the Company’s unitoperating costs.
• Lonestar’s Eagle Ford Shale field netback was $11.8 million and $18.16 per BOE in 4Q15. Year‐over‐year, Lonestar’s Eagle Ford Shalefield netback represented a 49% decrease in the field netback compared to the $23.1 million reported in the fourth quarter of 2014. Ona BOE basis, field netbacks declined 63% to $18.16 in fourth quarter of 2015 vs. $49.37 in 4Q14, caused by a 42% reduction in WTI and a44% reduction in Henry Hub and in spite of a 20% reduction in the Eagle Ford’s unit operating costs.
• Lonestar’s Conventional field netback was $0.6 million and $10.72 per BOE in 4Q15. Year‐over‐year, Lonestar’s field netback from itsConventional assets represented a 72% compared to the $2.1 million reported in the fourth quarter of 2014. On a BOE basis, fieldnetbacks declined 66% largely due to a 42% reduction in crude oil prices and a 44% reduction in Henry Hub natural gas pricing in spiteof a 4% reduction in Conventional unit operating costs.
Management’s Discussion and AnalysisField Netbacks
Page 8‐Quarterly Report‐ December 31, 2015
All figures are unaudited. All figures are in US dollars unless noted otherwise
2015 2014 % Change 2015 2014 % ChangeWestern Eagle Ford Shale
Production Revenue ($/BOE) $23.30 $53.47 ‐56% $31.84 $68.38 ‐53%Lease Operating Expenses ($/BOE) $6.37 $7.42 ‐14% $7.25 $8.26 ‐12%Production Taxes ($/BOE) $1.15 $3.13 ‐63% $1.88 $4.07 ‐54%
Field Netback ($/BOE) $15.79 $42.92 ‐63% $22.71 $56.06 ‐59%Field Netback ($MM) $8.3 $11.9 ‐30% $34.5 $56.1 ‐39%
Central Eagle Ford ShaleProduction Revenue ($/BOE) $36.58 $67.14 ‐46% $43.97 $85.39 ‐49%Lease Operating Expenses ($/BOE) $8.15 $7.71 6% $7.29 $9.59 ‐24%Production Taxes ($/BOE) $0.08 $2.73 ‐97% $2.61 $4.47 ‐42%
Field Netback ($/BOE) $28.35 $56.70 ‐50% $34.06 $71.33 ‐52%Field Netback ($MM) $2.5 $5.0 ‐50% $12.5 $16.2 ‐23%
Eastern Eagle Ford ShaleProduction Revenue ($/BOE) $36.45 $66.61 ‐45% $43.35 $73.70 ‐41%Lease Operating Expenses ($/BOE) $7.77 $2.91 167% $6.96 $4.85 43%Production Taxes ($/BOE) $0.36 $3.42 ‐89% $2.45 $4.36 ‐44%
Field Netback ($/BOE) $28.32 $60.28 ‐53% $33.93 $64.49 ‐47%Field Netback ($MM) $1.0 $6.3 ‐84% $7.2 $10.3 ‐30%
Total Eagle Ford ShaleProduction Revenue ($/BOE) $25.81 $58.95 ‐56% $35.13 $71.78 ‐51%Lease Operating Expenses ($/BOE) $6.68 $6.47 3% $7.23 $8.08 ‐11%Production Taxes ($/BOE) $0.96 $3.12 ‐69% $2.07 $4.17 ‐50%
Field Netback ($/BOE) $18.16 $49.37 ‐63% $25.83 $59.53 ‐57%Field Netback ($MM) $11.8 $23.1 ‐49% $54.2 $82.6 ‐34%
ConventionalProduction Revenue ($/BOE) $28.62 $50.42 ‐43% $32.82 $68.37 ‐52%Lease Operating Expenses ($/BOE) $15.13 $13.90 9% $14.61 $18.12 ‐19%Production Taxes ($/BOE) $2.77 $4.72 ‐41% $2.64 $5.41 ‐51%
Field Netback ($/BOE) $10.72 $31.81 ‐66% $15.56 $44.84 ‐65%Field Netback ($MM) $0.6 $2.1 ‐72% $3.8 $11.1 ‐66%
Total CompanyProduction Revenue ($/BOE) $26.03 $57.89 ‐55% $34.89 $71.27 ‐51%Lease Operating Expenses ($/BOE) $7.35 $7.40 ‐1% $7.99 $9.60 ‐17%Production Taxes ($/BOE) $1.11 $3.32 ‐67% $2.13 $4.36 ‐51%
Field Netback ($/BOE) $17.58 $47.17 ‐63% $24.77 $57.31 ‐57%Field Netback ($MM) $12.4 $25.2 ‐51% $57.9 $93.7 ‐38%
Three months endedDecember 31,
Twelve months endedDecember 31,
For
per
sona
l use
onl
y

Page 9‐ Quarterly Report‐ December 31, 2015
Management’s Discussion and Analysis
Depreciation and Depletion
Depletion is calculated using the units of production method, which involves dividing the carrying value of the assets by theestimated Proved reserves and applying this depletion rate to the production reported during the period. Depreciation of propertyplant and equipment is calculated on a declining basis so as to write down the net cost of each asset over its useful life, which rangesfrom 5 to 25 years.
Lonestar’s Depreciation and Depletion expense for the fourth quarter of 2015 was $14.8 million, or $21.09 per BOE compared to $14.2million, or $26.46 per BOE reported in the fourth quarter of 2014. This increase in D,D&A in absolute dollar terms is due to a 31%increase in production compared to 4Q14 levels, while Depreciation and Amortization declined significantly on a unit of productionbasis.
General and Administrative Expenses
Lonestar reported General & Administrative expenses of $2.3 million for the fourth quarter of 2015, a 3% decrease from the $2.4million of General & Administrative expenses reported in the fourth quarter of 2014. Excluded from the fourth quarter were G&Aexpenses of $1.0 million associated with legal and audit expenses associated with Lonestar’s efforts to re‐domicile to the UnitedStates, and list on the NASDAQ. On a sequential basis, fourth quarter 2015 General & Administrative expenses decreased 4% inabsolute dollar terms when compared to the third quarter of 2015. Lonestar is achieving significant scale with respect to overhead‐excluding the aforementioned costs associated with its efforts to re‐domicile to the U.S. The Company achieved a 26% decrease inG&A per BOE to $3.27 per BOE, compared to $4.44 per BOE reported in the fourth quarter of 2014.
Finance Expenses
Lonestar reported Finance expenses of $6.1 million for the fourth quarter of 2015, a 7% increase over the $5.7 million of Financeexpenses reported in the fourth quarter of 2014. On a BOE basis, the Company reported Finance expenses of $8.67 per BOE, a 19%decrease compared to $10.67 per BOE reported in the fourth quarter of 2014. Interest Expense grew a modest 6% in the fourthquarter of 2015. The Company’s borrowings from its senior unsecured notes were $220.0 million during the quarter with interestexpense averaging 8.75% on an annualized rate during the quarter.
All figures are unaudited. All figures are in US dollars unless noted otherwise
2015 2014 % Change 2015 2014 % ChangeTota l Expense ($MM) $14.8 $14.2 5% $54.0 $40.9 32%Depreciation & Depletion ($/BOE) $21.09 $26.46 ‐20% $23.08 $25.02 ‐8%
Three months endedDecember 31,
Twelve months endedDecember 31,
2015 2014 % Change 2015 2014 % ChangeTota l Expense ($MM) $2.3 $2.4 ‐3% $9.3 $8.4 11%Genera l & Adminis trative ($/BOE) $3.27 $4.44 ‐26% $4.00 $5.15 ‐22%
Three months endedDecember 31,
Twelve months endedDecember 31,
2015 2014 % Change 2015 2014 % ChangeInterest Expense ($MM) $5.5 $5.2 6% $21.8 $17.8 22%Amortization of Finance Costs ($MM) $0.6 $0.5 12% $2.8 $2.2 31%Total Finance Costs ($MM) $6.1 $5.7 7% $24.6 $19.9 23%Finance Costs ($/BOE) $8.67 $10.67 ‐19% $10.51 $12.20 ‐14%
Three months ended Twelve months endedDecember 31,December 31,
For
per
sona
l use
onl
y

Page 10‐ Quarterly Report‐ December 31, 2015
Management’s Discussion and AnalysisHedging Revenues (Expenses)
• Lonestar recorded crude oil hedge revenues of $9.4 million in the fourth quarter of 2015 vs. a crude oil hedge expense of $4.5 millionreported in the fourth quarter of 2014. As of December 31, 2015 the Mark to Market value of Lonestar’s remaining hedge contractstotaled $32.6 million.
Derivative Commodity Contracts
Lonestar uses the commodity derivatives market as a tool to manage commodity price risk, create higher certainty of returns on capitalexpenditures, and maximize its borrowings available under its Credit Facilities. As the Company places new wells into production, it hashistorically entered into additional derivatives transactions to further insulate the Company from the risks associated with the oil andgas business, and to lock in attractive returns, a policy that Lonestar expects to continue.
As has been its practice since inception, crude oil hedging has been a key element to providing visibility to its cash flow streams andassociated liquidity in the current crude oil price environment. In an effort to provide additional long‐term visibility to its cash flowstreams in the current crude oil price environment, Lonestar has recently increased its crude oil hedge position. Giving effect for thesenew hedges, the Company has increased its positions, and currently stand at:
• 2016‐ Lonestar has West Texas Intermediate swaps that total to 2,276 barrels of oil per day for 2016 at an average strike price of$77.15 per barrel.
• 2017‐ Lonestar’s 2017 oil hedge position consists of a 3‐Way West Texas Intermediate Collar covering 1,000 barrels per day forcalendar 2017, comprising of a $60.00/$40.00 put spread against an $85.00 call.
All figures are unaudited. All figures are in US dollars unless noted otherwise
2015 2014 % Change 2015 2014 % ChangeCrude Oil ($MM) $9.4 $4.5 109% $36.3 $1.2 2887%Natura l Gas Liquids ($MM) $0.0 $0.0 ‐ $0.0 $0.0 ‐Natura l Gas ($MM) $0.0 $0.0 ‐ $0.0 $0.0 ‐Hedging Revenues (Expenses) ($MM) $9.4 $4.5 109% $36.3 $1.2 2887%Hedging Revenues (Expenses) ($/BOE) $13.34 $8.38 $15.54 $0.74
Twelve months endedDecember 31,
Three months endedDecember 31,
Option Commodity Quantity Reference Strike Put Call TradedCrude Oi l 205,000 Jan 1, 2016 ‐ Dec 31, 2016 WTI $84.45 ‐ ‐ SwapCrude Oi l 309,000 Jan 1, 2016 ‐ Dec 31, 2016 WTI $90.45 ‐ ‐ SwapCrude Oi l 135,600 Jan 1, 2016 ‐ Dec 31, 2016 WTI $63.20 ‐ ‐ SwapCrude Oi l 183,400 Jan 1, 2016 ‐ Dec 31, 2016 WTI $56.90 ‐ ‐ SwapCrude Oi l 365,100 Jan 1, 2017 ‐ Dec 31, 2017 WTI ‐ $40/$60 $85.00 3‐Way
Term
Non‐recurring Expenses & Impairment Charges
Lonestar recorded $0.1 million of regulatory mandated P&A and a $0.7 million of Standby Rig Charges during the fourth quarter of 2015.Additionally, excluded from the fourth quarter were G&A expenses of $1.0 million associated with legal and audit expenses associatedwith Lonestar’s efforts to re‐domicile to the United States, and list on the NASDAQ. These charge have been excluded from theCompany’s EBITDAX calculation.
Lonestar recorded an impairment charge of approximately $0.3 million relating to the oil and gas properties located in South Texas. Note‐Lonestar commissions an independent review of its reserves position and associated future cash flows each year.
* The engineering reports for December 31, 2015 are not yet finalized by the independent engineering firms. However, the Companyadvises that the carrying value of its oil and gas reserves are expected to be materially adversely impacted by the precipitous fall in oiland gas prices over the past 6 months, since the last impairment test. The unaudited financial results included with this QuarterlyReport do not take into account the updated reserves position at December 31, 2015 or any impairment charge of the carrying value ofour properties due to the sharp fall in oil prices, and therefore caution should be adopted when reading these accounts. The Companyadvises that asset impairment is highly likely in future financial statements as a result of the material fall in oil and gas prices, consistentwith many other oil and gas companies.
For
per
sona
l use
onl
y

UNAUDITED INTERIM FINANCIAL REPORT
For the three months ended December 31, 2015
* Please see the footnote at the bottom of page 10 regarding anticipated impairment following conclusion of independent reserve audit.
All figures are unaudited. All figures are in US dollars unless noted otherwise
For
per
sona
l use
onl
y

Page 12‐ Quarterly Report‐ December 31, 2015
Consolidated statements of comprehensive income *For the three and twelve months ended December 31, 2015 and 2014
(US $MM)
2015 2014 2015 2014Revenues (Net of Royalties)Crude Oi l 14.3 27.8 70.7 104.2Natura l Gas Liquids 1.6 1.1 4.0 4.7Natura l Gas 2.4 2.1 6.9 7.7Revenues (Net of Royalties) 18.3 31.0 81.6 116.6Hedge Revenues (Expenses ) 9.4 4.5 36.3 1.2Net Revenue From Ordinary Activities 27.7 35.5 117.9 117.8
Operating ExpensesLease Operating Expenses (5.2) (4.0) (18.7) (15.7)Severance Taxes (0.9) (1.4) (3.7) (5.4)Ad Valorem Taxes 0.1 (0.3) (1.3) (1.7)Depreciation, Depletion & Amortization (14.8) (14.2) (54.0) (40.9)General & Administrative (2.3) (2.4) (9.3) (8.4)Total Operating Expenses (23.1) (22.3) (87.0) (72.1)
Gross Profit from Operating Activities 4.6 13.2 30.9 45.7
Other Income (Expense) (0.2) (0.4) (0.9) (0.0)Impairment of O&G properties (0.3) (5.5) (19.6) (5.5)Stock based compensation (0.8) 0.0 (2.6) (1.9)Non‐recurring expenses (1.8) (0.1) (1.9) (1.7)Interest & Other Finance Expenses (6.1) (5.7) (24.6) (19.9)Fa i r Value Gain (Loss) on derivatives (0.7) 38.1 (8.7) 42.7
Profit (Loss) before taxes (5.3) 39.6 (27.4) 59.4
Income tax (expense) benefi t 0.4 (14.2) 8.2 (16.8)
Net Income (Loss) (4.9) 25.4 (19.2) 42.6
EBITDAX 19.4 27.3 84.9 86.6
As Reported As Reported
December 31,December 31,
Twelve months endedThree months ended
* Please see the footnote at the bottom of page 10 regarding anticipated impairment following conclusion of independent reserve audit.
All figures are unaudited. All figures are in US dollars unless noted otherwise
For
per
sona
l use
onl
y

Page 13‐ Quarterly Report‐ December 31, 2015
Consolidated statements of financial position *
As of December 31, 2015
(US $MM)December 31, December 31,
2015 2014AssetsCurrent AssetsCash and cash equiva lents 4.3 10.0 Trade and other receivables 7.7 17.5 Derivative financia l instruments 33.2 31.0 Other assets 1.1 0.8 Total current assets 46.3 59.3
Non‐current assetsOi l and Gas Properties & Equipment 503.4 479.5 Deferred tax assets 0.3 0.1 Derivative financia l instruments 2.8 12.7 Other non‐current assets 3.6 3.7 Total non‐current assets 510.1 496.0
Total Assets 556.4 555.3
LiabilitiesCurrent liabilitiesTrade and other payables 22.0 35.7 Revenue payable 5.0 4.9 Accrued expenses 2.6 2.4 Derivative financia l instruments ‐ ‐ Total current liabilities 29.6 43.0
Non‐current liabilitiesLong‐term Debt 303.7 264.6 Deferred tax l iabl i l i ties 23.6 26.1 Other non‐current l iabi l i ties 8.4 7.8 Total non‐current liabilities 335.7 298.5
Total Liabilities 365.3 341.5
Net assets 191.1 213.8
EquityContributed equity 142.6 142.6 Reserves 9.5 6.9 Reta ined Earnings 39.0 64.3
Total Equity 191.1 213.8
As ReportedAs of
* Please see the footnote at the bottom of page 10 regarding anticipated impairment following conclusion of independent reserve audit.
All figures are unaudited. All figures are in US dollars unless noted otherwise
For
per
sona
l use
onl
y

(US $MM) Twelve Months Ended Twelve Months Ended
December 31, 2015 December 31, 2014CASH FLOWS FROM OPERATING ACTIVITIES
Net Income (loss ) (19.2) 42.6 Adjustments to reconci le profi t/(loss ) to net cash
provided by operating activi ties :
(Gain) / Loss on sa le of oi l and gas properties ‐ (0.5) Depreciation, depletion, amortisation 53.8 40.7 Impairment 19.3 5.5 Increase in reti rement provis ion 0.2 0.2 Deferred taxes (8.2) 17.6 Share based payments 2.6 1.9 Loss (Gain) on sa le of equipment 0.6 ‐ Non‐cash interest expense 1.1 0.8 Net (increase) decrease in derivatives 7.7 (45.8) Changes in operating assets and l iabi l i ties : ‐ ‐ Accounts receivable 9.8 (9.6) Other assets (0.3) (1.9) Accounts payable and provis ions (17.8) 26.6 Net cash inflow from operating activities 49.6 78.1
CASH FLOWS FROM INVESTING ACTIVITIES
Payments for oi l and gas property, plant & equipment (84.6) (161.5) Acquis i tion of oi l and gas properties (8.7) (71.0) Proceeds from sa les of oi l and gas properties ‐ 3.2 Net cash (outflow) from investing activities (93.3) (229.3)
CASH FLOWS FROM FINANCING ACTIVITIES
Net change in borrowings 38.0 (60.0) Proceeds from i s suance of long term bonds ‐ 214.5 Net cash inflow from financing activities 38.0 154.5
Net increase / (Decrease) in cash held (5.7) 3.3
Cash and cash equiva lents at the beginning of the financia l period 10.0 6.7
Cash and cash equivalents at the end of the financial period 4.3 10.0
As Reported
Page 14‐ Quarterly Report‐ December 31, 2015
Consolidated statements of cash flows *For the twelve months ended December 31, 2015 and 2014
* Please see the footnote at the bottom of page 10 regarding anticipated impairment following conclusion of independent reserve audit.
All figures are unaudited. All figures are in US dollars unless noted otherwise
For
per
sona
l use
onl
y

Page 15‐ Quarterly Report‐ December 31, 2015
Notes to the Quarterly Report
Cautionary and Forward Looking StatementsLonestar has presented petroleum and natural gas production and reserve volumes in barrel of oil equivalent (“boe”) amounts. For purposes of computing such units, a conversion rate of 6,000 cubic feet of natural gas to one barrel of oil equivalent (6:1) is used. The conversion ratio of 6:1 is based on an energy equivalency conversion method which is primarily applicable at the burner tip and does not represent value equivalence at the wellhead. Readers are cautioned that boe figures may be misleading, particularly if used in isolation.
Statements in this announcement which reflect management’s expectation relating to target dates, expected drilling program, and theability to fund its development plans are forward‐looking statements, and can be generally be identified by words such as “will”, “expects”,“intends”, “believes”, “estimates”, “anticipates”, “projects” or similar expressions. In addition, any statements that refer to expectations,projections or other characterizations of future events or circumstances are forward‐looking statements. Statements relating to “reserves”are deemed to be forward looking statements as they involve the implied assessment, based on certain estimates and assumptions that thatsome or all of the reserves described can be profitably produced in the future. These statements are not historical facts but insteadrepresent the expectations of management and/or its independent petroleum consultants, regarding future events.
Although management believes the expectations reflected in such forward‐looking statements are reasonable, forward‐looking statementsare based on the opinions, assumptions and estimates of management at the date the statements are made, and are subject to a variety ofrisks and uncertainties and other factors that could cause actual events or results to differ materially from those projected in the forward‐looking statements. These factors include risks related to exploration, development and production; oil and gas prices, markets andmarketing; acquisitions and dispositions; competition; additional funding requirements; changes in access to and the costs of energyservices; reserve estimates being inherently uncertain; incorrect assessments of the value of acquisitions and exploration and developmentprograms; environmental concerns; reliance on key personnel; title to assets; expiration of leases; hedging activities; litigation; governmentpolicies; unforeseen expenses; and contractual risk. Additionally, if any of the assumptions or estimates made by management prove to beincorrect, actual results and developments are likely to differ, and may differ materially, from those expressed or implied by the forward‐looking statements contained in this document. Such assumptions include, but are not limited to, general economic, market and businessconditions and corporate strategy. Accordingly, investors are cautioned not to place undue reliance on such statements.
All of the forward‐looking information in this announcement are expressly qualified by these cautionary statements. Forward‐lookinginformation contained herein is made as of the date of this document and Lonestar disclaims any obligation to update any forward‐lookinginformation, whether as a result of new information, future events or results or otherwise.
All figures are unaudited. All figures are in US dollars unless noted otherwise
For
per
sona
l use
onl
y

Page 17‐ Quarterly Report‐ December 31, 2015
Reserves Reporting:
Pursuant to ASX Listing Rules (“LR”) the reserves information in this document:
(i) is effective as at 1 January, 2015 (LR 5.25.1)(ii) has been estimated and is classified in accordance with SPE‐PRMS (Society of Petroleum Engineers ‐ Petroleum Resources Management System) (LR 5.25.2)(iii) is reported according to the Company’s economic interest in each of the reserves and net of royalties (LR 5.25.5)(iv) has been estimated and prepared using the deterministic method (LR 5.25.6)(v) has been estimated using a 6:1 BOE conversion ratio for gas to oil, pursuant to the information in the disclaimer section of this document (LR 5.25.7)
Other Reserves Information:
Lonestar operates most of its properties which are generally held by standard oil and gas lease arrangements. Detailed information on the operator and lease arrangements is disclosed in the Company announcement related to the initial acquisition of properties. The Company’s working interest ownership (WI%) and net‐revenue interest ownership (NRI%) in relation to each of its properties are generally included in the Company’s presentations which are available on the ASX or the Company’s websites. Well spacing assumptions and lateral length assumptions are generally included in the Company’s presentations as is additional information on capital cost and taxation assumptions. In accordance with ASX LR 5.43 the Company confirms that it is not aware of any new information or data that materially affects the reserves information included in previous Company announcements including as to material assumptions and technical parameters underpinning the estimates, other than as set out in this announcement.
Qualified Petroleum Reserves and Resources Evaluators:
In accordance with ASX Listing Rules 5.41 and 5.42:
The reserve reporting provided in this document in relation to the Company’s Eagle Ford Shale properties is based on and fairly represents information and supporting documentation that has been prepared by Mr. William D. Von Gonten, Jr., P.E., and Mr. Taylor D. Matthes, P.E. who are employed by W. D. Von Gonten & Co Petroleum Engineering. Mr. Von Gonten holds a Bachelor of Science degree in PetroleumEngineering from Texas A&M University and Mr. Matthes holds a Bachelor of Science degree in Petroleum Engineering from Texas A&M University. Both of these persons are Registered Texas Professional Engineers. Mr. Von Gonten has 24 years of experience as a Petroleum Engineer and Mr. Matthes has more than 5 years of experience as a Petroleum Engineer. Both of these persons are members of the Society of Petroleum Engineers . Messrs. Von Gonten and Matthes have consented to the inclusion in this document of the information and context in which it appears.
The reserve reporting provided in this document in relation to the Company’s Conventional properties is based on and fairly represents information and supporting documentation that has been prepared by Mr. William M. Kazmann who is President and Senior Partner LaRoche Petroleum Consultants, Ltd. Mr. Kazmann received his Bachelor of Science and Master of Science degrees in Petroleum Engineering from the University of Texas at Austin in 1973 and 1975 respectively. He has worked in the oil and gas industry since that time. Mr. Kazmann is a Licensed Professional Engineer in the State of Texas and is a member of the American Association of Petroleum Geologists, Society of Petroleum Engineers, Society of Independent Professional Earth Scientists (serving as National Director from 1993 to 1996 and National Treasurer in 1994 and 1995), Dallas Geological Society, and Dallas Petroleum Club (serving as Director from 2004 through 2006). Mr. Kazmann has consented to the inclusion in this document of the information and context in which it appears.
Reserves Cautionary Statement:
Hydrocarbon reserves and resource estimates are expressions of judgment based on knowledge, experience and industry practice. Estimates that were valid when originally calculated may alter significantly when new information or techniques become available. Additionally, by their very nature, reserve and resource estimates are imprecise and depend to some extent on interpretations, which may prove to be inaccurate. As further information becomes available through additional drilling and analysis, the estimates are likely to change. The may result in alterations to development and production plans which may, in turn, adversely impact the Company’s operations. Reserves estimates and estimates of future earnings are, by nature, forward looking statements and subject to the same risks as other forward looking statements.
Commodity Pricing Used:
Lonestar’s reserves and PV‐10 have been estimated using index prices determined in accordance with US SEC pricing guidelines for oil and natural gas, without giving effect to derivative transactions, and were held constant throughout the life of the properties. The unweighted arithmetic averages of the second‐day‐of‐the‐month prices for the year ended December 31, 2014 were $94.99 per bbl for oil and $4.35 per mmbtu for natural gas. These prices were adjusted by lease for quality, energy content, regional price differentials, transportation fees, marketing deductions and other factors affecting the price received at the wellhead.
For
per
sona
l use
onl
y