for personal use only - asx · ceo’s review breville group revenue growth of 7.7% was driven by...
TRANSCRIPT

TM
Spot: PMS518C
Display RGB: 72/40/60 Display HEX: 48283C
Process: 55/86/20/63
Annual report 2018For
per
sona
l use
onl
y

Breville Group Limited Annual report 2018 Contents:
Chairman’s review 1
CEO’s review 3
Strategy and brands 5
Financial report 13
Shareholder information 96
Company information 98
Annual general meeting:
Tuesday 13 November 2018 at 10am
Ground Floor, Suite 2, 170-180 Bourke Rd,
Alexandria NSW 2015.
(this page and outside covers)
the Juice Fountain® Cold XL
For
per
sona
l use
onl
y

1Breville Group Limited annual report 2018
Chairman’s review
The 2018 financial year was a significant year for the Breville Group with continued sales and profit growth whilst progressing through the Group’s acceleration program.
The Group delivered a 7.7% increase in revenue, with strong revenue growth in the core Global Product segment increasing by 12.2% to $526.9m. The Distribution segment revenue for the year of $125.5m was 7.8% lower than the previous year.
Group EBIT for the year of $86.9m, represented a 10.0% increase on the prior year. Group EBIT margins of 13.3% were slightly higher compared to 13.0% in the prior year. Net profit after tax increased by 8.7% to $58.5m.
Net cash flow generated from operating activities of $88.7m was 41.5% higher than the $62.7m generated in the prior year driven by both an improved operating performance and inventory reduction. Cash flows used in investing activities increased from $19.3m to $28.5m, due to the ongoing investment in product development, IT systems and the acquisition of Aquaport. Net cash at 30 June 2018 increased to $58.0m.
Under the leadership of CEO Jim Clayton, we made significant progress in our business model transformation, increasing our marketing and R&D spend to 10.5% of revenue whilst achieving targeted earnings.
The Board increased the level of dividends for the year to 33.0 cents from 30.5 cents in the prior year, demonstrating the Board’s ongoing commitment to providing strong returns to shareholders.
On behalf of the Board, I would like to take this opportunity to thank Jim Clayton and his team of talented, motivated and passionate team members around the world for their continued hard work and enthusiasm.
Finally, I would like to thank my Board colleagues and our shareholders, customers and suppliers for their continued support. I encourage all shareholders to attend the annual general meeting in November.
Steven Fisher Non-executive chairman
“We continue to advance through our acceleration program and deliver growth in operating performance.”
For
per
sona
l use
onl
y

the Kitchen Wizz‰ Peel & Dice
For
per
sona
l use
onl
y
3Breville Group Limited annual report 2018
CEO’s review
Breville Group revenue growth of 7.7% was driven by the Global Product segment.
Revenue for the year for the Global Product segment increased by 13.4% in constant currency, ending the year at $526.9m. All geographic regions contributed to this result, with North America growing by 16.3%, ANZ by 9.1%, and ROW by 10.7% (all growth rates in constant currency). Primarily, the key categories of beverage and cooking benefited from product launches in the current year as well as increases from existing products including those released part way through FY17.
Revenues in the Distribution segment of $125.5m were 7.8% lower than the 2017 financial year. The distribution segment included revenues from the North American Nespresso® machine partnership for the entire FY18, compared to the prior year where revenues commenced in the second half. Furthermore, new revenues in ANZ from the Aquaport acquisition and Nestlé® Dolce Gusto® distribution relationship largely offset the impact of the expiry of the ANZ Philips distribution agreement late in FY17.
Group EBIT for the year finished at $86.9m, 10.0% higher than the previous year. The Global Product segment EBIT increased 1.2% (or $0.9m) over the prior period and the Distribution segment EBIT grew by $7.0m, ending at $13.6m. The Global Product segment EBIT margin of 13.9% compares to 15.4% in FY17. This reduction in EBIT margin is reflective of the Group’s strategic acceleration program, which included increased investment in marketing and R&D as well as the cost of the
European expansion, all of which was expensed in the Global Product segment. The increased investment was enabled by increased EBIT from the Distribution segment along with higher gross profit generated in the Global Product segment (margin consistent with FY17). The Distribution segment EBIT margin increased from 4.9% in FY17 to 10.8% in FY18, which is reflective of the turnaround in segment profitability.
The 2018 financial year was a year of continuing to advance through the Group’s business model transformation, with notable achievements including launching the Sage® brand direct into Germany and Austria, transitioning to a third-party logistics model, going live with new updated websites in many regions, implementing retail sell out systems and improving the organisational capability. The Group continued to make strong progress through its growth acceleration framework of selling more product into a larger market on a scalable, acceleration platform.
On a personal note, I am excited by the progress we have made during the year, and I thank the Breville team for their energy, teamwork, and enthusiasm in the execution of the transformation. I also would like to thank the Board for their ongoing support and counsel.
Jim Clayton Chief executive officer
Financial summary
$ Millions except where indicated
REVENUE EBIT
30 June 2018
30 June 2017
% Change
30 June 2018
30 June 2017
% Change
Global Product segment 526.9 469.6 12.2% 73.3 72.4 1.2%
Distribution segment 125.5 136.2 (7.8%) 13.6 6.6 106.1%
TOTAL 652.3 605.7 7.7% 86.9 79.0 10.0%
Minor differences may arise due to rounding
“The Group delivered strong results in FY18 whilst simultaneously progressing further along the acceleration program, the impact of
which has helped drive the improved result.”
For
per
sona
l use
onl
y

the Precision Brewer ™ Thermal
For
per
sona
l use
onl
y

5Breville Group Limited annual report 2018
Strategy and brands
The Breville® brand is at the core of this strategy, representing the majority of the Group’s revenues and marketing activities. There are, however a number of additional company owned brands and brand partners in different geographies that assist in the delivery of the business strategy.
In line with its global strategy, the Group is focused on the design, development and sale of Breville branded products supplied in currently 65 countries to the premium kitchen segment of the market (‘Global Product’). The Distribution segment sells products that are distributed pursuant to a license or distribution agreement, or sourced directly from manufacturers. Products in this business unit may be sold under a brand owned by Breville (Breville®, Kambrook®, Aquaport, Cli-mate) or they may be distributed under a third-party brand (Nespresso®, Nestlé® Dolce Gusto®).
North America
In North America, the Group distributes its range of internally designed and developed kitchen products under the Breville brand through premium channels and its own direct-to-consumer e-commerce platform. From the second half of the 2017 financial year, the Breville brand included a range of Breville co-branded Nespresso® coffee machines as one of Nespresso®’s machine partners in North America.
North American revenues also include the USA based culinary division - PolyScience®, one of the world’s market leaders in premier sous vide cooking in both the commercial and professional markets.
Australia and New Zealand
In Australia and New Zealand, the Group primarily trades under its company owned brands (Breville®, Kambrook® and since August 2017 Aquaport and Cli-mate).
The Kambrook® brand extends to categories beyond the kitchen; offering not just a full range of kitchen appliances, but also irons, vacuums, heating and cooling products, all at an affordable price point without any compromise on quality and performance.
Europe
In Europe the Breville brand is not owned or operated by the Breville Group.
In the United Kingdom, and since April 2018 in Germany and Austria, the Group directly markets and distributes its premium designed and developed Breville global kitchen products under the company owned brand, Sage®. It is also a supplier of Sage® branded goods to certain third-party distributors located in Europe.
Rest of the World
In the Asia Pacific region and the Middle East, the Group markets its premium designed and developed kitchen products under the Breville brand. Distribution in these regions is managed using local third party distributors supplied primarily via the Group’s Hong Kong office.
A History of Innovation On Melbourne Cup day in 1932, two Australian entrepreneurs, Bill O’Brien and Harry Norville, combined their surnames together to form the name ‘Breville’ and founded a company manufacturing radios out of Sydney.
During the 1960’s, Bill’s son John focused the organisation on solving common kitchen problems and founded the Breville small appliance research and development centre, which led to the invention of the now iconic Breville toasted sandwich maker.
The toasted sandwich maker kick-started a long list of award-winning innovative Breville products developed in Australia and distributed throughout the world. From the original Kitchen Wizz® food processor and High-Wall® Wok, to the launch of the world’s first wide feed chute juicer, Breville has become synonymous with ground-breaking innovation in the kitchen.
Breville Group’s primary strategy is the design and development of the world’s best kitchen
appliances together with expanding distribution and dynamic marketing on a global scale.
For
per
sona
l use
onl
y

the Smart Tea Infuser ™
For
per
sona
l use
onl
y

7Breville Group Limited annual report 2018
Growth of the Brand In 2000, Breville embarked on a project to expand its design and innovation capabilities, building a much larger internal team that has today become Australia’s leading kitchen appliance product development team. This investment culminated in the 2003 launch of its premium range of products into the United States and other international markets.
In 2009, Breville combined its design and development capabilities with a more focused marketing, recruitment and cultural initiative entitled “Food Thinking”. As a part of this strategy, internal teams work closely with professional chefs and consumers to develop insight and an integrated approach to product development including:
• Deeper understanding of food, friction points, and the challenges consumers face
• Patented innovation to solve these challenges, marketed as “Simple Moments of Brilliance™”
• Superior quality and engaging design.
Breville’s ethos of ‘Food Thinking’ and creativity remains as relevant today as it did then and continues to gain momentum and win over a new generation of consumers, driving accelerated innovation and increased product development. Furthermore, the Group’s appreciation for food science and culinary trends has led to the fostering of relationships with high profile food thinkers, including world renowned baristas and chefs, some of whom have directly helped the Group in a product development capacity.
The Consumer at the Core of the BusinessMore recently, the Group has increased focus on driving consumer understanding of, and engagement with, the Group’s product and proposition. The Group believes that consumers should be able to produce and enjoy a perfect result every time, and that they should never have to settle or compromise just because they are making it at home. Through “Food Thinking”, the Group provides consumers with “Mastery in a Box™” - innovative products which simplify and make the process of creation more of a pleasure, and the end result more perfect, each and every time.
At the heart of this proposition lies a passionately-held belief that consumers should feel empowered to share these results with those who are most important to them: their family and friends. After all, the opportunities to make everyday moments an occasion exist in the tens of thousands, and Breville believes that use of its products will help consumers “Master Every Moment™” and enjoy life to the fullest extent.
Sage® In the United Kingdom, the Group distributes its premium designed and developed products under the Group owned brand, Sage®, which is endorsed by internationally acclaimed chef, Heston Blumenthal. The brand identity and positioning of Sage® is aligned closely to the global Breville brand identity, “Food Thinking” approach, and “Master Every Moment™” empowerment strategy.
The Sage® distribution strategy is also very similar to that of Breville in North America, with distribution limited primarily to premium retailers and its own direct to consumer e-commerce platform. The Group continues to invest in engaging marketing activity for the Sage® brand to drive targeted expansion and accelerate the brand’s presence in the premium channel in the United Kingdom.
Additionally, since 2017, distribution partners are taking advantage of the Group’s investment in the Sage® brand and have set aside their own brand names and adopted the Sage® brand in their territories. Countries such as Denmark, Sweden, Norway, Finland, Estonia, Lithuania, Latvia, Czech Republic and Slovakia, amongst others, were the first to transition.
Finally, in some key countries, the Group has decided to regain distribution control and launch the Sage® brand direct to markets. In April 2018, the Group launched the Sage® brand direct in Germany and Austria.
Strategy and brands continued
For
per
sona
l use
onl
y

the Sommelier ™
For
per
sona
l use
onl
y
9Breville Group Limited annual report 2018
Strategy and brands continued
Kambrook®Kambrook® has become known for quality, durable products at an affordable price point. The ever-expanding product range encompasses appliances for the kitchen, living room, laundry and bedroom. Kambrook® continues to highlight the durability of its appliances and the rigorous testing process that each new product undergoes. Products are subjected to extensive laboratory and quality testing before receiving the Kambrook® seal of approval. To help emphasise that aspect of the brand, a new logo incorporating the “infinity symbol” in place of the two letter “o”s in the Kambrook® name was introduced during FY17 and continues to find some success and recognition in the marketplace as a mark for quality assurance.
PolyScience®The PolyScience® culinary division includes the world’s premier immersion cooking circulators (for sous vide cooking), as well as various specialty cooking accessories such as the Smoking Gun (for rapid food smoking), vacuum sealers, cold plates and vacuum evaporations systems.
Innovation and product developmentThe core driving the Group’s growth continues to be investment in product development and a focus on design and innovation. Breville has further deepened its understanding of food, and how the consumer interacts with it, applying this to solving problems in ways that are both valuable to people, and differentiated from competitors.
Breville actively protects this customer value through increased investment in intellectual property protection and via the development of a portfolio of patented innovative products for future sustainable growth.
People – creative food thinkersBreville enjoys the benefits of highly experienced talent across all departments and geographies. Integrated throughout its food thinking culture, the passion, creativity and insight of staff has helped to consistently bring world class innovative products to consumers around the world. The team continues to be awarded both domestically and internationally, with multiple design awards, and recognition through mainstream media.
Breville Group invests in the training and education of its team; building strong, collaborative links with world experts in food thinking and technology. The Group is also involved in several consumer facing and chef liaison activities.
Strongly committed to its core values of creativity, simplicity, insight and excellence in all departments, Breville recruits, trains, assesses and rewards employees on this basis. With a team anchored around these common values, the business is able to foster a workplace that stimulates idea generation, a passion for learning, and the continuous search for new and better solutions.
During the 2018 financial year, the Group continued to grow its highly talented and experienced team, bringing on board additional experience and expertise, particularly in the areas of marketing, product design and development, IT and logistics.
Process and mindset change for the futureThe Group has continued to transform its go-to-market process. With the objective of an aligned calendar setting, both within Breville itself and its external manufacturing and retail channel partners, the Group seeks to fully leverage an increasing number of new product introductions to continue to drive its business and iconic brands forward.
By ensuring that the ‘go-to-market’ process is aligned functionally, regionally and with its external partners, the Group has set an objective: to launch product, with impact, at a single moment in time, across a number of markets under the global distribution footprint, in order to ensure that the Group will reap the full potential of its innovation and design excellence.
The Group is now at in the final stages of the process, and will see the full benefit coming on line in the 2019 financial year.
For
per
sona
l use
onl
y

the Luxe Collection in Black
For
per
sona
l use
onl
y

For
per
sona
l use
onl
y

12 Breville Group Limited annual report 2018
2018 BES880 the Barista Touch
2017 BES990 the Oracle Touch
2017 BFS800 the Steam Zone
2016 CMC800 Control Freak Cooker
2016 BEM825 the Bakery Boss
2015 BMO700 Quick Touch Microwave
2015 BCP600 Citrus Press
2015 BBL405 the Kinetix Twist
2014 BES980 the Oracle Espresso
2013 BSG1974 the Original ‘74
2012 BDC600 You-Brew Drip Coffee Machine
2011 BFP800 Food Processor
2010 BGR820 Smart Grill
BEST IN CATEGORY - Domestic Appliances2016 BSM600 the Smoking Gun
2018 BDC450 the Precision Brewer Thermal
2018 BJE830 the Juice Fountain Cold XL
2018 BNE500 Creatista Uno
2017 BOV900 the Smart Oven Air
2017 BTA735 the Toast Select Luxe
2017 BNE800 Creatista Plus
2016 BPB620 Boss To Go Personal Blender
2014 BBL910 the Boss Superblender
2013 BRC600 the Multi Chef
2013 BEF100 the Thermal Pro Grill
2012 BCI600 Smart Scoop Ice Cream Maker
2012 BES900 Dual Boiler Espresso Machine
2011 BCG800 Smart Grinder
2011 BTM800 Tea Maker
2010 BEM800 Wizz Planetary Mixer
2010 BOV800 Smart Oven
2010 BES820 Variable Temperature Kettle
2010 BES860 Fresca Espresso Machine
2008 BKT500 ikon Toaster & Kettle
2008 BTA800 Professional Series Toaster
2008 BBL800 Professional Series Blender
Red Dot Design Award - Best of the Best2017 BNE800 Creatista Plus
Red Dot Design Award2018 BES880 the Barista Touch
2018 BDC450 the Precision Brewer Thermal
2018 BJE830 the Juice Fountain Cold XL
2018 BFP820 the Kitchen Wizz Peel and Dice
2017 BES990 the Oracle Touch
2017 BSG600 the Perfect Press
2017 BFS800 the Steam Zone
2017 BSM600 the Smoking Gun
2017 BOV900 the Smart Oven Air
2017 BTA735 the Toast Select Luxe
2017 BKE735 the Soft Top Luxe
2016 CMC800 Control Freak Cooker
2016 BEM825 the Bakery Boss
2016 Thermal Pro Cookware
2016 BPB620 Boss To Go Personal Blender
2015 BMO700 Quick Touch Microwave
2015 BCP600 Citrus Press
2014 BES980 the Oracle Espresso
2014 BMO734 the Quick Touch
2014 BTA720/730 the Lift and Look Pro
2014 BWM640 the Smart Waffle
2013 BEF100 the Thermal Grill Pro
2013 BRC600 the Multi Chef
2012 BDC600XL You-Brew Drip Coffee Machine
2012 BFP800 Kitchen Wizz Pro
2008 BTA820/840 Professional Toasters
2008 BES400 Espresso Machine
Honourable Mention2013 BBL605 Kinetix Control Blender
2011 BKE820 Kettle Honourable Mention
the Restaurant Show UK - Best New Idea
2016 CMC800 Control Freak Cooker
Good Design Award Chicago Anthenaeum2012 BOV800 Smart Oven
2012 BFP800 Kitchen Wizz Pro
2012 BTM800 Tea Maker
2012 BCG800 Smart Grinder
IDSA Design Award – USA IDEA International Design Excellence Awards
Bronze Award 2017 BES990 the Oracle Touch
2017 BNE800 Creatista Plus
2017 BSM600 the Smoking Gun
2014 BES980 the Oracle Espresso
2013 BES900 Dual Boiler Espresso
2007 BBL600 Blender
Finalists 2018 BES880 the Barista Touch
2018 BDC450 the Precision Brewer Thermal
2018 BJE830 the Juice Fountain Cold XL
2018 BFP820 the Kitchen Wizz Peel and Dice
2017 BOV900 the Smart Oven Air
2014 BWM640 the Smart Waffle
2014 BTA720/730 the Lift and Look Pro
2013 BFP800 Kitchen Wizz Food Processor
2013 BBL 605 Kinetix Control Blender
2013 BDC600 You-Brew Drip Coffee Machine
iF Design Award 2016 Thermal Pro Cookware
2016 BPB620 Boss To Go Personal Blender
2008 BES820 Espresso Machine
2008 BTA820/840 Professional Toasters
Gold iF Design Selection2016 Thermal Pro Cookware
2015 BES980 the Oracle Espresso
2015 BWM640 the Smart Waffle
2008 BES820 Espresso Machine
AccoladesF
or p
erso
nal u
se o
nly

13Breville Group Limited annual report 2018
Contents:
Directors’ report 14
Corporate governance statement 39
Consolidated income statement 44
Consolidated statement of comprehensive income 45
Consolidated statement of financial position 46
Consolidated statement of changes in equity 47
Consolidated cash flow statement 48
Notes to the financial statements 49
Directors’ declaration 88
Independent auditor’s report 89
Auditor’s independence declaration 95
Breville Group Limited Financial report 2018 F
or p
erso
nal u
se o
nly

14 Breville Group Limited annual report 2018
Directors’ report
The board of directors of Breville Group Limited (company) has pleasure in submitting its report in respect of the Group for the year ended 30 June 2018.
Board of directors
The names and details of the company’s directors in office during the year and until the date of this report are as below. Unless indicated otherwise, directors were in office for this entire period.
Steven FisherNon-executive chairmanB.ACC, CA(SA)Mr Fisher has more than 25 years’ experience in general management positions in the wholesale consumer goods industry and is currently chief executive of the Voyager Group. Prior to entering into the consumer goods industry Mr Fisher was a practicing chartered accountant having qualified in South Africa with a Bachelor of Accounting degree. In addition, Mr Fisher serves on various private company boards.
During the last three years he has not served as a director of any other listed company.
Timothy AntonieNon-executive directorBEconMr Antonie has more than 20 years’ experience in investment banking and formerly held positions of Managing Director from 2004 to 2008 and Senior Advisor in 2009 at UBS Investment Banking, with particular focus on large scale mergers and acquisitions and capital raisings in the Australian retail, consumer, media and entertainment sectors. Mr Antonie is currently a principal of Stratford Advisory Group. He holds a Bachelor of Economics degree from Monash University and qualified as a Chartered Accountant with Price Waterhouse.
During the last three years he has served as a non-executive director of the following other listed companies:
• Premier Investments Limited #
• Village Roadshow Limited #
• Netwealth Group Limited #
# denotes current directorship
Sally HermanNon-executive directorBA, GAICDMs Herman is an experienced non-executive director sitting on both public and private company boards in financial services, retailing, property and consumer goods. She had a long career in financial services in both Australia and the United States, including 16 years with the Westpac Group, running business units in most
operating divisions of the Group. Ms Herman is based in Sydney and is actively involved in the community, with a particular interest in education, the arts and social justice. She is a member of Chief Executive Women.
During the last three years she has served as a non-executive director of the following other listed companies:
• Suncorp Group Limited #
• Premier Investments Limited #
• Evans Dixon Limited #
# denotes current directorship
Dean HowellNon-executive directorFCA, CTAMr Howell has had an extensive career in accounting, spanning over 40 years, and accordingly has a wealth of commercial and advisory experience. He was the former senior partner of a Melbourne firm of chartered accountants and also served on that firm’s national and international boards. He is also a director of Peter MacCallum Cancer Foundation Ltd.
During the last three years he has not served as a director of any other listed company.
Steven Klein – resigned 13 November 2017
Non-executive directorLLB, B.ComMr Klein is a Principal of SBA Law. He has had over 25 years’ experience acting on behalf of both public and private companies in merger and acquisition transactions.
During the last three years he has not served as a director of any other listed company.
Lawrence MyersNon-executive directorB.Acct, CA, CTAMr Myers has over 20 years’ experience as a practising Chartered Accountant. He is the Managing Director and founder of MBP Advisory Pty Limited, a high end Sydney firm of Chartered Accountants. Mr Myers sits on numerous private company and not-for-profit boards and acts as a trusted advisor and mentor on business and financial matters. He is a registered auditor and his specialist areas of practice include business and corporate advisory as well as mergers and acquisitions. Mr Myers is chairman of the audit and risk committee (A&RC) and is the company’s lead independent director.
During the last three years he has served as a director of the following other listed company:
• VGI Partners Global Investments Limited #
# denotes current directorship
For
per
sona
l use
onl
y

15Breville Group Limited annual report 2018
Kate WrightNon-executive directorBAMs Wright has more than 30 years’ experience in the consumer industry across Australia, the South Pacific and the USA. Her career has spanned manufacturing operations, sales, marketing, human resources and general management within the consumer sector. Ms Wright has held the positions of Managing Director, Australia and South Pacific region at Philip Morris from 2001 to 2004 and Head of Korn Ferry Australia’s Consumer and Retail Practice from 2005 to 2016. Ms Wright holds a Bachelor of Arts degree from the University of New South Wales. Ms Wright is chair of the people and performance committee (P&PC).
During the last three years she has not served as a director of any other listed company.
Company secretaries
The names and details of the company secretaries in office during the year and until the date of this report are as below. Unless indicated otherwise, the company secretaries were in office for this entire period.
Mervyn Cohen – resigned 17 November 2017
B.Com, B.Acc, CAMr Cohen is a chartered accountant and has over 25 years’ experience in senior financial roles after beginning his career in Audit and Advisory. Mr Cohen was also Chief Financial Officer of the company, a position he has held from October 2006 until resignation on 17 November 2017.
Sasha KittoLLB, FCAMs Kitto is a chartered accountant and has over 15 years’ experience as a practising chartered accountant and in senior finance roles.
Reporting currency and rounding
The financial report is presented in Australian dollars and all amounts have been rounded to the nearest thousand dollars ($’000) unless otherwise stated under the option available to the company under ASIC Corporations (Rounding in Financial/Directors Reports) Instrument 2016/191. The company is an entity to which the instrument applies.
Performance indicators
Management and the board monitor the financial performance of the group by measuring actual results against expectations as developed through an annual business planning and budgeting process.
Appropriate key performance indicators (KPI’s) are used to monitor operating performance and management effectiveness.
Operating and financial review
The operating and financial review has been designed to enhance the periodic financial reporting and provide shareholders with additional information regarding the Group’s operations, financial position, business strategies and prospects. This review complements the financial report and has been prepared in accordance with the guidance set out in ASIC Regulatory Guide 247.
Company overview and principal activitiesThe Group’s principal activities and underlying strategy is the design and development of innovative world class small electrical kitchen appliances and the effective marketing of these products across multiple geographies to drive growth in sales and profits.
In line with this strategy, the Group has:
• A strong and competitive product portfolio with proven success across the globe;
• An innovative, committed, high-quality team;
• An R&D culture that focuses on consumer value and emerging food and beverage technologies when developing new products, enabling the Group to maintain its premium product and market positioning;
• A track record of delivering growth outside of the ANZ region; and
• A strong balance sheet which provides a platform to take advantage of future opportunities.
During the year, the Group has continued to refine its strategic direction and has continued the execution of its acceleration program, further detail of which is provided on page 19.
The Group operates a global centralised business unit structure with two business segments described as per below:
• The Global Product segment sells premium products designed and developed by Breville, which are sold globally (currently 65 countries). Products included in this segment may be sold directly or through third parties, and may be branded Breville®, Sage®, or carry a third party brand; and
• The Distribution segment sells products that are designed and developed by a third party. Products are distributed pursuant to a license or distribution agreement, or they are sourced directly from manufacturers. Products in this business unit may be sold under a brand owned by Breville® (e.g. Breville®, Kambrook®), or they may be distributed under a third party brand (e.g. Nespresso®).
Board of directors continued
For
per
sona
l use
onl
y
16 Breville Group Limited annual report 2018
For both business segments, the geographic regions execute the sales and distribution functions, supported by centralised functions (including product development, marketing and operations). The centralised functions, specifically marketing and product development are part of the global, innovation driven product business and thus form part of the Global Product segment.
In Australia and New Zealand, the Group principally trades under its company owned brands, Breville®, Kambrook® and Aquaport and also distributes products under a machine partnership with Nespresso® and Nestlé® Dolce Gusto®.
In North America, the Group distributes Breville® (including Polyscience®) branded products through premium channels and commencing the second half of the 2017 financial year, Nespresso® products, under a machine partnership.
In UK, Germany and Austria, the marketing and distribution of Breville® designed products to premium retailers is under the company owned brand, Sage®. It is also a supplier for Sage® branded goods to certain distributors located in Europe.
The Group’s Hong Kong office performs the functions of a group procurement and quality assurance centre and also, a supplier of primarily Breville® designed products to distributors globally (excluding the Sage® European distributors). These distributors are located outside of the Group’s principal markets. The products sold to distributors are either Breville® branded or non-Breville branded in Europe (excluding Sage® European distributors), Asia Pacific region, the Middle East and South America.
Group operating results
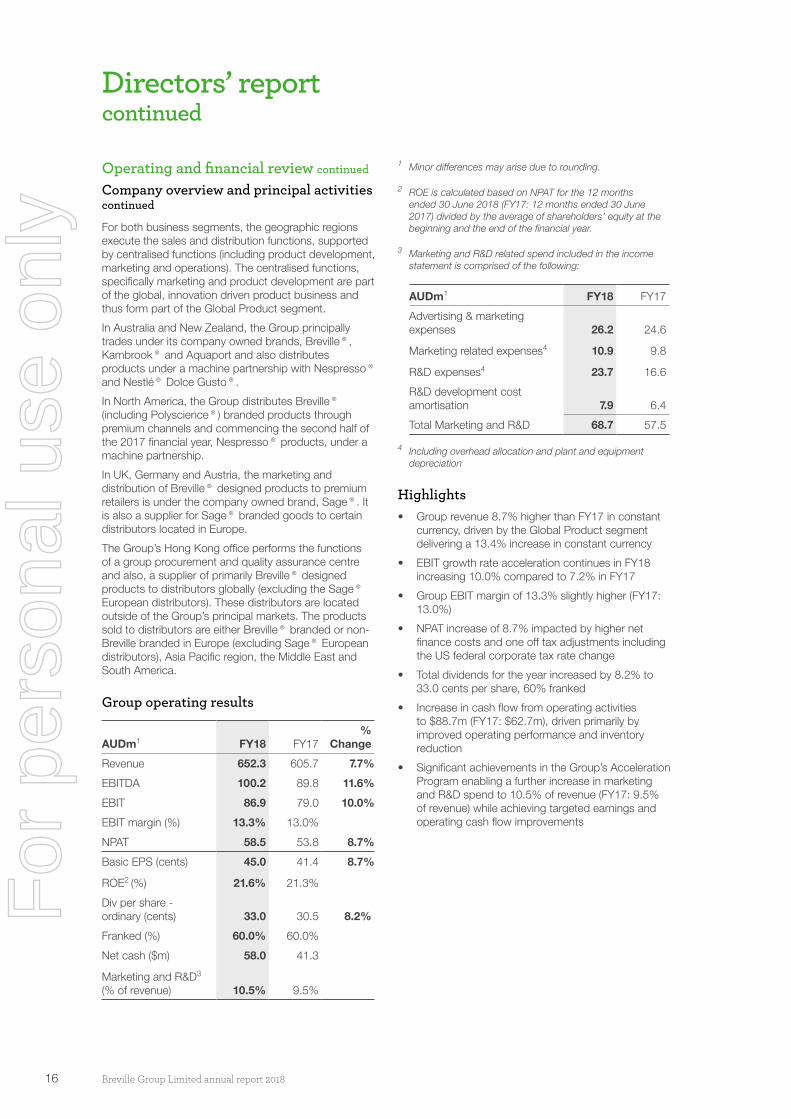
AUDm1 FY18 FY17%
Change
Revenue 652.3 605.7 7.7%
EBITDA 100.2 89.8 11.6%
EBIT 86.9 79.0 10.0%
EBIT margin (%) 13.3% 13.0%
NPAT 58.5 53.8 8.7%
Basic EPS (cents) 45.0 41.4 8.7%
ROE2 (%) 21.6% 21.3%
Div per share - ordinary (cents) 33.0 30.5 8.2%
Franked (%) 60.0% 60.0%
Net cash ($m) 58.0 41.3
Marketing and R&D3 (% of revenue) 10.5% 9.5%
1 Minor differences may arise due to rounding.
2 ROE is calculated based on NPAT for the 12 months ended 30 June 2018 (FY17: 12 months ended 30 June 2017) divided by the average of shareholders’ equity at the beginning and the end of the financial year.
3 Marketing and R&D related spend included in the income statement is comprised of the following:
AUDm1 FY18 FY17
Advertising & marketing expenses 26.2 24.6
Marketing related expenses4 10.9 9.8
R&D expenses4 23.7 16.6
R&D development cost amortisation 7.9 6.4
Total Marketing and R&D 68.7 57.5
4 Including overhead allocation and plant and equipment depreciation
Highlights• Group revenue 8.7% higher than FY17 in constant
currency, driven by the Global Product segment delivering a 13.4% increase in constant currency
• EBIT growth rate acceleration continues in FY18 increasing 10.0% compared to 7.2% in FY17
• Group EBIT margin of 13.3% slightly higher (FY17: 13.0%)
• NPAT increase of 8.7% impacted by higher net finance costs and one off tax adjustments including the US federal corporate tax rate change
• Total dividends for the year increased by 8.2% to 33.0 cents per share, 60% franked
• Increase in cash flow from operating activities to $88.7m (FY17: $62.7m), driven primarily by improved operating performance and inventory reduction
• Significant achievements in the Group’s Acceleration Program enabling a further increase in marketing and R&D spend to 10.5% of revenue (FY17: 9.5% of revenue) while achieving targeted earnings and operating cash flow improvements
Operating and financial review continued
Company overview and principal activities continued
Directors’ report continued
For
per
sona
l use
onl
y

17Breville Group Limited annual report 2018
Operating and financial review continued
Segment results
AUDm1
REVENUE EBIT EBIT MARGIN (%)
FY18 FY17 % Change FY18 FY17 % Change FY18 FY17
Global Product 526.9 469.6 12.2% 73.3 72.4 1.2% 13.9% 15.4%
Distribution 125.5 136.2 (7.8%) 13.6 6.6 106.1% 10.8% 4.9%
TOTAL 652.3 605.7 7.7% 86.9 79.0 10.0% 13.3% 13.0%
1 Minor differences may arise due to rounding.
Global Product segmentGlobal Product segment revenue
AUDm1
GLOBAL PRODUCT SEGMENT REVENUE
FY18 FY17% Change
AUD
% Change Constant Currency
North America 303.6 265.1 14.5% 16.3%
Australia and New Zealand (ANZ) 123.9 114.1 8.6% 9.1%
Rest of World 99.4 90.4 9.9% 10.7%
TOTAL 526.9 469.6 12.2% 13.4%
1 Minor differences may arise due to rounding.
The Global Product segment revenue for the year increased by 12.2% to $526.9m (FY17: $469.6m) and 13.4% in constant currency.
The North American region again reported solid growth, with revenue of $303.6m (FY17: $265.1m), a 14.5% increase in reported revenues and 16.3% in constant currency. The key categories of beverage and cooking benefited from FY18 product launches as well as revenue increases from existing product, including those not released for the full FY17 period.
The ANZ region delivered constant currency revenue growth of 9.1% in a somewhat challenged retail environment. The Australian component of this region delivered low double digit growth, and New Zealand softened off a very strong performance in FY17. New product releases in beverage and to a lesser extent food preparation drove the increase.
Rest of World revenues increased by 9.9% to $99.4m (FY17: $90.4m). In constant currency, revenues were 10.7% higher. During the second half of FY18, the Sage® brand was launched directly into Germany and Austria. This transition negatively impacted FY18 as Breville had earlier stopped selling its product to a third party. But even with this change, the ROW business delivered double digit growth in constant currency. These higher revenues flowed primarily from new product releases in both FY17 and FY18, as well as the addition of a new ROW partner (Nespresso®).
Global Product segment EBIT
Global Product segment EBIT for the year was $73.3m (FY17: $72.4m), representing a 1.2% increase. The segment EBIT margin of 13.9% compares to 15.4% in FY17.
The reduction in EBIT margin is reflective of the Group’s ongoing strategic acceleration program. The increased investment in marketing and R&D along with the European expansion has been expensed within the Global Product segment. Higher EBIT from the Distribution segment along with higher Global Product segment gross profit (consistent margin with FY17) enabled these investments in Global Product to be expensed while achieving overall profitability targets.
Distribution segment
Distribution segment revenue
Revenue for the year of $125.5m was $10.7m or 7.8% lower than prior year (FY17: $136.2m).
The Distribution segment included revenues from the North American Nespresso® machine partnership for the entire FY18, compared to the prior year where revenues commenced in the second half. FY18 also included new revenues in ANZ from the Aquaport acquisition and the Nestlé® Dolce Gusto® distribution relationship. These additional revenue streams largely offset the impact of the expiry of the ANZ Philips distribution agreement late in FY17.
Distribution segment EBIT
Distribution segment EBIT for FY18 increased by $7.0m to $13.6m (FY17: $6.6m), reflecting the turnaround in segment profitability.
The segment’s EBIT margin increased to 10.8% from 4.9% in the prior year. The improved segment EBIT margin was driven by improved brand and product revenue margin mix.
For
per
sona
l use
onl
y
18 Breville Group Limited annual report 2018
Financial position
Working capital
The Group’s total investment in working capital decreased by $8.7m compared to 30 June 2017.
Inventory balances of $99.7m at 30 June 2018 were $16.9m lower (30 June 2017: $116.6m), primarily due to the prior year inventory balance being adversely impacted by the one-off inventory build associated with the commencement of the North American Nespresso® machine partnership. This, combined with adjustments to the timing of the holiday season purchasing program and the sales and operations planning process continuing to drive efficiencies, more than offset those inventory items with a nil balance in the prior year (Aquaport, Nestlé® Dolce Gusto® and the European warehouse) and the slight negative FX translation impact.
Receivables were $2.0m lower than 30 June 2017, with the decrease driven by timing and mix within the fourth quarter of FY18 compared to the previous corresponding period.
Trade and other payables decreased $10.2m over 30 June 2017 to $84.6m. This decrease was driven primarily by refinements in the sales and operations
process as well as an adjusted purchase pattern for the holiday season (vs. FY17).
Net cash
Net cash at 30 June 2018 was $58.0m compared to $41.3m at 30 June 2017. Net cash flow generated from operating activities of $88.7m was $26.0m higher than the $62.7m generated in the prior year.
Dividends
A final dividend of 16.5 cents per share (60% franked) has been declared (FY17: 15.0 cents, 60% franked) bringing the total dividends to 33.0 cents per share, 60% franked. This final dividend has a record date of 14 September 2018 and is payable on 5 October 2018.
The Directors have resolved to continue to suspend the operation of the Dividend Reinvestment Plan. The ongoing expected increase in relative contribution of the businesses outside of Australia will continue to impact the extent to which the Group is able to frank future dividends.
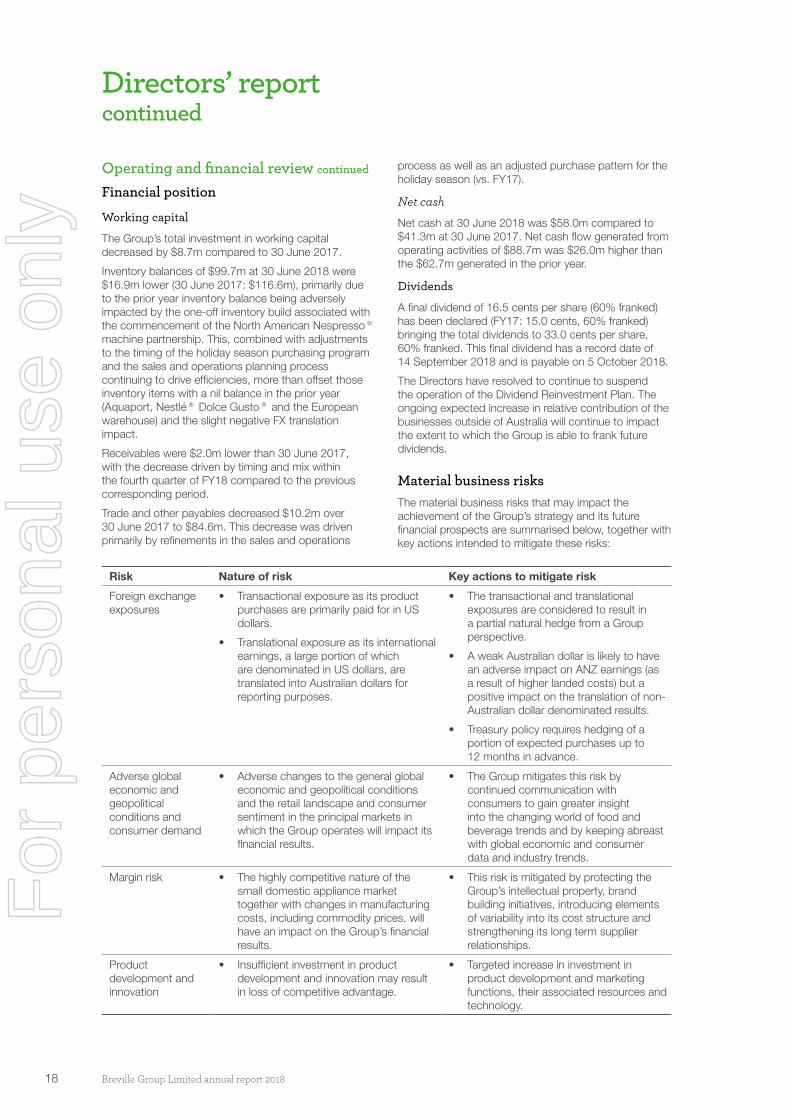
Material business risksThe material business risks that may impact the achievement of the Group’s strategy and its future financial prospects are summarised below, together with key actions intended to mitigate these risks:
Operating and financial review continued
Directors’ report continued
Risk Nature of risk Key actions to mitigate risk
Foreign exchange exposures
• Transactional exposure as its product purchases are primarily paid for in US dollars.
• Translational exposure as its international earnings, a large portion of which are denominated in US dollars, are translated into Australian dollars for reporting purposes.
• The transactional and translational exposures are considered to result in a partial natural hedge from a Group perspective.
• A weak Australian dollar is likely to have an adverse impact on ANZ earnings (as a result of higher landed costs) but a positive impact on the translation of non-Australian dollar denominated results.
• Treasury policy requires hedging of a portion of expected purchases up to 12 months in advance.
Adverse global economic and geopolitical conditions and consumer demand
• Adverse changes to the general global economic and geopolitical conditions and the retail landscape and consumer sentiment in the principal markets in which the Group operates will impact its financial results.
• The Group mitigates this risk by continued communication with consumers to gain greater insight into the changing world of food and beverage trends and by keeping abreast with global economic and consumer data and industry trends.
Margin risk • The highly competitive nature of the small domestic appliance market together with changes in manufacturing costs, including commodity prices, will have an impact on the Group’s financial results.
• This risk is mitigated by protecting the Group’s intellectual property, brand building initiatives, introducing elements of variability into its cost structure and strengthening its long term supplier relationships.
Product development and innovation
• Insufficient investment in product development and innovation may result in loss of competitive advantage.
• Targeted increase in investment in product development and marketing functions, their associated resources and technology.
For
per
sona
l use
onl
y

19Breville Group Limited annual report 2018
Group strategic acceleration program updateDuring FY18, the Group has continued to progress through its acceleration program, the impacts of which have helped drive the FY18 improved operating performance.
Product
The Group is widening its aperture from specific new product development innovation to the commercialisation of a range within the category. We are expanding our thinking to account for differing customer requirements, thereby extending the applicability of innovations and ultimately improving our return on investment, while simultaneously growing the end market.
We now have the ability to deliver a range with a common look and feel, offering retailers a more compelling range presentation opportunity and allowing customers to have a truly coordinated kitchen.
The Group is now leveraging innovations through the product range. For example, the ThermoJet™ heating system, currently available in three products, has been added into a further two products, due for release in the first half FY19: the Barista Express™ Pro and the Bambino™ Plus. In addition, the core technology in our oven range, Element IQ®, is being applied to our new pizza oven, the Smart Oven™ Pizzaiolo, planned for launch in the USA for the 2018 holiday period.
Market
The Group Brand Platform, a fundamental building block in our go-to-market process, has been completed with updated vision, mission, and guiding principles.
The Smart Oven™ Pizzaiolo represents the Group’s first ever “Brand Launch”.
• The marketing program for the Smart Oven™ Pizzaiolo began in April 2018, six months before the intended launch. Leading Pizzaiolos (pizza chefs) and professional chefs stress tested the product and announced to their followers that something special was coming.
• We are currently in the second phase of the Brand Launch program. The Pizzaiolo microsite is now live (http://www.smartovenpizzaiolo.breville.com/us), enabling early adopters to sign up for updates and the press to learn about the product. As we progress through this phase, we will execute a digital campaign targeting early adopters, seed social pizza communities, and unveil the product at IFA in Europe.
We launched the Sage® brand into Germany and Austria on 1 April 2018. Whilst still in the early stages, we are currently trading through approximately 600 retail locations, and we are making appropriate in-store investments. Importantly, commencing 1 January 2019, Sage® will begin selling the Creatista® range in Germany and Austria.
The Group continues to make progress on its strategy of unifying Europe under the Sage® brand. Existing European Sage® Distributors are now buying product directly from our European warehouse instead of Hong Kong. In addition, we expect to enter Benelux and Switzerland by the end of FY19. Given that we have an existing ROW customer in this territory, we believe the changeover will have a one off negative EBIT impact of approximately $1.0m in FY19.
Scalable, global platform
The Group has made signification progress during FY18 in delivering a scalable global platform, which included:
• Improved organisational capability by appointing a new Chief Financial Officer, Chief Technology Officer, Australian Head of Sales and North American Head of Sales Operations;
• Completed the transition to a third party logistics model in all geographies;
• Fully automated the operational transaction flow in Germany and Austria;
• Commenced the phasing in of both product serialisation and retailer co-planning;
• Rolling out chat for customer service;
• Our improved website is now live in USA, UK, Canada and Australia; and,
• The implementation of a retail sell out system: ANZ is currently live with North America due to go live shortly.
Acceleration program performance
We continue to see improvement in the inventory metric. In the underlying business (excluding new additions to the business that did not have twelve months of sales), inventory as a percentage of cost of sales at 30 June 2018 represents 24.7% of the last twelve months of cost of sales compared to 29.3% as at 30 June 2017.
As a result of portfolio remixing and efficiency efforts, the Distribution segment has experienced a turnaround and delivered a positive year over year EBIT performance.
The acceleration program has been in place for three years, with highlights as follows:
• Revenue and EBIT have grown approximately 24% (FY18 compared to FY15);
• The EBIT growth rate of 10.0% in FY18 compares to 7.2% in FY17, 5.9% in FY16 and (1.2%) in FY15;
• Marketing and R&D spend as a percentage of net sales represents 10.5% in FY18 compared to 9.5% in FY17 and 8.5% in FY16; and
• The growth has been achieved without increasing inventory levels or the number of employees.
Operating and financial review continued
For
per
sona
l use
onl
y

20 Breville Group Limited annual report 2018
Our commitment to sustainability and social responsibility The Group is committed to ethical, responsible and sustainable conduct across the entire business and acknowledges the importance of respecting our stakeholders, including employees, shareholders, customers and suppliers. In order to ensure this commitment is being met, the Group has a sustainability committee and a sustainability co-ordinator to drive initiatives. This committee is comprised of representatives from each area of the business in order to ensure sustainability issues company-wide are addressed. The role of this committee is to discuss all matters relating to sustainability and make strategic decisions regarding the Group’s approach to sustainability.
People
The Group enjoys the benefits of a highly experienced and talented team across all departments and geographies. Underpinning Breville’s food thinking culture, the passion, creativity and insight of employees is critical to consistently delivering world-class innovative products to consumers. The team continues to be acknowledged both domestically and internationally, with multiple design awards, and recognition through mainstream media.
The Group invests in the training and education of its team, building strong, collaborative links with world experts in food thinking and technology.
Strongly committed to its core values of creativity, simplicity, insight and excellence in all departments, the Group recruits, trains, assesses and rewards employees on this basis. With a team anchored around these common values, the business is able to foster a workplace that stimulates idea generation, a passion for learning, and the continuous search for new and better solutions.
The Group advocates diversity in its workforce, recognising the new thinking and innovation that it brings to the business. The Group believes that it is important for all team members to enjoy a workplace which is free from any form of discrimination; strongly supporting gender, age, sexual orientation, disability and cultural diversity at work.
Ensuring a safe workplace is another key area of focus and the Group strives for continuous improvement and consistency in safety practices across all departments and geographies.
Environment
Energy, packaging and waste are our key environmental impact areas. The Group is striving to incorporate sustainable decisions into operational facilities such
as the head office in Australia, and has a number of energy efficient features to reduce energy
usage including movement and light sensors to minimise use of lighting, limitations/timers on plant use (air conditioning, heating) and measurement of power usage. In the Group’s Australian warehouse, lighting power consumption has been reduced significantly through
the very successful daylight harvesting program which provides excellent natural
lighting. The Group will continue its focus and investment on energy efficient operations.
In Australia, the Group is a committed signatory to the Australian Packaging Covenant, a voluntary
agreement between government and industry which provides a framework for
the reduction of the potential impact of products, packaging and warehouse operations on the environment. The Group integrates actions and goals into existing business systems so that sustainable packaging considerations
become ‘just how we do business’. Success is being achieved via cross
functional teams working together to implement the Group’s Sustainable Packaging
Policy.
The Group has implemented improved waste reduction and recycling practices including
recycling of cardboard, paper, plastics and organic waste.
Business
Ethical sourcing
The Group is committed to conducting business in a socially responsible manner
and managing its business to reflect high ethical and moral values. The Group expects that
its supply partners will not be a party to any violation of basic Human Rights including:
• freedom from discrimination
• freedom from slavery or servitude
• freedom of movement
• freedom of expression
• freedom of thought.
The Group expects its supply partners to respect and adhere to the same
philosophy in the operation and management of their businesses and reserves the right not
to do business with vendors that do not share and demonstrate commitment to compliance with local and internationally accepted labour and employment laws.
Directors’ report continued
Operating and financial review continued
PeopleAttraction & retention
Development
Reward & recognition
Workplace safety
Diversity
CommunityCharitable donations
Community engagement
EnvironmentEnergy and emissions
Packaging stewardship
Waste and recycling
BusinessEthical sourcing
principles and policies
Vendor audits
Product responsibility
Anti-bribery and corruption
For
per
sona
l use
onl
y

21Breville Group Limited annual report 2018
The Group has an ethical sourcing policy which includes an ethical sourcing requirements code (‘code’) which sets out the minimum requirements and expectations that all vendors, including sub-contractors engaged by vendors, must comply with. The code specifies compliance in areas such as:
• wages, benefit policies (including transparent record keeping)
• child labour
• working hours
• forced and bonded labour
• discrimination
• harassment and abuse
• freedom of association
• health and safety
• environmental practices
• business integrity.
The company has zero tolerance for the use of child labour, prison labour or forced labour in the manufacture of its products.
Suppliers are required to contractually recognise the code and acknowledge their acceptance of its requirements. New key suppliers are required to undergo an independent audit to verify that they are in compliance with local laws and safety conditions.
The Group recognises the difficulties in dealing with a large and complex supply chain and therefore is dedicated to integrating ethics into its core business practices and continuously investing in its ethical sourcing program.
Vendor Audits
The Group conducts factory visits to vendors by senior management on a regular basis, as well as using internationally recognised independent audit firms to verify compliance with local laws and safety conditions as well as the Breville Group ethical sourcing policy. When an independent audit firm is engaged, an ethical trade audit report is issued, which is to an industry recognised standard.
The vendor audit conducted assesses the following areas:
• Labour Standards
• Health and Safety
• Environment
• Business Ethics
The scope of the vendor audits provides coverage (using a sample based method) of all workers at each site, including direct employees, agency workers and workers employed by service providers or provided by other contractors, in order to determine compliance by the vendor.
Vendor compliance is assessed and determined according to the following compliance metrics:
• the Ethical Trading Initiative (ETI) Base Code
• the Group’s ethical sourcing policy
• assessment of management systems
• assessment of entitlement to work and immigration
• assessment of sub-contracting
• assessment of environment and;
• assessment of business ethics.
30 June 2018
Target for June 2023
Vendor audits completed 5 10
This financial year, the Group performed audits on 5 individual vendors. The Group has set a target to increase vendor audits from 5 to 10 per annum over a 5-year period to June 2023. Each year, the vendors selected for audit will be based on the Group’s internal risk assessment framework which takes into consideration the size of the vendor, levels of purchases made and results from previous audits conducted. Vendors are audited on a rotational basis over a multi-year period taking these factors into consideration.
For those vendors which have been audited, a rating system has been applied and based on the results of the audit, each vendor is given a vendor audit rating. Based on the vendor compliance metrics above, the Group has defined an internal ‘baseline’ standard which defines the minimum level of compliance expected from any vendor. This baseline is subsequently used to benchmark the results of vendor audits to determine the outcome of the rating awarded. Vendors who meet, exceed or greatly exceed the Group’s internal ‘baseline’ standard can be rated bronze, silver or gold (gold being the highest rating). Higher ratings are awarded as a direct result of lower occurrences and severity of non-compliances found in the audit.
Operating and financial review continued
Our commitment to sustainability and social responsibility continued
Gold
Silver
Bronze
Below standard
BASELINEFor
per
sona
l use
onl
y

22 Breville Group Limited annual report 2018
Directors’ report continued
The severity of each non-compliance, and hence the rating of the vendor, is decided by the Group’s sustainability committee in accordance with the compliance metrics above. Vendors who do not meet the Group’s internal ‘baseline’ standard are categorised into a ‘below standard’ category and are actively monitored to ensure all remediate action is taken against identified non-compliance in the most effective and efficient method possible. Evidence of corrective action to remediate non-compliance is collated through inquiry, inspection and follow-up observation. Where the Group requires zero tolerance or where the vendor or factory does not demonstrate a willingness to comply, the Group reserves the right to discontinue doing business with the vendor/factory.
Product responsibility
The Group takes pride in the quality of its products. The Group has extensive compliance processes in place to ensure that its products are safe and compliant with labelling and safety requirements in relevant markets.
Anti-bribery and corruption
The Group is committed to operating in a manner consistent with the laws of the jurisdictions in which its businesses operate, including those relating to anti-bribery and corruption. Honesty, integrity and trust are considered integral to the ethos of the Group, its products and its brands. Conduct associated with bribery and corruption is inconsistent with these values. Accordingly, the Group adopts a “zero tolerance” approach in relation to these matters.
The Group has an anti-bribery policy which, in conjunction with the code of conduct and whistleblowing policy, sets out the responsibilities of all the Group’s employees (including contractors) and directors with regard to dealing with outside parties and prohibits all Group personnel in all jurisdictions in which the company operates or conducts commercial activities, from engaging in any activity that constitutes bribery or corruption and other improper inducements and/or payments.
In order to ensure that these values and the policy are properly adhered to, the Group has appointed an Anti-Bribery Compliance Officer who is responsible for monitoring the application of this policy.
Risk management
The company’s risk management is discussed in the corporate governance statement on page 43.
Dividends
The following dividends have been paid, declared or recommended since the end of the preceding year.
Cents per ordinary
share $’000
Final dividend recommended: 16.5 21,466
Dividends paid in the year:
Interim FY18 dividend paid 16.5 21,466
Final FY17 dividend paid 15.0 19,514
Significant changes in the state of affairs
There were no significant changes in the state of affairs of the consolidated entity that occurred during the year that have not otherwise been disclosed in this report or the consolidated financial statements.
Directors’ interests
As at the date of this report, the interests of the directors in the shares or other instruments of Breville Group Limited were:
Ordinary shares
S. Fisher 100,288
T. Antonie 28,286
S. Herman 30,000
D. Howell 120,000
L. Myers 200,000
K. Wright 15,000
Operating and financial review continued
Our commitment to sustainability and social responsibility continued
For
per
sona
l use
onl
y
23Breville Group Limited annual report 2018
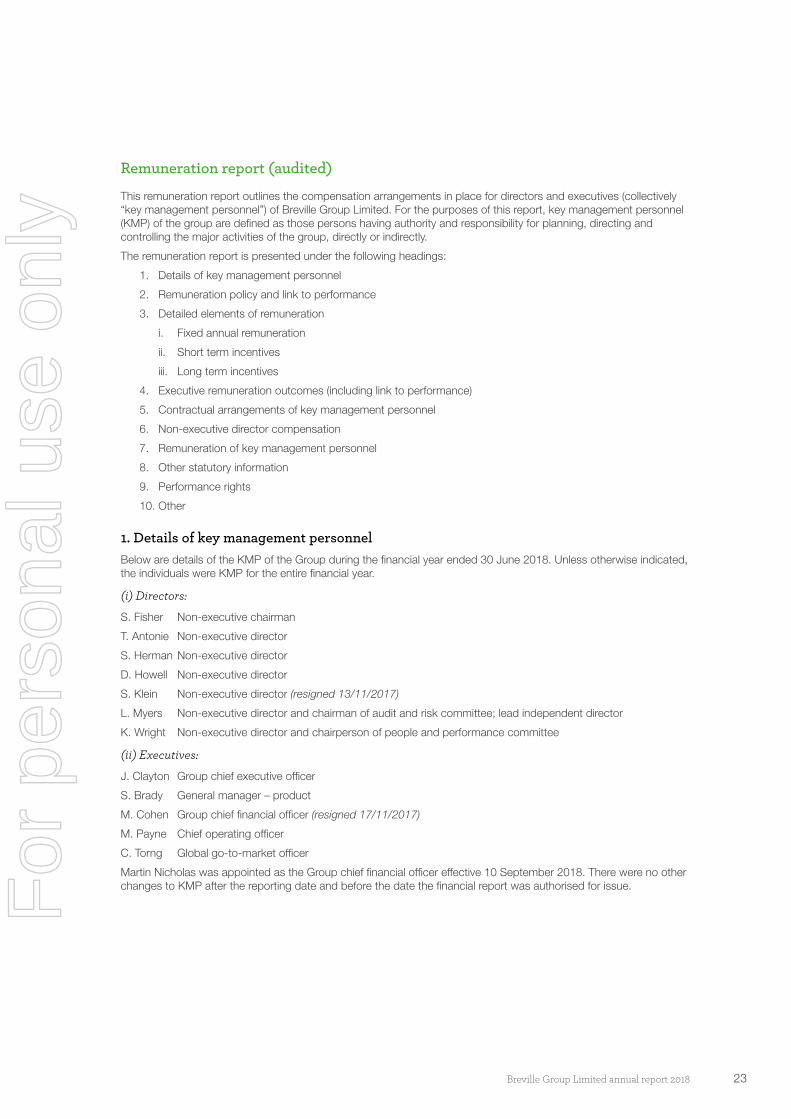
Remuneration report (audited)
This remuneration report outlines the compensation arrangements in place for directors and executives (collectively “key management personnel”) of Breville Group Limited. For the purposes of this report, key management personnel (KMP) of the group are defined as those persons having authority and responsibility for planning, directing and controlling the major activities of the group, directly or indirectly.
The remuneration report is presented under the following headings:
1. Details of key management personnel
2. Remuneration policy and link to performance
3. Detailed elements of remuneration
i. Fixed annual remuneration
ii. Short term incentives
iii. Long term incentives
4. Executive remuneration outcomes (including link to performance)
5. Contractual arrangements of key management personnel
6. Non-executive director compensation
7. Remuneration of key management personnel
8. Other statutory information
9. Performance rights
10. Other
1. Details of key management personnelBelow are details of the KMP of the Group during the financial year ended 30 June 2018. Unless otherwise indicated, the individuals were KMP for the entire financial year.
(i) Directors:
S. Fisher Non-executive chairman
T. Antonie Non-executive director
S. Herman Non-executive director
D. Howell Non-executive director
S. Klein Non-executive director (resigned 13/11/2017)
L. Myers Non-executive director and chairman of audit and risk committee; lead independent director
K. Wright Non-executive director and chairperson of people and performance committee
(ii) Executives:
J. Clayton Group chief executive officer
S. Brady General manager – product
M. Cohen Group chief financial officer (resigned 17/11/2017)
M. Payne Chief operating officer
C. Torng Global go-to-market officer
Martin Nicholas was appointed as the Group chief financial officer effective 10 September 2018. There were no other changes to KMP after the reporting date and before the date the financial report was authorised for issue.F
or p
erso
nal u
se o
nly

24 Breville Group Limited annual report 2018
2. Remuneration policy and link to performanceThe people and performance committee of the board of directors of the company is responsible for reviewing and recommending to the board executive and employee remuneration arrangements and executive succession as set out in the people and performance committee charter.
The committee reviews and determines the remuneration policy and structure annually to ensure it remains aligned to strategic goals and meets company remuneration principles. The group chief executive officer makes recommendations to the people and performance committee for consideration. From time to time the committee may also engage external remuneration consultants to assist with this review. No such external consultants were engaged for the year ended 30 June 2018.
The proportion of the fixed compensation and variable compensation (potential short term and long term incentives) is established for each executive by the people and performance committee and approved by the board.
In particular, the board aims to ensure that remuneration practices:
• Provide competitive total rewards (for fixed and variable compensation) to attract and retain high calibre employees;
• Link reward to sustained growth in shareholder value from dividends and growth in share price and the delivery of a consistent return on assets;
• Link rewards with the strategic goals and performance of the company;
• Reinforce a competitive business strategy to deliver organisational success and enhanced shareholder value; and
• Provide transparency and are easily understood.
Employment contracts are entered into with executives. Details of the contracts are provided on page 30.
Prohibition on hedging by key management personnel
The Group has adopted a policy which prohibits key management personnel and their closely related parties from entering into an arrangement that has the effect of limiting the exposure of a member of the key management personnel to risk relating to an element of that member’s compensation. The policy complies with the requirements of s.206J of the Corporations Act 2001.
Directors’ report continued
Remuneration report (audited) continued
For
per
sona
l use
onl
y
25Breville Group Limited annual report 2018
Table 1: Remuneration framework
Element Purpose Performance metrics
Potential value FY18 impact
Fixed remuneration Provide competitive market salary including superannuation and non-monetary benefits
None Appropriate to position and competitive in the market
Reviewed annually based on company and individual performance, market compensation, internal relativities and external advice where appropriate
Short term incentives (STI)
Reward executives and other employees on the achievement of company and individual value adding performance objectives assessed annually
Financial objectives for both the Group and business units, determined on an individual basis, aligned to enhance shareholder value
Depending on position and seniority, employees are eligible for an annual incentive of between 5% and 50% of their fixed or base annual remuneration, which is dependent on achievement of financial objectives. This may be subject to a multiplier in accordance with a sliding scale
STI only payable where the target Group EBIT is met, regardless of whether other objectives are achieved
Long term incentives (LTI)
Reward executives and other employees in alignment with creation of shareholder value
Time based and performance based hurdles
Depending on position and seniority, employees are eligible for an LTI award of between 10% and 87.5% of their fixed annual remuneration
Total shareholder Return (‘TSR’) hurdle for FY18 grants
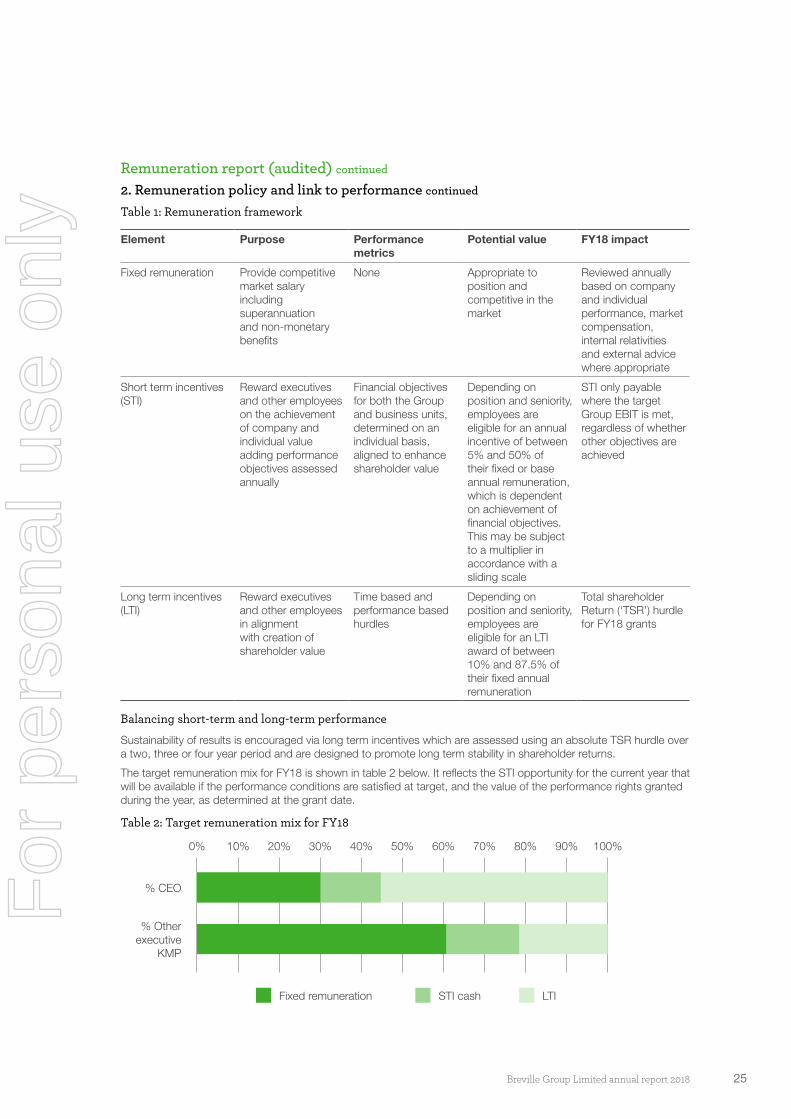
Balancing short-term and long-term performance
Sustainability of results is encouraged via long term incentives which are assessed using an absolute TSR hurdle over a two, three or four year period and are designed to promote long term stability in shareholder returns.
The target remuneration mix for FY18 is shown in table 2 below. It reflects the STI opportunity for the current year that will be available if the performance conditions are satisfied at target, and the value of the performance rights granted during the year, as determined at the grant date.
Table 2: Target remuneration mix for FY18
% CEO
% Other executive
KMP
0% 10% 20% 30% 40% 50% 60% 70% 80% 90% 100%
Fixed remuneration STI cash LTI
Remuneration report (audited) continued
2. Remuneration policy and link to performance continued
For
per
sona
l use
onl
y

26 Breville Group Limited annual report 2018
Assessing performance and cancellation of unvested performance rights
The people and performance committee is responsible for assessing performance against KPIs and determining the STI and LTI to be awarded. To assist in this assessment, the committee receives detailed reports on performance from management which are based on independently verifiable data. In the event of fraudulent or dishonest misconduct, the board may deem any unvested rights to have lapsed.
3. Detailed elements of remuneration
i) Fixed annual remuneration
Executives receive their fixed remuneration in cash or other non-cash benefits. Fixed remuneration is reviewed annually by the people and performance committee, or on role change. The committee reviews company and individual performance, relevant comparative market compensation, considers internal relativities and, where appropriate, external advice on policies and practices.
ii) Short term incentives (STI)
The Group operates an annual STI program available to executives and other employees and awards a cash incentive subject to attainment of clearly defined Group and business unit objectives.
Who participates? Executives and other employees
How is STI delivered?
Cash
What is the STI opportunity?
Executives and other employees are eligible for an annual incentive of between 5% and 50% of fixed or base annual remuneration. The incentive payment is based on the achievement of certain financial and non-financial objectives which if satisfied, apply a multiplier in accordance with a sliding scale.
What are the performance conditions for each financial year?
The STI rewards executives and other employees for their contribution to achievement of Group financial outcomes. Actual STI payments are awarded to each executive or employee depending on the extent to which specific financial key performance indicators (KPI’s) are met.
Regardless of achievement of other KPI’s, if the Group earnings before interest and taxation (EBIT) hurdle is not achieved, no STI is payable.
Other financial and non-financial KPI’s are specific to each participant, depending on their role. Financial performance measures were chosen as they represent the key drivers for short term success of the business and provide a framework for providing long-term value.
How is performance assessed?
At the end of the financial year and after consideration of performance against KPI’s:
• the people and performance committee recommends the amount of STI to be paid to the group chief executive officer for board approval; and
• for the other executives and employees, the people and performance committee will seek recommendations from the group chief executive officer as appropriate.
The group chief executive officer may recommend to the people and performance committee and the board, discretionary bonuses to recognise and reward key contributions from high performing executives and employees.
Remuneration report (audited) continued
2. Remuneration policy and link to performance continued
Directors’ report continued
For
per
sona
l use
onl
y

27Breville Group Limited annual report 2018
iii) Long term incentives (LTI)
The objective of the LTI plan is to reward executives and other employees in a manner that aligns this element of compensation with the creation of shareholder value.
Who participates? The LTI plan is only made available to executives and other employees (participants) who are able to influence the generation of shareholder value and have a direct impact on the company’s performance against relevant long-term performance hurdles.
LTI grants to participants (excluding the group chief executive officer) are recommended by the group chief executive officer to the people and performance committee. This recommendation, together with a recommendation by the people and performance committee of an LTI grant to the group chief executive officer, is then put to the board for approval.
How is LTI delivered?
Upon satisfaction of the performance hurdles, the performance rights will vest and be converted into fully paid ordinary shares in the company.
What is the LTI opportunity?
Depending upon their position and seniority in the organisation, executives and other employees are eligible for an annual LTI award of between 10% - 87.5% of their fixed annual remuneration.
What are the performance hurdles for the FY18 LTI grant?
The Group uses TSR as the performance measure for the LTI plan, applying both an absolute and relative test.
The absolute test requires that over the testing period, the TSR needs to be positive. If the TSR is negative over the testing period then the performance rights lapse.
If the TSR is positive, the Group then uses a relative TSR compared to a defined peer group extracted from the S&P/ASX200.
The Group’s percentile TSR performance is determined according to the Group’s TSR performance ranking against the companies in the TSR peer group over each tranche’s performance period.
The vesting schedule is as follows:
The Group (BRG) TSR performance ranking relative to peer group
Proportion of performance rights that will vest
Below 51st percentile 0%
51st percentile 50%
Between 51st and 75th percentile Pro rata between 50% and 100%, based on the relative TSR performance
75th percentile and above 100%
Each tranche of the above performance award will be measured independently. If any tranche does not achieve its vesting conditions, that tranche shall lapse but this shall not preclude the other tranches from vesting should their respective performance conditions be met.
The absolute positive TSR was selected to ensure that absolute wealth creation is always aligned between shareholders and executives. Relative TSR was selected as the LTI performance measure as TSR provides alignment between comparative shareholder return and reward for executives.
In addition to the grant of performance rights with a TSR hurdle, certain performance rights may be granted where the performance condition is continuing employment with the company to vesting date, or meeting an internal KPI measure.
How will performance be assessed for the FY18 LTI grant?
TSR performance is calculated by an independent external adviser at the end of each performance period. Table 9 on page 35 provides details of the KMP performance rights under this plan.
Remuneration report (audited) continued
3. Detailed elements of remuneration continued
For
per
sona
l use
onl
y
28 Breville Group Limited annual report 2018
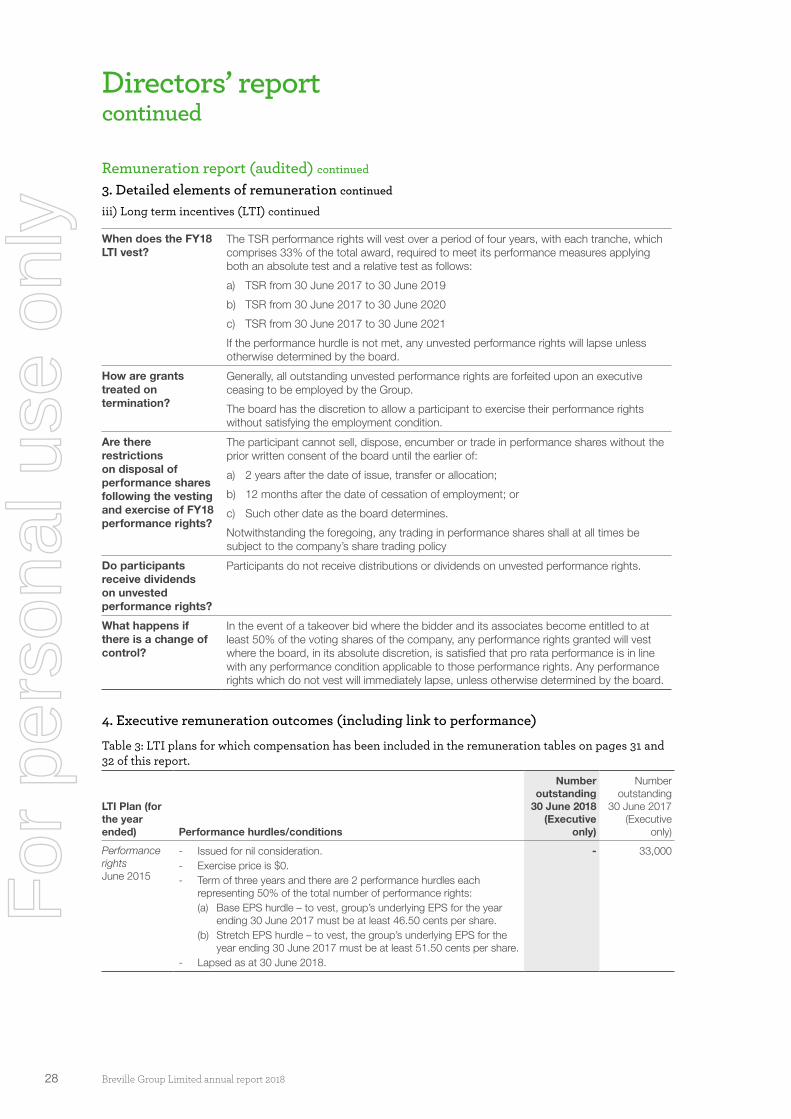
When does the FY18 LTI vest?
The TSR performance rights will vest over a period of four years, with each tranche, which comprises 33% of the total award, required to meet its performance measures applying both an absolute test and a relative test as follows:
a) TSR from 30 June 2017 to 30 June 2019
b) TSR from 30 June 2017 to 30 June 2020
c) TSR from 30 June 2017 to 30 June 2021
If the performance hurdle is not met, any unvested performance rights will lapse unless otherwise determined by the board.
How are grants treated on termination?
Generally, all outstanding unvested performance rights are forfeited upon an executive ceasing to be employed by the Group.
The board has the discretion to allow a participant to exercise their performance rights without satisfying the employment condition.
Are there restrictions on disposal of performance shares following the vesting and exercise of FY18 performance rights?
The participant cannot sell, dispose, encumber or trade in performance shares without the prior written consent of the board until the earlier of:
a) 2 years after the date of issue, transfer or allocation;
b) 12 months after the date of cessation of employment; or
c) Such other date as the board determines.
Notwithstanding the foregoing, any trading in performance shares shall at all times be subject to the company’s share trading policy
Do participants receive dividends on unvested performance rights?
Participants do not receive distributions or dividends on unvested performance rights.
What happens if there is a change of control?
In the event of a takeover bid where the bidder and its associates become entitled to at least 50% of the voting shares of the company, any performance rights granted will vest where the board, in its absolute discretion, is satisfied that pro rata performance is in line with any performance condition applicable to those performance rights. Any performance rights which do not vest will immediately lapse, unless otherwise determined by the board.
Remuneration report (audited) continued
3. Detailed elements of remuneration continued
iii) Long term incentives (LTI) continued
4. Executive remuneration outcomes (including link to performance)
Table 3: LTI plans for which compensation has been included in the remuneration tables on pages 31 and 32 of this report.
LTI Plan (for the year ended) Performance hurdles/conditions
Number outstanding
30 June 2018 (Executive
only)
Number outstanding
30 June 2017 (Executive
only)
Performance rights June 2015
- Issued for nil consideration.- Exercise price is $0.- Term of three years and there are 2 performance hurdles each
representing 50% of the total number of performance rights:(a) Base EPS hurdle – to vest, group’s underlying EPS for the year
ending 30 June 2017 must be at least 46.50 cents per share.(b) Stretch EPS hurdle – to vest, the group’s underlying EPS for the
year ending 30 June 2017 must be at least 51.50 cents per share.- Lapsed as at 30 June 2018.
- 33,000
Directors’ report continued
For
per
sona
l use
onl
y

29Breville Group Limited annual report 2018
Remuneration report (audited) continued
4. Executive remuneration outcomes (including link to performance) continued
Table 3: LTI plans for which compensation has been included in the remuneration tables on pages 31 and 32 of this report continued
LTI Plan (for the year ended) Performance hurdles/conditions
Number outstanding
30 June 2018 (Executive
only)
Number outstanding
30 June 2017 (Executive
only)
Performance rights June 2016
- Issued for nil consideration.- Exercise price is $0.- Term of two to four years with vesting as follows, each representing
33% of the total number of performance rights:(a) Total shareholder return (TSR) from 30 June 2015 to 30 June 2017
applying both an Absolute Test and a Relative Test.(b) Total shareholder return (TSR) from 30 June 2015 to 30 June 2018
applying both an Absolute Test and a Relative Test.(c) Total shareholder return (TSR) from 30 June 2015 to 30 June 2019
applying both an Absolute Test and a Relative Test.- 33% vested as at 30 June 2018 (16,860 lapsed).
55,520 108,700
- Issued for nil consideration- Exercise price is $0.- Participant must be employed by the company on 31 December 2018.- 0% vested at 30 June 2018.
30,100 30,100
- Issued for nil consideration- Exercise price is $0.- Participant must be employed by the company on 25 January 2019.- 0% vested at 30 June 2018.
44,350 44,350
- Issued for nil consideration- Exercise price is $0.- Participant must be employed by the company on 25 January 2020.- 0% vested at 30 June 2018.
44,350 44,350
Performance rightsJune 2017
- Issued for nil consideration.- Exercise price is $0.- Term of two to four years with vesting as follows, each representing
33% of the total number of performance rights:(a) Total shareholder return (TSR) from 30 June 2016 to 30 June 2018
applying both an Absolute Test and a Relative Test.(b) Total shareholder return (TSR) from 30 June 2016 to 30 June 2019
applying both an Absolute Test and a Relative Test.(c) Total shareholder return (TSR) from 30 June 2016 to 30 June 2020
applying both an Absolute Test and a Relative Test.- 0% vested as at 30 June 2018 (22,500 lapsed).
165,600 188,100
Performance rightsJune 2018
- Issued for nil consideration.- Exercise price is $0.- Term of two to four years with vesting as follows, each representing
33% of the total number of performance rights:(a) Total shareholder return (TSR) from 30 June 2017 to 30 June 2019
applying both an Absolute Test and a Relative Test.(b) Total shareholder return (TSR) from 30 June 2017 to 30 June 2020
applying both an Absolute Test and a Relative Test.(c) Total shareholder return (TSR) from 30 June 2017 to 30 June 2021
applying both an Absolute Test and a Relative Test.- 0% vested as at 30 June 2018.
144,900 -
- Issued for nil consideration.- Exercise price is $0.- Participant must be employed by the company on 30 June 2020.- 0% vested at 30 June 2018.
60,000 -
For
per
sona
l use
onl
y

30 Breville Group Limited annual report 2018
Remuneration report (audited) continued
4. Executive remuneration outcomes (including link to performance) continued
Statutory performance indicators
The objective is to align executive remuneration to the Group’s strategic and business objectives and the creation of shareholder wealth. Table 4 below shows measures of the Group’s performance over the last 5 years as required by the Corporations Act 2001. However these are not necessarily consistent with the measures used in determining the variable amounts of remuneration to be awarded to executives. As a consequence, there may not always be a direct correlation between the statutory key performance measures and the variable remuneration awarded.
Table 4: Group performance over the past five years
Year ended30 June
201430 June
201530 June
201630 June
201730 June
2018
Group gross profit ($m) 176.19 171.19 188.98 200.27 232.26
Group earnings before interest and tax ($m) 70.45 69.60 73.73 79.02 86.91
Group net profit before tax ($m) 69.37 67.76 71.52 77.22 84.37
Basic earnings per share (cents) 37.5 35.9 38.6 41.4 45.0
Total dividends per share (cents) 27.00 27.00 28.50 30.50 33.00
Share price at 30 June ($) 8.11 6.21 7.49 10.45 11.62
The Group annual FY18 STI has financial targets based on Group earnings before interest and tax and other financial and non-financial measures. Since FY16 the LTI performance rights awarded use either TSR as the performance measure or they are based on a continuing employment condition.
5. Contractual arrangements of key management personnelNone of the key management personnel have fixed term employment contracts. Amounts payable on termination vary from a minimum statutory entitlement to a maximum of 12 months based on a calculation of total fixed remuneration (which includes base salary, superannuation and allowances (if applicable)). In accordance with the terms of the performance rights plan, any performance rights not vested at the date of termination will be forfeited and shall lapse, unless otherwise determined by the board.
6. Non-executive director compensationIn accordance with best practice corporate governance, the structure of non-executive director and executive compensation is separate and distinct.
Objective
The board seeks to set compensation at a level which provides the company with the ability to attract and retain directors of high calibre whilst maintaining a level commensurate with companies of a similar size and type.
Structure
The Constitution and the ASX Listing Rules specify that the aggregate compensation of non-executive directors shall be determined from time to time by general meeting. The aggregate compensation of $1,400,000 per year was approved by shareholders at the annual general meeting held in November 2016.
The compensation of non-executive directors is reviewed annually. Each director receives a fee for being a director of the company. An additional fee is also paid to each director who also acts as chairman of a board committee. The payment of additional fees for acting as chairman of a committee recognises the additional time commitment required by the director to facilitate the running of the committee.
The compensation of non-executive directors for the year ended 30 June 2018 is detailed in Table 5 on page 31 of this report.
Directors’ report continued
For
per
sona
l use
onl
y

31Breville Group Limited annual report 2018
7. Remuneration of key management personnel
Table 5: Remuneration for the year ended 30 June 2018
Remuneration report (audited) continued
Short-term employee benefits
Post-em-ployment benefits
Long-term
employee benefits
Share-based
payment Total
Fixedremu-
nerationPerformance
related
Salary & fees
Cash bonuses Other
Total short term
employee benefits
Super- annuation
Long service
leave
Per-formance
rights STI LTI
$ $ $ $ $ $ $ $ % % %
Non-executive directors
S. Fisher – chairman 273,971 - - 273,971 26,027 - - 299,998 100% - -
T. Antonie 112,784 - - 112,784 10,715 - - 123,499 100% - -
S. Herman 112,784 - - 112,784 10,715 - - 123,499 100% - -
D. Howell 112,784 - - 112,784 10,715 - - 123,499 100% - -
S. Klein (a) 45,619 - - 45,619 - - - 45,619 100% - -
L. Myers 126,484 - - 126,484 12,016 - - 138,500 100% - -
K. Wright 126,484 - - 126,484 12,016 - - 138,500 100% - -
Sub-total non-executive directors 910,910 - - 910,910 82,204 - - 993,114
Other key management personnel
S. Brady 426,621 116,955 30,000 573,576 42,714 7,343 68,936 692,569 73.16% 16.89% 9.95%
J. Clayton 875,000 350,865 - 1,225,865 25,000 18,532 423,180 1,692,577 54.27% 20.73% 25.00%
M. Cohen (b) 829,954 - 12,115 842,069 10,096 - (43,498) 808,667 105.38% - (5.38%)
M. Payne 517,853 139,927 38,617 696,397 - - 69,381 765,778 72.67% 18.27% 9.06%
C. Torng 479,951 136,448 - 616,399 20,049 8,243 178,735 823,426 61.72% 16.57% 21.71%
Sub-total executive KMP 3,129,379 744,195 80,732 3,954,306 97,859 34,118 696,734 4,783,017
Totals 4,040,289 744,195 80,732 4,865,216 180,063 34,118 696,734 5,776,131
Note
(a) S. Klein resigned on 13 November 2017. S. Klein is a principal of the legal firm SBA Law. His director’s fees (which are subject to GST) were paid to SBA Law and are shown above net of GST, up to the date of resignation.
(b) M. Cohen resigned on 17 November 2017 and ceased to be key management personnel on that date. Salary and fees include an ex-gratia payment paid to him on his resignation. Share-based payment for M. Cohen includes the write-back of unvested performance rights following the cessation of employment and the forfeiture and lapse of those rights.
For
per
sona
l use
onl
y

32 Breville Group Limited annual report 2018
7. Remuneration of key management personnel continued
Table 6: Remuneration for the year ended 30 June 2017
Remuneration report (audited) continued
Short-term employee benefits
Post-em-ployment
benefits
Long-term employee
benefits
Share-based
payment Total
Fixedremuner-
ationPerformance
related
Salary & fees
Cash bonuses Other
Total short term employee
benefitsSuper-
annuation
Long service
leave
Per-formance
rights STI LTI
$ $ $ $ $ $ $ $ % % %
Non-executive directors
S. Fisher – chairman 234,463 - - 234,463 22,274 - - 256,737 100% - -
T. Antonie 112,842 - - 112,842 10,720 - - 123,562 100% - -
S. Herman 108,521 - - 108,521 10,310 - - 118,831 100% - -
D. Howell 93,521 - - 93,521 25,310 - - 118,831 100% - -
S. Klein (a) 118,905 - - 118,905 - - - 118,905 100% - -
L. Myers 121,835 - - 121,835 11,574 - - 133,409 100% - -
K. Wright (b) 98,279 - - 98,279 9,336 - - 107,615 100% - -
Sub-total non-executive directors 888,366 - - 888,366 89,524 - - 977,890
Other key management personnel
S. Brady (c) 426,621 59,576 30,000 516,197 42,714 6,838 (13,561) 552,188 91.67% 10.79% (2.46%)
J. Clayton 770,000 158,869 - 928,869 30,000 12,341 170,318 1,141,528 71.16% 13.92% 14.92%
M. Cohen (c) 415,000 53,380 30,000 498,380 35,000 6,651 (26,745) 513,286 94.81% 10.40% (5.21%)
M. Payne 530,840 50,636 33,341 614,817 - - 41,028 655,845 86.02% 7.72% 6.26%
C. Torng 478,844 48,654 - 527,498 19,308 7,704 150,831 705,341 71.72% 6.90% 21.38%
Sub-total executive KMP 2,621,305 371,115 93,341 3,085,761 127,022 33,534 321,871 3,568,188
Totals 3,509,671 371,115 93,341 3,974,127 216,546 33,534 321,871 4,546,078
Note
(a) S. Klein is a principal of the legal firm SBA Law. His director’s fees (which are subject to GST) were paid to SBA Law and are shown above net of GST.
(b) K. Wright was appointed effective 1 September 2016.
(c) Share-based payment includes the reversal of non-cash expenditure following the lapse of unvested performance rights.
Directors’ report continued
For
per
sona
l use
onl
y

33Breville Group Limited annual report 2018
8. Other statutory information
Table 7: Other key management personnel cash bonuses and share-based compensation
Cash bonuses Share-based compensation
Name % Earned % Forfeited Year
granted% Vested
2018% Forfeited
2018
S. Brady 2018 78.00% 22.00% 2018 - -
2017 39.72% 60.28% 2017 - -
J. Clayton 2018 78.00% 22.00% 2018 - -
2017 39.72% 60.28% 2017 - -
M.Cohen 2018 - - 2018 - -
2017 31.77% 68.23% 2017 - -
M. Payne 2018 74.10% 25.90% 2018 - -
2017 27.80% 72.20% 2017 - -
C. Torng 2018 78.00% 22.00% 2018 - -
2017 27.80% 72.20% 2017 - -
Table 8: Shareholdings of key management personnel
Ordinary shares held* in Breville Group Limited (number)
30 June 2018Balance at 1 July 2017
On exercise of performance rights Net change other (a)
Balance at 30 June 2018
DirectorsS. Fisher 92,288 - 8,000 100,288T. Antonie 20,753 - 7,533 28,286S. Herman 25,000 - 5,000 30,000D. Howell 120,000 - - 120,000S. Klein (b) 147,189 - (147,189) -L. Myers 200,000 - - 200,000K. Wright 5,000 - 10,000 15,000Other key management personnelS. Brady 350,732 8,770 - 359,502J. Clayton 160,000 10,100 - 170,100M. Cohen (c) 168,000 8,440 (176,440) -M. Payne - 5,340 11,315 16,655C. Torng - 3,670 - 3,670Total 1,288,962 36,320 (281,781) 1,043,501
* Held directly, indirectly or beneficially.
(a) All equity transactions with key management personnel have been entered into under terms and conditions no more favourable than those the Group would have adopted if dealing at arm’s length.
(b) S. Klein resigned on 13 November 2017.
(c) M. Cohen resigned on 17 November 2017.
Remuneration report (audited) continued
For
per
sona
l use
onl
y

34 Breville Group Limited annual report 2018
30 June 2017Balance at
1 July 2016On exercise of
performance rights Net change other (a)Balance at
30 June 2017DirectorsS. Fisher 70,288 - 22,000 92,288T. Antonie - - 20,753 20,753S. Herman 20,000 - 5,000 25,000D. Howell 110,000 - 10,000 120,000S. Klein 147,189 - - 147,189L. Myers 130,000 - 70,000 200,000K. Wright (b) - - 5,000 5,000Other key management personnelS. Brady 350,732 - - 350,732J. Clayton 135,000 - 25,000 160,000M. Cohen 168,000 - - 168,000M. Payne - - - -C. Torng - - - -Total 1,131,209 - 157,753 1,288,962
* Held directly, indirectly or beneficially.
(a) All equity transactions with key management personnel have been entered into under terms and conditions no more favourable than those the Group would have adopted if dealing at arm’s length.
(b) K. Wright was appointed effective 1 September 2016.
Remuneration report (audited) continued
8. Other statutory information continued
Table 8: Shareholdings of key management personnel continued
Directors’ report continued
For
per
sona
l use
onl
y

35Breville Group Limited annual report 2018
Remuneration report (audited) continued
9. Performance rights
Table 9: Performance rights granted
The terms and conditions of each grant of performance rights affecting remuneration of key management personnel in this financial year or future reporting years are as follows:
Grant Date
First exercise
date
Last exercise
date Expiry dateExercise
price
Fair value per performance right at grant
date ($) (Note 18)
Vested and exercised 30
June 2018
Vested and exercised 30
June 2017
12 Feb 16 (a)* 29 Aug 18 3 Oct 18 3 Oct 18 0.00 2.07 - -
12 Feb 16 (a)* 29 Aug 19 3 Oct 19 3 Oct 19 0.00 2.15 - -
12 Feb 16 (b) 31 Dec 18 31 Mar 19 31 Mar 19 0.00 4.56 - -
12 Feb 16 (c) 25 Jan 19 31 Mar 19 31 Mar 19 0.00 4.56 - -
12 Feb 16 (d) 25 Jan 20 31 Mar 20 31 Mar 20 0.00 4.35 - -
9 Aug 16 (e)* 29 Aug 18 3 Oct 18 3 Oct 18 0.00 3.43 - -
9 Aug 16 (e)* 29 Aug 19 3 Oct 19 3 Oct 19 0.00 3.49 - -
9 Aug 16 (e)* 31 Aug 20 2 Oct 20 2 Oct 20 0.00 3.51 - -
13 Nov 17 (f)* 29 Aug 19 1 Oct 19 1 Oct 19 0.00 7.05 - -
13 Nov 17 (f)* 28 Aug 20 1 Oct 20 1 Oct 20 0.00 6.81 - -
13 Nov 17 (f)* 27 Aug 21 1 Oct 21 1 Oct 21 0.00 6.68 - -
13 Nov 17 (g) 31 Aug 20 1 Oct 20 1 Oct 20 0.00 10.12 - -
*In addition to the TSR performance hurdle, the participant must be employed by the company on the vesting date.
(a) There are three equal tranches to be tested at 30 June 2017, 30 June 2018 and 30 June 2019 all with a total shareholder return hurdle (TSR) applying an absolute test and a relative test.
(b) Participant must be employed by the company on 31 December 2018.
(c) Participant must be employed by the company on 25 January 2019.
(d) Participant must be employed by the company on 25 January 2020.
(e) There are three equal tranches to be tested at 30 June 2018, 30 June 2019 and 30 June 2020 all with a total shareholder return hurdle (TSR) applying an absolute test and a relative test.
(f) There are three equal tranches to be tested at 30 June 2019, 30 June 2020 and 30 June 2021 all with a total shareholder return hurdle (TSR) applying an absolute test and a relative test.
(g) Participant must be employed by the company on 30 June 2020.
For
per
sona
l use
onl
y

36 Breville Group Limited annual report 2018
Table 10: Performance rights holdings of key management personnel
30 June 2018Balance
30 June 2017
Granted as remuneration
(a)Vested and
exercised Other (b)Balance
30 June 2018Other key management personnelS. Brady 64,700 16,300 (8,770) (15,000) 57,230J. Clayton 153,700 155,100 (10,100) - 298,700M. Cohen (c) 65,800 - (8,440) (57,360) -M. Payne 41,300 17,200 (5,340) - 53,160C. Torng 123,100 16,300 (3,670) - 135,730
448,600 204,900 (36,320) (72,360) 544,820
30 June 2017Balance
30 June 2016Granted as
remuneration (a)Vested and
exercised Other (b)Balance
30 June 2017Other key management personnelS. Brady 53,300 23,400 - (12,000) 64,700J. Clayton 60,200 93,500 - - 153,700M. Cohen (c) 58,300 22,500 - (15,000) 65,800M. Payne 16,000 25,300 - - 41,300C. Torng 99,700 23,400 - - 123,100
287,500 188,100 - (27,000) 448,600
(a) Performance awards granted during the year are subject to TSR performance hurdles and/or remaining in employment until date of vesting.
(b) Includes forfeitures and lapses.
(c) M. Cohen resigned on 17 November 2017 and ceased to be key management personnel on that date.
10. Other transactions and balances with key management personnel and their related parties servicesMr Klein is a principal of SBA Law and during his time as director, his director’s fees were paid to SBA Law. These fees were subject to GST. Mr. Klein resigned on 13 November 2017 and ceased acting as a non-executive director and ceased to be a related party on that date.
Fees totalling $127,335 (inclusive of GST), including Mr Klein’s director’s fees, were invoiced by SBA Law up to the date of resignation (year to 30 June 2017: $210,400). These fees were all on arm’s length terms.
Total amounts recognised at the reporting date in relation to other transactions and balances with key management personnel:
30 June 2018 $’000
30 June 2017 $’000
LiabilitiesCurrent liabilities - 31Total liabilities - 31ExpensesEmployee expenses (director’s fees) 46 119Professional fees 70 72Total expenses (GST exclusive) 116 191
Remuneration report (audited) continued
9. Performance rights continued
Directors’ report continued
For
per
sona
l use
onl
y

37Breville Group Limited annual report 2018
Directors’ meetings
The number of meetings of directors (including meetings of committees of directors) held during the year and the number of meetings attended by each director, or by each committee member, in the case of the audit and risk committee (A&RC) and the people and performance committee (P&PC), was as follows:
Full boardAudit & risk
(A&RC)
People and performance
(P&PC)Number of meetings 12 4 3S. Fisher 11(c) (a) (a)T. Antonie 12 (a) (a)S. Herman 12 (a) (a)D. Howell 12 4 3S. Klein (b) 5 (a) (a)L. Myers 12 4(c) 3K. Wright 12 4 3(c)
Board Committees
The current members, as at the date of this report, of the A&RC are L. Myers (chairperson), D. Howell and K. Wright.
The current members, as at the date of this report, of the P&PC are K. Wright (chairperson), D. Howell and L. Myers.
Notes
(a) Not a member of the relevant committee.
(b) S. Klein resigned on 13 November 2017.
(c) Designates the current chairperson of the board or committee.
Committee membership
As at the date of this report, the company had an audit and risk committee and a people and performance committee. The details of the functions and memberships of the committees are presented in the corporate governance statement.
Indemnification of directors and officers
The directors and officers of the company are indemnified by the company against losses or liabilities which they may sustain or incur as an officer of the company in the proper performance of their duties. During the financial year, the company paid premiums in respect of contracts to insure the directors and officers of the company against a liability to the extent permitted by the Corporations Act 2001. The contract of insurance prohibits disclosure of the nature of liability and the amount of the premiums.
Indemnification of auditors
To the extent permitted by law, the company has agreed to indemnify its auditors, PricewaterhouseCoopers, as part of the terms of its audit engagement agreement, against certain liabilities to third parties arising from the audit engagement, except to the extent that any losses are due to PricewaterhouseCoopers negligent, wrongful or wilful acts or omissions. No payments have been made to indemnify PricewaterhouseCoopers during or since the financial year.
Likely developments and expected results
Disclosure of information as to likely developments in the operations of the consolidated entity and expected results of those operations would be prejudicial to the interests of the consolidated entity. Accordingly, such information has not been included in this report.
Environmental regulations and performance
The consolidated entity is not involved in any activities that have a marked influence on the environment within its area of operation.
Corporate governance
In recognising the need for the highest standards of corporate behaviour and accountability, the directors of Breville Group Limited support the principles of good corporate governance. The company’s corporate governance statement is on page 39.
Performance rights
Unissued sharesAs at the date of this report there were 978,440 potential unissued shares under the performance rights. At the reporting date, there were 978,440 potential unissued shares under performance rights (2017: 914,400). Refer to note 18 of the financial report for further details of the performance rights outstanding. Performance right holders do not have any right, by virtue of the performance right, to participate in any share issue of the company.
Lapse of unvested performance rightsDuring the year, 66,360 unvested performance rights lapsed following the cessation of employment of employees or executives and 139,500 unvested performance rights lapsed as performance hurdles were not met. (2017: 30,800 unvested performance rights lapsed following the cessation of employment of employees or executives and 108,000 unvested performance rights lapsed as performance hurdles were not met).
For
per
sona
l use
onl
y

38 Breville Group Limited annual report 2018
Auditor’s declaration of independence
Attached on page 95 is a copy of the auditor’s declaration provided under section 307C of the Corporations Act 2001 in relation to the audit for the year ended 30 June 2018. This auditor’s declaration forms part of this directors’ report.
Non-audit services
During the financial year ended 30 June 2018 the company’s auditor, PricewaterhouseCoopers provided non-audit services to Breville Group entities. Details of the amounts paid to the auditor PricewaterhouseCoopers, for the provision of non-audit services during the year ended 30 June 2018 are set out in Note 20. These services primarily relate to tax compliance and advisory services.
In accordance with the recommendation from the audit and risk committee of the company, the directors are satisfied that the provision of the non-audit services during the year is compatible with the general standard of independence imposed by the Corporations Act. Also, in accordance with the recommendation from the audit and risk committee, the directors are satisfied that the nature and scope of each type of non-audit service provided means that auditor independence was not compromised. The auditors have also provided the audit and risk committee with a report confirming that, in their professional judgement, they have maintained their independence in accordance with the firm’s requirements, the provisions of APES 110 Code of Ethics for Professional Accountants and the applicable provisions of the Corporations Act.
Significant events after year end
No matters or circumstances have arisen since the end of the year which significantly affected or may affect the operations of the consolidated entity.
Signed in accordance with a resolution of directors.
Steven Fisher Non-executive chairman
Sydney 16 August 2018
Directors’ report continued
For
per
sona
l use
onl
y

39Breville Group Limited annual report 2018
Corporate governance statement
The board of directors is responsible for the corporate governance practices of the company and is committed to adhering to the Australian Securities Exchange (‘ASX’) Corporate Governance Council (‘council’) ‘Corporate Governance Principles and Recommendations (3rd Edition)’.
The ASX principles that have been adopted are outlined below.
The company’s corporate governance practices throughout the year ended 30 June 2018 were compliant with the council’s principles and recommendations, except for those differences disclosed and explained in this statement.
The following documents are available on the corporate, corporate governance section of the company’s website brevillegroup.com
• audit and risk committee charter
• board charter
• anti-bribery and corruption
• diversity policy
• share trading policy
• code of conduct
• people and performance committee charter
• continuous disclosure policy
• selection and appointment of directors
• criteria for assessing independence of directors
• shareholder communications policy
• workplace gender equality agency report
• ethical sourcing policy
Board skills matrix
The skills, diversity and term in office of the current directors as at the date of this annual report are as follows:
Director Appointed Term in office Qualifications Non-executive Independent Last elected
Steven Fisher (chairman) 2004 14 years B.ACC, CA (SA) Yes No 2015
Timothy Antonie 2013 4 years BEcon Yes No 2017
Sally Herman 2013 5 years BA, GAICD Yes No 2016
Dean Howell 2008 10 years FCA, CTA Yes Yes 2017
Lawrence Myers 2013 4 years B.Acct, CA, CTA Yes Yes 2015
Kate Wright 2016 2 years BA Yes Yes 2016
The board has a wide range of skills which are necessary for the effective management of the business including in the following areas:
• Corporate strategy and executive leadership
• Banking
• Legal and risk management
• Compliance and governance
• Accounting, tax and financial reporting, including financial analysis
• Mergers, acquisitions and capital raisings
• Human resources and executive remuneration
• Investor relations
• International business
• Marketing
Principle 1: Lay solid foundations for management and oversight
Role of the board and management
The board guides and monitors the business and affairs of the company on behalf of the shareholders, by whom it is elected and to whom it is accountable. The board has adopted formal guidelines for board operation and membership. These guidelines outline the roles and responsibilities of the board and its members and establish the relationship between the board and management.
The board is responsible for approving the strategic direction of the company, establishing goals for management, monitoring the achievement of those goals and establishing a sound system of risk oversight and management.
The board will regularly review its performance and the performance of its committees. The respective roles and responsibilities of the board and management are outlined further in the board charter.
For
per
sona
l use
onl
y

40 Breville Group Limited annual report 2018
Principle 1: Lay solid foundations for management and oversight continued
Appointment of board members
A detailed process is undertaken for the appointment of new board members, including appropriate checks as to background, history and any potential conflicts of interest.
As at the date of this annual report, all directors have a written agreement outlining their roles and responsibilities.
New directors receive a comprehensive briefing package prior to their appointment.
Company secretary
The company secretary is directly accountable to the board on all matters relating to the proper functioning of the board.
Diversity policy
The company is an equal opportunity employer and values differences such as gender, age, culture, disability, ethnicity and lifestyle choices. The company’s diversity policy aims to ensure a corporate culture that supports workplace diversity whilst providing access to equal opportunities at work based on merit. This policy is available on the company’s website at the corporate, corporate governance section and is subject to periodic review by, and may be changed by resolution of the board. The policy has no contractual effect.
Diversity policy objectives
The objectives set by the board in accordance with the diversity policy and progress towards achieving them are:
• Representation of women trained in recruitment and selection panels: Ongoing progress was made during the year with further women being trained;
• Issuing the company equal opportunity statement to recruiting agencies: This continued in Australia during the year;
• Explicit requirement of recruiting agencies to provide a gender balance of suitable, qualified, shortlisted candidates for interview: This initiative continued to progress during the year;
• Promoting a safe workplace free from harassment or discrimination of any kind: Training and education programs which included topics on harassment, bullying, victimisation and discrimination were conducted in Australia and the USA during the year;
• Enhancing the gender balance in career development in senior and managerial roles; and
• Continue flexible working arrangements where operationally appropriate.
The proportion of women employees in the company at 30 June 2018 has either met or exceeded the targets set for the period as follows:
30 June 2017
30 June 2018
Target for June 2018*
Women on the board 29% 33% 25%
Women in senior executive roles 25% 29% 25%
Women in senior roles 36% 32% 30%
Women in company 47% 50% 50%
*Target set in June 2015
Senior executives are direct reports to the CEO or a functional head. Senior roles include senior executives and direct reports to senior executives or other employees with a strategically important role.
To assist the board in fulfilling its responsibilities in relation to diversity, the implementation of these objectives is overseen by the people and performance committee.
The people and performance committee shall:
• report to the board at least annually, on the company’s progress in achieving the objectives set for achieving gender diversity;
• regularly oversee a review of the relative proportion of women across the company and their relative positions; and
• consider other initiatives to promote diversity in the workplace.
Workplace equality
In accordance with the requirements of the Workplace Gender Equality Act 2012 (Act), Breville Pty Limited lodged its annual compliance report with the Workplace Gender Equality Agency. This report is available on the company’s website at the corporate, corporate governance section.
Evaluating the performance of the board
The chairman is responsible for evaluating the board’s performance by way of an annual internal assessment. Each director provides written feedback in relation to the performance of the board and directors against a set of agreed criteria. This feedback is reported by the chairman to the board following the assessment. This performance assessment was completed by the chairman during the year.
Corporate governance statementcontinued
For
per
sona
l use
onl
y

41Breville Group Limited annual report 2018
Principle 1: Lay solid foundations for management and oversight continued
Evaluating the performance of key executives
The performance of key executives is reviewed against specific and measurable qualitative and quantitative performance criteria and includes:
• financial measures of the company’s performance;
• development and achievement of strategic objectives;
• development of management and staff;
• compliance with legislative and company policy requirements; and
• achievement of key performance indicators.
Performance evaluation
All key executives were subject to a performance review as described above during the reporting period.
Principle 2: Structure the board to add value
Board composition
The company’s constitution states that there must be a minimum of three directors and contains detailed provisions concerning the tenure of directors. The board currently comprises six non-executive directors. The directors’ report, on pages 14 and 15, outlines the relevant skills, experience and expertise held by each director in office at the date of this report.
In accordance with good corporate governance, where the chairman of the board is not an independent director, the board considers it to be useful and appropriate to designate an independent director to serve in a lead capacity to co-ordinate the activities of the other independent directors, including acting as principal liaison between the independent directors and the chairman and representing the board as the lead independent director when the chairman is unable to do so because of his non-independent status.
As Mr Fisher is not an independent director, the board has appointed Mr Myers as its lead independent director.
Director independence
In considering whether a director is independent, the board refers to the company’s “Criteria for assessing independence of directors” at the corporate, corporate governance section of the company’s website, which is consistent with the council’s recommendations. Independent directors of the company are those that are not involved in the day-to-day management of the company and are free from any real or reasonably perceived business or other relationship that could materially interfere with the exercise of their unfettered and independent judgement.
In accordance with the definition of independence above, and the materiality thresholds outlined in the company’s policy ‘Criteria for assessing independence of directors’, it is the board’s view that Mr Dean Howell, Mr Lawrence Myers and Ms Kate Wright are independent directors. The following directors are not independent directors:
• Mr Steven Fisher (non-executive chairman) is employed by an entity associated with a substantial shareholder of the company;
• Mr Timothy Antonie (non-executive director) is a non-executive director of Premier Investments Ltd, a substantial shareholder of the company; and
• Ms Sally Herman (non-executive director) is a non-executive director of Premier Investments Ltd, a substantial shareholder of the company.
Regardless of whether directors are defined as independent, all directors are expected to bring independent views and judgement to board deliberations.
Material personal interest requirement
The Corporations Act provides that unless agreed by the board, where any director has a material personal interest in a matter, the director will not be permitted to be present during discussions, or to vote on the matter.
Access to independent advice
There are procedures in place to enable directors, in connection with their duties and responsibilities as directors, to seek independent professional advice at the expense of the company. Prior written approval of the chairman is required, which will not be unreasonably withheld.
Board committees
The board has established the audit and risk committee and people and performance committee to assist in the execution of its duties and to allow detailed consideration of complex issues. The composition of these committees is shown on page 37. F
or p
erso
nal u
se o
nly

42 Breville Group Limited annual report 2018
Principle 2: Structure the board to add value continued
Nomination committee
During the year ended 30 June 2018, the company did not have a separately established nomination committee.
All duties and responsibilities typically delegated to such a committee are the responsibility of the full board. Although the council’s recommendation 2.1 recommends that a nomination committee can be a more efficient mechanism for the detailed examination of selection and appointment practices, particularly in larger companies, the board does not believe at this time that any marked efficiencies or enhancements would be achieved by the creation of a separate nomination committee.
The board brings independent judgement to decisions regarding the composition of the board. The process of recruiting a new director includes the evaluation of relevant skills, knowledge, experience, independence and diversity. The board endeavours to ensure appropriate succession planning, both at a board and senior executive level.
Principle 3: Promote ethical and responsible decision making
Code of conduct
The board has formally adopted a code of conduct (“code”) for all employees (including directors). The code aims at maintaining the highest ethical standards, corporate behaviour and accountability across the group. These obligations are also consistent with the duties imposed on directors by the Corporations Act. In addition, directors are obliged to be independent in judgement and to ensure that all reasonable steps are taken to be satisfied as to the soundness of board decisions.
Principle 4: Safeguard integrity in financial reporting
Audit and risk committee
The board has an audit and risk committee (A&RC), which operates under a charter approved by the board. It is the board’s responsibility to ensure that an effective internal control framework exists within the consolidated entity. This includes internal controls to deal with both the effectiveness and efficiency of significant business processes, the safeguarding of assets, the maintenance of proper accounting records and the reliability of financial information. The board has delegated the responsibility for the establishment and maintenance of a framework of internal control and ethical standards of the company to the A&RC.
Among its responsibilities, the A&RC:
• ensures that company accounting policies and practices are in accordance with current and emerging accounting standards;
• reviews all accounts of the group to be publicly released;
• recommends to the board the appointment and remuneration of the external auditors;
• reviews the scope of external audits;
• assesses the performance and independence of the external auditors, including procedures governing partner rotation;
• reviews corporate governance practices;
• monitors and assesses the systems for internal compliance and control, legal compliance and risk management including operational and strategic risks; and
• reviews and carries out an annual assessment of the company’s risk management framework.
Composition of committee
The members of the A&RC as at the date of this report are:
• Mr Lawrence Myers (chairperson)
• Mr Dean Howell
• Ms Kate Wright
The directors’ report, on page 37, outlines the number of A&RC meetings held during the year and the names of the attendees at those meetings. It also outlines the qualifications of A&RC members on pages 14 and 15.
The group chief executive officer; company secretary; group chief financial officer; the external auditors and any other persons considered appropriate may attend meetings of the A&RC by invitation. The committee also meets from time to time with the external auditors independent of management.
In accordance with the council’s recommendation 4.2, the A&RC is structured so that it:
• comprises only non-executive directors;
• is chaired by an independent chair, who is not chair of the board; and
• has at least three members.
In accordance with the council’s recommendation 4.2 the group chief executive officer and group chief financial officer provided the board with a written declaration confirming that the declaration provided in accordance with section 295A of the Corporations Act is founded on a sound system of risk management and internal control and that the system operated effectively in all material respects.
Corporate governance statementcontinued
For
per
sona
l use
onl
y

43Breville Group Limited annual report 2018
Principle 5: Make timely and balanced disclosure
The company’s continuous disclosure policy complies with the council’s recommendation 5.1. This policy is available on the company’s website at the corporate, corporate governance section.
Principle 6: Respect the rights of shareholders
Communication policy
The company is committed to providing all shareholders with comprehensive, timely and equal access to information about its activities to enable them to make informed investment decisions. The company’s shareholder communication policy is available on the company’s website at the corporate, corporate governance section.
Electronic communication
The company’s website displays recent ASX announcements and contains information about the company.
Shareholders can elect to receive communications from the company’s share registry electronically which also gives shareholders the opportunity to manage their account details and holdings electronically. Shareholders are also able to send communications to the company and receive responses to these communications electronically.
Briefings
The company keeps a record of briefings held with investors and analysts, including a record of those present and the time and place of the meeting.
Principle 7: Recognise and manage risk
The company is committed to the identification, monitoring and management of risks associated with its business activities including financial, operational, compliance, ethical conduct, brand and product quality risks. The company has embedded in its management and reporting systems a number of risk management controls.
These include:
• guidelines and limits for approval of capital expenditure;
• policies and procedures for the management of financial risk and treasury operations including exposures to foreign currencies and movements in interest rates;
• annual budgeting and monthly reporting systems for all businesses which enable the monitoring of progress against performance targets and the evaluation of trends;
• policies and procedures which enable management of the company’s material business risks;
• formal strategic planning sessions; and
• presentation of periodic reports to the board and the A&RC identifying items that represent a potential risk and the manner in which these are being managed and responded to.
The company does not have an internal audit function and management is ultimately responsible to the board for the system of internal control and risk management and has reported to the board as to the effectiveness of the company’s management of its material business risks. The A&RC assists the board in monitoring this function.
During the year ended 30 June 2018, the company did not have a separately established risk committee. All duties and responsibilities typically delegated to such a committee are the responsibility of the full board, with assistance from the A&RC.
The Group’s exposure to economic, environmental and social sustainability risks, together with how these risks are managed, are detailed in the Operating and Financial Review section of the Directors report.
Principle 8: Remunerate fairly and responsibly
People and performance committee
The board has a people and performance committee (P&PC), comprising the following directors as at the date of this report:
• Ms Kate Wright (chairperson)
• Mr Dean Howell
• Mr Lawrence Myers
In accordance with the council’s recommendation 8.1, the P&PC comprises:
• an independent chairperson; and
• at least three members.
The P&PC is considered to be independent as at the date of this report.
For details on the number of meetings of the P&PC held during the year and the attendees at those meetings, refer to the directors’ report on page 37.
Remuneration disclosure
For details of the company’s remuneration philosophy and framework, and the remuneration received by directors and executives in the current period, please refer to the remuneration report contained in the directors’ report on pages 23 to 36.
For
per
sona
l use
onl
y

44 Breville Group Limited annual report 2018
Consolidated income statement for the year ended 30 June 2018
Consolidated
Note30 June 2018
$’00030 June 2017
$’000
Revenue 3(a) 652,348 605,733
Cost of sales 3(b) (420,088) (405,465)
Gross profit 232,260 200,268
Other income 689 813
Employee benefits expenses 3(e) (68,417) (55,887)
Premises, lease & utilities expenses (14,108) (10,569)
Advertising and marketing expenses (26,177) (24,630)
Other expenses (24,036) (20,206)
Earnings before interest, tax, depreciation & amortisation (EBITDA) 100,211 89,789
Depreciation & amortisation expense 3(c) (13,302) (10,769)
Earnings before interest & tax (EBIT) 86,909 79,020
Finance costs 3(f) (3,580) (2,421)
Finance income 3(f) 1,044 624
Profit before income tax 84,373 77,223
Income tax expense 4 (25,854) (23,389)
Net profit after income tax for the year attributable to members of Breville Group Limited 58,519 53,834
Cents Cents
Earnings per share for profit attributable to the ordinary equity holders of Breville Group Limited:
- basic earnings per share 12 45.0 41.4
- diluted earnings per share 12 45.0 41.4
The accompanying notes form an integral part of this consolidated income statement.
For
per
sona
l use
onl
y

45Breville Group Limited annual report 2018
Consolidated statement of comprehensive income for the year ended 30 June 2018
Consolidated
Note30 June 2018
$’00030 June 2017
$’000
Net profit after income tax for the year 58,519 53,834
Other comprehensive income/(loss)
Items that may be reclassified to profit or loss
Foreign currency translation differences 1,789 (2,129)
Net change in fair value of cash flow hedges 4,846 (491)
Income tax on other comprehensive income/(loss) 4 (823) 696
Other comprehensive income/(loss) for the year, net of income tax 5,812 (1,924)
Total comprehensive income for the year attributable to members of Breville Group Limited 64,331 51,910
The accompanying notes form an integral part of this consolidated statement of comprehensive income.
For
per
sona
l use
onl
y
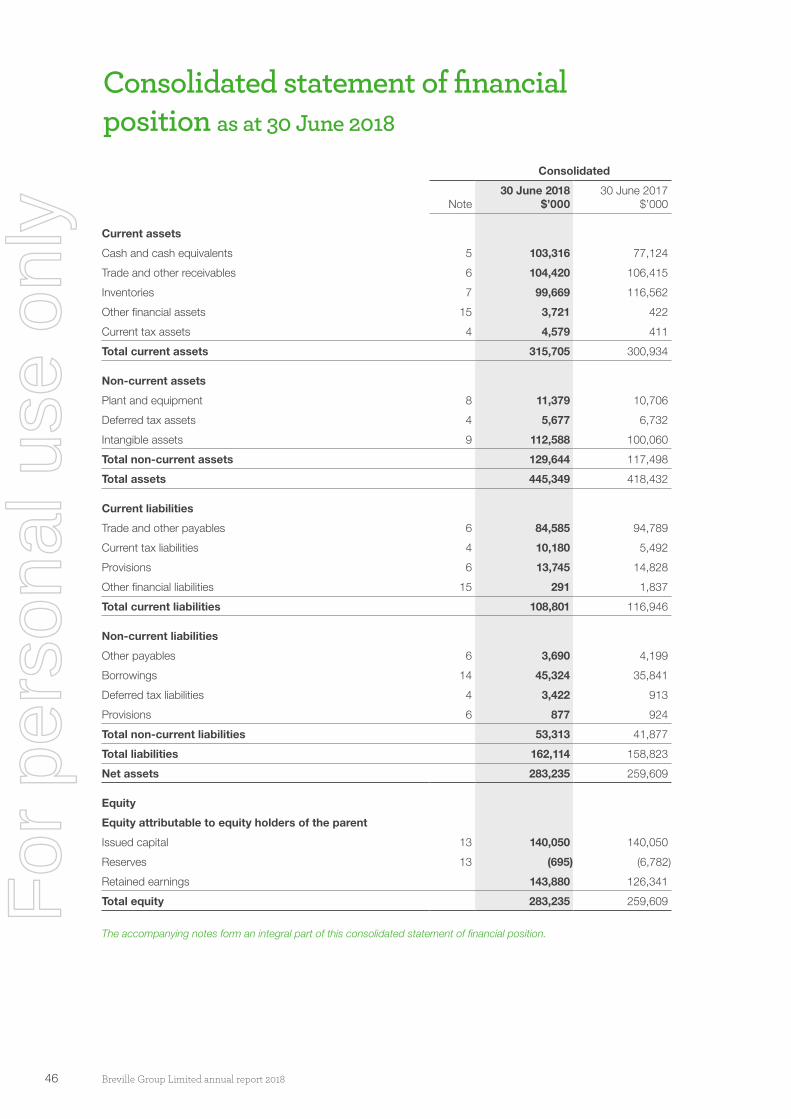
46 Breville Group Limited annual report 2018
Consolidated statement of financial position as at 30 June 2018
Consolidated
Note30 June 2018
$’00030 June 2017
$’000
Current assets
Cash and cash equivalents 5 103,316 77,124
Trade and other receivables 6 104,420 106,415
Inventories 7 99,669 116,562
Other financial assets 15 3,721 422
Current tax assets 4 4,579 411
Total current assets 315,705 300,934
Non-current assets
Plant and equipment 8 11,379 10,706
Deferred tax assets 4 5,677 6,732
Intangible assets 9 112,588 100,060
Total non-current assets 129,644 117,498
Total assets 445,349 418,432
Current liabilities
Trade and other payables 6 84,585 94,789
Current tax liabilities 4 10,180 5,492
Provisions 6 13,745 14,828
Other financial liabilities 15 291 1,837
Total current liabilities 108,801 116,946
Non-current liabilities
Other payables 6 3,690 4,199
Borrowings 14 45,324 35,841
Deferred tax liabilities 4 3,422 913
Provisions 6 877 924
Total non-current liabilities 53,313 41,877
Total liabilities 162,114 158,823
Net assets 283,235 259,609
Equity
Equity attributable to equity holders of the parent
Issued capital 13 140,050 140,050
Reserves 13 (695) (6,782)
Retained earnings 143,880 126,341
Total equity 283,235 259,609
The accompanying notes form an integral part of this consolidated statement of financial position.
For
per
sona
l use
onl
y
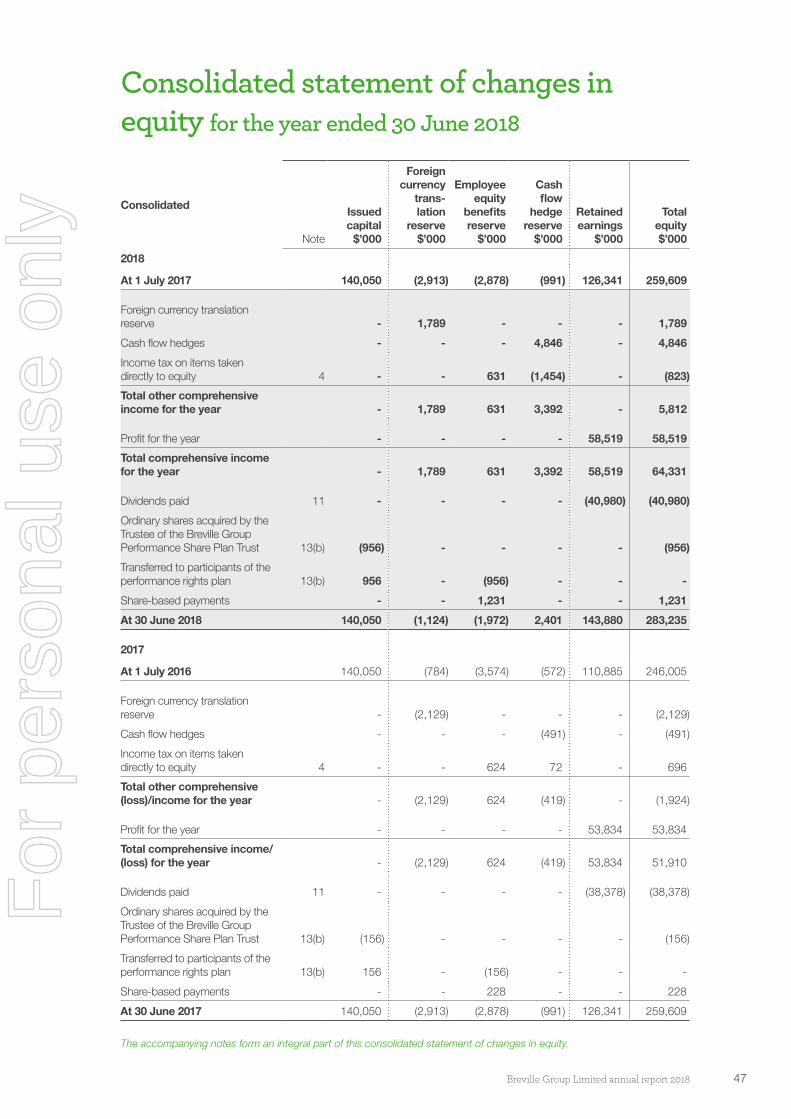
47Breville Group Limited annual report 2018
Consolidated statement of changes in equity for the year ended 30 June 2018
Consolidated
Note
Issued capital $’000
Foreign currency
trans-lation
reserve $’000
Employee equity
benefits reserve
$’000
Cash flow
hedge reserve
$’000
Retained earnings
$’000
Total equity $’000
2018
At 1 July 2017 140,050 (2,913) (2,878) (991) 126,341 259,609
Foreign currency translation reserve - 1,789 - - - 1,789
Cash flow hedges - - - 4,846 - 4,846
Income tax on items taken directly to equity 4 - - 631 (1,454) - (823)
Total other comprehensive income for the year - 1,789 631 3,392 - 5,812
Profit for the year - - - - 58,519 58,519
Total comprehensive income for the year - 1,789 631 3,392 58,519 64,331
Dividends paid 11 - - - - (40,980) (40,980)
Ordinary shares acquired by the Trustee of the Breville Group Performance Share Plan Trust 13(b) (956) - - - - (956)
Transferred to participants of the performance rights plan 13(b) 956 - (956) - - -
Share-based payments - - 1,231 - - 1,231
At 30 June 2018 140,050 (1,124) (1,972) 2,401 143,880 283,235
2017
At 1 July 2016 140,050 (784) (3,574) (572) 110,885 246,005
Foreign currency translation reserve - (2,129) - - - (2,129)
Cash flow hedges - - - (491) - (491)
Income tax on items taken directly to equity 4 - - 624 72 - 696
Total other comprehensive (loss)/income for the year - (2,129) 624 (419) - (1,924)
Profit for the year - - - - 53,834 53,834
Total comprehensive income/(loss) for the year - (2,129) 624 (419) 53,834 51,910
Dividends paid 11 - - - - (38,378) (38,378)
Ordinary shares acquired by the Trustee of the Breville Group Performance Share Plan Trust 13(b) (156) - - - - (156)
Transferred to participants of the performance rights plan 13(b) 156 - (156) - - -
Share-based payments - - 228 - - 228
At 30 June 2017 140,050 (2,913) (2,878) (991) 126,341 259,609
The accompanying notes form an integral part of this consolidated statement of changes in equity.
For
per
sona
l use
onl
y

48 Breville Group Limited annual report 2018
Consolidated cash flow statement for the year ended 30 June 2018
Consolidated
Note30 June 2018
$’00030 June 2017
$’000
Cash flows from operating activities
Receipts from customers 692,023 618,984
Payments to suppliers and employees (579,185) (535,506)
Finance costs paid (2,904) (1,688)
Income tax paid (22,326) (19,742)
Finance income received 1,044 624
Net cash flows from operating activities 5(b) 88,652 62,672
Cash flows used in investing activities
Purchase of plant and equipment (4,295) (1,917)
Proceeds from sale of plant and equipment - 25
Purchase of intangible assets (15,170) (17,405)
Purchase of business (9,071) -
Net cash flows used in investing activities (28,536) (19,297)
Cash flows used in financing activities
Proceeds from borrowings 76,630 32,515
Repayment of borrowings (68,576) (19,512)
Irretrievable cash contributions paid to the Trustee of the Breville Group Performance Share Plan Trust to acquire ordinary shares 13(b) (956) (156)
Equity dividends paid 11(a) (40,980) (38,378)
Net cash flows used in financing activities (33,882) (25,531)
Net increase in cash and cash equivalents 26,234 17,844
Cash and cash equivalents at beginning of the year 77,124 59,977
Net foreign exchange difference (42) (697)
Cash and cash equivalents at end of the year 5(a) 103,316 77,124
The accompanying notes form an integral part of this consolidated cash flow statement.
For
per
sona
l use
onl
y

49Breville Group Limited annual report 2018
Notes to the financial statements for the year ended 30 June 2018
Key numbers
1 Summary of significant accounting policies
2 Operating segments
3 Revenue and expenses
4 Income tax
5 Cash and cash equivalents
6 Receivables, payables and provisions
7 Inventories
8 Non-current assets – plant and equipment
9 Non-current assets – intangible assets
10 Impairment testing of goodwill and intangibles with indefinite lives
Capital management
11 Dividends
12 Earnings per share
13 Issued capital and reserves
14 Borrowings
15 Financial risk management
Group structure
16 Interests in other entities
17 Parent entity information
Other
18 Share-based payments
19 Related party transactions
20 Auditor’s remuneration
21 Commitments and contingencies
22 Significant events after year end
23 Other accounting policies
For
per
sona
l use
onl
y
50 Breville Group Limited annual report 2018
Notes to the financial statements for the year ended 30 June 2018
Key numbersNote 1. Summary of significant accounting policies
Breville Group Limited is a for profit company limited by shares incorporated in Australia. Breville Group Limited shares are quoted on the Australian Securities Exchange.
This financial report covers the consolidated entity comprising Breville Group Limited and its subsidiaries (company or group).
A description of the group’s operations and of its principal activities is included in the operating and financial review in the directors’ report on pages 15 to 22. The directors’ report is unaudited (except for the remuneration report) and does not form part of the financial report.
(a) Basis of preparationThe financial report is a general-purpose financial report, which has been prepared in accordance with the requirements of the Corporations Act 2001 and Australian Accounting Standards.
The financial report has also been prepared on a historical cost basis, except for derivative financial instruments which have been measured at fair value.
The financial report is presented in Australian dollars and all values are rounded to the nearest thousand dollars ($’000) unless otherwise stated under the option available to the company under ASIC Corporations (Rounding in Financial/Directors Reports) Instrument 2016/191. The company is an entity to which the class order applies.
Where necessary, comparatives have been reclassified and repositioned for consistency with current year disclosures.
(b) Statement of complianceThe financial report complies with Australian Accounting Standards as issued by the Australian Accounting Standards Board and International Financial Reporting Standards (IFRS) as issued by the International Accounting Standards Board.
(c) Basis of consolidationThe consolidated financial statements comprise the financial statements of Breville Group Limited and its subsidiaries as at 30 June each year.
Subsidiaries are all those entities over which the group has control. The group controls an entity when the group is exposed to, or has rights to, variable returns from its involvement with the entity and has the ability to affect those returns through its power to direct the activities of the entity. The existence and effect of potential voting rights that are currently exercisable or convertible are considered when assessing whether the group controls another entity.
The financial statements of subsidiaries are prepared for the same reporting period, using consistent accounting policies. In preparing the consolidated financial statements, all inter-group balances and transactions, income and expenses and profit and loss resulting from intra-group transactions have been eliminated in full.
Subsidiaries are fully consolidated from the date on which control is obtained by the group and cease to be consolidated from the date on which control is transferred out of the group.
The acquisition of subsidiaries is accounted for using the purchase method of accounting. The purchase method of accounting involves allocating the cost of the business combination to the fair value of assets acquired and the liabilities and contingent liabilities assumed at the date of acquisition.
(d) Significant accounting judgements, estimates and assumptionsThe carrying amounts of certain assets and liabilities are often determined based on estimates and assumptions of future events. The key estimates and assumptions that have a significant risk of causing a material adjustment to the carrying amounts of certain assets and liabilities within the next annual reporting period are:
Impairment of goodwill & intangibles with indefinite useful lives
The group determines whether goodwill and intangibles with indefinite useful lives are impaired at least on an annual basis. This requires an estimation of the recoverable amount of the cash generating units to which the goodwill and intangibles with indefinite useful lives are allocated. The assumptions used in this estimation of recoverable amount and the carrying amount of goodwill and intangibles with indefinite useful lives are discussed in note 10.
Share-based payment transactions
The group measures the cost of equity-settled transactions with employees by reference to the fair value of the equity instruments at the date at which they are granted. The fair value is determined by an external valuer using either the Black-Scholes or Monte-Carlo option pricing model, using the assumptions detailed in note 18.
For
per
sona
l use
onl
y

51Breville Group Limited annual report 2018
Taxes
Uncertainties exist with respect to the interpretation of complex tax regulations, changes in tax laws, and the amount and timing of future taxable income. Given the wide range of international business relationships and the long-term nature and complexity of existing contractual agreements, differences arising between the actual results and the assumptions made, or future changes to such assumptions, could necessitate future adjustments to tax income and expense already recorded.
The group establishes provisions, based on reasonable estimates, for possible consequences of audits by the tax authorities of the respective countries in which it operates. The amount of such provisions is based on various factors, such as experience of previous tax audits and differing interpretations of tax regulations by the taxable entity and the responsible tax authority. Such differences of interpretation may arise on a wide variety of issues depending on the conditions prevailing in the respective group company’s domicile. As the group assesses the probability for litigation and subsequent cash outflow with respect to taxes as remote, no contingent liability has been recognised.
Warranty and faulty goods
Provision for warranty and faulty goods is recognised at the date of sale of the relevant products, at the group’s best estimate of the expenditure required to settle the group’s liability. Factors that could impact the estimated claim information include the success of the group’s productivity and quality initiatives, as well as parts and labour costs. The related carrying amounts are disclosed in note 6.
(e) Notes to the financial statementsNotes relating to individual line items in the financial statements include accounting policy information where it is considered relevant to an understanding of these items. Details of the impact of new accounting policies and all other accounting policy information are disclosed in note 23 of the financial report.
Note 2. Operating segments
Operating segmentsThe group has identified its operating segments in line with AASB 8 Operating Segments based on the internal reports that are reviewed by the chief operating decision makers (group chief executive officer and board of directors) in assessing performance and in determining the allocation of resources.
The Group’s external reporting segments are ‘Global Product’ and ‘Distribution’.
‘Global Product’ sells premium products designed and developed by Breville, which are sold globally. Products may be sold directly or through 3rd parties, and may be branded Breville®, Sage® or carry a 3rd party brand.
‘Distribution’ sells products that are designed and developed by a 3rd party. Breville distributes these products pursuant to a license or distribution agreement, or they are sourced directly from manufacturers. Products in this business unit may be sold under a brand owned by the group (e.g. Breville®, Kambrook®), or they may be distributed under a 3rd party brand.
Note 1. Summary of significant accounting policies continued
(d) Significant accounting judgements, estimates and assumptions continued
For
per
sona
l use
onl
y

52 Breville Group Limited annual report 2018
Notes to the financial statements for the year ended 30 June 2018
Note 2. Operating segments continued
Consolidated
Note 30 June 2018 30 June 2017
Global Product
$’000
Distribu-tion
$’000Total
$’000
Global Product
$’000
Distribu-tion
$’000Total
$’000
Segment revenue (a) 526,881 125,467 652,348 469,568 136,165 605,733
Segment resultsEBITDA 86,051 14,160 100,211 82,592 7,197 89,789
Depreciation and amortisation (12,758) (544) (13,302) (10,221) (548) (10,769)
EBIT 73,293 13,616 86,909 72,371 6,649 79,020
Finance income 1,044 624
Finance costs (3,580) (2,421)
Profit before income tax 84,373 77,223
Other segment informationCapital expenditure - plant and equipment 3,254 754 4,008 1,068 759 1,827
Capital expenditure - intangibles 14,904 - 14,904 15,820 - 15,820
Consolidated
30 June 2018 $’000
30 June 2017 $’000
(a) Segment revenueGlobal Product
North America 303,649 265,083
ANZ 123,897 114,081
Rest of World 99,335 90,404
Total Global Product revenue 526,881 469,568
Distribution
Revenue generated from ANZ and North America
For
per
sona
l use
onl
y

53Breville Group Limited annual report 2018
Note 3. Revenue and expenses
Consolidated
Note30 June 2018
$’00030 June 2017
$’000
(a) RevenueSale of goods 652,348 605,599
Commission income - 134
Total revenue 652,348 605,733
(b) Cost of salesCosts of inventories recognised as an expense (includes write-down of inventory to net realisable value (note 7)) 368,541 361,058
Costs of delivering goods to customers 27,598 20,513
Warranty expense 23,949 23,894
Total cost of sales 420,088 405,465
(c) Depreciation and amortisation expenseDepreciation – plant and equipment 8 3,398 2,817
Amortisation – computer software 9 1,835 1,347
Amortisation – development costs 9 7,891 6,426
Amortisation – customer relationships 9 178 179
Total depreciation and amortisation expense 13,302 10,769
(d) Lease payments and other expenses included in consolidated income statementIncluded in premises, lease & utilities expenses:
• Minimum lease payments – operating lease 7,636 7,754
Included in other income/expenses:
• Net foreign exchange loss 522 345
• Other product related costs 3,902 3,255
• Impairment charge 9 554 -
(e) Employee benefits expensesWages & salaries, leave and other employee related benefits 64,358 52,861
Defined contribution plan expense 2,828 2,798
Share-based payments expense 1,231 228
Total employee benefits expenses 68,417 55,887
For
per
sona
l use
onl
y

54 Breville Group Limited annual report 2018
Notes to the financial statements for the year ended 30 June 2018
Note 3. Revenue and expenses continued
Consolidated
Note30 June 2018
$’00030 June 2017
$’000
(f) Finance costs/(income)Finance costs paid or payable on borrowings and bank overdrafts:
• interest 1,465 449
• other borrowing costs 1,439 1,239
Interest on other payables – non current 676 733
Finance costs 3,580 2,421
Finance income (1,044) (624)
Total net finance costs 2,536 1,797
(g) Research and development costsAmortisation of previously capitalised development costs included in amortisation expense 3(c) 7,891 6,426
Research and development costs charged directly to the income statement 19,826 14,139
Total research and development costs 27,717 20,565
Recognition and measurement
Revenue is recognised at the fair value of the consideration received or receivable to the extent it is probable that the economic benefits will flow to the group and the revenue can be reliably measured. The following specific recognition criteria must also be met before revenue is recognised:
(i) Sale of goods
Revenue is recognised when the significant risks and rewards of ownership of the goods have passed to the buyer and can be measured reliably. Risks and rewards are considered passed to the buyer at the earlier of delivery of the goods or the transfer of legal title to the buyer. Revenue is measured at the fair value of the consideration received or receivable, net of returns, allowances, trade discounts and volume rebates.
(ii) Commission income
Where an agency relationship exists, the amount included in revenue represents the commission received or receivable.
(iii) Finance costs/income
Revenue is recognised as interest accrues using the effective interest method. This is a method of calculating the amortised cost of a financial asset and allocating the interest income over the relevant period using the effective interest, which is the rate that exactly discounts estimated future cash receipts through the expected life of the financial asset to the net carrying amount of the financial asset. Borrowing costs are recognised as an expense when incurred.
For
per
sona
l use
onl
y

55Breville Group Limited annual report 2018
Note 4. Income tax
Consolidated
30 June 2018 $’000
30 June 2017 $’000
The major components of income tax expense are:
Income statementCurrent income tax
Current income tax charge 23,852 21,331
Adjustments in respect of current income tax of previous years (743) (105)
Deferred income tax
Relating to the origination and reversal of temporary differences 2,745 2,163
Total income tax expense reported in the income statement 25,854 23,389
Statement of changes in equityDeferred income tax related to items charged or credited directly to other comprehensive income
Employee equity benefits reserve (631) (624)
Net gain/(loss) on revaluation of cash flow hedges 1,454 (72)
Income tax expense/(benefit) reported in other comprehensive income 823 (696)
A reconciliation between tax expense and the product of accounting profit before income tax multiplied by the parent entity’s applicable income tax rate is as follows:
Profit before income tax 84,373 77,223
At the parent entity’s statutory income tax rate of 30% (2017: 30%) 25,312 23,167
• adjustments in respect of current income tax of previous years (743) (105)
• effect of different rates of tax on overseas income (139) 184
• expenditure not allowable for income tax purposes 850 (215)
• one-off adjustment to deferred taxes for change in US federal tax rate 1,571 -
• other (997) 358
Income tax expense reported in the income statement 25,854 23,389
For
per
sona
l use
onl
y

56 Breville Group Limited annual report 2018
Note 4. Income tax continued
Consolidated Consolidated
Statement of financial position
Income statement
30 June 2018 $’000
30 June 2017 $’000
30 June 2018 $’000
30 June 2017 $’000
Deferred income taxDeferred income tax at 30 June relates to the following:
Deferred tax liabilities
Brand names 1,875 1,875 - -
Development costs 8,613 7,359 (1,254) (1,344)
Intangibles 335 389 54 54
Cash flow hedge reserve 1,029 - - -
Accelerated depreciation for tax purposes 45 24 (21) (11)
Gross deferred income tax liabilities 11,897 9,647
Deferred tax assets
Losses available for offset against future taxable income 586 - 586 -
Provisions and accruals 6,007 6,907 (1,068) (833)
Other long term payables 950 1,142 (192) 172
Employee benefits 3,244 2,667 572 (258)
Revaluation of inventories 519 516 (18) (426)
Cash flow hedge reserve - 424 - -
Employee equity benefits reserve 1,874 1,160 316 16
Other 972 2,650 (1,720) 467
Gross deferred income tax assets 14,152 15,466
Net deferred income tax assets 2,255 5,819
Deferred tax expense (2,745) (2,163)
30 June 2018 $’000
30 June 2017 $’000
Current income taxCurrent tax asset 4,579 411
Current tax liabilities 10,180 5,492
At 30 June 2018, there is no recognised or unrecognised deferred income tax liability (2017: $nil) for taxes that would be payable on the unremitted earnings of certain of the group’s subsidiaries, as the group has no current intention of distributing existing retained earnings in jurisdictions where liability for additional taxation exists should such amounts be remitted.
Notes to the financial statements for the year ended 30 June 2018
For
per
sona
l use
onl
y

57Breville Group Limited annual report 2018
Recognition and measurement
Current tax
Current tax assets and liabilities for the current and prior periods are measured at the amounts expected to be recovered from or paid to the taxation authorities. The tax rates and tax laws used to compute the amount are those that are enacted or substantively enacted by the balance sheet date.
Deferred tax
Deferred income tax is provided on all temporary differences between the tax bases of assets/liabilities and their carrying amounts at balance sheet date for financial reporting purposes.
Deferred income tax liabilities are recognised for all taxable temporary differences except:
• when the deferred income tax liability arises from the initial recognition of goodwill or of an asset or liability in a transaction that is not a business combination and that, at the time of the transaction, affects neither the accounting profit nor taxable profit or loss; or
• when the taxable temporary difference is associated with investments in subsidiaries and the timing of the reversal of the temporary difference can be controlled and it is probable that the temporary difference will not reverse in the foreseeable future.
Deferred income tax assets are recognised for all deductible temporary differences, carry-forward of unused tax assets and unused tax losses, to the extent that it is probable that taxable profit will be available against which the deductible temporary differences and the carry-forward of unused tax assets and unused tax losses can be utilised, except:
• when the deferred income tax asset relating to the deductible temporary difference arises from the initial recognition of an asset or liability in a transaction that is not a business combination and, at the time of the transaction, affects neither the accounting nor taxable profit or loss; or
• when the deductible temporary difference is associated with investments in subsidiaries in which case a deferred tax asset is only recognised to the extent that it is probable that the temporary difference will reverse in the foreseeable future and taxable profit will be available against which the temporary differences can be utilised.
The carrying amount of deferred income tax assets is reviewed at each balance sheet date and reduced to the extent that it is no longer probable that sufficient taxable profit will be available to allow all or part of the deferred income tax asset to be utilised.
Unrecognised deferred income tax assets are reassessed at each balance sheet date and are recognised to the extent that it has become probable that future taxable profit will allow the deferred tax asset to be recovered.
Deferred income tax assets and liabilities are measured at the tax rates that are expected to apply to the year when the asset is realised or the liability is settled, based on tax rates (and tax laws) that have been enacted or substantively enacted at the balance sheet date.
Income taxes in relation to items recognised directly in equity are recognised in equity and not in the income statement.
Deferred tax assets and deferred tax liabilities are offset only if a legally enforceable right exists to set off current tax assets against current tax liabilities and the deferred tax assets and liabilities relate to the same taxable entity and the same taxation authority.
Tax consolidation legislation
Breville Group Limited and its wholly-owned Australian resident controlled entities (excluding the Breville Group Performance Share Plan Trust) have implemented the tax consolidated legislation as of 1 July 2003.
Breville Group Limited is the head entity of the tax consolidated group. For further information, refer to note 17.
Note 4. Income tax continued
For
per
sona
l use
onl
y
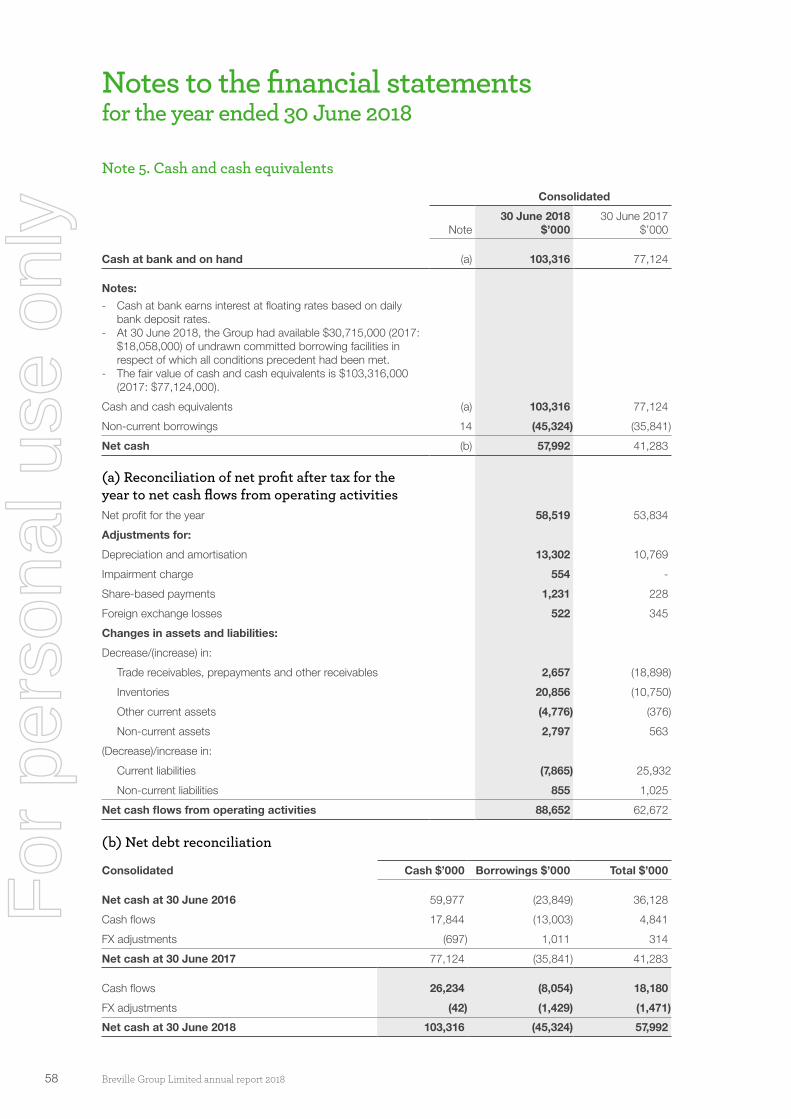
58 Breville Group Limited annual report 2018
Notes to the financial statements for the year ended 30 June 2018
Note 5. Cash and cash equivalents
Consolidated
Note30 June 2018
$’00030 June 2017
$’000
Cash at bank and on hand (a) 103,316 77,124
Notes:- Cash at bank earns interest at floating rates based on daily
bank deposit rates.- At 30 June 2018, the Group had available $30,715,000 (2017:
$18,058,000) of undrawn committed borrowing facilities in respect of which all conditions precedent had been met.
- The fair value of cash and cash equivalents is $103,316,000 (2017: $77,124,000).
Cash and cash equivalents (a) 103,316 77,124
Non-current borrowings 14 (45,324) (35,841)
Net cash (b) 57,992 41,283
(a) Reconciliation of net profit after tax for the year to net cash flows from operating activitiesNet profit for the year 58,519 53,834
Adjustments for:
Depreciation and amortisation 13,302 10,769
Impairment charge 554 -
Share-based payments 1,231 228
Foreign exchange losses 522 345
Changes in assets and liabilities:
Decrease/(increase) in:
Trade receivables, prepayments and other receivables 2,657 (18,898)
Inventories 20,856 (10,750)
Other current assets (4,776) (376)
Non-current assets 2,797 563
(Decrease)/increase in:
Current liabilities (7,865) 25,932
Non-current liabilities 855 1,025
Net cash flows from operating activities 88,652 62,672
(b) Net debt reconciliation
Consolidated Cash $’000 Borrowings $’000 Total $’000
Net cash at 30 June 2016 59,977 (23,849) 36,128
Cash flows 17,844 (13,003) 4,841
FX adjustments (697) 1,011 314
Net cash at 30 June 2017 77,124 (35,841) 41,283
Cash flows 26,234 (8,054) 18,180
FX adjustments (42) (1,429) (1,471)
Net cash at 30 June 2018 103,316 (45,324) 57,992
For
per
sona
l use
onl
y

59Breville Group Limited annual report 2018
(c) Disclosure of financing facilitiesRefer to note 14.
Recognition and measurement
Cash and cash equivalents in the balance sheet comprise cash at bank and in hand and short-term deposits with an original maturity of three months or less that are readily convertible to known amounts of cash and which are subject to an insignificant risk of changes in value.
For the purposes of the consolidated cash flow statement, cash and cash equivalents consist of cash and cash equivalents as defined above, net of outstanding bank overdrafts.
Note 5. Cash and cash equivalents continued
Note 6. Receivables, payables and provisions
Consolidated
Note30 June 2018
$’00030 June 2017
$’000
Trade and other receivables
CurrentTrade receivables (a) 101,787 104,305
Allowance for uncollectible receivables (247) (387)
Trade receivables, net 101,540 103,918
Prepayments 1,349 1,265
Other receivables (b) 1,531 1,232
Total current trade receivables, prepayments and other receivables 104,420 106,415
Notes: (a) Trade receivables are non-interest bearing and are generally on 30-60 day terms. An allowance for uncollectible
receivables is made when there is objective evidence on a case by case basis that a trade receivable is impaired. A charge of $133,000 (2017: $128,000) has been recognised by the group as an expense in ‘other expenses’ for the current year for specific debtors for which such evidence exists.
At 30 June 2018 an ageing analysis of those trade receivables which are past due but not impaired are as follows:
Consolidated
30 June 2018 $’000
30 June 2017 $’000
1 – 30 days overdue 9,897 11,777
31 – 60 days overdue 210 1,305
61+ days overdue 348 -
Total past due but not impaired 10,455 13,082
Trade receivables past due but not impaired amount to $10,455,000 (2017: $13,082,000). Of this balance, $4,203,000 (2017: $12,453,000) is covered by insurance in the event of default of payment. In all instances each operating unit has been in contact with the relevant debtor and is satisfied that payment will be received in full.
(b) Non-trade other receivables are non-interest bearing and have repayment terms between 30 and 60 days. Balances within other receivables do not contain impaired assets and are not past due. It is expected that these balances will be received when due.
For
per
sona
l use
onl
y

60 Breville Group Limited annual report 2018
Notes to the financial statements for the year ended 30 June 2018
Recognition and measurement
Trade receivables are initially recognised at fair value and subsequently measured at amortised cost. Bad debts are written off when incurred. An allowance for uncollectible receivables is established when there is objective evidence that the group will not be able to collect all amounts due. The amount of the allowance is recognised in the income statement. The carrying value and estimated net fair values of the trade and other receivables is assumed to approximate their fair value, being the amount at which the asset could be exchanged between willing parties.
Details regarding the effective interest rate and credit risk of current receivables are disclosed in note 15.
Consolidated
Note30 June 2018
$’00030 June 2017
$’000
Trade and other payables
CurrentTrade and other payables – unsecured 84,585 94,789
Total current trade and other payables 84,585 94,789
Non currentOther payables (a) 3,690 4,199
3,690 4,199
Notes:
(a) Relates to an earn-out in relation to the acquisition of PolyScience.
Recognition and measurement
Trade and other payables are carried at amortised cost. Trade payables represent liabilities for goods and services provided to the group prior to the end of the year that are unpaid and arise when the group becomes obliged to make future payments in respect of the purchase of these goods and services. The amounts are unsecured, non-interest bearing and are usually settled on 30 day terms. The carrying value and estimated net fair values of the trade and other payables is assumed to approximate their fair value, being the amount at which the liability could be settled in a current transaction between willing parties. Details regarding interest rate, foreign exchange and liquidity risk exposure are disclosed in note 15.
Consolidated
Note30 June 2018
$’00030 June 2017
$’000
Provisions
CurrentWarranty and faulty goods (a) 7,773 8,458
Employee benefits – annual leave (a) 3,529 3,965
Employee benefits – long service (a) 2,273 2,405
Other provisions (a) 170 -
Total current provisions (a) 13,745 14,828
Non currentEmployee benefits – long service (a) 877 924
Total non-current provisions (a) 877 924
Note 6. Receivables, payables and provisions continued
Trade and other receivables continued
For
per
sona
l use
onl
y

61Breville Group Limited annual report 2018
Note 6. Receivables, payables and provisions continued
Provisions continued
ConsolidatedWarranty
and faulty goods$’000
Employee benefits -
annual leave$’000
Employee benefits -
long service
$’000
Other Provisions
$’000Total
$’000
(a) Movement in provisionsCarrying amount at the beginning of the year:
Current 8,458 3,965 2,405 - 14,828
Non-current - - 924 - 924
Total 8,458 3,965 3,329 - 15,752
Movement in provisions during the year:
Additional provisions made in the year 23,925 2,593 352 170 27,040
Amounts utilised during the year (24,824) (3,049) (535) - (28,408)
Net exchange differences 214 20 4 - 238
Net movement (685) (436) (179) 170 (1,130)
Carrying amount at the end of the year:
Current 7,773 3,529 2,273 170 13,745
Non-current - - 877 - 877
Total 7,773 3,529 3,150 170 14,622
Recognition and measurement
Provisions are recognised when the group has a present legal or constructive obligation as a result of a past event, it is probable that an outflow of resources embodying economic benefits will be required to settle the obligation and a reliable estimate can be made of the amount of the obligation.
Where the group expects some or all of a provision to be reimbursed, for example under an insurance contract, the reimbursement is recognised as a separate asset but only when the reimbursement is virtually certain. The expense relating to any provision is presented in the income statement net of any reimbursement.
Provisions are measured as the present value of management’s best estimate of the expenditure required to settle the present obligation at the balance sheet date. If the effect of the time value of money is material, provisions are discounted using a current pre-tax rate that reflects the risks specific to the liability. Where discounting is used, the increase in the provision due to the passage of time is recognised as a finance cost.
Warranties and faulty goods
Provisions for warranty and faulty goods are recognised at the date of sale of the relevant products. A provision for warranty and faulty goods represents the present value of the best estimate of the future sacrifice of economic benefits expected that will be required for warranty and faulty goods claims on products sold. This estimate is based on the historical trends experienced on the level of repairs and returns. It is expected that these costs will be incurred in the next year. Assumptions used to calculate the provision for warranty and faulty goods were based on the level of warranty and faulty goods claims experienced during the last year.
Employee benefits - annual leave
Liabilities for wages and salaries, including non-monetary benefits, annual leave and accumulating sick leave expected to be settled within 12 months of the reporting date are recognised in respect of employees’ services up to the reporting date. They are measured at the amounts expected to be paid when the liabilities are settled. Liabilities for non-accumulating sick leave are recognised when the leave is taken and are measured at the rates paid or payable.
Contributions to the defined contribution fund are recognised as an expense as they become payable.
For
per
sona
l use
onl
y

62 Breville Group Limited annual report 2018
Employee benefits – long service
The provision for employee benefits represents the present value of expected future payments to be made in respect of services provided by employees up to the reporting date. Consideration is given to the expected future wage and salary levels, experience of employee departures and periods of service. Expected future payments are discounted using appropriate market yields at the reporting date to estimate the future cash outflows.
Note 7. Inventories
Consolidated
Note30 June 2018
$’00030 June 2017
$’000
Finished goods (at lower of cost and net realisable value) (a) 87,687 97,781
Stock in transit (at cost) 11,982 18,781
Total inventories 99,669 116,562
Notes: (a) Total net finished goods provision movements recognised in the income statement totalled a $42,000 credit
(2017: $186,000 credit) for the group. This net credit is included in the cost of inventories line in the cost of sales.
Recognition and measurement
Inventories are valued at the lower of cost and net realisable value. The cost of inventories comprises all costs of purchase, costs of conversion and other costs incurred in bringing the inventories to their present location and condition. This includes the transfer from equity of gains and losses on qualifying cash flow hedges of purchases of finished goods. Costs are assigned to individual items of inventory on a weighted average cost basis.
Net realisable value is the estimated selling price in the ordinary course of business, less estimated costs necessary to make the sale.
Notes to the financial statements for the year ended 30 June 2018
Note 6. Receivables, payables and provisions continued
Provisions continued
Recognition and measurement continued
For
per
sona
l use
onl
y
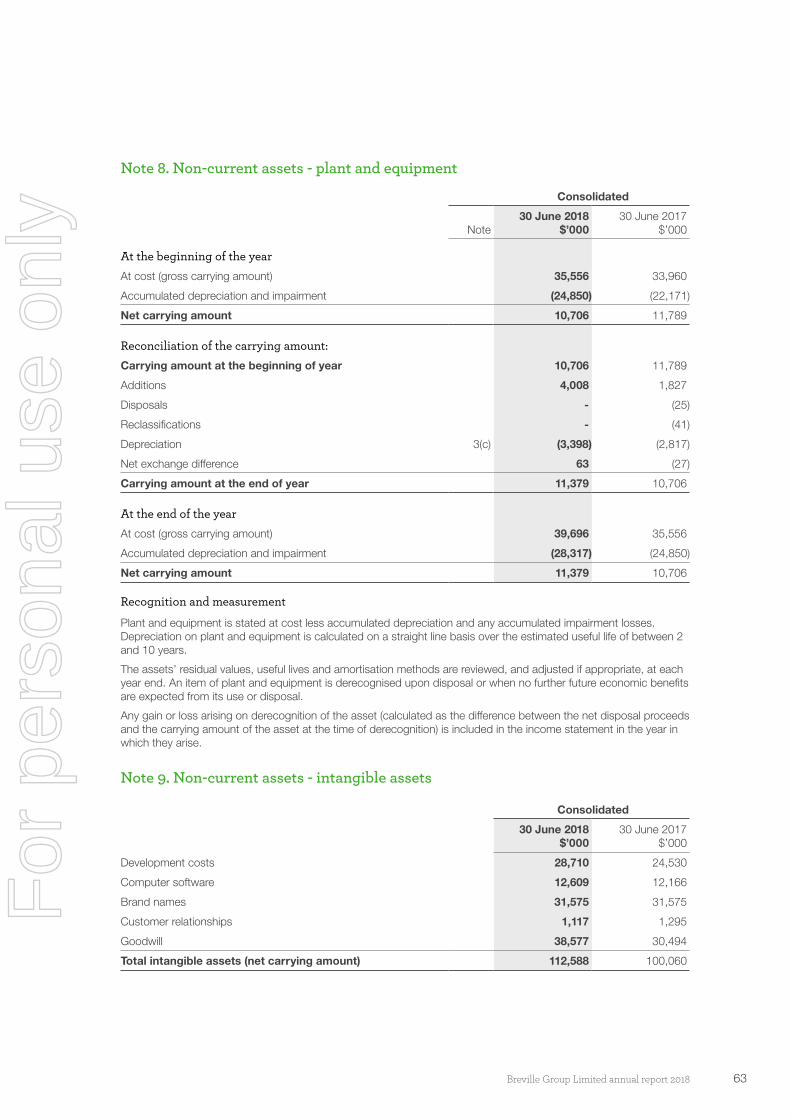
63Breville Group Limited annual report 2018
Note 8. Non-current assets - plant and equipment
Consolidated
Note30 June 2018
$’00030 June 2017
$’000
At the beginning of the year
At cost (gross carrying amount) 35,556 33,960
Accumulated depreciation and impairment (24,850) (22,171)
Net carrying amount 10,706 11,789
Reconciliation of the carrying amount:
Carrying amount at the beginning of year 10,706 11,789
Additions 4,008 1,827
Disposals - (25)
Reclassifications - (41)
Depreciation 3(c) (3,398) (2,817)
Net exchange difference 63 (27)
Carrying amount at the end of year 11,379 10,706
At the end of the year
At cost (gross carrying amount) 39,696 35,556
Accumulated depreciation and impairment (28,317) (24,850)
Net carrying amount 11,379 10,706
Recognition and measurement
Plant and equipment is stated at cost less accumulated depreciation and any accumulated impairment losses. Depreciation on plant and equipment is calculated on a straight line basis over the estimated useful life of between 2 and 10 years.
The assets’ residual values, useful lives and amortisation methods are reviewed, and adjusted if appropriate, at each year end. An item of plant and equipment is derecognised upon disposal or when no further future economic benefits are expected from its use or disposal.
Any gain or loss arising on derecognition of the asset (calculated as the difference between the net disposal proceeds and the carrying amount of the asset at the time of derecognition) is included in the income statement in the year in which they arise.
Note 9. Non-current assets - intangible assets
Consolidated
30 June 2018 $’000
30 June 2017 $’000
Development costs 28,710 24,530
Computer software 12,609 12,166
Brand names 31,575 31,575
Customer relationships 1,117 1,295
Goodwill 38,577 30,494
Total intangible assets (net carrying amount) 112,588 100,060
For
per
sona
l use
onl
y

64 Breville Group Limited annual report 2018
Notes to the financial statements for the year ended 30 June 2018
Note 9. Non-current assets - intangible assets continued
Consolidated 2018
Note
Develop-ment costs $’000
Computer software
$’000
Brand names
$’000
Customer relation-
ships $’000
Goodwill $’000
Total $’000
At the beginning of the yearAt cost (gross carrying amount) 67,609 15,990 31,575 1,835 30,494 147,503
Accumulated amortisation and impairment (43,079) (3,824) - (540) - (47,443)
Net carrying amount 24,530 12,166 31,575 1,295 30,494 100,060
Reconciliation of the carrying amount:Carrying amount at the beginning of year 24,530 12,166 31,575 1,295 30,494 100,060
Additions 12,071 2,833 - - 8,083 22,987
Amortisation 3(c) (7,891) (1,835) - (178) - (9,904)
Impairment charge - (554) - - - (554)
Net exchange difference - (1) - - - (1)
Carrying amount at the end of year 28,710 12,609 31,575 1,117 38,577 112,588
At the end of the yearAt cost (gross carrying amount) 79,680 18,010 31,575 1,835 38,577 169,677
Accumulated amortisation and impairment (50,970) (5,401) - (718) - (57,089)
Net carrying amount 28,710 12,609 31,575 1,117 38,577 112,588
Consolidated 2017
At the beginning of the yearAt cost (gross carrying amount) 57,176 10,554 31,575 1,835 30,494 131,634
Accumulated amortisation and impairment (36,653) (2,485) - (361) - (39,499)
Net carrying amount 20,523 8,069 31,575 1,474 30,494 92,135
Reconciliation of the carrying amount:Carrying amount at the beginning of year 20,523 8,069 31,575 1,474 30,494 92,135
Additions 10,496 5,324 - - - 15,820
Reclassifications (63) 113 - - - 50
Amortisation 3(c) (6,426) (1,347) - (179) - (7,952)
Net exchange difference - 7 - - - 7
Carrying amount at the end of year 24,530 12,166 31,575 1,295 30,494 100,060
At the end of the yearAt cost (gross carrying amount) 67,609 15,990 31,575 1,835 30,494 147,503
Accumulated amortisation and impairment (43,079) (3,824) - (540) - (47,443)
Net carrying amount 24,530 12,166 31,575 1,295 30,494 100,060
For
per
sona
l use
onl
y

65Breville Group Limited annual report 2018
Note 9. Non-current assets - intangible assets continued
A summary of the policies applied to the group’s intangible assets is as follows:
(a) Development costsInternally generated or Acquired
Internally generated
Recognition Capitalised at cost and recognised only when the group can demonstrate the technical feasibility of completing the intangible asset so that it will be available for use or sale, its intention to complete and its ability to use or sell the asset, how the asset will generate future economic benefits, the availability of resources to complete the development and the ability to measure reliably the expenditure attributable to the intangible asset during its development. Following the initial recognition of the development expenditure, the cost model is applied requiring the asset to be carried at cost less any accumulated amortisation and accumulated impairment losses. Research costs are expensed as incurred.
Useful lives FiniteAmortisation method Amortised straight line over the period of expected future sales, not exceeding 3 years,
from the related project on a straight line basis.Impairment test Annually and more frequently when an indication of impairment exists. An impairment loss
is recognised to the extent that the recoverable amount is lower than the carrying amount. The amortisation method is reviewed at each year end.
(b) Computer softwareInternally generated or Acquired
Internally generated and acquired
Recognition Capitalised at costUseful lives FiniteAmortisation method Amortised over the useful life, not exceeding 7 years, on a straight line basis.Impairment test When an indication of impairment exists. The amortisation method is reviewed at each
year end.(c) Brand namesInternally generated or Acquired
Acquired
Recognition Capitalised at cost or if acquired as part of a business combination at fair value at the date of acquisition
Useful lives IndefiniteAmortisation method No amortisationImpairment test Annually and more frequently when an indication of impairment exists.(d) Customer relationshipsInternally generated or Acquired
Acquired
Recognition Capitalised at cost or if acquired as part of a business combination at fair value at the date of acquisition
Useful lives FiniteAmortisation method Amortised over the useful life, not exceeding 10 years, on a straight line basis.Impairment test Annually and more frequently when an indication of impairment exists. The amortisation
method is reviewed at each year end.(e) GoodwillInternally generated or Acquired
Acquired
Recognition Initially capitalised at cost, being the excess of the cost of the business combination over the group’s interest in the net fair value of the acquiree’s identifiable assets, liabilities and contingent liabilities. Following initial recognition, goodwill is measured at cost less any accumulated impairment losses.
Useful lives IndefiniteAmortisation method No amortisationImpairment test Annually and more frequently when an indication of impairment exists.
For
per
sona
l use
onl
y

66 Breville Group Limited annual report 2018
Notes to the financial statements for the year ended 30 June 2018
Note 9. Non-current assets - intangible assets continued
The amortisation period and the amortisation method for an intangible asset with a finite useful life are reviewed at least at each year end. Changes in the expected useful life or the expected pattern of consumption of future economic benefits embodied in the asset are accounted for by changing the amortisation period or method, as appropriate, which is a change in accounting estimate. The amortisation expense on intangible assets with finite lives is recognised in the income statement in the expense category consistent with the function of the intangible asset.
Gains or losses arising from derecognition of an intangible asset are measured as the difference between the net disposal proceeds and the carrying amount of the asset and are recognised in the income statement when the asset is derecognised.
Note 10. Impairment testing of goodwill and intangibles with indefinite lives
On a consistent basis, goodwill and brand names acquired through business combinations have been allocated to these cash generating units or groups of cash generating units for impairment testing as follows:
• Global Product ANZ
• Global Product North America
• Global Product Rest of World
• Distribution
In all cases the recoverable amount of the individual cash generating unit has been determined based on a value in use calculation using cash flow projections based on financial budgets approved by the Board.
The pre-tax discount rates applied to cash flow projections are in the range of 8.2% to 11.1% (2017: 8.3% to 10.6%), depending on the CGU. This discount rate has been determined using the weighted average cost of capital which incorporates both the cost of debt and the cost of capital. Cash flows beyond the approved 30 June 2019 budgets are extrapolated using a 3% growth rate (2017: 3.0%), which is considered a reasonable estimate of the long-term average growth rate for the wholesale consumer products industry.
Management has performed sensitivity testing by cash generating unit (CGU), based on assessing the effect of changes in revenue growth rates as well as discount rates. Management consider any reasonable likely combination of changes in these key assumptions would not result in the carrying value of the goodwill or brand names exceeding the recoverable amount.
Consolidated
Note30 June 2018
$’00030 June 2017
$’000
Carrying amount of goodwill and brand names are allocated as follows:Breville Group- brand names with indefinite useful lives 13,800 13,800
Global Product ANZ- goodwill 20,553 20,553
Global Product North America- goodwill 7,700 7,700
Global Product Rest of World- goodwill 2,241 2,241
Distribution- goodwill 8,083 -
- brand names with indefinite useful lives 17,775 17,775
70,152 62,069
All cash generating units
- goodwill 9 38,577 30,494
- brand names with indefinite useful lives 9 31,575 31,575
Total carrying amount of goodwill and brand names 70,152 62,069
For
per
sona
l use
onl
y

67Breville Group Limited annual report 2018
Key assumptions used in value in use calculations for the cash generating units for 30 June 2018 and 30 June 2017The key assumption on which management has based its cash flow projections when determining the value in use of the cash generating units is budgeted gross margins. The basis used to determine the value assigned to the budgeted gross margins is based on past performance and expectations for the future.
Recognition and measurement
Intangible assets – goodwill
The useful life of an intangible asset with an indefinite life is reviewed each reporting period to determine whether indefinite life assessment continues to be supportable.
For the purpose of impairment testing, goodwill acquired in a business combination shall, from the acquisition date, be allocated to each of the group’s cash generating units, or groups of cash generating units, that are expected to benefit from the synergies of the combination, irrespective of whether other assets or liabilities of the group are assigned to those units or groups of units. Each unit or group of units to which the goodwill is so allocated represents the lowest level within the group at which the goodwill is monitored for internal management purposes.
Impairment is determined by assessing the recoverable amount of the cash generating unit to which the goodwill relates. When the recoverable amount of a cash generating unit is less than the carrying amount, an impairment loss is recognised. When goodwill forms part of a cash generating unit and an operation within that unit is disposed of, the goodwill associated with the operation disposed of is included in the carrying amount of the operation when determining the gain or loss on disposal of the operation. Goodwill disposed of in this manner is measured based on the relative values of the operation disposed of and the portion of the cash generating unit retained.
Impairment losses recognised for goodwill are not subsequently reversed.
Impairment of non-financial assets other than goodwill
Intangible assets that have an indefinite useful life are not subject to amortisation and are tested annually for impairment; or more frequently if events or changes in circumstances indicate that they might be impaired. Other assets are tested for impairment whenever events or changes in circumstances indicate that the carrying amount may not be recoverable. An impairment loss is recognised for the amount by which the asset’s carrying amount exceeds its recoverable amount.
Recoverable amount is the higher of an asset’s fair value less costs to sell and value in use. For the purposes of assessing impairment, assets are grouped at the lowest levels for which there are separately identifiable cash inflows that are largely independent of the cash inflows from other assets or groups of assets (cash generating units). Non-financial assets other than goodwill that suffered impairment are tested for possible reversal of the impairment whenever events or changes in circumstances indicate that the impairment may have reversed.
Note 10. Impairment testing of goodwill and intangibles with indefinite lives continued
For
per
sona
l use
onl
y

68 Breville Group Limited annual report 2018
Notes to the financial statements for the year ended 30 June 2018
Capital managementNote 11. Dividends
Consolidated
Note30 June 2018
$’00030 June 2017
$’000
(a) Dividends on ordinary shares declared and paid during the year:
Final partially franked dividend for the year ending 30 June 2017 of 15.0 cents per share, 9.0 cents (60%) franked (2017: final partially franked dividend for 2016 of 14.0 cents per share, 9.8 cents (70%) franked)
• Paid in cash (i) 19,514 18,213
Final dividend 19,514 18,213
Partially franked interim dividend for the year ending 30 June 2018 of 16.5 cents per share, 9.9 cents (60%) franked (2017: interim partially franked dividend for 2017 of 15.5 cents per share, 9.3 cents (60%) franked)
• Paid in cash (i) 21,466 20,165
Interim dividend 21,466 20,165
Total partially franked dividends declared and paid during the year of 31.5 cents per share, 18.9 cents (60%) franked (2017: 29.5 cents per share (19.1 cents (65%) franked))
(i) Total dividends paid in cash 40,980 38,378
Total dividends 40,980 38,378
(b) Dividends on ordinary shares proposed and not recognised as a liability:
Final partially franked dividend for 2018 of 16.5 cents per share, 9.9 cents (60%) franked (2017: final partially franked dividend of 15.0 cents per share, 9.0 cents (60%) franked) 21,466 19,514
(c) Franking credit balance
The amount of franking credits in the parent available for the subsequent year are:
• franking account balance as at the end of the year at 30% (2017: 30%) 1,464 1,290
• franking credits that will arise from the payment of income tax payable as at the end of the year 6,564 2,939
8,028 4,229
The amount of franking credits in the parent available for future reporting periods:
• impact on the franking account of dividends proposed or declared before the financial report was authorised for issue but not recognised as distribution to equity holders during the period (5,520) (5,018)
Total franking credit balance 2,508 (789)
The tax rate at which dividends are franked is 30% (2017: 30%).
For
per
sona
l use
onl
y
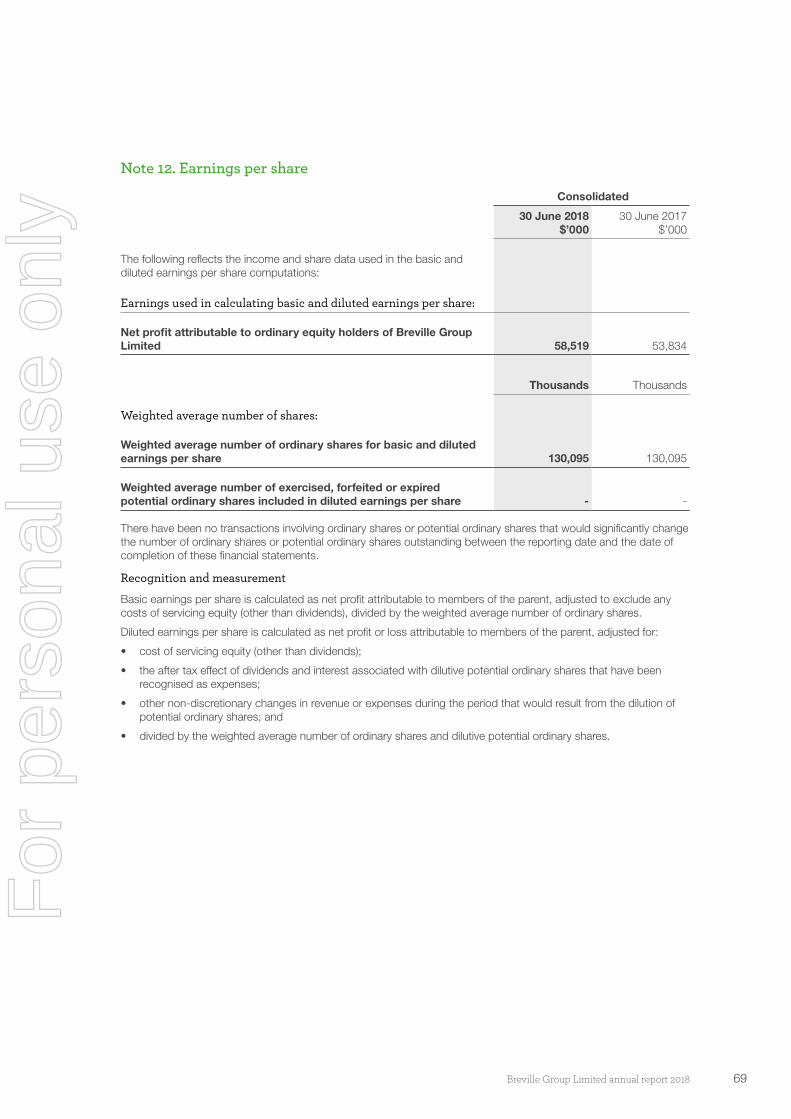
69Breville Group Limited annual report 2018
Note 12. Earnings per share
Consolidated
30 June 2018 $’000
30 June 2017 $’000
The following reflects the income and share data used in the basic and diluted earnings per share computations:
Earnings used in calculating basic and diluted earnings per share:
Net profit attributable to ordinary equity holders of Breville Group Limited 58,519 53,834
Thousands Thousands
Weighted average number of shares:
Weighted average number of ordinary shares for basic and diluted earnings per share 130,095 130,095
Weighted average number of exercised, forfeited or expired potential ordinary shares included in diluted earnings per share - -
There have been no transactions involving ordinary shares or potential ordinary shares that would significantly change the number of ordinary shares or potential ordinary shares outstanding between the reporting date and the date of completion of these financial statements.
Recognition and measurement
Basic earnings per share is calculated as net profit attributable to members of the parent, adjusted to exclude any costs of servicing equity (other than dividends), divided by the weighted average number of ordinary shares.
Diluted earnings per share is calculated as net profit or loss attributable to members of the parent, adjusted for:
• cost of servicing equity (other than dividends);
• the after tax effect of dividends and interest associated with dilutive potential ordinary shares that have been recognised as expenses;
• other non-discretionary changes in revenue or expenses during the period that would result from the dilution of potential ordinary shares; and
• divided by the weighted average number of ordinary shares and dilutive potential ordinary shares.
For
per
sona
l use
onl
y
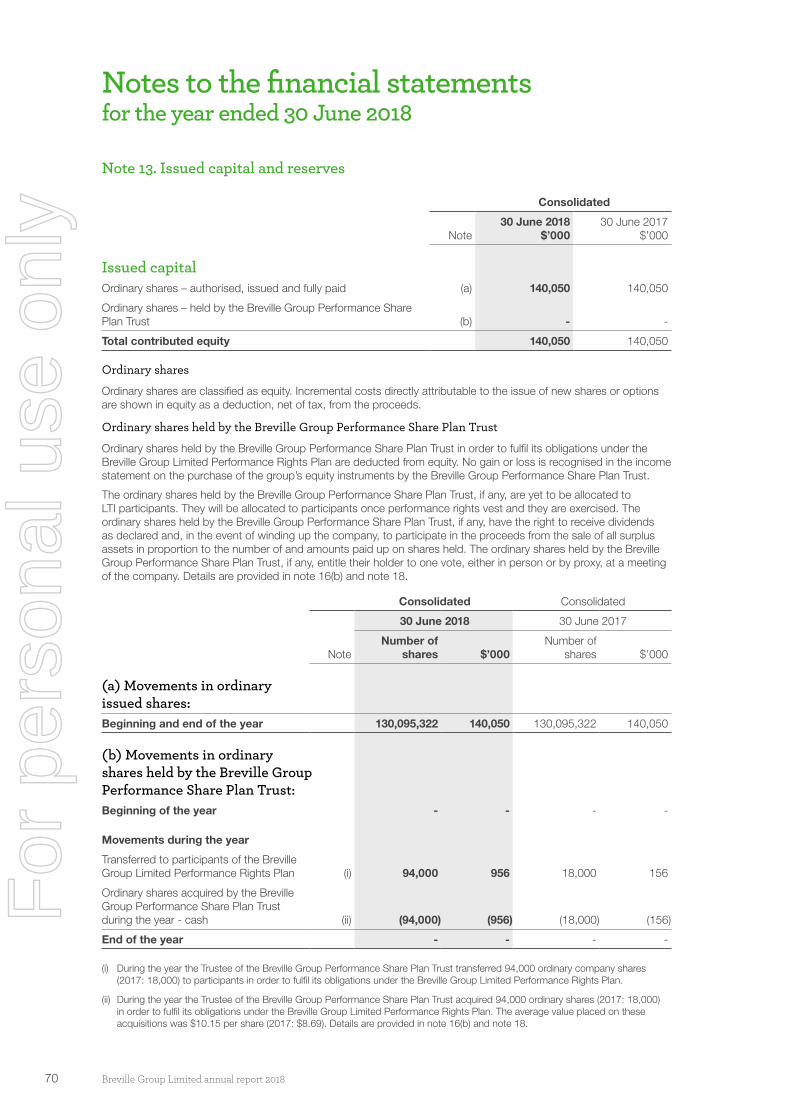
70 Breville Group Limited annual report 2018
Notes to the financial statements for the year ended 30 June 2018
Note 13. Issued capital and reserves
Consolidated
Note30 June 2018
$’00030 June 2017
$’000
Issued capitalOrdinary shares – authorised, issued and fully paid (a) 140,050 140,050
Ordinary shares – held by the Breville Group Performance Share Plan Trust (b) - -
Total contributed equity 140,050 140,050
Ordinary shares
Ordinary shares are classified as equity. Incremental costs directly attributable to the issue of new shares or options are shown in equity as a deduction, net of tax, from the proceeds.
Ordinary shares held by the Breville Group Performance Share Plan Trust
Ordinary shares held by the Breville Group Performance Share Plan Trust in order to fulfil its obligations under the Breville Group Limited Performance Rights Plan are deducted from equity. No gain or loss is recognised in the income statement on the purchase of the group’s equity instruments by the Breville Group Performance Share Plan Trust.
The ordinary shares held by the Breville Group Performance Share Plan Trust, if any, are yet to be allocated to LTI participants. They will be allocated to participants once performance rights vest and they are exercised. The ordinary shares held by the Breville Group Performance Share Plan Trust, if any, have the right to receive dividends as declared and, in the event of winding up the company, to participate in the proceeds from the sale of all surplus assets in proportion to the number of and amounts paid up on shares held. The ordinary shares held by the Breville Group Performance Share Plan Trust, if any, entitle their holder to one vote, either in person or by proxy, at a meeting of the company. Details are provided in note 16(b) and note 18.
Consolidated Consolidated
Note
30 June 2018 30 June 2017
Number of shares $’000
Number of shares $’000
(a) Movements in ordinary issued shares:Beginning and end of the year 130,095,322 140,050 130,095,322 140,050
(b) Movements in ordinary shares held by the Breville Group Performance Share Plan Trust:Beginning of the year - - - -
Movements during the year
Transferred to participants of the Breville Group Limited Performance Rights Plan (i) 94,000 956 18,000 156
Ordinary shares acquired by the Breville Group Performance Share Plan Trust during the year - cash (ii) (94,000) (956) (18,000) (156)
End of the year - - - -
(i) During the year the Trustee of the Breville Group Performance Share Plan Trust transferred 94,000 ordinary company shares (2017: 18,000) to participants in order to fulfil its obligations under the Breville Group Limited Performance Rights Plan.
(ii) During the year the Trustee of the Breville Group Performance Share Plan Trust acquired 94,000 ordinary shares (2017: 18,000) in order to fulfil its obligations under the Breville Group Limited Performance Rights Plan. The average value placed on these acquisitions was $10.15 per share (2017: $8.69). Details are provided in note 16(b) and note 18.
For
per
sona
l use
onl
y

71Breville Group Limited annual report 2018
(c) Performance rights over ordinary shares:The company has a share-based payment performance rights scheme under which rights to subscribe for the company’s shares have been granted to certain executives and other employees (refer note 18). At the end of the year there were 978,400 (2017: 914,400) potential unissued ordinary shares in respect of performance rights that were outstanding.
Consolidated
30 June 2018 $’000
30 June 2017 $’000
ReservesForeign currency translation reserve (1,124) (2,913)
Employee equity benefits reserve (1,972) (2,878)
Cash flow hedge reserve 2,401 (991)
Total reserves (695) (6,782)
Nature and purpose of reservesForeign currency translation reserve - This reserve is used to record exchange differences arising from the translation of the financial statements of foreign subsidiaries.
Employee equity benefits reserve - This reserve is used to record the value of equity benefits provided to employees as part of their remuneration. Refer to note 18 for further details of these plans.
Cash flow hedge reserve - This reserve records the portion of the gain or loss on a hedging instrument in a cash flow hedge that is determined to be an effective hedge.
Note 14. Borrowings
Consolidated
Note30 June 2018
$’00030 June 2017
$’000
Non-currentOther loans:
- Cash advance facilities 45,324 35,841
Total non-current borrowings 45,324 35,841
Terms and conditionsThe group operates under one primary facility with Australia and New Zealand Banking Group Limited (ANZ) enabling all jurisdictions to borrow under one global facility. The facility agreement has a number of financial covenants all of which have been fully complied with as at the years ended 30 June 2018 and 30 June 2017.
The Australia and New Zealand financing facilities are secured by a first ranking fixed and floating registered charge (or general security for Breville New Zealand Limited), over all the assets and undertakings of Thebe International Pty Limited, Breville Pty Limited, Breville Holdings Pty Limited, Breville R&D Pty Limited and Breville New Zealand Limited and are guaranteed by Breville Group Limited. The Hong Kong facility is secured via a security agreement over the assets and undertakings of HWI International Limited. A security agreement in favour of ANZ is in existence over the assets and undertakings of Breville USA, Inc. Breville Group Limited has issued corporate guarantees in favour of the local bank (HSBC) which provides the day to day US, Canadian and UK transactional banking facilities. Borrowings may include Australian dollar, US dollar, Canadian dollar, British pounds, Euro and New Zealand dollar denominated amounts.
Note 13. Issued capital and reserves continued
Issued capital continued
For
per
sona
l use
onl
y

72 Breville Group Limited annual report 2018
Fair valueThe carrying value and estimated net fair values of the borrowings held with banks (determined under Level 2, as described in note 15) approximates their fair value. Fair values of the company’s interest-bearing loans are determined by using a discounted cash flow method using a discount rate that reflects the issuer’s borrowing rate as at the end of the reporting period. The non-performance risk as at 30 June 2018 was assessed to be insignificant (2017: insignificant). Details regarding interest rate, foreign exchange and liquidity risk are disclosed in note 15.
Consolidated
Note30 June 2018
$’00030 June 2017
$’000
Financing facilities availableAt reporting date, the following financial facilities have been negotiated and were available to the group:Facilities used at the reporting date (a) 49,587 41,713Facilities unused at the reporting date (b) 53,036 19,872Total facilities (c) 102,623 61,585
(a) Facilities used at the reporting date:- Non-current cash advance facilities – committed 45,324 35,841- Non-current cash advance facilities – uncommitted - -- Overdraft facilities - 2,156- Business transactions facilities 496 513- Indemnity/guarantee facilities 3,767 3,203- Documentary credit facilities - -Facilities used as at reporting date 49,587 41,713
(b) Facilities unused at the reporting date:- Non-current cash advance facilities – committed 20,750 10,584- Non-current cash advance facilities – uncommitted 20,747 -- Overdraft facilities 9,965 7,474- Business transactions facilities 495 513- Indemnity/guarantee facilities - -- Documentary credit facilities 1,079 1,301Facilities unused as at reporting date 53,036 19,872
(c) Total facilities:- Non-current cash advance facilities – committed 66,074 46,425- Non-current cash advance facilities – uncommitted 20,747 -- Overdraft facilities 9,965 9,630- Business transactions facilities 991 1,026- Indemnity/guarantee facilities 3,767 3,203- Documentary credit facilities 1,079 1,301Total facilities 102,623 61,585
Notes to the financial statements for the year ended 30 June 2018
Note 14. Borrowings continued
For
per
sona
l use
onl
y

73Breville Group Limited annual report 2018
Note 14. Borrowings continued
Seasonal facilityUnder the primary facility with ANZ, the group also has a committed seasonal facility available between August 2018 and January 2019 which ranges from $26,986,911 up to $48,576,440 and a committed seasonal facility available between September 2018 and December 2018 of $7,186,858 (2017: $8,000,000 available between October 2017 and January 2018 and $12,358,688 available between June 2017 and March 2018). The group also introduced an uncommitted seasonal facility available from February 2018 to January 2019 of $6,746,728. These facilities are under the same terms and conditions as described above.
Borrowings may include Australian dollar, US dollar, Canadian dollar, British pounds, Euro and New Zealand dollar denominated amounts.
Recognition and measurement
All borrowings, including cash advance facilities, are initially recognised at the fair value of the consideration received less directly attributable transaction costs. After initial recognition, borrowings, including cash advance facilities, are subsequently measured at amortised cost using the effective interest method. Gains and losses are recognised in the income statement when the liabilities are derecognised.
Borrowings are classified as current liabilities unless the group has an unconditional right to defer settlement of the liability for at least 12 months after the balance sheet date.
Non-current borrowings at 30 June 2018 fall due in July 2019.
Since the end of the year, the Group reduced its committed non-current cash advance facilities by $33,733,639 in July 2018 and $10,689,471 in August 2018. Consequently, the total committed non-current cash advance facility was reduced to $21,651,000.
Note 15. Financial risk management
The group’s principal financial instruments, other than derivatives, comprises cash advances, bank overdrafts, cash at bank and short-term deposits.
The main purpose of these financial instruments is to raise finance for the group’s operations. The group has various other financial assets and liabilities such as trade receivables and trade payables, which arise directly from its operations. The group also enters into derivative transactions, primarily forward exchange contracts. The purpose is to manage the currency risks arising from the group’s business operations and its sources of finance. It is the group’s policy that no speculative trading in derivatives shall be undertaken. The main risks arising from the group’s financial instruments are foreign currency risk and credit risk. The board reviews and agrees policies for managing each of these risks and they are summarised below.
Recognition and measurement
Derivative financial instruments and hedging
The group may use derivative financial instruments such as forward exchange contracts to hedge its risks associated with foreign currency fluctuations. Such derivative financial instruments are initially recognised at fair value on the date on which a derivative contract is entered into and are subsequently remeasured to fair value. The fair value of the forward exchange contracts is estimated using market observable inputs. Derivatives are carried as assets when their fair value is positive and as liabilities when their fair value is negative.
Any gains or losses arising from changes in the fair value of derivatives, except for those that qualify for hedge accounting, are taken directly to the income statement for the year.
The fair value of forward exchange contracts are calculated by reference to current forward exchange rates for contracts with similar maturity profiles and where applicable, exercise prices.
For the purposes of hedge accounting, hedges are classified as cash flow hedges when they hedge exposure to variability in cash flows that is attributable either to a particular risk associated with a recognised asset or liability or to a forecast transaction.
At the inception of a hedge relationship, the group formally designates and documents the hedge relationship to which the group wishes to apply hedge accounting and the risk management objective and strategy for undertaking the hedge. The documentation includes identification of the hedging instrument, the hedged item or transaction, the nature of the risk being hedged and how the entity will assess the hedging instrument’s effectiveness in offsetting the exposure to changes in the hedged item’s cash flows attributable to the hedged risk. Such hedges are expected to be highly effective in achieving offsetting changes in cash flows and are assessed on an ongoing basis to determine that they actually have been highly effective throughout the financial reporting periods for which they were designated.
For
per
sona
l use
onl
y

74 Breville Group Limited annual report 2018
Notes to the financial statements for the year ended 30 June 2018
Hedges that meet the strict criteria for hedge accounting are accounted for as follows:
Cash flow hedges
Cash flow hedges are hedges of the group’s exposure to variability in cash flows that is attributable to a particular risk associated with a recognised asset or liability or a highly probable forecast transaction and that could affect profit or loss. The effective portion of the gain or loss on the hedging instrument is recognised directly in equity, while the ineffective portion is recognised in income statement.
Amounts taken to equity are transferred to the income statement when the hedged transaction affects profit or loss, such as when hedged income or expenses are recognised or when a forecast purchase occurs. When the hedged item is the cost of a non-financial asset or liability, the amounts taken to equity are transferred to the initial carrying amount of the non-financial asset or liability.
If the forecast transaction is no longer expected to occur, amounts previously recognised in equity are transferred to the income statement. If the hedging instrument expires or is sold, terminated or exercised without replacement or rollover, or if its designation as a hedge is revoked, amounts previously recognised in equity remain in equity until the forecast transaction occurs. If the related transaction is not expected to occur, the amount is taken to the income statement.
A hedge of the foreign currency risk of a firm commitment is accounted for as a cash flow hedge.
Interest rate riskThe group is exposed to interest rate risk on its borrowings, cash balances and derivative financial instruments. The group’s policy is to manage its interest rate risk using a mix of fixed and variable rate debt where appropriate. Cash advance facilities have short term fixed interest rates with maturities ranging between 1 and 3 months, therefore within the financial year they are exposed to interest rate risk.
At 30 June 2018, the group has the following exposure to interest rate risk:
Consolidated
30 June 2018 $’000
30 June 2017 $’000
Cash at bank 103,316 77,124
Cash advance facilities (45,324) (35,841)
Net exposure 57,992 41,283
At 30 June 2018, 100% of the Groups borrowings (2017: 100%) are exposed to floating rates. On a principal net receivable of $57,992,000 (2017: $41,283,000), at an average payable rate including line fee and margin of 2.5% (2017: 2.2%) and average receivable rate of 1.1% (2017: 0.8%), an increment of 0.5% in the market rates would result in a decrease in finance costs of $310,000 (2017: $206,000), conversely a decrement of 0.5% in the market rates would result in an increase in finance costs of $227,000 (2017: $170,000).
The group’s net exposure to interest rate risk calculated as at 30 June 2018 is not representative of its exposure during the financial year due to seasonality in the volume of sales such that financial performance is historically weighted in favour of the half to 31 December. This seasonality results in a higher level of receivable and inventory balances and a consequent increase in working capital requirements. All of the group’s borrowings during the year (2017 average borrowings: 100%) are at a floating rate of interest. On an average principal net receivable during the year of $23,699,000 (2017: $49,031,000), at an average payable rate including margin of 2.5% (2017: 2.2%) and average receivable rate of 1.1% (2017: 0.8%), an increment of 0.5% in the market rates would result in a decrease in finance costs of $85,000 (2017: $245,000), conversely a decrement of 0.5% in the market rates would result in an increase in finance costs of $41,000 (2017: $192,000).
Note 15. Financial risk management continued
Recognition and measurement continued
For
per
sona
l use
onl
y

75Breville Group Limited annual report 2018
Foreign currency riskThe group undertakes certain transactions denominated in foreign currency and is exposed to foreign exchange rate fluctuations. Such exposure arises primarily from purchases of inventory by a business unit in currencies other than the unit’s functional currency (purchases are predominately US dollar denominated). Other foreign exchange risk only arises when future commercial transactions and recognised assets and liabilities are denominated in a currency that is not the entity’s functional currency.
To hedge exposure arising from the purchase of inventories or payments in currencies other than the business unit’s functional currency, forward exchange contracts may be utilised. At inception these hedge contracts are designated as cash flow hedges to hedge the exposure to the variability in cash flows arising as a result of movements in exchange rates below contracted exchange rates for options and for movements above or below a contracted exchange rate for forward exchange contracts.
Also, as a result of the group’s investment in its overseas operations, the group’s balance sheet can be affected significantly by movements in the exchange rates of the jurisdictions it operates within.
At 30 June 2018, the group has the following financial assets and liabilities exposed to foreign currency risk:
Consolidated
30 June 2018 $’000
30 June 2017 $’000
Cash at bank 10,000 7,675
Trade and other receivables 2,065 1,101
Trade and other payables (9,070) (13,060)
Other financial assets – derivative assets – forward exchange contracts 3,721 422
Other financial liabilities – derivative liabilities – forward exchange contracts (291) (1,837)
Net exposure 6,425 (5,699)
Of the total net exposure above, an increment of 10% in the foreign exchange rates would result in an increase in other expenses of $272,000 (2017: decrease $334,000). A decrement of 10% in the foreign exchange rates would result in a decrease in other expenses of $333,000 (2017: increase $554,000).
Instruments used by the groupDerivative financial instruments are used by the group in the normal course of business in order to hedge exposures to fluctuations in interest and foreign exchange rates.
The Group uses the following hierarchy for determining and disclosing the fair value of financial instruments by valuation technique:
Level 1: quoted (unadjusted) prices in active markets for identical assets or liabilities.
Level 2: other techniques for which all inputs that have a significant effect on the recorded fair value are observable, either directly or indirectly.
Level 3: techniques that use inputs that have a significant effect on the recorded fair value that are not based on observable market data.
The fair value of all derivative assets and liabilities have been determined under Level 2.
Note 15. Financial risk management continued
For
per
sona
l use
onl
y

76 Breville Group Limited annual report 2018
(i) Forward exchange contracts – cash flow hedges
The majority of the group’s inventory purchases from suppliers are denominated in US dollars (US$). In order to manage exchange rate movements and to manage the inventory costing process, the group has entered into forward exchange contracts to purchase US$, Euro and CHF. These contracts are hedging highly probable forecasted purchases and highly probable forecasted payments and they are timed to mature when settlement of purchases or the payments are scheduled to be made. All forward exchange contracts have 0-12 months maturity (2017: 0-12 months).
The cash flows are expected to occur between 0-12 months from 1 July 2018 (2017: 0-12 months) and the cost of sales and where applicable the sale of goods within the income statement will be affected in the next financial year as the inventory is sold or the payments are made. At balance date, the details of outstanding contracts are:
Consolidated
30 June 2018 A$’000
30 June 2017 A$’000
Buy US$ 97,220 63,237
Buy Euro 3,027 2,257
Buy CHF 8,572 8,176
The cash flow hedges of the forecast purchases and forecast payments are considered to be highly effective and any gain or loss on the contracts is taken directly to equity. Where the contracts are hedging highly probable forecasted inventory purchases, when the inventory is received or the risk is assumed, the amount recognised in equity is adjusted to the inventory account in the balance sheet. Where the contracts are hedging highly probable forecasted payments, when the payments are made the amount recognised in equity is adjusted to the income statement. During the year $2,447,000 was debited to inventory (2017: $1,674,000 debited) and $2,398,000 was credited (2017: $2,039,000 debited) to equity in respect of the group.
At 30 June 2018, the group had hedged 44% (2017: 31%) of its foreign currency purchases extending to June 2019 (2017: June 2018). The remaining 56% (2017: 69%) is exposed to foreign exchange risk.
In respect of net derivative assets and liabilities above, being the fair value of forward exchange contracts designated as cash flow hedges, a decrease of 10% in the US dollar exchange rate against local currencies, all other variables held constant, would result in an increase in equity of $10,243,000 (2017: $4,461,000). Conversely, an increase of 10% in the US dollar exchange rate against local currencies, all other variables held constant, would result in a decrease in equity of $7,089,000 (2017: $3,622,000).
Capital managementThe board’s policy is to maintain a strong capital base so as to maintain investor, creditor and market confidence and to sustain future development of the business.
The board seeks to maintain a balance between the higher returns that might be possible with higher levels of borrowings and the advantages and security afforded by a sound capital position. The board monitors the group’s gearing ratio and compliance with debt covenants on a regular basis. The group’s gearing ratio at 30 June 2018 and 30 June 2017 is nil due to the group being in a net cash position. The gearing ratio is defined as group net borrowings divided by capital employed (net borrowings plus shareholders’ equity).
Note 15. Financial risk management continued
Instruments used by the group continued
Notes to the financial statements for the year ended 30 June 2018
For
per
sona
l use
onl
y
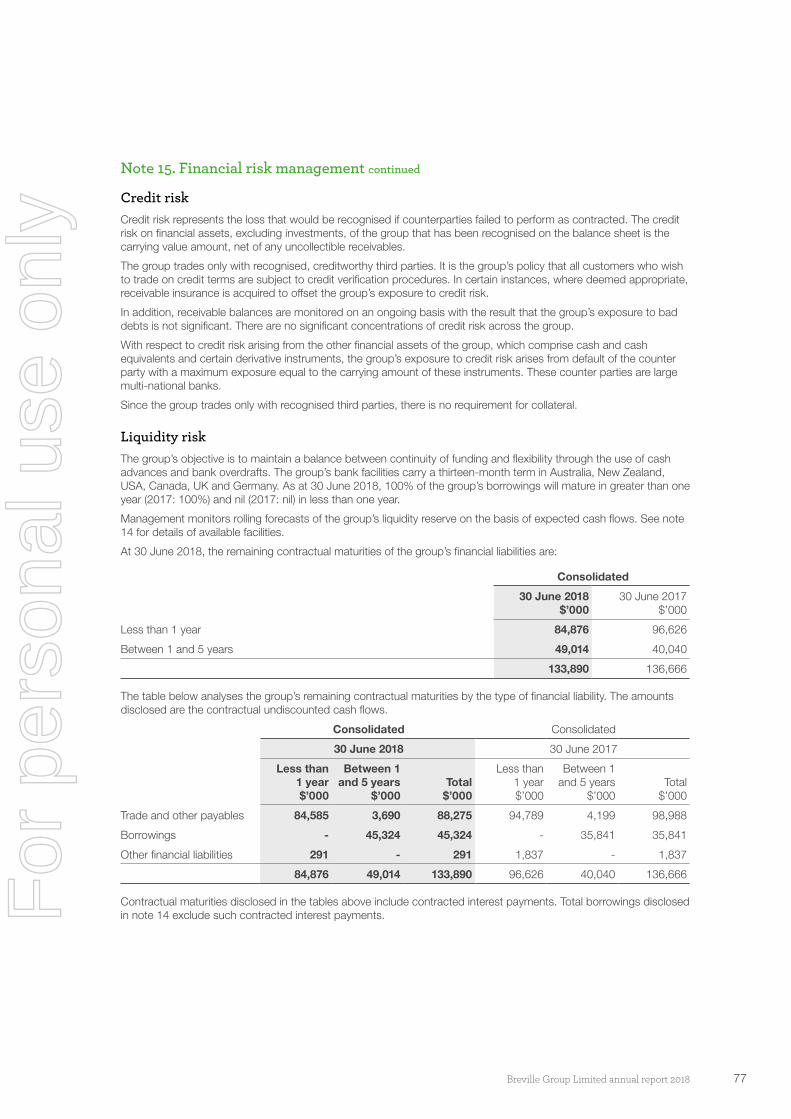
77Breville Group Limited annual report 2018
Credit riskCredit risk represents the loss that would be recognised if counterparties failed to perform as contracted. The credit risk on financial assets, excluding investments, of the group that has been recognised on the balance sheet is the carrying value amount, net of any uncollectible receivables.
The group trades only with recognised, creditworthy third parties. It is the group’s policy that all customers who wish to trade on credit terms are subject to credit verification procedures. In certain instances, where deemed appropriate, receivable insurance is acquired to offset the group’s exposure to credit risk.
In addition, receivable balances are monitored on an ongoing basis with the result that the group’s exposure to bad debts is not significant. There are no significant concentrations of credit risk across the group.
With respect to credit risk arising from the other financial assets of the group, which comprise cash and cash equivalents and certain derivative instruments, the group’s exposure to credit risk arises from default of the counter party with a maximum exposure equal to the carrying amount of these instruments. These counter parties are large multi-national banks.
Since the group trades only with recognised third parties, there is no requirement for collateral.
Liquidity riskThe group’s objective is to maintain a balance between continuity of funding and flexibility through the use of cash advances and bank overdrafts. The group’s bank facilities carry a thirteen-month term in Australia, New Zealand, USA, Canada, UK and Germany. As at 30 June 2018, 100% of the group’s borrowings will mature in greater than one year (2017: 100%) and nil (2017: nil) in less than one year.
Management monitors rolling forecasts of the group’s liquidity reserve on the basis of expected cash flows. See note 14 for details of available facilities.
At 30 June 2018, the remaining contractual maturities of the group’s financial liabilities are:
Consolidated
30 June 2018 $’000
30 June 2017 $’000
Less than 1 year 84,876 96,626
Between 1 and 5 years 49,014 40,040
133,890 136,666
The table below analyses the group’s remaining contractual maturities by the type of financial liability. The amounts disclosed are the contractual undiscounted cash flows.
Consolidated Consolidated
30 June 2018 30 June 2017
Less than 1 year$’000
Between 1 and 5 years
$’000Total
$’000
Less than 1 year$’000
Between 1 and 5 years
$’000Total
$’000
Trade and other payables 84,585 3,690 88,275 94,789 4,199 98,988
Borrowings - 45,324 45,324 - 35,841 35,841
Other financial liabilities 291 - 291 1,837 - 1,837
84,876 49,014 133,890 96,626 40,040 136,666
Contractual maturities disclosed in the tables above include contracted interest payments. Total borrowings disclosed in note 14 exclude such contracted interest payments.
Note 15. Financial risk management continued
For
per
sona
l use
onl
y
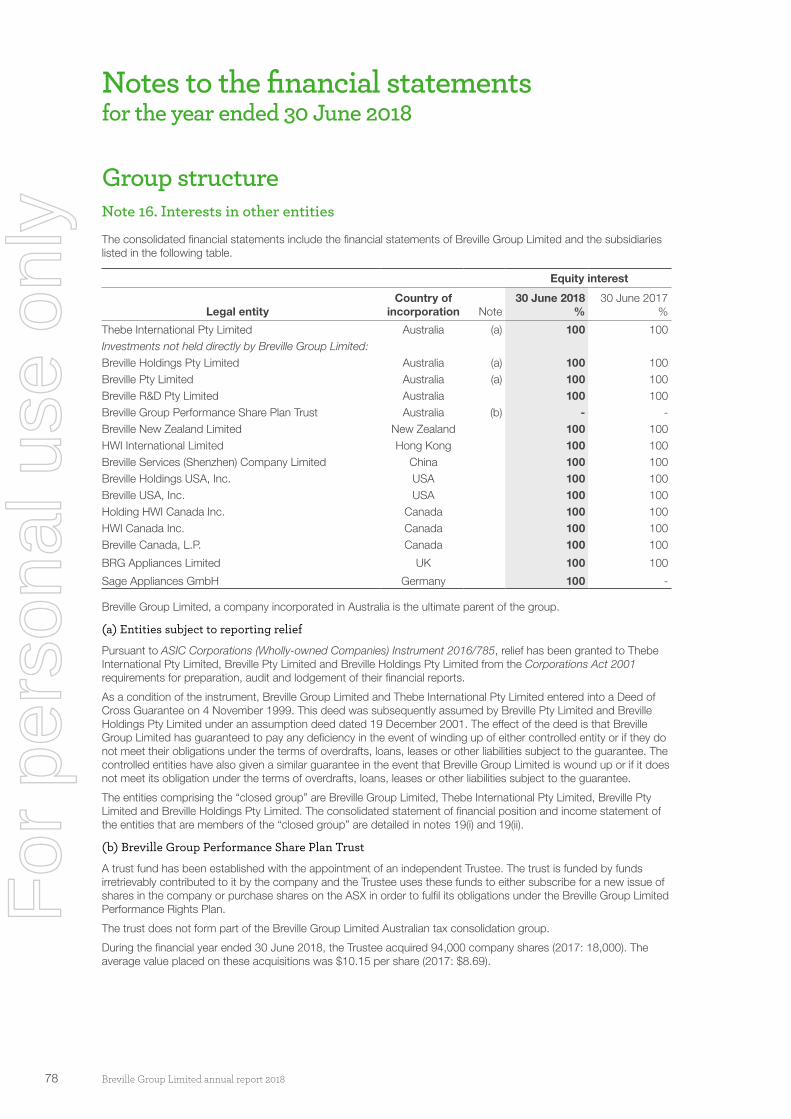
78 Breville Group Limited annual report 2018
Group structureNote 16. Interests in other entities
The consolidated financial statements include the financial statements of Breville Group Limited and the subsidiaries listed in the following table.
Equity interest
Legal entityCountry of
incorporation Note30 June 2018
%30 June 2017
%
Thebe International Pty Limited Australia (a) 100 100Investments not held directly by Breville Group Limited:Breville Holdings Pty Limited Australia (a) 100 100Breville Pty Limited Australia (a) 100 100Breville R&D Pty Limited Australia 100 100Breville Group Performance Share Plan Trust Australia (b) - -Breville New Zealand Limited New Zealand 100 100HWI International Limited Hong Kong 100 100Breville Services (Shenzhen) Company Limited China 100 100Breville Holdings USA, Inc. USA 100 100Breville USA, Inc. USA 100 100Holding HWI Canada Inc. Canada 100 100HWI Canada Inc. Canada 100 100Breville Canada, L.P. Canada 100 100
BRG Appliances Limited UK 100 100
Sage Appliances GmbH Germany 100 -
Breville Group Limited, a company incorporated in Australia is the ultimate parent of the group.
(a) Entities subject to reporting relief
Pursuant to ASIC Corporations (Wholly-owned Companies) Instrument 2016/785, relief has been granted to Thebe International Pty Limited, Breville Pty Limited and Breville Holdings Pty Limited from the Corporations Act 2001 requirements for preparation, audit and lodgement of their financial reports.
As a condition of the instrument, Breville Group Limited and Thebe International Pty Limited entered into a Deed of Cross Guarantee on 4 November 1999. This deed was subsequently assumed by Breville Pty Limited and Breville Holdings Pty Limited under an assumption deed dated 19 December 2001. The effect of the deed is that Breville Group Limited has guaranteed to pay any deficiency in the event of winding up of either controlled entity or if they do not meet their obligations under the terms of overdrafts, loans, leases or other liabilities subject to the guarantee. The controlled entities have also given a similar guarantee in the event that Breville Group Limited is wound up or if it does not meet its obligation under the terms of overdrafts, loans, leases or other liabilities subject to the guarantee.
The entities comprising the “closed group” are Breville Group Limited, Thebe International Pty Limited, Breville Pty Limited and Breville Holdings Pty Limited. The consolidated statement of financial position and income statement of the entities that are members of the “closed group” are detailed in notes 19(i) and 19(ii).
(b) Breville Group Performance Share Plan Trust
A trust fund has been established with the appointment of an independent Trustee. The trust is funded by funds irretrievably contributed to it by the company and the Trustee uses these funds to either subscribe for a new issue of shares in the company or purchase shares on the ASX in order to fulfil its obligations under the Breville Group Limited Performance Rights Plan.
The trust does not form part of the Breville Group Limited Australian tax consolidation group.
During the financial year ended 30 June 2018, the Trustee acquired 94,000 company shares (2017: 18,000). The average value placed on these acquisitions was $10.15 per share (2017: $8.69).
Notes to the financial statements for the year ended 30 June 2018
For
per
sona
l use
onl
y

79Breville Group Limited annual report 2018
Note 17. Parent entity informationAs at and throughout the financial year ended 30 June 2018 the parent company of the group was Breville Group Limited.
30 June 2018 $’000
30 June 2017 $’000
Results of the parent entityProfit of the parent entity 40,467 38,525
Total comprehensive income of the parent entity 40,467 38,525
Financial position of the parent entityCurrent assets 73,753 70,238
Total assets 148,875 145,289
Current liabilities (6,132) (2,939)
Total liabilities (6,132) (2,939)
Net assets 142,743 142,350
Equity attributable to the equity holders of the parent
Issued capital 140,050 140,050
Employee equity benefits reserve (1,972) (2,878)
Retained earnings 4,665 5,178
Total shareholders’ equity 142,743 142,350
ContingenciesThe parent company has guaranteed under the terms of an ASIC class order any deficiency of funds if Thebe International Pty Limited, Breville Pty Limited and Breville Holdings Pty Limited are wound up. No such deficiency currently exists.
The parent company has issued corporate guarantees in favour of the HSBC local banks in the US, Canada and the UK which provides the day to day US, Canadian and UK transactional banking facilities.
Tax consolidationBreville Group Limited and its 100% owned Australian resident subsidiaries (excluding the Breville Group Performance Share Plan Trust) have formed a tax consolidated group with effect from 1 July 2003.
The head entity, Breville Group Limited, and each subsidiary in the tax consolidated group are required to account for their own current and deferred tax amounts. These tax amounts are measured as if each entity in the tax consolidated group continues to be a stand alone tax payer in its own right.
In addition to its own current and deferred tax amounts, Breville Group Limited also recognises:
(a) the current tax liabilities (or assets) and the deferred tax assets arising from unused tax losses and unused tax credits assumed from controlled entities in the tax consolidated group; and
(b) assets or liabilities arising for Breville Group Limited under the tax funding agreement as amounts receivable from or payable to other entities in the group.
Members of the tax consolidated group have entered into a tax funding agreement. The tax funding agreement supports the calculation of current tax liabilities (and assets) and deferred tax assets/liabilities on a stand-alone basis. Calculation is performed in accordance with AASB 112 Income Tax. The allocation of taxes under the tax funding agreement is recognised as an increase/decrease in the subsidiaries’ intercompany accounts with the tax consolidated group head company, Breville Group Limited.
No amounts have been recognised in the financial statements in respect of the tax sharing agreement should the head entity default on its tax payment obligations on the basis that the possibility of default is remote.
For
per
sona
l use
onl
y

80 Breville Group Limited annual report 2018
OtherNote 18. Share-based payments
Performance rights planUnder the performance rights plan participants are issued with performance rights over the ordinary shares of Breville Group Limited issued in accordance with the Breville Group Limited Performance Rights Plan (PRP). See page 27 and 28 of the Remuneration report for details of the performance rights plans.
At 30 June 2018 there were 978,440 (2017: 914,400) performance rights outstanding under this plan. The expense recognised in the income statement in relation to share-based payments is disclosed in note 3(e).
Recognition and measurement
Performance rights issued to employees (including key management personnel) are accounted for as share-based payments, whereby employees render services in exchange for shares or rights over shares (equity-settled transactions). The cost of these equity-settled transactions with employees is measured by reference to the fair value of the equity instruments at the date at which they are granted. The fair value has been determined by an external valuer using a Black Scholes or Monte-Carlo model, further details of which are given below.
Service and non-market performance conditions are not taken into account when determining the grant date fair value of the awards, but the likelihood of the conditions being met is assessed as part of the Group’s best estimate of the number of equity instruments that will ultimately vest. Market based performance conditions are reflected within the grant date fair value.
The cost of equity-settled transactions is recognised, together with a corresponding increase in equity, over the period in which the performance and/or service conditions are fulfilled (the vesting period), ending on the date on which the relevant employees become fully entitled to the award (the vesting date). At each subsequent reporting date until vesting, the cumulative charge to the income statement is the product of (i) the grant date fair value of the award; (ii) the current best estimate of the number of awards that will vest, taking into account such factors as the likelihood of employee turnover during the vesting period and the likelihood of non-market performance conditions being met; and (iii) the expired portion of the vesting period. The charge to the income statement for the period is the cumulative amount as calculated above less the amounts already charged in previous periods. There is a corresponding entry to equity.
No expense is recognised for awards that do not ultimately vest because non-market performance and/or service conditions have not been met. Where awards include a market or non-vesting condition, the transactions are treated as vested irrespective of whether the market or non-vesting condition is satisfied, provided that all other performance and/or service conditions are satisfied.
Performance rights granted under the performance rights planThe following table illustrates the number and weighted average exercise prices (“WAEP”) of and movements in performance rights issued during the year:
Note
30 June 2018 30 June 2017
Number of performance
rights WAEP
Number of performance
rights WAEP
Outstanding at the beginning of the year 914,400 0.0000 696,700 0.0000
Performance rights granted during the year 363,900 0.0000 374,500 0.0000
Performance rights exercised during the year (94,000) 0.0000 (18,000) 0.0000
Performance rights lapsed during the year (205,860) 0.0000 (138,800) 0.0000
Outstanding at the end of the year (a) 978,440 0.0000 914,400 0.0000
Exercisable at the end of the year - - - -
Notes to the financial statements for the year ended 30 June 2018
For
per
sona
l use
onl
y

81Breville Group Limited annual report 2018
Notes
(a) The outstanding balance as at 30 June 2018 is represented by:
Number of performance rights Note * Grant date Vesting date Expiry date WAEP $
Fair value at grant date ($)
79,470 (i) 12-Feb-16 29-Aug-18 3-Oct-18 0.0000 2.07
79,470 (ii) 12-Feb-16 29-Aug-19 3-Oct-19 0.0000 2.15
30,100 (iii) 12-Feb-16 31-Dec-18 31-Mar-19 0.0000 4.56
44,350 (iv) 12-Feb-16 25-Jan-19 31-Mar-19 0.0000 4.56
44,350 (v) 12-Feb-16 25-Jan-20 31-Mar-20 0.0000 4.35
1,100 (i) 16-Mar-16 29-Aug-18 3-Oct-18 0.0000 2.07
1,100 (ii) 16-Mar-16 29-Aug-19 3-Oct-19 0.0000 2.15
113,700 (vi) 9-Aug-16 29-Aug-18 3-Oct-18 0.0000 3.43
112,300 (vii) 9-Aug-16 29-Aug-19 3-Oct-19 0.0000 3.49
112,300 (viii) 9-Aug-16 31-Aug-20 2-Oct-20 0.0000 3.51
60,000 (ix) 13-Nov-17 31-Aug-20 1-Oct-20 0.0000 10.12
2,500 (x) 13-Nov-17 29-Aug-19 1-Oct-19 0.0000 10.56
98,800 (xi) 13-Nov-17 29-Aug-19 1-Oct-19 0.0000 7.05
99,800 (xii) 13-Nov-17 28-Aug-20 1-Oct-20 0.0000 6.81
99,100 (xiii) 13-Nov-17 27-Aug-21 1-Oct-21 0.0000 6.68
978,440 0.0000
(i) These performance rights vest based on the group’s total shareholder return (TSR) from 30 June 2015 to 30 June 2018 applying both an absolute test and a relative test measured against a TSR peer group.
(ii) These performance rights vest based on the group’s total shareholder return (TSR) from 30 June 2015 to 30 June 2019 applying both an absolute test and a relative test measured against a TSR peer group.
(iii) Performance condition being that the participant must be employed by the company on 31 December 2018.
(iv) Performance condition being that the participant must be employed by the company on 25 January 2019.
(v) Performance condition being that the participant must be employed by the company on 25 January 2020.
(vi) These performance rights vest based on the group’s total shareholder return (TSR) from 30 June 2016 to 30 June 2018 applying both an absolute test and a relative test measured against a TSR peer group.
(vii) These performance rights vest based on the group’s total shareholder return (TSR) from 30 June 2016 to 30 June 2019 applying both an absolute test and a relative test measured against a TSR peer group.
(viii) These performance rights vest based on the group’s total shareholder return (TSR) from 30 June 2016 to 30 June 2020 applying both an absolute test and a relative test measured against a TSR peer group.
(ix) Performance condition being that the participant must be employed by the company on 30 June 2020.
(x) Performance condition being that the participant must meet an internal KPI measure on 30 June 2018.
(xi) These performance rights vest based on the group’s total shareholder return (TSR) from 30 June 2017 to 30 June 2019 applying both an absolute test and a relative test measured against a TSR peer group.
(xii) These performance rights vest based on the group’s total shareholder return (TSR) from 30 June 2017 to 30 June 2020 applying both an absolute test and a relative test measured against a TSR peer group.
(xiii) These performance rights vest based on the group’s total shareholder return (TSR) from 30 June 2017 to 30 June 2021 applying both an absolute test and a relative test measured against a TSR peer group.
* Excluding (iii), (iv), (v), (ix) and (x), in addition to the EPS, TSR or internal KPI measure performance hurdle, the participant must be employed by the company on the vesting date.
Note 18. Share-based payments continued
Performance rights granted under the performance rights plan continued
For
per
sona
l use
onl
y

82 Breville Group Limited annual report 2018
The average remaining contractual life for the performance rights outstanding at 30 June 2018 is between 1 and 4 years (2017: 1 and 4 years).
The exercise price for performance rights outstanding at the end of the year was $nil (2017: $nil).
The weighted average fair value of performance rights granted during the year was $7.41 (2017: $3.48).
The fair value of the equity-settled performance rights granted under the performance rights plan, is estimated as at the date of grant using a Black-Scholes or Monte-Carlo option-pricing model, taking into account the terms and conditions upon which the options and performance rights were granted.
The following table lists the inputs to the model used for the grants during the year ended 30 June 2018 and 30 June 2017:
30 June 2018
30 June 2018
30 June 2018
30 June 2018
30 June 2018
30 June 2017
30 June 2017
30 June 2017
(Black- Scholes)
(Black-Scholes)
(Monte- Carlo)
(Monte- Carlo)
(Monte- Carlo)
(Monte- Carlo)
(Monte- Carlo)
(Monte- Carlo)
Grant date 13 Nov 17 13 Nov 17 13 Nov 17 13 Nov 17 13 Nov 17 9 Aug 16 9 Aug 16 9 Aug 16
Vesting date 31 Aug 20 29 Aug 19 29 Aug 19 28 Aug 20 27 Aug 21 29 Aug 18 29 Aug 19 31 Aug 20
Dividend yield (%) 3.50 3.50 3.50 3.50 3.50 3.50 3.50 3.50
Expected volatility (%) 32.00 32.00 32.00 32.00 32.00 34.00 34.00 34.00
Historical volatility (%) 32.00 32.00 32.00 32.00 32.00 34.00 34.00 34.00
Risk-free interest rate (%) 1.80 1.80 1.80 1.80 1.80 1.50 1.50 1.50
Expected life of performance right 2.8 years 1.8 years 1.8 years 2.8 years 3.8 years 2.1 years 3.1 years 4.1 years
Performance right exercise price ($) 0.00 0.00 0.00 0.00 0.00 0.00 0.00 0.00
Weighted average share price ($)1 12.64 12.64 12.64 12.64 12.64 7.93 7.93 7.93
Weighted average fair value ($)1 10.12 10.56 7.05 6.81 6.68 3.43 3.49 3.51
1) At grant date
The expected life of the performance rights is based on historical data and is not necessarily indicative of exercise patterns that may occur. The expected volatility reflects the assumption that the historical volatility is indicative of future trends, which may also not necessarily be the actual outcome. No other features of performance rights granted were incorporated into the measurement of fair value.
Note 18. Share-based payments continued
Performance rights granted under the performance rights plan continued
Notes to the financial statements for the year ended 30 June 2018
For
per
sona
l use
onl
y
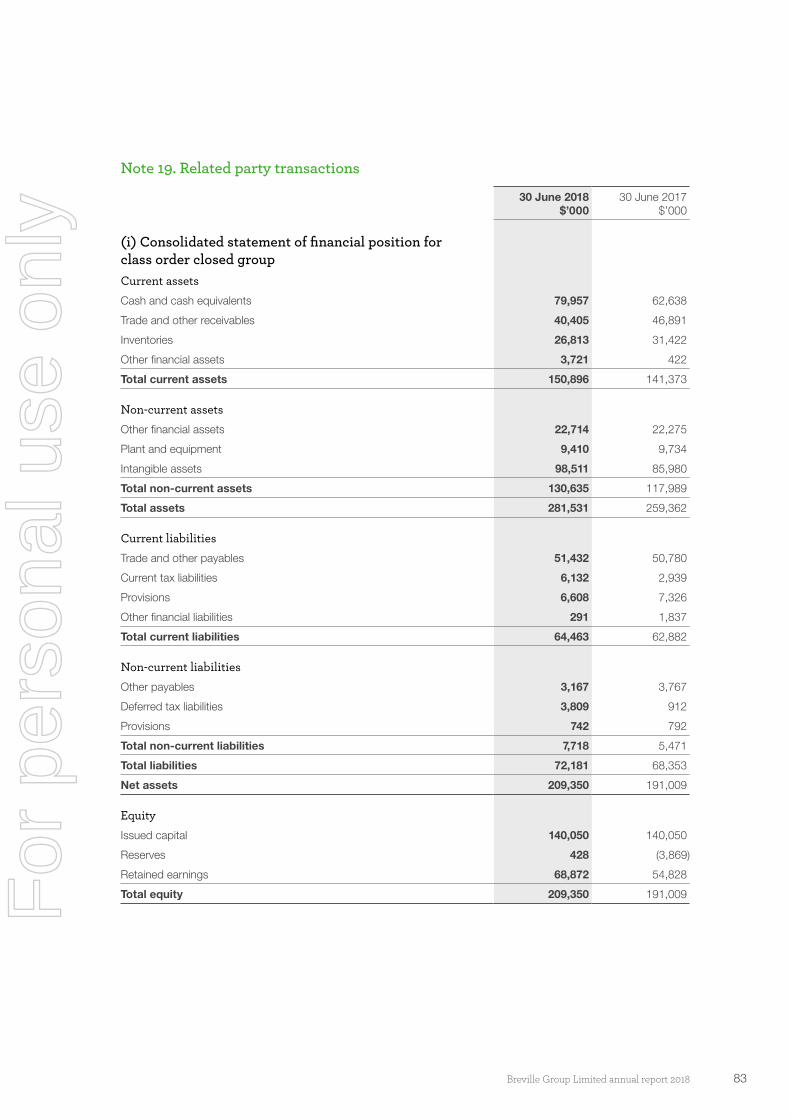
83Breville Group Limited annual report 2018
Note 19. Related party transactions
30 June 2018 $’000
30 June 2017 $’000
(i) Consolidated statement of financial position for class order closed groupCurrent assets
Cash and cash equivalents 79,957 62,638
Trade and other receivables 40,405 46,891
Inventories 26,813 31,422
Other financial assets 3,721 422
Total current assets 150,896 141,373
Non-current assets
Other financial assets 22,714 22,275
Plant and equipment 9,410 9,734
Intangible assets 98,511 85,980
Total non-current assets 130,635 117,989
Total assets 281,531 259,362
Current liabilities
Trade and other payables 51,432 50,780
Current tax liabilities 6,132 2,939
Provisions 6,608 7,326
Other financial liabilities 291 1,837
Total current liabilities 64,463 62,882
Non-current liabilities
Other payables 3,167 3,767
Deferred tax liabilities 3,809 912
Provisions 742 792
Total non-current liabilities 7,718 5,471
Total liabilities 72,181 68,353
Net assets 209,350 191,009
Equity
Issued capital 140,050 140,050
Reserves 428 (3,869)
Retained earnings 68,872 54,828
Total equity 209,350 191,009For
per
sona
l use
onl
y
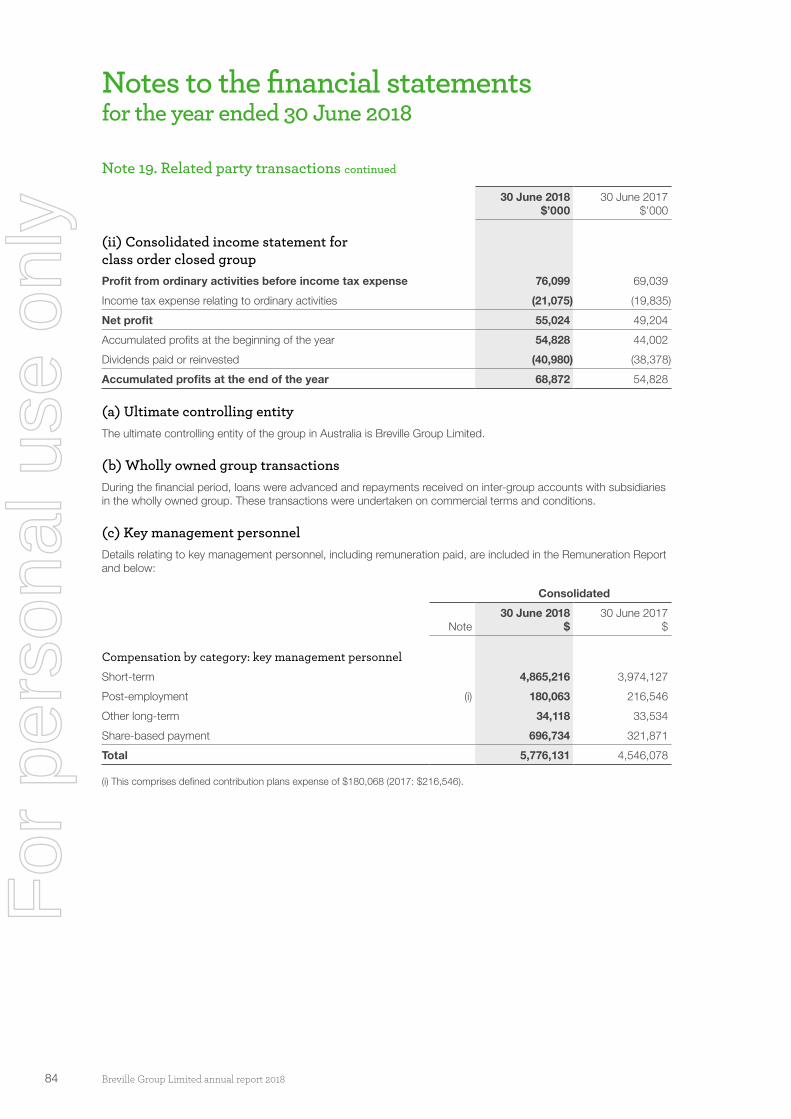
84 Breville Group Limited annual report 2018
Note 19. Related party transactions continued
30 June 2018 $’000
30 June 2017 $’000
(ii) Consolidated income statement for class order closed groupProfit from ordinary activities before income tax expense 76,099 69,039
Income tax expense relating to ordinary activities (21,075) (19,835)
Net profit 55,024 49,204
Accumulated profits at the beginning of the year 54,828 44,002
Dividends paid or reinvested (40,980) (38,378)
Accumulated profits at the end of the year 68,872 54,828
(a) Ultimate controlling entityThe ultimate controlling entity of the group in Australia is Breville Group Limited.
(b) Wholly owned group transactionsDuring the financial period, loans were advanced and repayments received on inter-group accounts with subsidiaries in the wholly owned group. These transactions were undertaken on commercial terms and conditions.
(c) Key management personnelDetails relating to key management personnel, including remuneration paid, are included in the Remuneration Report and below:
Consolidated
Note30 June 2018
$30 June 2017
$
Compensation by category: key management personnel
Short-term 4,865,216 3,974,127
Post-employment (i) 180,063 216,546
Other long-term 34,118 33,534
Share-based payment 696,734 321,871
Total 5,776,131 4,546,078
(i) This comprises defined contribution plans expense of $180,068 (2017: $216,546).
Notes to the financial statements for the year ended 30 June 2018
For
per
sona
l use
onl
y

85Breville Group Limited annual report 2018
Note 20. Auditor’s remuneration
Consolidated
30 June 2018 $
30 June 2017 $
Amounts received or due and receivable from the entity and any other entity in the consolidated entity:
PricewaterhouseCoopers Australia – primary auditors
Parent entity
Audit or review services 416,099 416,099
Taxation and accounting advisory services 208,604 248,200
Network Firms of PricewaterhouseCoopers Australia
Controlled entities
Audit or review services 136,576 136,576
Taxation and accounting advisory services 333,266 186,769
Total auditor’s remuneration 1,094,545 987,644
Note 21. Commitments and contingencies
Operating lease commitments – group as lesseeOperating leases are entered into mainly as a means of acquiring access to commercial property and storage facilities and the use of minor items of plant and equipment. Rental payments are generally fixed; however certain property leases contain a rental inflation escalation clause, an agreed rental percentage increase clause, a market rental review clause or a mix of these clauses over the term of the operating lease.
Future minimum rentals payable under non-cancellable operating leases as at 30 June are as follows:
Consolidated
30 June 2018 $’000
30 June 2017 $’000
Within one year 7,787 7,490
After one year but not later than five years 23,817 28,076
More than five years 3,808 7,495
Total future minimum rentals payable 35,412 43,061
Contingent rentals are determined with reference to known existing rental payments and known rental increases during the existing term of each operating lease.
No purchase options exist in relation to operating leases and no operating lease contains restrictions on financing or other leasing activities. Certain property leases contain renewal option clauses.
ContingenciesIndemnity agreements have been entered into with certain officers of the group in respect of expenses and liabilities they incur in their official capacities. No monetary limit applies to these agreements and no known obligations have emerged as a result of these agreements.
Cross guarantees given by Breville Group Limited, Thebe International Pty Limited, Breville Holdings Pty Limited and Breville Pty Limited are described in note 16(a).
Breville Group Limited has issued corporate guarantees in favour of the local bank (HSBC) which provides the day to day US, Canadian and UK transactional banking facilities.
For
per
sona
l use
onl
y

86 Breville Group Limited annual report 2018
Notes to the financial statements for the year ended 30 June 2018
Note 22. Significant events after year end
No matters or circumstances have arisen since the end of the year which significantly affected or may affect the operations of the consolidated entity.
The financial report of Breville Group Limited for the year ended 30 June 2018 was authorised for issue in accordance with a resolution of the directors on 16 August 2018.
Note 23. Other accounting policies
Foreign currency translation
(i) Functional and presentation currency
Both the functional and presentation currency of Breville Group Limited and its Australian subsidiaries are Australian dollars (AUD or A$). Each entity in the group determines its own functional currency and items included in the financial statements of each entity are measured using that functional currency.
(ii) Transactions and balances
Transactions in foreign currencies are initially recorded in the functional currency at the exchange rates ruling at the date of the transaction. Monetary assets and liabilities denominated in foreign currencies are retranslated at the rate of exchange ruling at the balance sheet date.
Non-monetary items that are measured in terms of historical cost in a foreign currency are translated using the exchange rate as at the date of the initial transaction. Non-monetary items measured at fair value in a foreign currency are translated using the exchange rates at the date when the fair value was determined.
The functional currency of the foreign subsidiaries is either:
• USD - United States dollar (Breville Holdings USA, Inc. and Breville USA, Inc.);
• HKD - Hong Kong dollar (HWI International Limited);
• CAD - Canadian dollar (HWI Canada, Inc., Holding HWI Canada, Inc. and Breville Canada, L.P.);
• NZD - New Zealand dollar (Breville New Zealand Limited);
• GBP - British pound (BRG Appliances Limited);
• RMB - Chinese Renminbi (Breville Services (Shenzhen) Company Limited); and
• EUR – Euro (Sage Appliances GmbH).
As at the reporting date the assets and liabilities of these foreign subsidiaries are translated into the presentation currency of Breville Group Limited. They are translated at the rate of exchange ruling at the balance sheet date and the income statements are translated at the weighted average exchange rates for the year.
The exchange differences arising on the retranslation of the financial statements of foreign subsidiaries are taken directly to a separate component of equity. On disposal of a foreign entity, the deferred cumulative amount recognised in equity relating to that particular foreign operation is recognised in the income statement.
(iii) Disposal of foreign operations
In some instances companies in the Breville Group provide intra group funding to other group entities by way of permanent equity loans. In these instances any foreign exchange movements are recognised in equity (foreign currency translation reserve) as these equity loans are considered to form part of the net investment in the subsidiary.
Investments and other financial assetsFinancial assets in the scope of AASB 139 Financial Instruments: Recognition and Measurement are classified as either financial assets at fair value through profit or loss, loans and receivables or held-to-maturity investments, as appropriate. When financial assets are recognised initially, they are measured at fair value, plus, in the case of investments not at fair value through the income statement, directly attributable transactions costs. The group determines the classification of its financial assets after initial recognition and, when allowed and appropriate, re-evaluates this designation at each year end.
All regular way purchases and sales of financial assets are recognised on the trade date i.e. the date that the group commits to purchase the asset. Regular way purchases or sales are purchases or sales of financial assets under contracts that require delivery of the assets within the period established generally by regulation or convention in the marketplace.
(i) Held to maturity investments
Non-derivative financial assets with fixed or determinable payments and fixed maturity are classified as held-to-maturity when the group has the positive intention and ability to hold to maturity. Investments intended to be held for an undefined period are not included in this classification. Investments that are intended to be held-to-maturity, such as bonds, are subsequently measured at amortised cost. This cost is computed as the amount initially recognised minus principal repayments, plus or minus the cumulative amortisation using the effective interest method of any difference between the initially recognised amount and the maturity amount. This calculation includes all fees and points paid or received between parties to the contract that are an integral part of the effective interest rate, transaction costs and all other premiums and discounts.
For investments carried at amortised cost, gains and losses are recognised in the income statement when the investments are derecognised or impaired, as well as through the amortisation process.
For
per
sona
l use
onl
y

87Breville Group Limited annual report 2018
(ii) Loans and receivables
Loans and receivables are non-derivative financial assets with fixed or determinable payments that are not quoted in an active market. Such assets are carried at amortised cost using the effective interest method. Gains and losses are recognised in the income statement when the loans and receivables are derecognised or impaired, as well as through the amortisation process.
LeasesThe determination of whether an arrangement is or contains a lease is based on the substance of the arrangement and requires an assessment of whether the fulfilment of the arrangement is dependent on the use of a specific asset or assets and the arrangement conveys a right to use the asset.
Group as a lessee
Operating lease payments are recognised as an expense in the income statement on a straight line basis over the lease term. Any lease incentives are recognised in the income statement as an integral part of the total lease expense.
Other TaxesRevenue, expenses and assets are recognised net of the amount of goods and services tax (GST) or value added tax (VAT) except:
• where the GST/VAT incurred on the purchase of goods and services is not recoverable from the taxation authority, in which case the GST/VAT is recognised as part of the cost of acquisition of the asset or as part of the expense item as applicable; and
• receivables and payables, which are stated with the applicable amount of GST/VAT included.
The net amount of GST/VAT recoverable/payable is included in receivables/payables in the statement of financial position.
Cash flows are included in the cash flow statement on a gross basis and the GST/VAT component of cash flows arising from investing and financing activities are classified as operating cash flows.
Commitments and contingencies are disclosed net of recoverable/payable GST/VAT.
New accounting standards and interpretations
(i) Changes to accounting policy and disclosures
The accounting policies adopted are consistent with those of the previous financial year.
The Group adopted all new and amended Australian Accounting Standards and Interpretations that became applicable during the current financial year.
The adoption of these Standards and Interpretations did not have a significant impact on the Group’s financial results or statement of financial position.
(ii) Accounting Standards and Interpretations issued but not yet effective
Relevant accounting standards that have been issued but are not yet effective are outlined as follows:
AASB 9: Financial Instruments (applicable for reporting periods beginning on or after 1 January 2018): The new standard addresses the classification, measurement and derecognition of financial assets and financial liabilities. It also introduces revised rules around hedge accounting and impairment. The Group has completed the impact assessment of this standard, including review of its current classification and measurement of financial assets and liabilities, as well as review of hedge accounting documentation and does not expect a material impact when the standard is adopted from 1 July 2018.
AASB 15: Revenue from Contracts with Customers (applicable for reporting periods beginning on or after 1 January 2018): The new standard will replace AASB 118 Revenue and introduces a new framework for revenue recognition. It replaces the previously applied risks and reward approach with a five-step model where revenue is recognised for each distinct performance obligation, at the point which control of the good or service is passed to the customer. The Group has completed the impact assessment of this standard, including review of its revenue recognition policy, customer contracts and internal documents and does not expect a material impact when the standard is adopted from 1 July 2018.
AASB 16: Leases (applicable for reporting periods beginning on or after 1 January 2019): The new standard will replace AASB 117 Leases. Once effective, the new requirements will apply to new and pre-existing lease arrangements. The key changes have been outlined below:
• Lessees will recognise a lease liability reflecting future lease payments and a ‘right-of-use’ asset for virtually all lease contracts (optional exemption available for short-term leases and leases of low-value assets);
• Lessees will have to present interest expense on the lease liability and depreciation on the right-of-use asset in their income statement;
• Lease payments that reflect interest on the lease liability can be presented as an operating cash flow. Cash payments for the principal portion of the lease liability should be classified within financing activities. Payments for short-term leases and for leases of low-value assets should be presented within operating activities.
The Group is in the process of accessing the impact of AASB 16 and does not intend to adopt this standard early.
Note 23. Other accounting policies continuedInvestments and other financial assets continued
For
per
sona
l use
onl
y

88 Breville Group Limited annual report 2018
In accordance with a resolution of the directors of Breville Group Limited, I state that:
1. In the opinion of the directors:
(a) the financial statements and notes of the consolidated entity are in accordance with the Corporations Act 2001, including:
(i) giving a true and fair view of the consolidated entity’s financial position as at 30 June 2018 and of its performance for the year ended on that date; and
(ii) complying with Australian Accounting Standards and the Corporations Regulations 2001;
(b) the financial statements and notes also comply with International Financial Reporting Standards as disclosed in note 1;
(c) there are reasonable grounds to believe that the Company will be able to pay its debts as and when they become due and payable; and
(d) as at the date of this declaration, there are reasonable grounds to believe that the members of the Closed Group identified in note 16(a) will be able to meet any obligations or liabilities to which they are or may become subject, by virtue of the Deed of Cross Guarantee.
2. This declaration has been made after receiving the declarations required to be made to the Directors in accordance with section 295A of the Corporations Act 2001 for the financial year ended 30 June 2018.
On behalf of the board
Steven Fisher Non-executive chairman
Sydney 16 August 2018
Directors’ declarationF
or p
erso
nal u
se o
nly
89Breville Group Limited annual report 2018
Independent auditor’s report
Independent auditor’s report To the members of Breville Group Limited
Report on the audit of the financial report
Our opinionIn our opinion:The accompanying financial report of Breville Group Limited (the Company) and its controlled entities (together the Group) is in accordance with the Corporations Act 2001, including:
a. giving a true and fair view of the Group’s financial position as at 30 June 2018 and of its financial performance for the year then ended
b. complying with Australian Accounting Standards and the Corporations Regulations 2001.
What we have auditedThe Group financial report comprises:• the consolidated statement of financial position as at 30 June 2018• the consolidated statement of comprehensive income for the year then ended• the consolidated statement of changes in equity for the year then ended• the consolidated cash flow statement for the year then ended• the consolidated income statement for the year then ended• the notes to the financial statements, which include a summary of significant accounting
policies• the directors’ declaration.
Basis for opinionWe conducted our audit in accordance with Australian Auditing Standards. Our responsibilities under those standards are further described in the Auditor’s responsibilities for the audit of the financial report section of our report.
We believe that the audit evidence we have obtained is sufficient and appropriate to provide a basis for our opinion.
IndependenceWe are independent of the Group in accordance with the auditor independence requirements of the Corporations Act 2001 and the ethical requirements of the Accounting Professional and Ethical Standards Board’s APES 110 Code of Ethics for Professional Accountants (the Code) that are relevant to our audit of the financial report in Australia. We have also fulfilled our other ethical responsibilities in accordance with the Code.
PricewaterhouseCoopers, ABN 52 780 433 757One International Towers Sydney, Watermans Quay, Barangaroo, GPO BOX 2650, SYDNEY NSW 2001T: +61 2 8266 0000, F: +61 2 8266 9999, www.pwc.com.auLevel 11, 1PSQ, 169 Macquarie Street, Parramatta NSW 2150, PO Box 1155 Parramatta NSW 2124T: +61 2 9659 2476, F: +61 2 8266 9999, www.pwc.com.au
Liability limited by a scheme approved under Professional Standards Legislation.
For
per
sona
l use
onl
y

90 Breville Group Limited annual report 2018
Our audit approachAn audit is designed to provide reasonable assurance about whether the financial report is free from material misstatement. Misstatements may arise due to fraud or error. They are considered material if individually or in aggregate, they could reasonably be expected to influence the economic decisions of users taken on the basis of the financial report.
We tailored the scope of our audit to ensure that we performed enough work to be able to give an opinion on the financial report as a whole, taking into account the geographic and management structure of the Group, its accounting processes and controls and the industry in which it operates.
• For the purpose of our audit we used overall Group materiality of $3.9 million, which represents approximately 5% of the Group’s profit before tax.
• We applied this threshold, together with qualitative considerations, to determine the scope of our audit and the nature, timing and extent of our audit procedures and to evaluate the effect of misstatements on the financial report as a whole.
• We chose Group profit before tax because, in our view, it is the benchmark against which the performance of the Group is most commonly measured.
• We utilised a 5% threshold based on our professional judgement, noting it is within the range of commonly acceptable thresholds.
• We applied this threshold, together with qualitative considerations, to determine the scope of our audit and the nature, timing and extent of our audit procedures and to evaluate the effect of misstatements on the financial report as a whole.
Independent auditor’s report continued
Materiality
For
per
sona
l use
onl
y

91Breville Group Limited annual report 2018
Audit scope
• Our audit focused on:- subjective judgements made by the Group, and- significant accounting estimates involving assumptions and inherently uncertain
future events.
• The Group comprises entities located in Australia/New Zealand, North America, and the ‘Rest of World’ comprising its entities in Hong Kong, United Kingdom, Germany and China, with the most financially significant operations being Breville Australia and Breville United States. Accordingly, we structured our audit as follows:
• The Group audit was led by our team from the Australian PwC firm (“Group audit team”). The Group audit team conducted an audit of the special purpose financial information of Breville Australia and Breville United States used to prepare the consolidated financial statements.
• Component auditors in Canada and Hong Kong, under instructions from the Group audit team, performed specified audit procedures over targeted financial statement items within the respective special purpose financial information for those locations used to prepare the consolidated financial statements.
• The Group audit team undertook the remaining audit procedures, including over significant financial statement items controlled at the Group level, the Group consolidation and the audit of the financial report and remuneration report.
• The Group audit team decided on their level of involvement needed in the work performed by the component auditors, to be satisfied that sufficient appropriate evidence had been obtained for the purpose of our opinion. Review of the work undertaken by the component teams and regular dialogue between the teams up to the reporting date supplemented the specific direct written instruction provided by PwC Australia and augmented the reporting provided by the component auditors.
• The combination of all these procedures provided us with sufficient and appropriate audit evidence to express an opinion on the Group’s financial report as a whole.
Key audit mattersKey audit matters are those matters that, in our professional judgement, were of most significance in our audit of the financial report for the current period. The key audit matters were addressed in the context of our audit of the financial report as a whole, and in forming our opinion thereon, and we do not provide a separate opinion on these matters. Further, any commentary on the outcomes of a particular audit procedure is made in that context. We communicated the key audit matters to the Audit and Risk Committee.F
or p
erso
nal u
se o
nly
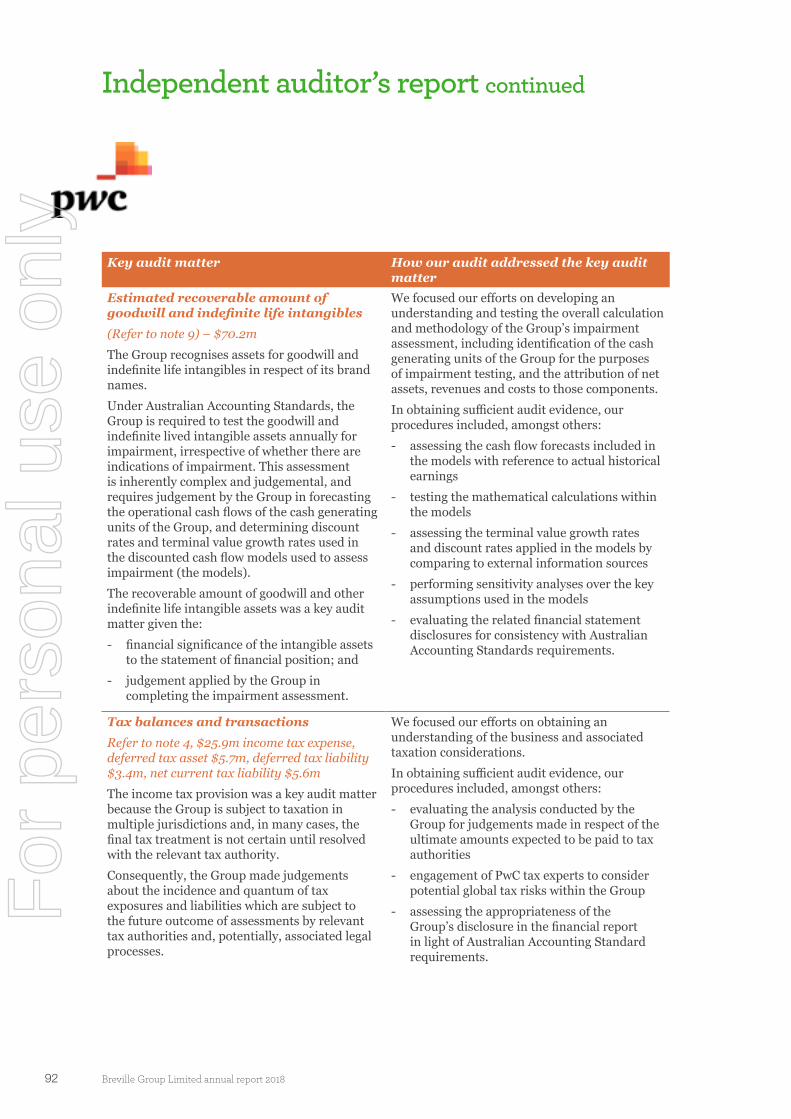
92 Breville Group Limited annual report 2018
Key audit matter How our audit addressed the key audit matter
Estimated recoverable amount of goodwill and indefinite life intangibles (Refer to note 9) – $70.2mThe Group recognises assets for goodwill and indefinite life intangibles in respect of its brand names. Under Australian Accounting Standards, the Group is required to test the goodwill and indefinite lived intangible assets annually for impairment, irrespective of whether there are indications of impairment. This assessment is inherently complex and judgemental, and requires judgement by the Group in forecasting the operational cash flows of the cash generating units of the Group, and determining discount rates and terminal value growth rates used in the discounted cash flow models used to assess impairment (the models). The recoverable amount of goodwill and other indefinite life intangible assets was a key audit matter given the:- financial significance of the intangible assets
to the statement of financial position; and- judgement applied by the Group in
completing the impairment assessment.
We focused our efforts on developing an understanding and testing the overall calculation and methodology of the Group’s impairment assessment, including identification of the cash generating units of the Group for the purposes of impairment testing, and the attribution of net assets, revenues and costs to those components. In obtaining sufficient audit evidence, our procedures included, amongst others:- assessing the cash flow forecasts included in
the models with reference to actual historical earnings
- testing the mathematical calculations within the models
- assessing the terminal value growth rates and discount rates applied in the models by comparing to external information sources
- performing sensitivity analyses over the key assumptions used in the models
- evaluating the related financial statement disclosures for consistency with Australian Accounting Standards requirements.
Tax balances and transactionsRefer to note 4, $25.9m income tax expense, deferred tax asset $5.7m, deferred tax liability $3.4m, net current tax liability $5.6mThe income tax provision was a key audit matter because the Group is subject to taxation in multiple jurisdictions and, in many cases, the final tax treatment is not certain until resolved with the relevant tax authority. Consequently, the Group made judgements about the incidence and quantum of tax exposures and liabilities which are subject to the future outcome of assessments by relevant tax authorities and, potentially, associated legal processes.
We focused our efforts on obtaining an understanding of the business and associated taxation considerations. In obtaining sufficient audit evidence, our procedures included, amongst others:- evaluating the analysis conducted by the
Group for judgements made in respect of the ultimate amounts expected to be paid to tax authorities
- engagement of PwC tax experts to consider potential global tax risks within the Group
- assessing the appropriateness of the Group’s disclosure in the financial report in light of Australian Accounting Standard requirements.
Independent auditor’s report continuedF
or p
erso
nal u
se o
nly

93Breville Group Limited annual report 2018
Other informationThe directors are responsible for the other information. The other information comprises the information included in the annual report for the year ended 30 June 2018, but does not include the financial report and our auditor’s report thereon. Prior to the date of this auditor’s report, the other information we obtained included the Directors’ report, Corporate governance statement, and Company Information. We expect the remaining other information to be made available to us after the date of this auditor’s report, including Chairman’s review, Chief Executive Officer’s review, Brand & Strategy and Shareholder Information.
Our opinion on the financial report does not cover the other information and we do not and will not express an opinion or any form of assurance conclusion thereon.
In connection with our audit of the financial report, our responsibility is to read the other information identified above and, in doing so, consider whether the other information is materially inconsistent with the financial report or our knowledge obtained in the audit, or otherwise appears to be materially misstated.
If, based on the work we have performed on the other information that we obtained prior to the date of this auditor’s report, we conclude that there is a material misstatement of this other information, we are required to report that fact. We have nothing to report in this regard.
When we read the other information not yet received as identified above, if we conclude that there is a material misstatement therein, we are required to communicate the matter to the directors and use our professional judgement to determine the appropriate action to take.
Responsibilities of the directors for the financial reportThe directors of the Company are responsible for the preparation of the financial report that gives a true and fair view in accordance with Australian Accounting Standards and Corporations Act 2001 and for such internal control as the directors determine is necessary to enable the preparation of the financial report that gives a true and fair view and is free from material misstatement, whether due to fraud or error.
In preparing the financial report, the directors are responsible for assessing the ability of the Group to continue as a going concern, disclosing, as applicable, matters related to going concern and using the going concern basis of accounting unless the directors either intend to liquidate the Group or to cease operations, or have no realistic alternative but to do so.
Auditor’s responsibilities for the audit of the financial reportOur objectives are to obtain reasonable assurance about whether the financial report as a whole is free from material misstatement, whether due to fraud or error, and to issue an auditor’s report that includes our opinion. Reasonable assurance is a high level of assurance, but is not a guarantee that an audit conducted in accordance with the Australian Auditing Standards will always detect a material misstatement when it exists. Misstatements can arise from fraud or error and are considered material if, individually or in the aggregate, they could reasonably be expected to influence the economic decisions of users taken on the basis of the financial report.
A further description of our responsibilities for the audit of the financial report is located at the Auditing and Assurance Standards Board website at: http://www.auasb.gov.au/auditors_responsibilities/ar1.pdf. This description forms part of our auditor’s report.
For
per
sona
l use
onl
y
94 Breville Group Limited annual report 2018
Report on the remuneration report
Our opinion on the remuneration reportWe have audited the remuneration report included in pages 23 to 36 of the directors’ report for the year ended 30 June 2018.
In our opinion, the remuneration report of Breville Group Limited for the year ended 30 June 2018 complies with section 300A of the Corporations Act 2001.
ResponsibilitiesThe directors of the Company are responsible for the preparation and presentation of the remuneration report in accordance with section 300A of the Corporations Act 2001. Our responsibility is to express an opinion on the remuneration report, based on our audit conducted in accordance with Australian Auditing Standards.
PricewaterhouseCoopers
Mark Dow SydneyPartner 16 August 2018
Independent auditor’s report continuedF
or p
erso
nal u
se o
nly
95Breville Group Limited annual report 2018
Auditor’s independence declaration
Auditor’s Independence Declaration As lead auditor for the audit of Breville Group Limited for the year ended 30 June 2018, I declare that to the best of my knowledge and belief, there have been:
a. no contraventions of the auditor independence requirements of the Corporations Act 2001 in relation to the audit; and
b. no contraventions of any applicable code of professional conduct in relation to the audit.
This declaration is in respect of Breville Group Limited and the entities it controlled during the period.
Mark Dow SydneyPartner 16 August 2018PricewaterhouseCoopers
PricewaterhouseCoopers, ABN 52 780 433 757One International Towers Sydney, Watermans Quay, Barangaroo, GPO BOX 2650, SYDNEY NSW 2001T: +61 2 8266 0000, F: +61 2 8266 9999, www.pwc.com.auLevel 11, 1PSQ, 169 Macquarie Street, Parramatta NSW 2150, PO Box 1155 Parramatta NSW 2124T: +61 2 9659 2476, F: +61 2 8266 9999, www.pwc.com.au
Liability limited by a scheme approved under Professional Standards Legislation.
For
per
sona
l use
onl
y

96 Breville Group Limited annual report 2018
Shareholder information
Substantial shareholders as at 11 September 2018
The following information is extracted from the company’s register of substantial shareholder notices:
NameNumber of
ordinary shares% of issued
ordinary shares
S. Lew Custodians Pty Limited 42,691,756 32.82%
Matthews International Capital Management, LLC 13,558,450 10.42%
Bennelong Australian Equity Partners Ltd 7,262,595 5.58%
Distribution of shareholdings as at 11 September 2018
Size of holdingOrdinary
shareholders
1 to 1,000 1,428
1,001 to 5,000 1,342
5,001 to 10,000 299
10,001 to 100,000 236
100,001 and over 39
Total shareholders 3,344
Number of ordinary shareholders with less than a marketable parcel 122
Voting rights
All ordinary shares issued by Breville Group Limited carry one vote per share without restriction.
For
per
sona
l use
onl
y
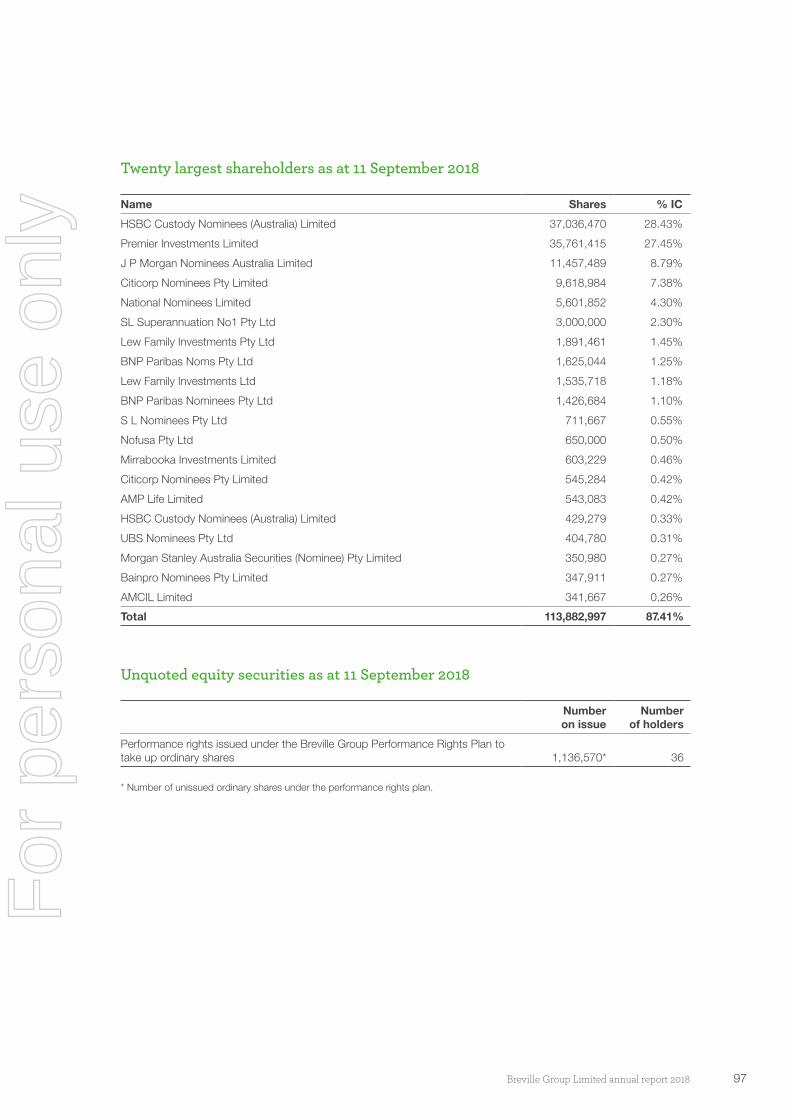
97Breville Group Limited annual report 2018
Twenty largest shareholders as at 11 September 2018
Name Shares % IC
HSBC Custody Nominees (Australia) Limited 37,036,470 28.43%
Premier Investments Limited 35,761,415 27.45%
J P Morgan Nominees Australia Limited 11,457,489 8.79%
Citicorp Nominees Pty Limited 9,618,984 7.38%
National Nominees Limited 5,601,852 4.30%
SL Superannuation No1 Pty Ltd 3,000,000 2.30%
Lew Family Investments Pty Ltd 1,891,461 1.45%
BNP Paribas Noms Pty Ltd 1,625,044 1.25%
Lew Family Investments Ltd 1,535,718 1.18%
BNP Paribas Nominees Pty Ltd 1,426,684 1.10%
S L Nominees Pty Ltd 711,667 0.55%
Nofusa Pty Ltd 650,000 0.50%
Mirrabooka Investments Limited 603,229 0.46%
Citicorp Nominees Pty Limited 545,284 0.42%
AMP Life Limited 543,083 0.42%
HSBC Custody Nominees (Australia) Limited 429,279 0.33%
UBS Nominees Pty Ltd 404,780 0.31%
Morgan Stanley Australia Securities (Nominee) Pty Limited 350,980 0.27%
Bainpro Nominees Pty Limited 347,911 0.27%
AMCIL Limited 341,667 0.26%
Total 113,882,997 87.41%
Unquoted equity securities as at 11 September 2018
Number on issue
Number of holders
Performance rights issued under the Breville Group Performance Rights Plan to take up ordinary shares 1,136,570* 36
* Number of unissued ordinary shares under the performance rights plan.
For
per
sona
l use
onl
y

98 Breville Group Limited annual report 2018
Company information
Directors
Steven FisherNon-executive chairman
Timothy AntonieNon-executive director
Peter Cowan – appointed 1 September 2018Non-executive director
Sally HermanNon-executive director
Dean HowellNon-executive director
Lawrence MyersNon-executive director Lead independent director
Kate Wright Non-executive director
Company secretary
Sasha Kitto
Registered office and principal place of businessGround Floor, Suite 2 170-180 Bourke Road Alexandria NSW 2015
Telephone (+61 2) 9384 8100
Company websitesbrevillegroup.com breville.com kambrook.com.au sageappliances.com
ABNBreville Group Limited ABN 90 086 933 431
Share registerLink Market Services Limited Level 12, 680 George Street Sydney NSW 2000
Enquiries within Australia: (02) 8280 7111 Enquiries outside Australia: (+61 2) 8280 7111 Website: linkmarketservices.com.au
Auditors PricewaterhouseCoopers One International Towers Sydney Watermans Quay Barangaroo NSW 2000 Australia
BankersAustralia and New Zealand Banking Group Limited 242 Pitt Street Sydney NSW 2000
For
per
sona
l use
onl
y

TM
Spot: PMS518C
Display RGB: 72/40/60 Display HEX: 48283C
Process: 55/86/20/63
This report is printed on ecoStar+ which is an environmentally responsible paper made carbon neutral, and the fibre source is FSC Recycled certified. ecoStar+ is manufactured from 100% post consumer recycled paper in a process chlorine free environment under the ISO 14001 environmental management system.
Design: Buzzsaw. Print: Hogan Print
For
per
sona
l use
onl
y

For
per
sona
l use
onl
y