for personal use only - asx...2019/02/21 · interest cover ratio (icr) 5.17x 5.17x 4.73x net...
TRANSCRIPT

Financial results presentation For the half year ended 31 December 2018
Managed by:
February 2019
For
per
sona
l use
onl
y

Managed by:
Disclaimer
Front cover: Swan Ridge macadamia orchard, Bundaberg, September 2018.
This presentation has been prepared by Rural Funds Management Limited (ACN 077 492 838, AFSL 226 701) (RFM) as the responsible entity of Rural Funds Group (RFF). RFF is a stapled security, incorporating Rural Funds Trust (ARSN 112 951 578) and RF Active (ARSN 168 740 805). The information contained in this presentation is not investment or financial product advice and is not intended to be used as the basis for making an investment decision. Please note that, in providing this presentation, RFM has not considered the investment objectives, financial circumstances or particular needs of any particular recipients.
This presentation is not, and does not constitute, an offer to sell or the solicitation, invitation or recommendation to purchase any securities, and neither this presentation nor anything contained herein shall form the basis of any contract or commitment. In particular, this presentation does not constitute an offer to sell, or a solicitation of an offer to buy, any securities in the United States. This presentation must not be released or distributed in the United States. Any securities described in this presentation have not been, and will not be, registered under the US Securities Act of 1933 and may not be offered or sold in the United States except in transactions exempt from, or not subject to, registration under the US Securities Act and applicable US state securities laws.
RFM has prepared this presentation based on information available to it at the time of preparation. No representation or warranty is made as to the fairness, accuracy or completeness of the information, opinions and conclusions contained in this presentation or any other information that RFM otherwise provides. To the maximum extent permitted by law, RFM, its related bodies corporate and its officers, employees and advisers are not liable for any direct, indirect or consequential loss or damage suffered by any person as a result of relying on this presentation or otherwise in connection with it.
This presentation includes “forward-looking statements”. These forward-looking statements are based on current views, expectations and beliefs as at the date they are expressed. They involve known and unknown risks, uncertainties and other factors which could cause the actual results, performance or achievements of RFF to be materially different from those expressed or implied by the forward-looking statements. Accordingly, there can be no assurance or guarantee regarding these statements and you must not place undue reliance on these forward-looking statements. RFM and RFF disclaim any responsibility for the accuracy or completeness of any forward-looking statements.
2
For
per
sona
l use
onl
y

Managed by:
1. Financial results
2. Capital management
3. Strategy and portfolio update
4. Outlook and conclusion
5. Appendices
3
Contents
David BryantManaging Director
Stuart WaightExecutive Manager
Daniel Yap Financial Controller
James Powell General Manager -Investor Relations & Marketing
RFM presenters
For
per
sona
l use
onl
y

Recently announced cattle property acquisition; Cobungra, Omeo, Victoria, October 2018.
Financialresults 1
For
per
sona
l use
onl
y

Managed by:
July 18
• Conducted an Entitlement Offer to raise $149.5m at $1.95 per unit to fund two transactions with JBS Australia Pty Ltd (JBS) totalling $127.7m and the acquisition of a cattle property called Comanche for $16.7m. The Entitlement Offer provided up to $100.0m of balance sheet capacity for further acquisitions, based on a target gearing limit of 35%.
Aug 18 • Commencement of the guarantee enabling JBS to replace an existing arrangement for the supply of cattle to five feedlots to be acquired by RFF.
Sept 18
• Acquired Cerberus, an 8,280 ha cattle property located in central Queensland for $10.8m. Leased to Katena Pty Ltd for ten years, with a rent review in year five.
• Acquired Mayneland, a 2,942 ha cotton property located in central Queensland for $17.8m. RFM operating and paying rent on the property for FY19. Colliers International Agribusiness have been appointed to conduct a competitive selection process for a Mayneland lessee prior to the FY20 cotton season.
Oct 18
• Acquired Dyamberin, a 1,728 ha cattle property located in the New England region of New South Wales for $14.1m. Leased to Stone Axe Pastoral Company (Stone Axe) for ten years, with a rent review in year five.
• Foreign Investment Review Board approval received for JBS transaction. Three JBS cattle feedlots (Mungindi, Caroona and Prime City) settled. Two remaining feedlots (Beef City and Riverina Beef) still subject to subdivision approvals.
Jan 19 • Acquired Woodburn, a 1,062 ha cattle property located in the New England region for $7.5m. Leased to Stone Axe
for ten years, with a rent review in year five.
Feb 19• Announced the acquisition of Cobungra, a 6,486 ha cattle property located in Victoria for $36.9m. Upon
settlement, leased to Stone Axe for ten years, with a rent review in year five. Expected to settle in March 2019.
Key events: July 2018 to February 2019
5
Acquisitions totalling $87.1m will be funded from balance sheet capacity following the July 2018 Entitlement Offer.
For
per
sona
l use
onl
y

Managed by:
HY19 financial results
Forecasts
Income and earnings metrics
6 mths ended31 Dec 2018
6 mths ended31 Dec 2017
Property revenue ($) 30,700,000 24,141,000
Total comprehensive income (TCI) ($) 24,620,000 16,749,000
Earnings per unit (EPU)1 (cents) 7.73 6.58
Adjusted funds from operations (AFFO) ($) 20,320,000 15,406,000
AFFO per unit (cents) 6.4 6.0
Distributions per unit (DPU) (cents) 5.22 5.02
AFFO payout ratio 82% 84%
Note: 1. Calculated TCI/weighted average units (see page 20).
• Property revenue 27% higher due to recent
transactions, development capital
expenditure and lease indexation.
• TCI and EPU higher mainly due to additional
property revenue and an independent
revaluation of the Kerarbury almond orchard.
• AFFO per unit is forecast to be higher in the
second half of FY19 due to additional property
revenue from acquisitions and lower
expenses.
• FY19 AFFO and DPU forecasts confirmed.
• FY20 DPU forecast of 10.85 cents, consistent
with 4% annual growth target.
• Refer to pages 19 to 23 for further
information.
FY19 forecast AFFO and DPU reaffirmed. FY20 forecast DPU of 10.85 cents, consistent with 4% annual growth target.
FY20 FY19 FY18
AFFO per unit (cents) 13.2 12.7
DPU (cents) 10.85 10.43 10.03
AFFO payout ratio 79% 79%
6
For
per
sona
l use
onl
y

Managed by:
HY19 financial results
Pro forma3
as at31 Dec 2018
$
As at31 Dec 2018
$
As at30 June 2018
$
Total assets 871,256,000 802,789,000 637,808,000
Adjusted for water at fair value 51,844,000 51,844,000 49,841,000
Adjusted total assets1 923,100,000 854,633,000 723,649,000
External borrowings 301,851,000 233,384,000 273,161,000
Gearing2 32.7% 27.3% 37.7%
Net asset value (NAV) 532,413,000 532,413,000 378,735,000
NAV per unit 1.60 1.60 1.48
Adjusted NAV1 584,257,000 584,257,000 428,576,000
Adjusted NAV per unit1 1.75 1.75 1.68
Pro forma3
as at31 Dec 2018
As at31 Dec 2018
As at30 June 2018
Number of properties 49 45 38
Weighted avg. lease expiry (WALE) 11.4 yrs 11.5 yrs 12.4 yrs
CPI linked vs fixed indexation 57% / 39% 59% / 37% 60% / 38%
Units on issue 333.1m 333.1m 255.6m
Balance sheet summary
Key portfolio metrics
Notes: 1. Assets adjusted for the independent valuation of water entitlements which are recognised at the lower of cost or fair value on balance sheet.2. Gearing calculated as external borrowings/adjusted total assets.3. Pro forma includes feedlots (Beef City and Riverina Beef) and cattle properties (Woodburn and Cobungra) which were not settled at 31 December 2018.
Gearing remains within the target range of 30-35%, with sufficient capacity for committed capital expenditure.
• Increase in pro forma adjusted total assets of
$200m due to acquisitions, capex and
Kerarbury revaluation (see page 8).
• Pro forma gearing of 33% remains within
target range of 30-35%, with sufficient
capacity for committed capital expenditure
(see page 14).
• WALE of 11 years provides stability of income
and long term rental growth via a mix of rent
reviews and indexation.
• Refer to pages 19 to 23 for further
information.
7
For
per
sona
l use
onl
y

Managed by:
HY19 financial results
Adjusted property assets movements ($m)
Notes: 1. Directors’ valuation applied to certain poultry assets, consistent with management’s approach to reflect increasing average age of the infrastructure.2. Acquisition amounts include stamp duty. The sector totals presented in the chart are net of written-off transaction costs and inclusive of capex.
• Cattle acquisitions include:2
– Cerberus $10.8m
– Dyamberin $14.1m
– Mungindi, Caroona and Prime
City feedlots $28.4m
– Woodburn $7.5m (pro forma)
– Cobungra $36.9m (pro forma)
– Beef City and Riverina Beef
feedlots $24.1m (pro forma).
• Almond revaluation and capex
includes Kerarbury independent
valuation increase $15.6m.
• Cotton acquisition, revaluation and
capex includes Mayneland
acquisition $17.8m.2
• See page 24 for schedule of
independent valuations.
The Kerarbury almond orchard revaluation represents a 10% increase.
8
For
per
sona
l use
onl
y

Three-year-old almond trees on Kerarbury almond orchard, Darlington Point, New South Wales, January 2019.
Capital management 2
For
per
sona
l use
onl
y

Managed by:
Notes:
1. Pro forma includes feedlots (Beef City and Riverina Beef) and cattle properties (Woodburn and Cobungra) which were not settled at 31 December 2018 and excess cash adjustment. Pro forma limit increase subject to final approval.
2. Key financial covenants for FY19: LVR <50%, ICR >3.0x, with distribution permitted at >3.15x, NTA including water entitlements >$400m, 40% hedging requirement.
3. Security: Real property mortgages, general security agreement, cross guarantees between RFF and subsidiaries.
4. LVR calculated as term debt drawn plus limited guarantee of $75m divided by directly secured assets based on independent valuations.
5. Current hedges only.
6. Proportion hedged calculated as current hedges/term debt drawn.
7. Duration remaining as at 31 December 2018 and includes forward start hedges.
Debt facility and interest rate hedges
Pro forma 31 Dec 20181
31 Dec 2018
30 June 2018
Debt facility
Term debt facility limit2,3 335.0m 300.0m 275.0m
Term debt drawn 289.4m 230.2m 269.8m
Headroom 45.6m 69.8m 5.2m
Effective cost of total debt 4.51% 4.51% 4.00%
Covenants
Loan to Value Ratio (LVR)4 43.0% 39.2% 41.1%
Interest Cover Ratio (ICR) 5.17x 5.17x 4.73x
Net Tangible Assets (NTA)2 584.3m 584.3 m 428.6m
Hedging
Total amount hedged5 143.0m 143.0m 108.0
Proportion debt hedged6 49.4% 62.1% 40.0%
Weighted avg duration (yrs)7 7.6 yrs 7.6 yrs 7.3 yrs
Debt metrics
5 year hedged (fixed rate) position
Debt facility limit to be increased in conjunction with settlement of Cobungra. Facility remains within all covenants.
10
Pro forma debt facility expiry1
142.2
180.5 183.0 179.3
168.0
3.04%3.03%
3.06% 3.06%
3.09%
3.00%
3.05%
3.10%
3.15%
3.20%
$100m
$120m
$140m
$160m
$180m
$200m
FY19 FY20 FY21 FY22 FY23
Average hedged amount (LHS) Weighted average hedge rate (RHS)
200.0
89.4
25.0
20.6
$-
$50m
$100m
$150m
$200m
$250m
FY19 FY20 FY21 FY22 FY23 FY24
Fa
cil
ity
lim
it (
$m
)
Debt drawn Undrawn
For
per
sona
l use
onl
y

Baled raw cotton. Lynora Downs, Queensland, July 2018.
Strategy and portfolio update 3
For
per
sona
l use
onl
y

Managed by:
Sectors and assetsThe portfolio includes 49 properties diversified across six agricultural sectors and multiple climatic zones.1
Note:1. Shaded areas denote climatic zones differentiated by rainfall seasonality. Source: Bureau of Meteorology; see RFF Climatic Diversification discussion paper, 20 June
2016. Murrumbidgee High Security water entitlement (8,754 ML) with a value of $32.8m and forecast FY19 revenue of $2.0m not shown. Blue square boxes on map denote cattle feedlots. Map and sector information includes pro forma includes feedlots (Beef City and Riverina Beef) and cattle properties (Woodburn and Cobungra) which were not settled at 31 December 2018.
12
For
per
sona
l use
onl
y

Managed by:
53%
47%
77%
23%
6%
33%
52%
5%4%
Portfolio strategy and diversificationTargeted diversification aims to assist in achieving the objectives of generating a stable income plus capital growth and growing distributions consistently at 4% p.a.
Notes: 1. Pro forma includes feedlots (Beef City and Riverina Beef) and cattle properties (Woodburn and Cobungra) which were not settled at 31 December 2018.2. Assumes poultry, feedlots (and guarantee fee) are infrastructure predominant, vineyards and cattle are natural resource predominant, and almond/macadamia
orchards split equally.
Climatic zone (FY19f revenue)
13
Sector type (FY19f revenue)2
Almonds
Cattle
Poultry
Vineyards
Cotton
Macadamias
Other
Southern
Northern
Natural resource predominant
Infrastructure predominant
Fixed indexation (2.5%)
Fixed indexation (2.5%) with market review
CPI and CPI linked indexation
CPI with market review
Other
Indexation (FY19f revenue)
Sector by asset value1
45%
30%
9%
6%
5%
4% 2%
For
per
sona
l use
onl
y

Managed by:
Natural resource developmentsProductivity developments continue on the existing natural resource predominant assets, with similar potential for productivity improvements on recently acquired assets.
Note: 1. Development opportunities on Cerberus, Comanche, Dyamberin and Mayneland have been identified but are yet to be finalised with lessees.
14
For
per
sona
l use
onl
y

Managed by:
Forecast capital expenditure
Portfolio updatePortfolio update
1H19($m)
2H19f($m)
FY20f($m)
Total($m)
Description
Almonds 11.1 12.2 21.6 44.9FY20 represents water acquisitions for Kerarbury. This commitment may be met by utilising the Murrumbidgee HS water which is currently not leased.
Cattle1 1.4 4.2 3.1 8.7FY19 and FY20 capex pertains to productivity developments on cattle properties, including water points, cultivation area, improved pasture.
Poultry2 - 1.1 - 1.1 Water sanitation plant and equipment.
Cotton1 1.6 2.0 6.1 9.7FY19 and FY20 capex pertains to productivity developments on cotton properties including additional water storage and expansion of irrigated cotton areas.
Vineyards 0.1 0.7 - 0.8 Grafting and redevelopment.
Macadamias 0.1 0.2 - 0.3 Irrigation and dehusking shed.
Total ($m) 14.3 20.4 30.8 65.5
15Notes:1. Includes forecast figures for identified development opportunities which are yet to be finalised with lessees.2. An additional $2.1m ($1.3m FY19 and $0.8m FY20) of agreed capital expenditure will not attract rent.
Forecast capex of $65.5m will attract rent as it is deployed.
For
per
sona
l use
onl
y

Maturing almonds in final stage of growth, Mooral almond orchard, Hillston, NSW, January 2019.
Outlook and conclusion 4
For
per
sona
l use
onl
y
Managed by:
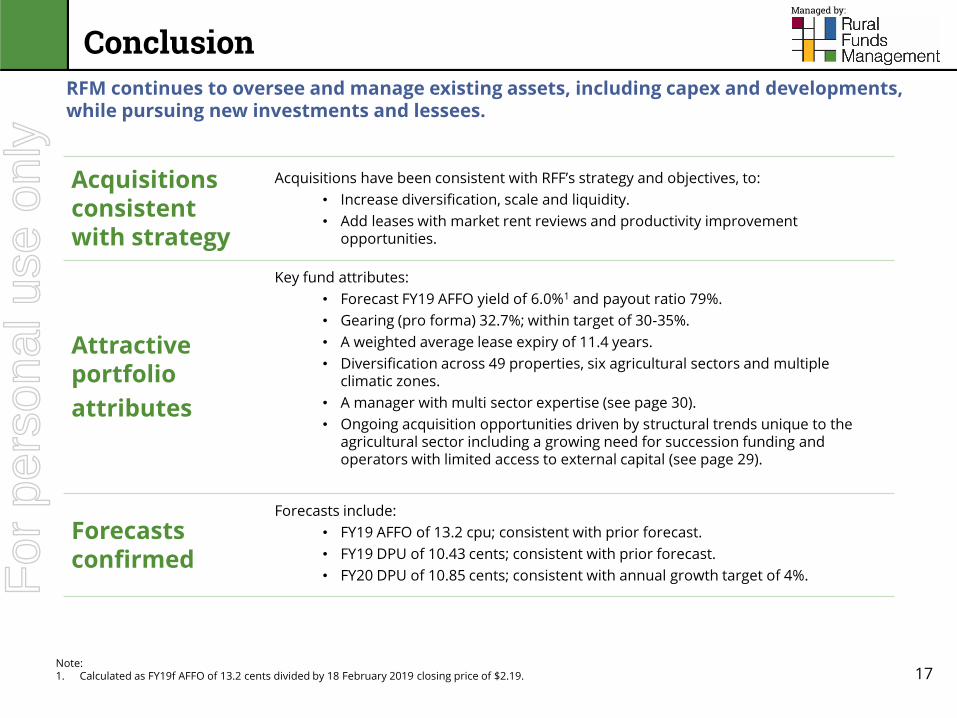
Conclusion
Acquisitions consistent with strategy
Acquisitions have been consistent with RFF’s strategy and objectives, to:
• Increase diversification, scale and liquidity.
• Add leases with market rent reviews and productivity improvement opportunities.
Attractive portfolio
attributes
Key fund attributes:
• Forecast FY19 AFFO yield of 6.0%1 and payout ratio 79%.
• Gearing (pro forma) 32.7%; within target of 30-35%.
• A weighted average lease expiry of 11.4 years.
• Diversification across 49 properties, six agricultural sectors and multiple climatic zones.
• A manager with multi sector expertise (see page 30).
• Ongoing acquisition opportunities driven by structural trends unique to the agricultural sector including a growing need for succession funding and operators with limited access to external capital (see page 29).
Forecasts confirmed
Forecasts include:
• FY19 AFFO of 13.2 cpu; consistent with prior forecast.
• FY19 DPU of 10.43 cents; consistent with prior forecast.
• FY20 DPU of 10.85 cents; consistent with annual growth target of 4%.
17Note: 1. Calculated as FY19f AFFO of 13.2 cents divided by 18 February 2019 closing price of $2.19.
RFM continues to oversee and manage existing assets, including capex and developments, while pursuing new investments and lessees.
For
per
sona
l use
onl
y
Geier vineyard, Barossa Valley, South Australia, March 2018.
Appendices 5F
or p
erso
nal u
se o
nly

Managed by:
Notes:1. Calculated TCI/weighted average units. 2. RFM Australian Wine Fund (AWF) is a subsidiary of Rural Funds Trust (RFT) that has formed a tax consolidated group.
HY19 results - comprehensive income
Summarised statement of comprehensive income
6 mths ended 6 mths ended
31 Dec 2018 31 Dec 2017
$ $
Property revenue 30,700,000 24,141,000
Revenue 30,700,000 24,141,000
Other income 1,604,000 86,000
Property expenses (759,000) (568,000)
Other expenses (2,212,000) (1,350,000)
Management fees (3,878,000) (2,886,000)
Finance costs (4,655,000) (4,017,000)
Property revaluations - investment property 2,832,000 4,051,000
Change in fair value of interest rate swaps (3,908,000) (1,970,000)
Change in fair value of financial assets/liabilities (34,000) -
Depreciation and impairments (486,000) (440,000)
Gain/(loss) on sale of assets 26,000 12,000
Profit before tax 19,230,000 17,059,000
Income tax expense (822,000) (310,000)
Profit after tax 18,408,000 16,749,000
Other comprehensive income – bearer plant revaluation
6,212,000 -
Total comprehensive income 24,620,000 16,749,000
Weighted average units 318,696,579 254,729,029
Earnings per unit1 7.73 cents 6.58 cents
• Property revenue has increased primarily as
a result of rent on new acquisitions,
guarantee fee, rent on development capital
expenditure and lease indexation.
• Other income relates to unleased
Murrumbidgee High Security water annual
allocation sales.
• Property and other expenses increased
largely due to costs associated with the JBS
transaction, and oversight of capex and
developments.
• Investment property revaluations primarily
relates to the Kerarbury almond orchard
$15.6m, offset by directors revaluation of
poultry assets ($1.5m) and write-off of
transaction costs on property acquisitions
($2.9m).
• Management fees equate to 1.0% for HY19.
• Income tax expense relates to RF Active and
AWF.2 RFT treated as a flow through trust for
tax purposes.
19
For
per
sona
l use
onl
y

Managed by:
Note: 1. Based on the weighted average number of units on issue during the half year.
HY19 results - AFFO
Composition of AFFO (pre-tax)
6 mths ended 6 mths ended
31 Dec 2018 31 Dec 2017
$ $
Property revenue 30,607,000 24,141,000
Property expenses (759,000) (568,000)
Net property income 29,848,000 23,573,000
Other income 1,604,000 86,000
Other expenses (2,212,000) (1,350,000)
Management fees (3,878,000) (2,886,000)
EBITDA 25,362,000 19,423,000
Income tax payable (RF Active) (387,000) -
Finance costs (4,655,000) (4,017,000)
AFFO 20,320,000 15,406,000
AFFO per unit1 6.4 cents 6.0 cents
DPU 5.22 cents 5.02 cents
• AFFO is pre-tax and excludes fair value
adjustments, depreciation and impairment
to represent RFF’s property rental business.
• Property expenses relate to costs directly
attributable to the properties (e.g. insurance,
rates, applicable cost recovery). Other
expenses relate to non-property overheads
(e.g. ASX/bank/audit/registry fees,
cost recovery).
• Adjustment to funds from operations (FFO)
pertains to tax expense of $0.4m largely
relating to AWF (see page 21).
• Property leases are largely triple net.
20
For
per
sona
l use
onl
y

Managed by:
Note: 1. Based on the weighted average number of units on issue during the half year.
HY19 results - reconciliation of net profit
Reconciliation of net profit after tax to AFFO
6 mths ended6 mthsended
31 Dec 2018 31 Dec 2017
$ $
Net profit after income tax 18,408,000 16,749,000
Adjusted for:
Property revaluations (2,832,000) (4,051,000)
Change in fair value of interest rate swaps
3,908,000 1,970,000
Change in fair value of financial assets/liabilities
34,000 -
Depreciation and impairment 486,000 440,000
Gain on sale of assets (26,000) (12,000)
Interest component of JBS feedlot finance lease
(93,000) -
FFO 19,885,000 15,096,000
Adjusted for income tax expense (AWF) 435,000 310,000
AFFO 20,320,000 15,406,000
AFFO per unit1 6.4 cents 6.0 cents
• Non cash items added back to reconcile
net profit after tax to AFFO.
• Major items for HY19:
– $2.8m property revaluations
largely due to revaluation of
Kerarbury almond orchard.
– $3.9m unrealised loss on interest
rate hedges.
– $0.5m depreciation and
impairment, primarily relating to
plant and equipment in RF Active.
21
For
per
sona
l use
onl
y

Managed by:
HY19 results - summarised balance sheet
Summarised balance sheetPro Forma As at As at
31 Dec 2018 31 Dec 2018 30 Jun 2018
$ $ $
Cash 11,259,000 11,259,000 1,210,000
Property investments 839,041,000 770,574,000 658,593,000
Plant and equipment 7,117,000 7,117,000 5,480,000
Other assets 13,839,000 13,839,000 8,525,000
Total assets 871,256,000 802,789,000 673,808,000
Interest bearing liabilities
- Current 3,152,000 3,152,000 3,361,000
- Non-current 298,699,000 230,232,000 269,800,000
Derivative financial liabilities 9,741,000 9,741,000 5,834,000
Current tax liabilities 667,000 667,000 277,000
Deferred tax liabilities 1,823,000 1,823,000 1,406,000
Other liabilities 24,761,000 24,761,000 14,395,000
Total liabilities 338,843,000 270,376,000 295,073,000
Net assets 532,413,000 532,413,000 378,735,000
Units on issue 333,137,778 333,137,778 255,630,515
NAV per unit 1.60 1.60 1.48
Adjustment for water entitlements fair value per unit
0.15 0.15 0.20
Adjusted NAV per unit 1.75 1.75 1.68
• Accounting standards and ASIC guidance
require water entitlements to be
recorded as intangible assets, and held
at the lower of cost or fair value. The
adjustment for water entitlements
shows the difference between book
value and fair value (based on current
independent valuations).
• Water entitlements totalling 114,415 ML
and water delivery entitlements of
21,430 ML representing a fair value of
$173.2m or 20% of total adjusted assets.
22
For
per
sona
l use
onl
y

Managed by:
Notes: 1. Accounting standards and ASIC guidance require water entitlements to be recorded as intangible assets, and held at the lower of cost or fair value. The adjustment for
water entitlements shows the adjustment to the fair value of the water entitlements held.2. Relates to water entitlements held as part of the investment in Barossa Infrastructure Limited, Coleambally Irrigation Co-operative Limited, breeder herd finance lease, loan
to Camm, and finance lease with JBS Australia for three feedlots, which are accounted for as financial assets.3. Water entitlements of 114,415 ML and 21,430 ML of water delivery entitlements held by the Group representing a fair value of $173.2m.4. Fair value adjustments as part of 31 December 2018 valuations. 5. Breeder herd lease structured as a finance lease with no price risk impact on lessor associated with movements in value of the breeder herd (approx. 17,000 head).
HY19 results - total assets reconciliation
Total assets reconciliation
Investment property
Bearer plants
Intangibleassets1,3
Financialassets -
property2,3
Other assets Total
Adjustment for water
entitlements at fair values1,3
Adjusted total assets
$ $ $ $ $ $ $ $
Balance as at 30 June 2018 357,518,000 157,239,000 106,926,000 36,910,000 15,215,000 673,808,000 49,841,000 723,649,000
Additions – Cattle 41,553,000 - - - - 41,553,000 - 41,553,000
Additions – Cotton 19,428,000 - - - - 19,428,000 - 19,428,000
Additions - Almond orchard 4,237,000 6,830,000 - - - 11,067,000 - 11,067,000
Additions net of disposals 226,000 10,000 1,598,000 - - 1,834,000 - 1,834,000
Depreciation and impairments - - 106,000 - (591,000) (485,000) - (485,000)
Fair value adjustment4 2,831,000 6,212,000 - - - 9,043,000 2,003,000 11,046,000
Breeder herd lease5 - - - 276,000 - 276,000 - 276,000
JBS Feedlots - - - 28,774,000 - 28,774,000 - 28,774,000
Other movements (100,000) - - - 17,591,000 17,491,000 - 17,491,000
Balance as at 31 December 2018 425,693,000 170,291,000 108,630,000 65,960,000 32,215,000 802,789,000 51,844,000 854,633,000
23
For
per
sona
l use
onl
y

Managed by:
Sector Asset Brief descriptionLast independent valuation (by reporting date)
Almonds
Mooral 800 ha mature orchard, NSW June 2018
Yilgah 1,000 ha mature orchard, NSW June 2018
Tocabil 600 ha orchard, NSW June 2018
Kerarbury 2,500 ha orchard under development, NSW December 2018
Cattle
Mutton Hole 140,300 ha breeding property, Qld June 2017
Oakland Park 85,500 ha breeding property, Qld June 2017
Rewan 17,500 ha backgrounding property, Qld December 2017
Natal Aggregation 390,600 ha breeding & backgrounding properties, Qld December 2017
Comanche 7,600 ha breeding & backgrounding property, Qld June 2018
Cerberus 8,280 ha breeding & backgrounding property, Qld December 2018
Dyamberin 1,728 ha breeding & backgrounding property, NSW December 2018
Woodburn 1,062 ha breeding & backgrounding property, NSW December 2018
Cotton Lynora Downs 4,880 ha cropping property, Qld December 2017
Mayneland 2,942 ha cropping property, Qld December 2018
Poultry Griffith sheds 134 sheds on 13 farms, NSW June 2018
Lethbridge sheds 20 sheds on four farms, Vic June 2018
Macadamias Swan Ridge, Moore Park, Bonmac 259 ha orchards, Qld June 2018
Vineyards Kleinig, Geier, Hahn, Mundy, Murphy, Rosebank, Dohnt
666 ha vineyards, SA and Vic June 2017
Water Murrumbidgee High Security 9,549 ML entitlement December 2017
Independent valuationsRFM has a policy to independently value assets at least every two years.
Asset and last independent valuation date
24
For
per
sona
l use
onl
y

Managed by:
Investment overview and strategy
Maintain agricultural REIT structure.
Invest in sectors where Australia possesses a comparative advantage.
Enhance sector diversification.
Enhance climatic diversification.
Identify investments which may benefit from productivity capex.
Invest in sectors where RFM has direct operational knowledge.
1
2
3
4
5
Description
Strategy
• To generate a stable income plus capital growth by owning and improving farms.
Objectives
• Grow adjusted funds from operations (AFFO) per unit through lease indexation, reinvestment of retained AFFO and market rent review mechanisms.
• Grow distributions consistently at 4% p.a.
• Maintain gearing between 30-35%.
• Increase sector and climatic diversification, liquidity and scale.
Key principles underpinning assessment of acquisition opportunities
6
Rural Funds Group is an agricultural real estate investment trust (REIT) that leases properties to agricultural operators and processors.
25
For
per
sona
l use
onl
y

Managed by:
Distribution growthA combination of lease indexation, reinvestment of retained AFFO and market rent review mechanisms has enabled DPU growth to be maintained at or above the 4% per annum target. FY20 forecast distributions of 10.85 cents per unit in line with this target.
DPU, DPU growth and retained AFFO per unit
8.598.93
9.6410.03
10.43
0.510.33
2.872.67
2.77
FY15 FY16 FY17 FY18 FY19f
5.0
6.0
7.0
8.0
9.0
10.0
11.0
12.0
13.0
14.0
15.0
Ce
nts
pe
r u
nit
4%
4%
8%
4%
DPU Retained AFFO per unit DPU growth 26
For
per
sona
l use
onl
y

Managed by:
Olam Orchards Australia
Largest almond grower in Australia, producing approximately 45% of the national crop. Wholly owned subsidiary of SGX-listed Olam International Ltd (SGX: O32), one of the worlds largest agribusinesses with 204 processing facilities globally and a market capitalisation of A$6.6b.
23.2%
Select Harvests
One of Australia’s largest almond growers and the country’s leading manufacturer, processor and marketer of nut products to Australian and international markets. ASX-listed (ASX: SHV) with a market capitalisation of $0.5b.
13.7%
RFM Poultry & Baiada1
One of the two largest integrated poultry breeding, growing and processors in Australia. Retail brands include Steggles and Lilydale.
12.1%
JBS Australia
Australia’s largest cattle lot feeder and processor with five feedlots and 10 processing facilities. A subsidiary of the Brazilian-listed JBS S.A. (BZ: JBSS3) that has a market capitalisation of A$15.0b. JBS S.A. employs 235,000 people globally and is the world’s largest beef and poultry producer and second largest pork and lamb producer.
8.2%
Cattle JV2A farm and fund manager with over 20 years’ experience operating assets in multiple agricultural sectors including cattle, almonds, poultry, cotton, vineyards and macadamias.
6.2%
Treasury Wine Estates
World’s largest listed pure-play wine company. Winemaking facilities in Australia, New Zealand and the United States. Key brands include Penfolds and Wolf Blass. ASX-listed (ASX: TWE) with a market capitalisation of $12.8b.
5.6%
DA and JF CammPart of the Camm Agricultural Group, an integrated cattle business operating nine properties including a 9,000 SCU feedlot in southern Queensland.
5.4%
Key lessees and counterparts Lessees and counterparts include leading agricultural producers and processors.
Top 75% lessees/counterparts by FY19f revenue
Notes:1. RFM Poultry, lessee to RFF, has grower contracts with Baiada Poultry Pty Ltd and Turi Foods Pty Ltd.2. Cattle JV is a wholly owned subsidiary of Rural Funds Management Ltd.
27
For
per
sona
l use
onl
y

Managed by:
Lease expiry profile
Lease expiry profile
Portfolio WALE of 11.4 years.
28
Portfolio WALE of 11.4 years
For
per
sona
l use
onl
y

Managed by:
Notes: 1. Australian Bureau of Agricultural and Resource Economics and Sciences (ABARES) AGSURF Data 2017.2. ABARES AGSURF Data 2018. Data represents ABARES defined broadacre sector of Australian agriculture (cropping, livestock and mixed operation thereof). Broadacre
data set used in order to show segmentation by size of farm. Total farm number for 2017 was 85,681. Size of farm is defined as gross turnover (total cash receipts plus build up of trading stocks).
Capital sources for investment update1 Farms by size and average age of farmers2
Favourable acquisition environment Capital constraints have limited operator’s ability to undertake productivity improvements.The need for intergenerational transfer provides acquisition and development opportunities.
29
For
per
sona
l use
onl
y

Managed by:
Manager with multi sector expertise RFM is a fund and farm manager with 22 years’ experience in Australian agriculture, with operational and development experience across multiple agricultural sectors.
Key farm management team and sector experience
Daryl WinterNational Manager – Horticulture
39 yrs
Adriaan Shields National Manager – Poultry
18 yrs
Matthew MitchellNational Manager –Cropping
24 yrs
Tim Sheridan Chief Operating Officer & Manager of Cattle JV
10 yrs
Scott NorvalNational Manager – Macadamias
16 yrs
30
1997
2019
1997RFM established by David Bryant.
1998-2018Land and water acquired at Hillston, NSW, to develop irrigated cotton fields. Cotton crops planted each year.
2000Vineyards developed in the Barossa Valley & Adelaide Hills, SA. Continue to supply icon quality grapes to Treasury Wine Estates.
2003-2006 Purchase of Bartter Enterprises 110 broiler chicken sheds in Griffith, NSW, becoming one of Australia's largest contract chicken growers. Developed an additional 24 sheds in Griffith, NSW, and 20 sheds in Lethbridge, Vic.
2006-2018Developed 1,814 ha of almond orchards at Hillston, NSW, one of the first commercial plantings in the Riverina. An additional 3,100 ha of almond orchards developed in conjunction with Olam Orchards Australia.
2016 Acquired and operate 254 ha of macadamia orchards.Acquired and operate one backgrounding and two breeding cattle properties.
2017Acquired and operate 4,800 ha cotton property. Acquired three contiguous cattle properties, totalling 390,600 ha.
2018Acquired and operate 2,942 ha cotton property.Acquired three breeding and backgrounding cattle properties totalling 17,608 ha and three cattle feedlots.
Ben LeaperOperations Manager– Cattle
3 yrs
Harvey Gaynor General Manager - Farming
31 yrs
For
per
sona
l use
onl
y

Managed by:
Rural Funds Management
Guy PaynterNon – Executive Chairman
9 yrs
David BryantManaging Director
22 yrs
Michael CarrollNon – Executive Director
9 yrs
Stuart WaightExecutive
16 yrs
James Powell General Manager –Investor Relations & Marketing
11 yrs
Tim Sheridan Chief Operating Officer
11 yrs
Daniel Yap Financial Controller
7 yrs
Julian WiddupNon – Executive Director
2 yrs
RFM is a fund and farm manager with 22 years’ experience in Australian agriculture.
Dan EdwardsNational Manager –Rural Funds Group
14 yrs
Established 1997
Assets under management
$1.2 billion
Ownership Directors & staff
Farm & operations staff 61
Funds management staff 46
RFM direct operational experience
Cotton: since 1998Vineyards: since 2000Poultry: since 2003Almonds: since 2006 Macadamias: since 2006Livestock: since 2010
RFF fee structure 1.05% p.a. adjusted total assets & cost recovery
RFF key responsibilities
• Compliance to financial, farming and reporting requirements of leases
• Water asset management including obtaining approvals and engagement with government
• Management of infrastructure e.g. ongoing and development capital expenditure
• Coordination of regular independent valuations
• Facilitating acquisitions
• Managing lessee/customer relationships
Key information Board and management team contacts and tenure
Emma Spear Company Secretary
11 yrs
Harvey Gaynor General Manager – Farming
Less than 1 yr
31
For
per
sona
l use
onl
y

Managed by:
Glossary and table of abbreviations
Term Definition
Adjusted NAV
Net Asset Value (NAV) adjusted for the independent valuation of water entitlements
Adjusted total assets
Total assets adjusted for the independent valuation of water entitlements
ASX Australian Securities Exchange
AFFO Adjusted funds from operations - a financial metric used in the REIT sector to measure available cash flow from operations (adjustment relates to non-cash tax expense)
CounterpartA party other than RFF involved in a financial transaction, usually referring to the lessee of a property
CPI Consumer Price Index
DPU Distributions per Unit
Fair value Value of an asset as determined by an independent valuation
FeedlotsA facility where livestock are provided a nutritious diet for the purpose of producing beef of a consistent quality and quantity
FIRB The Foreign Investment Review Board
Gearing Calculated as external borrowings divided by adjusted total assets
Term Definition
ha Hectare(s) - an area of 10,000m2
Improved pasture
Pasture with higher relative level of nutrition that is sown to increase livestock weight gain
LVRLoan to valuation ratio - a bank covenant, calculated as debt divided by tangible assets (including water entitlements)
ML Megalitre - a volume of 1,000,000 litres
m Million(s)
NAVNet asset value - calculated as assets less the value of liabilities (does not recognise fair value of water entitlements)
Processor The operator of a slaughtering facility at which cattle are slaughtered and broken down into saleable beef
Pro forma Financial statements based on certain assumptions and projections
Standard Cattle Unit (SCU)
A measure of feedlot capacity - one Standard Cattle Unit is equivalent to an animal with a liveweight of 600 kg
Total assets Total value of assets as presented on the balance sheet (water entitlements recorded at the lower of cost or fair value)
RFF Rural Funds Group (ASX:RFF)
RFM Rural Funds Management Limited - manager and responsible entity for the Rural Funds Group
32
For
per
sona
l use
onl
y

Rural Funds Management LtdACN 077 492 838 AFSL 226701 Canberra OfficeLevel 2, 2 King StreetDeakin ACT 2600
Telephone: +61 2 6203 9700Facsimile: +61 2 6281 5077Website: ruralfunds.com.au
Managing good assets with good people
For further information:
David BryantManaging Director
Rural Funds Management
T 02 6203 9700
For media enquiries:
Stuart WaightExecutive Manager
Rural Funds Management
T 0419 126 689
Investor relations enquiries:
James PowellGeneral Manager - InvestorRelations & Marketing
Rural Funds Management
T 0420 279 374
For
per
sona
l use
onl
y