for personal use only · amalgam sales continues the trend we have seen in recent years with the us...
TRANSCRIPT
HY 2020 RESULTS PRESENTATION
Samantha Cheetham CEOJohn Slaviero CFO / COO
Good morning everyone and thank you for joining us for our first half result investor conference call for financial year 2020.
My name is Samantha Cheetham, the Chief Executive Officer and with me today is John Slaviero our Chief Financial Officer and Chief Operating Officer.
This is a very pleasing result with many of our milestones achieved in the half. With increased investment in sales and marketing activities, we are beginning to see strong growth in the product categories and in regions we are targeting. Gross margins have been particularly pleasing, reflective of a continuing shift towards our higher margin products.
We are continuing to make improvements in our manufacturing processes; we are investing in research and development and we are growing faster than our peers in the Global dental industry.
1
For
per
sona
l use
onl
y

Long successful operating history – founded in 1972 and listed on ASX in 1985 and Australia’s largest dental manufacturer
SDI conducts research and development of specialist dentist materials undertaking the development, manufacturing and marketing of dental restorative materials.
SDI sells to 100+ countries on all continents and with sales teams and distribution in Australia, Brazil, Europe and North America
YOUR SMILE. OUR VISION.
2
Before talking about this result and sharing with you some of the highlights of the last six months, I wanted to recap on where we have come from.
Having been established in 1972 we have built this business into a successful manufacturing company where today we are exporting to more than a 100 countries.
Underpinning this success has been our continuing focus on research and development, and through this we have developed new and innovative products that meet the needs of our customers.
Let me now turn to the agenda for today's presentation.
2
For
per
sona
l use
onl
y
AGENDA• HY 2020 highlights• Product categories• Key geographies• Financial performance • Strategy and outlook
3
I will begin with the highlights for the last six months, then spend some time talking about the product categories and the key geographies we operate in.
I will then turn over to John who will run through the financials before returning to me to talk about our strategy and outlook for the remainder of the financial year.
3
For
per
sona
l use
onl
y
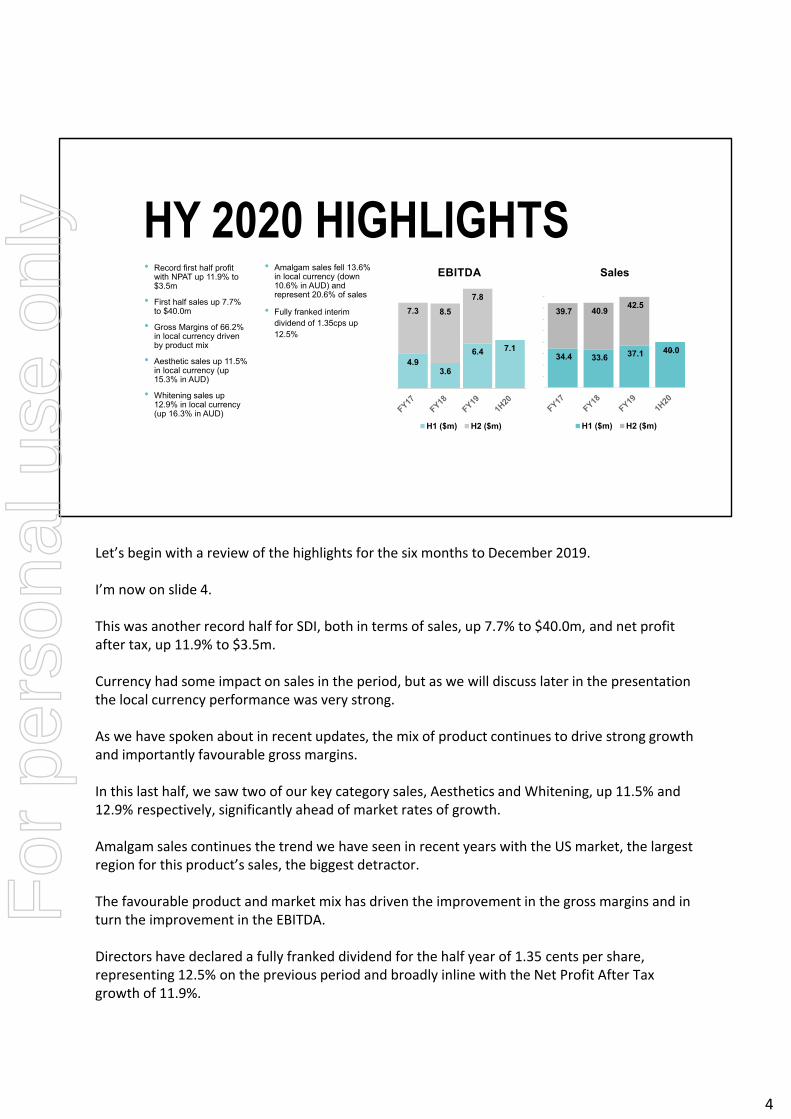
• Record first half profit with NPAT up 11.9% to $3.5m
• First half sales up 7.7% to $40.0m
• Gross Margins of 66.2% in local currency driven by product mix
• Aesthetic sales up 11.5% in local currency (up 15.3% in AUD)
• Whitening sales up 12.9% in local currency (up 16.3% in AUD)
• Amalgam sales fell 13.6% in local currency (down 10.6% in AUD) and represent 20.6% of sales
• Fully franked interim dividend of 1.35cps up 12.5%
HY 2020 HIGHLIGHTS
4.93.6
6.4 7.1
7.3 8.5
7.8
EBITDA
H1 ($m) H2 ($m)
34.4 33.6 37.1 40.0
39.7 40.9 42.5
-
-
10.0
20.0
30.0
40.0
50.0
60.0
70.0
80.0
Sales
H1 ($m) H2 ($m)
Let’s begin with a review of the highlights for the six months to December 2019.
I’m now on slide 4.
This was another record half for SDI, both in terms of sales, up 7.7% to $40.0m, and net profit after tax, up 11.9% to $3.5m.
Currency had some impact on sales in the period, but as we will discuss later in the presentation the local currency performance was very strong.
As we have spoken about in recent updates, the mix of product continues to drive strong growth and importantly favourable gross margins.
In this last half, we saw two of our key category sales, Aesthetics and Whitening, up 11.5% and 12.9% respectively, significantly ahead of market rates of growth.
Amalgam sales continues the trend we have seen in recent years with the US market, the largest region for this product’s sales, the biggest detractor.
The favourable product and market mix has driven the improvement in the gross margins and in turn the improvement in the EBITDA.
Directors have declared a fully franked dividend for the half year of 1.35 cents per share, representing 12.5% on the previous period and broadly inline with the Net Profit After Tax growth of 11.9%.
4
For
per
sona
l use
onl
y
PRODUCT CATEGORIES
5
Let’s now turn to the product categories.
5
For
per
sona
l use
onl
y
• Aesthetics sales
growth continuing with
11.5% growth in local
currency (up 15.3% in
AUD)
• Whitening returns to
growth, up 12.9% in
local currency (up
16.3% in AUD)
• Amalgam sales, fell
13.6% in local
currency (down
10.6% in AUD)
• Growth in Aesthetics
and Whitening
products continue to
track significantly
ahead of market
growth rates globally
AESTHETICS & WHITENING DRIVE GROWTH
6
Product Category Sales
Growth in Local Currency
Growth in AUD
% of Total AUD Sales
Aesthetics 11.5% 15.3% 45.7%
Whitening 12.9% 16.3% 26.6%
Equipment (7.2%) (4.1%) 7.1%
Amalgam (13.6%) (10.6%) 20.6%
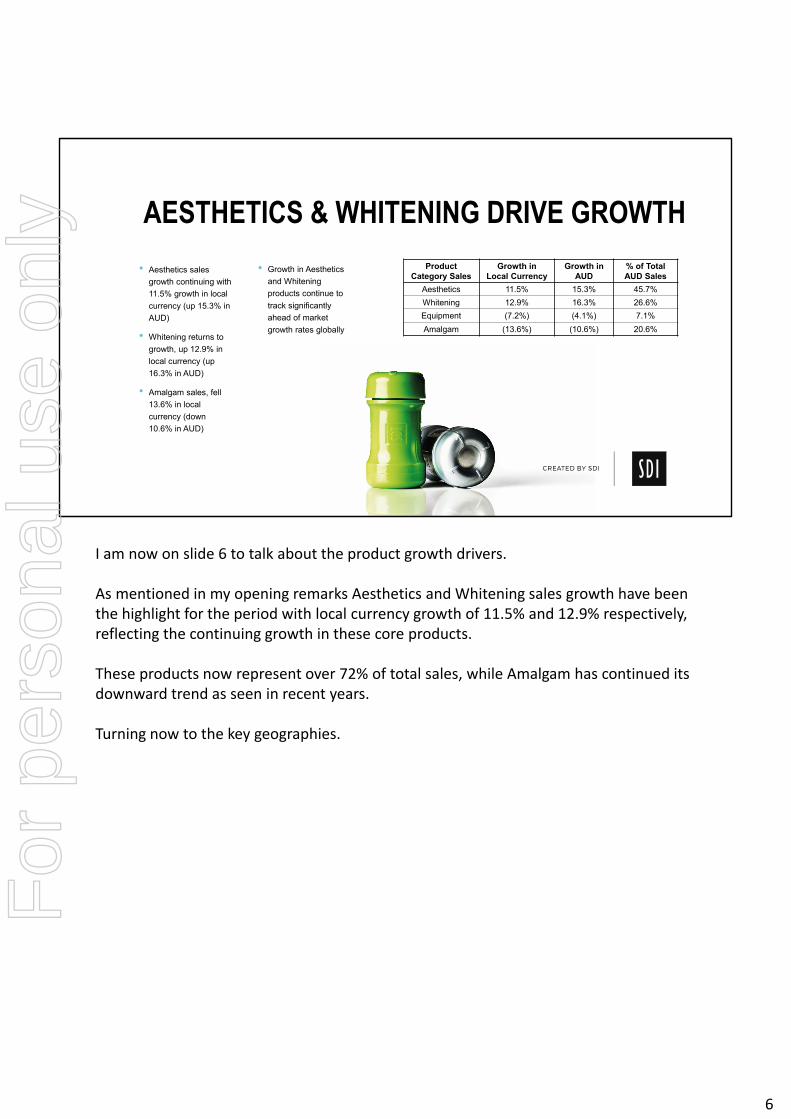
I am now on slide 6 to talk about the product growth drivers.
As mentioned in my opening remarks Aesthetics and Whitening sales growth have been the highlight for the period with local currency growth of 11.5% and 12.9% respectively, reflecting the continuing growth in these core products.
These products now represent over 72% of total sales, while Amalgam has continued its downward trend as seen in recent years.
Turning now to the key geographies.
6
For
per
sona
l use
onl
y

KEY GEOGRAPHIES
7
7
For
per
sona
l use
onl
y

• The Australian business
unit grew sales by 3.2%
in local currency,
including direct exports
• Europe sales grew 9%
with Aesthetics and
Whitening products
continuing to gain share
• Brazil returned to growth
with 21% growth in local
currency terms, following
investments in local
manufacturing
• North American sales
saw a 5% decline in
local currency with
weak Amalgam &
Whitening sales the
main detractor
SALES BY BUSINESS UNIT
8
Business UnitGrowth in local
currencyGrowth in AUD
% of Total AUD Sales
Australia* 3.2% 7.2% 38.5%
North America (5.0%) 0.2% 22.2%
Europe 9.0% 10.9% 32.1%
Brazil 21.0% 23.3% 7.2%
TOTAL 4.1% 7.7% 100.0%
*Australian business unit sales includes direct exports to other markets
Slide 8 breaks down the sales by business units as disclosed in our accounts with local currency growth in Australia at 3.2%, Europe at 9.1% and Brazil at 21.0%.
Sales growth in Europe and Brazil were back on track after coming off a previous low base, with sales in non‐Amalgam products increasing significantly faster than the decline in Amalgam sales, highlighting a lower reliance on Amalgam products in these markets.
The better way to look at our sales is on the next slide, slide 9.
8
For
per
sona
l use
onl
y

North America $8.8m +0.1%
Europe$14.5m +11.7%
Middle East/Africa$4.4m (3.9%)
South America $4.5m +19.9%
APAC$7.8m +10.9%
GEOGRAPHICAL SALES HY 2020
9
7.1
4.6
8.8
3.8
12.8
7.8
4.4
8.8
4.5
14.5
Oceania& Asia
MiddleEast &Africa
NorthAmerica
SouthAmerica
Europe
Sales by geographical location A$(m)
1H19 1H20
This slide shows the geographical sales and is more meaningful in understanding customer behaviour.
The strongest regions in the six months to December were South America, Europe and APAC with sales up 19.9%, 11.7% and 10.9% respectively in AUD terms.
As indicated earlier the strong sales performance was due to product sales in our two leading product categories, Aesthetics and Whitening.
Further, following investments we have made in building our local manufacturing capability for some products in Brazil, we are beginning to see strong performance in this market. These initiatives have enabled us to compete more effectively in this local market.
Finally, the APAC result has continued the trend seen in other regions with our leading products gaining traction.
In Australian Dollars, the North American market was flat (down 5.0% in local currency) for the period. Amalgam sales represent more than a third of sales in this market, were particularly weak in the six months to December. In addition to this, Whitening sales were also down which is being addressed with a new marketing campaign.
I will now hand over to John to talk though the financials.
9
For
per
sona
l use
onl
y

FINANCIAL PERFORMANCE
10
10
For
per
sona
l use
onl
y
• Gross product margins up 5.3% to 66.2%
- Favourable product mix in favourable regions and currency drive improved margins.
• Other Income includes $707k of unrealised currency loss
• Operating expenses increased by 12.0% (adjusted for currency movements 9.7%) following a period of investment in sales & marketing, increased investment in research and some additional compliance costs.
• Amortisation expense of $1.0m
PROFIT & LOSS
11
Profit & Loss ($'000) HY 2020 HY 2019 % Change
Revenue
Sales Revenue 39,963 37,103 7.7%
Cost of goods sold (13,502) (14,495) (6.9%)
Gross Profit 26,461 22,608 17.0%
Gross margin 66.2% 60.9%
Other income / (expense) (407) 675
Expenses
Selling & Administration (19,255) (17,505) 10.0%
Research & Development (901) (648) 39.0%
Other Expenses (945) (684) 38.2%
Profit before tax 4,953 4,446 11.4%
Tax expense (1,456) (1,320) 10.3%
Net profit after tax 3,497 3,126 11.9%
Amortisation & depreciation 2131 1,919 11.0%
Net interest expense 35 27
EBITDA 7,119 6,392 11.4%
Thanks Sam.
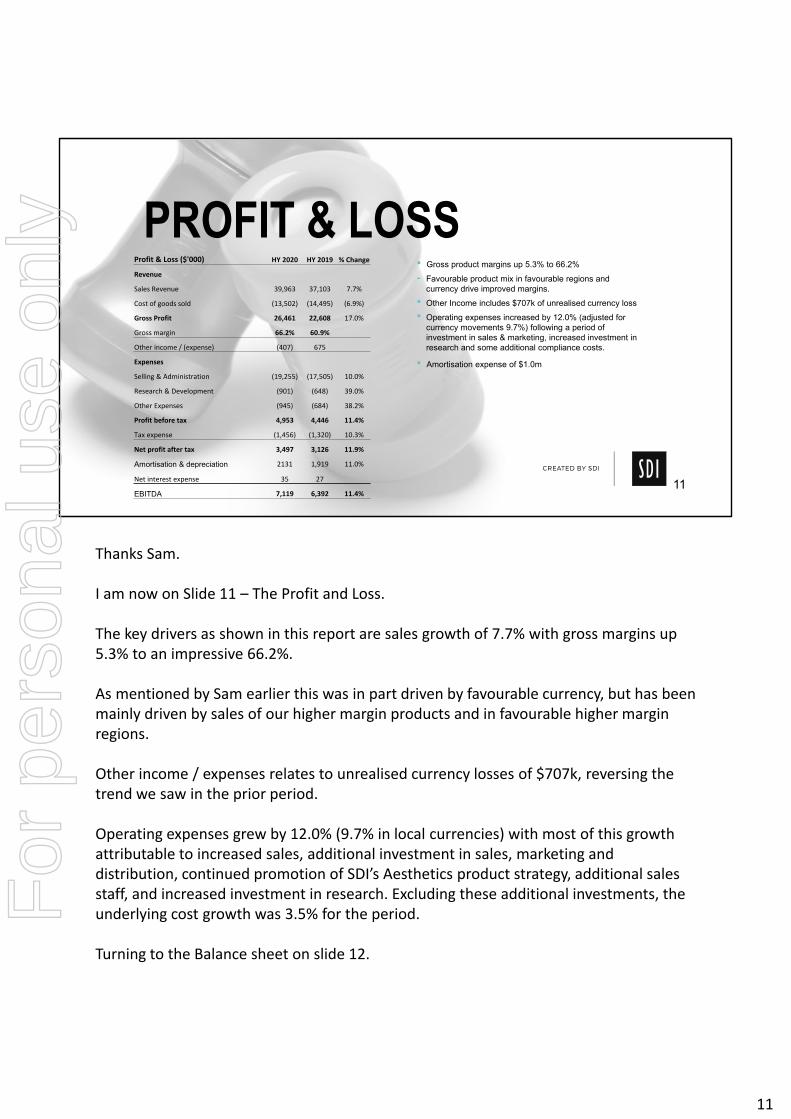
I am now on Slide 11 – The Profit and Loss.
The key drivers as shown in this report are sales growth of 7.7% with gross margins up 5.3% to an impressive 66.2%.
As mentioned by Sam earlier this was in part driven by favourable currency, but has been mainly driven by sales of our higher margin products and in favourable higher margin regions.
Other income / expenses relates to unrealised currency losses of $707k, reversing the trend we saw in the prior period.
Operating expenses grew by 12.0% (9.7% in local currencies) with most of this growth attributable to increased sales, additional investment in sales, marketing and distribution, continued promotion of SDI’s Aesthetics product strategy, additional sales staff, and increased investment in research. Excluding these additional investments, the underlying cost growth was 3.5% for the period.
Turning to the Balance sheet on slide 12.
11
For
per
sona
l use
onl
y
Balance sheet ($'000) FY18 FY17 Change
Assets
Cash and cash equivalents 8,246 5,754 43%
Trade and other receivables 16,225 15,451 5%
Inventories 14,558 17,135 (15%)
Prepayments 750 818 (8%)
Other receivables 885 1,124 (21%)
Property, plant and equipment 17,569 18,121 (3%)
Intangibles 23,657 22,859 3%
Total assets 81,890 81,262 1%
Liabilities
Trade and other payables 3,960 4,551 (13%)
Borrowings 2,214 4,137 (46%)
Derivative financial instruments ‐ 62 (100%)
Provision for income tax 182 248 (27%)
Employee benefits 3,546 3,715 (5%)
Deferred tax liability 2,437 2,206 10%
Total liabilities 12,339 14,919 (17%)
Net assets 69,551 66,343 5%
• Cash holdings at balance date were $6.1m with no debt
• Inventory build due to Whitening product rebranding and a new light curing light, ahead of its release in 2H 2H 2020
• New Accounting Standard for Leasing
BALANCE SHEET
12
Balance Sheet ($'000) HY 2020 FY 2019 HY 2019
Assets
Cash & cash equivalents 6,058 6,481 6,068
Trade & other receivables 14,203 17,780 15,059
Inventories 20,655 17,242 17,501
Prepayments 2,716 1,100 1,376
Other receivables 507 713 1,125
Property, plant & equipment 19,387 18,680 17,944
Right of use Assets 882
Intangibles 25,298 24,603 23,967
Total Assets 89,706 86,599 83,040
Liabilities
Trade & other payables 7,562 6,249 5,283
Provision for income tax 566 1,386 508
Employee benefits 3,499 3,516 3,387
Lease Liability 899
Deferred tax liability 2,475 2,363 2,402
Total Liabilities 15,001 13,514 11,580
Net Assets 74,705 73,085 71,460
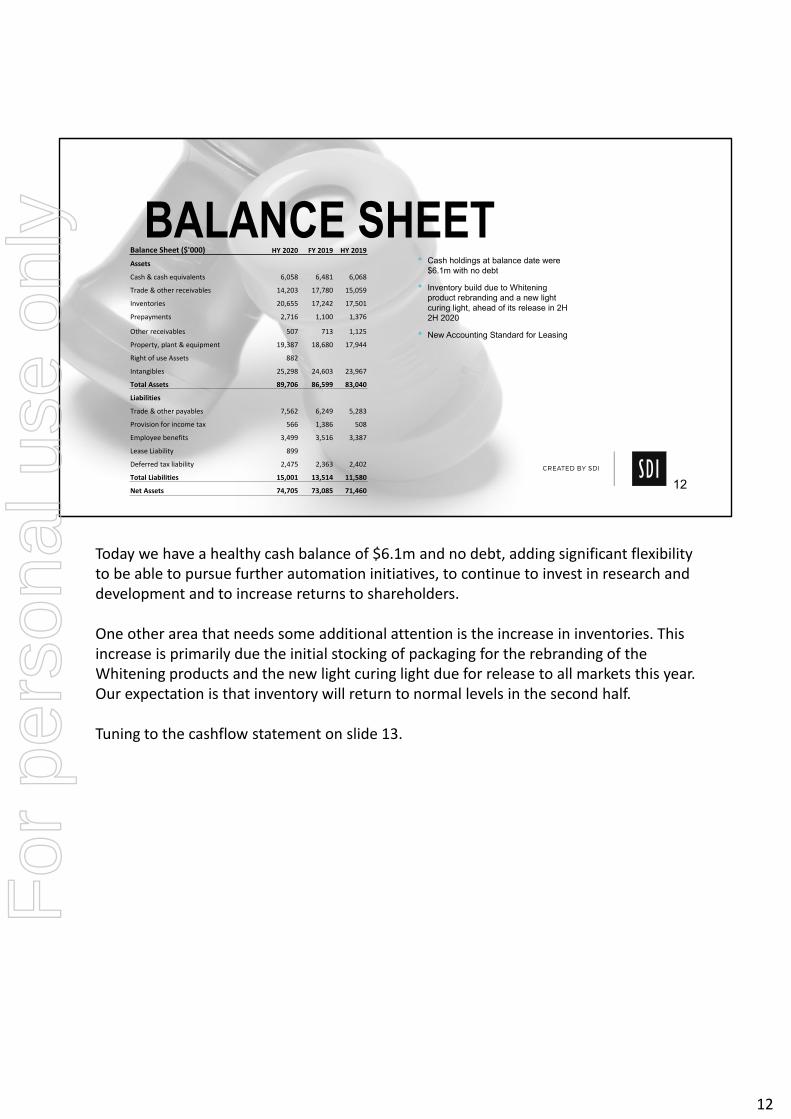
Today we have a healthy cash balance of $6.1m and no debt, adding significant flexibility to be able to pursue further automation initiatives, to continue to invest in research and development and to increase returns to shareholders.
One other area that needs some additional attention is the increase in inventories. This increase is primarily due the initial stocking of packaging for the rebranding of the Whitening products and the new light curing light due for release to all markets this year. Our expectation is that inventory will return to normal levels in the second half.
Tuning to the cashflow statement on slide 13.
12
For
per
sona
l use
onl
y
• Increased inventory investment for rebranding in Whitening and a new product launch
• Continued investment in R & D
• New Accounting Standard on leasing
CASH FLOWCash Flow ($'000) HY 2020 HY 2019 % Chg
Receipts from customers 43,746 38,029 15.0%
Payments to suppliers & employees (36,826) (32,792) 12.3%
Other revenue 4 6
Interest & other finance costs paid (41) (33)
Income tax paid (2,164) (1,029) 110.3%
Net cash from operating activities 4,719 4,181 12.9%
Payments for property, plant & equip. (1,754) (1,388) 26.4%
Payments for intangibles (1,702) (1,245) 36.7%
Proceeds from disposal of P P & E 187 27
Net cash used for investing activities (3,269) (2,606) 25.4%
Net cash used in financing activities (1,783) (3,878) (54.0%)
Cash & cash equivalents at end of period 6,058 6,068 0% 13
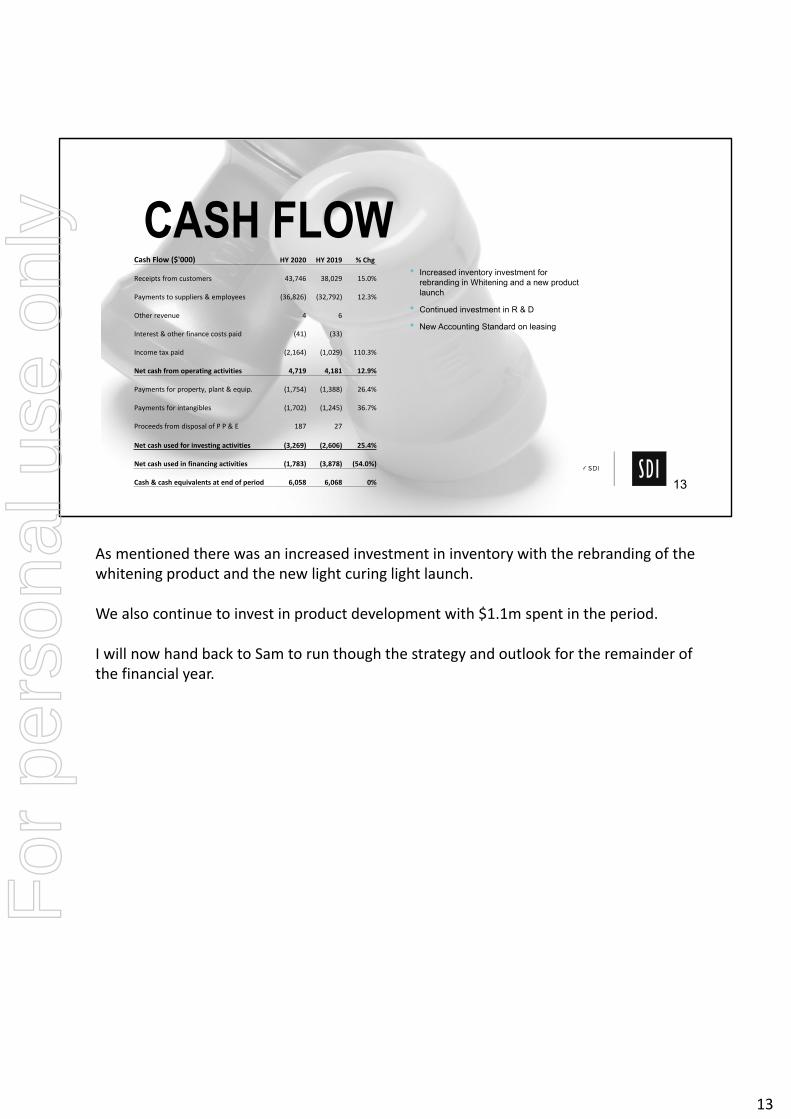
As mentioned there was an increased investment in inventory with the rebranding of the whitening product and the new light curing light launch.
We also continue to invest in product development with $1.1m spent in the period.
I will now hand back to Sam to run though the strategy and outlook for the remainder of the financial year.
13
For
per
sona
l use
onl
y
STRATEGY & OUTLOOK
14
14
For
per
sona
l use
onl
y
STRATEGY & OUTLOOK
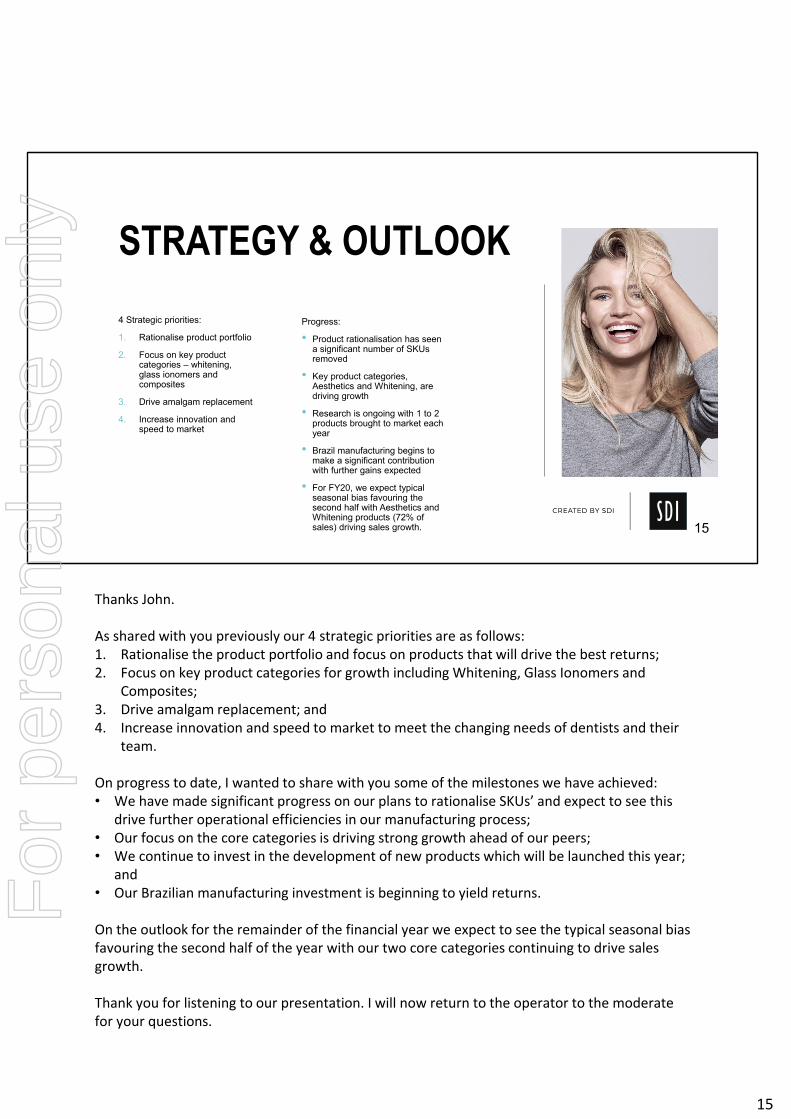
4 Strategic priorities:
1. Rationalise product portfolio
2. Focus on key product categories – whitening, glass ionomers and composites
3. Drive amalgam replacement
4. Increase innovation and speed to market
Progress:
• Product rationalisation has seen a significant number of SKUs removed
• Key product categories, Aesthetics and Whitening, are driving growth
• Research is ongoing with 1 to 2 products brought to market each year
• Brazil manufacturing begins to make a significant contribution with further gains expected
• For FY20, we expect typical seasonal bias favouring the second half with Aesthetics and Whitening products (72% of sales) driving sales growth. 15
Thanks John.
As shared with you previously our 4 strategic priorities are as follows:1. Rationalise the product portfolio and focus on products that will drive the best returns;2. Focus on key product categories for growth including Whitening, Glass Ionomers and
Composites;3. Drive amalgam replacement; and4. Increase innovation and speed to market to meet the changing needs of dentists and their
team.
On progress to date, I wanted to share with you some of the milestones we have achieved:• We have made significant progress on our plans to rationalise SKUs’ and expect to see this
drive further operational efficiencies in our manufacturing process;• Our focus on the core categories is driving strong growth ahead of our peers;• We continue to invest in the development of new products which will be launched this year;
and • Our Brazilian manufacturing investment is beginning to yield returns.
On the outlook for the remainder of the financial year we expect to see the typical seasonal bias favouring the second half of the year with our two core categories continuing to drive sales growth.
Thank you for listening to our presentation. I will now return to the operator to the moderate for your questions.
15
For
per
sona
l use
onl
y

QUESTIONS
16
16
For
per
sona
l use
onl
y
DISCLAIMERTHIS PRESENTATION CONTAINS SUMMARY INFORMATION ABOUT SDI LIMITED (SDI) AND ITS SUBSIDIARIES AND THEIR ACTIVITIES. THE INFORMATION IN THIS PRESENTATION DOES NOT PURPORT TO BE COMPLETE. IT SHOULD BE READ IN CONJUNCTION WITH SDI’S OTHER PERIODIC AND CONTINUOUS DISCLOSURE ANNOUNCEMENTS LODGED WITH THE AUSTRALIAN SECURITIES EXCHANGE, WHICH ARE AVAILABLE AT WWW.ASX.COM.AU.THE INFORMATION CONTAINED IN THIS PRESENTATION IS NOT INVESTMENT OR FINANCIAL PRODUCT ADVICE AND HAS BEEN PREPARED WITHOUT TAKING INTO ACCOUNT THE INVESTMENT OBJECTIVES, FINANCIAL SITUATION OR PARTICULAR NEEDS OF ANY PARTICULAR PERSON. BEFORE MAKING AN INVESTMENT DECISION, INVESTORS SHOULD CONSIDER THE APPROPRIATENESS OF THE INFORMATION HAVING REGARD TO THEIR OWN INVESTMENT OBJECTIVES, FINANCIAL SITUATION AND NEEDS AND SEEK INDEPENDENT PROFESSIONAL ADVICE APPROPRIATE TO THEIR JURISDICTION AND CIRCUMSTANCES.TO THE EXTENT PERMITTED BY LAW, NO RESPONSIBILITY FOR ANY LOSS ARISING IN ANY WAY FROM ANYONE ACTING OR REFRAINING FROM ACTING AS A RESULT OF THIS INFORMATION IS ACCEPTED BY SDI, ANY OF ITS RELATED BODIES CORPORATE OR ITS DIRECTORS, OFFICERS, EMPLOYEES, PROFESSIONAL ADVISORS AND AGENTS (RELATED PARTIES). NO REPRESENTATION OR WARRANTY, EXPRESS OR IMPLIED, IS MADE BY ANY PERSON, INCLUDING SDI AND ITS RELATED PARTIES, AS TO THE FAIRNESS, ACCURACY, COMPLETENESS OR CORRECTNESS OF THE INFORMATION, OPINIONS AND CONCLUSIONS CONTAINED IN THIS PRESENTATION.AN INVESTMENT IN SDI SECURITIES IS SUBJECT TO INVESTMENT AND OTHER KNOWN AND UNKNOWN RISKS, SOME OF WHICH ARE BEYOND THE CONTROL OF SDI OR ITS DIRECTORS. SDI DOES NOT GUARANTEE ANY PARTICULAR RATE OF RETURN OR THE PERFORMANCE OF SDI SECURITIES.PAST PERFORMANCE INFORMATION GIVEN IN THIS PRESENTATION IS GIVEN FOR ILLUSTRATIVE PURPOSES ONLY AND SHOULD NOT BE RELIED UPON AS (AND IS NOT) AN INDICATION OF FUTURE PERFORMANCE.THIS PRESENTATION CONTAINS CERTAIN FORWARD-LOOKING STATEMENTS WITH RESPECT TO THE FINANCIAL CONDITION, RESULTS OF OPERATIONS AND BUSINESS OF SDI AND ASSOCIATED ENTITIES OF SDI AND CERTAIN PLANS AND OBJECTIVES OF THE MANAGEMENT OF SDI. FORWARD-LOOKING STATEMENTS CAN BE IDENTIFIED BY THE USE OF FORWARD-LOOKING TERMINOLOGY, INCLUDING, WITHOUT LIMITATION, THE TERMS “BELIEVES”, “ESTIMATES”, “ANTICIPATES”, “EXPECTS”, “PREDICTS”, “INTENDS”, “PLANS”, “GOALS”, “TARGETS”, “AIMS”, “OUTLOOK”, “GUIDANCE”, “FORECASTS”, “MAY”, “WILL”, “WOULD”, “COULD” OR “SHOULD” OR, IN EACH CASE, THEIR NEGATIVE OR OTHER VARIATIONS OR COMPARABLE TERMINOLOGY. THESE FORWARD-LOOKING STATEMENTS INCLUDE ALL MATTERS THAT ARE NOT HISTORICAL FACTS. SUCH FORWARD-LOOKING STATEMENTS INVOLVE KNOWN AND UNKNOWN RISKS, UNCERTAINTIES AND OTHER FACTORS WHICH BECAUSE OF THEIR NATURE MAY CAUSE THE ACTUAL RESULTS OR PERFORMANCE OF SDI TO BE MATERIALLY DIFFERENT FROM THE RESULTS OR PERFORMANCE EXPRESSED OR IMPLIED BY SUCH FORWARD-LOOKING STATEMENTS.SUCH FORWARD-LOOKING STATEMENTS ARE BASED ON NUMEROUS ASSUMPTIONS REGARDING SDI’S PRESENT AND FUTURE BUSINESS STRATEGIES AND THE POLITICAL, REGULATORY AND ECONOMIC ENVIRONMENT IN WHICH SDI WILL OPERATE IN THE FUTURE, WHICH MAY NOT BE REASONABLE, AND ARE NOT GUARANTEES OR PREDICTIONS OF FUTURE PERFORMANCE. NO REPRESENTATION OR WARRANTY IS MADE THAT ANY OF THESE STATEMENTS OR FORECASTS (EXPRESS OR IMPLIED) WILL COME TO PASS OR THAT ANY FORECAST RESULT WILL BE ACHIEVED.FORWARD-LOOKING STATEMENTS SPEAK ONLY AS AT THE DATE OF THIS PRESENTATION AND TO THE FULL EXTENT PERMITTED BY LAW, SDI AND ITS RELATED PARTIES DISCLAIM ANY OBLIGATION OR UNDERTAKING TO RELEASE ANY UPDATES OR REVISIONS TO INFORMATION TO REFLECT ANY CHANGE IN ANY OF THE INFORMATION CONTAINED IN THIS PRESENTATION (INCLUDING, BUT NOT LIMITED TO, ANY ASSUMPTIONS OR EXPECTATIONS SET OUT IN THIS PRESENTATION).STATUTORY PROFIT IS PREPARED IN ACCORDANCE WITH THE CORPORATIONS ACT 2001 AND THE AUSTRALIAN ACCOUNTING STANDARDS, WHICH COMPLY WITH THE INTERNATIONAL FINANCIAL REPORTING STANDARDS (IFRS). UNDERLYING PROFIT IS CATEGORISED AS NON-IFRS FINANCIAL INFORMATION AND THEREFORE HAS BEEN PRESENTED IN COMPLIANCE WITH AUSTRALIAN SECURITIES AND INVESTMENTS COMMISSION REGULATORY GUIDE 230 – DISCLOSING NON-IFRS INFORMATION, ISSUED IN DECEMBER 2011.ALL FIGURES IN THIS PRESENTATION ARE A$ UNLESS STATED OTHERWISE AND ALL MARKET SHARES ARE ESTIMATES ONLY. A NUMBER OF FIGURES, AMOUNTS, PERCENTAGES, ESTIMATES, CALCULATIONS OF VALUE AND FRACTIONS ARE SUBJECT TO THE EFFECT OF ROUNDING. ACCORDINGLY, THE ACTUAL CALCULATIONS OF THESE FIGURES MAY DIFFER FROM FIGURES SET OUT IN THIS PRESENTATION.
17
17
For
per
sona
l use
onl
y