for personal use only - asx · •long term and smooth debt maturity profile −weighted average...
TRANSCRIPT

Rio Tinto Limited 120 Collins Street Melbourne 3000 Australia Postal Address: GPO Box 384D Melbourne 3001 Australia T +61 (0) 3 9283 3333 F +61 (0) 3 9283 3707
Registered in Australia Rio Tinto Limited 120 Collins Street Melbourne 3000 Australia ABN 96 004 458 404
ASX Market Announcements Australian Securities Exchange SYDNEY NSW 2000
8 August 2013
Dear Sir, Attached is the Rio Tinto half year results presentation given today by Rio Tinto chief executive Sam Walsh, and chief financial officer Chris Lynch. Yours faithfully,
Tim Paine Joint Company Secretary
For
per
sona
l use
onl
y

8 August 2013 Safety Strategy Performance Delivery
2013 interim results Pursuing greater value for shareholders
For
per
sona
l use
onl
y

©2013, Rio Tinto, All Rights Reserved
Cautionary statement
This presentation has been prepared by Rio Tinto plc and Rio Tinto Limited (“Rio Tinto”) and consisting of the slides for a
presentation concerning Rio Tinto. By reviewing/attending this presentation you agree to be bound by the following conditions.
Forward-looking statements
This presentation includes forward-looking statements. All statements other than statements of historical facts included in this
presentation, including, without limitation, those regarding Rio Tinto’s financial position, business strategy, plans and objectives of
management for future operations (including development plans and objectives relating to Rio Tinto’s products, production forecasts
and reserve and resource positions), are forward-looking statements. Such forward-looking statements involve known and unknown
risks, uncertainties and other factors which may cause the actual results, performance or achievements of Rio Tinto, or industry
results, to be materially different from any future results, performance or achievements expressed or implied by such forward-
looking statements.
Such forward-looking statements are based on numerous assumptions regarding Rio Tinto’s present and future business strategies
and the environment in which Rio Tinto will operate in the future. Among the important factors that could cause Rio Tinto’s actual
results, performance or achievements to differ materially from those in the forward-looking statements include, among others, levels
of actual production during any period, levels of demand and market prices, the ability to produce and transport products profitably,
the impact of foreign currency exchange rates on market prices and operating costs, operational problems, political uncertainty and
economic conditions in relevant areas of the world, the actions of competitors, activities by governmental authorities such as
changes in taxation or regulation and such other risk factors identified in Rio Tinto's most recent Annual Report on Form 20-F filed
with the United States Securities and Exchange Commission (the "SEC") or Form 6-Ks furnished to the SEC. Forward-looking
statements should, therefore, be construed in light of such risk factors and undue reliance should not be placed on forward-looking
statements. These forward-looking statements speak only as of the date of this presentation.
Nothing in this presentation should be interpreted to mean that future earnings per share of Rio Tinto plc or Rio Tinto Limited will
necessarily match or exceed its historical published earnings per share.
2 F
or p
erso
nal u
se o
nly

Sam Walsh Chief executive
8 August 2013 Safety Strategy Performance Delivery
For
per
sona
l use
onl
y

©2013, Rio Tinto, All Rights Reserved
4
Safety is a core value
0.0
0.2
0.4
0.6
0.8
1.0
1.2
1.4
1.6
1.8
2.0
’03 ’04 ’05 ’06 ’07 ’08 ’09 ’10 ’11 ’12 ’13 H1
All injuryfrequency rate
Lost time injuryfrequency rate
Injury frequency rates 2003 – H1 2013 Per 200,000 hours worked
Take 5 safety risk assessment at Oyu Tolgoi
For
per
sona
l use
onl
y
©2013, Rio Tinto, All Rights Reserved
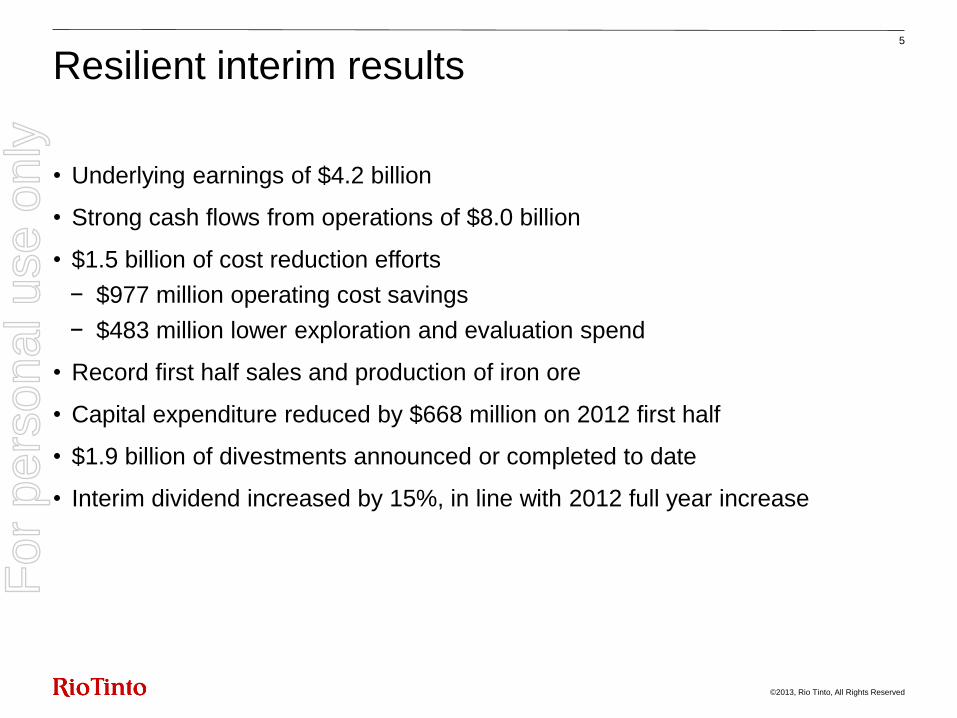
Resilient interim results
• Underlying earnings of $4.2 billion
• Strong cash flows from operations of $8.0 billion
• $1.5 billion of cost reduction efforts
− $977 million operating cost savings
− $483 million lower exploration and evaluation spend
• Record first half sales and production of iron ore
• Capital expenditure reduced by $668 million on 2012 first half
• $1.9 billion of divestments announced or completed to date
• Interim dividend increased by 15%, in line with 2012 full year increase
5 F
or p
erso
nal u
se o
nly
©2013, Rio Tinto, All Rights Reserved
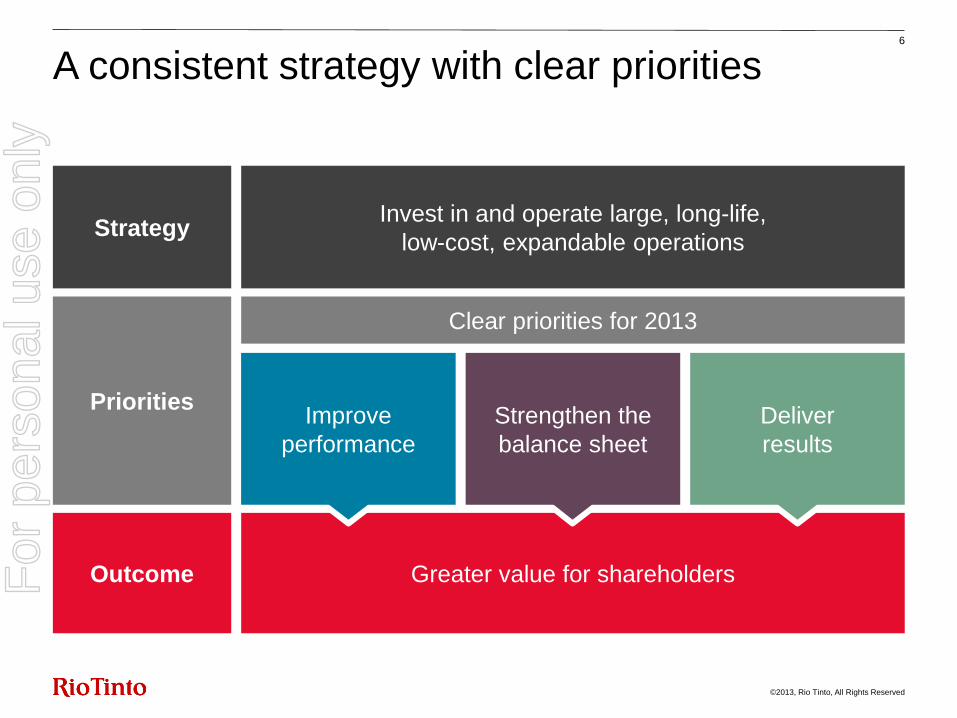
A consistent strategy with clear priorities 6
Greater value for shareholders
Invest in and operate large, long-life,
low-cost, expandable operations
Clear priorities for 2013
Improve
performance
Strengthen the
balance sheet
Deliver
results
Strategy
Priorities
Outcome For
per
sona
l use
onl
y

©2013, Rio Tinto, All Rights Reserved
Pursuing greater value for shareholders 7
Outcomes in H1 2013 Focus Areas Priority
• $977 million of operating cost reductions
• $483 million lower exploration and
evaluation spend
• Focused on productivity gains
• Capex reduced by 9%
• Strengthened investment review process
• Net debt increased by $2.9 billion
• Four major projects completed
• Pilbara 290 project approaching completion
• $1.9 billion of divestments announced
or completed to date
• Reduce costs
• Increase productivity
• Reduce sustaining capex
and working capital
• Enhance discipline
in capital allocation
• Reduce net debt over time
• Enhance systems & controls
• Complete approved projects
on time and on budget
• Realise value by divesting
non-core assets
Improve
Strengthen
Deliver For
per
sona
l use
onl
y

8 August 2013 Safety Strategy Performance Delivery
Chris Lynch Chief financial officer
For
per
sona
l use
onl
y

©2013, Rio Tinto, All Rights Reserved
0
1,000
2,000
3,000
4,000
5,000
6,000
H1 2012underlyingearnings
Absence of2012 one
offs
Price Exchangerates
Volumeincreases
Volumedecreases
Energy andinflation
Cash costreductions
Expl'nEval'n
Tax 2013 oneoffs & other
H1 2013underlyingearnings
4,229
5,152
9
Solid underlying earnings despite weaker commodity prices
Underlying earnings H1 2012 vs H1 2013 US$ million (post tax)
(1,284)
(131) (149)
(308)
655
(353)
(246)
211
359
323
Total cost reductions
of $978m post-tax
For
per
sona
l use
onl
y
©2013, Rio Tinto, All Rights Reserved
0
200
400
600
800
1000
Post-tax Pre-tax Post-tax Pre-tax
Cash operating cost Exploration & Evaluation
323
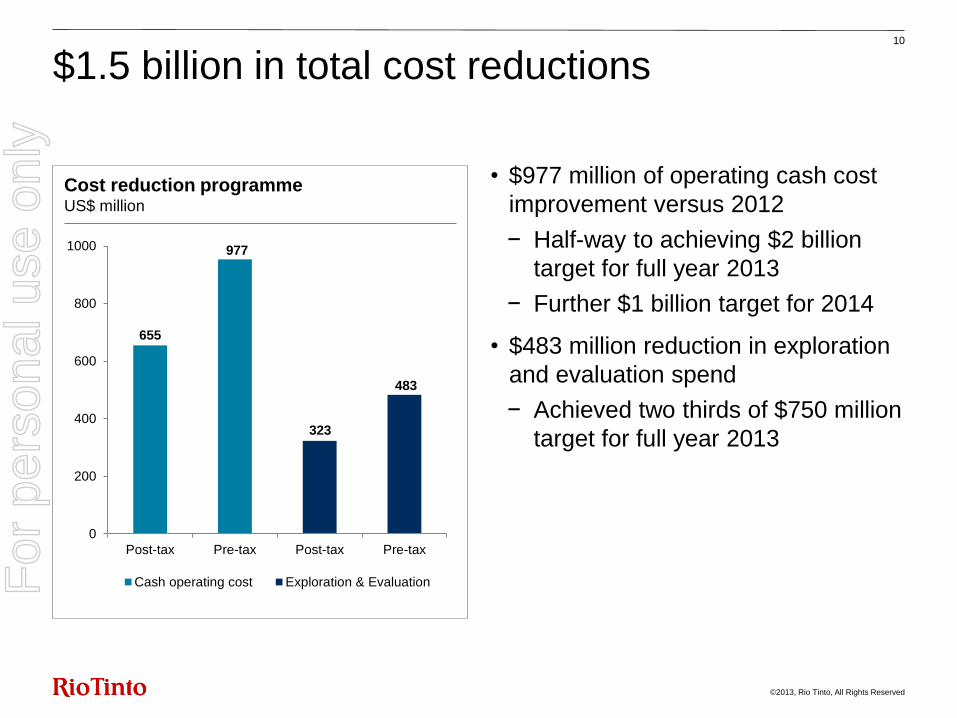
• $977 million of operating cash cost
improvement versus 2012
− Half-way to achieving $2 billion
target for full year 2013
− Further $1 billion target for 2014
• $483 million reduction in exploration
and evaluation spend
− Achieved two thirds of $750 million
target for full year 2013
Cost reduction programme US$ million
10
$1.5 billion in total cost reductions
655
483
977
For
per
sona
l use
onl
y

©2013, Rio Tinto, All Rights Reserved
Co
st
Redu
ction
Intia
tives
Effic
iency
Impro
vem
ents
Gra
de
One
Offs
Min
ing
Infla
tio
n
Weath
er
Ope
ratio
nal
Re
adin
ess/
Ra
mp u
p
Tota
l C
ash
Co
st
Impa
ct
• More than 1,500 separate initiatives
being implemented across the
business
• Major headcount reductions,
relocations and productivity gains
• Operational readiness and ramp-up
costs incurred on continued
expansion in the Pilbara
Pre tax operating cash cost variance US$ million
11
Operating cost targets are being achieved
Aluminium
Copper
Energy
Other PGs & central
977
For
per
sona
l use
onl
y

©2013, Rio Tinto, All Rights Reserved
• Strong project pipeline to supply
future reserves and resources
− 28 major projects ongoing
− across 10 commodities
− in 19 countries
• On track to achieve $750 million
reduction in exploration and
evaluation spend in 2013
• First half spend almost 50% lower
than 2012
• Reduced spend to be sustained in
2014 and beyond
Exploration and evaluation costs US$ million (pre tax)
12
Lower exploration and evaluation spend
$483 million
-
250
500
750
1,000
H1 2012 YoY saving H1 2013
Iron ore evaluation Copper evaluation
Aluminium evaluation Energy evaluation
D&M evaluation Central exploration
For
per
sona
l use
onl
y

©2013, Rio Tinto, All Rights Reserved
0
2
4
6
8
10
12
Inflows Outflows
• Strong cash flow from operations
reflecting cost reductions despite
weaker commodity prices
• $1.9 billion of divestments
announced or completed to date
− Net cash proceeds expected
largely in second half of 20131
• Reduced capex of $6.9 billion as
capital projects are completed
• Interim dividend increased in line
with 2012 full year 15% increase
H1 2013 cash flows US$ billion
* Net of disposals of property, plant and equipment of $31 million.
13
Increasing focus on cash flow
Cash flow from operations: $8.0bn
Other: $0.3bn
Increase in net debt $2.9bn
Capex: ($6.9bn)*
Net Tax: ($1.9bn)
Dividends: ($1.7bn)
Interest paid and Other ($0.7bn)
1 $1.9 billion represents the enterprise value of divestments announced or completed so far in 2013. The impact on the Group’s cash flow statement and net debt will reflect final cash proceeds, incorporating customary adjustments on closing and the treatment of any cash, debt and other liabilities transferred as part of the divestment.
For
per
sona
l use
onl
y

©2013, Rio Tinto, All Rights Reserved
0
5
10
15
20
2012A 2013F
• Capex peaked in 2012
• 2013 full year capex expected to be
20% below 2012
• Four major projects completed so far
this year
• Capital is only available to the
highest quality projects
Expected capital expenditure profile US$ billion
14
Capital expenditure is being prioritised on the highest quality projects
For
per
sona
l use
onl
y

©2013, Rio Tinto, All Rights Reserved
0
1
2
3
4
• Long term and smooth debt maturity
profile
− Weighted average maturity of
around eight years
− Weighted average cost of debt of
4%
− $3.0 billion of short-dated bonds
issued in the first half of 2013
• $7.3 billion of cash at half year end
Gross debt maturity profile at 30 June 2013 US$ billion
15
Prudent balance sheet management F
or p
erso
nal u
se o
nly

©2013, Rio Tinto, All Rights Reserved
• Focused on strengthening the
balance sheet
• Discipline in capital allocation
• Prioritisation of projects
• Improvement through lower cost,
sustaining capital and working capital
• Delivering results from our
divestment programme
• Sustainable growth in cash returns to
shareholders from our progressive
dividend policy
16
Pursuing greater value for shareholders
Annual capex
expected to
reduce by
20% in 2013
Interim
dividend
increased
by 15%
Average
borrowing
maturity of
8 years
Cash
returns to
shareholders
Prudent
balance
sheet
management
Disciplined
investment in
highest value
opportunities
Cash from operations
and divestment proceeds
For
per
sona
l use
onl
y

Sam Walsh Chief executive
8 August 2013 Safety Strategy Performance Delivery
For
per
sona
l use
onl
y
©2013, Rio Tinto, All Rights Reserved
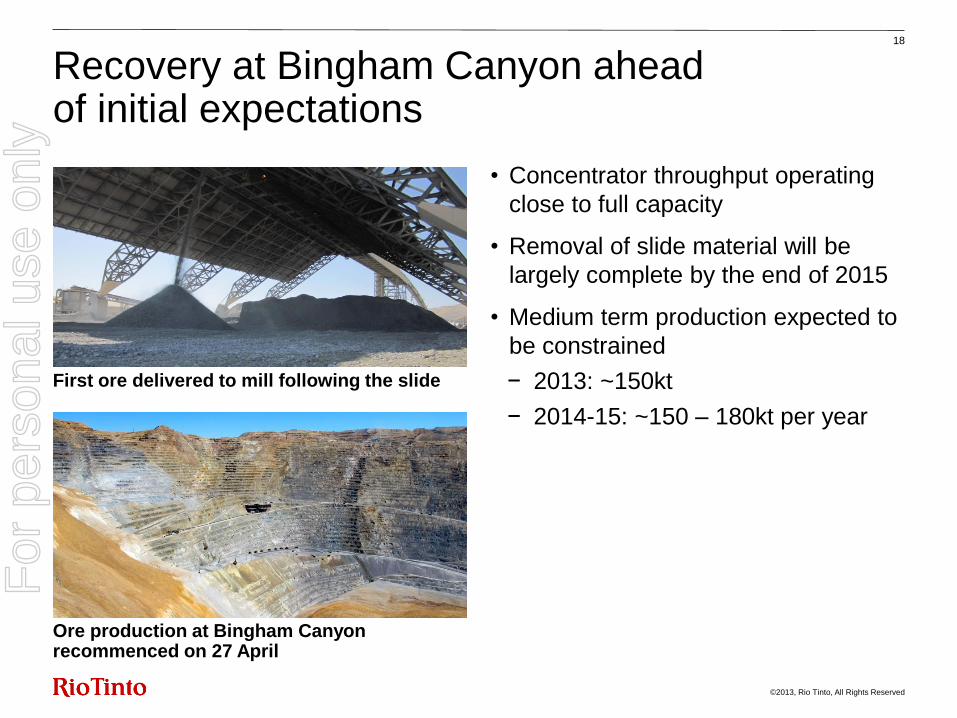
• Concentrator throughput operating
close to full capacity
• Removal of slide material will be
largely complete by the end of 2015
• Medium term production expected to
be constrained
− 2013: ~150kt
− 2014-15: ~150 – 180kt per year
Ore production at Bingham Canyon recommenced on 27 April
18
Recovery at Bingham Canyon ahead of initial expectations
First ore delivered to mill following the slide
For
per
sona
l use
onl
y

©2013, Rio Tinto, All Rights Reserved
• First shipment is a major milestone
• Ramp-up of open pit production is
making good progress
• Oyu Tolgoi concentrator consistently
operating at over 80% of capacity
• Expect to reach full capacity in the
second half of 2013
• Delaying underground development
work while discussions continue with
the Government of Mongolia on a
range of matters
19
Commenced concentrate shipments at Oyu Tolgoi
Shipment of first concentrate
Prime Minister receives sample of first concentrate from Chairman of Oyu Tolgoi
For
per
sona
l use
onl
y

©2013, Rio Tinto, All Rights Reserved
• Expansion programme on budget
and on time for accelerated ramp-up
• 55Mt/a shiploader now installed at
Cape Lambert
• Rail capacity infrastructure complete
• Major coastal infrastructure for
290Mt/a is fully constructed
• First tonnes during September 2013
• Steady commissioning and ramp-up
to reach 290Mt/a
• Multiple options for mine capacity
growth to 360Mt/a under evaluation
Cape Lambert car dumper
20
Pilbara iron ore 290Mt/a expansion is approaching completion
Shiploader in place
For
per
sona
l use
onl
y

©2013, Rio Tinto, All Rights Reserved
Pursuing greater value for shareholders 21
Strengthen
Improve
• Enhance discipline in capital allocation
• Reduce net debt over time
• Enhance systems and controls
• Reduce costs
• Increase productivity
• Reduce sustaining capex and working capital
Deliver • Complete approved projects on time and on budget
• Realise value by divesting non-core assets For
per
sona
l use
onl
y

8 August 2013 Safety Strategy Performance Delivery
2013 interim results Pursuing greater value for shareholders
For
per
sona
l use
onl
y

©2013, Rio Tinto, All Rights Reserved
4,229
1,720
114
(1,854)
(119)
(340) (310)
0
1,000
2,000
3,000
4,000
5,000
6,000
Underlyingearnings
Impairment Impacts ofconsol/disposal ofbusiness interests
Exchange diffs &gains on debt &
derivatives
Utah Copper -Manefay pit wall
slide
Other Net earnings
23
Reconciliation of underlying to net earnings
Underlying earnings H1 2013 to net earnings H1 2013 US$ million (post tax)
For
per
sona
l use
onl
y

©2013, Rio Tinto, All Rights Reserved
5,152
(1,284)
0
1,000
2,000
3,000
4,000
5,000
6,000
H1 2012underlyingearnings
Price
24
Underlying earnings impacted by lower commodity prices
Underlying earnings H1 2012 vs H1 2013 US$ million (post tax)
(510)
(208) (195)
(104) (94) (65)
(108)
Iron ore Met coal CopperThermal
Coal Aluminium Ind mins Other
For
per
sona
l use
onl
y

©2013, Rio Tinto, All Rights Reserved
5,152
(1,284)
211
359
0
1,000
2,000
3,000
4,000
5,000
6,000
H1 2012underlyingearnings
Price Exchangerates
Volumeincreases
118 117
69
20
35
Iron Ore Aluminium Copper Other
25
Growth in iron ore and recovery in aluminium
Underlying earnings H1 2012 vs H1 2013 US$ million (post tax)
1 Includes Pacific Aluminium volume increases of $20m
but excludes Other aluminium 2 Escondida, Northparkes & Utah Copper
Other
Coal
1 2
For
per
sona
l use
onl
y
©2013, Rio Tinto, All Rights Reserved
5,152
(1,284)
(131) 211
359
0
1,000
2,000
3,000
4,000
5,000
6,000
H1 2012underlyingearnings
Price Exchangerates
Volumeincreases
Volumedecreases
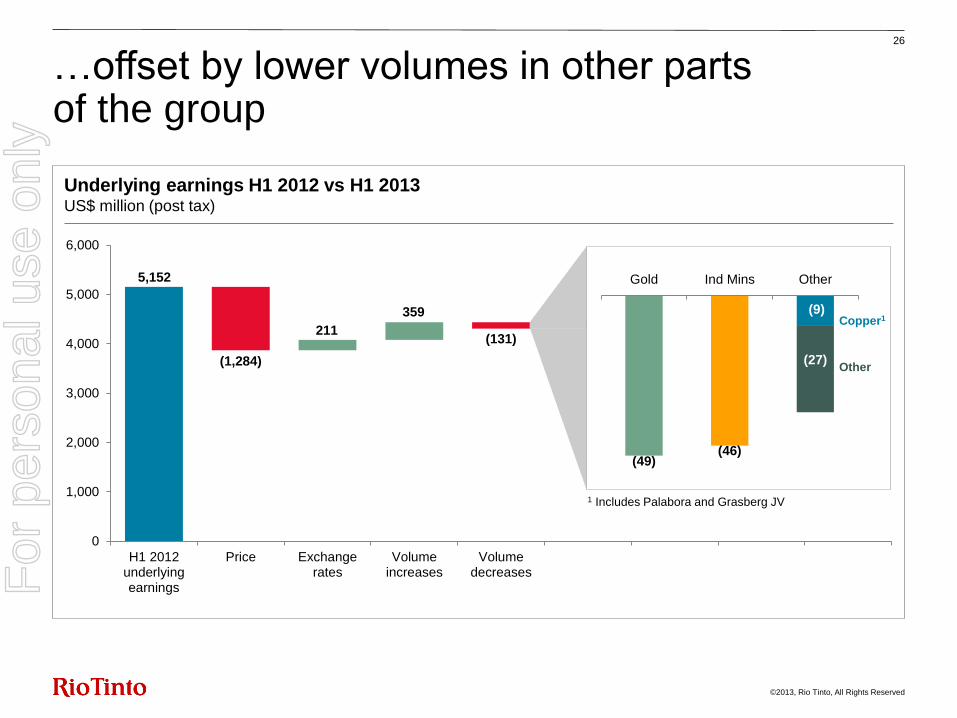
26
…offset by lower volumes in other parts of the group
Underlying earnings H1 2012 vs H1 2013 US$ million (post tax)
(9)
(49) (46)
(27)
Gold Ind Mins Other
1 Includes Palabora and Grasberg JV
Copper1
Other
For
per
sona
l use
onl
y

©2013, Rio Tinto, All Rights Reserved
27
Modelling earnings
Earnings sensitivity
2012 first half average price/
rate
2013 first half average price/
rate 10% change in 2013 average
Impact on 2013 full year underlying earnings ($m)
Copper 367c/lb 343c/lb +/-34c/lb 237
Aluminium $2,081/t $1,919/t +/-$192/t 582
Gold $1,652/oz $1,523/oz +/-$152/oz 34
Iron ore +/-10% 1,584
Coking coal +/-10% 44
Thermal coal +/-10% 73
A$ 103USc 102USc +/-US10.2c 1,052
C$ 99USc 99USc +/-US9.9c 314
For
per
sona
l use
onl
y

©2013, Rio Tinto, All Rights Reserved
Iron ore: achieving record sales in H1 2013 while delivering expansions on time and budget
• Record sales from the Pilbara in H1 2013, offset by lower prices, a one-off legacy royalty claim and utilisation of the MRRT deferred tax asset
• Expansion of Pilbara capacity to 290Mt/a remains on budget and on time to deliver first tonnes during September 2013. Completion of the Rail Capacity Expansion project achieved in H1 2013
• Iron Ore Company of Canada saleable production was higher in H1 2013 following the completion of the Concentrate Expansion Project (CEP1) and the first phase of CEP2, combined with operational improvements
• Pilbara iron ore revenues include $322 million of freight in H1 2013 ($355 million in H1 2012)
28
Underlying earnings H1 2012 vs H1 2013 US$ million (post tax)
4,990
4,273 (510) (43)
(369)
58 118 2 26 1
0
1,000
2,000
3,000
4,000
5,000
6,000
H1 2012 Price FX Vols CPI Energy Other Cash Expl'n Eval'n Other H1 2013
For
per
sona
l use
onl
y

©2013, Rio Tinto, All Rights Reserved
Copper: improved grades, and commencement of Oyu Tolgoi commercial production
• Mined copper production up 17 per cent following sustained recovery in grades at Kennecott Utah Copper
and Escondida
• Following the north wall slide at Bingham Canyon, mining of ore from lower sections of the pit recommenced
on 27 April and is being supplemented by stockpiles
• Recovery is advancing faster than expected
• Cash cost reductions achieved through fixed cost efficiencies and cost reduction initiatives
• $118 million of “one-off” impacts on Kennecott Utah Copper underlying earnings caused by the pit wall slide
relating to remediation works, stockpile haulage and copper concentrate purchases
• Oyu Tolgoi first shipment of copper concentrate to China on 9 July 2013 with the concentrator continuing to
ramp-up and now consistently operating at 80 per cent of design capacity
29
Underlying earnings H1 2012 vs H1 2013 US$ million (post tax)
530
348
(238) (5) (20) (188)
21 9
175 64
0
100
200
300
400
500
600
H1 2012 Price FX Vols CPI Energy Other Cash Expl'n Eval'n Other H1 2013
For
per
sona
l use
onl
y

©2013, Rio Tinto, All Rights Reserved
Rio Tinto Alcan:(1) volume and cost improvements offset pricing pressure
• Aluminium volume growth primarily relates to the resumption of production at the Alma smelter following a lock-out in January 2012 which lasted for six months, as well as continued ramp-up of Yarwun 2 and strong operational performance at Weipa
• 8 per cent lower LME price period on period partly offset by impact of a weaker Canadian dollar
• Lower caustic, coke & pitch prices
• Cost savings of $37 million across raw material spend in H1 2013 compared to H1 2012
30
Underlying earnings H1 2012 vs H1 2013 US$ million (post tax)
24
123
-150
-50
50
150
250
2012 Other Expl’n Eval’n Other Cash Energy CPI Vols Fx Price 2011
(20)
4 95
(22) (18)
97
43
(80)
H1 2012 H1 2013
(1) Excludes Pacific Aluminium and Other aluminium
For
per
sona
l use
onl
y

©2013, Rio Tinto, All Rights Reserved
Energy: lower prices partly offset by cost saving initiatives
• In H1 2012, Rio Tinto divested interests in Extract Resources and Kalahari Minerals, resulting in net gains on disposal of $249 million
• Lower prices for coal and uranium partially offset by cost reduction initiatives which continued to gain momentum throughout the first half
• Production of hard coking coal was 4 per cent lower offset by higher semi-soft and thermal coal production being 26 per cent higher than H1 2012
• Higher production at Clermont and Hunter Valley following brownfield expansions and ongoing work to improve efficiency and productivity of operations
• A low wall failure at the Hail Creek Mine on 21 July 2013 has resulted in a decrease to full year coking coal production guidance to 8 million tonnes (a 0.5 million tonne reduction to previous guidance)
31
Underlying earnings H1 2012 vs H1 2013 US$ million (post tax)
320
(52)
(249) 23
(321) (17) (10)
(84)
29 22
235
-300
-200
-100
-
100
200
300
400
H1 2012 Extract &Kalahari
Price FX Vols CPI Energy Other Cash Expl'nEval'n
Other H1 2013
For
per
sona
l use
onl
y

©2013, Rio Tinto, All Rights Reserved
Diamonds & Minerals: increased diamond volumes partially offset softer metallics markets
• Underlying earnings of $192 million are $203 million favourable to the loss incurred in 2012
• Excluding Simandou project costs, underlying earnings of $216 million are 3 per cent lower than 2012
• Softer markets for zircon, zirsil and metallics drive the price variance, partially offset by higher prices for diamonds and TiO2 slag
• Cash costs are negatively impacted by lower production volumes at Iron and Titanium as a result of fixed cost inefficiencies
• The earnings impact of exploration and evaluation costs is lower following the capitalisation of Simandou project costs from 1 April 2012. Total spend on the Simandou project was $214 million in H1 2013 ($364 million in H1 2012)
• Other earnings benefit from the group’s increased share of Richards Bay Minerals from September 2012
32
Underlying earnings H1 2012 vs H1 2013 US$ million (post tax)
(11)
192
(55) (23) (15) (12)
(31)
50
217
72
-150
-50
50
150
250
H1 2012 Price FX Vols CPI Energy Other Cash Expn'nEval'n
Other H1 2013
For
per
sona
l use
onl
y

©2013, Rio Tinto, All Rights Reserved
• Other operations comprises mainly Pacific and Other Aluminium(1) and Constellium
• The reduction in the net loss reflects cost savings at Pacific Aluminium and the divestment of other non-core aluminium assets which were loss-making in 2012
• Exploration costs decreased as a result of slowing in exploration projects, offset by the absence of divestment income in H1 2013
• Other includes variances due to higher insurance costs relating to the Gladstone Refinery and Kennecott Utah Copper mine landslide, various tax adjustments, increased pension costs, partly offset by headcount reductions and favourable tax
Other movements in underlying earnings 33
Underlying earnings impact
Volumes CPI Energy Cash
Costs Epl'n
Eval'n
Epl'n Eval'n
2012 disp
Non Cash
Interest, tax & other H1 2013 US$ million H1 2012
FX/ price
Intersegment – – – – – (4) – – – – (4)
Other operations (227) (71) 19 (10) 5 110 – – 13 94 (67)
Central exploration (net) (79) 1 – – – – 14 (11) – – (75)
Interest (84) – – – – – – – – (44) (128)
Other (311) – – – – 49 – – – (119) (381)
(1) Other Aluminium comprises Lynemouth, Sebree, Specialty Alumina, Alcan Cable and other non-operating upstream aluminium entities
For
per
sona
l use
onl
y

©2013, Rio Tinto, All Rights Reserved
Delivering divestments to streamline the portfolio
34
Divestments announced
or completed in 2013
US$m
Eagle 315
Palabora Mining Company 373
Altynalmas 235
Northparkes* 820
Other 151
Total to date 1,894
* Announced on 29 July 2013 but not yet completed. For
per
sona
l use
onl
y

©2013, Rio Tinto, All Rights Reserved
35
Provisional pricing
Open shipments
(million lbs)
Provisional pricing effect
(US$m)
30
June
2013
31
Dec
2012
H1
2013
H1
2012
Escondida 218 215 (66) –
Northparkes 35 33 (5) (7)
Grasberg JV/Other – 1 – –
253 249 (71) (7)
For
per
sona
l use
onl
y

©2013, Rio Tinto, All Rights Reserved
36
Earnings reconciliations
2013
Energy Resources of Australia US$m
Earnings per ERA press release (A$54m) (54)
Increased depreciation of closure asset (3)
Tax and unwinding of discount 1
Less: Minority interests (31.6%) 18
Other (10)
Underlying earnings as reported by Rio Tinto (48)
Palabora US$m
Earnings per Palabora press release (ZAR 778m) 85
Rio Tinto share of interest and FX gain/loss on net debt (net) (38)
Other 22
Tax effect on above items 4
Less: minority interest (42.3%) (31)
Underlying earnings as reported by Rio Tinto 42
For
per
sona
l use
onl
y