for personal use only - asx2018/03/06 · rex wood-ward chairman 23 february 2018 03 financial...
TRANSCRIPT

CAPRAL LIMITED2017 ANNUAL REPORT
ABN 78 004 213 692
For
per
sona
l use
onl
y

Our Vision is to be our customers first choice supplier of aluminium products and solutions.
We are committed to our Values:
CAPRAL’S VISION & VALUES
OWN ITBe accountable. Feel empowered.
Take pride in our work. Act boldly.
PLAY FAIRAct with integrity. Do the right thing. Work as a team.
Be honest and respectful.
BETTER EVERY DAYContinuous improvement.
Be innovative. Embrace change.
SAFETY FIRSTEveryone is responsible.
Injuries can be prevented.All jobs can be done safely.
CUSTOMER SUCCESSCustomers
determine our success. Committed to
service and quality. Be responsive to customer needs.
CAPRAL ANNUAL REPORT 2017
For
per
sona
l use
onl
y
01
CAPRAL’S VISION & VALUES
IFC Capral’s Vision & Values
02 Key Statistics
03 Chairman’s Report
04 Managing Director’s Operations and Financial Review
06 Board Of Directors
08 Sustainability Report
11 Directors’ Report
33 Auditor’s Independence Declaration
34 Consolidated Statement of Profit or Loss and Other Comprehensive Income
35 Consolidated Statement of Financial Position
36 Consolidated Statement of Cash Flows
37 Consolidated Statement of Changes In Equity
38 Notes to the Financial Statements
75 Directors’ Declaration
76 Independent Auditor’s Report
80 Member Details
83 Corporate Directory
CONTENTS
CAPRAL ANNUAL REPORT 2017
For
per
sona
l use
onl
y
02 KEY STATISTICS
KEY STATISTICS
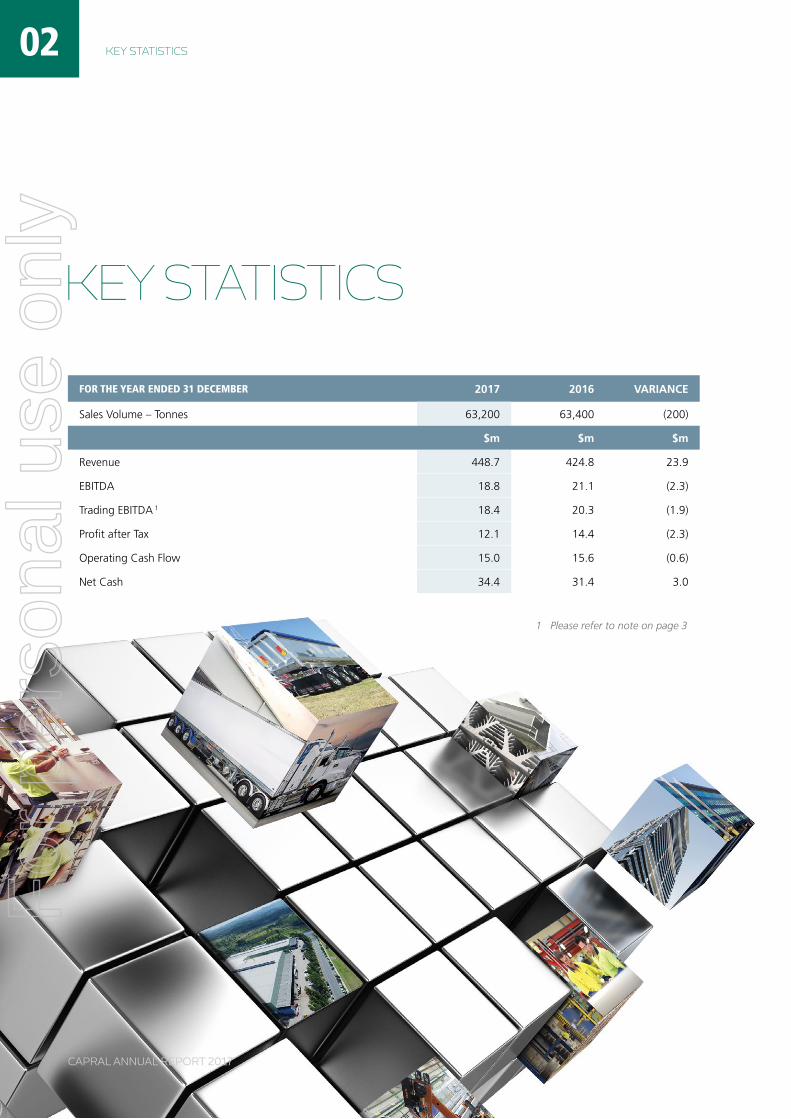
FOR THE YEAR ENDED 31 DECEMBER 2017 2016 VARIANCE
Sales Volume – Tonnes 63,200 63,400 (200)
$m $m $m
Revenue 448.7 424.8 23.9
EBITDA 18.8 21.1 (2.3)
Trading EBITDA 1 18.4 20.3 (1.9)
Profit after Tax 12.1 14.4 (2.3)
Operating Cash Flow 15.0 15.6 (0.6)
Net Cash 34.4 31.4 3.0
1 Please refer to note on page 3
CAPRAL ANNUAL REPORT 2017
For
per
sona
l use
onl
y

SAFETYThe Company’s focus on safety saw a decrease in its total reportable injury frequency rate to 13.1 in 2017 (2016: 15.5). Capral continues to prioritise safety improvement through education and monitoring of the workplace.
DIVIDENDSThe Company has declared a fully franked dividend of 1.25 cents per ordinary share (2016: 1.25 cents), which represents 51% payout of Net Profit After Tax, to be paid on 23 March 2018 in respect of the financial year ended 31 December 2017. The dividend will be paid to all shareholders on the register of members as at the Record Date of 2 March 2018.
I would like to thank all of Capral’s employees, its customers, suppliers and other providers as well as our shareholders, for their commitment and support during the past year. I would also like to record my appreciation to my co-directors for their endeavours and continuing support.
REX WOOD-WARD Chairman
23 February 2018
03
FINANCIAL RESULTSI am pleased to report that the Company recorded a Net Profit After Tax of $12.1 million for the year ended 31 December 2017 (2016: $14.4 million). At the operating level, Trading EBITDA* of $18.4 million was $1.9 million lower than the $20.3 million reported in 2016. This was still a commendable earnings result and consequently the Company has maintained the fully franked dividend at 1.25 cents to be paid in March 2018.
After a slow start in the first quarter, the remainder of 2017 saw the resumption of higher levels of activity, particularly in the commercial construction and industrial sectors, which resulted in the Company achieving a sales volume of 63,200 tonnes, virtually the same as the 63,400 tonnes sold in 2016. Revenues of $449 million were 5% higher than the $425 million reported in 2016 as a result of selling price increases due to substantially higher LME material input costs. Unfortunately, this increase in revenues did not translate into higher earnings than 2016 and this was primarily a result of being unable to fully recover the material increases in LME cost of aluminium billet which continued over the year under review.
Management delivered significant cost savings and efficiencies which helped offset the impact of inflation on costs. Positive net operating cash flows resulted in year-end net cash on hand increasing to $34.4 million after a dividend payment of $5.9 million during 2017. Capral has a strong balance sheet, supported by a $50.5 million facility with the ANZ that we announced in January last year.
The firm residential building market enjoyed in 2017 is anticipated to slow in 2018, although the larger portion of the decline is expected to come from high density dwelling commencements.
With our industry’s support, the Company will continue to monitor and pursue anti-dumping and circumvention cases to ensure that Australian manufacturers are competing in a fair market.
The major portion of the Company’s capital expenditure in 2018 will be directed at productivity improvements while Management’s commitment to reduce costs will continue to deliver additional efficiencies.
The Company is forecasting 2018 earnings at similar levels to 2017. I refer shareholders to the Outlook section of the Managing Director’s Operations and Financial Review.
CHAIRMAN’S REPORT
CHAIRMAN’S REPORT
* Trading EBITDA is the Statutory EBITDA adjusted for significant items that are material items of revenue or expense that are unrelated to the underlying performance of the business. Capral believes that Trading EBITDA provides a better understanding of its financial performance and allows for a more relevant comparison of financial performance between financial periods. These items are LME and Premium revaluation, and one-off costs relating to restructuring that are non-recurring in nature. Trading EBITDA is presented with reference to the Australian Securities and Investment Commission Regulatory Guide 230 “Disclosing non-IFRS financial information” issued in December 2011.
CAPRAL ANNUAL REPORT 2017
For
per
sona
l use
onl
y

CAPRAL ANNUAL REPORT 2017
on like volumes and sales revenue growth of 5.7%. Statutory EBITDA of $18.8 million (2016: $21.1 million) included a positive LME revaluation of $0.6 million. This result was however the second highest in the last 7 years.
Capral recorded a net profit after tax of $12.1 million (2016: $14.4 million) and this has enabled Capral to maintain its dividend. The net cash position, after a $5.9 million dividend payment in 2017, improved by $3.0 million. Working Capital increased by $3.4 million due to the higher LME and an increase in trade receivables. The balance sheet remains strong with net cash at $34.4 million. A two year $50 million facility was established with ANZ Bank in January 2017.
KEY INITIATIVES AND STRATEGIESIt is pleasing to see that the plans and strategies implemented over recent years have lowered Capral’s breakeven point and positioned Capral to benefit from improved market conditions and volumes. The key high level strategies remain consistent:
» Build on our strengths; product offer, scale, capability and our people.
» Optimise what we do; improve efficiencies in manufac-turing and supply chain.
» Grow for the future; innovative new products and services and capitalise on anti-dumping outcomes.
The focus in 2018 will be to execute our capital investment plans in new technology and automation to improve our long term competitive position, and implement further cost improvement initiatives to offset inflation and rising energy costs. We will also leverage our recent investment in system technology (CRM, E-Store, EDI) to improve our sales effectiveness.
During 2017 Capral established its Façade Solutions division to capitalise on the growing market for fully assembled windows and doors into the high density dwelling market. Imports have taken a large share of this market in recent years. Capral is working with key customers to develop a competitive offer of window and door systems that are fully compliant and tested to relevant Australian Standards.
OVERVIEW » Full Year result at top end of guidance range
» Volume at 63,200 tonne was on par with 2016
» Market conditions softer in residential but stronger in commercial and industrial
» Margins adversely impacted by significant rise in LME since Q4 2016
» Trading EBITDA¹ $18.4 million, down $1.9 million on 2016
» Strong balance sheet with net cash at $34.4 million
» Fully franked dividend of 1.25 cents per share, maintained at same level as last year
» Key capital investment projects in 2018 to improve long term competitive position.
FINANCIAL REVIEWDespite a slower start to 2017, Capral closed the year strongly with volumes finishing on par with last year. The residential market slowed on the back of lower commencements, down 6.1% to 219,0002 starts. However, this was offset by growth in commercial construction and key industrial markets (manufac-turing, transport and marine). Recent market share gains against imports were maintained as a result of an on-going vigilant approach against dumping and circumvention activities. Imports still however make up approximately one-third of the Australian extrusion market and they continue to suppress selling prices.
The largest input cost for Capral’s extrusion operation is aluminium billet which is based on the international LME price and premiums. LME rose from US$1,650/tonne at the start of Q4 2016 to finish 2017 at US$2,250/tonne. Just over half of Capral’s sales volume is on LME based contracts. The balance of customers are on fixed price or price list arrangements which require notice periods. The rising LME had a material negative impact on margins as we were unable to fully recover the higher LME price from customers in a timely manner. This was the principal factor in the lower earnings against last year.
As a result, Capral delivered a lower profit in 2017 than 2016, with a Trading EBITDA¹ of $18.4 million (2016: $20.3 million)
MANAGING DIRECTOR’S Operations and Financial Review
04 MANAGING DIRECTOR’S OPERATIONS AND FINANCIAL REVIEW
1 Refer to Trading EBITDA explanation in footnote to Chairman’s Report on page 3.
2 Source: BIS Oxford Economics November 2017 forecast (two quarters delayed).
For
per
sona
l use
onl
y
CAPRAL ANNUAL REPORT 2017
injury frequency rate fell to 13.1 (2016: 15.5) and lost time injury frequency rate fell to 2.1 (2016: 3.2). In 2018, Capral will target improved safety outcomes and further details are set out in the Sustainability Report (page 8).
RISKSCapral is exposed to a range of risks that could impact the achievement of Capral’s strategies and financial prospects, and further details are outlined in the Sustainability Report (pages 8–10).
OUTLOOKExternal forecasts for the residential market point to a slowdown in activity in 2018, with total commencements falling 7.3% to 203,3001. However the primary impact will be in high density dwellings. Demand for detached dwellings is forecast to remain relatively strong and this is the primary driver of Capral’s volume in this segment.
The non-residential market is forecast to grow modestly in 2018. The industrial market is expected to remain at current strong levels as infrastructure and defence projects continue to progress.
LME rose to 5 year highs at the end of 2017. LME is not easy to predict given the influence of a number of external factors. Whilst LME currently remains at high levels, forecasters are generally predicting a gradual fall in LME through 2018².
Overall market conditions for Capral’s aluminium extrusion and rolled products are forecast to slow marginally in 2018. Trading and Statutory EBITDA3 is forecast, absent any unforeseen events, to be broadly in line with 2017 and, on this basis, Capral would again be in a position to consider a franked dividend.
The focus in 2018 will be to continue our business improve-ment journey, enhance our service and quality, and deliver on our key capital projects. This will strengthen customer relationships, secure the future of our employees, and deliver returns to shareholders.
TONY DRAGICEVICH Managing Director
23 February 2018
Capral was appointed the exclusive distributor for Schüco, the leading European window systems supplier, in the second half of 2016. Schüco systems have superior acoustic and thermal performance ratings and are a good complement to Capral’s systems, enhancing our overall offer to the architectural market.
FAIR TRADEWith the support of the local extrusion industry, Capral continues to initiate cases against dumping and circumvention activities. During 2017 the following key actions were taken:
» A review of the 2015 dumping measures against China was undertaken by the Anti-Dumping Commission which resulted in generally higher measures against Chinese exporters.
» Measures were imposed by the Anti-Dumping Commission against some Malaysian exporters and all Vietnamese exporters.
» A new case was initiated against Thailand and two large Chinese exporters that are currently exempt from measures. A decision is expected in the first half of 2018.
» A case was initiated against the circumvention of measures through the transhipment of Chinese extrusions through third party countries. A decision is expected in the second half of 2018.
Imports continue to suppress selling prices and injure local industry. It is important that local manufacturing industries continue to fight for Fair Trade.
DIVIDENDWe are pleased to announce that Capral is in a position to pay a dividend again this year. Based on this year’s earnings, we have resolved to pay a final, fully franked dividend of 1.25 cents per share on 23 March 2018. This corresponds to a pay-out ratio of 51% of Capral’s net profit after tax, which is within our target pay-out range of 40% to 80%.
SAFETYCapral continues to prioritise the safety of its people with an on-going focus on safety training, systems and culture and remain committed to our Safety First Value: everyone is responsible, injuries can be prevented and all jobs can be done safety. During 2017 Capral retained its AS4801 (Safety Management) accreditation across the group and Capral retained its ISO9001 (Quality Management) and ISO14001 (Environmental Management) accreditation for all sites. The total reportable
05MANAGING DIRECTOR’S OPERATIONS AND FINANCIAL REVIEW
1 BIS Oxford Economics November 2017 forecast (two quarters delayed).
2 Source: Harbor Aluminium Intelligence Unit / ANZ – September 2017.
3 Refer to Trading EBITDA explanation in footnote to Chairman’s Report on page 3.
For
per
sona
l use
onl
y
BOARD OF DIRECTORS06
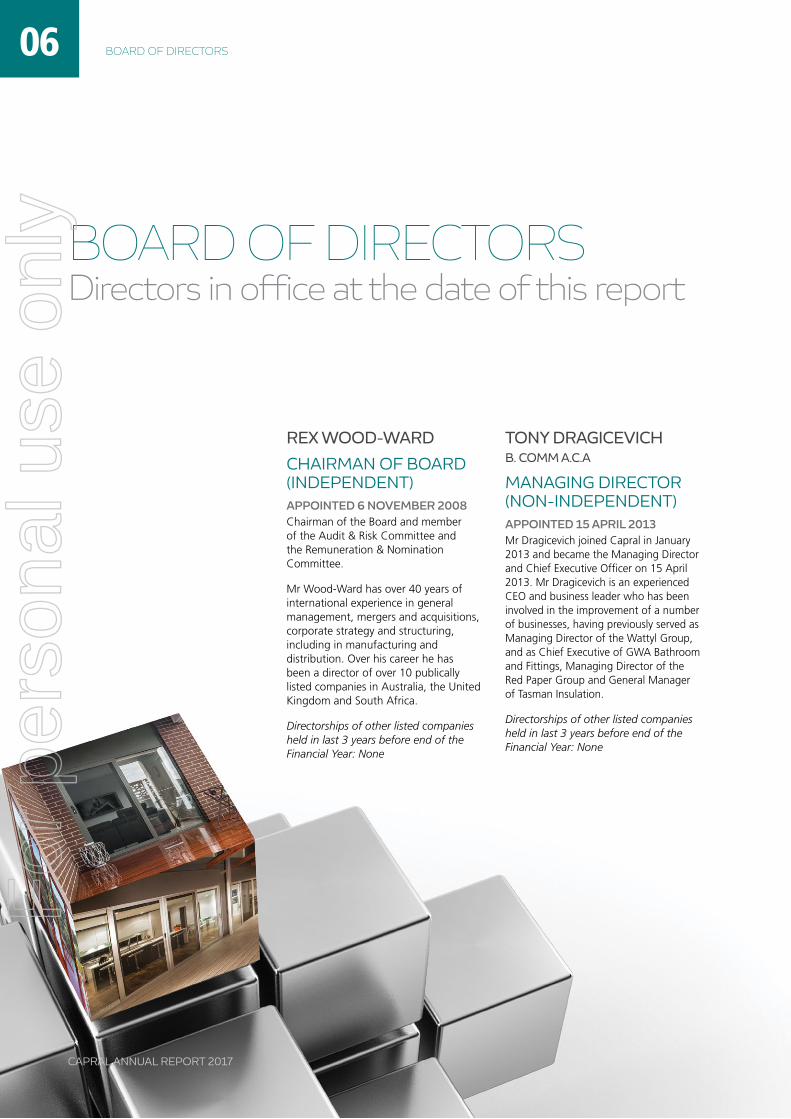
REX WOOD-WARD
CHAIRMAN OF BOARD (INDEPENDENT)APPOINTED 6 NOVEMBER 2008Chairman of the Board and member of the Audit & Risk Committee and the Remuneration & Nomination Committee.
Mr Wood-Ward has over 40 years of international experience in general management, mergers and acquisitions, corporate strategy and structuring, including in manufacturing and distribution. Over his career he has been a director of over 10 publically listed companies in Australia, the United Kingdom and South Africa.
Directorships of other listed companies held in last 3 years before end of the Financial Year: None
TONY DRAGICEVICH B. COMM A.C.A
MANAGING DIRECTOR (NON-INDEPENDENT)APPOINTED 15 APRIL 2013Mr Dragicevich joined Capral in January 2013 and became the Managing Director and Chief Executive Officer on 15 April 2013. Mr Dragicevich is an experienced CEO and business leader who has been involved in the improvement of a number of businesses, having previously served as Managing Director of the Wattyl Group, and as Chief Executive of GWA Bathroom and Fittings, Managing Director of the Red Paper Group and General Manager of Tasman Insulation.
Directorships of other listed companies held in last 3 years before end of the Financial Year: None
BOARD OF DIRECTORS Directors in office at the date of this report
CAPRAL ANNUAL REPORT 2017
For
per
sona
l use
onl
y

07BOARD OF DIRECTORS
PHILIP JOBE B. COMM
NON-EXECUTIVE DIRECTOR (INDEPENDENT)APPOINTED 24 APRIL 2009Member of the Audit & Risk Committee and the Remuneration & Nomination Committee.
Mr Jobe became a non-executive director following the expiry of his term as Capral’s Chief Executive Officer and Managing Director in April 2013. Before joining Capral, Mr Jobe was the Executive General Manager of Boral Limited’s Cement Division, including Managing Director of Blue Circle Southern Cement Pty Limited. This also encompassed the role of Chairman of the Cement Industry Federation. He also had executive responsibility for Boral’s expanding Asian construction materials businesses.
Mr Jobe was previously Managing Director of Stegbar Pty Limited from 1989 to 1994.
Directorships of other listed companies held in last 3 years before end of the Financial Year: None
IAN BLAIR M.MGT, FCA
NON-EXECUTIVE DIRECTOR (INDEPENDENT)APPOINTED 23 MAY 2006Chairman of the Audit & Risk Committee and member of the Remuneration & Nomination Committee.
Mr Blair is a Chartered Accountant and Company Director. He spent almost 20 years as a partner in major accounting firm Deloitte, and retired after 5 years as CEO of that firm. Mr Blair is currently Chairman of Bisley & Co Pty Ltd.
Directorships of other listed companies held in last 3 years before end of the Financial Year: None
GRAEME PETTIGREW FIPA, FAIM, FAICD
NON-EXECUTIVE DIRECTOR (INDEPENDENT)APPOINTED 18 JUNE 2010Chairman of the Remuneration & Nomination Committee and member of the Audit & Risk Committee.
Mr Pettigrew has held chief executive roles at CSR Building Products Pty Ltd and Chubb Australia Ltd and he is currently a non-executive director of Adelaide Brighton Ltd. He has relevant experience in the construction and building materials industry, as well as manufacturing and distribution businesses.
Directorships of other listed companies held in last 3 years before end of the Financial Year:
» Non-executive director of Adelaide Brighton Ltd: 27 August 2004 to Current.
CAPRAL ANNUAL REPORT 2017
For
per
sona
l use
onl
y
» Retained AS4801 (Safety Management) accreditation across the group and Capral retained its ISO9001 (Quality Management) and ISO14001 (Environmental Management) accreditation.
» The number of key lead indicator measures improved overall as against 2016.
» Workers compensation is being well managed, with better than industry rates and reducing premium.
» A number of safety improvement programs and reviews were conducted.
» Perception surveys were completed and demonstrated overall improvements in safety culture and leadership. Identified gaps will be addressed as part of the 2018 plans.
» Manufacturing sites that achieved LTI free milestones: Canning Vale (8 years), Austex Dies (6 years), and Campbellfield (2 years).
» Distribution sites that remained LTI/MTI free: Hobart (21 years), Rockdale (19 years), Springwood, Cardiff and Kunda Park (12 years), Laverton (11 years), Cairns (10 years), Wangara and Darwin (8 years), Lynbrook (6 years), Welshpool (5 years) and Gold Coast (4 years).
In 2017, Capral undertook various activities around our Safety First Value, and focussed on specific site safety plans and best practice measures. This included addressing key issues identified by the annual perception surveys. Capral’s Letter of Assurance Audit program and High Risk Group Reviews were conducted, and health and wellbeing and other training programs were
SCOPECapral’s operations are affected by economic, environmental and social sustainability risks. These risks are managed within the internal controls framework described in Capral’s Corporate Governance Statement (available on Capral’s website). This report should be read with other sections of the Annual Report. The exposure to economic factors is outlined below and further information can be found in the Managing Director’s Operations and Financial Review. Capral is committed to continuous improvements including programs that focus in the areas below:
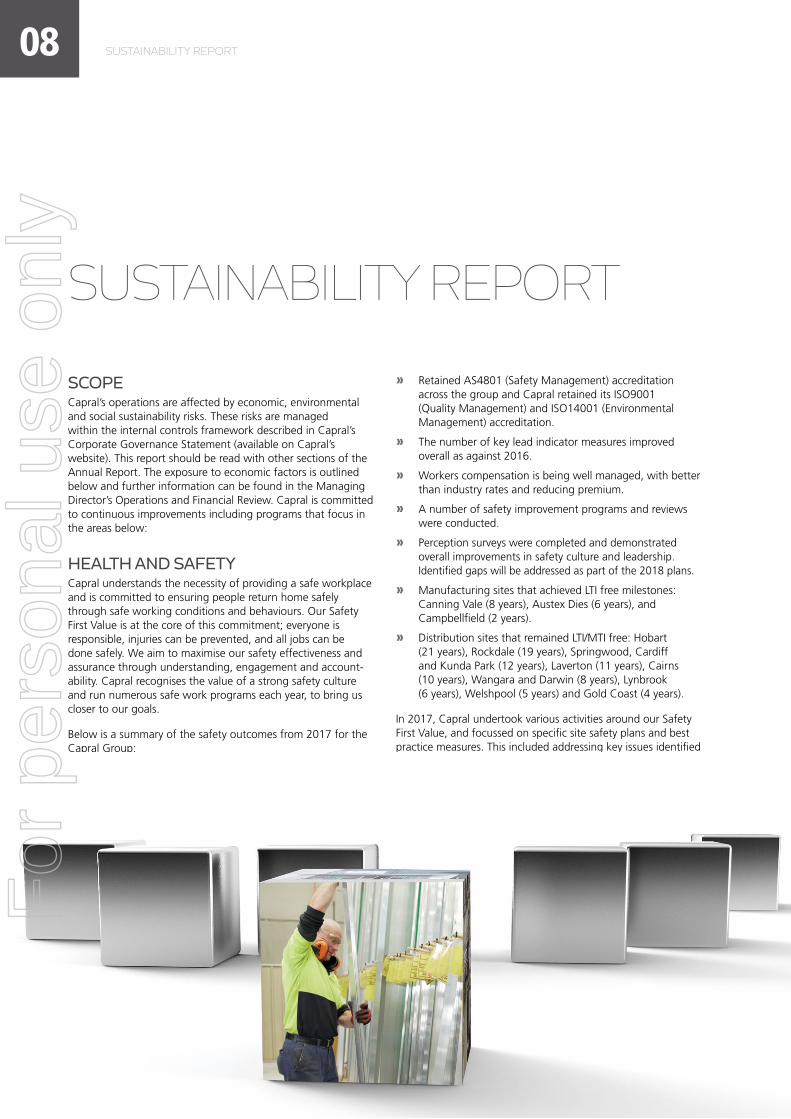
HEALTH AND SAFETYCapral understands the necessity of providing a safe workplace and is committed to ensuring people return home safely through safe working conditions and behaviours. Our Safety First Value is at the core of this commitment; everyone is responsible, injuries can be prevented, and all jobs can be done safely. We aim to maximise our safety effectiveness and assurance through understanding, engagement and account-ability. Capral recognises the value of a strong safety culture and run numerous safe work programs each year, to bring us closer to our goals.
Below is a summary of the safety outcomes from 2017 for the Capral Group:
» There were 25 reportable injuries, 4 less than 2016. The LTI/MTI Frequency Rate decreased to 13.1.
SUSTAINABILITY REPORT
SUSTAINABILITY REPORT08
CAPRAL ANNUAL REPORT 2017
For
per
sona
l use
onl
y

audits were carried out to identify initiatives to reduce our energy footprint and provide cost efficiencies. As a result, a number of initiatives were implemented across the business including LED lighting substitution across our operations, implementation of power factor correction and participation in demand reduction programmes with the National Electricity market and other state wide energy providers. These have reduced our emissions profile. Capral also continues to be committed to meeting its obligations under the National Greenhouse Energy Reporting Act.
In addition, Capral continues to act responsibly in minimising the environmental impacts of our operations. Our commitment to recycling, elimination of waste materials, and improved waste disposal strategies were demonstrated through the use of recyclable plastic cleats and replacing timber for major customers across all manufacturing locations. Furthermore, increased scrap density through our new aluminium scrap bailing operation at Penrith has enhanced scrap management efficiencies. Capral monitors compliance with legislative requirements and reviews industry best practice, to promote improved environmental performance. Our plant, equipment and processes are assessed regularly and measures are taken where improvements can be achieved. A continued focus remains on the disposal of waste; we recycle where possible.
All environmental reporting obligations were met as required in 2017 and Capral retained its ISO14001 (International Environmental Management) accreditation for all operations.
COMMUNITY INTERACTIONCapral’s commitment to the communities where its facilities are located included the following initiatives in 2017:
» R U OK Day: Capral sites participated in this important event in September. To further support awareness and early intervention of Mental Health issues, Capral provided Mental Health Training to managers with further training to follow in 2018.
» White Ribbon Day: Capral sites again participated in events in November. Capral sponsored the inaugural Allison Baden-Clay Foundation Strive to be Kind luncheon in Brisbane in July 2017. Funds raised from the luncheon fund education programs for the prevention of domestic and family violence.
» Capral’s sites undertook numerous fundraising activities for charities such as Children’s Cancer, Australian Breast Cancer Foundation, Lions Club (for special needs children), Share the Dignity, Rosie’s, City Hope Church, Townsville Orchid Society, Hope Street Youth and Family Services, Disability Support and Recreation; and Tweed/Coolangatta Surf club.
SUSTAINABILITY REPORT 09
continued. Capral implemented a transition plan to align our practices to the new requirements for the Environmental and Quality Management standards during 2018.
PEOPLEThe Capral Group employs more than 1,000 people, with over 900 permanent staff at 25 locations in Australia. Capral has a stable workforce and around half of our employees are covered by enterprise agreements. There are no material workplace issues.
Our Values underpin how our business is conducted and include:
» Safety First: Everyone is responsible; Injuries can be prevented; All jobs can be done safely
» Customer Success: Customers determine our success; Committed to service and quality; Be responsive to customer needs
» Play Fair: Act with integrity; Do the right thing; Work as a team; Be honest and respectful
» Better Every Day: Continuous improvement; Be innova-tive; Embrace change
» Own It: Be accountable; Feel empowered; Take pride in our work; Act boldly.
Our Code of Conduct provides a set of guiding principles and our people receive regular Code of Conduct training.
Capral respects the benefits arising from workplace diversity. We strive to promote an environment conducive to the appointment of well qualified people so that there is appro-priate diversity to maximise the achievement of our goals. Further details of Capral’s objectives are contained in Capral’s Corporate Governance Statement and Diversity Policy, both available on Capral’s website.
Capral continues to demonstrate a training commitment to its employees and the local community. This includes the provision of Certificate III Competitive Systems Training to production and warehouse workers at its Bremer Park site and Certificate IV and Diploma training in Competitive Systems and Processes at its Canning Vale site.
ENVIRONMENT Capral has a relatively modest carbon footprint and is not included in the top 500 site emitters. Our commitment on environmental impacts continued to be a key focus through 2017.
Our main emissions come from natural gas and electricity. Electricity consumption remained a critical focal point. Energy
CAPRAL ANNUAL REPORT 2017
For
per
sona
l use
onl
y
CAPRAL ANNUAL REPORT 2017
» Anti-dumping: To the extent duties are reduced or removed in relation to imports from China, this could have an adverse impact on Capral volume and margins.
» Residential and Commercial markets: Capral is exposed to the cyclical nature of both residential and commercial building activity which is currently at or near the top of the cycle. As many of Capral’s costs are fixed, it may not be easy to reduce its costs relative to the economic downturn and therefore any material and/or extended downturn may negatively affect Capral.
» Industrial markets: Capral is also exposed to industrial markets driven by transport, marine and the general manufacturing sectors. These markets have been relatively soft in recent times.
» Economic downturn: An economic downturn, like the global financial crisis in 2008, could have a material adverse affect on the demand for Capral’s products and financial performance.
» Carry forward of historical tax losses: a change in business may cause Capral to lose the future benefit of some (but not all) of its historical tax losses.
» Other: other risks include an inability to maintain a competitive cost base, a major operational failure or disruption to Capral’s facilities, and regulatory compliance and change.
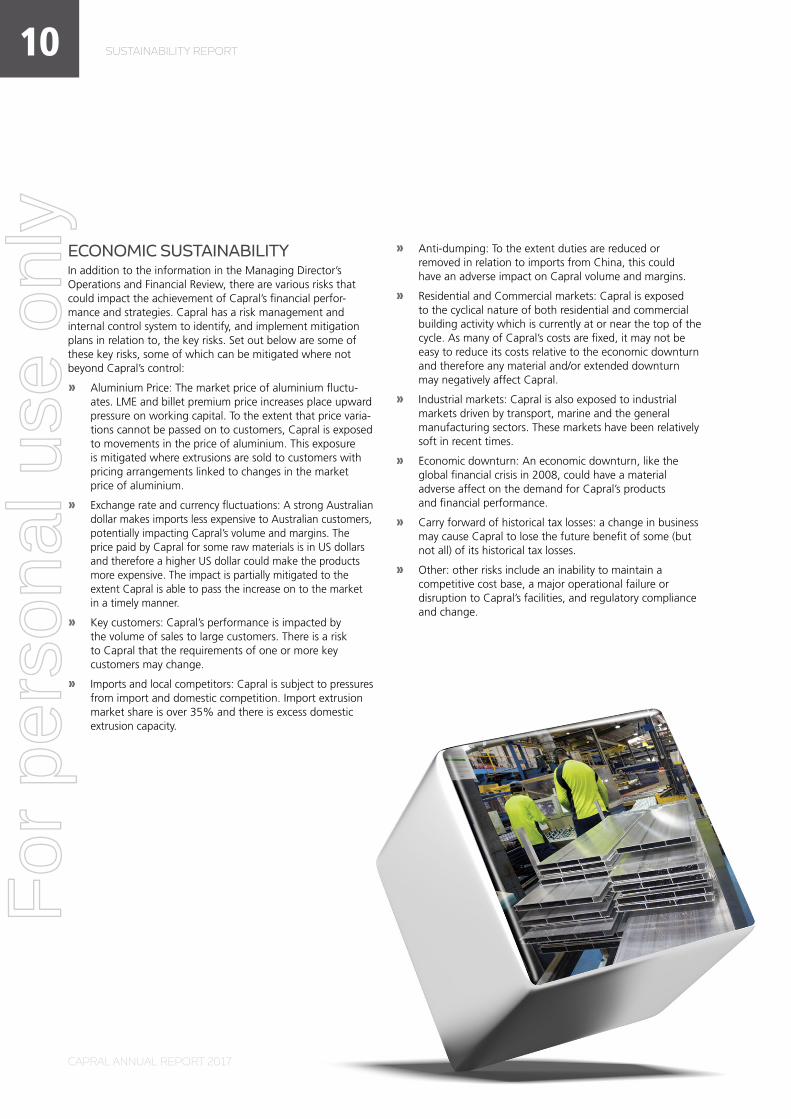
ECONOMIC SUSTAINABILITYIn addition to the information in the Managing Director’s Operations and Financial Review, there are various risks that could impact the achievement of Capral’s financial perfor-mance and strategies. Capral has a risk management and internal control system to identify, and implement mitigation plans in relation to, the key risks. Set out below are some of these key risks, some of which can be mitigated where not beyond Capral’s control:
» Aluminium Price: The market price of aluminium fluctu-ates. LME and billet premium price increases place upward pressure on working capital. To the extent that price varia-tions cannot be passed on to customers, Capral is exposed to movements in the price of aluminium. This exposure is mitigated where extrusions are sold to customers with pricing arrangements linked to changes in the market price of aluminium.
» Exchange rate and currency fluctuations: A strong Australian dollar makes imports less expensive to Australian customers, potentially impacting Capral’s volume and margins. The price paid by Capral for some raw materials is in US dollars and therefore a higher US dollar could make the products more expensive. The impact is partially mitigated to the extent Capral is able to pass the increase on to the market in a timely manner.
» Key customers: Capral’s performance is impacted by the volume of sales to large customers. There is a risk to Capral that the requirements of one or more key customers may change.
» Imports and local competitors: Capral is subject to pressures from import and domestic competition. Import extrusion market share is over 35% and there is excess domestic extrusion capacity.
SUSTAINABILITY REPORT10F
or p
erso
nal u
se o
nly

CAPRAL ANNUAL REPORT 2017
REVIEW OF OPERATIONS AND FINANCIAL POSITIONA review of operations and financial position of the consolidated entity are referred to in the Managing Director’s Operations and Financial Review on pages 4 and 5.
SIGNIFICANT CHANGES IN THE STATE OF AFFAIRSThere were no significant changes in the state of affairs of the consolidated entity during the year.
MATTERS SUBSEQUENT TO THE END OF THE FINANCIAL YEARNo matter or circumstance has arisen since the end of the Financial Year that has significantly affected, or may signifi-cantly affect the consolidated entity’s operations, the results of those operations or the consolidated entity’s state of affairs in future financial years.
LIKELY DEVELOPMENTS, BUSINESS STRATEGIES, PROSPECTS AND RISKSInformation on likely developments, business strategies, prospects and risks are detailed in the Managing Director’s Operations and Financial Review on pages 4 and 5 and the Sustainability Report on pages 8–10. Whilst Capral continues to meet its continuous disclosure obligations, this report omits information where it would be likely to result in unreason-able prejudice to Capral. This includes information that is commercially sensitive, is confidential or could provide a third party with a commercial advantage (such as internal budgets and forecasts).
OTHER INFORMATION FOR MEMBERS TO MAKE AN INFORMED ASSESSMENTOther than information set out in this report, there is no information that members would reasonably require to make an informed assessment of the operations, financial position, business strategies and prospects for future financial years of the consolidated entity.
Your directors present their report on the consolidated entity consisting of Capral Limited (Capral) and the entities it controlled at the end of, or during, the financial year ended 31 December 2017 (Financial Year).
DIRECTORSThe following persons were directors of Capral during the Financial Year and up to the date of this report:
NAME PERIOD OFFICE HELD
R. L. Wood-Ward 6 November 2008 – Date of this report
A. M. Dragicevich 15 April 2013 – Date of this report
P. J. Jobe 24 April 2009 – Date of this report
I. B. Blair 23 May 2006 – Date of this report
G. F. Pettigrew 18 June 2010 – Date of this report
Details of directors, their qualifications, experience, special responsibilities (including committee memberships) and directorships of other listed companies held in the last three years before end of the Financial Year are set out on pages 6 and 7.
PRINCIPAL ACTIVITIESDuring the Financial Year, the principal continuing activities of the consolidated entity consisted of the manufacturing, marketing and distribution of fabricated and semi-fabricated aluminium related products.
DIVIDENDSThe Directors recommend that a final dividend of 1.25 cents per ordinary share (fully franked) be declared. The record date for the final ordinary dividend will be 2 March 2018, with payment being made on 23 March 2018. A final dividend of 1.25 cents per ordinary share (fully franked) was paid in March 2017; no other dividends or distributions have been paid during the Financial Year.
11
DIRECTORS’ REPORT
DIRECTORS’ REPORTF
or p
erso
nal u
se o
nly

12 DIRECTORS’ REPORT
COMPANY SECRETARYMR R ROLFE – GENERAL COUNSEL & COMPANY SECRETARY, LLB (HON) (UNIVERSITY OF LEICESTER, UK)
Mr Rolfe was appointed as General Counsel of Capral on 12 June 2006 and to the position of Company Secretary on 23 June 2006.
Mr Rolfe was admitted as a Solicitor of the Supreme Court of England and Wales in 1998 and New South Wales in 2002. Prior to joining Capral, Mr Rolfe was a senior corporate lawyer at Qantas Airways Limited from July 2002.
DIRECTORS’ MEETINGSThe numbers of directors’ meetings (including meetings of committees) held, and the number of meetings attended, by each director during the Financial Year, are as follows:
DIRECTOR
BOARD AUDIT & RISK COMMITTEEREMUNERATION &
NOMINATION COMMITTEE
HELD ATTENDED HELD ATTENDED HELD ATTENDED
R.L. Wood-Ward 8 8 3 3 2 2
A.M. Dragicevich 8 8 3 31 2 21
P.J. Jobe 8 8 3 3 2 2
I.B. Blair 8 8 3 3 2 2
G.F. Pettigrew 8 8 3 3 2 2
1 Attended meeting(s) in an ex-officio capacity
CAPRAL ANNUAL REPORT 2017
For
per
sona
l use
onl
y

CAPRAL ANNUAL REPORT 2017
13DIRECTORS’ REPORT
DIRECTORS’ INTERESTS AND BENEFITS
ORDINARY SHARESDetails of holdings of ordinary shares in Capral for the directors (including former directors who held office during the Financial Year) at the beginning and end of the Financial Year and at the date of this report are as follows:
ORDINARY SHARES FULLY PAID IN THE COMPANY
NAME POSITIONBALANCE AT
1.1.2017BALANCE AT 31.12.2017
BALANCE AT DATE OF THIS REPORT
R.L .Wood-Ward Director and Chairman of the Board – – –
A.M. Dragicevich Managing Director 6,000,000 6,250,0001 6,250,000
P.J. Jobe Director 7,100,500 7,100,500 7,100,500
I.B. Blair Director 227,348 227,348 227,348
G.F. Pettigrew Director – – –
1 Acquired 250,000 shares on market
In addition to the interests shown above, indirect interests in Capral shares held by the Managing Director, Mr. Dragicevich, are as follows:
MR A.M. DRAGICEVICH NATURE OF OTHER INTERESTS
BALANCE AT 1.1.2017
BALANCE AT 31.12.2017
BALANCE AT DATE OF THIS REPORT
Performance rights 4,583,250 6,583,2501 6,583,250
1 2.0 million performance rights were issued on 11 May 2017
UNISSUED SHARES OR INTERESTS UNDER OPTIONAt the date of this report, there are 18,458,123 (2016: 15,373,118) unissued shares or interests under option. Refer to sections 1 to 3 of the Remuneration Report.
For
per
sona
l use
onl
y

CAPRAL ANNUAL REPORT 2017
The Remuneration & Nomination Committee may seek independent advice as appropriate in setting the structure and levels of remuneration based on the principle that the elements of remuneration should be set at an appropriate level having regard to market practice for roles of similar scope and skill. No remuneration recommendations have been made by remunera-tion consultants in relation to the Financial Year. Capral has reviewed generally available market information regarding remuneration, as outlined further below.
(C) PERFORMANCE PLANNING AND REVIEW
Capral has a Performance Planning and Review (PPR) process to evaluate and discuss performance and development plans at least annually with salaried employees. This PPR process covers:
» An agreement of objectives for the year ahead and the setting of key performance measures against which the achievement of those objectives will be assessed. These are set by reference to financial targets and key business strategies.
» A review of performance against the previously agreed objectives for the period under review.
» Employee comment and feedback.
» Short and long term training and development needs and career aspirations.
The PPR process ensures that there is better understanding of Capral’s objectives thereby increasing the likelihood of their achievement. It also enables managers to evaluate and develop employee skills and performance and identify future develop-ment needs.
(D) NON-EXECUTIVE DIRECTORSThe structure of Capral’s non-executive director remuneration is distinct from that applicable to the Managing Director and other senior executives.
Remuneration of non-executive directors is established at a level that enables Capral to attract and retain high quality directors at a reasonable cost. Remuneration of non-executive directors and their terms of office are governed by Capral’s constitution and not by contract.
This report sets out Capral’s remuneration of its directors and executives. It also details the actual remuneration of its key management personnel (including the directors) during the Financial Year.
SECTION 1: THE REMUNERATION FRAMEWORK
(A) KEY PRINCIPLESCapral’s remuneration framework and practices are based on the principles that remuneration is performance driven, aligns with shareholder interests, provides market competitive remuneration that attracts qualified and experienced candi-dates, and retains and motivates employees.
The variable components of remuneration (short and long term) are driven by challenging targets focused on both external and internal measures of financial and non-financial performance. Details of performances measures are set out in sections 1(g) and 1(h) below. Executive remuneration is aligned with shareholder interests via an emphasis on variable (incentive) remuneration, the award of which is linked to performance benchmarks that support business strategies and future success. A significant proportion of executive remunera-tion is at-risk. Details of the link between performance and remuneration is set out in section 4.
(B) ROLE OF REMUNERATION & NOMINATION COMMITTEE
The Remuneration & Nomination Committee is responsible for reviewing and making recommendations to the Board of Directors (the Board) on remuneration policies for Capral including, in particular, those governing the directors (including the Managing Director) and executive managers. The Committee operates in accordance with its Charter.
Remuneration of the Managing Director and certain executive managers is reviewed at least annually by the Remuneration & Nomination Committee and recommendations are put to the Board for its approval. Short and long term incentives are linked to performance criteria. The Board can exercise its discretion in relation to approving bonuses and incen-tives. Changes must be justified by reference to measurable performance criteria and having regard to Capral’s overall financial performance and other special circumstances.
REMUNERATION REPORT (Audited)
14 DIRECTORS’ REPORTF
or p
erso
nal u
se o
nly

CAPRAL ANNUAL REPORT 2017
Fixed remuneration of executives is generally targeted at market median.
The fixed remuneration of the Managing Director was deter-mined by the Board in 2012 having regard to other ASX listed companies in building product related industries, his particular skills and previous remuneration, experience and capability to lead Capral in delivering financial targets and executing key business strategies. It represented a significant reduction to the previous Managing Director’s remuneration. It forms part of his executive employment contract and is subject to annual review. His fixed remuneration has not been increased since joining Capral.
The Board has reviewed generally available market informa-tion regarding fixed remuneration of the key management personnel for 14 ASX listed companies in either building product related industries or with comparable revenues and market capitalisation. The fixed remuneration of Capral’s key management personnel is generally in line with this group.
The fixed remuneration of Capral’s other key management personnel increased by 2.5% on 1 March 2017.
(G) SHORT TERM INCENTIVESCapral’s short term incentive schemes are designed to encourage participants to assist Capral in achieving continuous improvement by aligning their interests with those of Capral and its stakeholders and rewarding them when key perfor-mance measures are achieved.
For the Financial Year, there were 3 short term incentive programs:
(1) Short Term Incentive Plan (STIP): the Managing Director and senior employees have the opportunity to earn a cash incentive, based on a specified percentage of TEC dependent on each individual’s level of responsibility. The actual incentive earned is based on the achievement of financial and non-financial objectives.
(2) Bonus scheme: other salaried employees can earn fixed payments, as approved by the Managing Director, for achieving key performance measures set by their managers and outlined in the employee’s individual PPR.
(3) Sales incentives: Sales employees participate in quarterly sales incentive programs in relation to revenue, gross margin and debtor days targets.
STIP is weighted 70% to financial objectives and 30% non-financial objectives. A summary of STIP is set out in the table below:
Remuneration of non-executive directors is allocated out of the pool of funds, the limit of which is approved by shareholders in general meeting; the fee pool limit is currently $500,000 per annum. Each non-executive director is entitled to the payment of an annual fee in cash and superannuation contributions for their services. Additional fees are not paid for sitting on Board committees, however the extra responsibility of the Chairman of the Board and committees is recognised by the payment of a higher fee. The fees for the non-executive directors are regularly reviewed having regard to generally available market information and are currently considered to be similar to those paid at comparable listed companies. Non-executive directors do not receive any shares, options or other securities as part of their remuneration however they are eligible to participate in Capral’s equity incentive plans, although none currently participate. There are no schemes for retirement benefits (other than statutory superannuation payments).
(E) SENIOR MANAGEMENT REMUNERATION
The remuneration policy for the Managing Director and executives seeks to attract and retain people with the required capabilities to lead Capral in the achievement of business objectives and focus on delivering financial and non-financial measures.
Remuneration is reviewed annually and approved changes applied from 1 March.
The Remuneration & Nomination Committee reviews the remu-neration arrangements of the Managing Director, his direct reports and certain other executive managers. The Managing Director reviews the remuneration arrangements of the other members of senior management, based on the recommenda-tions of his direct reports.
For the Managing Director and other senior management, remuneration consists of a fixed annual salary and superan-nuation (refer to section 1(f) below) plus at-risk components comprised of a short term incentive plan (STIP) (refer to section 1(g) below) and a long term incentive plan (LTIP) (refer to section 1(h) below).
The proportions of fixed and at-risk remuneration are established for the Managing Director and other senior management relative to their position in Capral. As a general guide, at-risk remuneration is 50% for the Managing Director, 25% for executive management and 10%-20% for other senior managers, for the achievement of ‘target’ goals.
(F) FIXED REMUNERATIONThe level of the total employment cost (being base salary plus superannuation) (TEC) is determined having regard to job responsibilities, skills, experience and performance. Salaries are reviewed annually, with any changes applied from 1 March.
15DIRECTORS’ REPORTF
or p
erso
nal u
se o
nly

CAPRAL ANNUAL REPORT 2017
Frequency Awards determined annually with payment made in the March following the end of the performance year.
Financial Measures
» Trading EBITDA for Capral and (for relevant General/ Divisional Managers) Business Units (30%). Key financial threshold measure as reflects underlying earnings after excluding external economic factors such as global aluminium prices and foreign exchange rates.
» Net Profit Before Tax for Capral (15%). Aligned to ability to pay dividends.
» Operating Cash Flow for Capral (15%). Selected to ensure effectiveness of cash management.
» % Working Capital to Annualised Sales for Capral and (for relevant General/ Divisional Managers) Business Units (10%). Selected to ensure effectiveness of capital management.
Non-financial Measures
Specific individual objectives are set to reflect measurable and numeric (where possible) strategic initiatives and profit and safety improvement objectives. The key individual objectives include performance to customers, sales targets/ growth, productivity and operational improvements, key projects and cost improvements. The weight-ings are generally 5% however may be higher or lower depending on importance to company performance.
Assessment of perfor-mance against measures
Performance against financial measures is assessed after the end of each financial year based on Capral’s financial results. The performance against non-financial measures is assessed as part of the PPR process.
The Managing Director, in consultation with senior managers, is responsible for recommending to the Board the amount of STIP, if any, to be paid.
Payments are subject to Capral achieving its minimum annual Trading EBITDA target. Stretch payments are not made where target financial metrics are not met.
Discretionary override
The Board retains absolute discretion regarding payments having regard to Capral’s overall financial position and other special circumstances that have arisen during the course of the year (ie normalisation or clawback). The intent however is to minimise the exercise of discretionary adjustments to the planned outcomes set at the start of the year. Material adjustments would be disclosed.
Service condition
The Managing Director is eligible to receive a pro-rata payment where his employment is terminated other than for cause. Other employees who leave Capral part way through a performance period are not eligible for a payment for that period.
Employees who start employment part way through the period may be eligible for a pro-rata payment, provided that their probation period has been successfully completed by the end of the year.
Clawback of awards
In the event of fraud, misstatement or misrepresentation of the financials, the Board may exercise its discre-tion to withhold some or all of a payment before it is made or recover some or all of payments already made.
Deferral There is no deferred cash/ equity component. The Board considers this is appropriate in the context of the relatively low amounts paid under STIP awards, Capral’s current remuneration framework and the cyclical nature of the business.
Plan review The STIP design is reviewed at least annually by the Remuneration & Nomination Committee, and approved by the Board. The Managing Director, in consultation with senior managers, is responsible for recommending to the Board the STIP financial targets. The non-financial objectives are approved by the Managing Director. The Managing Director’s non-financial targets are established and approved by the Board.
The Managing Director and key management personnel are eligible for the following awards of STIP relative to TEC:
POSITION
% OF TEC
MINIMUM TARGET STRETCH
Managing Director 25% 50% 100%
Other KMP 12.5% 25% 50%
16 DIRECTORS’ REPORTF
or p
erso
nal u
se o
nly

CAPRAL ANNUAL REPORT 2017
Where objectives can be financially measured, ‘Minimum’ is generally set around 15% below Board approved Budget. ‘Target’ is generally set around Board approved Budget and ‘Stretch’ is generally set 30% above Budget.
The Board has reviewed available market information regarding short term incentive schemes of the key management personnel for 14 ASX listed companies in either building product related industries or with comparable revenues and market capitalisation. The Board considers that Capral’s short term incentive scheme is generally in line with this group.
(H) LONG TERM INCENTIVES Capral’s long term incentive plan (LTIP) was designed to strengthen the alignment of the interests of senior managers with shareholders and support a culture of share ownership and shareholder wealth. It also aims to provide competitive remuneration for the retention of specifically targeted members of senior management.
LTIP – MANAGING DIRECTORMr Dragicevich was granted 2,500,000 performance rights following shareholder approval in April 2015 and 2,000,000 perfor-mance rights following shareholder approval in April 2016. During the Financial Year, an additional 2,000,000 performance rights were granted to Mr Dragicevich following shareholder approval in May 2017.
A summary of the Managing Director’s LTIP is set out below:
Frequency Awards determined annually.
Type of award
Performance rights subject to service requirements and vesting criteria. If the conditions are met, shares will be issued around the vesting date.
Amount of award
Eligible to receive additional annual issues of up to 50% of the value of TEC, subject to shareholder approval.
2015 award: 2,500,000 rights granted in April 2015 following shareholder approval.
2016 award: 2,500,000 rights granted in April 2016 following shareholder approval.
2017 award: 2,000,000 rights granted in May 2017 following shareholder approval.
Performance period & vesting dates
2015 award: 3 year performance period with 31 December testing dates. Vesting date of 1 March 2018.
2016 award: 3 year performance period with 31 December 2018 testing date. Vesting date of 1 March 2019.
2017 award: 3 year performance period with 31 December 2019 testing date. Vesting date of 1 March 2020.
Performance conditions
Performance rights are subject to Mr Dragicevich remaining employed by Capral at the vesting date and the achievement of the following performance conditions:
2015, 2016 and 2017 awards: 50% of the rights are subject to a Total Shareholder Return (TSR) performance condition and 50% of the rights are subject to a Basic Earnings Per Share (EPS) performance condition.
The EPS condition is calculated each year as follows: Net Profit Before Tax Target as specified by the Board for that year (adjusted for any extraordinary items approved by the Board) divided by number of securities on issue. For the 2016 and 2017 awards, the actual EPS performance over the 3 year period must meet, in aggregate, the 3 annual targets combined. The Net Profit Before Tax Target used for this condition is set at least at minimum Budget level. The Board may adjust EPS to normalise results and exclude the effects of material business acquisitions/ divestments and certain one-off costs; any adjustments would be disclosed.
The rights subject to the TSR condition are subject to Capral’s performance as against the entities with ordinary shares and units (as the case may be) included in the S&P/ASX All Ordinaries Index as at 1 January in the year of grant but excluding those companies who are classified in the Global Industry Classification Standard sector number 40. The number of rights which may vest is set out in Table A below.
17DIRECTORS’ REPORTF
or p
erso
nal u
se o
nly

CAPRAL ANNUAL REPORT 2017
Performance conditions
Continued
The Board considered setting a rate of EPS growth over the 3 year performance period however determined that is was more appropriate to set this performance measure every year because:
» the EPS targets reward achievement of a Board approved Budget that generally requires growth against the prior year which is directly under the Managing Director’s influence thus placing further focus on the key business drivers;
» the outcomes may become distorted by building and commodity cycles that can vary materially over a longer term;
» the relative nature of the starting level of earnings; and
» the TSR rewards performance that meets or exceeds the market and thereby directly linked to share-holder value.
For the 2016 award, the structure of the EPS condition was changed so that actual EPS performance over the 3 year period must meet, in aggregate, the 3 annual targets combined. This structure remained unchanged for the 2017 award. For the 2015 to 2017 awards, the Managing Director falls under the same LTIP as the other executives which has a 3 year performance period – see below.
The use of EPS and TSR tests is consistent with market practice as it ensures alignment between comparative shareholder return and remuneration of executives. Different options regarding the TSR peer group have been considered (such as alternatives ASX indices or a selected peer group) however in the context of Capral’s relative size and objectives it has been determined that the TSR peer group is appropriate. The EPS condition is also considered as appropriate as it assesses the success of Capral in achieving earnings growth.
Assessment of perfor-mance against measures
2015 award: Performance against the EPS condition is assessed at the end of each financial year (31 December testing date). If the condition is met in a given year, the rights will convert to shares at the end of the 3 year vesting period and will be issued to the Managing Director provided that he continues to be employed by Capral at the vesting date (1 March 2018). If the condition is not met in a given year, those rights will lapse.
2016 award: Performance against the EPS condition is assessed at the end of the 3 year period (31 December 2018 testing date).
2017 award: Performance against the EPS condition is assessed at the end of the 3 year period (31 December 2019 testing date).
All awards: Performance against the TSR condition is assessed at the end of the 3 year period (31 December testing date). There is no re-testing of EPS or TSR conditions. Vested rights convert on the relevant vesting date on a one-for-one basis to ordinary shares. Unvested rights lapse.
Treatment of awards on cessation of employment
For the 2015 and 2016 awards, if employment is terminated by Capral, other than for cause, unvested rights will immediately vest. For the 2017 award, unvested rights lapse on termination of his employment except in special circumstances (such as death, permanent disability and redundancy) where the Board retains discretion, and then having regard to his performance until the termination date and the proportion of the unexpired performance period, when determining the number of rights that vest.
Treatment of awards on change of control
The Board has discretion to allow awards to vest on a change of control. In exercising this discretion, the Board is not bound to award all shares and would generally consider applying pro-rata assessments for current awards.
Dividend/ participation rights
There is no entitlement to dividends on performance rights during the vesting period or to participate in respect of issues of shares to shareholders.
Clawback of awards
In the event of fraud, misstatement or misrepresentation of the financials, the Board may exercise its discretion to forfeit some or all of the award prior to the issue of shares or recover some or all of the award already made.
Plan review The LTIP design is reviewed at least annually by the Remuneration & Nomination Committee, and approved by the Board.
18 DIRECTORS’ REPORTF
or p
erso
nal u
se o
nly

CAPRAL ANNUAL REPORT 2017
LTIP – OTHER EXECUTIVESOn the recommendation of the Managing Director to the Remuneration & Nomination Committee, selected senior executives participate in LTIP. A summary of LTIP for those senior executives is set out below:
Frequency Awards determined annually.
Type of award
Performance rights subject to service requirements and vesting criteria. If the conditions are met, shares will be issued around the vesting date.
Amount of award
As a matter of practice, the aggregate amount of each annual award is about 1% of issued capital. There is no specified % of the value of TEC for individual awards in executive employment contracts. The value of individual awards is generally less than 30% of TEC.
Performance period & vesting dates
3 years with 31 December testing dates.
2014 award: vesting date of 1 March 2017
2015 award: vesting date of 1 March 2018
2016 award: vesting date of 1 March 2019
2017 award: vesting date of 1 March 2020
Performance conditions
Performance rights granted under LTIP during 2014, 2015, 2016 and the Financial Year are subject to the participant remaining employed by Capral at the vesting date and the achievement of the following perfor-mance conditions:
» 60% (for the 2014 award) or 50% (for the 2015, 2016 and 2017 awards) of rights are subject to an EPS performance condition. For the 2014 and 2015 awards, these were granted in 3 equal tranches, and will be tested on 31 December each year over a 3 year period. For the 2016 and 2017 awards, the actual EPS performance over the 3 year period, as tested on 31 December 2018 or 2019 (respectively), must meet, in aggregate, the 3 annual targets combined. The EPS condition is calculated each year as follows: Net Profit Before Tax Target as specified by the Board for that year (adjusted for any extraordinary items approved by the Board) divided by number of securities on issue. The Net Profit Before Tax Target used for this condition is set at least at minimum Budget level. The Board may adjust EPS to normalise results and exclude the effects of material business acquisitions/ divestments and certain one-off costs; any adjustments would be disclosed.
» 40% (for the 2014 award) or 50% (for the 2015, 2016 and 2017 awards) of rights are subject to a TSR performance condition as against the entities with ordinary shares and units (as the case may be) included in the S&P/ASX All Ordinaries Index as at 1 January in the year of grant but excluding those companies who are classified in the Global Industry Classification Standard sector number 40. The number of rights which may vest is set out in Table A below.
Refer to the explanation above (LTIP- Managing Director) regarding the setting of the EPS condition.
The use of EPS and TSR tests is consistent with market practice as it ensures alignment between comparative shareholder return and remuneration of executives. TSR has been a feature of LTIP since 2006. Different options regarding the TSR peer group have been considered (such as alternatives ASX indices or a selected peer group) however in the context of Capral’s relative size and objectives it has been determined that the TSR peer group is appropriate. The EPS condition was implemented in the plan in 2011 and has been consistently applied. The measure is considered as appropriate as it assesses the success of Capral in achieving earnings growth.
Assessment of perfor-mance against measures
Performance against the EPS condition is assessed at the end of each financial year (31 December testing date). For the 2014 and 2015 awards, if the condition is met in a given year, the rights will convert to shares at the end of the 3 year vesting period and will be issued to participants provided that they continue to be employed by Capral at the vesting date. If the condition is not met in a given year, those rights will lapse. For the 2016 and 2017 awards, performance against the EPS condition is assessed at the end of the 3 year period (31 December 2018 or 31 December 2019 testing dates).
For all awards, performance against the TSR condition is assessed at the end of the 3 year period (31 December testing date). There is no re-testing of EPS or TSR conditions. Vested rights convert on the relevant vesting date a one-for-one basis to ordinary shares. Unvested rights lapse.
19DIRECTORS’ REPORTF
or p
erso
nal u
se o
nly

CAPRAL ANNUAL REPORT 2017
Treatment of awards on cessation of employment
If employment ceases all unvested rights will immediately lapse. However, if the cessation relates to the redundancy or permanent disability/ death of the employee or other reason determined by the Board then the Board has absolute discretion to determine that some or all of the rights vest.
Treatment of awards on change of control
The Board has discretion to allow awards to vest on a change of control. In exercising this discretion, the Board is not bound to award all shares and would generally consider applying pro-rata assessments for current awards.
Dividend/ participation rights
There is no entitlement to dividends on performance rights during the vesting period or to participate in respect of issues of shares to shareholders.
Clawback of awards
In the event of fraud, misstatement or misrepresentation of the financials, the Board may exercise its discretion to forfeit some or all of the award prior to the issue of shares or recover some or all of the award already made.
Plan review The LTIP design is reviewed at least annually by the Remuneration & Nomination Committee, and approved by the Board. The Managing Director makes recommendations to the Remuneration & Nomination Committee regarding the proposed LTIP award participants and the amount of the entitlements.
Vesting of rights subject to the TSR performance condition at each testing date is determined in accordance with Table A below:
TABLE A
PERCENTILE OF TSR % RIGHTS VESTING
< 50th None
50th 50
> 50th and < 75th Between 50 and 100 (pro rata)
> 75th 100
The Board has reviewed generally available market information regarding long term incentive schemes of the key management personnel (including the Managing Director) for 14 ASX listed companies in either building product related industries or with comparable revenues and market capitalisation. The Board considers that Capral’s long term incentive scheme is generally in line with this group.
(I) ANTI-HEDGING POLICYCapral’s personnel are not permitted to enter into transactions with securities (or any derivative thereof) which limit the economic risk of any unvested entitlements awarded under any Capral equity-based remuneration scheme currently in operation or which will be offered by Capral in the future. As part of Capral’s due diligence undertaken at the time of the financial results, participants in any Capral equity plan are required to confirm that they have not entered into any such prohibited transactions.
20 DIRECTORS’ REPORTF
or p
erso
nal u
se o
nly

CAPRAL ANNUAL REPORT 2017
SECTION 2: ACTUAL REMUNERATION OF KEY MANAGEMENT PERSONNEL During the Financial Year there were a number of remuneration outcomes. The expensed remuneration is set out in detail in the remuneration table below however in summary the key outcomes were as follows:
(A) REMUNERATIONPay increases were implemented for executives. Total expensed remuneration for the key management personnel (including the directors) overall increased as compared to the prior year.
(B) STIPSTIP payments are below the prior year.
(C) LTIP » 2,000,000 performance rights were granted to the Managing Director in May 2017 following shareholder approval (2016:
2,500,000) and 4,850,000 rights were granted under the 2017 LTIP award to executives (2016: 4,500,000) in March 2017.
» 2,422,880 rights granted to executives under the 2014 LTIP award vested and converted into Capral shares on a 1 for 1 basis in March 2017. The 2,422,880 shares were delivered via a new issue of shares.
Performance rights granted to the Managing Director and executives under LTIP awards were tested after the year end with the outcomes detailed in section 3 below.
For the financial year ending 31 December 2018, Capral intends to:
» increase the fixed remuneration of executives; and
» grant further performance rights under the LTIP to the Managing Director (subject to shareholder approval) and selected executives.
21DIRECTORS’ REPORTF
or p
erso
nal u
se o
nly

CAPRAL ANNUAL REPORT 2017
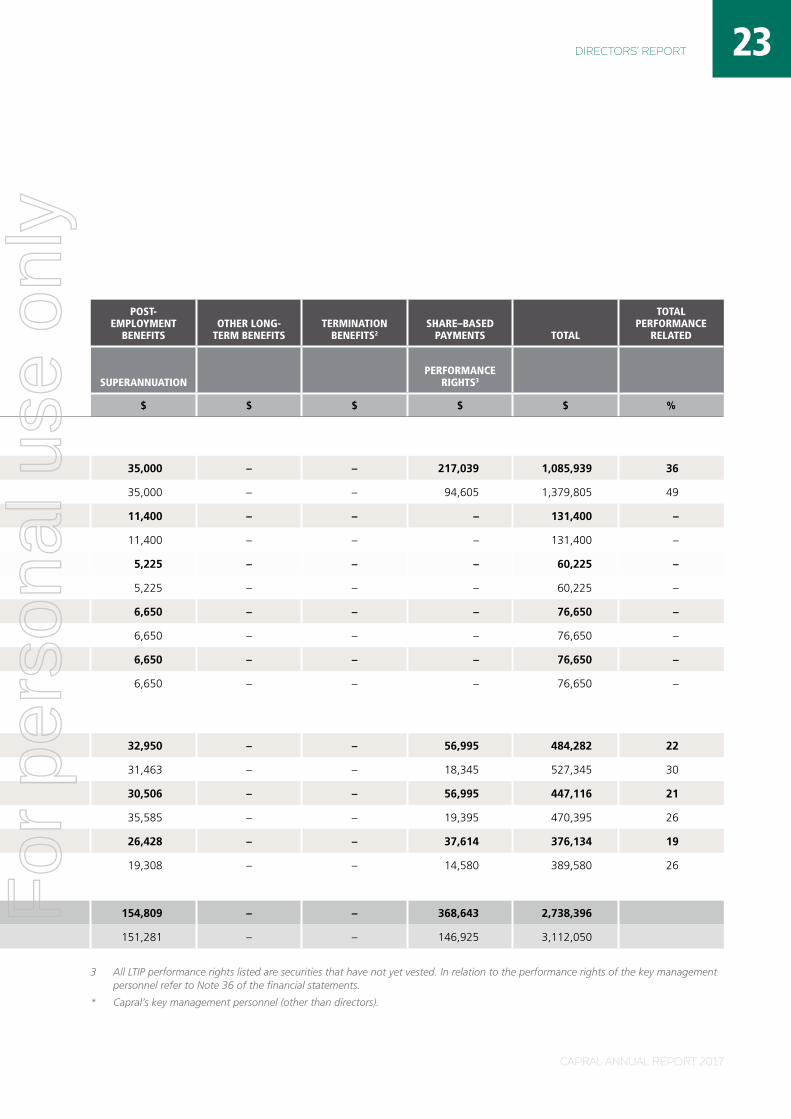
(D) REMUNERATION TABLE – KEY MANAGEMENT PERSONNELThe following table sets out the remuneration of the key management personnel (including the directors) during the Financial Year and the 2016 financial year.
The key management personnel of the consolidated entity are the non-executive directors, Managing Director, Chief Financial Officer, General Manager Operations and Company Secretary. These people have the authority and responsibility for planning, directing and controlling the day-to-day activities of Capral.
SHORT–TERM EMPLOYEE BENEFITS
POST-EMPLOYMENT
BENEFITSOTHER LONG-
TERM BENEFITSTERMINATION
BENEFITS2SHARE–BASED
PAYMENTS TOTAL
TOTAL PERFORMANCE
RELATED
NAME YEAR TITLESALARY AND
FEES BONUS1
NON- MONETARY BENEFITS SUPERANNUATION
PERFORMANCE RIGHTS3
$ $ $ $ $ $ $ $ %
Directors
A.M. Dragicevich 2017 Managing Director 665,000 168,900 – 35,000 – – 217,039 1,085,939 36
2016 Managing Director 665,000 585,200 – 35,000 – – 94,605 1,379,805 49
R.L. Wood-Ward2017 Chairman 120,000 – – 11,400 – – – 131,400 –
2016 Chairman 120,000 – – 11,400 – – – 131,400 –
P.J. Jobe 2017 Non-executive director 55,000 – – 5,225 – – – 60,225 –
2016 Non-executive director 55,000 – – 5,225 – – – 60,225 –
I.B. Blair2017 Non-executive director 70,000 – – 6,650 – – – 76,650 –
2016 Non-executive director 70,000 – – 6,650 – – – 76,650 –
G.F. Pettigrew 2017 Non-executive director 70,000 – – 6,650 – – – 76,650 –
2016 Non-executive director 70,000 – – 6,650 – – – 76,650 –
Executives
T. Campbell* 2017 Chief Financial Officer 346,837 47,500 – 32,950 – – 56,995 484,282 22
2016 Chief Financial Officer 337,537 140,000 – 31,463 – – 18,345 527,345 30
R. Michael*2017 GM Operations 321,115 38,500 – 30,506 – – 56,995 447,116 21
2016 GM Operations 312,415 103,000 – 35,585 – – 19,395 470,395 26
R. Rolfe* 2017 Gen. Counsel/ Co. Sec. 278,192 33,900 – 26,428 – – 37,614 376,134 19
2016 Gen. Counsel/ Co. Sec 270,692 85,000 – 19,308 – – 14,580 389,580 26
Total 2017 1,926,144 288,800 – 154,809 – – 368,643 2,738,396
Total 2016 1,900,644 913,200 – 151,281 – – 146,925 3,112,050
1 All bonus amounts are on an accrual basis.
2 Termination benefits include leave accrued and payments made in lieu of notice at the end of employment with Capral.
22 DIRECTORS’ REPORTF
or p
erso
nal u
se o
nly
CAPRAL ANNUAL REPORT 2017
SHORT–TERM EMPLOYEE BENEFITS
POST-EMPLOYMENT
BENEFITSOTHER LONG-
TERM BENEFITSTERMINATION
BENEFITS2SHARE–BASED
PAYMENTS TOTAL
TOTAL PERFORMANCE
RELATED
NAME YEAR TITLESALARY AND
FEES BONUS1
NON- MONETARY BENEFITS SUPERANNUATION
PERFORMANCE RIGHTS3
$ $ $ $ $ $ $ $ %
Directors
A.M. Dragicevich 2017 Managing Director 665,000 168,900 – 35,000 – – 217,039 1,085,939 36
2016 Managing Director 665,000 585,200 – 35,000 – – 94,605 1,379,805 49
R.L. Wood-Ward2017 Chairman 120,000 – – 11,400 – – – 131,400 –
2016 Chairman 120,000 – – 11,400 – – – 131,400 –
P.J. Jobe 2017 Non-executive director 55,000 – – 5,225 – – – 60,225 –
2016 Non-executive director 55,000 – – 5,225 – – – 60,225 –
I.B. Blair2017 Non-executive director 70,000 – – 6,650 – – – 76,650 –
2016 Non-executive director 70,000 – – 6,650 – – – 76,650 –
G.F. Pettigrew 2017 Non-executive director 70,000 – – 6,650 – – – 76,650 –
2016 Non-executive director 70,000 – – 6,650 – – – 76,650 –
Executives
T. Campbell* 2017 Chief Financial Officer 346,837 47,500 – 32,950 – – 56,995 484,282 22
2016 Chief Financial Officer 337,537 140,000 – 31,463 – – 18,345 527,345 30
R. Michael*2017 GM Operations 321,115 38,500 – 30,506 – – 56,995 447,116 21
2016 GM Operations 312,415 103,000 – 35,585 – – 19,395 470,395 26
R. Rolfe* 2017 Gen. Counsel/ Co. Sec. 278,192 33,900 – 26,428 – – 37,614 376,134 19
2016 Gen. Counsel/ Co. Sec 270,692 85,000 – 19,308 – – 14,580 389,580 26
Total 2017 1,926,144 288,800 – 154,809 – – 368,643 2,738,396
Total 2016 1,900,644 913,200 – 151,281 – – 146,925 3,112,050
23DIRECTORS’ REPORT
3 All LTIP performance rights listed are securities that have not yet vested. In relation to the performance rights of the key management personnel refer to Note 36 of the financial statements.
* Capral’s key management personnel (other than directors).
For
per
sona
l use
onl
y

CAPRAL ANNUAL REPORT 2017
SECTION 3: PERFORMANCE RIGHTS, OPTIONS AND BONUSES PROVIDED AS COMPENSATION
PERFORMANCE RIGHTS – MANAGING DIRECTORDuring the Financial Year and the financial year ended 31 December 2016, performance rights were granted as equity compensation benefits under the LTIP, to the Managing Director as disclosed as at balance date below. The performance rights were granted at no cost to him.
2,000,000 performance rights were granted to the Managing Director in May 2017 following shareholder approval. These rights have a vesting date of March 2020.
2,500,000 performance rights were granted to the Managing Director in April 2016 following shareholder approval. These rights have a vesting date of March 2019.
2,500,000 performance rights were granted to the Managing Director in April 2015 following shareholder approval. These rights have a vesting date of March 2018. Tranche 1 of the EPS condition was tested as at 31 December 2015. Capral did not achieve the 2015 EPS condition and consequently 416,750 of these rights lapsed in January 2016. Tranche 2 of the EPS condition was tested as at 31 December 2016. Capral achieved the 2016 EPS condition and consequently 416,750 rights will vest and convert into Capral shares on a 1 for 1 basis as at 1 March 2018, provided that the Managing Director remains employed by Capral at that date. Tranche 3 of the EPS condition was tested as at 31 December 2017. Capral did not achieve the 2017 EPS condition and consequently 416,500 of these rights will lapse in March 2018. The TSR condition (1,250,000 rights) was also tested as at 31 December 2017. Capral’s relative TSR performance over the period from January 2015 to December 2017 was in the 59th percentile and consequently 68.48% of the rights subject to the TSR condition (856,000 rights) will vest, and the balance (394,000 rights) will lapse, in March 2018. Consequently, a total of 1,272,750 rights will vest and convert into Capral shares on a 1 for 1 basis, and 810,500 rights will lapse, as at 1 March 2018.
TRANCHE GRANT NO. GRANT DATE
FAIR VALUE PER RIGHT AT GRANT DATE ($) TEST DATE LAPSED NO. VESTED NO.
2017 OfferA Dragicevich 11/05/2017
EPS 50% 1,000,000 $0.11 31/12/2019 – –
TSR 50% 1,000,000 $0.07 31/12/2019 – –
Total 2017 2,000,000 – –
2016 OfferA Dragicevich 14/04/2016
EPS 50% 1,250,000 $0.11 31/12/2018 – –
TSR 50% 1,250,000 $0.08 31/12/2018 – –
Total 2016 2,500,000 – –
2015 OfferA Dragicevich 16/04/2015
Tranche 1 – EPS 16.67% 416,750 $0.16 31/12/2015 (416,750) –
Tranche 2 – EPS 16.67% 416,750 $0.16 31/12/2016 – –
Tranche 3 – EPS 16.66% 416,500 $0.16 31/12/2017 – –
Tranche 4 – TSR 50% 1,250,000 $0.132 31/12/2017 – –
Total 2015 2,500,000 (416,750) –
24 DIRECTORS’ REPORTF
or p
erso
nal u
se o
nly

CAPRAL ANNUAL REPORT 2017
PERFORMANCE RIGHTS – OTHER KEY MANAGEMENT PERSONNELDuring the Financial Year and the financial year ended 31 December 2016, performance rights were granted as equity compensa-tion benefits under the LTIP, to certain executives including key management personnel as disclosed as at balance date below. The performance rights were granted at no cost to the participants.
4,850,000 performance rights were granted under the 2017 LTIP award to executives in March 2017. These rights have a vesting date of March 2020.
4,500,000 performance rights were granted under the 2016 LTIP award to executives in March 2016. These rights have a vesting date of March 2019.
4,500,000 performance rights were granted under the 2015 LTIP award to executives in March 2015. Tranche 1 of the EPS condition was tested as at 31 December 2015. Capral did not achieve the 2015 EPS condition and consequently 650,130 of these rights lapsed in January 2016. Tranche 2 of the EPS condition was tested as at 31 December 2016. Capral achieved the 2016 EPS condition and consequently 625,127 rights will vest and convert into Capral shares on a 1 for 1 basis as at 1 March 2018, provided that the participants remain employed by Capral at that date. Tranche 3 of the EPS condition was tested as at 31 December 2017. Capral did not achieve the 2017 EPS condition and consequently 624,746 of these rights will lapse in March 2018. The TSR condition (1,875,000 rights) was also tested as at 31 December 2017. Capral’s relative TSR performance over the period from January 2015 to December 2017 was in the 59th percentile and consequently 68.48% of the rights subject to the TSR condition (1,284,000 rights) will vest, and the balance (591,000 rights) will lapse, in March 2018. Consequently, a total of 1,909,127 rights will vest and convert into Capral shares on a 1 for 1 basis, and 1,215,746 rights will lapse, as at 1 March 2018.
In relation to the 2014 LTIP award, Tranche 1 of the EPS condition (760,000 rights) was tested on 31 December 2014 and the condition was achieved. Tranche 2 of the EPS condition (760,000 rights) was tested as at 31 December 2015 and the condition was not achieved and consequently 760,000 of these rights lapsed in January 2016. Tranche 3 of the EPS condition (760,000 rights) was tested as at 31 December 2016 and the condition was achieved. The TSR condition (1,520,000 rights) was also tested as at 31 December 2016. Capral’s relative TSR performance over the period from January 2014 to December 2016 was in the 54th percentile and consequently 59.4% of the rights subject to the TSR condition (902,880 rights) vested and the balance (617,120 rights) lapsed. Consequently, a total of 2,422,880 rights vested and converted into Capral shares on a 1 for 1 basis as at 1 March 2017.
EXECUTIVES/ OFFER TRANCHE GRANT NO. GRANT DATE
FAIR VALUE PER RIGHT AT GRANT DATE ($) TEST DATE LAPSED NO. VESTED NO.
2017 Offer
T. Campbell 500,000 07/03/2017 – –
EPS 50% 250,000 $0.15 31/12/2019 – –
TSR 50% 250,000 $0.13 31/12/2019 – –
R. Michael 500,000 07/03/2017
EPS 50% 250,000 $0.15 31/12/2019 – –
TSR 50% 250,000 $0.13 31/12/2019 – –
R. Rolfe 350,000 07/03/2017
EPS 50% 175,000 $0.15 31/12/2019 – –
TSR 50% 175,000 $0.13 31/12/2019 – –
Total 2017 1,350,000 – –
25DIRECTORS’ REPORTF
or p
erso
nal u
se o
nly

CAPRAL ANNUAL REPORT 2017
EXECUTIVES/ OFFER TRANCHE GRANT NO. GRANT DATE
FAIR VALUE PER RIGHT AT GRANT DATE ($) TEST DATE LAPSED NO. VESTED NO.
2016 Offer
T Campbell 500,000 07/03/2016
EPS 50% 250,000 $0.10 31/12/2018 – –
TSR 50% 250,000 $0.08 31/12/2018 – –
R Michael 500,000 07/03/2016
EPS 50% 250,000 $0.10 31/12/2018 – –
TSR 50% 250,000 $0.08 31/12/2018 – –
R Rolfe 350,000 07/03/2016
EPS 50% 175,000 $0.10 31/12/2018 – –
TSR 50% 175,000 $0.08 31/12/2018 – –
Total 2016 1,350,000 – –
2015 Offer
T Campbell 500,000 06/03/2015 (83,350)
Tranche 1 – EPS 16.67% 83,350 $0.16 31/12/2015 (83,350) –
Tranche 2 – EPS 16.67% 83,350 $0.16 31/12/2016 – –
Tranche 3 – EPS 16.66% 83,300 $0.16 31/12/2017 – –
Tranche 4 – TSR 50% 250,000 $0.132 31/12/2017 – –
R Michael 500,000 06/03/2015 (83,350)
Tranche 1 – EPS 16.67% 83,350 $0.16 31/12/2015 (83,350) –
Tranche 2 – EPS 16.67% 83,350 $0.16 31/12/2016 – –
Tranche 3 – EPS 16.66% 83,300 $0.16 31/12/2017 – –
Tranche 4 – TSR 50% 250,000 $0.132 31/12/2017 – –
R Rolfe 300,000 06/03/2015 (50,010)
Tranche 1 – EPS 16.67% 50,010 $0.16 31/12/2015 (50,010) –
Tranche 2 – EPS 16.67% 50,010 $0.16 31/12/2016 – –
Tranche 3 – EPS 16.66% 49,980 $0.16 31/12/2017 – –
Tranche 4 – TSR 50% 150,000 $0.132 31/12/2017 – –
Total 2015 1,300,000 (216,710) –
26 DIRECTORS’ REPORTF
or p
erso
nal u
se o
nly

CAPRAL ANNUAL REPORT 2017
EXECUTIVES/ OFFER TRANCHE GRANT NO. GRANT DATE
FAIR VALUE PER RIGHT AT GRANT DATE ($) TEST DATE LAPSED NO. VESTED NO.
2014 Offer
T Campbell 500,000 07/03/2014 181,200 318,800
Tranche 1 – EPS 20% 100,000 $0.150 31/12/2014 – 100,000
Tranche 2 – EPS 20% 100,000 $0.150 31/12/2015 (100,000) –
Tranche 3 – EPS 20% 100,000 $0.150 31/12/2016 – 100,000
Tranche 4 – TSR 40% 200,000 $0.107 31/12/2016 (81,200) 118,800
R Michael 500,000 07/03/2014 181,200 318,800
Tranche 1 – EPS 20% 100,000 $0.150 31/12/2014 – 100,000
Tranche 2 – EPS 20% 100,000 $0.150 31/12/2015 (100,000) –
Tranche 3 – EPS 20% 100,000 $0.150 31/12/2016 – 100,000
Tranche 4 – TSR 40% 200,000 $0.107 31/12/2016 (81,200) 118,800
R Rolfe 300,000 07/03/2014 108,720 191,280
Tranche 1 – EPS 20% 60,000 $0.150 31/12/2014 – 60,000
Tranche 2 – EPS 20% 60,000 $0.150 31/12/2015 (60,000) –
Tranche 3 – EPS 20% 60,000 $0.150 31/12/2016 – 60,000
Tranche 4 – TSR 40% 120,000 $0.107 31/12/2016 (48,720) 71,280
Total 2014 1,300,000 471,120 828,880
OPTIONSNo options were issued under the LTIP during the Financial Year and the financial year ended 31 December 2016. 4,300,000 options granted to the previous Managing Director, Mr Jobe, expired on 21 April 2016. The total number of options granted to Mr Jobe and outstanding as at the end of the Financial Year is Nil.
EQUITY GRANTS AND MOVEMENTS DURING THE FINANCIAL YEARDetails of the performance rights granted, as well as the movement during the Financial Year in rights previously granted, to Key Management Personnel are as follows:
2017 – PERFORMANCE SHARE RIGHTS
HELD AT START OF YEAR
GRANTED AS COMPENSATION LAPSED VESTED
HELD AT END OF YEAR
Executives
A Dragicevich 4,583,250 2,000,000 – – 6,583,250
T Campbell 1,316,650 500,000 (81,200) (318,800) 1,416,650
R Michael 1,316,650 500,000 (81,200) (318,800) 1,416,650
R Rolfe 839,990 350,000 (48,720) (191,280) 949,990
8,056,540 3,350,000 (211,120) (828,880) 10,366,540
The non-executive directors hold no performance rights.
27DIRECTORS’ REPORTF
or p
erso
nal u
se o
nly

CAPRAL ANNUAL REPORT 2017
BONUSESDuring the Financial Year and the financial year ended 31 December 2016, STIP bonus payments were made to the Managing Director and key management personnel. The Managing Director’s STIP payments for 2016 and 2017 equated to 84% and 24% (respectively) of his TEC (above and below respectively the ‘target’ level detailed in section 1 above) and the Board considers it appropriate having regard to the achievement of certain key financial measures as well as critical non-financial measures regarding customers, automation projects, anti-dumping activities and other strategic plans. The other key management personnel’s STIP payments were between 29% to 38% of TEC for 2016 (above the ‘target’ level detailed in section 1 above) and 11% to 13% of TEC for 2017 (below the ‘target’ level detailed in section 1 above).
The percentages of bonus paid and forfeited (as a result of not meeting the performance criteria at ‘target’ level) during the Financial Year and the financial year ended 31 December 2016 are disclosed below:
2017% OF BONUS
PAID% OF BONUS
FORFEITED% OF COMPENSATION FOR THE YEAR
CONSISTING OF STIP BONUS1
Executives
A. Dragicevich 48.3 51.7 19.4
T. Campbell 50.0 50.0 11.1
R. Michael 43.8 56.2 8.6
R. Rolfe 44.5 55.5 10.0
2017 financial year bonuses are payable in the 2018 financial year.
2016% OF BONUS
PAID% OF BONUS
FORFEITED% OF COMPENSATION FOR THE YEAR
CONSISTING OF STIP BONUS1
Executives
A. Dragicevich 167.2 – 45.5
T. Campbell 151.8 – 27.5
R. Michael 118.4 – 22.8
R. Rolfe 146.6 – 22.7
2016 financial year bonuses were paid in the 2017 financial year.
Note:1 Total compensation used for calculating % purposes excludes share based payments and termination benefits.
28 DIRECTORS’ REPORTF
or p
erso
nal u
se o
nly

CAPRAL ANNUAL REPORT 2017
SHAREHOLDINGS OF KEY MANAGEMENT PERSONNEL – FULLY PAID ORDINARY SHARES OF THE COMPANYDetails of the holdings of Capral’s ordinary shares of key management personnel during the Financial Year are as follows:
2017HELD AT
START OF YEARGRANTED AS
COMPENSATION
RECEIVED ON VESTING OF
PERFORMANCE RIGHTS/ EXERCISE
OF OPTIONSOTHER CHANGES
DURING THE YEARHELD AT
END OF YEAR
Directors
R.L. Wood-Ward – – – – –
A.M. Dragicevich 6,000,000 – – 250,0001 6,250,000
P.J. Jobe 7,100,500 – – – 7,100,500
I.B. Blair 227,348 – – – 227,348
G.F. Pettigrew – – – – –
Executives
T. Campbell 299,854 – 318,8002 (615,000)3 3,654
R. Michael 142,421 – 318,8002 – 461,221
R. Rolfe 133,197 – 191,2802 – 324,477
13,903,320 – 828,880 (365,000) 14,367,200
1 Acquired on market in accordance with the Capral Securities Trading Policy
2 Acquired on vesting of performance rights in March 2017
3 Disposed on market in accordance with the Capral Securities Trading Policy
SECTION 4: RELATIONSHIP BETWEEN REMUNERATION AND COMPANY PERFORMANCEThere is a link between company performance and executive reward. For the Financial Year and the previous 4 financial years, Capral has made STIP payments based upon the achievement of performance (financial and non-financial) measures.
Whilst continuing to ensure that Capral attracts and retains qualified, experienced and motivated employees in accordance with the remuneration policy by remunerating employees at a competitive level, Capral has placed more emphasis on at-risk remunera-tion in order to align remuneration of the employees to the performance of Capral and encourage shareholder wealth.
During the Financial Year and the previous 4 financial years (2013–2016), Capral’s financial performance was as follows, with the minimum target (MT) for STIP financial measures also shown for 2016 and 2017:
29DIRECTORS’ REPORTF
or p
erso
nal u
se o
nly

YEAR ENDED 31 DEC 2017 (A) 2017 (MT) 2016 (A) 2015 (A) 2014 (A) 2013 (A)
Trading EBITDA $’000^ 18,409 18,300 20,265 13,028 9,226 4,131
Operating Cash Flow $’000 15,044 16,600 15,555 7,295 7,676 470
Net Profit/(Loss) $’000 12,085 12,700 14,350 (2,511) 2,650 (51,707)*
% Working Capital to Annualised Sales 13.8 14.15 13.87 16.24 17.97 15.13
Dividend – cents per share 1.25 n/a – – – –
Basic earnings/(loss) - cents per share 2.54 2.66 3.02 (0.5) 0.6 (12.5)
Share price (closing) $ 0.15 n/a 0.17 0.10 0.11 0.155
* Includes $41.5 million impairment charge^ Trading EBITDA (non-IFRS measure) is Statutory EBITDA adjusted for items assessed as unrelated to the underlying performance of the
business and allows for a more relevant comparison between financial periods
In the Financial Year, Capral’s Trading EBITDA and Net Profit Before Tax were below 2016 levels albeit significantly above 2013–2015 levels. The Trading EBITDA minimum target and the % Working Capital to Annualised Sales target were achieved. The Net Profit Before Tax and Operating Cash Flow minimum targets were not achieved. At a divisional level, Extrusion Trading EBITDA and Working Capital measures were achieved, but there were mixed results for Distribution on Trading EBITDA, Working Capital and sales volume measures.
The following provides examples of other key measures (that are not commercially sensitive) used to assess executive performance:
PERFORMANCE AREA MEASURE OUTCOME
Safety Reduction in total reportable injury frequency rate
Rate reduced however Group targets not met.
Reduction of LTIs Number of LTIs reduced and minimum target achieved.
Hours lost & return to work hours lost from injuries
Performance on par with 2016 but targets not met.
Safety plan implementation Plans were substantially implemented in 2017 and target was achieved.
Customers Volume retention/growth Sales areas met most of the specific growth and revenue targets but not margin measures. Performance varied by region/ division.
Production Operational efficiency Manufacturing plants met some of their operational efficiency/ improvement targets.
Supply Chain Supply chain and inventory reduction programs
Initiatives were generally achieved.
People AL & LSL balance reduction Overall leave balance reduction initiatives were achieved. Performance varied by region/ division.
Anti-dumping Pursue anti-dumping campaign Initiated cases against Thailand and 2 large Chinese exporters, and Chinese circumvention. Generally higher measures imposed against Chinese exporters. Initiatives were achieved.
Costs Cost reduction initiatives Some of the specific cost and expense reduction initiatives were achieved. Performance varied by region/ division.
30 DIRECTORS’ REPORT
CAPRAL ANNUAL REPORT 2017
For
per
sona
l use
onl
y
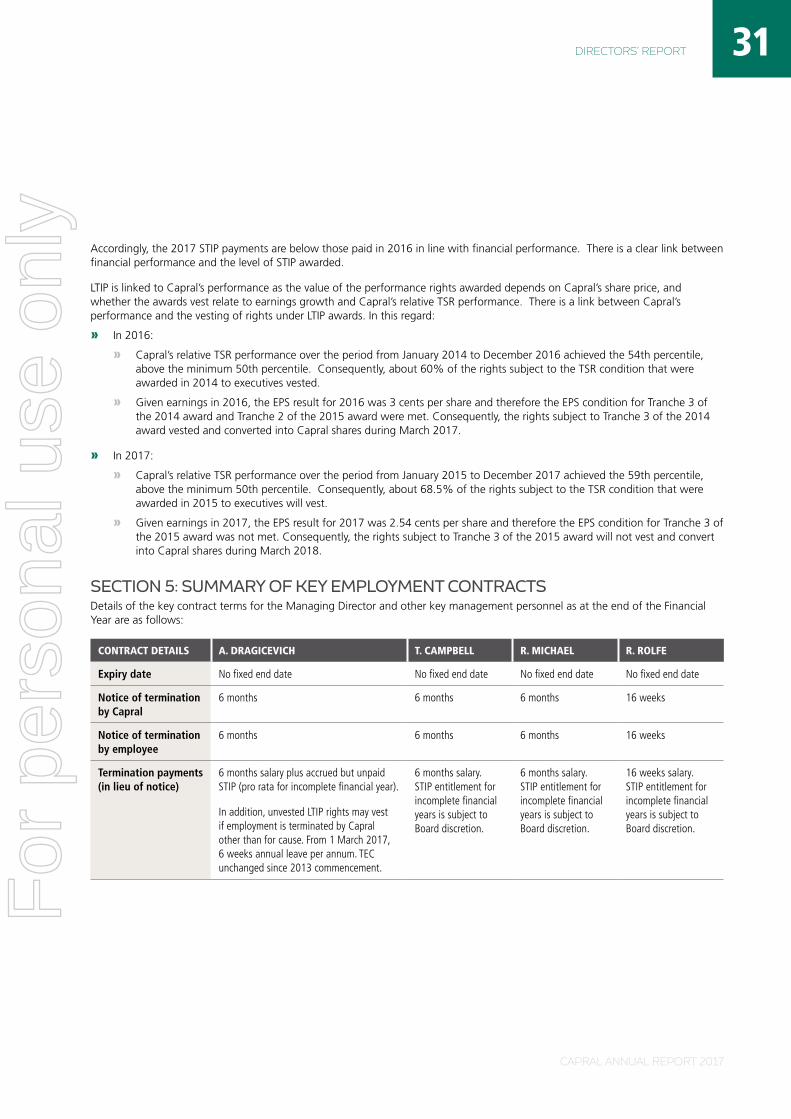
Accordingly, the 2017 STIP payments are below those paid in 2016 in line with financial performance. There is a clear link between financial performance and the level of STIP awarded.
LTIP is linked to Capral’s performance as the value of the performance rights awarded depends on Capral’s share price, and whether the awards vest relate to earnings growth and Capral’s relative TSR performance. There is a link between Capral’s performance and the vesting of rights under LTIP awards. In this regard:
» In 2016:
» Capral’s relative TSR performance over the period from January 2014 to December 2016 achieved the 54th percentile, above the minimum 50th percentile. Consequently, about 60% of the rights subject to the TSR condition that were awarded in 2014 to executives vested.
» Given earnings in 2016, the EPS result for 2016 was 3 cents per share and therefore the EPS condition for Tranche 3 of the 2014 award and Tranche 2 of the 2015 award were met. Consequently, the rights subject to Tranche 3 of the 2014 award vested and converted into Capral shares during March 2017.
» In 2017:
» Capral’s relative TSR performance over the period from January 2015 to December 2017 achieved the 59th percentile, above the minimum 50th percentile. Consequently, about 68.5% of the rights subject to the TSR condition that were awarded in 2015 to executives will vest.
» Given earnings in 2017, the EPS result for 2017 was 2.54 cents per share and therefore the EPS condition for Tranche 3 of the 2015 award was not met. Consequently, the rights subject to Tranche 3 of the 2015 award will not vest and convert into Capral shares during March 2018.
SECTION 5: SUMMARY OF KEY EMPLOYMENT CONTRACTSDetails of the key contract terms for the Managing Director and other key management personnel as at the end of the Financial Year are as follows:
CONTRACT DETAILS A. DRAGICEVICH T. CAMPBELL R. MICHAEL R. ROLFE
Expiry date No fixed end date No fixed end date No fixed end date No fixed end date
Notice of termination by Capral
6 months 6 months 6 months 16 weeks
Notice of termination by employee
6 months 6 months 6 months 16 weeks
Termination payments (in lieu of notice)
6 months salary plus accrued but unpaid STIP (pro rata for incomplete financial year).
In addition, unvested LTIP rights may vest if employment is terminated by Capral other than for cause. From 1 March 2017, 6 weeks annual leave per annum. TEC unchanged since 2013 commencement.
6 months salary. STIP entitlement for incomplete financial years is subject to Board discretion.
6 months salary. STIP entitlement for incomplete financial years is subject to Board discretion.
16 weeks salary. STIP entitlement for incomplete financial years is subject to Board discretion.
31DIRECTORS’ REPORT
CAPRAL ANNUAL REPORT 2017
For
per
sona
l use
onl
y

CAPRAL ANNUAL REPORT 2017
The Board has considered this position and in accordance with the advice received from the Audit & Risk Committee, it is satisfied that the provision of these services during the Financial Year by the auditor is compatible with, and did not compromise, the general standard of auditor independence imposed by the Corporations Act for the following reasons:
(1) the non-audit services provided do not involve reviewing or auditing the auditor’s own work and have not involved partners or staff acting in a management or decision-making capacity for Capral or in the processing or originating of transactions;
(2) all non-audit services and the related fees have been reviewed by the Audit & Risk Committee to ensure complete transparency and that they do not affect the integrity and objectivity of Deloitte Touche Tohmatsu; and
(3) the declaration required by section 307C of the Corporations Act 2001 confirming independence has been received from Deloitte Touche Tohmatsu.
Details of the amounts paid or payable to Capral’s auditor (Deloitte Touche Tohmatsu) for audit and non-audit services provided during the Financial Year are set out in Note 32 of the financial statements.
AUDITOR’S INDEPENDENCE DECLARATIONThe auditors’ independence declaration as required under section 307C of the Corporations Act is set out on page 33.
ROUNDING OF AMOUNTSCapral is a company of the kind referred to in Class Order 98/0100, dated 10 July 1998, and in accordance with that Class Order amounts in the Directors’ Report and the Financial Report are rounded off to the nearest thousand dollars, unless otherwise indicated.
Signed in accordance with a resolution of directors made pursuant to section 298(2) of the Corporations Act 2001.
On behalf of the directors
R. L. WOOD-WARD A. M. DRAGICEVICHChairman Managing Director
Sydney 23 February 2018
ENVIRONMENTAL REGULATIONSManufacturing licences and consents required by laws and regulations are held by the consolidated entity at each relevant site as advised by consulting with relevant environmental authorities. All applications for and renewals of licences have been granted and all consents have been given by all relevant authorities.
DIRECTORS’ AND OFFICERS’ INDEMNITIES AND INSURANCEUnder Capral’s constitution, Capral is required to indemnify, to the extent permitted by law, each director and secretary of Capral against any liability incurred by that person as an officer of Capral. The directors listed on pages 6 and 7 and the secretary listed on page 12 have the benefit of this indemnity. During the Financial Year, Capral paid a premium for directors’ and officers’ liability insurance policies which cover current and former directors, company secretaries and officers of the consolidated entity. Details of the nature of the liabilities covered and the amount of the premium paid in respect of the directors’ and officers’ insurance policies are not disclosed, as such disclosure is prohibited under the terms of the contracts.
INDEMNITIES TO AUDITORSIn respect of non-audit services provided in relation to reviews of consulting and compliance advice during the Financial Year, Deloitte Touche Tohmatsu, Capral’s auditor, has the benefit of an indemnity (including in respect of legal costs) for any third party claim in connection with the use, distribution or reliance on their work (except to the extent caused by the wilful misconduct or fraud of Deloitte Touche Tohmatsu, or where it has agreed that the third party may rely on the work or it may be used in a public document).
PROCEEDINGS ON BEHALF OF CAPRALNo person has applied to the Court under section 237 of the Corporations Act for leave to bring proceedings on behalf of Capral, or to intervene in any proceedings to which Capral is party, for the purpose of taking responsibility on behalf of Capral for all or part of those proceedings. No proceedings have been brought or intervened in on behalf of Capral with leave of the Court under section 237 of the Corporations Act.
NON-AUDIT SERVICESCapral may decide to employ the auditor on assignments additional to their statutory audit services where the auditor’s expertise and experience with the consolidated entity are important.
32 DIRECTORS’ REPORTF
or p
erso
nal u
se o
nly
CAPRAL ANNUAL REPORT 2017
33AUDITOR’S INDEPENDENCE DECLARATION
AUDITOR’S INDEPENDENCE DECLARATION
33
The Board of Directors Capral Limited Level 4 60 Philip Street Parramatta NSW 2150
Dear Directors,
Capral Limited
In accordance with section 307C of the Corporations Act 2001, I am pleased to provide the following declaration of independence to the directors of Capral Limited.
As lead audit partner for the audit of the financial statements of Capral Limited for the financial year ended 31 December 2017, I declare that to the best of my knowledge and belief, there have been no contraventions of:
(i) the auditor independence requirements of the Corporations Act 2001 in relation to the audit
(ii) any applicable code of professional conduct in relation to the audit.
Yours sincerely
DELOITTE TOUCHE TOHMATSU
David White Partner Chartered Accountants Parramatta, 23 February 2018
Deloitte Touche TohmatsuABN 74 490 121 060
Eclipse TowerLevel 1960 Station StreetParramatta NSW 2150PO Box 38Parramatta NSW 2124 Australia
DX 28485Tel: +61 (0) 2 9840 7000Fax: +61 (0) 2 9840 7001www.deloitte.com.au
Liability limited by a scheme approved under Professional Standards Legislation. Member of Deloitte Touche Tohmatsu
For
per
sona
l use
onl
y

CAPRAL ANNUAL REPORT 2017
CONTINUING OPERATIONS2017 2016
NOTE $’000 $’000
Sales revenue 415,268 398,202
Scrap and other revenue 33,412 26,604
Revenue 3 448,680 424,806
Other income 3 500 411
Changes in inventories of finished goods and work in progress 2,111 880
Raw materials and consumables used (270,756) (242,057)
Employee benefits expense 2 (90,941) (88,368)
Depreciation and amortisation expense 2 (5,845) (5,878)
Finance costs 2 (972) (863)
Freight expense (11,523) (11,334)
Occupancy costs 2 (20,240) (20,256)
Repairs and maintenance expense (7,152) (7,329)
Restructuring costs 2 (192) (40)
Other expenses (31,585) (35,622)
Profit before tax 12,085 14,350
Income tax 4 – –
Profit for the year 12,085 14,350
Other comprehensive incomeItems that will not be reclassified subsequently to profit or loss
Gain on revaluation of properties 793 –
Other comprehensive income for the year 793 –
Total comprehensive income for the year 12,878 14,350
Earnings per share (Cents per share) (Cents per share)
Basic earnings per share 24 2.54 3.02
Diluted earnings per share 24 2.45 2.94
The above Consolidated Statement of Profit or Loss and Other Comprehensive Income should be read in conjunction with the accompanying notes.
CONSOLIDATED STATEMENT OF PROFIT OR LOSS AND OTHER COMPREHENSIVE INCOMEfor the financial year ended 31 December 2017
34 FINANCIAL STATEMENTSF
or p
erso
nal u
se o
nly

CAPRAL ANNUAL REPORT 2017
CONSOLIDATED STATEMENT OF FINANCIAL POSITIONas at 31 December 2017
35FINANCIAL STATEMENTS
2017 2016
NOTE $’000 $’000
ASSETSCurrent assets
Cash and cash equivalents 7 34,358 31,409
Trade and other receivables 8 67,959 63,110
Inventories 9 76,978 75,210
Other financial assets 30 (c) 32 497
Prepayments 10 729 876
Total current assets 180,056 171,102
Non-current assets
Deferred tax assets 11 2,857 2,857
Property, plant and equipment 14 42,010 41,102
Other intangible assets 15 336 117
Total non-current assets 45,203 44,076
Total assets 225,259 215,178
LIABILITIESCurrent liabilities
Trade and other payables 17 74,033 73,136
Borrowings 18 – 48
Provisions 19 12,638 11,063
Other financial liabilities 30 (c) 644 –
Deferred income 20 100 101
Total current liabilities 87,415 84,348
Non-current liabilities
Provisions 19 4,952 5,558
Total non-current liabilities 4,952 5,558
Total liabilities 92,367 89,906
Net assets 132,892 125,272
EQUITYIssued capital 21 425,744 425,744
Reserves 22 (a) 11,427 9,958
Accumulated losses 22 (b) (304,279) (310,430)
Total equity 132,892 125,272
The above Consolidated Statement of Financial Position should be read in conjunction with the accompanying notes.
For
per
sona
l use
onl
y

CAPRAL ANNUAL REPORT 2017
CONSOLIDATED STATEMENT OF CASH FLOWSfor the financial year ended 31 December 2017
36 FINANCIAL STATEMENTS
2017 2016
NOTE $’000 $’000
Cash flows from operating activities
Receipts from customers 488,699 464,710
Payments to suppliers and employees (472,824) (448,339)
15,875 16,371
Interest and other costs of finance paid (831) (816)
Net cash provided by operating activities 34(ii) 15,044 15,555
Cash flows from investing activities
Payments for property, plant and equipment (5,745) (4,136)
Payments for software assets (431) (170)
Interest received 15 16
Proceeds from sale of property, plant and equipment – 1
Net cash flows used in investing activities (6,161) (4,289)
Cash flows from financing activities
Payments of dividends (5,934) –
Net cash flows used in financing activities (5,934) –
Net increase in cash and cash equivalents 2,949 11,266
Cash and cash equivalents at the beginning of the financial year 31,409 20,143
Cash and cash equivalents at the end of the financial year 34(i) 34,358 31,409
The above Consolidated Statement of Cash Flows should be read in conjunction with the accompanying notes.
For
per
sona
l use
onl
y

CAPRAL ANNUAL REPORT 2017
CONSOLIDATED STATEMENT OF CHANGES IN EQUITYfor the year ended 31 December 2017
37FINANCIAL STATEMENTS
FULLY PAID ORDINARY
SHARES
EQUITY-SETTLED COMPENSATION
RESERVE
ASSET REVALUATION
RESERVEACCUMULATED
LOSSES TOTAL
$’000 $’000 $’000 $’000 $’000
Balance as at 1 January 2016 425,744 9,508 221 (324,780) 110,693
Profit for the year – – – 14,350 14,350
Total comprehensive income for the year – – – 14,350 14,350
Share-based payments expense – 229 – – 229
Balance as at 31 December 2016 425,744 9,737 221 (310,430) 125,272
Balance as at 1 January 2017 425,744 9,737 221 (310,430) 125,272
Profit for the year – – – 12,085 12,085
Total comprehensive income for the year – – 793 12,085 12,878
Share-based payments expense – 676 – – 676
Dividends paid – – – (5,934) (5,934)
Balance as at 31 December 2017 425,744 10,413 1,014 (304,279) 132,892
The above Consolidated Statement of Changes in Equity should be read in conjunction with the accompanying notes.
For
per
sona
l use
onl
y

CAPRAL ANNUAL REPORT 2017
1B ADOPTION OF NEW AND REVISED ACCOUNTING STANDARDS
In the current year, the Group has adopted all the new and revised Standards and Interpretations issued by the Australian Accounting Standards Board (the AASB) that are relevant to its operations and effective for the current annual reporting period. The adoption of new and revised Standards and Interpretations has resulted in changes to the Group’s accounting policies, but did not have material impact on the Group’s financial statements.
Initial application of the following Standards and Interpretations is not expected to have any material impact to the financial report of the consolidated entity and the Company.
1A GENERAL INFORMATIONCapral Limited (the Company) is a public listed company incorp-orated and operating in Australia. The Company’s shares are quoted on the Australian Securities Exchange (ASX Code: CAA).
The Company’s registered office and its principal place of business is as follows:
REGISTERED OFFICE AND PRINCIPAL PLACE OF BUSINESS71 Ashburn Road Bundamba QLD 4304
Tel: (07) 3816 7000
The principal continuing activities of the consolidated entity consist of the manufacturing, marketing and distribution of fabricated and semi-fabricated aluminium related products.
NOTES TO THE FINANCIAL STATEMENTS38
NOTES TO THE FINANCIAL STATEMENTSfor the financial year ended 31 December 2017
STANDARD
EFFECTIVE FOR ANNUAL REPORTING PERIODS
BEGINNING ON OR AFTER
EXPECTED TO BE INITIALLY APPLIED IN THE FINANCIAL YEAR
ENDING
AASB 9 ‘Financial Instruments’, and the relevant amending standards 1 January 2018 31 December 2018
AASB 15 ‘Revenue from Contracts with Customers’, AASB 2014-5 ‘Amendments to Australian Accounting Standards arising from AASB 15’, AASB 2015-8 ‘Amendments to Australian Accounting Standards – Effective Date of AASB 15’, and AASB 2016-3 ‘Amendments to Australian Accounting Standards – Clarifications to AASB 15’ 1 January 2018 31 December 2018
Classification and Measurement of Share-based Payment Transactions (Amendment to IFRS 2) 1 January 2018 31 December 2018
Management is currently assessing the potential impact to the financial report of the consolidated entity and the Company from the application of the following Standard.
STANDARD
EFFECTIVE FOR ANNUAL REPORTING PERIODS
BEGINNING ON OR AFTER
EXPECTED TO BE INITIALLY APPLIED IN THE FINANCIAL YEAR
ENDING
AASB 16 Leases 1 January 2019 31 December 2019
For
per
sona
l use
onl
y

CAPRAL ANNUAL REPORT 2017
NOTES TO THE FINANCIAL STATEMENTS 39
ASSESSMENT OF THE IMPACT OF ADOPTING AASB 15 REVENUE FROM CONTRACTS WITH CUSTOMERS AASB 15 establishes a single comprehensive model for entities to use in accounting for revenue arising from contracts with customers. AASB 15 will supersede the current revenue recognition guidance including AASB 118 Revenue, AASB 11 Construction Contracts and the related Interpretations when it becomes effective.
The core principle of AASB 15 is that an entity should recognize revenue to depict the transfer of promised goods or services to customers in an amount that reflects the considera-tion to which the entity expects to be entitled in exchange for those goods or services. Specifically, the Standard introduces a 5-step approach to revenue recognition:
» Step 1: Identify the contract(s) with a customer
» Step 2: Identify the performance obligations in the contract
» Step 3: Determine the transaction price
» Step 4: Allocate the transaction price to the performance obligations in the contract
» Step 5: Recognise revenue when (or as) the entity satisfies a performance obligation
Under AASB 15, an entity recognises revenue when (or as) a performance obligation is satisfied, i.e. when ‘control’ of the goods or services underlying the particular performance obligation is transferred to the customer.
The Group recognises revenue from the sale of products as disclosed in note 1 of the financial statements.
The Group has assessed that the only performance obligation is from the sale of the products and accordingly, revenue will be recognised for this performance obligation when control over the corresponding goods is transferred to the customer. This is similar to the current identification of separate revenue components under AASB 18.
The Group intends to use the full retrospective method of transition to AASB 15.
Apart from providing more extensive disclosures on the Group’s revenue transactions, it is not anticipated that the application of AASB 15 will have a significant impact on the financial position and/or financial performance of the Group.
1C. SIGNIFICANT ACCOUNTING POLICIES
STATEMENT OF COMPLIANCE The financial report is a general purpose financial report which has been prepared in accordance with the Corporations Act
2001, Accounting Standards and Interpretations, and complies with other requirements of the law.
The financial report includes the financial statements of the Company and the financial statements of the Group. For the purpose of preparing the consolidated financial statements, the Company is a for-profit entity.
Accounting Standards include Australian equivalents to International Financial Reporting Standards (‘A-IFRS’). Compliance with A-IFRS ensures that the financial statements and notes of the Group comply with International Financial Reporting Standards (‘IFRS’).
The financial statements were authorised for issue by the directors on 23 February 2018.
BASIS OF PREPARATIONThe financial report has been prepared on the basis of historical cost, except for the revaluation of certain non-current assets and financial instruments. Cost is based on the fair values of the consideration given in exchange for assets. All amounts are presented in Australian dollars, unless otherwise noted.
The Company is of a kind referred to in ASIC Class Order 2016/191, dated 24 March 2016, issued by the Australian Securities and Investments Commission, relating to the “rounding off” of amounts in the financial report. Amounts in the financial report have been rounded off in accordance with that Class Order to the nearest thousand dollars, or in certain cases, the nearest dollar as indicated.
The following significant accounting policies have been adopted in the preparation and presentation of the financial report:
(A) BASIS OF CONSOLIDATIONThe financial statements incorporate the financial statements of the Company and entities (including special purpose entities) controlled by the Company (and its subsidiaries) (referred to as ‘the Group’ in these financial statements).
Control is based on whether an investor has:
» power over the investee
» exposure, or rights, to variable returns from its involve-ment with the investee, and
» the ability to use its power over the investee to affect the amount of the returns.
The results of the subsidiaries acquired or disposed of during the year are included in the consolidated statement of profit or loss and other comprehensive income from the effective date of acquisition or up to the effective date of disposal, as appropriate.
Where necessary, adjustments are made to the financial state-ments of subsidiaries to bring their accounting policies into line with those used by other members of the Group. All intra-group transactions, balances, income and expenses are eliminated in full on consolidation.
For
per
sona
l use
onl
y

CAPRAL ANNUAL REPORT 2017
NOTES TO THE FINANCIAL STATEMENTS40
(B) BORROWING COSTSBorrowing costs directly attributable to the acquisition, construc-tion or production of qualifying assets, which are assets that necessarily take a substantial period of time to get ready for their intended use or sale, are added to the cost of those assets, until such time as the assets are substantially ready for their intended use or sale. Investment income earned on the temporary investment of specific borrowings pending their expenditure on qualifying assets is deducted from the borrowing costs eligible for capitalisation. All other borrowing costs are recognised in profit or loss in the period in which they are incurred.
(C) BUSINESS COMBINATIONSAcquisitions of subsidiaries and businesses are accounted for using the acquisition method. The consideration for each acquisition is measured at the aggregate of the fair values (at the date of exchange) of assets given, liabilities incurred or assumed, and equity instruments issued by the Group in exchange for control of the acquiree. Acquisition-related costs are recognised in profit or loss as incurred.
Where applicable, the consideration for the acquisition includes any asset or liability resulting from a contingent consideration arrangement, measured at its acquisition-date fair value. Subsequent changes in such fair values are adjusted against the cost of acquisition where they qualify as measurement period adjustments (see below). All other subsequent changes in the fair value of contingent consideration classified as an asset or liability are accounted for in accordance with relevant Standards. Changes in the fair value of contingent considera-tion classified as equity are not recognised.
The acquiree’s identifiable assets, liabilities and contingent liabilities that meet the conditions for recognition under AASB 3(2008) are recognised at their fair value at the acquisition date, except that:
» deferred tax assets or liabilities and liabilities or assets related to employee benefit arrangements are recognised and measured in accordance with AASB 112 Income Taxes and AASB 119 Employee Benefits respectively;
» liabilities or equity instruments related to the replacement by the Group of an acquiree’s share based payment awards are measured in accordance with AASB 2 Share-based Payment; and
» assets (or disposal groups) that are classified as held for sale in accordance with AASB 5 Noncurrent Assets Held for Sale and Discontinued Operations are measured in accordance with that Standard.
(D) CASH AND CASH EQUIVALENTSCash comprises cash on hand and demand deposits. Cash equivalents are short-term, highly liquid investments that are readily convertible to known amounts of cash and which are
subject to an insignificant risk of change in value and have a maturity of three months or less at the date of acquisition. Bank overdrafts are shown within borrowings in current liabilities in the statement of financial position.
(E) DERIVATIVE FINANCIAL INSTRUMENTS
The Group enters into a variety of derivative financial instruments to manage its exposure to interest rate and foreign exchange rate risk, including foreign exchange forward contracts.
Further details of derivative financial instruments are disclosed in Note 30 to the financial statements. Derivatives are initially recognised at fair value at the date a derivative contract is entered into and are subsequently remeasured to their fair value at each reporting date.
The resulting gain or loss is recognised in profit or loss immediately. The fair value of hedging derivatives is classified as a non-current asset or a non-current liability if the remaining maturity of the hedge relationship is more than 12 months, and as a current asset or current liability if the remaining maturity of the hedge relationship is less than 12 months. The Group’s derivatives do not qualify for hedge accounting, and are not designated into an effective hedge relationship and are classified as a current asset and current liability.
EMBEDDED DERIVATIVES Derivatives embedded in other financial instruments or other host contracts are treated as separate derivatives when their risks and characteristics are not closely related to those of the financial instrument, and the financial instruments are measured at fair value with changes in fair value recognised in profit or loss.
(F) EMPLOYEE BENEFITS(I) SALARIES, WAGES AND LEAVE BENEFITSA liability is recognised for benefits accruing to employees in respect of wages and salaries, including non-monetary benefits, annual leave and long service leave, when it is probable that settlement will be required and they are capable of being measured reliably. Liabilities recognised in respect of short term employee benefits are measured at their nominal values using the remuneration rate expected to apply at the time of settlement. Liabilities recognised in respect of long term employee benefits are measured at the present value of the estimated future cash outflows to be made by the Group in respect of services provided by employees up to reporting date.
(II) SHARE-BASED PAYMENTSEquity-settled share-based payments with employees are measured at the fair value of the equity instrument at the grant date.
1C. SIGNIFICANT ACCOUNTING POLICIES CONTINUED
For
per
sona
l use
onl
y
CAPRAL ANNUAL REPORT 2017
NOTES TO THE FINANCIAL STATEMENTS 41
The fair value of the performance rights is estimated at grant date using a Monte-Carlo Simulation analysis taking into account the terms and conditions upon which the securities are granted.
The fair value of the options is estimated at grant date using a binomial tree model taking into account the terms and conditions upon which the securities are granted.
The expected life used in the model has been adjusted, based on management’s best estimate, for the effects of non-trans-ferability, exercise restrictions, and behavioural considerations.
The fair value determined at the grant date of the equity-settled share-based payments is expensed on a straight-line basis over the vesting period, based on the Group’s estimate of shares that will eventually vest.
Further details on how the fair value of equity-settled share-based transactions have been determined can be found in Note 36.
(III) DEFINED CONTRIBUTION PLANContributions to defined contribution superannuation plans are expensed when incurred.
(G) FINANCIAL ASSETSInvestments are recognised and derecognised on trade date where the purchase or sale of an investment is under a contract whose terms require delivery of the investment within the timeframe established by the market concerned, and are initially measured at fair value, net of transaction costs except for those financial assets classified as at fair value through the profit or loss which are initially measured at fair value. Subsequent to initial recognition, investments in subsidiaries are measured at cost in the Company’s financial statements. Other financial assets are classified into the following specified categories: Financial assets ‘at fair value through profit or loss’, ‘held-to-maturity investments’, ‘available-for-sale’ financial assets, and ‘loans and receivables’. The classification depends on the nature and purpose of the financial assets and is determined at the time of initial recognition.
EFFECTIVE INTEREST METHODThe effective interest method is a method of calculating the amortised cost of a financial asset and of allocating interest income over the relevant period. The effective interest rate is the rate that exactly discounts estimated future cash receipts through the expected life of the financial asset, or, where appropriate, a shorter period.
Income is recognised on an effective interest rate basis for debt instruments other than financial assets ‘at fair value through profit or loss’.
FINANCIAL ASSETS AT FAIR VALUE THROUGH PROFIT OR LOSSFinancial assets are classified as financial assets at fair value through profit or loss where the financial asset:
(i) has been acquired principally for the purpose of selling in the near future;
(ii) is a part of an identified portfolio of financial instruments that the Group manages together and has a recent actual pattern of short-term profit taking; or
(iii) is a derivative that is not designated and effective as a hedging instrument.
Financial assets at fair value through profit or loss are stated at fair value, with any resultant gain or loss recognised in the profit or loss. The net gain or loss recognised in profit or loss incorpo-rates any dividend or interest earned on the financial asset. Fair value is determined in the manner described in Note 30.
LOANS AND RECEIVABLESTrade receivables, loans, and other receivables that have fixed or determinable payments that are not quoted in an active market are classified as ‘loans and receivables’. Loans and receivables are measured at amortised cost using the effective interest method less impairment. Interest is recognised by applying the effective interest rate.
IMPAIRMENT OF FINANCIAL ASSETSFinancial assets, other than those at fair value through profit or loss, are assessed for indicators of impairment at each balance date. Financial assets are impaired where there is objective evidence that as a result of one or more events that occurred after the initial recognition of the financial asset the estimated future cash flows of the investment have been impacted.
For financial assets carried at amortised cost, the amount of the impairment is the difference between the asset’s carrying amount and the present value of estimated future cash flows, discounted at the original effective interest rate.
The carrying amount of the financial asset is reduced by the impairment loss directly for all financial assets with the exception of trade receivables where the carrying amount is reduced through the use of an allowance account. When a trade receivable is uncollectible, it is written off against the allowance account. Subsequent recoveries of amounts previ-ously written off are credited against the allowance account. Changes in the carrying amount of the allowance account are recognised in profit or loss.
DERECOGNITION OF FINANCIAL ASSETSThe Group derecognises a financial asset only when the contrac-tual rights to the cash flows from the asset expire, or it transfers the financial asset and substantially all the risks and rewards of ownership of the asset to another entity. If the Group neither transfers nor retains substantially all the risks and rewards of ownership and continues to control the transferred asset, the Group recognises its retained interest in the asset and an associ-ated liability for the amounts it may have to pay. If the Group retains substantially all the risks and rewards of ownership of a transferred financial asset, the Group continues to recognise the financial asset and also recognises a collateralised borrowing for the proceeds received.
For
per
sona
l use
onl
y

CAPRAL ANNUAL REPORT 2017
(H) FINANCIAL INSTRUMENTS ISSUED BY THE GROUP
DEBT AND EQUITY INSTRUMENTSDebt and equity instruments are classified as either liabilities or as equity in accordance with the substance of the contractual arrangement.
COMPOUND INSTRUMENTSThe component parts of compound instruments are classified separately as financial liabilities and equity in accordance with the substance of the contractual arrangement. At the date of issue, the fair value of the liability component is estimated using the prevailing market interest rate for a similar non-convertible instrument.
This amount is recorded as a liability on an amortised cost basis until extinguished on conversion or upon the instruments reaching maturity. The equity component initially brought to account is determined by deducting the amount of the liability component from the fair value of the compound instrument as a whole. This is recognised and included in equity, net of income tax effects and is not subsequently remeasured.
FINANCIAL GUARANTEE CONTRACT LIABILITIESFinancial guarantee contract liabilities are measured initially at their fair values and subsequently at the higher of the amount recognised as a provision and the amount initially recognised less cumulative amortisation.
FINANCIAL LIABILITIES Financial liabilities are classified as either financial liabilities ‘at fair value through profit or loss’ or other financial liabilities.
FINANCIAL LIABILITIES AT FAIR VALUE THROUGH PROFIT OR LOSSFinancial liabilities at fair value through profit or loss are stated at fair value, with any resultant gain or loss recognised in profit or loss. The net gain or loss recognised in profit or loss incorporates any interest paid on the financial liability. Fair value is determined in the manner described in Note 30.
OTHER FINANCIAL LIABILITIESOther financial liabilities, including borrowings, are initially measured at fair value, net of transaction costs.
Other financial liabilities are subsequently measured at amortised cost using the effective interest method, with interest expense recognised on an effective yield basis. Refer note 1c (g).
(I) FOREIGN CURRENCYIn preparing the financial statements, transactions in currencies other than the entity’s functional currency (foreign currencies) are recorded at the rates of exchange prevailing on the dates of the transactions. At each balance date, monetary items
denominated in foreign currencies are retranslated at the rates prevailing at the balance date. Non-monetary items carried at fair value that are denominated in foreign currencies are retrans-lated at the rates prevailing on the date when the fair value was determined. Non monetary items that are measured in terms of historical cost in a foreign currency are not retranslated.
Exchange differences are recognised in profit or loss in the period in which they arise except for exchange differences which relate to assets under construction for future productive use, which are included in the cost of those assets where they are regarded as an adjustment to interest costs on foreign currency borrowings.
(J) IMPAIRMENT OF OTHER TANGIBLE AND INTANGIBLE ASSETS EXCLUDING GOODWILL
At each reporting date, the Group reviews the carrying amounts of its tangible and intangible assets to determine whether there is any indication that those assets have suffered an impairment loss. If any such indication exists, the recover-able amount of the asset is estimated in order to determine the extent of the impairment loss (if any). Where the asset does not generate cash flows that are independent from other assets, the Group estimates the recoverable amount of the cash-generating unit (CGU) to which that asset belongs.
Intangible assets with indefinite useful lives and intangible assets not yet available for use are tested for impairment at least annually and whenever there is an indication that the asset may be impaired. Recoverable amount is the higher of fair value less costs to sell and value in use. In assessing value in use, the estimated future cash flows are discounted to their present value using a post-tax discount rate that reflects current market assessments of the time value of money and the risks specific to the asset for which the estimates of future cash flows have not been adjusted. If the recoverable amount of an asset (or CGU) is estimated to be less than its carrying amount, the carrying amount of the asset (CGU) is reduced to its recoverable amount. An impairment loss is recognised in profit or loss immediately, unless the relevant asset is carried at fair value, in which case the impairment loss is treated as a revaluation decrease.
Where an impairment loss subsequently reverses, the carrying amount of the asset (CGU) is increased to the revised estimate of its recoverable amount, but only to the extent that the increased carrying amount does not exceed the carrying amount that would have been determined had no impairment loss been recognised for the asset (CGU) in prior years. A reversal of an impairment loss is recognised in the profit or loss immediately, unless the relevant asset is carried at fair value, in which case the reversal of the impairment loss is treated as a revaluation increase.
NOTES TO THE FINANCIAL STATEMENTS42
1C. SIGNIFICANT ACCOUNTING POLICIES CONTINUED
For
per
sona
l use
onl
y

CAPRAL ANNUAL REPORT 2017
(K) INCOME TAXThe income tax expense or revenue for the period is the tax payable on the current period’s taxable income based on the national income tax rate for each jurisdiction adjusted by changes in deferred tax assets and liabilities attributable to temporary differences between the tax bases of assets and liabilities and their carrying amounts in the financial state-ments, and to unused tax losses.
Deferred tax assets are recognised for deductible temporary differences and unused tax losses only if it is probable that future taxable amounts will be available to utilise those temporary differences and losses.
The Company and its wholly-owned Australian entities have implemented the tax consolidation legislation.
The current and deferred tax amounts for the tax-consolidated group are allocated to the members of the tax-consolidated group (including the Company as the head entity) using the ‘separate taxpayer within group’ approach, with deferred taxes being allocated by reference to the carrying amounts in the financial statements of each member entity and the tax values applying under tax consolidation. Current tax liabilities and assets and deferred tax assets arising from unused tax losses and relevant tax credits arising from this allocation process are then accounted for as immediately assumed by the head entity, as under Australian taxation law the head entity has the legal obligation (or right) to these amounts.
(L) INTANGIBLE ASSETS Intangible assets acquired in a business combination are identified and recognised separately from goodwillwhere they satisfy the definition of an intangible asset and their fair value can be measured reliably.
PATENTS, TRADEMARKS AND LICENCESPatents, trademarks and licences are recorded at cost less accumulated amortisation and impairment. Amortisation is charged on a straight line basis over their estimated useful lives, which vary from 5 to 16 years.
The estimated useful life and amortisation method is reviewed at the end of each annual reporting period, with any changes being recognised as a change in accounting estimate.
SOFTWARE Software assets including system development costs have a finite useful life and are carried at cost less accumulated amortisation and impairment losses. Amortisation is calculated using the straight-line method to allocate the cost over the assets estimated useful lives, which vary from 3 to 5 years.
(M) INVENTORIESInventories representing aluminium log, other supplies and finished goods are valued at the lower of cost and net realis-able value.
Net realisable value represents the estimated selling price less all estimated costs of completion and costs necessary to make the sale.
Aluminium log is valued at moving average of direct purchase cost. Cost of rolled product has been determined principally on moving average of direct purchase costs. Costs for finished and partly finished includes moving average metal cost, direct labour, and appropriate proportion of fixed and variable factory overhead.
(N) LEASED ASSETSTHE GROUP AS LESSEE:Leases are classified as finance leases when the terms of the lease transfer substantially all the risks and rewards incidental to ownership of the leased asset to the lessee. All other leases are classified as operating leases.
Operating lease payments are recognised as an expense on a straight-line basis over the lease team, except where another systematic basis is more representative of the time pattern in which economic benefits from the leased asset are consumed.
In the event that lease incentives are received to enter into operating leases, such incentives are recognised as a liability. The aggregate benefits of incentives are recognised as a reduction of rental expense on a straight-line basis, except where another systematic basis is more representative of the time pattern in which economic benefits from the leased asset are consumed.
Rental income from operating leases is recognised on a straight-line basis over the term of the relevant lease. Initial direct costs incurred in negotiating and arranging an operating lease are added to the carrying amount of the leased asset and recognised on a straight-line basis over the lease term.
(O) PROPERTY, PLANT AND EQUIPMENT
Land and buildings are measured at fair value less any subsequent accumulated depreciation and subsequent accumulated impairment losses. Fair value is determined on the basis of a periodic, independent valuation by external valuation experts, based on discounted cash flows or capitalisation of net income, as appropriate.
Periodic reviews are conducted every three to five years. The fair values are recognised in the financial statements of the Group, and are reviewed at the end of each reporting period to ensure that the carrying value of land and buildings is not materially different from their fair values. Any revaluation
NOTES TO THE FINANCIAL STATEMENTS 43F
or p
erso
nal u
se o
nly

CAPRAL ANNUAL REPORT 2017
increase arising on revaluation of land and buildings are credited to the asset revaluation reserve except to the extent that the increase reverses a revaluation decrease for the same asset previously recognised as an expense in profit or loss, in which case the increase is credited to the profit and loss to the extent of the decrease previously charged. A decrease in carrying amount arising on the revaluation of land and buildings is charged as an expense in profit or loss to the extent that it exceeds the balance, if any, held in the revalua-tion reserve relating to a previous revaluation of that asset.
Depreciation on revalued buildings is charged to profit or loss. On the subsequent sale or retirement of revalued property, the attributable revaluation surplus remaining in the revaluation reserve, net of any related taxes, is transferred directly to retained earnings.
Plant and equipment, and leasehold improvements are stated at cost less accumulated depreciation and impairment. Cost includes expenditure that is directly attributable to the acquisi-tion of the item.
In the event that settlement of all or part of the purchase consideration is deferred, cost is determined by discounting the amounts payable in the future to their present value as at the date of acquisition. Depreciation is provided on property, plant and equipment, including freehold buildings but excluding land. Depreciation is calculated on a straight-line basis so as to write off the net cost or other revalued amount of each asset over its expected useful life to its estimated residual value.
Leasehold improvements are depreciated over the period of the lease or estimated useful life, whichever is shorter, using the straight-line method. The estimated useful lives, residual values and depreciation method are reviewed at the end of each annual reporting period, with the effect of any changes recognised on a prospective basis.
(P) PROVISIONSProvisions are recognised when the Group has a present, legal or constructive obligation as a result of past events, it is probable that the Group will be required to settle the obligation, and a reliable estimate can be made of the amount of the obligation.
The amount recognised as a provision is the best estimate of the consideration required to settle the present obligation at reporting date, taking into account the risks and uncertainties surrounding the obligation. Where a provision is measured using the cashflows estimated to settle the present obligation, its carrying amount is the present value of those cashflows. When some or all of the economic benefits required to settle a provision are expected to be recovered from a third party, the receivable is recognised as an asset if it is virtually certain that the reimbursement will be received and the amount of the receivable can be measured reliably.
ONEROUS CONTRACTSPresent obligations arising under onerous contracts are recognised and measured as a provision. An onerous contract is considered to exist where the Group has a contract under which the unavoidable costs of meeting the obligations under the contract exceed the economic benefits expected to be received under it.
RESTRUCTURINGSA restructuring provision is recognised when the Group has developed a detailed formal plan for the restructuring and has raised a valid expectation in those affected that it will carry out the restructuring by starting to implement the plan or announcing its main features to those affected by it.
The measurement of a restructuring provision includes only the direct expenditures arising from the restructuring, which are those amounts that are both necessarily entailed by the restructuring and not associated with the ongoing activities of the entity.
PROVISION FOR RESTORATION AND REHABILITATION (PROVISION FOR MAKE GOOD ON LEASED ASSETS)A provision for restoration and rehabilitation (provision for make good on leased assets) is recognised when there is a present obligation as a result of production activities under-taken, it is probable that an outflow of economic benefits will be required to settle the obligation, and the amount of the provision can be measured reliably. The estimated future obligations include the costs of removing the facilities and restoring the affecting areas.
(Q) REVENUE RECOGNITIONRevenue is measured at the fair value of the consideration received or receivable. Sales revenue comprises sales of goods and services at net invoice values less returns, trade allowances and applicable rebates.
SALE OF GOODSRevenue from the sale of goods is recognised when all the following conditions are satisfied:
(i) the Group has transferred to the buyer the significant risks and rewards of ownership of the goods;
(ii) the Group retains neither continuing managerial involve-ment to the degree normally associated with ownership nor effective control over the goods sold;
(iii) the amount of revenue can be measured reliably;
(iv) it is probable that the economic benefits associated with the transaction will flow to the entity; and
(v) the costs incurred or to be incurred in respect of the transaction can be measured reliably.
NOTES TO THE FINANCIAL STATEMENTS44
1C. SIGNIFICANT ACCOUNTING POLICIES CONTINUED(O) PROPERTY, PLANT AND EQUIPMENT CONTINUED
For
per
sona
l use
onl
y

CAPRAL ANNUAL REPORT 2017
ROYALTIESRoyalty revenue is recognised on an accrual basis in accordance with the substance of the relevant agreement.
Royalties determined on a time basis are recognised on a straight-line basis over the period of the agreement. Royalty arrangements that are based on production, sales and other measures are recognised by reference to the underlying agreement.
RENTAL INCOMEThe Group’s policy for recognition of revenue from operating leases is described in note 1c (q).
INTEREST REVENUEInterest revenue is accrued on a time basis, by reference to the principal outstanding and at the effective interest rate applicable, which is the rate that exactly discounts estimated future cash receipts through the expected life of the financial asset to that asset’s net carrying amount.
(R) GOODS AND SERVICES TAXRevenues, expenses and assets are recognised net of the amount of goods and services tax (GST) except:
(i) where the amount of GST incurred is not recoverable from the taxation authority, it is recognised as part of the cost of acquisition of an asset or as part of an item of expense; or
(ii) for receivables and payables which are recognised inclusive of GST.
The net amount of GST recoverable from, or payable to, the taxation authority is included as part of receivables or payables. Cash flows are included in the cash flow statement on a gross basis. The GST component of cash flows arising from investing and financing activities which is recoverable from, or payable to, the taxation authority, is classified as operating cash flows.
(S) EARNINGS PER SHARE(I) BASIC EARNINGS PER SHAREBasic earnings per share is calculated by dividing the profit/(loss) attributable to equity holders of the Group, excluding any costs of servicing equity other than ordinary shares, by the weighted average number of ordinary shares outstanding during the year, adjusted for bonus elements in ordinary shares issued during the year.
(II) DILUTED EARNINGS PER SHAREDiluted earnings per share adjusts the figures used in the determination of basic earnings per share to take into account the weighted average number of shares assumed to have been issued for no consideration in relation to dilutive potential ordinary shares.
1D. CRITICAL ACCOUNTING JUDGE-MENTS AND KEY SOURCES OF ESTIMATION UNCERTAINTY
In the application of the Group’s accounting policies, which are described in note 1, management is required to make judgements, estimates and assumptions about carrying values of assets and liabilities that are not readily apparent from other sources. The estimates and associated assumptions are based on historical experience and various other factors that are believed to be reasonable under the circumstances, the results of which form the basis of making the judgements. Actual results may differ from these estimates.
The estimates and underlying assumptions are reviewed on an ongoing basis. Revisions to accounting estimates are recognised in the period in which the estimate is revised if the revision affects only that period, or in the period of the revision and future periods if the revision affects both current and future periods.
CRITICAL JUDGEMENTS IN APPLYING THE GROUP’S ACCOUNTING POLICIESThe following are the critical judgements (apart from those involving estimations which are dealt with above), that management has made in the process of applying the Group’s accounting policies and that have the most significant effect on the amounts recognised in the financial statements.
INVENTORIESNote 9 sets out the categories of inventory carried. The net realisable value of inventories is the estimated selling price in the ordinary course of business less estimated costs to sell which approximates fair value less cost to sell. The key assumptions require the use of management judgement and are reviewed annually.
These key assumptions are the variables affecting the estimated costs to sell and the expected selling price. Any reassessment of cost to sell or selling price in a particular year will affect the cost of goods sold.
INDICATORS OF IMPAIRMENT AND REVERSAL OF IMPAIRMENTNote 14 sets out the categories of property, plant and equipment held. In assessing whether there is any indication that property, plant and equipment may be impaired, or whether a reversal of previous impairment losses should be recognised, management has used, among others, the following key assumptions:
NOTES TO THE FINANCIAL STATEMENTS 45F
or p
erso
nal u
se o
nly

CAPRAL ANNUAL REPORT 2017
USEFUL LIVES OF PROPERTY, PLANT AND EQUIPMENTThe Group reviews the estimated useful lives of property, plant and equipment at the end of each annual reporting period. During the financial year, the directors determined that there were no revisions to the useful lives of property, plant and equipment.
DEFERRED TAXATIONThe recognition of deferred tax assets is based upon whether it is more likely than not that sufficient and suitable taxable profits will be available in the future against which the reversal of temporary differences can be deducted. To determine the future taxable profits, reference is made to the latest available profit forecasts. Where the temporary differences are related to losses, relevant tax law is considered to determine the availability of the losses to offset against the future taxable profits. Recognition of deferred tax assets therefore involves judgement regarding the future financial performance of the particular legal entity or tax group in which the deferred tax asset has been recognised.
1E. COMPARATIVE INFORMATION Where necessary, comparative amounts have been reclas-sified and repositioned for consistency with current period disclosures.
(i) the cyclical nature of both residential and commercial building activity,
(ii) aluminium prices which impact margins to the extent that price variations are passed on to customers or not, and
(iii) anti-dumping outcomes in relation to import duties imposed on overseas suppliers.
The key assumptions required the use of management judgement and are reviewed biannually.
EMPLOYEE BENEFITSKey assumptions used in the calculation of leave benefit provisions at balance date:
(i) future on-cost rates,
(ii) experience of employee departures and period of service, and
(iii) future increase in wages and salaries.
NOTES TO THE FINANCIAL STATEMENTS46
1D. CRITICAL ACCOUNTING JUDGEMENTS AND KEY SOURCES OF ESTIMATION UNCERTAINTY CONTINUED
For
per
sona
l use
onl
y

CAPRAL ANNUAL REPORT 2017
CONSOLIDATED
2 PROFIT FOR THE YEAR2017 $’000
2016 $’000
(A) OTHER EXPENSESProfit before tax includes the following specific net expenses:
Inventory:Write-down of inventory to net realisable value 259 993Reversal of write-down of inventory (893) (710)
Amortisation of other intellectual property – 9Amortisation of software 180 171
Total amortisation 180 180
Depreciation:Buildings 141 139Leasehold improvements 234 235Plant and equipment 5,290 5,325
Total depreciation 5,665 5,699
Total depreciation and amortisation 5,845 5,878
Revaluation of properties, plant and equipment: Gain on revaluation of property 793 –
793 –
Occupancy costsSublease income received (1,711) (1,674)Minimum lease payments 18,551 18,246
Site costs 3,400 3,684
20,240 20,256
Other charges against assetsImpairment of trade receivables 12 226
Employee benefit expensePost employment benefits:
– defined contribution plans 6,695 6,213Equity-settled share-based payments 676 285
Termination benefits 33 196Other employee benefits 83,537 81,674
90,941 88,368
Restructuring costs Termination benefits – 40Other site closure costs 192 –
192 40
Finance costs
Interest and finance charges paid/payable– third party financier 823 863
Net finance costs are comprised of: Interest on bank overdrafts and loans 823 863Impact of discounting on long-term provisions 149 –
Total interest expense 972 863
B) GAINS AND LOSSESNet (loss)/gain on foreign exchange (494) 25
Net loss on disposal of property, plant and equipment – (1)
NOTES TO THE FINANCIAL STATEMENTS 47F
or p
erso
nal u
se o
nly
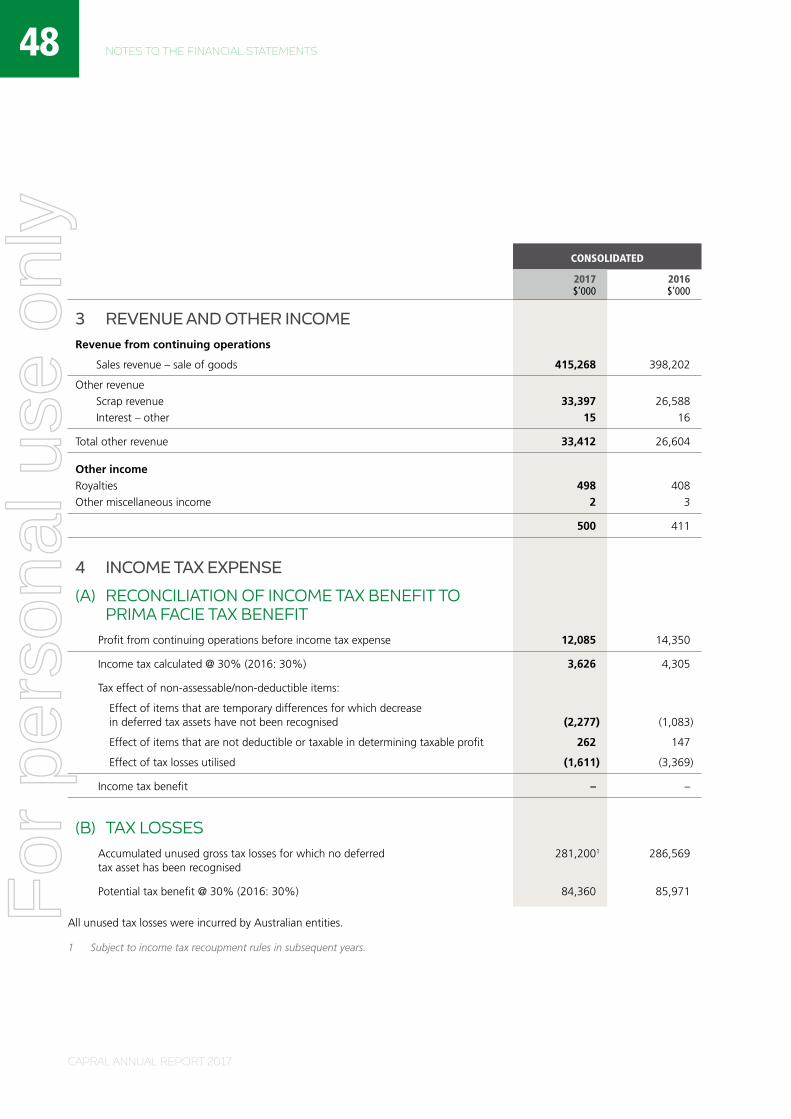
CAPRAL ANNUAL REPORT 2017
CONSOLIDATED
2017 $’000
2016 $’000
3 REVENUE AND OTHER INCOMERevenue from continuing operations
Sales revenue – sale of goods 415,268 398,202
Other revenue
Scrap revenue 33,397 26,588
Interest – other 15 16
Total other revenue 33,412 26,604
Other income
Royalties 498 408
Other miscellaneous income 2 3
500 411
4 INCOME TAX EXPENSE
(A) RECONCILIATION OF INCOME TAX BENEFIT TO PRIMA FACIE TAX BENEFIT
Profit from continuing operations before income tax expense 12,085 14,350
Income tax calculated @ 30% (2016: 30%) 3,626 4,305
Tax effect of non-assessable/non-deductible items:
Effect of items that are temporary differences for which decrease in deferred tax assets have not been recognised (2,277) (1,083)
Effect of items that are not deductible or taxable in determining taxable profit 262 147
Effect of tax losses utilised (1,611) (3,369)
Income tax benefit – –
(B) TAX LOSSESAccumulated unused gross tax losses for which no deferred tax asset has been recognised
281,2001 286,569
Potential tax benefit @ 30% (2016: 30%) 84,360 85,971
All unused tax losses were incurred by Australian entities.
1 Subject to income tax recoupment rules in subsequent years.
NOTES TO THE FINANCIAL STATEMENTS48F
or p
erso
nal u
se o
nly

CAPRAL ANNUAL REPORT 2017
5 CHANGES IN ACCOUNTING ESTIMATESThere were no significant changes in accounting estimates during the Financial Year (2016: none).
6 SEGMENT INFORMATIONThe information reported to the Managing Director, as the Group’s chief operating decision maker, for the purposes of resource allocation and assessment of performance is focused on the type of goods supplied, being aluminium products. As such, in 2016 and 2017, the Group operated in one reportable segment under AASB 8 Operating Segment.
MAJOR PRODUCTS AND SERVICESThe Group produces a wide range of extruded aluminium products and systems. It distributes those manufactured products in addition to a small amount of bought-in products through two distribution channels.
The Group supplies to three market segments through each of its distribution channels:
» Residential – supply of aluminium and other components for windows and doors, showers and wardrobes and security products,
» Commercial – supply of aluminium and other components for windows and doors, internal fit outs and other commercial building related products, and
» Industrial – supply of aluminium extrusions and rolled products for industrial uses.
Management does not report on the revenues from external customers for each of the market segments.
GEOGRAPHIC INFORMATIONThe Group operates in one geographical area, Australia.
INFORMATION ABOUT MAJOR CUSTOMERSThere are no individual major customers who contributed more than 10% of the Group’s revenue in either the Financial Year or in 2016.
CONSOLIDATED
7 CURRENT ASSETS – CASH AND CASH EQUIVALENTS
2017 $’000
2016 $’000
Cash at bank and cash in hand 34,358 31,409
8 CURRENT ASSETS – TRADE AND OTHER RECEIVABLES
Trade receivables – at amortised cost 67,856 63,327
Allowance for doubtful debts (i) (325) (400)
67,531 62,927
Other receivables – at amortised cost 428 183
67,959 63,110
Disclosed in the financial statements as:
Current trade and other receivables 67,959 63,110
Non-current other receivables – –
67,959 63,110
The average credit period on sales of goods is approximately 49 days (2016: 53 days). No interest is charged on trade receivables.
NOTES TO THE FINANCIAL STATEMENTS 49F
or p
erso
nal u
se o
nly

CAPRAL ANNUAL REPORT 2017
NOTES TO THE FINANCIAL STATEMENTS50
During both the Financial Year and 2016 the provision has been based on a percentage of the total debt for customers who are subject to formal payment plans or legal action and 1.75% of the 90 day and over balances. The provision for doubtful debts is reviewed each month and necessary adjustments made to the provision. The provision is based on estimated irrecoverable amounts from the sale of goods, determined by reference to past experience and knowledge of customers. Allowances are made for known doubtful debts at the time of appointment of administrators, liquidators or other formal insolvency events.
Included in the Group’s trade receivables are debtors with balances in 61 days and over of $0.475 million (2016: $0.261 million), refer note 30(h). No further amount has been provided for as the Group believes that this past due balance is still considered recoverable. In relation to some of the balances the Group holds personal property securities registrations and/or personal guaran-tees and/or trade indemnity insurance for 90% of the amount outstanding (after applying the deductible). The average age of these receivables is 49 days (2016: 88 days). Aging past due but not impaired was calculated based on agreed customers individual terms.
Aging past due but not impaired:
CONSOLIDATED
2017 $’000
2016 $’000
1–30 days past due 14,249 10,187
31–60 days past due 1,289 2,015
61+ days past due 216 82
Total 15,754 12,284
Included in the allowance for doubtful debts are individually impaired trade receivables with a balance of $0.259 million (2016: $0.179 million). The impairment recognised represents the difference between the carrying amount of these trade receivables and the present value of the expected proceeds.
1–30 days past due – –
31–60 days past due – –
61+ days past due 259 179
Total 259 179
(I) MOVEMENT IN THE ALLOWANCE FOR DOUBTFUL DEBTS
Balance at beginning of the financial year (400) (812)
Amounts written off during the financial year 87 638
Increase in allowance recognised in profit or loss (12) (226)
Balance at end of the financial year (325) (400)
In determining the recoverability of a trade receivable the Group considers any change in the credit quality of the trade receivable from the date credit was initially granted up to the reporting date. The Group and Company do not have any significant exposure to any individual customer or counterparty.
Major concentrations of credit risk are in the construction, transport, consumer durable and electrical industries in Australia. Furthermore, the Company has credit insurance cover which requires ongoing management of credit accounts with monthly reports provided to the Insurer. Accordingly, there is no further credit provision required in excess of the allowance for doubtful debts.
8 CURRENT ASSETS – TRADE AND OTHER RECEIVABLES CONTINUED
For
per
sona
l use
onl
y

CAPRAL ANNUAL REPORT 2017
CONSOLIDATED
2017 $’000
2016 $’000
9 CURRENT ASSETS – INVENTORIESRaw materials and stores 16,025 14,439
Work in progress 2,165 1,663
Finished goods 58,788 59,108
76,978 75,210
All inventories are net of provision and are expected to be recovered within 12 months.
10 CURRENT ASSETS – PREPAYMENTS Prepayments 729 876
11 DEFERRED TAX ASSETSDeferred tax assets 2,857 2,857
The Group has recognised deferred tax assets of $2,857,000 (2016: $2,857,000) (the Company $2,650,000 – 2016: $2,650,000) based upon the forecasted operational performance the recovery of these prior year losses in the short term is more than probable.
12 NON-CURRENT ASSETS – INVESTMENTS
DETAILS OF SUBSIDIARIESThe financial statements incorporate the assets, liabilities and results of the following subsidiaries:
EQUITY HOLDING
ENTITY NAME2017
%2016
%COUNTRY OF
INCORPORATION
Aluminium Extrusion & Distribution Pty Limited1 100 100 Australia
Austex Dies Pty Limited 100 100 Australia
1 Subsidiary has been granted relief from the necessity to prepare financial reports in accordance with Class Order 98/1418 issued by ASIC. The Company and Aluminium Extrusion & Distribution Pty Limited have entered into a deed of cross guarantee (Deed). Refer to note 28.
13 RELATED PARTIES
PARENT ENTITIESThe ultimate parent entity within the Group is Capral Limited.
EQUITY INTERESTS IN CONTROLLED ENTITIESInterests in controlled entities are set out in Note 12.
NOTES TO THE FINANCIAL STATEMENTS 51F
or p
erso
nal u
se o
nly

CAPRAL ANNUAL REPORT 2017
TRANSACTIONS WITH KEY MANAGEMENT PERSONNELRefer to Note 36 in relation to securities granted and forfeited during the Financial Year under the Long Term Incentive Plan that include rights granted to Capral’s Managing Director and rights granted and shares issued, to Capral’s Chief Financial Officer, General Manager (Operations) and Company Secretary (who are key management personnel).
Details of the compensation of, and transactions with, each Director of the Company and key management personnel of the Group are set out in the Directors’ Report and in particular, the Remuneration Report.
TRANSACTIONS WITH OTHER RELATED PARTIESIn 2017 as the parent entity in the consolidated entity, the Company has a non-interest bearing loan of $3,650,000 (2016: $3,300,000) advanced from a controlled entity, Austex Dies Pty Limited. The loan is payable on demand. The Company has entered into the following transactions with controlled entities:
» Rental expense of $152,000 (2016: $162,000) – Aluminium Extrusion & Distribution Pty Limited
» Purchase of dies of $4,527,000 (2016: $4,988,000) – Austex Dies Pty Limited
These transactions were conducted on arm’s length commercial terms and conditions at market rates.
CONSOLIDATED
14 PROPERTY, PLANT AND EQUIPMENT2017 $’000
2016 $’000
Freehold land
At valuation 1,200 1,200
Accumulated depreciation – –
Net book amount 1,200 1,200
Buildings
At valuation 3,393 2,949
Accumulated depreciation (250) (537)
Net book amount 3,143 2,412
Leasehold improvements
At cost 11,532 11,273
Accumulated depreciation (7,318) (7,112)
Accumulated impairment (2,069) (2,069)
Net book amount 2,145 2,092
Total land and buildings 6,488 5,704
Plant, machinery and equipment
At cost 225,627 222,356
Accumulated depreciation (144,746) (140,131)
Accumulated impairment losses (48,962) (48,962)
Net book amount 31,919 33,263
Construction work in progress at cost 3,603 2,135
Net plant, machinery and equipment 35,522 35,398
Total property, plant and equipment – net book value 42,010 41,102
NOTES TO THE FINANCIAL STATEMENTS52
13 RELATED PARTIES CONTINUED
For
per
sona
l use
onl
y

CAPRAL ANNUAL REPORT 2017
The following useful lives are used in the calculation of depreciation:
Buildings 20–33 Years
Leasehold improvements 5–25 Years
Plant and equipment 3–25 Years
(I) VALUATIONS OF LAND AND BUILDING:An independent valuation of the Group’s land and buildings was performed in November 2017 using Capitalisation and Direct Comparison approaches to determine the fair value of the land and buildings. The valuations, which conform to International Valuation Standards, were determined by reference to recent market transactions on arm’s length terms at the time. The fair value of the Land and Buildings is $1,200,000 and $2,950,000 respectively.
RECONCILIATIONSReconciliations of the carrying amounts of each class of property, plant and equipment at the beginning and end of the current and prior financial year are set out below:
CONSOLIDATED
FREEHOLD LAND AT FAIR
VALUE BUILDINGS AT
FAIR VALUE
LEASEHOLD IMPROVE-MENTS AT
COST
PLANT AND EQUIPMENT
AT COST
IN COURSE OF CONSTRUC-
TION AT COST TOTAL
$’000 $’000 $’000 $’000 $’000 $’000
2017Opening net book amount 1,200 2,412 2,092 33,263 2,135 41,102
Additions – 59 131 3,478 2,162 5,830
Disposals – – – (50) – (50)
Transfers – 20 156 518 (694) –
Revaluation – 793 – – – 793
Depreciation charge (Note 2(a)) – (141) (234) (5,290) – (5,665)
Net book amount at 31 December 2017 1,200 3,143 2,145 31,919 3,603 42,010
2016Opening net book amount 1,200 2,523 1,689 34,151 3,067 42,630
Additions – 24 93 2,966 1,167 4,250
Disposals – – – (1) – (1)
Transfers – 4 545 1,472 (2,099) (78)
Depreciation charge (Note 2(a)) – (139) (235) (5,325) – (5,699)
Net book amount at 31 December 2016 1,200 2,412 2,092 33,263 2,135 41,102
IMPAIRMENT OF NON-CURRENT ASSETSAt each reporting date, the Group reviews the carrying amounts of its tangible and intangible assets to determine whether there is any indication that those assets have suffered an impairment loss. If any such indication exists, the recoverable amount of the asset is estimated in order to determine the extent of the impairment loss (if any). Where the asset does not generate cash flows that are independent from other assets, the Group estimates the recoverable amount of the cash-generating unit (CGU) to which that asset belongs. Management views the Group as representing one CGU.
NOTES TO THE FINANCIAL STATEMENTS 53F
or p
erso
nal u
se o
nly

CAPRAL ANNUAL REPORT 2017
If there is an indication of impairment, the recoverable amount of property, plant & equipment and intangible assets will be determined by reference to a value in use discounted cash flow valuation of the Group, utilising financial forecasts and projections.
Recoverable amount is the higher of fair value less costs to sell and value in use. In assessing value in use, the estimated future cash flows are discounted to their present value using a post-tax discount rate that reflects current market assessments of the time value of money and the risks specific to the asset for which the estimates of future cash flows have not been adjusted. Cash flows that may result from prior period tax losses are not taken into account. If the recoverable amount of an asset (or CGU) is estimated to be less than its carrying amount, the carrying amount of the asset (CGU) is reduced to its recoverable amount. An impairment loss is recognised in profit or loss immediately.
Following the positive results in the Financial Year, Management has, in addition to considering indicators of impairment, also considered indicators for the potential reversal of the impairment previously recognised. However, recognising the operational and economic challenges, such as dumping, residential and commercial construction activity and increasing input costs, it is Management’s view that no reversal of impairment should be recognised in the Financial Year. Refer to Note 1 (d) for the critical accounting judgements in this regard.
THE RESULT OF IMPAIRMENT ASSESSMENT AS AT 31 DECEMBER 2017No impairment assessment was performed at 31 December 2017 as there was no indication of impairment or reversal of impairment.
15 INTANGIBLES
OTHER INTELLECTUAL
PROPERTY SOFTWARE TOTAL
$’000 $’000 $’000
CONSOLIDATED2017Cost 15,915 24,071 39,986
Accumulated amortisation (8,353) (21,265) (29,618)
Accumulated impairment losses (7,562) (2,470) (10,032)
Net book value – 336 336
2016Cost 15,941 23,672 39,613
Accumulated amortisation (8,379) (21,085) (29,464)
Accumulated impairment losses (7,562) (2,470) (10,032)
Net book value – 117 117
NOTES TO THE FINANCIAL STATEMENTS54
14 PROPERTY, PLANT AND EQUIPMENT CONTINUED
For
per
sona
l use
onl
y
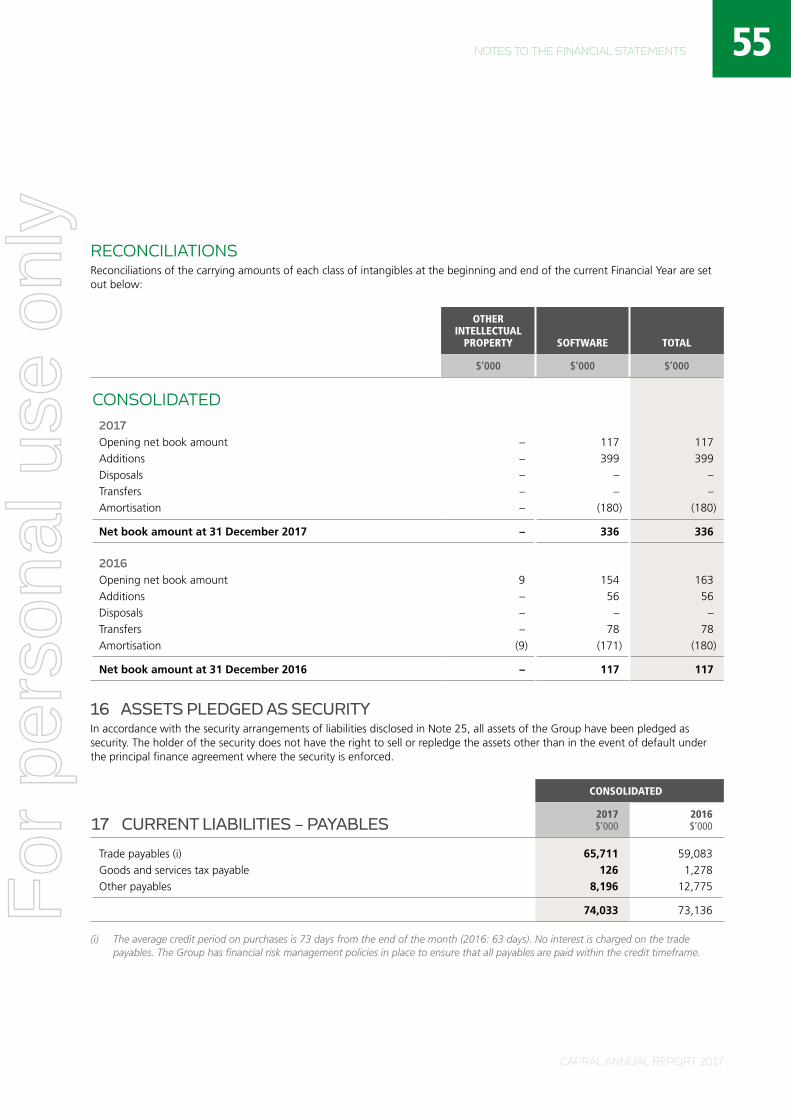
CAPRAL ANNUAL REPORT 2017
RECONCILIATIONSReconciliations of the carrying amounts of each class of intangibles at the beginning and end of the current Financial Year are set out below:
OTHER INTELLECTUAL
PROPERTY SOFTWARE TOTAL
$’000 $’000 $’000
CONSOLIDATED2017Opening net book amount – 117 117
Additions – 399 399
Disposals – – –
Transfers – – –
Amortisation – (180) (180)
Net book amount at 31 December 2017 – 336 336
2016Opening net book amount 9 154 163
Additions – 56 56
Disposals – – –
Transfers – 78 78
Amortisation (9) (171) (180)
Net book amount at 31 December 2016 – 117 117
16 ASSETS PLEDGED AS SECURITYIn accordance with the security arrangements of liabilities disclosed in Note 25, all assets of the Group have been pledged as security. The holder of the security does not have the right to sell or repledge the assets other than in the event of default under the principal finance agreement where the security is enforced.
17 CURRENT LIABILITIES – PAYABLES
CONSOLIDATED
2017 $’000
2016 $’000
Trade payables (i) 65,711 59,083
Goods and services tax payable 126 1,278
Other payables 8,196 12,775
74,033 73,136
(i) The average credit period on purchases is 73 days from the end of the month (2016: 63 days). No interest is charged on the trade payables. The Group has financial risk management policies in place to ensure that all payables are paid within the credit timeframe.
NOTES TO THE FINANCIAL STATEMENTS 55F
or p
erso
nal u
se o
nly

CAPRAL ANNUAL REPORT 2017
CONSOLIDATED
2017 $’000
2016 $’000
18 BORROWINGSUnsecured – at amortised cost
Current
Loans from other entities – 48
– 48
19 PROVISIONSCurrent
Employee benefits 11,732 10,172
Make good on leased assets1 782 330
Other2 124 561
12,638 11,063
Non-current
Employee benefits 1,420 1,867
Make good on leased assets1 1,887 2,173
Other3 1,645 1,518
4,952 5,558
1 Provision for make good on leased assets comprises obligations relating to site closure and other costs associated with operating lease rental properties.
2 Other current provisions include provisions for customer claims including metal returns net of scrap and pricing adjustments.
3 Other non-current provisions include amounts relating to the straight-lining of fixed rate increases in rental payments.
CONSOLIDATED
MAKE GOOD ON LEASED ASSETS OTHER TOTAL
$’000 $’000 $’000
Movements in carrying amounts
Carrying value at the beginning of the financial year 2,503 2,079 4,582
Provision utilised in the year (20) (3,295) (3,315)
Additional amounts provided 186 2,985 3,171
Carrying value at the end of the financial year 2,669 1,769 4,438
NOTES TO THE FINANCIAL STATEMENTS56F
or p
erso
nal u
se o
nly

CAPRAL ANNUAL REPORT 2017
20 DEFERRED INCOME – CURRENT
CONSOLIDATED
2017 $’000
2016 $’000
Deferred income – other 100 101
100 101
2017 2016 2017 2016
No. 000 No. 000 $’000 $’000
21 ISSUED CAPITAL
(A) SHARE CAPITALOrdinary shares: fully paid 477,107 474,685 425,744 425,744
Fully paid ordinary shares carry one vote per share and carry the right to dividends.
(B) MOVEMENT IN ORDINARY SHARE CAPITAL
DATE DETAILSNUMBER OF
SHARES ISSUE PRICE $’000
January 2016 Balance at the beginning of the financial year 474,684,577 – 425,744
December 2016 Balance at the end of the financial year 474,684,577 – 425,744
January 2017 Balance at the beginning of the financial year 474,684,577 – 425,744
Shares issued against performance rights 2,422,880 – –
December 2017 Balance at the end of the financial year 477,107,457 – 425,744
CONSOLIDATED
2017 $’000
2016 $’000
22 RESERVES AND ACCUMULATED LOSSESAsset revaluation reserve 1,014 221
Equity-settled compensation reserve 10,413 9,737
11,427 9,958
Accumulated losses (304,279) (310,430)
(292,852) (300,472)
NOTES TO THE FINANCIAL STATEMENTS 57F
or p
erso
nal u
se o
nly

CAPRAL ANNUAL REPORT 2017
CONSOLIDATED
2017 $’000
2016 $’000
(A) MOVEMENTS IN RESERVES WERE:Equity-settled compensation reserve
Balance at the beginning of the financial year 9,737 9,508
On market purchase of shares in respect of performance rights issue – (56)
Expense recognised 676 285
Balance at the end of the financial year 10,413 9,737
Asset revaluation reserve
Balance at the beginning of the financial year 221 221
Revaluation increase 793 –
Balance at the end of the financial year 1,014 221
(B) ACCUMULATED LOSSESBalance at the beginning of the financial year (310,430) (324,780)
Net profit attributable to members of Capral 12,085 14,350
Dividends paid (5,934) –
Balance at the end of the financial year (304,279) (310,430)
23 DIVIDENDSOrdinary shares: 5,934 –
FRANKING CREDITSFranking credits available for subsequent financial years based on a tax rate of 30% (2016:30%) 24,633 27,176
24 EARNINGS PER SHARE2017 Cents
2016 Cents
Basic earnings per share 2.54 3.02
Diluted earnings per share 2.45 2.94
Profit used in the calculation of basic and diluted profit per share for 2017 was $12,085,000 (2016: $14,350,000). The weighted average numbers of ordinary shares on issue used in the calculation of basic and diluted earnings per share were 476,669,347 and 493,768,430 respectively (2016: 474,684,577 and 488,838,355 respectively).
There are 18,458,123 performance rights (2016: 15,373,118 rights) and Nil options (2016: Nil options), with the potential to dilute future earnings at the end of the Financial Year.
NOTES TO THE FINANCIAL STATEMENTS58
22 RESERVES AND ACCUMULATED LOSSES CONTINUED
For
per
sona
l use
onl
y

CAPRAL ANNUAL REPORT 2017
CONSOLIDATED
2017 $’000
2016 $’000
25 STAND BY ARRANGEMENT AND CREDIT FACILITIESSECURED BANK LOAN FACILITIES
Amount used – –
Amount unused 50,000 60,000
Total available facilities 50,000 60,000
The Revolver facility with Harrenvale Corporation (Australia) Pty Ltd (previously GE Commercial Corporation (Australia) Pty Ltd) was cancelled in January 2017, as the Company entered into a new facility arrangement with Australia and New Zealand Banking Group Limited (ANZ).
The ANZ facility is for a term expiring on 31 January 2019 and is fully secured against the Capral group, consisting of:
» $45 million Multi-option Facility which includes a Loan Facility, Trade Instruments and Trade Finance;
» $5 million Asset Finance Facility;
» $0.5 million Commercial Card Facility.
26 COMMITMENTS FOR EXPENDITURE – CAPITALCommitments for the acquisition of plant and equipment contracted for at the reporting date but not recognised as liabilities payable:
Within one year 3,813 1,723
27 COMMITMENTS FOR EXPENDITURE – OPERATING LEASES
Commitments for minimum lease payments in relation to non-cancellable operating leases for office and plant premises are payable as follows:
Within one year 18,186 21,169
Later than one year but not later than five years 40,509 48,024
Later than five years 15,314 24,941
74,009 94,134
Operating leases relate to office and plant premises with lease terms of between 2 to 20 years, with options to extend for a further 3 to 10 years. The Group does not have an option to purchase the leased asset at the expiry of the lease period.
NON-CANCELLABLE OPERATING LEASE RECEIVABLEWithin one year 1,676 1,666
Later than one year but not later than five years 1,117 2,777
Later than five years – –
2,793 4,443
Operating lease receivables relate to the sublease of office and plant premises with an original lease term of 5 years, with an option to extend for a further term of around 5 years.
NOTES TO THE FINANCIAL STATEMENTS 59F
or p
erso
nal u
se o
nly

CAPRAL ANNUAL REPORT 2017
28 DEED OF CROSS GUARANTEEPursuant to ASIC Class Order 98/1418, the wholly owned subsidiary, Aluminium Extrusion and Distribution Pty Limited (AED) is relieved from the Corporations Act 2001 requirement for the preparation, audit and lodgement of financial reports.
It is a condition of that class order that the Company and AED enter into a Deed of Cross Guarantee (Deed). Under the Deed the Company guarantees the payment of all debts of AED in full, in the event of a winding up. AED in turn has guaranteed the payment of the debts of the Company in full in the event that it is wound up.
For the 2017 and 2016 financial years, the closed group represents the Company and its wholly owned Australian subsidiaries (except for Austex Dies Pty Limited).
CLOSED GROUP
2017 $’000
2016 $’000
STATEMENT OF PROFIT OR LOSS AND COMPREHENSIVE INCOME
Revenue 447,624 423,961
Other income 500 411
Changes in inventories of finished goods and work in progress 2,111 880
Raw materials and consumables used (272,129) (245,812)
Employee benefits expense (88,292) (86,086)
Depreciation and amortisation expense (5,588) (5,564)
Finance costs (971) (874)
Freight expense (11,423) (11,232)
Occupancy costs (20,100) (20,136)
Repairs and maintenance expense (6,839) (7,033)
Restructuring costs (192) (736)
Other expenses (33,639) (34,620)
Profit before income tax 11,062 13,159
Income tax expense – –
Profit for the year 11,062 13,159
Other comprehensive profit for the year (net of tax)
Revaluation increase – –
Total comprehensive profit for the year 11,062 13,159
SUMMARY OF MOVEMENTS IN ACCUMULATED LOSSES
Accumulated losses at the beginning of the year (314,014) (327,173)
Profit for the year 11,062 13,159
Payment of dividends (5,934) –
Accumulated losses at the end of the year (308,886) (314,014)
NOTES TO THE FINANCIAL STATEMENTS60F
or p
erso
nal u
se o
nly

CAPRAL ANNUAL REPORT 2017
CLOSED GROUP
2017 $’000
2016 $’000
STATEMENT OF FINANCIAL POSITIONCURRENT ASSETS
Cash and cash equivalents 34,093 30,985
Trade and other receivables 67,495 61,582
Inventories 77,207 75,499
Other financial assets 32 24
Prepayments 773 801
Total current assets 179,600 168,891
NON CURRENT ASSETS
Deferred tax assets 2,650 2,650
Investment in subsidiary 1,100 1,100
Property, plant and equipment 39,240 39,707
Other intangible assets 337 117
Total non current assets 43,327 43,574
Total assets 222,927 212,465
LIABILITIESCURRENT LIABILITIES
Trade and other payables 77,421 74,645
Borrowings – 48
Provisions 12,245 11,461
Deferred income 100 101
Total current liabilities 89,766 86,255
NON CURRENT LIABILITIES
Provisions 4,876 4,743
Total non current liabilities 4,876 4,743
Total liabilities 94,642 90,998
NET ASSETS 128,285 121,467
EQUITYIssued capital 425,744 425,744
Reserves 11,427 9,737
Accumulated losses (308,886) (314,014)
TOTAL EQUITY 128,285 121,467
NOTES TO THE FINANCIAL STATEMENTS 61F
or p
erso
nal u
se o
nly

CAPRAL ANNUAL REPORT 2017
29 FAIR VALUE MEASUREMENTSome of the Group’s assets and liabilities are measured at fair value at the end of each reporting period. The following table gives information about how the fair values of these assets and liabilities are determined (in particular, valuation technique(s) and input(s) used).
ASSETS / LIABILITIES
FAIR VALUE AS ATFAIR VALUE HIERARCHY
VALUATION TECHNIQUE(S) AND
KEY INPUT(S)
SIGNIFICANT UNOBSERVABLE
INPUT(S)
RELATIONSHIP OF UNOBSERVABLE
INPUT(S)31/12/17 31/12/16
Foreign currency forward contracts (see note 30(f))
Assets – nil
Liabilities – $431,7781
Assets – $473,0671
Liabilities – nil
Level 2 Discounted cash flow. Future cash flows are estimated based on forward exchange rate (from observable forward exchange rates at the end of the reporting period) and contract forward rates, discounted at a rate that reflects the credit risks of various counterparties.
n/a n/a
Land and buildings
Land – $1,200,000
Buildings – $3,144,000
Land – $1,200,000
Buildings – $2,412,000
Level 3 Capitalisation and Direct Comparison approaches.
Comparable market net rental and comparable market sales transactions.
The higher/(lower) the comparable market net rental amount and the higher/(lower) the comparable market sales transactions, the higher the fair value.
1 presented under Other Financial liabilities (2016: presented under Other Financial assets)
30 FINANCIAL INSTRUMENTS
(A) CAPITAL RISK MANAGEMENTThe Group manages its capital to ensure that entities in the Group will be able to continue as going concerns while maximising the return to stakeholders through the optimisation of the debt and equity balance.
The Group’s overall strategy remains unchanged from 2016.
The capital structure of the Group consists of debt, as disclosed in Note 25, cash and cash equivalents, and equity holders of the parent, comprising issued capital, reserves and accumulated losses, as disclosed in Notes 7, 21 and 22 respectively. The Directors review the capital structure on a regular basis, and at least annually. As a part of this review the Directors consider the cost of capital and the risks associated with each class of capital. Based on the determinations of the Directors, the Group will balance its overall capital structure through the payment of dividends, new share issues and share buy-backs as well as the issue of new debt or the redemption of existing debt.
The Group prepares monthly management accounts, comprising Balance Sheet, Profit and Loss Statement and Cash Flow Statement updates for the current financial year and the current year forecast. The forecast is used to monitor the Group’s capital structure and future capital requirements, taking into account future capital requirements and market conditions.
NOTES TO THE FINANCIAL STATEMENTS62F
or p
erso
nal u
se o
nly

CAPRAL ANNUAL REPORT 2017
The Group complied with its borrowing financial covenants under its current facility detailed in Note 25 as at 31 December 2017 as follows:
FINANCIAL COVENANT DESCRIPTION REQUIRED VALUE ACTUAL VALUE
EBITDA Interest Cover Ratio 3.00:1 27.89:1
Minimum Tangible Net Worth AUD 50.0m AUD 130.0m
Borrowing Base Ratio 0.80:1 0.34:1
Distributions AUD 11.3M AUD 5.9M
Security Cover Ratio 1.00:1 0.33:1
Inventory Cover Ratio 0.80:1 0.89:1
The Group complied with its borrowing financial covenants under its previous facility detailed in Note 25 as at 31 December 2016 as follows:
COVENANTS 2016 ACTUAL LIMIT/COVENANT HEADROOM
Net Tangible Worth ($'000) 121,698 Greater than 45,000 76,698
Capital Expenditure to Dec 16 ($'000) 3,316 Less than 6,500 3,184
Fixed Charge Coverage Ratio (ratio) 23.76 Greater than 1.1:1 22.66
(B) SIGNIFICANT ACCOUNTING POLICIES
Details of the significant accounting policies and methods adopted, including the criteria for recognition, the basis of measurement and the basis on which income and expenses are recognised, in respect of each class of financial asset, financial liability and equity instrument are disclosed in Note 1(c).
(C) CATEGORIES OF FINANCIAL INSTRUMENTS
CONSOLIDATED
2017 $’000
2016 $’000
FINANCIAL ASSETSLoans and receivables (including cash and cash equivalents) 102,317 94,519
Other financial assets1 32 24
FINANCIAL LIABILITIESAmortised cost 74,033 73,243
Other financial liabilities2 644 –
1 capitalised borrowing costs $32,000 (2016: $24,000).
2 foreign exchange contract mark-to-market and other financial liabilities.
NOTES TO THE FINANCIAL STATEMENTS 63F
or p
erso
nal u
se o
nly

CAPRAL ANNUAL REPORT 2017
(D) FINANCIAL RISK MANAGEMENT OBJECTIVESThe Group’s treasury function monitors and manages the financial risks relating to the operations of the Group through internal risk reports. These risks include market risk (including currency risk, interest rate risk and equity price risk), credit risk and liquidity risk. These risks are analysed below.
(E) MARKET RISKThe Group’s activities expose it primarily to the financial risks of changes in foreign currency exchange rates (refer note 30(f)) and interest rates (refer note 30(g)). From time to time, the Group enters into a variety of derivative financial instruments to manage its exposure to interest rate and foreign currency risk, including foreign exchange forward contracts to hedge the exchange rate risk arising on the purchase of aluminium log and rolled product from overseas in US dollars.
At a Group and Company level, market risk exposures are measured using a sensitivity analysis. There has been no material change to the Group’s exposure to market risks or the manner in which it manages and measures the risk during the Financial Year.
(F) FOREIGN CURRENCY RISK MANAGEMENTThe Group undertakes certain transactions in foreign currencies, resulting in exposures to exchange rate fluctuations. Exchange rate exposures are managed within approved policy parameters utilising forward foreign exchange contracts. It is the policy of the Group to enter into forward foreign exchange contracts from time to time to manage any material risk associated with anticipated foreign currency sales and purchase transactions.
The carrying amount of the Group’s and Company’s foreign currency denominated monetary assets and monetary liabilities at the reporting date is as follows:
CONSOLIDATED
2017 $’000
2016 $’000
USD (cash) 7,235 5,329
USD (trade payables) (12,428) (4,214)
EURO (trade receivables) 214 199
USD (trade receivables) 2,238 992
FOREIGN CURRENCY SENSITIVITYThe Group is exposed to EUR and USD (2016: EUR and USD).
In order to mitigate foreign currency risk at reporting date, the Group entered into foreign exchange forward contracts. The Group’s exposure to foreign exchange rate fluctuations was primarily limited to trade payables and trade receivables outstanding at reporting date denominated in currencies other than Australian dollar (AUD). The total value of trade payables denominated in currencies other than the AUD at reporting date was $14,945,000 (2016: $5,534,000). The total value of trade receivables denominated in currencies other than the AUD at reporting date was $2,870,000 (2016: $1,372,000).
The following table details the Group’s sensitivity to a 10% increase and decrease in the AUD against the relevant foreign currency. 10% represents management’s assessment of the possible change in foreign exchange rates. The sensitivity analysis includes only foreign currency denominated monetary items outstanding at 31 December 2017 and 31 December 2016 and adjusts their transla-tion at the period end for a 10% change in foreign currency rates. A positive number indicates an increase in profit.
NOTES TO THE FINANCIAL STATEMENTS64
30 FINANCIAL INSTRUMENTS CONTINUED
For
per
sona
l use
onl
y

CAPRAL ANNUAL REPORT 2017
CONSOLIDATED
2017 $’000
2016 $’000
Profit or loss (after tax)
– AUD strengthens by 10% against USD 1,240 779
– AUD weakens by 10% against USD (1,240) (779)
– AUD strengthens by 10% against EUR 33 25
– AUD weakens by 10% against EUR (33) (25)
FORWARD FOREIGN EXCHANGE CONTRACTSIt is the policy of the Group to enter into forward foreign exchange contracts to cover specific material foreign currency payments and receipts.
The following table details the forward foreign currency (FC) contracts outstanding at the end of the reporting period:
FOREIGN CURRENCY FAIR VALUE
OUTSTANDING CONTRACTS31/12/17
FC$’00031/12/16
FC$’000
31/12/17 $’000
Gain/(Loss)
31/12/16 $’000
Gain/(Loss)
Buy EUR 2,659 1,122 (35) 45
Buy USD 16,412 13,062 (397) (518)
(G) INTEREST RATE RISK MANAGEMENTThe Group interest rate risk arises from borrowings, cash and derivatives.
The Group is exposed to interest rate risk as the Group borrows funds at floating interest rates. Hedging activities are evaluated regularly to align with interest rate views and defined risk appetite, ensuring optimal hedging strategies are applied, by either positioning the balance sheet or protecting interest expense through different interest rate cycles. The Group’s exposure to interest rate risk at the reporting date was considered insignificant and as a result the Group did not enter into interest rate options.
The Group’s exposures to interest rates on financial assets and financial liabilities are detailed below.
INTEREST RATE SENSITIVITYThe sensitivity analysis below shows the effect on profit or loss after tax for the Financial Year if there is a change in interest rates with all other variables held constant. This is determined by applying the change in interest rates to both derivative and non-derivative instruments at the reporting date that have an exposure to interest rate changes. A 3 basis point (0.03%) increase and a 3 basis point (0.03%) decrease represents Management’s assessment of the possible change in interest rates (2016: 25bp or 0.25% increase and 25bp or 0.25% decrease). A positive number indicates an increase in profit.
CONSOLIDATED
2017 $’000
2016 $’000
PROFIT OR LOSS (AFTER TAX)Impact of a 3bp (2016: 25bp) increase in AUD interest rates
– Cash and cash equivalents 7 55
Impact of a 3bp (2016: 25bp) decrease in AUD interest rates
– Cash and cash equivalents (7) (55)
NOTES TO THE FINANCIAL STATEMENTS 65F
or p
erso
nal u
se o
nly
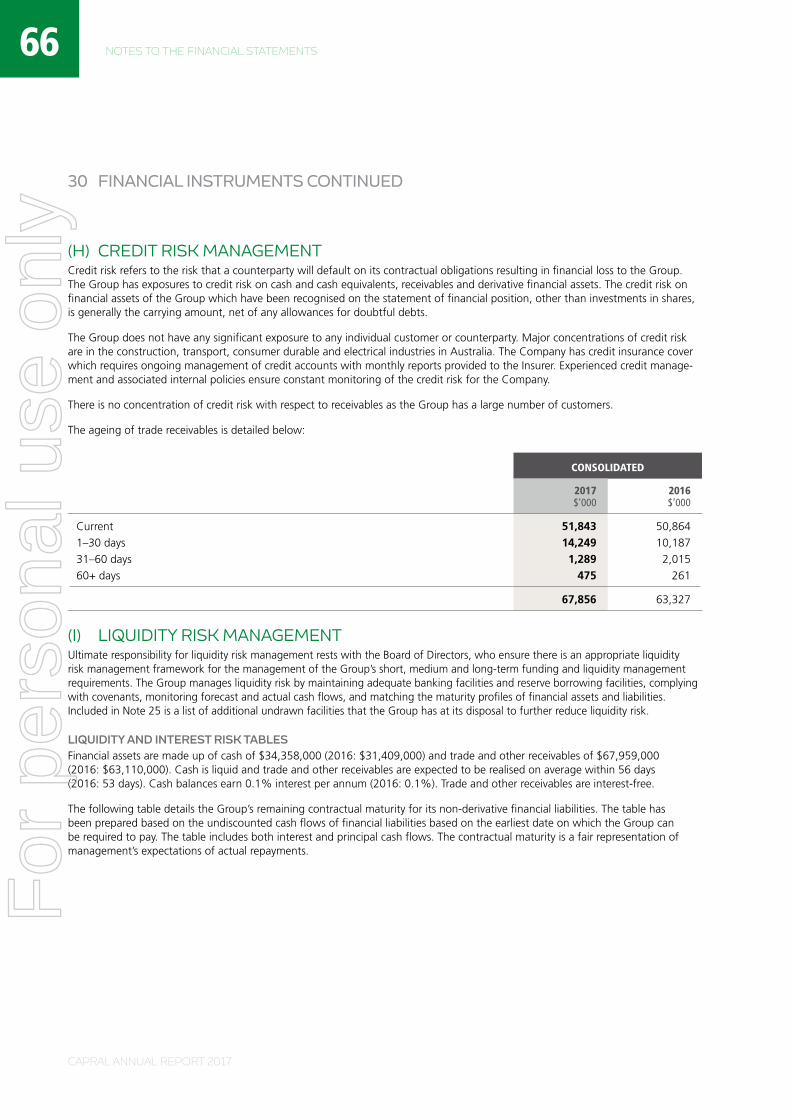
CAPRAL ANNUAL REPORT 2017
(H) CREDIT RISK MANAGEMENTCredit risk refers to the risk that a counterparty will default on its contractual obligations resulting in financial loss to the Group. The Group has exposures to credit risk on cash and cash equivalents, receivables and derivative financial assets. The credit risk on financial assets of the Group which have been recognised on the statement of financial position, other than investments in shares, is generally the carrying amount, net of any allowances for doubtful debts.
The Group does not have any significant exposure to any individual customer or counterparty. Major concentrations of credit risk are in the construction, transport, consumer durable and electrical industries in Australia. The Company has credit insurance cover which requires ongoing management of credit accounts with monthly reports provided to the Insurer. Experienced credit manage-ment and associated internal policies ensure constant monitoring of the credit risk for the Company.
There is no concentration of credit risk with respect to receivables as the Group has a large number of customers.
The ageing of trade receivables is detailed below:
CONSOLIDATED
2017 $’000
2016 $’000
Current 51,843 50,864
1–30 days 14,249 10,187
31–60 days 1,289 2,015
60+ days 475 261
67,856 63,327
(I) LIQUIDITY RISK MANAGEMENTUltimate responsibility for liquidity risk management rests with the Board of Directors, who ensure there is an appropriate liquidity risk management framework for the management of the Group’s short, medium and long-term funding and liquidity management requirements. The Group manages liquidity risk by maintaining adequate banking facilities and reserve borrowing facilities, complying with covenants, monitoring forecast and actual cash flows, and matching the maturity profiles of financial assets and liabilities. Included in Note 25 is a list of additional undrawn facilities that the Group has at its disposal to further reduce liquidity risk.
LIQUIDITY AND INTEREST RISK TABLESFinancial assets are made up of cash of $34,358,000 (2016: $31,409,000) and trade and other receivables of $67,959,000 (2016: $63,110,000). Cash is liquid and trade and other receivables are expected to be realised on average within 56 days (2016: 53 days). Cash balances earn 0.1% interest per annum (2016: 0.1%). Trade and other receivables are interest-free.
The following table details the Group’s remaining contractual maturity for its non-derivative financial liabilities. The table has been prepared based on the undiscounted cash flows of financial liabilities based on the earliest date on which the Group can be required to pay. The table includes both interest and principal cash flows. The contractual maturity is a fair representation of management’s expectations of actual repayments.
NOTES TO THE FINANCIAL STATEMENTS66
30 FINANCIAL INSTRUMENTS CONTINUED
For
per
sona
l use
onl
y

CAPRAL ANNUAL REPORT 2017
WEIGHTED AVERAGE EFFECTIVE
INTEREST RATELESS THAN
1 YEAR 1–3 YEARS 3–5 YEARS
GREATER THAN 5 YEARS
% $’000 $’000 $’000 $’000
CONSOLIDATED2017Trade and other payables – 74,033 – – –
Floating rate debt 2.94% – – – –
74,033 – – –
2016Trade and other payables – 73,136 – – –
Floating rate debt 4.18% – – – –
73,136 – – –
(J) FAIR VALUE OF FINANCIAL INSTRUMENTSThe fair values of financial assets, financial liabilities and derivative instruments are determined as follows:
(i) the fair value of financial assets and financial liabilities (excluding derivative instruments) are determined in accordance with generally accepted pricing models based on the discounted cash flow analysis using prices from observable market data; and
(ii) the fair value of derivative instruments are calculated using quoted prices. Where such prices are not available, the discounted cash flow analysis is employed using observable market data for non-option derivatives. For option derivatives, option pricing models are used with key inputs sourced from observable market data.
The Directors consider that the carrying amounts of financial assets and financial liabilities recorded at amortised cost in the financial statements approximate their fair values.
31 CONTINGENT LIABILITIESClaims and possible claims, indeterminable in amount, have arisen in the ordinary course of business against entities in the consolidated entity. The Company has fully provided for all known and determinable claims. Based on legal advice obtained, the Directors believe that any resulting liability will not materially affect the financial position of the consolidated entity.
The Company’s bankers have granted guarantees in respect of rental obligations on lease commitments, use of utilities infrastruc-ture and international trade facilities. At 31 December 2017 these guarantees totalled $3,782,684 (2016: $18,822,684).
NOTES TO THE FINANCIAL STATEMENTS 67F
or p
erso
nal u
se o
nly

CAPRAL ANNUAL REPORT 2017
32 REMUNERATION OF AUDITORS
CONSOLIDATED
2017 $
2016 $
During the year the auditor of the parent entity and its related practices earned the following remuneration:
AUDITOR OF THE PARENT ENTITYAudit or review of financial reports of the entity or any entity in the consolidated entity 285,000 285,000
Other non-audit services
– tax compliance 52,430 75,280
Total remuneration 337,430 360,280
It is the Group’s policy to employ the Company’s auditors, Deloitte Touche Tohmatsu, on assignments additional to their statutory duties where their expertise and experience is considered invaluable to the assignment.
33 EVENTS AFTER REPORTING DATENo matter or circumstance has arisen since the end of the Financial Year that has significantly affected, or may significantly affect the Group’s operations, the results of those operations or the Group’s state of affairs in future financial years.
34 NOTES TO THE CASH FLOW STATEMENT
(I) RECONCILIATION OF CASH AND CASH EQUIVALENTS
CONSOLIDATED
2017 $’000
2016 $’000
RECONCILIATION OF CASH AND CASH EQUIVALENTS
For the purposes of the Statement of Cash Flows, cash and cash equivalents includes cash on hand and at bank and short term deposits at call net of bank overdrafts. Cash as at the end of the financial year as shown in the Statement of Cash Flows is reconciled to the related items in the Statement of Financial Position as follows:
Cash at bank and on hand 34,358 31,409
34,358 31,409
NOTES TO THE FINANCIAL STATEMENTS68F
or p
erso
nal u
se o
nly

CAPRAL ANNUAL REPORT 2017
(II) RECONCILIATION OF PROFIT FOR THE YEAR TO NET CASH FLOWS FROM OPERATING ACTIVITIES
CONSOLIDATED
2017 $’000
2016 $’000
Profit for the year 12,085 14,350
NON-CASH ITEMS:Depreciation and amortisation of non-current assets 5,844 5,878
Loss on sale of property, plant and equipment – 1
Share-based payments expense 676 285
Interest expense accrued/(reversed) but not paid (50) 47
Interest income reclassified to investing activities (15) (16)
CHANGE IN ASSETS AND LIABILITIES:Increase in current receivables (4,849) (2,577)
Decrease/(increase) in financial assets 465 (473)
Increase in inventories (1,768) (9,051)
Decrease in prepayments 147 118
Increase in non-current receivables – 84
Increase in trade and other payables 897 6,809
Increase/(decrease) in employee benefit provisions 1,113 (11)
(Decrease)/increase in other provisions (144) 117
Decrease in deferred income (1) (6)
Increase in other financial liabilities 644 –
Net cash provided by operating activities 15,044 15,555
(III) DETAILS OF FINANCE FACILITIES ARE INCLUDED IN NOTE 25 TO THE FINANCIAL STATEMENTS
(IV) NON-CASH FINANCING ACTIVITIESThere were no non-cash financing activities during the Financial Year or the 2016 year.
NOTES TO THE FINANCIAL STATEMENTS 69F
or p
erso
nal u
se o
nly

CAPRAL ANNUAL REPORT 2017
COMPANY
35 PARENT ENTITY DISCLOSURES2017 $’000
2016 $’000
FINANCIAL POSITIONASSETS
Current assets – third parties 180,700 169,991
Total assets 218,692 210,617
LIABILITIES
Current liabilities – third parties 89,766 86,257
Total liabilities 98,939 94,300
EQUITY
Issued capital 425,744 425,744
Accumulated losses (317,417) (319,164)
Equity-settled compensation reserve 11,426 9,737
Total Equity 119,753 116,317
FINANCIAL PERFORMANCEProfit/(loss) for the year 11,062 13,159
Other comprehensive income – –
Total comprehensive profit/(loss) 11,062 13,159
GUARANTEES ENTERED INTO BY THE PARENT ENTITY IN RELATION TO THE DEBTS OF ITS SUBSIDIARIES
Deed of cross guarantee – refer Note 28 – –
CONTINGENT LIABILITIES OF THE PARENT ENTITYRefer note 31 – –
COMMITMENTS FOR THE ACQUISITION OF PROPERTY, PLANT AND EQUIPMENT BY THE PARENT ENTITY
Commitments for the acquisition of property, plant and equipment by the parent entity
Within one year 3,813 1,723
NOTES TO THE FINANCIAL STATEMENTS70F
or p
erso
nal u
se o
nly

CAPRAL ANNUAL REPORT 2017
36 SHARE-BASED PAYMENTS
PERFORMANCE SHARE RIGHTSEXECUTIVE AND SENIOR MANAGEMENTRefer to section 2 of the Remuneration Report for details of rights issued under the Long Term Incentive Plan.
The following share-based payment arrangements were in existence during the current reporting period:
PERFORMANCE RIGHT SERIES (LTIP)
NUMBER AS AT 31 DEC 17 GRANT DATE
LAST TESTING DATE
EXERCISE PRICE $
FAIR VALUE AT GRANT DATE
$
Issued 6 March 20151 1,875,000 06/03/2015 31/12/2017 – 0.13
Issued 6 March 20151 625,127 06/03/2015 31/12/2017 – 0.16
Issued 6 March 20151 624,746 06/03/2015 31/12/2017 – 0.16
Issued 7 March 20162 2,125,000 07/03/2016 31/12/2018 – 0.08
Issued 7 March 20162 2,125,000 07/03/2016 31/12/2018 – 0.10
Issued 10 March 20173 2,250,000 10/03/2017 31/12/2019 – 0.13
Issued 10 March 20173 2,250,000 10/03/2017 31/12/2019 – 0.15
1 In accordance with the terms of the LTIP arrangement, performance rights issued during the financial year ended 31 December 2015 have an average vesting date of 1 March 2018.
2 In accordance with the terms of the LTIP arrangement, performance rights issued during the financial year ended 31 December 2016 have an average vesting date of 1 March 2019.
3 In accordance with the terms of the LTIP arrangement, performance rights issued during the financial year ended 31 December 2017 have an average vesting date of 1 March 2020.
The following share-based payment arrangements were in existence during the comparative reporting period:
NUMBER AS AT 31 DEC 16 GRANT DATE
LAST TESTING DATE
EXERCISE PRICE $
FAIR VALUE AT GRANT DATE
$
Issued 7 March 20141 1,520,000 07/03/2014 31/12/2016 – 0.11
Issued 7 March 20141 760,000 07/03/2014 31/12/2016 – 0.15
Issued 7 March 20141 760,000 07/03/2014 31/12/2016 – 0.15
Issued 6 March 20152 1,950,000 06/03/2015 31/12/2017 – 0.13
Issued 6 March 20152 650,132 06/03/2015 31/12/2017 – 0.16
Issued 6 March 20152 649,736 06/03/2015 31/12/2017 – 0.16
Issued 7 March 20163 2,250,000 07/03/2016 31/12/2018 – 0.08
Issued 7 March 20163 2,250,000 07/03/2016 31/12/2018 – 0.10
1 In accordance with the terms of the LTIP arrangement, performance rights issued during the financial year ended 31 December 2013 have an average vesting date of 1 March 2016.
2 In accordance with the terms of the LTIP arrangement, performance rights issued during the financial year ended 31 December 2014 have an average vesting date of 1 March 2017.
3 In accordance with the terms of the LTIP arrangement, performance rights issued during the financial year ended 31 December 2015 have an average vesting date of 1 March 2018.
NOTES TO THE FINANCIAL STATEMENTS 71F
or p
erso
nal u
se o
nly

CAPRAL ANNUAL REPORT 2017
PERFORMANCE RIGHTS (LTIP)
INPUTS INTO THE MODEL 10 MARCH 2017 07 MARCH 2016 06 MARCH 2015 07 MARCH 2014
Grant date 10/03/2017 7/03/2016 6/03/2015 7/03/2014
Dividend yield 5.7% 0% 0% 0%
Risk free yield 2.14% 1.90% 1.82% 2.93%
Expected volatility 60% 55% 55% 55%
Last testing date 31/12/2019 31/12/2018 31/12/2017 31/12/2016
Exercise price n.a n.a n.a n.a
Share price at grant date $0.18 $0.10 $0.16 $0.15
Performance right life 3 years 3 years 3 years 3 years
MANAGING DIRECTORDuring the Financial Year, 2,000,000 rights were issued to Mr A. Dragicevich.
During the comparative financial year, 2,500,000 rights were issued to Mr A. Dragicevich.
The following rights were in existence during the current reporting period, subject to the achievement of performance conditions and have been independently valued as follows:
SHARE RIGHTSNUMBER AS AT
31 DEC 17 GRANT DATELAST TESTING
DATEEXERCISE PRICE
$
FAIR VALUE AT GRANT DATE
$
Issued 16 April 20151 1,250,000 16/04/2015 31/12/2017 – $0.13
Issued 16 April 20151 416,750 16/04/2015 31/12/2017 – $0.16
Issued 16 April 20151 416,500 16/04/2015 31/12/2017 – $0.16
Issued 14 April 20162 1,250,000 14/04/2016 31/12/2018 – $0.08
Issued 14 April 20162 1,250,000 14/04/2016 31/12/2018 – $0.11
Issued 11 May 20173 1,000,000 11/05/2017 31/12/2019 – $0.07
Issued 11 May 20173 1,000,000 11/05/2017 31/12/2019 – $0.11
1 In accordance with the terms of the LTIP arrangement, performance rights issued during the Financial Year ended 31 December 2015 have an average vesting date of 1 March 2018.
2 In accordance with the terms of the LTIP arrangement, performance rights issued during the Financial Year ended 31 December 2016 have an average vesting date of 1 March 2019.
3 In accordance with the terms of the LTIP arrangement, performance rights issued during the Financial Year ended 31 December 2017 have an average vesting date of 1 March 2020.
NOTES TO THE FINANCIAL STATEMENTS72
36 SHARE-BASED PAYMENTS CONTINUED
For
per
sona
l use
onl
y
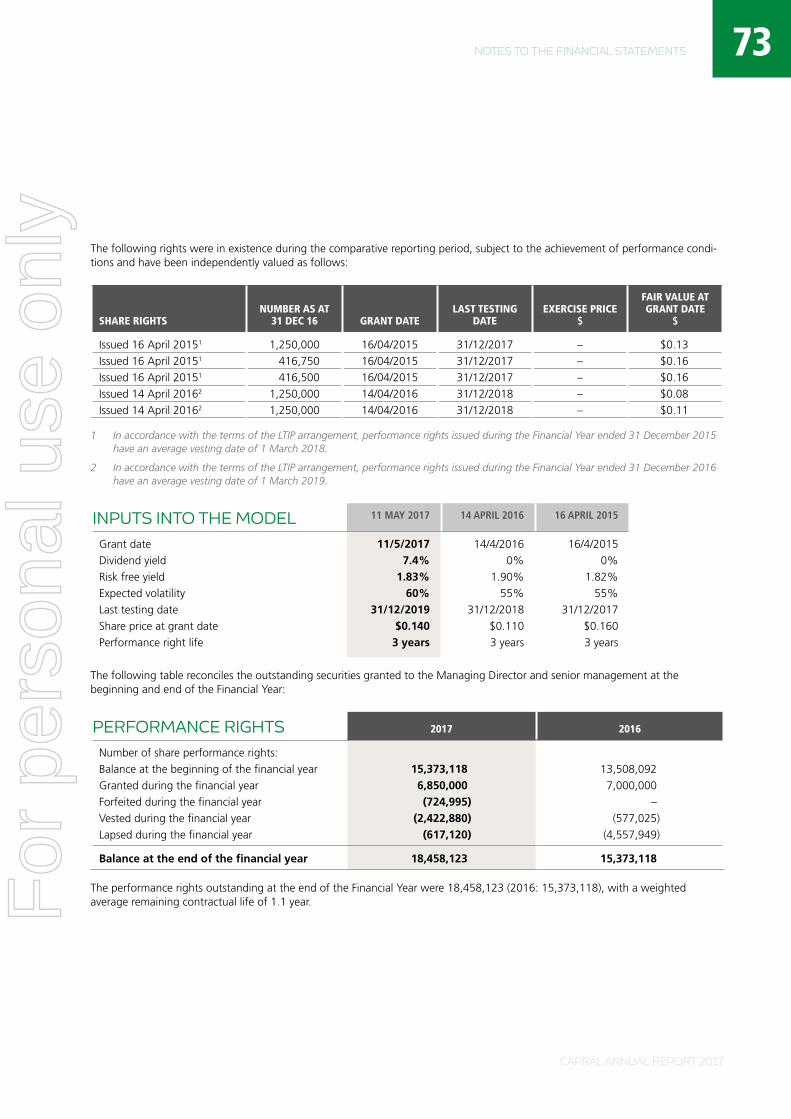
CAPRAL ANNUAL REPORT 2017
The following rights were in existence during the comparative reporting period, subject to the achievement of performance condi-tions and have been independently valued as follows:
SHARE RIGHTSNUMBER AS AT
31 DEC 16 GRANT DATELAST TESTING
DATEEXERCISE PRICE
$
FAIR VALUE AT GRANT DATE
$
Issued 16 April 20151 1,250,000 16/04/2015 31/12/2017 – $0.13
Issued 16 April 20151 416,750 16/04/2015 31/12/2017 – $0.16
Issued 16 April 20151 416,500 16/04/2015 31/12/2017 – $0.16
Issued 14 April 20162 1,250,000 14/04/2016 31/12/2018 – $0.08
Issued 14 April 20162 1,250,000 14/04/2016 31/12/2018 – $0.11
1 In accordance with the terms of the LTIP arrangement, performance rights issued during the Financial Year ended 31 December 2015 have an average vesting date of 1 March 2018.
2 In accordance with the terms of the LTIP arrangement, performance rights issued during the Financial Year ended 31 December 2016 have an average vesting date of 1 March 2019.
INPUTS INTO THE MODEL 11 MAY 2017 14 APRIL 2016 16 APRIL 2015
Grant date 11/5/2017 14/4/2016 16/4/2015
Dividend yield 7.4% 0% 0%
Risk free yield 1.83% 1.90% 1.82%
Expected volatility 60% 55% 55%
Last testing date 31/12/2019 31/12/2018 31/12/2017
Share price at grant date $0.140 $0.110 $0.160
Performance right life 3 years 3 years 3 years
The following table reconciles the outstanding securities granted to the Managing Director and senior management at the beginning and end of the Financial Year:
PERFORMANCE RIGHTS 2017 2016
Number of share performance rights:
Balance at the beginning of the financial year 15,373,118 13,508,092
Granted during the financial year 6,850,000 7,000,000
Forfeited during the financial year (724,995) –
Vested during the financial year (2,422,880) (577,025)
Lapsed during the financial year (617,120) (4,557,949)
Balance at the end of the financial year 18,458,123 15,373,118
The performance rights outstanding at the end of the Financial Year were 18,458,123 (2016: 15,373,118), with a weighted average remaining contractual life of 1.1 year.
NOTES TO THE FINANCIAL STATEMENTS 73F
or p
erso
nal u
se o
nly

CAPRAL ANNUAL REPORT 2017
37 KEY MANAGEMENT PERSONNEL COMPENSATIONThe aggregate compensation made to directors and other members of key management personnel of the Company and the Group is set out below:
CONSOLIDATED/COMPANY
2017 $
2016 $
Short-term benefits 2,214,944 2,813,844
Post-employment benefits 154,809 151,281
Other long-term benefits – –
Termination benefits – –
Share-based payments 368,643 146,925
2,738,396 3,112,050
38 COMPARATIVE FIGURESComparative figures have been reclassified as follows:
CONSOLIDATED
2017 $’000
2016 $’000
Inventories – 1,239
Prepayments – (1,239)
– –
The above restatement was to reclassify the balance of un-amortised dies costs as inventories, instead of previously prepayments. Due to the nature of dies being consumed in the production process, this classification is consistent with AASB102.
Inventories – (2,917)
Property, plant and equipment – 2,917
– –
The above restatement was to reclassify the balance of un-amortised spare parts as property, plant and equipment, instead of previously inventories. Since spare parts are generally held for maintenance activities for production and the economic benefits are expected in more than one period, this classification is consistent with AASB116.
Occupancy costs – (3,684)
Other expenses – 3,684
– –
The above restatement was to reclassify various site costs to Occupancy costs, instead of previously Other expenses.
NOTES TO THE FINANCIAL STATEMENTS74F
or p
erso
nal u
se o
nly

CAPRAL ANNUAL REPORT 2017
The directors declare that:
(a) in the directors’ opinion, there are reasonable grounds to believe that Capral will be able to pay its debts as and when they become due and payable;
(b) in the directors’ opinion, the attached financial statements and notes thereto are in accordance with the Corporations Act 2001, including compliance with accounting standards and giving a true and fair view of the financial position and performance of Capral and the consolidated entity;
(c) in the directors’ opinion, the financial statements and notes thereto are in accordance with International Financial Reporting Standards issued by the International Accounting Standards Board; and
(d) the directors have been given declarations required by section 295A of the Corporations Act 2001.
At the date of this declaration, Capral is within the class of companies affected by ASIC Class Order 98/1418. The nature of the deed of cross guarantee is such that each company which is party to the deed, guarantees to each creditor payment in full of any debt in accordance with the deed of cross guarantee.
In the directors’ opinion there are reasonable grounds to believe that Capral and the companies to which the ASIC Class Order applies, as detailed in Note 28 to the financial statements will, as a group, be able to meet any obligations or liabilities to which they are, or may become, subject by virtue of the deed of cross guarantee.
Signed in accordance with a resolution of the directors made pursuant to section 295(5) of the Corporations Act 2001.
On behalf of the directors
R. L. WOOD-WARD A. M. DRAGICEVICHChairman Managing Director
Sydney 23 February 2018
DIRECTORS’ DECLARATION
DIRECTORS’ DECLARATION 75F
or p
erso
nal u
se o
nly
CAPRAL ANNUAL REPORT 2017
INDEPENDENT AUDITOR’S REPORT
INDEPENDENT AUDITOR’S REPORT76
INDEPENDENT AUDITOR’S REPORT TO THE MEMBERS OF CAPRAL LIMITED
REPORT ON THE AUDIT OF THE FINANCIAL REPORTWe have audited the financial report of Capral Limited (the Company) and its subsidiaries (the Group) which comprises the consolidated statement of financial position as at 31 December 2017, the consolidated statement of profit or loss and other comprehensive income, the consolidated statement of changes in equity and the consolidated statement of cash flows for the year then ended, and notes to the financial statements, including a summary of significant accounting policies and other explanatory information, and the directors’ declaration.
In our opinion, the accompanying financial report of the Group is in accordance with the Corporations Act 2001, including:
(i) giving a true and fair view of the Group’s financial position as at 31 December 2017 and of its financial performance for the year then ended; and
(ii) complying with Australian Accounting Standards and the Corporations Regulations 2001.
BASIS FOR OPINION We conducted our audit in accordance with Australian Auditing Standards. Our responsibilities under those standards are further described in the Auditor’s Responsibilities for the Audit of the Financial Report section of our report. We are independent of the Group in accordance with the auditor independence requirements of the Corporations Act 2001 and the ethical requirements of the Accounting Professional and Ethical Standards Board’s APES 110 Code of Ethics for Professional Accountants (the Code) that are relevant to our audit of the financial report in Australia. We have also fulfilled our other ethical responsibilities in accordance with the Code.
We confirm that the independence declaration required by the Corporations Act 2001, which has been given to the directors of the Company, would be in the same terms if given to the directors as at the time of this auditor’s report.
We believe that the audit evidence we have obtained is sufficient and appropriate to provide a basis for our opinion.
KEY AUDIT MATTERS Key audit matters are those matters that, in our professional judgement, were of most significance in our audit of the financial report for the current period. These matters were addressed in the context of our audit of the financial report as a whole, and in forming our opinion thereon, and we do not provide a separate opinion on these matters.
Deloitte Touche TohmatsuABN 74 490 121 060
Eclipse TowerLevel 1960 Station StreetParramatta NSW 2150PO Box 38Parramatta NSW 2124 Australia
DX 28485Tel: +61 (0) 2 9840 7000Fax: +61 (0) 2 9840 7001www.deloitte.com.au
Member of Deloitte Touche Tohmatsu Limited. Liability limited by a scheme approved under Professional Standards Legislation
For
per
sona
l use
onl
y
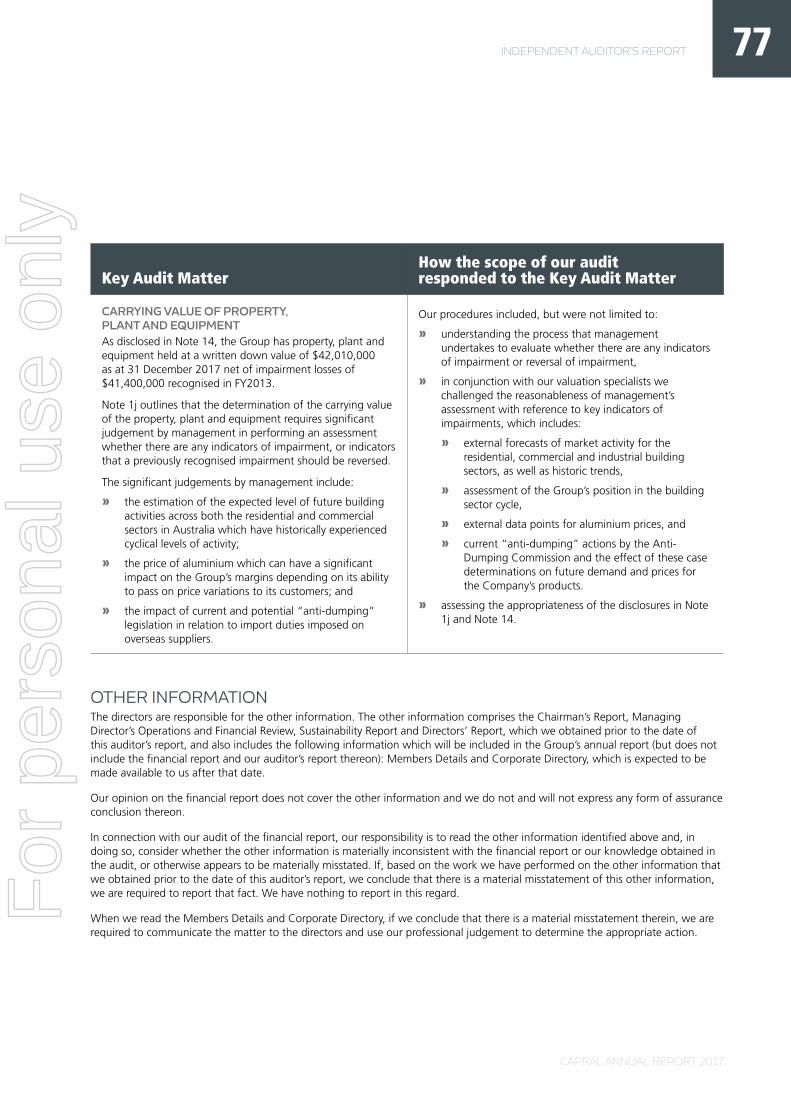
CAPRAL ANNUAL REPORT 2017
Key Audit Matter How the scope of our audit responded to the Key Audit Matter
CARRYING VALUE OF PROPERTY, PLANT AND EQUIPMENTAs disclosed in Note 14, the Group has property, plant and equipment held at a written down value of $42,010,000 as at 31 December 2017 net of impairment losses of $41,400,000 recognised in FY2013.
Note 1j outlines that the determination of the carrying value of the property, plant and equipment requires significant judgement by management in performing an assessment whether there are any indicators of impairment, or indicators that a previously recognised impairment should be reversed.
The significant judgements by management include:
» the estimation of the expected level of future building activities across both the residential and commercial sectors in Australia which have historically experienced cyclical levels of activity;
» the price of aluminium which can have a significant impact on the Group’s margins depending on its ability to pass on price variations to its customers; and
» the impact of current and potential “anti-dumping” legislation in relation to import duties imposed on overseas suppliers.
Our procedures included, but were not limited to:
» understanding the process that management undertakes to evaluate whether there are any indicators of impairment or reversal of impairment,
» in conjunction with our valuation specialists we challenged the reasonableness of management’s assessment with reference to key indicators of impairments, which includes:
» external forecasts of market activity for the residential, commercial and industrial building sectors, as well as historic trends,
» assessment of the Group’s position in the building sector cycle,
» external data points for aluminium prices, and
» current “anti-dumping” actions by the Anti-Dumping Commission and the effect of these case determinations on future demand and prices for the Company’s products.
» assessing the appropriateness of the disclosures in Note 1j and Note 14.
OTHER INFORMATION The directors are responsible for the other information. The other information comprises the Chairman’s Report, Managing Director’s Operations and Financial Review, Sustainability Report and Directors’ Report, which we obtained prior to the date of this auditor’s report, and also includes the following information which will be included in the Group’s annual report (but does not include the financial report and our auditor’s report thereon): Members Details and Corporate Directory, which is expected to be made available to us after that date.
Our opinion on the financial report does not cover the other information and we do not and will not express any form of assurance conclusion thereon.
In connection with our audit of the financial report, our responsibility is to read the other information identified above and, in doing so, consider whether the other information is materially inconsistent with the financial report or our knowledge obtained in the audit, or otherwise appears to be materially misstated. If, based on the work we have performed on the other information that we obtained prior to the date of this auditor’s report, we conclude that there is a material misstatement of this other information, we are required to report that fact. We have nothing to report in this regard.
When we read the Members Details and Corporate Directory, if we conclude that there is a material misstatement therein, we are required to communicate the matter to the directors and use our professional judgement to determine the appropriate action.
INDEPENDENT AUDITOR’S REPORT 77F
or p
erso
nal u
se o
nly

CAPRAL ANNUAL REPORT 2017
DIRECTORS’ RESPONSIBILITIES FOR THE FINANCIAL REPORT The directors of the Company are responsible for the preparation of the financial report that gives a true and fair view in accord-ance with Australian Accounting Standards and the Corporations Act 2001 and for such internal control as the directors determine is necessary to enable the preparation of the financial report that gives a true and fair view and is free from material misstatement, whether due to fraud or error.
In preparing the financial report, the directors are responsible for assessing the ability of the Group to continue as a going concern, disclosing, as applicable, matters related to going concern and using the going concern basis of accounting unless the directors either intend to liquidate the Group or to cease operations, or has no realistic alternative but to do so.
AUDITOR’S RESPONSIBILITIES FOR THE AUDIT OF THE FINANCIAL REPORT Our objectives are to obtain reasonable assurance about whether the financial report as a whole is free from material misstate-ment, whether due to fraud or error, and to issue an auditor’s report that includes our opinion. Reasonable assurance is a high level of assurance, but is not a guarantee that an audit conducted in accordance with the Australian Auditing Standards will always detect a material misstatement when it exists. Misstatements can arise from fraud or error and are considered material if, individu-ally or in the aggregate, they could reasonably be expected to influence the economic decisions of users taken on the basis of this financial report.
As part of an audit in accordance with the Australian Auditing Standards, we exercise professional judgement and maintain profes-sional scepticism throughout the audit. We also:
» Identify and assess the risks of material misstatement of the financial report, whether due to fraud or error, design and perform audit procedures responsive to those risks, and obtain audit evidence that is sufficient and appropriate to provide a basis for our opinion. The risk of not detecting a material misstatement resulting from fraud is higher than for one resulting from error, as fraud may involve collusion, forgery, intentional omissions, misrepresentations, or the override of internal control.
» Obtain an understanding of internal control relevant to the audit in order to design audit procedures that are appropriate in the circumstances, but not for the purpose of expressing an opinion on the effectiveness of the Group’s internal control.
» Evaluate the appropriateness of accounting policies used and the reasonableness of accounting estimates and related disclosures made by the directors.
» Conclude on the appropriateness of the directors’ use of the going concern basis of accounting and, based on the audit evidence obtained, whether a material uncertainty exists related to events or conditions that may cast significant doubt on the Group’s ability to continue as a going concern. If we conclude that a material uncertainty exists, we are required to draw attention in our auditor’s report to the related disclosures in the financial report or, if such disclosures are inadequate, to modify our opinion. Our conclusions are based on the audit evidence obtained up to the date of our auditor’s report. However, future events or conditions may cause the Group to cease to continue as a going concern.
» Evaluate the overall presentation, structure and content of the financial report, including the disclosures, and whether the financial report represents the underlying transactions and events in a manner that achieves fair presentation.
We communicate with the directors regarding, among other matters, the planned scope and timing of the audit and significant audit findings, including any significant deficiencies in internal control that we identify during our audit.
We also provide the directors with a statement that we have complied with relevant ethical requirements regarding independence, and to communicate with them all relationships and other matters that may reasonably be thought to bear on our independence, and where applicable, related safeguards.
From the matters communicated with the directors, we determine those matters that were of most significance in the audit of the financial report of the current period and are therefore the key audit matters. We describe these matters in our auditor’s report unless law or regulation precludes public disclosure about the matter or when, in extremely rare circumstances, we determine that a matter should not be communicated in our report because the adverse consequences of doing so would reasonably be expected to outweigh the public interest benefits of such communication.
INDEPENDENT AUDITOR’S REPORT78F
or p
erso
nal u
se o
nly

CAPRAL ANNUAL REPORT 2017
REPORT ON THE REMUNERATION REPORTOPINION ON THE REMUNERATION REPORTWe have audited the Remuneration Report included in pages 14 to 31 of the Directors’ Report for the year ended 31 December 2017.
In our opinion, the Remuneration Report of Capral Limited, for the year ended 31 December 2017, complies with section 300A of the Corporations Act 2001.
RESPONSIBILITIES The directors of the Company are responsible for the preparation and presentation of the Remuneration Report in accordance with section 300A of the Corporations Act 2001. Our responsibility is to express an opinion on the Remuneration Report, based on our audit conducted in accordance with Australian Auditing Standards.
DELOITTE TOUCHE TOHMATSU
David White Partner Chartered Accountants Parramatta, 23 February 2018
INDEPENDENT AUDITOR’S REPORT 79F
or p
erso
nal u
se o
nly

CAPRAL ANNUAL REPORT 2017
80 MEMBER DETAILS
MEMBER DETAILS(In accordance with the Listing Rules:)
1 TWENTY LARGEST HOLDERSDetails of Capral’s twenty largest shareholders were as follows:
NO. NAME OF HOLDERNO. OF
SHARES HELDISSUED CAPITAL
HELD (%)
1 HSBC Custody Nominees (Australia) Limited 116,203,667 24.36
2 Citicorp Nominees Pty Limited 71,516,976 14.99
3 J P Morgan Nominees Australia Limited 52,056,178 10.91
4 BNP Paribas Noms Pty Ltd – DRP 16,542,186 3.47
5 National Nominees Limited 12,011,241 2.52
6 BNP Paribas Nominees Pty Ltd – Agency Lending DRP Account 11,686,084 2.45
7 Bainpro Nominees Pty Limited 6,622,075 1.39
8 Brazil Farming Pty Ltd 6,000,000 1.26
9 Luton Pty Ltd 5,133,905 1.08
10 Mr Anthony Matthew Dragicevich 4,250,000 0.89
11 Mr John George Whiting & Mrs Diana Patricia Whiting – The Whiting Investment Account
4,000,000 0.84
12 Aust Executor Trustees Ltd – Kentgrove Capital Fund 3,900,000 0.82
13 AGO Pty Ltd – Superannuation Fund Account 3,154,956 0.66
14 Southern Steel Investments Pty Limited 3,000,000 0.63
15 Debuscey Pty Ltd 2,540,604 0.53
16 Mr Gerald Francis Pauley & Mr Michael James Pauley – Pauley Super Fund Account 2,370,712 0.50
17 Mr Andrew Roy Newbery Sisson 2,350,000 0.49
18 Grantully Investments Pty Limited 2,065,000 0.43
19 BNP Paribas Nominees Pty Ltd – IB AU Noms Retail Client DRP 2,058,907 0.43
20 Mrs Glenda Claire Orgill 2,046,003 0.43
Total 329,508,494 69.06
AS AT 28 FEBRUARY 2018
For
per
sona
l use
onl
y

CAPRAL ANNUAL REPORT 2017
MEMBER DETAILS 81
2 SUBSTANTIAL SHAREHOLDERSSubstantial shareholders as notified to Capral in accordance with the Corporations Act 2001:
NAME NO. OF SHARES% OF SHARES
HELD AS NOTIFIED ON
Allan Gray Australia 89,675,039 18.89 23/3/2015
Perpetual Limited 69,863,006 14.72 24/2/2016
Commonwealth Bank of Australia 42,522,525 8.91 7/7/2017
Schroder Investment Management Australia 25,082,934 5.26 2/8/2017
Total 236,143,504 47.78
3 NUMBER OF HOLDERS(a) Quoted equity securities: There were 2,084 holders of ordinary shares.
(b) Unquoted equity securities – options: There were Nil unquoted options.
(c) Unquoted equity securities – performance rights: There were 18,458,123 unquoted performance rights issued to 17 holders under the Capral Long Term Incentive Plan. There is 1 holder who holds 20% or more performance rights under this plan.
4 VOTING RIGHTS(a) Voting rights attaching to the fully paid ordinary shares are, on a show of hands, one vote per person present as a member
proxy, attorney, or representative thereof and on a poll, one vote per share for every member present in person or by proxy or by attorney or by representative.
(b) Holders of options and performance rights do not have any voting rights on the equity securities held by them. Ordinary shares issued on exercise of options or vesting of performance rights will carry the same voting rights as all other fully paid ordinary shares of Capral.
5 DISTRIBUTION OF EQUITY SECURITIES
(A) QUOTED ORDINARY SHARES
RANGE OF SHARES NUMBER OF HOLDERS
1–1,000 344
1,001–5,000 316
5,001–10,000 250
10,001–100,000 843
100,001 and over 331
Total 2,084For
per
sona
l use
onl
y

CAPRAL ANNUAL REPORT 2017
82 MEMBER DETAILS
B) UNQUOTED PERFORMANCE RIGHTSPerformance rights granted under the Capral Long Term Incentive Plan (including to the Managing Director) with various vesting and expiry dates and a nil exercise price:
RANGE OF RIGHTS NUMBER OF HOLDERS
1–1,000 0
1,001–5,000 0
5,001–10,000 0
10,001–100,000 1
100,001 and over 16
Total 17
6 MARKETABLE PARCELSThe number of shareholders holding less than a marketable parcel* of shares is 456 holders.
(* Minimum parcel size of shares: 2,942)
7 ON-MARKET BUY BACKThere is no current on-market buy back.
For
per
sona
l use
onl
y

CAPRAL’S REGISTERED OFFICE71 Ashburn Road, Bundamba, QLD 4304 Telephone: +61 (0)7 3816 7000
CAPRAL’S PRINCIPAL ADMINISTRATION OFFICE/INVESTOR ENQUIRIESLevel 4, 60 Phillip Street, Parramatta, NSW 2150 Telephone: +61 (0)2 9682 0710 Email: [email protected]
SHARE REGISTRYCOMPUTERSHARE INVESTOR SERVICES PTY LIMITED ABN 48 078 279 277Level 2, 60 Carrington Street, Sydney NSW 2000 Telephone: 1800 855 080 Fax: +61 (0)3 9473 2118
AUDITORDELOITTE TOUCHE TOHMATSU ABN 74 490 121 060Eclipse Tower, Level 19, 60 Station Street, Parramatta NSW 2150
SECURITIES EXCHANGE LISTINGCapral’s shares are quoted on the Australian Securities Exchange (Code: CAA).
COMPANY SECRETARYMr Richard Rolfe
CORPORATE GOVERNANCE STATEMENTHTTP://WWW.CAPRAL.COM.AU/ – under Corporate / Investors / Corporate Governance
83CORPORATE DIRECTORY
CORPORATE DIRECTORY
CAPRAL ANNUAL REPORT 2017
For
per
sona
l use
onl
y

Capral LimitedABN 78 004 213 692
71 Ashburn Road, Bundamba, QLD 4304 T 07 3816 7000 | F 07 3816 7111
www.capral.com.au
For
per
sona
l use
onl
y