for personal use only - asx · 2016-03-31 · forward to your continued support over the next 12...
TRANSCRIPT

Y P B G R O U P L T D
2 0 1 5 A N N U A L R E P O R T
1
For
per
sona
l use
onl
y

Contents Chairman’s Letter .................................................................................................................................... 3
Chief Executive Officer's Report………………………………………………………………………………. 4 Directors’ Report ..................................................................................................................................... 6
Auditor’s Independence Declaration ..................................................................................................... 16
Financial Report .................................................................................................................................... 17
Directors’ Declaration ............................................................................................................................ 54
Independent Auditor’s Report ............................................................................................................... 55
Shareholder Information ........................................................................................................................ 57
Corporate Directory ............................................................................................................................... 59
2
For
per
sona
l use
onl
y

Chairman’s Letter Letter from the Chairman Dear fellow shareholders, It is my pleasure to present the 2015 Annual Report for YPB Group Limited. It was for YPB a year of exciting growth in our technology portfolio, capabilities and distribution, culminating at year-end with the creation of what we believe to be the world’s first end-to-end ‘Protect, Detect and Connect’ solution. YPB protects brands and connects them with their consumers around product authenticity. We are proud to be taking a stance against the scourge of counterfeiting, which has now become a US$1.7 trillion industry. I strongly believe that YPB’s future is very bright based on the foundations we laid in 2015. During 2015 we made key acquisitions including in Australia proximity marketing business nTouch, leading security consultancy IPP Group in Thailand and in the US print management company Continuous Forms Control. I am proud and happy to say that they are all now fully integrated under the YPB umbrella, and each one is making important contributions towards our unique capabilities and our revenue platform. Additionally we entered into a binding agreement to acquire Motif Micro Inc., and have more recently entered into a Joint Venture with Affyrmx for the supply of Government security documents in Latin America. YPB has progressed from a China-centric tracer and scanner provider at IPO, to a world leading end-to-end solution provider with important consumer connect technologies and distribution now in China, south-east Asia, Australia, USA and Mexico. We also have significantly strengthened our management team during the year, and I am very pleased to have recently overseen Mr. Jens Michel’s promotion to CEO. It is my intention to remain totally committed to YPB in my role as Executive Chairman and work closely with Jens Michel, not only supporting him operationally but also placing more focus on our investor relations capabilities. I would like to thank our dedicated staff, my fellow Board members and our shareholders for their support of YPB, and look forward to that continuing over the next 12 months and beyond as we continue to grow YPB.
John Houston Executive Chairman
3
For
per
sona
l use
onl
y

Chief Executive Officer’s Report It is with much pleasure that as the recently appointed CEO I present my first Annual Report for YPB Group Limited, a pioneer in brand protection and anti-counterfeit solutions, connecting global brands with consumers while providing the certainty of product authenticity. The 2015 year was full of key milestones for YPB, transforming the business from a China-centric single product company to the world’s first end-to-end solution provider of brand protection, giving YPB its ability to protect, detect and connect brands and consumers. During 2015 we made key acquisitions including:
• Proximity marketing business nTouch • World-leading security and IP consultancy IPP Group, based in Thailand
and USA • Print integration company CFC, based in Los Angeles • Additionally we entered into a binding Letter of Intent to acquire Motif
Micro and its embedded micro barcode technology, which will be developed into smartphone-readable technology over the next year.
We have also developed a significant distribution footprint in Australia, South East Asia, USA and Latin America, with an enviable list of clients that includes a number of Fortune 500 companies, government departments and agencies that we will continue to expand upon during 2016 and onwards. With the successful integration of all 2015 acquisitions, we have developed a unique value proposition for brand owners and governments with an outstanding global foundation for future revenue growth. As we continue to invest into our research, development and marketing to exploit YPB’s outstanding platform and geographic presence, we have delivered key revenue-generating milestones in 2015 that will further underpin our run rate for 2016 and set a strong path of growth in the future. YPB now generates revenues from the two largest economies in the world, the USA and China, with the latter generating significant traction. Key commercial highlights for 2015 to date include:
• Signed Hicap and Shensaier supply contracts, which are budgeted to deliver a total of A$26m over the next 4-5 years
• Awarded contract to supply Chinese Government access passes and temporary entry permits for Palace Museum
• Signed first contract to protect Chinese Government ‘fapiaos’ (tax invoices). YPB has delivered more than 14 million tax invoices to date, with future potential to deliver approximately A$40m in revenues
• Signed contract to protect consumer foods packaging in China, having so far delivered 270 million anti-counterfeit food labels, with potential to grow to 600 million in 2016
4
For
per
sona
l use
onl
y

• Signed agreement with China Feather and Down Industrial Association (CFDIA) – 1.2 million labels delivered in 2015
• Delivered more than 300,000 bank deposit certificates for one of the largest regional banks in China
• Security passes for the People’s Procuratorate of Beijing Municipality • Three-year supply contract with a major US footwear brand to
incorporate anti-counterfeit technology into more than 70% of its annual production of 48 million pairs of shoes
For the 12 months ended 31 December 2015 we recorded net income of $1.7 million and Net EBITDA of $(5.6) million, with a cash balance of $2.9 million. The Chinese Government is aware that the United Nations has identified China as accounting for more than 70% of global counterfeit trade. As a result there is an increasing focus on counterfeit trade, with National and Local government agencies and industry alike moving to protect the consumers from exposure to counterfeit products. Given the enormous potential of global anti-counterfeit markets, we have clearly defined our sources of business. In 2016, we will execute our annual operating plan that has developed strategies for each market. We will continue to develop strong partnerships and subsequent revenues by providing brand protection solutions to Australian brands exporting overseas and enabling consumers in risk markets to make conscious decisions through certainty of authenticity. Our focus in 2016 is to commercialise our solutions across industries at high-risk of counterfeiting, such as pharmaceuticals, foods and nutraceuticals, electronics and fashion/apparel, with key account strategies being executed in each market. We will continue to develop an extensive distribution and partnership network globally that will exponentially increase our sales presence in key emerging and developed markets and leverage local core competencies to accelerate YPB’s growth in 2016 and onwards. I would like to thank our dedicated staff, Chairman, Board members and shareholders for their ongoing support in building a highly valuable, world leading company. I look forward to your continued support over the next 12 months and beyond as we continue to grow YPB to be the world’s most admired anti-counterfeit and brand protection company. Jens Michel Chief Executive Officer
5
For
per
sona
l use
onl
y

Director’s Report The directors present their report and the financial statements of YPB Group Limited, the “Company”) and its controlled entities (the “Consolidated Entity”) for the company’s the financial year ended of 31 December 2015. 1. Directors & Secretary For the period under review and covered by this report, the following persons were directors of the Company. Directors have been in office since the start of the financial year to the date of this report unless otherwise stated. Date Appointed Date Resigned Executive Chairman John Houston 31 July 2014 Executive Director Robert Whitton (CFO) 3 August 2012 Non-Executive Director Geoffrey Raby 31 July 2014 Su (George) Su 31 July 2014 Ronald Langley 28 April 2015 Gerard Eakin 4 March 2016 Mr Robert Whitton was the Company Secretary for the year under review. 2. Principal Activities The principal activity of the Company during the financial period was as a sales, marketing and developer of anti-counterfeiting, product authentication and consumer engagement solutions to brands owners globally. 3. Review of Operations The 12 months to December 2015, the first full year post listing, has been one in which the Company developed on the strong foundation of 2014. Firstly with the acquisition of complimentary businesses YPB developed and owns the world’s first end-to-end anti-counterfeit and brand protection solution, “Protect, Detect and Connect”, and secondly the Company expanded its global footprint, now operating in China, Thailand, USA and Australia, establishing its regional hub in Bangkok in mid 2015.
The 2015 year produced an acceleration in global sales with YPB now generating revenues from a wide and growing range of applications in the 2 largest economies, China and USA in addition to Australia, Thailand and now Mexico.
During 2015 the Company also entered the Government document business through its recent Thai acquisition, with 2 major western economies applying its solution into millions of passports and now vital record documents.
The year under review saw the addition of many new customers and a consequent increase in revenue providing a platform for acceleration in 2016 with the Company well positioned to continue to build its market position by leveraging its core technologies that enable customers to protect their products, detect counterfeit and connect with consumers.
6
For
per
sona
l use
onl
y
Research and Development continues to be a focus for YPB and 2015 saw material investment in new developments, including lodgment of new patent applications, both by the internal team and by acquisition enabling the company to proudly be the only company worldwide to offer a suite of products that include completely covert, indestructible, highly versatile and cost effective tracer technology together with consumer interaction technology to brand owners and government agencies. The Company added significant strength to its leadership team throughout the year appointing Jens Michel as Chief Operating Officer (now CEO), Robert Whitton as Chief Financial Officer. 4. Operating Results The consolidated loss of the Consolidated Entity, after providing for income tax, amounted to $6,762,000 (2014: loss $4,478,000) for the financial period. 5. Significant Changes in State of Affairs — On 13 January the Company announced it had signed a 5 year supply agreement worth potentially
A$16.0M with Shenzhen Shensaier a major ink supplier to the Chinese Liquor and Tobacco industries.
— On 21 January 2015 the Company announced that its Options rights issue had closed over-subscribed raising $227,771.19 and issuing 22,777.119 31 October 2017 Options exercisable at $0.20.
— On 30 January 2015 the Company announced it had signed a 4 year supply agreement with a major China based bottle closure company, Hicap Closures worth potentially A$10.0M.
— On 4 February 2015 the Company announced that it had issued the Options rights issue shortfall of 4,452,958 options and accordingly the issue was fully subscribed raising $272,230.20.
— On 12 February 2015 signed a Letter of Intent with Beijing Guohe Haidali Electronics to co-operate in developing authentication solutions using Near Field Communication (NFC).
— On 16 February 2015 the Company announced it had entered into its first supply agreement with a Chinese Government agency supplying its tracer solution to the Guandong National Tax Bureau for 14 M tax invoices (fapiao).
— On 19 February 2015 the Company advised the commencement of supply of Government building security passes in China.
— On 23 February 2015 the Company announced that it had completed a strategic placement issuing 10,000,000 fully paid ordinary shares at $0.30 per share and 10,000,000 31 October 2017 options, with an exercise price of $0.20 raising a total of $3.1M.
— On 23 February 2015 the Company announced a Share Purchase Plan proving exsiting shareholders to subscribe for up to $15,000 in shares with 1 attaching 31 October 2017 option for each 4 shares.
— On 26 February the Company lodged 3 next generation scanner patents. — On 6 March 2015 Prospectus for Share Purchase Plan (SPP) lodged. — On 10 March 2015 Alliance with Crime Stoppers International announced. — On 16 March 2015 the Company signed a binding LOI to acquire the Intellectual Product Protection
group (IPP), a leading Security consultancy company with operations in Thailand and USA. — On 21 April 2015 the Company announced that it had closed the SPP raising $1.3M and issuing
4.22M shares and 1.055M options. — On 27 April 2015 highly experienced and successful businessman Ronald Langley appointed to the
Board of Directors. — On 7 May 2015 the acquisition of the Intellectual Product Protection group was completed. — On 8 May 2015 new Brand Reporter website launched.
7
For
per
sona
l use
onl
y

— On 21 May 2015 the company announced the creation of a South East Asian hub in Bangkok and the appointment as Chief Technological Officer (CTO) of Tim Merchant, founder of IPP and the appointment of Robert Whitton as Chief Financial Officer (CFO).
— On 25 May 2015 commences shipment of tracer and scanners to major China customers. — On 1 June 2015 the Company entered into an agreement with Continuous Forms Control Inc (CFC)
in the USA to jointly develop a sales and distribution platform for security printing on the West Coast of the USA.
— On 14 July 2015 commences supply of tracer and scanners for the protection of up to 1 billion salt packages for China National Salt Industry Corporation A$325,000 sales potential.
— 20 July 2015 Initiation of coverage by Edison Investment Research. — 31 July 2015 IPP the Company’s Thai subsidiary signs Memorandum of Co-operation with
Foilmakers Australia P/L for the production, sale and marketing of 3 IPP products used in Government document security.
— 3 August 2015 the Company appointed Jens Michel as Global Chief Operating Officer (COO) to be based in the Company’s Bangkok hub and bringing high level Asian management experience and contacts.
— 19 August 2015 the Company announced its 2nd Chinese Government security contract, protecting staff permits at Beijing Palace Museum.
— 26 August 2015 the Company announces execution of binding LOI to acquire nTouch Holdings P/L a consumer engagement and proximity marketing possessing a unique marketing platform.
— 28 August 2015 first implementation of the Company’s anti-counterfeiting solutions in the Chinese banking sector announced.
— 1 September 2015 acquisition of CFC adds US anti-counterfeiting packaging capability, CFC founder appointed President YPB Print Solutions.
— 29 September 2015 appoints Richard Raju as Chief Marketing Officer.
— 6 October 2015 new tracer production line operational, 400% increase in capacity, security document production ramps up.
— 12 October 2015 second Chinese bank adopts the Company’s anti-counterfeiting technology. — 15 October 2015 China Feather & Down Industrial Association selects YPB’s end to end
authentication and consumer engagement solution, potential $1.5m contract. — 19 October 2015 YPB’s VariSec technology to be applied to 15ml per annum first world economy’s
ePassports. — 22 October 2015 Company wins 2 awards at 2015 Security Document Summit. — 26 October 2015 Acquisition of consumer engagement and proximity marketing company nTouch
finalized. — 29 October 2015 the Company signs a Memorandum of Co-operation with China subsidiary of
global supply chain management, print and packaging solutions company Elanders AB. — 6 November 2015 the Company is contracted to provide its VariSec technology for Southern African
ePassports. — 8 December 2015 announces signing of LOI to acquire patented smartphone readable
authentication technology. — 22 December 2015 the Company announces completion of successful capital raising of AU$7.78M. 6. Financial Position The net assets of YPB were $21.244M as at 31 December 2015. This was an increase of $10.519M which was as a result of completion of the acquisitions discussed above and capital raisings during the year.
8
For
per
sona
l use
onl
y

7. Future Developments, Prospects and Business Strategies YPB is now in a position to become the dominant player globally in the field of Product authentication anti-counterfeit technologies and resultant consumer engagement, through its end to end capabilities, existing product lineup and distribution footprint. The Company expects exponential growth in revenue in 2016 by building on its market position and leveraging its core technologies and the world’s first end-to-end anti-counterfeit and brand protection solutions across all markets. Key drivers for growth for YPB will be its ability to provide a complete suite of solutions to governments, brands and businesses whilst connecting them with consumers. The future will see YPB adding additional depth and skill into the management team to develop further the existing footprint and grow into new regions with both current and developing technologies. There are significant opportunities arising in the Americas as a result of the Joint Venture with Affyrmx and YPB Print. YPB has a demonstrated ability to innovate in products and services and we are continuing this with the proposed acquisition of Motif Micro Inc. announced in December 2015. The Company also will continue innovation in the scanner field with smaller, lower cost scanners and interface with smartphones currently under development. YPB’s strategy of protecting its intellectual property and thereby protecting investment in IP will continue. YPB sees opportunities to develop authentication tools for online merchants and consumers in the growing online shopping space. The nTouch acquisition, in November 2015, and solutions that this business unit provides in product authentication, consumer engagement and proximity marketing will be a major significant asset to the Company and a focus of our marketing in 2016. YPB will continue to seek out major global Brands in 2016 and given the growth in Australian product exporting opportunities to China and nearby regions make Australian Brands a major focus of our sales and marketing strategies and provide our solutions that will PROTECT, DETECT & CONNECT whilst at the same time continue to build our China business. 8. Dividends Paid No dividends have been paid or been recommended for payment in respect of the financial period ended 31 December 2015. 9. Events Subsequent to Balance Date On 29 January 2016 the Company advised that it had entered into a mutual co-operation agreement with leading Australian retail security and anti-shoplifting company Llexan Australia with Llexan to spearhead the Company’s Australian and New Zealand sales function. On 10 February 2016 the Company announced that it had entered into six year Joint Venture and Consulting Agreements with Affyrmx Group LLC of Atlanta, Georgia, USA focussed on the protection of government documents in Latin America. On 19 February 2016 the Company announced that it had secured its first order as a result of the Affyrmx Joint Venture, being supply of high security vital records documents to the State of Jalisco, Mexico. On 3 March 2016 the Company announced that Mr Jens Michel who joined the Company as Chief Operating Officer (COO) on 1 September 2015 had been promoted to Chief Executive Officer (CEO) and that Mr John Houston would step down as CEO but would remain as Executive Chairman actively involved in the Company and focusing on strategy and investor relations.
9
For
per
sona
l use
onl
y

On 4 March 2016 the Company announced that respected Investment banker Mr Gerard Eakin had been appointed as a Non-Executive Director. On 4 March 2016 the Company announced that founding Non-Executive Director Mr Geoffrey Raby would not be standing for re-election at the next Annual General Meeting (AGM). On 7 March 2016 the Company announced it had been selected to protect security passes for the People’s Procuratorate of Beijing Municipality, the third such government contract. On 11 March 2016 the Company announced that a major US brand manufacturing in China had adopted YPB’s authentication solution for approximately 70% of its production - 33 million pairs annually. On 23 March 2016 the Company announced that it had secured its second Mexican vital records documents order of 700,000 documents for the State of Guanajuato. 10. Directors’ & Secretary Experience and Special Responsibilities John Houston Executive Chairman Appointed 31 July 2014 John Houston has over 20 years of international business experience in countries including Australia, New Zealand, Sri Lanka, Thailand, Switzerland and Singapore. John was the inaugural CEO from pre listing of the Company until 3 March 2016. John has extensive international experience including building a USD $2 billion “Greenfield” mobile phone operation in Thailand, running a USD $350m EBITDA mobile Company in Switzerland, and selling an international Broadband Company for a 70x multiple of EBITDA. Other current directorships: Nil. Dr Geoffrey Raby MAICD Non-Executive Director Appointed 31 July 2014 Dr Raby was the Australian Ambassador to China from February 2007 to August 2011 and Deputy Secretary of the Department of Foreign Affairs and Trade from November 2002 to November 2006. He is a former Australian Ambassador to the World Trade Organisation and also to APEC (Asia Pacific Economic Co-operation). Dr. Raby lives in Beijing, China. As well as being CEO of Geoff Raby & Associates, a Beijing-based business advisory firm. Dr. Raby has BEc (Hons) MEc and PhD degrees from La Trobe University Melbourne. Dr Raby who will retire, pursuant to Clause 60 of the company’s Constitution at the 2015 Annual General Meeting, has advised the company that he will not offer himself for re-election. Other current directorships: Fortescue Metals Group Limited, SmartTrans Holdings Ltd, OceanaGold Corporation, iSentia Group Limited, Yancoal Australia Ltd.
10
For
per
sona
l use
onl
y

George (Su) Su Non-Executive Director Appointed 31 July 2014 Mr Su headed CITIC Securities Australian operation between 2009 and 2013 with special focus on cross border transactions between Australia and China and continues to represent the Chinese investment bank in Australia as its business partner. He was born and educated in Beijing before continuing his education in the USA. He holds a Bachelor of Arts Degree in Business Administration. Mr Su has lived and worked in China, Hong Kong, Singapore and Australia and now resides in Sydney. He has held senior positions in a Chinese government controlled Investment Company, has been the managing director of a Singapore based venture group and was an Independent director of Macquarie Bank's China property fund. Other current directorships: Oriental Technologies Investment Limited. Robert Whitton Executive Director Chief Financial Officer and Company Secretary Robert has a longstanding and successful career as a Chartered Accountant and Business Advisor. A specialist in business reconstruction services, Robert is a Fellow of the Institute of Chartered Accountants and a Fellow of the Institute of Company Directors. Robert has in excess of 30 years’ experience gained across a range of accountancy firms, most recently as a Director of William Buck, Chartered Accountants & Advisors in Sydney, Australia. Robert is a Certified Fraud Examiner. He also is an Associate Fellow of the Australian Institute of Management and a member of Australian Restructuring Insolvency & Turnaround Association. Robert is also a Director of The Australian Wine Co-Operative Society Ltd (“The Wine Society”). He was appointed Chief Financial Officer on 1 March 2015, Company Secretary on 31 July 2014 having previously been appointed non-executive Director on 3 August 2012. Other current directorships: Nil. Ronald Langley Non-Executive Director Appointed 28 April 2015 Ron is an Australian with extensive experience in building and running businesses globally. He spent 25 years in the United States, initially heading the former Brierley Investments Ltd’s international subsidiary in North America. He is an experienced senior executive, investor, Company Director, and Chairman with a background in corporate acquisitions and business building. He is a past director of Guinness Peat Group plc, Jungfraubahn Holding AG and Redflex Holdings Limited, and has held directorships in Vidler Water Company, Citation Insurance and Nevada Land and Resource Company to name a few. He has been an international investor for the past 33 years and has built 2 substantial businesses in the USA, Ron returned to Sydney in 2009 and manages a personal investment fund, which includes both listed and unlisted companies. Ron holds a BCom (Hons) degree from The University of NSW. Other current directorships: Mercantile Investment Company Ltd.
11
For
per
sona
l use
onl
y

Gerard Eakin Non-Executive Director Appointed 4 March 2016 Mr Eakin has had a 30 year-plus career in Australian equities in both portfolio management and equity research. His focus has been identifying and supporting young companies with superior potential. He is the founder of Manifest Capital Management and manages Australian equity portfolios for a select group of high net worth investors. Previously, he was the Head of Australian Equities at Rothschild Australia Asset Management managing funds of approximately $3 billion and the Head of Smaller Companies Research at JP Morgan/Ord Minnett and Merrill Lynch. Other current directorships: Nil. 11. Meetings of Directors
During the period under review, 3 formal board meetings of directors were held. During the period the full Board dealt with all relevant matters and no separate meetings of either the Remuneration or Audit Committees of the Board were held. Attendances by each director during the period were:
Board Meetings Number eligible
to attend Number Attended
John Houston Robert Whitton Geoffrey Raby George Su Ronald Langley
44442
44442
12. Remuneration Report (Audited)
This section presents the nature and amount of remuneration for each director of the Company, and for the executives receiving the highest remuneration. Remuneration Policy The remuneration policy of the Company has been designed to align director and executive objectives with shareholder and business objectives by providing a fixed remuneration component and a variable (at risk) component. The Board of the Company believes the remuneration policy is appropriate for the current stage of development of the Company. The Board’s policy for determining the nature and amount of remuneration for Board members and senior executives of the Entity is as follows:
— The remuneration policy, setting the terms and conditions for the executive directors and other senior executives, was developed by the Board. All executives receive an agreed mix of fixed salary (which is based on factors such as experience and level of responsibilities), superannuation, fringe benefits and an annual cash performance incentive. The Company’s Remuneration Committee will review and make recommendations to the Board in respect of executive packages on an annual basis. Reference will be made to the Entity’s performance, executive performance and comparable information from industry sectors and other listed companies in similar industries.
— The performance of executives is measured against criteria agreed annually with each executive. Performance criteria include factors relating to the responsibilities of each position as well as company-wide factors such as the forecast growth of the Entity’s profits. All bonuses are linked to
12
For
per
sona
l use
onl
y

predetermined performance criteria. The Board may, however, exercise its discretion in relation to approving incentives, bonuses and can recommend changes to the committee’s recommendations. The policy is designed to attract the highest caliber of executives and reward them for performance that results in long-term growth in shareholder wealth.
— The executive directors and executives receive a superannuation guarantee contribution required by the government and do not receive any other retirement benefits.
— All remuneration paid to directors and executives is valued at the cost to the Company and expensed. There are no share or options schemes as part of directors’ or executive remuneration.
— The Board policy is to remunerate non-executive directors at market rates for comparable companies for time, commitment and responsibilities. The remuneration committee determines payments to the non-executive directors and reviews their remuneration annually, based on market practice, duties and accountability.
— The maximum aggregate amount of fees that can be paid to non-executive directors is subject to approval by shareholders at the Annual General Meeting. Fees for non-executive directors are not linked to the performance of the Entity. However, to align directors’ interests with shareholder interests, the directors are encouraged to hold shares in the Company.
— Where non-executive directors provide additional services to the Company, this must be approved in advance by the remuneration committee chair.
Performance Based Remuneration
As part of each executive director and executive’s remuneration package there is a performance-based component, which is paid on achievement of key performance indicators (“KPIs”). The program seeks to align goals of directors and executives with that of the Company and its shareholders. The KPIs are reviewed annually by the Board in consultation with executives. The measures are tailored to the areas each executive has a level of control over. The KPIs target areas the Board believes hold greater potential for group expansion and profit, covering financial and non-financial as well as short- and long-term goals. The level set for each KPI is based on budgeted figures for the group and respective industry standards. Performance in relation to the KPIs is assessed annually, with bonuses being awarded depending on the number and deemed difficulty of the KPIs achieved. Following the assessment, the KPIs are reviewed by the remuneration committee in light of the desired and actual outcomes, and their efficiency is assessed in relation to the group’s goals and shareholder wealth, before the KPIs are set for the following year. Company Performance, Shareholder Wealth and Directors’ and Executives’ Remuneration
There were no KPIs set for the period under review being the twelve months ended 31 December 2015 and as a result no performance payments were paid or are payable.
13
For
per
sona
l use
onl
y

Details of Remuneration for the Period Ended 31 December 2015
The remuneration for each key management personnel is set out in the tables below.
Short-term
benefits Equity-based
payments
Fees or Remuneration Shares Total12 months to 31 December 2015 $ $ $ John Houston (Executive Chairman) 450,300 - 450,300 Jens Michael (Chief Executive Officer) 406,275 140,499 546,774 Robert Whitton (Chief Financial Officer) 278,332 - 278,332 Richard Raju (Chief Marketing Officer) 34,803 140,000 174,803 Tim Merchant (Chief Technology Officer) 137,118 - 137,118 Ralph Davis (President - YPB Print Solutions) 78,913 - 78,913 Geoffrey Raby 53,525 - 53,525 George (Su) Su 40,000 - 40,000 Ronald Langley 26,667 - 26,667 1,505,933 280,499 1,786,432
Short-term
benefits Equity-based
Payments
Cash salary Shares and fees Total6 months to 31 December 2014 $ $ $ John Houston (Chairman) 154,704 - 154,704 Colin Turner (Chief Financial Officer) 142,000 - 142,000 Randall Griffis (Chief Marketing Officer) 55,000 55,000 110,000 Paul Eveleigh (Chief Operating Officer) 50,000 - 50,000 Robert Whitton 13,333 27,500 40,833 Geoffrey Raby 17,842 - 17,842 George (Su) Su 13,333 - 13,333 Anthony Damianos 8,250 - 8,250 454,462 82,500 536,962 Additional disclosures relating to key management personnel Shareholdings The number of shares in the Company held during the financial year by each director and other members of key management personnel of the Group, including their personally related parties, is set out below: Balance at Received Balance at the start of as part of Disposals/ the end of the year remuneration Additions other the year Group KMP John Houston (Chairman) 60,318,519 - 50,000 - 60,368,519 Robert Whitton (Chief Financial Officer) 175,000 - 50,000 - 225,000 Geoffrey Raby 250,000 - - - 250,000 George (Su) Su 5,496,716 - - - 5,496,716 Ronald Langley - - 3,333,333 - 3,333,333Jens Michael (Chief Operating Officer) - - 401,283 - 401,283 Richard Raju (Chief Marketing Officer) - - 400,000 - 400,000 Tim Merchant - - 878,185 - 878,185 66,240,235 - 5,112,801 - 71,353,036
14
For
per
sona
l use
onl
y

The number of options in the Company held during the financial year by each director and other members of key management personnel of the Group, including their personally related parties, is set out below: Balance at Received Balance at the start of as part of Disposals/ the end of the year remuneration Additions other the year Group KMP - John Houston (Chairman) - - 15,089,413 - 15,089,413Robert Whitton (Chief Financial Officer) - - 56,250 - 56,250Geoffrey Raby - - 62,500 - 62,500George (Su) Su - - 1,374,719 - 1,374,719Ronald Langley - - 3,333,333 - 3,333,333Jens Michael (Chief Operating Officer) - - - - -Richard Raju (Chief Marketing Officer) - - - - -Tim Merchant - - - - - - - 19,916,215 - 19,916,215 Other Equity-related KMP Transactions There have been no other transactions involving equity instruments other than those described in the tables above relating options, rights and shareholders. Employment Contracts of Directors and Senior Executives. The terms of employment for all directors and senior executives are formalised in contracts of employment. The key terms of the contracts with Directors and specified executives except the Executive Chairman and Chief Financial Officer are:
— none of the contracts have fixed terms
— resignation period or termination by the Group is between one and six months' notice
— termination or redundancy payments by the Group are not specifically provided for in the contracts, however, will be payable in accordance with relevant Federal or State legislation, and
The services of the Executive Chairman and the Chief Financial Officer are provided pursuant to a Contract with a Service Company:
— The contract has a term of 36 months from the date of signing.
— Resignation period or termination by the Group is twelve months' notice.
— Termination or redundancy payments by the Group are not specifically provided for in the contracts, however, will be payable in accordance with the relevant Federal or state legislation; and
— No termination payments are payable in respect of resignation or dismissal for serious misconduct. In the instance of serious misconduct the Group can terminate employment at any time.
13. Indemnification of Directors, Officers and Auditor
Pursuant to Article 103 of its Constitution, the Company insures and indemnifies its current and former directors and officers, against liabilities to another person (other than the Company or a related body corporate) that may arise from their position as directors and officers of the Company and its controlled entities, except where the liability arises out of conduct involving lack of good faith. Each Director and Secretary named in the Directors and Secretary section of this report and any past director or secretary, has entered into a Deed of Indemnity with the Company on these terms. No indemnity has been provided to the Company’s auditor.
15
For
per
sona
l use
onl
y

14. Insurance Premiums
The Company has paid an insurance premium in respect of a contract insuring against liability of Directors and Officers in accordance with the Company’s Constitution and the Corporations Act 2001. The contract of insurance prohibits disclosure of the amount of the premium and the nature of the liability insured against. The Company has paid the insurance premium in respect of cover which may apply in relation to liabilities of the type referred to in Section 199B of the Corporations Act 2001. 15. Non-audit Services
The Board is satisfied that the provision of non-audit services during the year is compatible with the general standard of independence for auditors imposed by the Corporations Act 2001. The directors are satisfied that the services disclosed below did not compromise the external auditor’s independence for the following reasons: ⎯ all non-audit services are reviewed and approved by the Board prior to commencement to ensure
they do not adversely affect the integrity and objectivity of the auditor; and
⎯ the nature of the services provided does not compromise the general principles relating to auditor independence in accordance with APES 110: Code of Ethics for Professional Accountants set by the Accounting Professional and Ethical Standards Board.
16. Compliance with Listing Rule 4.10.19
The company confirms that it has since reinstatement used the cash and assets in a form readily converted into cash that it had at the time of reinstatement in a manner consistent with its business objectives. 17. Auditor’s Independence Declaration
The auditor’s independence declaration for the period ended 31 December 2015 will be included on the following page of this Annual Report. 18. Proceedings on Behalf of Company
Other than as set out below, no person has applied for leave of Court to bring proceedings on behalf of the Company or intervene in any proceedings to which the Company is a party for the purpose of taking responsibility on behalf of the Company for all or any part of those proceedings. 19. Rounding of Amounts
The Company is an entity to which ASIC Class Order 98/100 applies and, accordingly, amounts in the financial statements and directors’ report have been rounded to the nearest thousand dollars. Signed in accordance with a resolution of the Board of Directors
John Houston Executive Chairman Dated this 31st day of March 2016
16
For
per
sona
l use
onl
y

HALL CHADWICK
Level 40, 2 Park Street
SYDNEY NSW 2000
GRAHAM WEBB
Partner
Dated: 31 March 2016
YPB GROUP LIMITED
ACN 108 649 421
AND CONTROLLED ENTITIES
AUDITOR’S INDEPENDENCE DECLARATION
UNDER SECTION 307C OF THE CORPORATIONS ACT 2001
TO THE DIRECTORS OF YPB GROUP LIMITED AND CONTROLLED ENTITIES
I declare that, to the best of my knowledge and belief, during the year ended 31 December 2015
there have been no contraventions of:
i. the auditor independence requirements as set out in the Corporations Act 2001 in relation to
the audit; and
ii. any applicable code of professional conduct in relation to the audit.
17
For
per
sona
l use
onl
y

Financial Report
31 December 2015
18
For
per
sona
l use
onl
y

YPB Group Ltd Statement of profit or loss and other comprehensive income For the year ended 31 December 2015
Consolidated
Note
12 months to 31 December
2015
6 months to 31 December
2014 $'000 $'000
The above statement of profit or loss and other comprehensive income should be read in conjunction with the accompanying notes
Revenue 3 1,714 85 Expenses Consulting fees (1,377) (258)Depreciation and amortisation expense (902) (315)Directors' fees (197) (56)Employee benefits expense (1,039) (293)Finance costs (197) (68)Impairment of goodwill - (2,206)Production costs (221) -Rental expenses (304) (89)Research and development (1,380) (505)Marketing (183) - Traveling expense (645) - Options expense - (97)Share-based payments (282) (113)Commissions expense (797) (118)Regulatory expenses (250) (146)Professional fees (142) (23)Other expenses (560) (276) Loss before income tax expense 4 (6,762) (4,478) Income tax expense 5 - - Loss after income tax expense for the year/period attributable to the owners of YPB Group Ltd
(6,762) (4,478)
Other comprehensive income Items that may be reclassified subsequently to profit or loss Exchange differences on translation of foreign operations 731 1,060 Other comprehensive income for the year/period, net of tax 731 1,060 Total comprehensive loss for the year/period attributable to the owners of YPB Group Ltd
(6,031) (3,418)
Cents Cents Basic and diluted earnings per share 26 (5.44) (4.32)
19
For
per
sona
l use
onl
y

YPB Group Ltd Statement of financial position As at 31 December 2015
Consolidated
Note 31 December
2015 31 December
2014 $'000 $'000
The above statement of financial position should be read in conjunction with the accompanying notes
Assets Current assets Cash and cash equivalents 6 2,877 2,405 Trade and other receivables 7 4,568 174 Inventories 8 179 136 Total current assets 7,624 2,715 Non-current assets Plant and equipment 9 313 26 Intangibles 10 16,176 11,096 Trade and other receivables 11 1,653 - Total non-current assets 18,142 11,122 Total assets 25,766 13,837 Liabilities Current liabilities Trade and other payables 12 1,418 364 Total current liabilities 1,418 364 Non-current liabilities Borrowings 13 3,104 2,748 Total non-current liabilities 3,104 2,748 Total liabilities 4,522 3,112 Net assets 21,244 10,725 Equity Issued capital 14 33,606 17,449 Reserves 15 3,056 1,932 Accumulated losses (15,418) (8,656) Total equity 21,244 10,725
20
For
per
sona
l use
onl
y

YPB Group Ltd Statement of changes in equity For the year ended 31 December 2015
The above statement of changes in equity should be read in conjunction with the accompanying notes
Issued Issued Foreign
currency Accumulated Share-based Total
capital options
reserve translation
reserve losses payments
reserve equity Consolidated $'000 $'000 $'000 $'000 $'000 $'000 Balance at 1 July 2014 10,399 - 775 (4,178) - 6,996 Loss after income tax expense for the period
-
- - (4,478)
- (4,478)
Other comprehensive income for the period, net of tax
-
- 1,060 -
- 1,060
Total comprehensive profit/(loss) for the period
-
- 1,060 (4,478)
- (3,418)
Transactions with owners in their capacity as owners:
Shares issued, net of transaction costs
7,050
- - -
- 7,050
Options granted during the period
-
- - -
97 97
Balance at 31 December 2014 17,449 - 1,835 (8,656) 97 10,725
Issued Issued Foreign
currency Accumulated Share-based Total
capital options
reserve translation
reserve losses payments
reserve equity Consolidated $'000 $'000 $'000 $'000 $'000 $'000 Balance at 1 January 2015 17,449 - 1,835 (8,656) 97 10,725 Loss after income tax expense for the year
-
- - (6,762)
- (6,762)
Other comprehensive income for the year, net of tax
-
- 731 -
- 731
Total comprehensive profit/(loss) for the year
-
- 731 (6,762)
- (6,031)
Transactions with owners in their capacity as owners:
Shares issued, net of transaction costs
16,144
- - -
- 16,144
Options exercised during the year
13
- - -
- 13
Options issued during the year - 393 - - - 393 Balance at 31 December 2015 33,606 393 2,566 (15,418) 97 21,244
21
For
per
sona
l use
onl
y

YPB Group Ltd Statement of cash flows For the year ended 31 December 2015
Consolidated
Note
12 months to 31 December
2015
6 months to 31 December
2014 $'000 $'000
The above statement of cash flows should be read in conjunction with the accompanying notes
Cash flows from operating activities Receipts from customers 828 6 Payments to suppliers and employees (6,595) (2,081)Interest received 77 11 Finance costs (1) (1) Net cash used in operating activities 25 (5,691) (2,065) Cash flows from investing activities Payments for plant and equipment (299) (17)Payments for intangibles (39) -Payments for acquisitions of subsidiaries (net of cash acquired) 22 (423) (144) Net cash used in investing activities (761) (161) Cash flows from financing activities Proceeds from issue of shares (net of costs) 6,752 4,900 Proceeds from issue of options 393 - Repayment of loan from related party (197) (394)Repayment of loan from unrelated party (24) - Net cash from financing activities 6,924 4,506 Net increase in cash and cash equivalents 472 2,280 Cash and cash equivalents at the beginning of the financial year/period 2,405 125 Cash and cash equivalents at the end of the financial year/period 6 2,877 2,405
22
For
per
sona
l use
onl
y

YPB Group Ltd Notes to the financial statements 31 December 2015
Note 1. Significant accounting policies These consolidated financial statements and notes represent those of YPB Group Limited and Controlled Entities (the “consolidated entity” or “group”). The company is a listed public company, incorporated and domiciled in Australia. The separate financial statements of the parent entity, YPB Group Limited, have not been presented within this financial report as permitted by the Corporations Act 2001. The financial statements were authorised for issue on 31 March 2016 by the directors of the company. Basis of preparation These general purpose financial statements have been prepared in accordance with the Corporations Act 2001, Australian Accounting Standards and Interpretations of the Australian Accounting Standards Board and International Financial Reporting Standards as issued by the International Accounting Standards Board. The Group is a for-profit entity for financial reporting purposes under Australian Accounting Standards. Material accounting policies adopted in the preparation of these financial statements are presented below and have been consistently applied unless stated otherwise. Except for cash flow information, the financial statements have been prepared on an accruals basis and are based on historical costs, modified, where applicable, by the measurement at fair value of selected non-current assets, financial assets and financial liabilities. Going concern The group incurred an operating loss after income tax of $6,762,000 and has a deficiency of operating cash flows of $5,691,000. The financial statements have been prepared on a going concern basis as the group’s cash flow forecast indicates that after meeting all of its commitments, and with the capital raising undertaken and options issued during the year amounting to $12,145,000 (including the Landstead raising of $5,000,000, as outlined in note 7), the Group will be cash flow positive for at least the next 12 months from the date of this report. The directors are also confident that the forecasted sales growth will be achieved. The forecasted sales growth assumes that from the four significant sales contracts signed to date and other pipeline opportunities, the Group will generate revenue in excess of $38,500,000 over a period of 5 years. If the forecasted sales growth is not achieved, the company will manage its overhead costs accordingly in order to remain cash flow positive. On this basis the directors are of the opinion that the financial statements can be prepared on a going concern basis and the group will be able to pay for its debts as and when they fall due and payable. On this basis the directors are of the opinion that the financial statements can be prepared on a going concern basis and the group will be able to pay for its debts as and when they fall due and payable. Principles of consolidation The consolidated financial statements incorporate all of the assets, liabilities and results of the parent YPB Group Limited and all of the subsidiaries. Subsidiaries are entities the parent controls. The parent controls an entity when it is exposed to, or has rights to, variable returns from its involvement with the entity and has the ability to affect those returns through its power over the entity. A list of the subsidiaries is provided in Note 23. The assets, liabilities and results of all subsidiaries are fully consolidated into the financial statements of the Group from the date on which control is obtained by the Group. The consolidation of a subsidiary is discontinued from the date that control ceases. Intercompany transactions, balances and unrealised gains or losses on transactions between group entities are fully eliminated on consolidation. Accounting policies of subsidiaries have been changed and adjustments made where necessary to ensure uniformity of the accounting policies adopted by the Group. Equity interests in a subsidiary not attributable, directly or indirectly, to the Group are presented as “non-controlling interests”. The Group initially recognises non-controlling interests that are present ownership interests in subsidiaries and are entitled to a proportionate share of the subsidiary’s net assets on liquidation at either fair value or at the non-controlling interests’ proportionate share of the subsidiary’s net assets. Subsequent to initial recognition, non-controlling interests are attributed their share of profit or loss and each component of other comprehensive income. Non-controlling interests are shown separately within the equity section of the statement of financial position and statement of comprehensive income. The consolidated financial statements have been prepared using reverse acquisition accounting. In reverse acquisition accounting, the cost of the business combination is deemed to have been incurred by the legal subsidiary YPB Limited (HK) (the acquirer for accounting purposes) in the form of equity instruments issued to the owners of the legal parent, YPB Group Limited (formerly AUV Enterprises Limited) (the acquiree for accounting purposes).
23
For
per
sona
l use
onl
y

YPB Group Ltd Notes to the financial statements 31 December 2015
Note 1. Significant accounting policies
Business combinations Business combinations occur where an acquirer obtains control over one or more businesses. A business combination is accounted for by applying the acquisition method, unless it is a combination involving entities or businesses under common control. The business combination will be accounted for from the date that control is attained, whereby the fair value of the identifiable assets acquired and liabilities (including contingent liabilities) assumed is recognised (subject to certain limited exemptions). When measuring the consideration transferred in the business combination, any asset or liability resulting from a contingent consideration arrangement is also included. Subsequent to initial recognition, contingent consideration classified as equity is not remeasured and its subsequent settlement is accounted for within equity. Contingent consideration classified as an asset or liability is remeasured in each reporting period to fair value, recognising any change to fair value in profit or loss, unless the change in value can be identified as existing at acquisition date. All transaction costs incurred in relation to business combinations, other than those associated with the issue of a financial instrument, are recognised as expenses in profit or loss when incurred. The acquisition of a business may result in the recognition of goodwill or a gain from a bargain purchase. Goodwill Goodwill is carried at cost less any accumulated impairment losses. Goodwill is calculated as the excess of the sum of: - the consideration transferred; - any non-controlling interest (determined under either the full goodwill or proportionate interest method); and - the acquisition date fair value of any previously held equity interest; over the acquisition date fair value of net identifiable assets acquired. The acquisition date fair value of the consideration transferred for a business combination plus the acquisition date fair value of any previously held equity interest shall form the cost of the investment in the separate financial statements. Fair value remeasurements in any pre-existing equity holdings are recognised in profit or loss in the period in which they arise. Where changes in the value of such equity holdings had previously been recognised in other comprehensive income, such amounts are recycled to profit or loss. Goodwill on acquisition of subsidiaries is included in intangible assets. Goodwill is tested for impairment annually and is allocated to the Group's cash-generating units or groups of cash-generating units, representing the lowest level at which goodwill is monitored being not larger than an operating segment. Gains and losses on the disposal of an entity include the carrying amount of goodwill related to the entity disposed of.
24
For
per
sona
l use
onl
y

YPB Group Ltd Notes to the financial statements 31 December 2015
Note 1. Significant accounting policies
Income Tax The income tax expense/(income) for the period comprises current income tax expense/(income) and deferred tax expense/(income). Current income tax expense charged to profit or loss is the tax payable on taxable income. Current tax liabilities/(assets) are measured at the amounts expected to be paid to/(recovered from) the relevant taxation authority. Deferred income tax expense reflects movements in deferred tax asset and deferred tax liability balances during the period as well as unused tax losses. Current and deferred income tax expense/(income) is charged or credited outside profit or loss when the tax relates to items that are recognised outside profit or loss. Except for business combinations, no deferred income tax is recognised from the initial recognition of an asset or liability, where there is no effect on accounting or taxable profit or loss. Deferred tax assets and liabilities are calculated at the tax rates that are expected to apply to the period when the asset is realised or the liability is settled and their measurement also reflects the manner in which management expects to recover or settle the carrying amount of the related asset or liability. With respect to non-depreciable items of property, plant and equipment measured at fair value and items of investment property measured at fair value, the related deferred tax liability or deferred tax asset is measured on the basis that the carrying amount of the asset will be recovered entirely through sale. Deferred tax assets relating to temporary differences and unused tax losses are recognised only to the extent that it is probable that future taxable profit will be available against which the benefits of the deferred tax asset can be utilised. Where temporary differences exist in relation to investments in subsidiaries, branches, associates, and joint ventures, deferred tax assets and liabilities are not recognised where the timing of the reversal of the temporary difference can be controlled and it is not probable that the reversal will occur in the foreseeable future. Current tax assets and liabilities are offset where a legally enforceable right of set-off exists and it is intended that net settlement or simultaneous realisation and settlement of the respective asset and liability will occur. Deferred tax assets and liabilities are offset where: (a) a legally enforceable right of set-off exists; and (b) the deferred tax assets and liabilities relate to income taxes levied by the same taxation authority on either the same taxable entity or different taxable entities where it is intended that net settlement or simultaneous realisation and settlement of the respective asset and liability will occur in future periods in which significant amounts of deferred tax assets or liabilities are expected to be recovered or settled. Tax consolidation The Company and its wholly owned subsidiaries have formed a tax-consolidated group with effect from 6 April 2004 and are therefore taxed as a single entity from that date. The head entity of the tax-consolidated group is YPB Group Limited. YPB Group Limited is responsible for recognising the current and deferred tax assets and liabilities for the consolidated group. The tax-consolidated group has entered a tax sharing agreement whereby each company in the group contributes to the income tax payable in proportion to their contribution to the taxable profit of the tax-consolidated group.
25
For
per
sona
l use
onl
y

YPB Group Ltd Notes to the financial statements 31 December 2015
Note 1. Significant accounting policies
Fair Value of Assets and Liabilities The Group measures some of its assets and liabilities at fair value on either a recurring or non-recurring basis, depending on the requirements of the applicable Accounting Standard. Fair value is the price the Group would receive to sell an asset or would have to pay to transfer a liability in an orderly (i.e. unforced) transaction between independent, knowledgeable and willing market participants at the measurement date. As fair value is a market-based measure, the closest equivalent observable market pricing information is used to determine fair value. Adjustments to market values may be made having regard to the characteristics of the specific asset or liability. The fair values of assets and liabilities that are not traded in an active market are determined using one or more valuation techniques. These valuation techniques maximise, to the extent possible, the use of observable market data. To the extent possible, market information is extracted from either the principal market for the asset or liability (i.e. the market with the greatest volume and level of activity for the asset or liability) or, in the absence of such a market, the most advantageous market available to the entity at the end of the reporting period (i.e. the market that maximises the receipts from the sale of the asset or minimises the payments made to transfer the liability, after taking into account transaction costs and transport costs). For non-financial assets, the fair value measurement also takes into account a market participant’s ability to use the asset in its highest and best use or to sell it to another market participant that would use the asset in its highest and best use. The fair value of liabilities and the entity’s own equity instruments (excluding those related to share-based payment arrangements) may be valued, where there is no observable market price in relation to the transfer of such financial instrument, by reference to observable market information where such instruments are held as assets. Where this information is not available, other valuation techniques are adopted and, where significant, are detailed in the respective note to the financial statements. Inventories Inventories are measured at the lower of cost and net realisable value. The cost of manufactured products includes direct materials, direct labour and an appropriate proportion of variable and fixed overheads. Plant and Equipment Plant and equipment is carried at cost or fair value as indicated less, where applicable, any accumulated depreciation and impairment losses. Plant and equipment are measured on the cost basis and therefore carried at cost less accumulated depreciation and any accumulated impairment. In the event the carrying amount of plant and equipment is greater than the estimated recoverable amount, the carrying amount is written down immediately to the estimated recoverable amount and impairment losses are recognised either in profit or loss or as a revaluation decrease if the impairment losses relate to a revalued asset. A formal assessment of recoverable amount is made when impairment indicators are present. The carrying amount of plant and equipment is reviewed annually by directors to ensure it is not in excess of the recoverable amount from these assets. The recoverable amount is assessed on the basis of the expected net cash flows that will be received from the asset’s employment and subsequent disposal. The expected net cash flows have been discounted to their present values in determining recoverable amounts. Subsequent costs are included in the asset’s carrying amount or recognised as a separate asset, as appropriate, only when it is probable that future economic benefits associated with the item will flow to the Group and the cost of the item can be measured reliably. All other repairs and maintenance are recognised as expenses in profit or loss during the financial period in which they are incurred.
26
For
per
sona
l use
onl
y
YPB Group Ltd Notes to the financial statements 31 December 2015
Note 1. Significant accounting policies
Plant and Equipment Depreciation The depreciable amount of all fixed assets including buildings and capitalised lease assets, but excluding freehold land, is depreciated on a straight-line basis over the asset’s useful life to the consolidated group commencing from the time the asset is held ready for use. Leasehold improvements are depreciated over the shorter of either the unexpired period of the lease or the estimated useful lives of the improvements. The depreciation rates used for each class of depreciable assets are: Plant and equipment 10% - 25% The assets’ residual values and useful lives are reviewed, and adjusted if appropriate, at the end of each reporting period. Plant and equipment under lease are depreciated over the unexpired period of the lease or the estimated useful life of the assets, whichever is shorter. An asset’s carrying amount is written down immediately to its recoverable amount if the asset’s carrying amount is greater than its estimated recoverable amount. Gains and losses on disposals are determined by comparing proceeds with the carrying amount. These gains and losses are recognised in profit or loss in the period in which they arise. When revalued assets are sold, amounts included in the revaluation surplus relating to that asset are transferred to retained earnings. Financial Instruments Initial recognition and measurement Financial assets and financial liabilities are recognised when the entity becomes a party to the contractual provisions to the instrument. For financial assets, this is equivalent to the date that the company commits itself to either the purchase or sale of the asset (i.e. trade date accounting is adopted). Financial instruments are initially measured at fair value plus transaction costs, except where the instrument is classified “at fair value through profit or loss”, in which case transaction costs are expensed to profit or loss immediately. Classification and subsequent measurement Financial instruments are subsequently measured at fair value, amortised cost using the effective interest method, or cost. Amortised cost is calculated as the amount at which the financial asset or financial liability is measured at initial recognition less principal repayments and any reduction for impairment, and adjusted for any cumulative amortisation of the difference between that initial amount and the maturity amount calculated using the effective interest method. The effective interest method is used to allocate interest income or interest expense over the relevant period and is equivalent to the rate that discounts estimated future cash payments or receipts (including fees, transaction costs and other premiums or discounts) over the expected life (or when this cannot be reliably predicted, the contractual term) of the financial instrument to the net carrying amount of the financial asset or financial liability. Revisions to expected future net cash flows will necessitate an adjustment to the carrying amount with a consequential recognition of an income or expense item in profit or loss. Loans and receivables Loans and receivables are non-derivative financial assets with fixed or determinable payments that are not quoted in an active market and are subsequently measured at amortised cost. Gains or losses are recognised in profit or loss through the amortisation process and when the financial asset is derecognised. Financial liabilities Non-derivative financial liabilities other than financial guarantees are subsequently measured at amortised cost. Gains or losses are recognised in profit or loss through the amortisation process and when the financial liability is derecognised.
27
For
per
sona
l use
onl
y

YPB Group Ltd Notes to the financial statements 31 December 2015
Note 1. Significant accounting policies
Financial Instruments Impairment A financial asset (or a group of financial assets) is deemed to be impaired if, and only if, there is objective evidence of impairment as a result of one or more events (a “loss event”) having occurred, which has an impact on the estimated future cash flows of the financial asset(s). In the case of financial assets carried at amortised cost, loss events may include: indications that the debtors or a group of debtors are experiencing significant financial difficulty, default or delinquency in interest or principal payments; indications that they will enter bankruptcy or other financial reorganisation; and changes in arrears or economic conditions that correlate with defaults. For financial assets carried at amortised cost (including loans and receivables), a separate allowance account is used to reduce the carrying amount of financial assets impaired by credit losses. After having taken all possible measures of recovery, if management establishes that the carrying amount cannot be recovered by any means, at that point the written-off amounts are charged to the allowance account or the carrying amount of impaired financial assets is reduced directly if no impairment amount was previously recognised in the allowance account. When the terms of financial assets that would otherwise have been past due or impaired have been renegotiated, the Group recognises the impairment for such financial assets by taking into account the original terms as if the terms have not been renegotiated so that the loss events that have occurred are duly considered. Derecognition Financial assets are derecognised when the contractual rights to receipt of cash flows expire or the asset is transferred to another party whereby the entity no longer has any significant continuing involvement in the risks and benefits associated with the asset. Financial liabilities are derecognised when the related obligations are discharged, cancelled or have expired. The difference between the carrying amount of the financial liability extinguished or transferred to another party and the fair value of consideration paid, including the transfer of non-cash assets or liabilities assumed, is recognised in profit or loss. Leases Lease payments for operating leases, where substantially all the risks and benefits remain with the lessor, are recognised as expenses in the periods in which they are incurred. Lease incentives under operating leases are recognised as a liability and amortised on a straight-line basis over the lease term. Impairment of Assets At the end of each reporting period, the Group assesses whether there is any indication that an asset may be impaired. The assessment will include the consideration of external and internal sources of information including dividends received from subsidiaries, associates or joint ventures deemed to be out of pre-acquisition profits. If such an indication exists, an impairment test is carried out on the asset by comparing the recoverable amount of the asset, being the higher of the asset’s fair value less costs of disposal and value in use, to the asset’s carrying amount. Any excess of the asset’s carrying amount over its recoverable amount is recognised immediately in profit or loss, unless the asset is carried at a revalued amount in accordance with another Standard (e.g. in accordance with the revaluation model in AASB 116: Property, Plant and Equipment). Any impairment loss of a revalued asset is treated as a revaluation decrease in accordance with that other Standard. Where it is not possible to estimate the recoverable amount of an individual asset, the Group estimates the recoverable amount of the cash-generating unit to which the asset belongs. Impairment testing is performed annually for goodwill, intangible assets with indefinite lives and intangible assets not yet available for use. Intangibles Other than GoodwillIntellectual property Intellectual property is recognised at cost of acquisition. Intellectual property has a finite life and is carried at cost less any accumulated amortisation and any impairment losses. Intellectual property is amortised over a period of 5 - 20 years.
28
For
per
sona
l use
onl
y
YPB Group Ltd Notes to the financial statements 31 December 2015
Note 1. Significant accounting policies
Research and development Expenditure during the research phase of a project is recognised as an expense when incurred. Development costs are capitalised only when technical feasibility studies identify that the project is expected to deliver future economic benefits and these benefits can be measured reliably. Capitalised development costs have a finite useful life and are amortised on a systematic basis based on the future economic benefits over the useful life of the project. Customer relationships Customer relationships acquired in a business combination are amortised on a straight-line basis over the period of their expected benefit, being their finite life of 5 years. Foreign Currency Transactions and Balances Functional and presentation currency The functional currency of each of the Group’s entities is measured using the currency of the primary economic environment in which that entity operates. The consolidated financial statements are presented in Australian dollars, which is the parent entity’s functional currency. Transactions and balances Foreign currency transactions are translated into functional currency using the exchange rates prevailing at the date of the transaction. Foreign currency monetary items are translated at the period-end exchange rate. Non-monetary items measured at historical cost continue to be carried at the exchange rate at the date of the transaction. Non-monetary items measured at fair value are reported at the exchange rate at the date when fair values were determined. Exchange differences arising on the translation of monetary items are recognised in profit or loss, except where deferred in equity as a qualifying cash flow or net investment hedge. Exchange differences arising on the translation of non-monetary items are recognised directly in other comprehensive income to the extent that the underlying gain or loss is recognised in other comprehensive income; otherwise the exchange difference is recognised in profit or loss. Group companies The financial results and position of foreign operations, whose functional currency is different from the Group’s presentation currency, are translated as follows: – assets and liabilities are translated at exchange rates prevailing at the end of the reporting period; – income and expenses are translated at average exchange rates for the period; and – retained earnings are translated at the exchange rates prevailing at the date of the transaction. Exchange differences arising on translation of foreign operations with functional currencies other than Australian dollars are recognised in other comprehensive income and included in the foreign currency translation reserve in the statement of financial position. The cumulative amount of these differences is reclassified into profit or loss in the period in which the operation is disposed of.
29
For
per
sona
l use
onl
y

YPB Group Ltd Notes to the financial statements 31 December 2015
Note 1. Significant accounting policies
Employee Benefits Short-term employee benefits Provision is made for the Group’s obligation for short-term employee benefits. Short-term employee benefits are benefits (other than termination benefits) that are expected to be settled wholly before 12 months after the end of the annual reporting period in which the employees render the related service, including wages, salaries and sick leave. Short-term employee benefits are measured at the (undiscounted) amounts expected to be paid when the obligation is settled. The Group’s obligations for short-term employee benefits such as wages, salaries and sick leave are recognised as a part of current trade and other payables in the statement of financial position. The Group’s obligations for employees’ annual leave and long service leave entitlements are recognised as provisions in the statement of financial position. Equity-settled compensation The Group operates an employee share and option plan. Share-based payments to employees are measured at the fair value of the instruments issued and amortised over the vesting periods. Share-based payments to non-employees are measured at the fair value of goods or services received or the fair value of the equity instruments issued, if it is determined the fair value of the goods or services cannot be reliably measured, and are recorded at the date the goods or services are received. The corresponding amount is recorded to the option reserve. The fair value of options is determined using the Black-Scholes pricing model. The number of shares and options expected to vest is reviewed and adjusted at the end of each reporting period such that the amount recognised for services received as consideration for the equity instruments granted is based on the number of equity instruments that eventually vest. Cash and Cash Equivalents Cash and cash equivalents include cash on hand, deposits available on demand with banks, other short-term highly liquid investments with original maturities of three months or less, and bank overdrafts. Revenue and Other Income Revenue from the sale of goods is recognised at the point of delivery as this corresponds to the transfer of significant risks and rewards of ownership of the goods and the cessation of all involvement in those goods. Revenue recognition relating to the provision of services is determined with reference to the stage of completion of the transaction at the end of the reporting period, where outcome of the contract can be estimated reliably. Stage of completion is determined with reference to the services performed to date as a percentage of total anticipated services to be performed. Where the outcome cannot be estimated reliably, revenue is recognised only to the extent that related expenditure is recoverable. Interest revenue is recognised using the effective interest method. All revenue is stated net of the amount of goods and services tax. Trade and Other Receivables Trade and other receivables include amounts due from customers for goods sold and services performed in the ordinary course of business. Receivables expected to be collected within 12 months of the end of the reporting period are classified as current assets. All other receivables are classified as non-current assets. Trade and other receivables are initially recognised at fair value and subsequently measured at amortised cost using the effective interest method, less any provision for impairment. Trade and Other Payables Trade and other payables represent the liabilities for goods and services received by the entity that remain unpaid at the end of the reporting period. The balance is recognised as a current liability with the amounts normally paid within 30 days of recognition of the liability. Borrowing Costs Borrowing costs directly attributable to the acquisition, construction or production of assets that necessarily take a substantial period of time to prepare for their intended use or sale are added to the cost of those assets, until such time as the assets are substantially ready for their intended use or sale. All other borrowing costs are recognised in profit or loss in the period in which they are incurred.
30
For
per
sona
l use
onl
y

YPB Group Ltd Notes to the financial statements 31 December 2015
Note 1. Significant accounting policies
Goods and Services Tax (GST) Revenues, expenses and assets are recognised net of the amount of GST, except where the amount of GST incurred is not recoverable from the Australian Taxation Office (ATO). Receivables and payables are stated inclusive of the amount of GST receivable or payable. The net amount of GST recoverable from, or payable to, the ATO is included with other receivables or payables in the statement of financial position. Cash flows are presented on a gross basis. The GST components of cash flows arising from investing or financing activities which are recoverable from, or payable to, the ATO are presented as operating cash flows included in receipts from customers or payments to suppliers. Comparative Figures When required by Accounting Standards, comparative figures have been adjusted to conform to changes in presentation for the current financial period. Rounding of Amounts The parent entity has applied the relief available to it under ASIC Class Order 98/100. Accordingly, amounts in the financial statements and directors’ report have been rounded off to the nearest $1,000. Critical Accounting Estimates and JudgementsThe directors evaluate estimates and judgements incorporated into the financial statements based on historical knowledge and best available current information. Estimates assume a reasonable expectation of future events and are based on current trends and economic data, obtained both externally and within the Group. Key estimates Intellectual property and customer relationships The Group assesses the carrying value of intellectual property and customer relationships at the end of each reporting period by evaluating conditions and events specific to the Group that may be indicative of impairment triggers. The directors have assessed the carrying value of intellectual property and customer relationships at 31 December 2015 and determined that no impairment is required. Goodwill The Group tests annually, or more frequently if events or changes in circumstances indicate impairment, whether goodwill is impaired, in accordance with the accounting policy stated in note 1. The recoverable amounts of cash-generating units have been determined based on value-in-use calculations. These calculations require the use of assumptions, including estimated discount rates based on the current cost of capital and growth rates of the estimated future cash flows. Note 2. Operating segments Identification of reportable operating segments The Consolidated Entity is organised into operating segments as outlined below: The operating segments are based on internal reports that are reviewed and used by the Board of Directors (who are identified as the Chief Operating Decision Makers ('CODM')) in assessing performance and in determining the allocation of resources. There is no aggregation of operating segments. The CODM reviews EBITDA (earnings before interest, tax, depreciation and amortisation). The accounting policies adopted for internal reporting to the CODM are consistent with those adopted in the financial statements.
31
For
per
sona
l use
onl
y
YPB Group Ltd Notes to the financial statements 31 December 2015
Note 2. Operating segments
The information reported to the CODM is on at least a monthly basis. The introduction of YPB’s end-to-end product and services offering, as a result of the 2015 acquisitions, has resulted in the CODM’s introducing a revised internal reporting process which places more focus on the geographic location of the generated revenue rather than specific products and services. The change was deemed necessary as future revenue will essentially consist of both products and services components being combined in a dedicated agreement between YPB and the end customer, irrespective of the source of the products or services within the YPB Group. The disclosed segment report as outlined below is based on the historical reporting process that was in use up to 31 December 2015 and that has since been updated. Types of products and services The principal products and services of each of these operating segments are as follows: Covert Forensic Products
These are patented hidden, invisible particles fused into a product or packaging during orafter the manufacturing process. The tracers are inexpensive and can be used in all key product manufacturing and packaging industries including plastics, paper, inks, textiles andcoatings. They cannot be seen or removed, are non-toxic and meet food contactspecifications. YPB owns two patents over its tracer products and is the only Company currently licensed in China to supply invisible tracers. YPB's proprietary scanner detects YPB's forensic tracers. They are low cost and can beused at any point in the supply chain - from manufacture through to point-of-sale. Forensic laboratory services comprise a well-equipped laboratory service currently operating out of the Thailand office which is made available to brands to forensicallyexamine potential counterfeit products. In addition the covert services include a security consulting service that providesgovernments, corporations and intellectual property owners with solutions for deterrence ofcounterfeiting, grey markets, production diversions and fraud
Digital Solutions
A patent pending application based platform designed for governments, brands andconsumers to identify, manage, track and report counterfeit or diverted products withinsupply chains or at point-of sale. It provides opportunities for consumer engagementbetween the brand owner and customer in a simple and easily deployed application suiteavailable on all popular smartphones.
Print solutions The provision of anti-counterfeiting solutions to brands and resellers in packaging andlabelling.
32
For
per
sona
l use
onl
y

YPB Group Ltd Notes to the financial statements 31 December 2015
Note 2. Operating segments
Operating segment information Covert Forensic Digital Print
Products and
Services Solutions Solutions
Corporate Total Consolidated - 12 months to 31 December 2015
$'000 $'000 $'000
$'000 $'000
Revenue Sales to external customers 893 - 744 - 1,637 Interest revenue - - 3 74 77 Total revenue 893 - 747 74 1,714 EBITDA (921) (575) 310 (4,675) (5,861)Depreciation and amortisation (54) (179) - (668) (901)Profit/(loss) before income tax expense (975) (754) 310 (5,343) (6,762)Income tax expense - Loss after income tax expense (6,762) Assets Segment assets 678 524 491 24,073 25,766 Total assets 25,766 Liabilities Segment liabilities 514 1,451 370 2,187 4,522 Total liabilities 4,522 Covert Forensic Digital Print Product Solutions Solutions Corporate Total Consolidated - 6 months to 31 December 2014
$'000 $'000 $'000
$'000 $'000
Revenue Sales to external customers 33 37 - 4 74 Interest revenue - - - 11 11 Total revenue 33 37 - 15 85 EBITDA (666) (171) - (1,120) (1,957)Depreciation and amortisation (8) - - (307) (315)Impairment of assets - - - (2,206) (2,206)Loss before income tax expense (674) (171) - (3,633) (4,478)Income tax expense - Loss after income tax expense (4,478) Assets Segment assets 380 623 - 12,834 13,837 Total assets 13,837 Liabilities Segment liabilities 744 794 - 1,574 3,112 Total liabilities 3,112
33
For
per
sona
l use
onl
y

YPB Group Ltd Notes to the financial statements 31 December 2015
Note 2. Operating segments
Geographical information
Sales to external customers Geographical non-current
assets
12 months to 31 December
2015
6 months to 31 December
2014
31 December
2015 31 December
2014 $'000 $'000 $'000 $'000 Australia 74 52 10,883 1,172 Peoples Republic of China and HK 379 33 13,658 12,665 Thailand 489 - 700 -United States of America 772 - 525 - 1,714 85 25,766 13,837 Note 3. Revenue Consolidated
12 months to 31 December
2015
6 months to 31 December
2014 $'000 $'000 Revenue Sale of goods 1,637 74 Other revenue Interest 77 11 Revenue 1,714 85 Note 4. Loss for the year/period The loss for the year/period includes the following expenses: Consolidated
12 months to 31 December
2015
6 months to 31 December
2014 $'000 $'000 Finance costs 197 68 Research and development costs 1,380 505 Depreciation and amortisation 902 315 Impairment of goodwill - 2,206 Rental expense on operating leases - minimum lease payments 304 89
34
For
per
sona
l use
onl
y

YPB Group Ltd Notes to the financial statements 31 December 2015
Note 5. Income tax expense Consolidated
12 months to 31 December
2015
6 months to 31 December
2014 $'000 $'000 Numerical reconciliation of income tax expense and tax at the statutory rate Loss before income tax expense (6,762) (4,478) Tax at the statutory tax rate of 30% (2,029) (1,343) Tax effect amounts which are not deductible/(taxable) in calculating taxable income:
- impairment of goodwill - 662 - offshore expenses not deductible 1,093 164 - non-allowable expenses 33 2 - share options expensed during the period - 29 - tax losses not recognised 734 404
(169) (82)Difference in overseas tax rates 107 109 - timing differences not recognised 62 (27) Income tax expense - - Deferred tax assets have not been recognised in respect of the following items: - deductible temporary differences 155 109 - tax losses 615 635 770 744
Deferred tax assets have not been recognised because it is not probable that future taxable profit will be available against which the group can utilise the benefits therefrom. Note 6. Current assets - cash and cash equivalents Consolidated
31 December
2015 31 December
2014 $'000 $'000 Cash on hand 10 - Cash at bank 2,867 2,405 2,877 2,405 Note 7. Current assets - trade and other receivables Consolidated
31 December
2015 31 December
2014 $'000 $'000 Trade receivables 891 46 Sundry receivables 330 128 Receivable from Lanstead 3,347 - 4,568 174
35
For
per
sona
l use
onl
y

YPB Group Ltd Notes to the financial statements 31 December 2015
Note 7. Current assets - trade and other receivables
As announced to the market on 22 December 2015, the Company issued 20,192,307 shares to Lanstead Capital L.P. (‘Lanstead’). Lanstead, subscribed for 19,230,769 shares (the ‘Subscription Shares’), for an aggregate nominal consideration of $5,000,000. Lanstead also received 961,538 shares in lieu of payment of a $250,000 fee for entering an Equity Sharing Agreement. The Company entered into an Equity Sharing Agreement with Lanstead to allow the Company to retain much of the economic interest in the Lanstead Subscription Shares. The Equity Sharing Agreement enables the Company to secure much of the potential upside arising from the anticipated near term news flow. The aggregate consideration of $5,000,000 is to be repaid by way of an initial $750,000 (received 7 January 2016) followed by 18 monthly instalments. The non-current component of the receivable is disclosed in note 11. Note 8. Current assets - inventories Consolidated
31 December
2015 31 December
2014 $'000 $'000 Finished goods - at cost 179 136 Note 9. Non-current assets - plant and equipment Consolidated
31 December
2015 31 December
2014 $'000 $'000 Plant and equipment - at cost 388 67 Less: Accumulated depreciation (75) (41) 313 26 Reconciliations Reconciliations of the written down values at the beginning and end of the current and previous financial period/year are set out below:
Plant and
equipment Total Consolidated $'000 $'000 Balance at 1 July 2014 8 8 Additions 17 17 Exchange differences 10 10 Depreciation expense (9) (9) Balance at 31 December 2014 26 26 Additions 299 321 Additions through business combinations (note 22) 13 13Exchange differences 30 30Depreciation expense (55) (55) Balance at 31 December 2015 313 313
36
For
per
sona
l use
onl
y

YPB Group Ltd Notes to the financial statements 31 December 2015
Note 10. Non-current assets - intangibles Consolidated
31 December
2015 31 December
2014 $'000 $'000 Goodwill - at cost 3,498 2,206 Less: Accumulated impairment losses (2,206) (2,206) 1,292 - Intellectual property - at cost 16,999 12,779 Less: Accumulated amortisation (2,530) (1,683) 14,469 11,096 Customer relationships - at cost 415 - Less: Accumulated amortisation - - 415 - 16,176 11,096 Reconciliations Reconciliations of the written down values at the beginning and end of the current and previous financial period/year are set out below:
Goodwill Intellectual property
Customer relationships Total
Consolidated $'000 $'000 $'000 $'000 Balance at 1 July 2014 - 9,435 - 9,435 Additions through business combinations 2,206 548 - 2,754 Exchange differences - 1,419 - 1,419 Impairment of assets (2,206) - - (2,206)Amortisation expense - (306) - (306) Balance at 31 December 2014 - 11,096 - 11,096Additions through business combinations (note 22) 1,296 2,865 436 4,597Exchange differences (4) 1,355 (21) 1,330Amortisation expense - (847) - (847) Balance at 31 December 2015 1,292 14,469 415 16,176
37
For
per
sona
l use
onl
y

YPB Group Ltd Notes to the financial statements 31 December 2015
Note 10. Non-current assets - intangibles
* Intangible assets, other than goodwill, have finite useful lives. The current period amortisation charge for intangibleassets in included under the depreciation and amortisation expense in the statement of profit and loss and other comprehensive income.
** a) The intangible asset additions arising from the three acquisitions concluded during the financial year ended 31December 2015 amount to $4,597,000, as outlined in detail in note 22. The directors’ consider the fair value of these acquisitions to be confirmed by the arm’s length nature of the specific transaction occurring betweenknowledgeable, independent parties and an accurate reflection of their recoverable amounts in context of theYPB business model.
The fair value purchase price allocation relating to the current year’s acquisitions, namely customer relationships, intellectual property and goodwill have been provisionally determined by the directors based on available information and the Company is in the process of obtaining independent expert advice to firm up the allocations accordingly.
b) The recoverable amount of intellectual property amounting to $11,580,000 was determined using the relief from
royalty methodology. The royalty relief methodology is based on the principle that the owner of intangible assets would be prepared topay a royalty for the right to use the intangible assets if someone else owned it. The relief from royalty methodology is based on the present value of a notional royalty stream that the company would be relieved frompaying as a result of owing the intellectual property over a 20 year period. The notional royalty streams are discounted using the weighted average cost of capital of the company. In determining the revenue forecasts underpinning the royalty relief model, the directors have applied and considered the new capability of the YPB Group to provide its end customers a true end-to-end service offering that includes B2C functionality and user interaction in addition to product sales. The additional services have onlybecome available during the 2015 financial year and the full benefit of these new platforms and services willbecome reliably measurable upon full integration into the business.
In context of the new product capabilities of YPB, the directors have forecast annual revenue growth to increaseexponentially over the next 5 years and have considered an achievable medium-term revenue target to be approximately $38.8 million at the end the growth phase in 2020. The directors expect the full benefits of theCompany’s integrated sales initiatives to materialise during this period before entering a long-term growth pattern at an annual rate of at least 5%.
Apart from the above the following key assumptions were used in the royalty relief calculation: - Growth rate (from 2022 based on revenue forecasts up until that date): 5% - Royalty rate: 8% - Discount rate: 18.5%
c) Indicative sensitivity of the calculations is illustrated by the director's assessment of having to recognise an impairment charge against overall intellectual property of $265,000 for a 1% lower budgeted growth rate applied to the post exponential growth period, and an impairment charge of $983,000 for 10% lower sales revenues.
Note 11. Non-current assets - trade and other receivables Consolidated
31 December
2015 31 December
2014 $'000 $'000 Receivable from Lanstead 1,653 -
38
For
per
sona
l use
onl
y

YPB Group Ltd Notes to the financial statements 31 December 2015
Note 12. Current liabilities - trade and other payables Consolidated
31 December
2015 31 December
2014 $'000 $'000 Trade payables 1,057 334 Sundry payables and accruals 361 30 1,418 364 Note 13. Non-current liabilities - borrowings Consolidated
31 December
2015 31 December
2014 $'000 $'000 Loans to related parties 3,104 2,748 The loans were provided by Ralph Davis and related entities of John Houston. The loans provided by Ralph Davis attract nil interest rate, are unsecured and repayable on or after 1 January 2017. The loans provided by related entities of John Houston attract at a rate of 8%, are unsecured and repayable in full on or after 1 January 2017. Note 14. Equity - issued capital Consolidated
31 December
2015 31 December
2014 31 December
2015 31 December
2014 Shares Shares $'000 $'000 Ordinary shares - fully paid 170,400,287 108,921,678 33,606 17,449 Movements in ordinary share capital Details Date Shares $'000 Balance 1 July 2014 113,178,034 10,399 Elimination of YPB Limited (HK) shares on issue of acquisition
22 July 2014 (113,178,034)
-
Shares of YPB Group Limited (formerly AUV Enterprises Limited)
7 August 2014 8,257,125
-
Shares issued to formal shareholders of YPB Limited (HK)
7 August 2014 74,250,000
1,652
Issue under share-based payments 7 August 2014 187,500 30 Share placement 7 August 2014 18,750,000 3,750 Shares issued on acquisition of Brand Reporter 9 September 2014 1,752,055 385 Issued under share-based payments 14 October 2014 250,000 55 Issued under share-based payments 18 November 2014 125,000 28 Issued under share-based payments 11 December 2014 120,670 36 Share placement 11 December 2014 5,229,328 1,569 Less: Transaction costs on shares issued, net of tax - (455) Balance 31 December 2014 108,921,678 17,449
39
For
per
sona
l use
onl
y

YPB Group Ltd Notes to the financial statements 31 December 2015
Note 14. Equity - issued capital
Movements in ordinary share capital Details Date Shares $'000 Balance 31 December 2014 108,921,678 17,449 Issued under share-based payments 4 February 2015 73,333 22 Exercise of share options 6 February 2015 10,357 2 Issued under share placement 24 February 2015 10,000,000 3,000 Exercise of share options 2 March 2015 29,618 6 Exercise of share options 15 April 2015 1,607 1 Issued under Share Purchase Plan 28 April 2015 4,522,182 1,357 Shares issued on acquisition of IPP 7 May 2015 1,170,913 390 Exercise of share options 15 June 2015 7,500 2 Exercise of share options 30 June 2015 5,000 1 Shares issued on acquisition of CFC 1 September 2015 1,094,830 383 Share-based payment to executives 1 September 2015 401,283 140 Share-based payment to executives 12 October 2015 400,000 142 Shares issued on acquisition of nTouch 30 October 2015 12,857,143 3,350 Exercise of share options 16 November 2015 3,000 1 Share placement 29 December 2015 10,709,536 2,784 Shares issued to Lanstead 29 December 2015 19,230,769 5,000 Issued under share-based payments 29 December 2015 961,538 250Less: Transaction costs on shares issued, net of tax - (674) Balance 31 December 2015 170,400,287 33,606 Capital management Management controls the capital of the Group in order to maintain a sustainable debt to equity ratio, generate long-term shareholder value and ensure that the Group can fund its operations and continue as a going concern. The Group’s debt and capital include ordinary share capital, redeemable preference shares, convertible preference shares and financial liabilities, supported by financial assets. The Group is not subject to any externally imposed capital requirements. Management effectively manages the Group’s capital by assessing the Group’s financial risks and adjusting its capital structure in response to changes in these risks and in the market. These responses include the management of debt levels, distributions to shareholders and share issues. The gearing ratios for as at 31 December 2015 and 31 December 2014 are as follows: Note Consolidated
31 December
2015 31 December
2014 $ $ Total borrowings 13 3,104 2,748Less cash and cash equivalents 6 (2,877) (2,405)Net debt 227 343Total equity 21,244 10,725Total capital 21,471 11,068Gearing ratio 1% 3%
40
For
per
sona
l use
onl
y

YPB Group Ltd Notes to the financial statements 31 December 2015
Note 14. Equity - issued capital
Movements in options on issue Details Date Options $'000 Balance 1 July 2014 - -Options issued as part of the share placement 7 August 2014 750,000 - Balance 31 December 2014 750,000 -Options issued 28 April 2015 2,130,546 21 Options issued 24 February 2015 10,000,000 100 Options issued 4 February 2015 4,453,301 45 Options issued 23 January 2015 22,777,119 227 Less: options exercised (57,082) - Balance 31 December 2015 40,053,884 393 Options All options were issued for a price of 1 cent, except for options issued under the share placement. They have an exercise price of 20 cents and expire on the 31 October 2017. Note 15. Equity - reserves Consolidated
31 December
2015 31 December
2014 $'000 $'000 Foreign currency reserve 2,566 1,835 Issued options reserve 393 - Share-based payments reserve 97 97 3,056 1,932 Foreign currency translation reserve The foreign currency translation reserve is used to recognise exchange differences arising from the translation of the financial statements of foreign controlled subsidiaries to Australian dollars. Issued options reserve The issued options reserve is used to record the value of the share options issued by the Company. Share-based payments reserve The share-based payments reserve records items recognised as expenses on valuation of equity benefits including share options issued to employees and directors as part of their remuneration, and other parties as part of their compensation for services. The reserve consists of 750,000 (2014: 750,000) options granted to promoters of the Company's capital raisings. The options vest immediately; expire on October 2017; have an exercise price of $0.20 and have a fair value at grant date of $0.20; a risk-free rate of 2.50%; a dividend yield of nil and a volatility of 100%. Note 16. Financial instruments Financial risk management objectives The Group's activities expose it to a variety of financial risks: market risk (relating to foreign currency risk), credit risk and liquidity risk. The Group's overall risk management program focuses on the unpredictability of financial markets and seeks to minimise potential adverse effects on the financial performance of the Group.
41
For
per
sona
l use
onl
y

YPB Group Ltd Notes to the financial statements 31 December 2015
Note 16. Financial instruments
Risk management is carried out by senior finance executives ('finance') under policies approved by the Board of Directors ('the Board'). These policies include identification and analysis of the risk exposure of the Group and appropriate procedures, controls and risk limits. Finance identifies, evaluates and hedges financial risks within the Group's operating units. Finance reports to the Board on a monthly basis. Market risk Foreign currency risk Exposure to foreign exchange risk may result in the fair value or future cash flows of a financial instrument fluctuating due to movement in foreign exchange rates of currencies in which the Group holds financial instruments which are other than the AUD functional currency of the Group. With instruments being held by overseas operations, fluctuations in the Renminbi and US dollar may impact on the Group’s financial results Consolidated – 31 December 2015
2015 RMB$000
2015 USD$000
2015 THB$000
2014 RMB $000
2014 USD$000
2014 THB$000
Cash and cash equivalents 284 70 378 729 79 - Trade and other receivables 1,659 366 9,421 24 - - Trade and other payables (553) (344) (1,033) (245) - - Borrowings - (2,261) - - (2,254) -
Sensitivity analysis Based on the financial instruments held at 31 December 2015, had the Australian dollar weakened/strengthened by 10% against the US dollar with all other variables held constant, the Group’s post-tax profit for the period would have been $298,000 lower/higher (2014: $265,000 lower/higher).
Had the Australian dollar weakened/strengthened by 10% against the Renminbi with all other variable held constant, the Group’s post-tax profit for the period would have been $35,000 higher/lower (2014: $10,000 higher/lower).
Had the Australian dollar weakened/strengthened by 10% against the Thai Baht with all other variables held constant, the Group’s post-tax profit for the period would have been $33,000 higher/lower (2014: $- higher/lower) Liquidity risk Liquidity risk arises from the possibility that the Group might encounter difficulty in settling its debts or otherwise meeting its obligations related to financial liabilities. The Group manages this risk through the following mechanisms: – preparing forward-looking cash flow analyses in relation to its operating, investing and financing activities; – obtaining funding from a variety of sources; – maintaining a reputable credit profile; – managing credit risk related to financial assets; – only investing surplus cash with major financial institutions; and – comparing the maturity profile of financial liabilities with the realisation profile of financial assets. The table below reflects an undiscounted contractual maturity analysis for financial liabilities. Cash flows realised from financial assets reflect management’s expectation as to the timing of realisation. Actual timing may therefore differ from that disclosed. The timing of cash flows presented in the table to settle financial liabilities reflects the earliest contractual settlement dates and does not reflect management’s expectations that banking facilities will be rolled forward.
42
For
per
sona
l use
onl
y

YPB Group Ltd Notes to the financial statements 31 December 2015
Note 16. Financial instruments
Remaining contractual maturities The following tables detail the Group's remaining contractual maturity for its financial instrument liabilities. The tables have been drawn up based on the undiscounted cash flows of financial liabilities based on the earliest date on which the financial liabilities are required to be paid. The tables include both interest and principal cash flows disclosed as remaining contractual maturities and therefore these totals may differ from their carrying amount in the statement of financial position.
Effective
Interest Rate 1 year or less
Between 1 and 5 years
Remaining contractual maturities
Consolidated - 31 December 2015 % $'000 $'000 $'000 Financial assets - cash flows realisable Cash and cash equivalents 2.00% 2,877 - 2,877 Trade and other receivables - 4,568 1,653 6,221 Financial liabilities - due for payment Trade and other payables - (1,418) - (1,418)Borrowings 8.00% - (3,104) (3,104) 6,027 (1,451) 4,576
Weighted average
interest rate 1 year or less
Between 1 and 5 years
Remaining contractual maturities
Consolidated - 31 December 2014 % $'000 $'000 $'000 Financial assets - cash flows realisable Cash and cash equivalents 2.50% 2,405 - 2,405 Trade and other receivables - 174 - 174 Financial liabilities – due for payment Trade and other payables - (364) - (364)Borrowings 8.00% - (2,748) (2,748) 2,215 (2,748) (533) The cash flows in the maturity analysis above are not expected to occur significantly earlier than contractually disclosed above. Fair value of financial instruments Unless otherwise stated, the carrying amounts of financial instruments reflect their fair value. Note 17. Key management personnel disclosures Directors The following persons were directors of YPB Group Ltd during the financial year/period: John Houston (Executive Chairman) Robert Whitton (Chief Financial Officer) Geoffrey Raby Su (George) Su Ronald Langley
43
For
per
sona
l use
onl
y

YPB Group Ltd Notes to the financial statements 31 December 2015
Note 17. Key management personnel disclosures
Other key management personnel The following persons also had the authority and responsibility for planning, directing and controlling the major activities of the Group, directly or indirectly, during the financial year/period: Jens Michael (Chief Executive Officer) Richard Raju (Chief Marketing Officer) Tim Merchant (Chief Technology Officer) Ralph Davis (President - YPB Print Solutions) Compensation The aggregate compensation made to directors and other members of key management personnel of the Group is set out below: Consolidated
12 months to 31 December
2015
6 months to 31 December
2014 $ $ Short-term employee benefits 1,505,933 454,462 Post-employment benefits 280,499 82,500 1,786,432 536,962 Short-term employee benefits These amounts include fees and benefits paid to executive and non-executive directors as well as all salary, paid leave benefits, fringe benefits and cash bonuses awarded to other KMP. Share-based payments These amounts represent the expense related to participation of KMP in equity-settled benefit schemes as measured by the fair value of the options, rights and shares granted on grant date. Refer to the remuneration report contained in the directors' report for details of the remuneration paid or payable to each member of the Group's key management personnel (KMP) for the year ended 31 December 2015 and the period ended 31 December 2014.
44
For
per
sona
l use
onl
y

YPB Group Ltd Notes to the financial statements 31 December 2015
Note 18. Remuneration of auditors During the financial year/period the following fees were paid or payable for services provided by the auditor of the Company: Consolidated
12 months to 31 December
2015
6 months to 31 December
2014 $ $ Audit services - Audit or review of the financial report 65,000 35,000 Other services - Corporate services - 30,000 65,000 65,000 Component auditors - Audit or review of the financial report 46,030 2,400 Note 19. Contingencies and commitments Operating lease commitments Consolidated
31 December
2015 31 December
2014 $'000 $'000 Within one year 240 192 Later than one year but not later than five years 327 501 567 693 The Group had no contingent liabilities as at 31 December 2015 and 2014 Note 20. Related party transactions Parent entity YPB Group Ltd is the parent entity. Subsidiaries Interests in subsidiaries are set out in note 23. Key management personnel Disclosures relating to key management personnel are set out in note 17 and the remuneration report in the directors' report.
45
For
per
sona
l use
onl
y
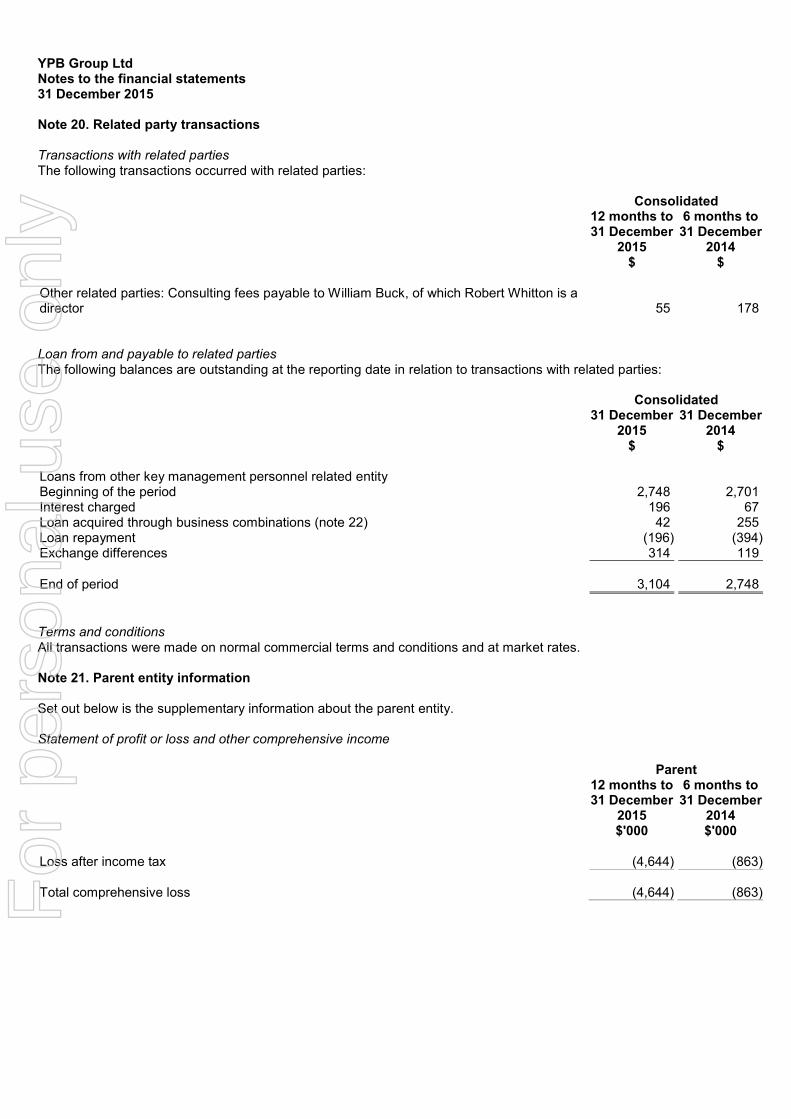
YPB Group Ltd Notes to the financial statements 31 December 2015
Note 20. Related party transactions
Transactions with related parties The following transactions occurred with related parties: Consolidated
12 months to 31 December
2015
6 months to 31 December
2014 $ $ Other related parties: Consulting fees payable to William Buck, of which Robert Whitton is a director
55 178
Loan from and payable to related parties The following balances are outstanding at the reporting date in relation to transactions with related parties: Consolidated
31 December
2015 31 December
2014 $ $ Loans from other key management personnel related entity Beginning of the period 2,748 2,701 Interest charged 196 67 Loan acquired through business combinations (note 22) 42 255 Loan repayment (196) (394)Exchange differences 314 119 End of period 3,104 2,748 Terms and conditions All transactions were made on normal commercial terms and conditions and at market rates. Note 21. Parent entity information Set out below is the supplementary information about the parent entity. Statement of profit or loss and other comprehensive income Parent
12 months to 31 December
2015
6 months to 31 December
2014 $'000 $'000 Loss after income tax (4,644) (863) Total comprehensive loss (4,644) (863)
46
For
per
sona
l use
onl
y

YPB Group Ltd Notes to the financial statements 31 December 2015
Note 21. Parent entity information
Statement of financial position Parent
31 December
2015 31 December
2014 $'000 $'000 Total current assets 6,480 2,193 Total assets 17,149 4,364 Total current liabilities 1,167 287 Total liabilities 1,167 287 Equity
Issued capital 38,644 22,488 Options reserve 393 - Share-based payments reserve 97 97 Accumulated losses (23,152) (18,508)
Total equity 15,982 4,077 Guarantees entered into by the parent entity in relation to the debts of its subsidiaries There have been no guarantees entered into by the parent entity in relation to the debts of its subsidiaries. Contingent liabilities There were no contingent liabilities at 31 December 2015 and 2014 which related to the parent entity. Contractual commitments There were no contractual commitments at 31 December 2015 and 2014 which related to the parent entity.
47
For
per
sona
l use
onl
y

YPB Group Ltd Notes to the financial statements 31 December 2015
Note 22. Business combinations Acquisition of Intellectual Property Protection Co Ltd and Intellectual Product Protection Inc (IPP) On 7 May 2015, the Company acquired a security consulting business specialising in providing high security programs to governments, major brands and fortune 500 companies which operates under the name "Intellectual Product Protection" or "IPP" for a consideration of $641,000 (US$500,000) of which $252,000 (US$200,000) was paid/payable in cash and the balance by the issue shares in YPB Group Limited as shown in Note 14. Details of the acquisition are as follows: Fair value $'000 Cash and cash equivalents 21 Trade and other receivables 118 Intellectual property 520 Plant and equipment 13 Trade and other payables (5)Borrowings – unrelated party (26) Net assets acquired 641 Goodwill - Acquisition-date fair value of the total consideration transferred 641 Representing: - Cash paid / payable 252 - Issuance of shares 389 641 Purchase consideration - cash outflow Cash consideration 252 Less: Unpaid cash (126)Less: Cash and cash equivalents (21) Net cash used 105 Revenue of IPP included in the consolidated revenue of the Group since the acquisition date amounted to $504,190. Loss of IPP included in the consolidated profit or loss statement of the Group since the acquisition date amounted to $42,954. Had the results of IPP been consolidated from 1 January 2015, revenue of the consolidated group would have been $756,285 and the consolidated loss would have been $101,154 for the year ended 31 December 2015. At the time the financial statements were authorised for issue, the Group had not yet completed the accounting for acquisition of IPP. In particular, the fair values of the assets and liabilities disclosed above have only been determined provisionally as the independent valuations have not been finalised.
48
For
per
sona
l use
onl
y

YPB Group Ltd Notes to the financial statements 31 December 2015
Note 22. Business combinations
Acquisition of Continuous Forms Control Inc (CFC) Effective 31 August 2015, the Company acquired all the issued shares of the US based printing company Continuous Forms Control Inc., since renamed YPB Print Solutions Inc. ('Print Solutions') for a consideration of $1,007,000 (US$600,000) of which $285,000 (US$300,000) was paid/payable in cash, $339,000 (US$243,000) was settled of pre-existing relationships and the balance by the issue of shares in YPB Group Limited. Details of the acquisition are as follows: Fair value $'000 Cash and cash equivalents (33)Trade and other receivables 460 Inventories 32 Intangible assets - customer relationships 436 Trade and other payables (137)Financial liabilities (42) Net assets acquired 716 Goodwill 291 Acquisition-date fair value of the total consideration transferred 1,007 Representing: - Cash paid / payable 285 - Issuance of shares 383 - Pre-existing relationships 339 1,007 Purchase consideration - cash outflow Cash consideration 285 Add: Cash and cash equivalents 33 Net cash used 318 Revenue of CFC included in the consolidated revenue of the Group since the acquisition date amounted to $257,558. Loss of CFC included in the consolidated profit or loss statement of the Group since the acquisition, date amounted to $174,212. Had the results of CFC been consolidated from 1 January 2015, revenue of the consolidated group would have been $743,545 and the consolidated loss would have been $130,074 for the year ended 31 December 2015. At the time the financial statements were authorised for issue, the Group had not yet completed the accounting for acquisition of CFC. In particular, the fair values of the assets and liabilities disclosed above have only been determined provisionally as the independent valuations have not been finalised.
49
For
per
sona
l use
onl
y

YPB Group Ltd Notes to the financial statements 31 December 2015
Note 22. Business combinations
Acquisition of nTouch Holdings Pty Ltd (nTouch) Effective 31 October 2015, the company acquired all the issued shares of proximity marketing technology company nTouch Holdings Pty Ltd ('nTouch'). The transaction was based on an all script offering of 12,857,143 YPB shares at a price of 35c per share. Management has however determined that the fair value of the YPB shares is $0.26 per share, on the basis that shares placed at and around this time were at $0.26. nTouch is a unique marketing platform that leverages proximity technologies to allow business clients to engage with customers (B2C) based on time, location and specific user characteristics. The nTouch group of companies has launched a fully tested communications platform which integrates with YPB’s customer engagement strategy around product authenticity. Details of the acquisition are as follows: Fair value $'000 Intangible assets - intellectual property 2,345 Net assets acquired 2,345 Goodwill 1,005 Acquisition-date fair value of the total consideration transferred 3,350 Representing: - Issuance of shares 3,350 Revenue of nTouch included in the consolidated revenue of the Group since the acquisition date amounted to $nil. Loss of nTouch included in the consolidated profit or loss statement of the Group since the acquisition date amounted to $56,568. Had the results of nTouch been consolidated from 1 January 2015, revenue of the consolidated group would have been $nil and the consolidated loss would have been $538,648 for the year ended 31 December 2015. At the time the financial statements were authorised for issue, the Group had not yet completed the accounting for acquisition of nTouch. In particular, the fair values of the assets and liabilities disclosed above have only been determined provisionally as the independent valuations have not been finalised.
50
For
per
sona
l use
onl
y
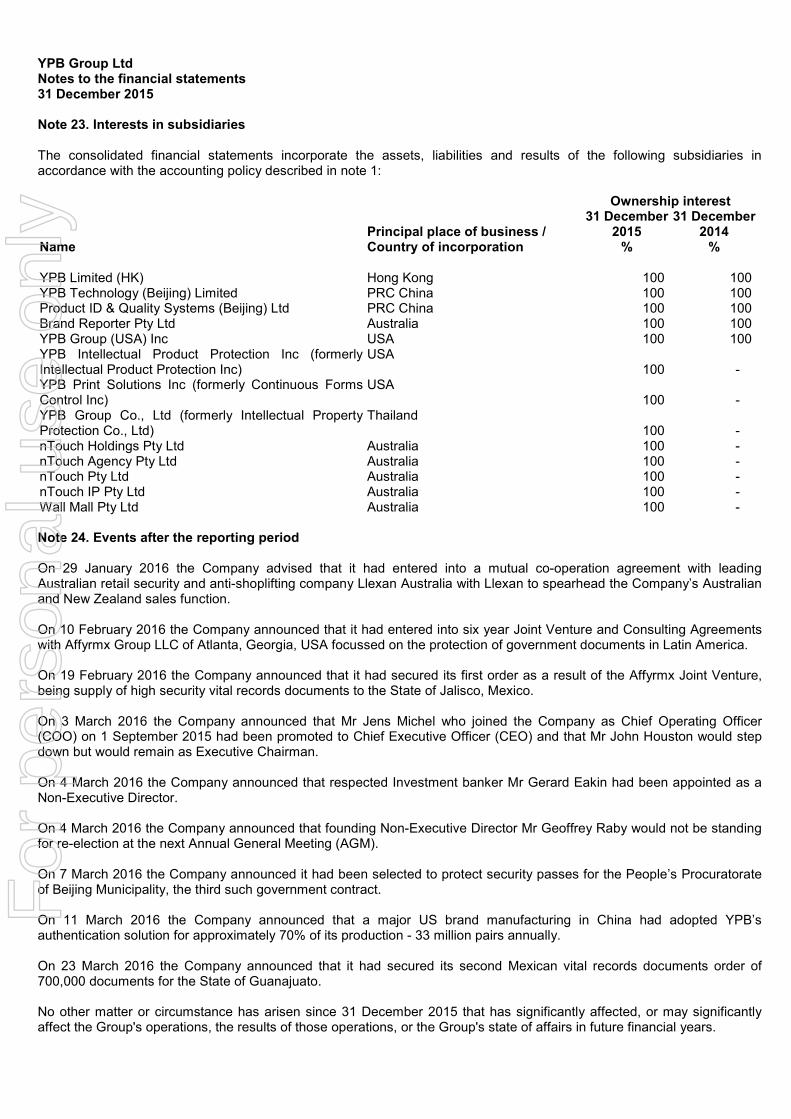
YPB Group Ltd Notes to the financial statements 31 December 2015
Note 23. Interests in subsidiaries The consolidated financial statements incorporate the assets, liabilities and results of the following subsidiaries in accordance with the accounting policy described in note 1: Ownership interest
Principal place of business / 31 December
2015 31 December
2014 Name Country of incorporation % % YPB Limited (HK) Hong Kong 100 100 YPB Technology (Beijing) Limited PRC China 100 100 Product ID & Quality Systems (Beijing) Ltd PRC China 100 100 Brand Reporter Pty Ltd Australia 100 100 YPB Group (USA) Inc USA 100 100 YPB Intellectual Product Protection Inc (formerly Intellectual Product Protection Inc)
USA 100 -
YPB Print Solutions Inc (formerly Continuous Forms Control Inc)
USA 100 -
YPB Group Co., Ltd (formerly Intellectual Property Protection Co., Ltd)
Thailand 100 -
nTouch Holdings Pty Ltd Australia 100 - nTouch Agency Pty Ltd Australia 100 - nTouch Pty Ltd Australia 100 - nTouch IP Pty Ltd Australia 100 - Wall Mall Pty Ltd Australia 100 - Note 24. Events after the reporting period On 29 January 2016 the Company advised that it had entered into a mutual co-operation agreement with leading Australian retail security and anti-shoplifting company Llexan Australia with Llexan to spearhead the Company’s Australian and New Zealand sales function. On 10 February 2016 the Company announced that it had entered into six year Joint Venture and Consulting Agreements with Affyrmx Group LLC of Atlanta, Georgia, USA focussed on the protection of government documents in Latin America. On 19 February 2016 the Company announced that it had secured its first order as a result of the Affyrmx Joint Venture, being supply of high security vital records documents to the State of Jalisco, Mexico. On 3 March 2016 the Company announced that Mr Jens Michel who joined the Company as Chief Operating Officer (COO) on 1 September 2015 had been promoted to Chief Executive Officer (CEO) and that Mr John Houston would step down but would remain as Executive Chairman. On 4 March 2016 the Company announced that respected Investment banker Mr Gerard Eakin had been appointed as a Non-Executive Director. On 4 March 2016 the Company announced that founding Non-Executive Director Mr Geoffrey Raby would not be standing for re-election at the next Annual General Meeting (AGM). On 7 March 2016 the Company announced it had been selected to protect security passes for the People’s Procuratorate of Beijing Municipality, the third such government contract. On 11 March 2016 the Company announced that a major US brand manufacturing in China had adopted YPB’s authentication solution for approximately 70% of its production - 33 million pairs annually. On 23 March 2016 the Company announced that it had secured its second Mexican vital records documents order of 700,000 documents for the State of Guanajuato. No other matter or circumstance has arisen since 31 December 2015 that has significantly affected, or may significantly affect the Group's operations, the results of those operations, or the Group's state of affairs in future financial years.
51
For
per
sona
l use
onl
y

YPB Group Ltd Notes to the financial statements 31 December 2015
Note 25. Reconciliation of loss after income tax to net cash used in operating activities Consolidated
12 months to 31 December
2015
6 months to 31 December
2014 $'000 $'000 Loss after income tax expense for the year/period (6,762) (4,478) Adjustments for: Accrued interest on borrowings - 67 Depreciation and amortisation expense 902 315 Impairment of goodwill - 2,206 Options expense - 97 Share-based payments 282 113 Change in operating assets and liabilities; net of the effects of purchase and disposal of subsidiaries
(Increase) in trade and other receivables (470) (108)(Increase) in inventories (10) (28)Increase/(decrease) in trade and other payables 367 (249)
Net cash used in operating activities (5,691) (2,065)
52
For
per
sona
l use
onl
y

YPB Group Ltd Notes to the financial statements 31 December 2015
Note 26. Earnings per share Consolidated
12 months to 31 December
2015
6 months to 31 December
2014 $'000 $'000 Loss after income tax attributable to the owners of YPB Group Ltd (6,762) (4,478) Number Number Weighted average number of ordinary shares used in calculating basic earnings per share 124,326,070 103,739,417 Weighted average number of ordinary shares used in calculating diluted earnings per share 124,326,070 103,739,417 Cents Cents Basic and diluted earnings per share (5.44) (4.32) Due to losses of the YPB Group, diluted earnings per share have not been presented. Note 27. Company details The registered office of the company and principal place of business is: YPB Group Limited Level 29, 66 Goulburn Street Sydney NSW, Australia
53
For
per
sona
l use
onl
y

Directors’ Declaration The directors of the Company declare that: 1. the financial statements and notes, as set out on pages 19 to 53, are in accordance with the
Corporations Act 2001 and:
a. comply with Accounting Standards and the Corporations Regulations 2001; and b. give a true and fair view of the financial position as at 31 December 2015 and of the
performance for the year ended on that date of the Company and the Consolidated entity; 2. the Chief Executive Officer and Chief Financial Officer have each declared that:
a. the financial records of the Company for the financial year have been properly maintained in accordance with section 268 of the Corporations Act 2001;
b. the financial statements and notes for the financial year comply with the Accounting Standards; and
c. the financial statements and notes for the financial year give a true and fair view; 3. in the directors’ opinion there are reasonable grounds to believe that the Company will be able to
pay its debts as and when they become due and payable. This declaration is made in accordance with a resolution of the directors.
John Houston Robert Whitton Executive Chairman Company Secretary Dated this 31st day of March 2016 at Sydney
54
For
per
sona
l use
onl
y

YPB GROUP LIMITED
ACN 108 649 421 AND CONTROLLED ENTITIES
INDEPENDENT AUDITOR’S REPORT TO THE MEMBERS OF
YPB GROUP LIMITED
Report on the Financial Report
We have audited the accompanying financial report of YPB Group Limited, which comprises the
consolidated statement of financial position as at 31 December 2015, the consolidated statement of
profit or loss and other comprehensive income, the consolidated statement of changes in equity and
the consolidated statement of cash flows for the year then ended, notes comprising a summary of
significant accounting policies and other explanatory information and the directors’ declaration of the
consolidated entity comprising the company and the entities it controlled at the year’s end or from
time to time during the financial year.
Directors’ Responsibility for the Financial Report
The directors of the company are responsible for the preparation of the financial report that gives a
true and fair view in accordance with Australian Accounting Standards and the Corporations Act 2001
and for such internal control as the directors determine is necessary to enable the preparation of the
financial report that is free from material misstatement, whether due to fraud or error. In Note 1 the
directors also state, in accordance with Accounting Standard AASB 101: Presentation of Financial
Statements, that the financial statements comply with International Financial Reporting Standards
(IFRS).
Auditor’s Responsibility
Our responsibility is to express an opinion on the financial report based on our audit. We conducted
our audit in accordance with Australian Auditing Standards. Those standards require that we comply
with relevant ethical requirements relating to audit engagements and plan and perform the audit to
obtain reasonable assurance whether the financial report is free from material misstatement.
An audit involves performing procedures to obtain audit evidence about the amounts and disclosures
in the financial report. The procedures selected depend on the auditor’s judgement, including the
assessment of the risks of material misstatement of the financial report, whether due to fraud or error.
In making those risk assessments, the auditor considers internal control relevant to the entity’s
preparation and fair presentation of the financial report in order to design audit procedures that are
appropriate in the circumstances, but not for the purpose of expressing an opinion on the
effectiveness of the entity’s internal control. An audit also includes evaluating the appropriateness of
accounting policies used and the reasonableness of accounting estimates made by the directors, as
well as evaluating the overall presentation of the financial report.
We believe that the audit evidence we have obtained is sufficient and appropriate to provide a basis
for our audit opinion.
Independence
In conducting our audit, we have complied with the independence requirements of the Corporations
Act 2001.
55
For
per
sona
l use
onl
y

YPB GROUP LIMITED
ACN 108 649 421 AND CONTROLLED ENTITIES
INDEPENDENT AUDITOR’S REPORT TO THE MEMBERS OF
YPB GROUP LIMITED
Auditor’s Opinion
In our opinion:
a. the financial report of YPB Group Limited is in accordance with the Corporations Act
2001 including:
i. giving a true and fair view of the consolidated entity’s financial position as at
31 December 2015 and of its performance for the year ended on that date;
and
ii. complying with Australian Accounting Standards and the Corporations
Regulations 2001; and
b. the financial report also complies with International Financial Reporting Standards as
disclosed in Note 1.
Emphasis of Matter
Without modifying our opinion, we draw attention to Note 10 in the financial report which details the basis of valuing the intangible assets as at 31 December 2015. The measurement of the intangible assets is based on relief from royalty methodology which determines the recoverable amount at present value of a notional royalty stream at 8% of forecast revenue over 20 years. These conditions, along with other matters as set forth in Note 10, indicate the existence of material uncertainty that may cast doubt about the consolidated entity’s ability to generate the forecasted revenue to justify the carrying value of intangibles at the amounts stated in the financial report.
Report on the Remuneration Report
We have audited the remuneration report included in pages 12 - 15 of the directors’ report for the year ended 31 December 2015. The directors of the company are responsible for the preparation and presentation of the remuneration report in accordance with s300A of the Corporations Act 2001. Our responsibility is to express an opinion on the remuneration report, based on our audit conducted in accordance with Australian Auditing Standards.
Auditor’s Opinion
In our opinion the remuneration report of YPB Group Limited for the year ended 31 December
2015 complies with s300A of the Corporations Act 2001.
HALL CHADWICK Level 40, 2 Park Street SYDNEY NSW 2000
GRAHAM WEBB
Partner Dated: 31 March 2016
56
For
per
sona
l use
onl
y

Shareholder Information Distribution of holders The number of holders and amount of holdings by a range of holding sizes of the ordinary shares and options as at 24 March 2016 are detailed below.
Holding Size Ordinary Shares No. of holders Shares Held 1 – 1,000 59 12,5661,001 – 5,000 118 346,8445,001 – 10,000 126 1,127,51010,001 – 100,000 315 12,537,737100,001 – and over 100 157,385,630 718 171,410,287
Number of holdings less than a marketable parcel of 94. Substantial Shareholders The names of substantial shareholders listed in the Company’s register as at 24 March 2016 are:
Number of Shares Held
THE BIMM CORPORATION PTY LTD <FJ FUND A/C> 60,318,453 BNP PARIBAS PTY LTD <GLOBAL PRIME OMNI DRP> 18,192,307
Voting Rights The voting rights attached to each class of equity security are as follows: (a) Each ordinary share holder is entitled to one vote when a poll is called, otherwise each member present
at a meeting or by proxy has one vote on a show of hands. $0.20 options expiring 31 October 2017
Holding Size Options No. of holders Options Held 1-1,000 31 10,6011,001 - 5,000 81 242,2865,001 – 10,000 47 343,65110,001 – 100,000 118 4,080,642100,001 – and over 28 35,366,704 305 40,043,884
57
For
per
sona
l use
onl
y

Top 20 Ordinary Shareholders as at 24 March 2016
THE BIMM CORPORATION PTY LTD <FJ FUND A/C> 60,368,453 BNP PARIBAS NOMINEES PTY LTD <GLOBAL PRIME OMNI DRP> 18,192,307 HIGH ALTITUDE INVESTMENTS LIMITED 5,496,716 PERLE VENTURES PTY LTD <877 CAP INVESTMENTS 2 A/C> 5,000,000 ACK PTY LTD <MARKOFF FAMILY A/C> 4,000,000 HSBC CUSTODY NOMINEES (AUSTRALIA) LIMITED 3,436,454 MR RONALD LANGLEY & MRS RHONDA LANGLEY 3,333,333 SELBY SUPER PTY LTD <MARC SELBY SUPER FUND A/C> 3,296,703 MS DAN LIU 3,098,092 JEFFREY MARKOFF 2,564,103 SILK ROAD CORPORATE FINANCE PTY LTD 2,398,624 ABN AMRO CLEARING SYDNEY NOMINEES PTY LTD <CUSTODIAN A/C> 2,087,200 MR VICTOR JOHN PLUMMER 2,050,000 XETERA LIMITED 1,640,116 J P MORGAN NOMINEES AUSTRALIA LIMITED 1,355,200 CITICORP NOMINEES PTY LIMITED 1,345,000 MCNEIL NOMINEES PTY LIMITED 1,335,000 MR DAVID KINSMAN 1,297,933 GLENCO PROPERTIES PTY LTD 1,250,000 ONE MANAGED INVESTMENT FUNDS LTD <1 A/C> 1,222,810
124,768,044 Balance of Register 46,642,243
TOTAL 171,410,287 Top 20 Option Holders as at 24 March 2016
THE BIMM CORPORATION PTY LTD <FJ FUND A/C> 15,089,413 PERLE VENTURES PTY LTD <877 CAP INVESTMENTS 2 A/C> 4,900,000 MR RONALD LANGLEY & MRS RHONDA LANGLEY 3,333,333 MR VICTOR JOHN PLUMMER 2,012,500 TECHINVEST HOLDINGS PTY LTD <ANM A/C> 1,070,000 SHEARER-SMITH HOLDINGS PTY LTD <JASON SHEARER-SMITH FAM A/C> 808,333 MS DAN LIU 774,523 CLEAR CHANNEL PTY LTD <CLEAR CHANNEL SUPERFUND A/C> 743,750 HSBC CUSTODY NOMINEES (AUSTRALIA) LIMITED 701,489 SLADE TECHNOLOGIES PTY LTD <EMBREY FAMILY SUPERFUND A/C> 650,000 SILK ROAD CORPORATE FINANCE PTY LTD 599,656 MR BROCK LACHLAN RODWELL 599,500 MR LEO FERDINANDO CESTER & MRS MARIA HENDRIKA CESTER <CESTER SUPER FUND A/C> 494,860 GREGORY J WOOD & ASSOCIATES PTY LTD <THE G J WOOD FAMILY A/C> 414,400 SHIPLEY NOMINEES PTY LTD 400,000 IHODS SUPER FUND PTY LTD <VAD SUPER FUND A/C> 343,750 MR NEIL ATHERTON DAY & DR PAUL MELVILLE DAY <NEIL ATHERTON DAY SUPER A/C> 297,044 FERNHILL INVESTMENTS PTY LTD <GRAEME PEARSON FAMILY A/C> 293,750 ANTANG INVESTMENTS PTY LTD <ANTHONY ZAITA FAMILY A/C> 271,890 DR PAUL ANTHONY PORTER & DR TI-WAN NG <PORTER FAMILY A/C> 240,000 34,038,191
Balance of Register 6,005,693 TOTAL 40,043,884
On-Market Buy Back There is currently no on-market buy back.
58
For
per
sona
l use
onl
y
Corporate Directory REGISTERED OFFICE DIRECTORS Level 29, 66 Goulburn Street John Houston Sydney NSW 2060 Geoffrey Raby ABN 68 108 649 421 George (Su) Su Telephone: +612 8263 4000 Robert Whitton Facsimile: +612 8263 4111 Ronald Langley Website: www.ypbsystems.com Gerard Eakin SHARE REGISTRY COMPANY SECRETARY Boardroom Pty Limited Robert Whitton Level 7, 207 Kent Street Sydney NSW 2000 Telephone: 1300 737 760 Facsimile: 1300 653 459 Email: [email protected] Web site: www.boardroomlimited.com.au AUDITORS Hall Chadwick Level 40, 2 Park Street Sydney NSW 2000 Telephone: +612 9263 2600 Facsimile: +612 9263 2800 STOCK EXCHANGE LISTING The shares of YPB Group Ltd are listed on the Australian Stock Exchange.
ASX Code: Ordinary Shares YPB 31 October 2017 Options YPBO
Web site: www.asx.com.au
59
For
per
sona
l use
onl
y