for personal use only - asx2015/09/30 · scott dundas fund manager 98.4 % occupancy $ 2.26 b...
TRANSCRIPT

Annual Report2015
Charter Hall Retail REIT
Charter H
all Retail R
EIT
Annual R
epo
rt 2015
For
per
sona
l use
onl
y

INSIDE
Charter Hall Retail REIT
Charter Hall Group
ABOUT US
Charter Hall Retail REIT invests in high quality neighbourhood and sub-regional centres with a combined value of $2.26 billion. We have 75 properties with a portfolio that has over 50% of annual base rent derived from Wesfarmers and Woolworths.
With a focus on non-discretionary retail, we optimise returns for our investors and create enjoyable environments for the 100 million shopper visitations to our centres each year, by providing end-to-end property services to our entire portfolio.
Charter Hall Retail REIT is managed by Charter Hall Group (ASX: CHC), one of Australia’s leading property groups which owns and manages office, retail, industrial and hospitality properties on behalf of institutional, wholesale and retail clients, with funds under management totalling $14.5 billion as at 30 September 2015.
IFC About Us
02 Letter from the Chair
and the Fund Manager
04 Our Key Results
06 Our Strategy
08 Our Performance
10 Sustainability
12 Australian Property Portfolio
20 Our Board and Fund Management
23 Financial Report
79 Investor Information
80 Corporate Directory
Cover image Lansell Square, Bendigo, Vic
For
per
sona
l use
onl
y

FY15 HIGHLIGHTS
Annual Report 2015 1
Charter Hall Retail REIT offers investors exposure to a portfolio of supermarket anchored shopping centres that aim to provide a secure and growing income stream. Our geographically diverse portfolio benefits from exposure to key markets across a number of growth regions in Australia.”Scott DundasFUND MANAGER
98.4 %OCCUPANCY
$ 2.26 bPORTFOLIO VALUE
27.50 cpuDISTRIBUTIONS PER UNIT
$ 3.59NET TANGIBLE ASSET
For
per
sona
l use
onl
y

2 Charter Hall Retail REIT
Letter from the Chair and the Fund Manager
This reporting period has seen the REIT focused on driving value from its Australian supermarket anchored portfolio and its strong balance sheet.
Our performance is underpinned by a continued focus on active asset management, enhanced portfolio quality and prudent capital management to continue to deliver a secure and growing income stream to our unitholders.
Managing our Australian portfolioCharter Hall Retail REIT is one of the largest owners of high quality supermarket anchored shopping centres, with a portfolio valued at $2.26 billion. Since completing the disposal of our international property portfolio last year, we have been actively managing and enhancing our 75 strong property portfolio.
Our team of national retail property specialists are focused on fostering lasting partnerships with our tenants to ensure we optimise the tenancy mix of the portfolio via proactive leasing and enhance the overall shopper experience for the 100 million shopper visitations per year.
This active management approach has seen us achieve same property net operating income (NOI) growth of 2.4% and stable portfolio occupancy of 98.4%.
Specialty moving annual turnover (MAT) growth increased to 2.8% for the period, continuing the positive momentum for specialty tenant sales in the REIT’s portfolio. Anchor MAT growth was 1.0%, reflecting the more subdued trading conditions for the REIT’s anchor tenants.
Our team completed 122 lease renewals and 1852 new specialty tenant leases including our first two Aldi supermarket transactions in WA and SA. The new Aldi tenancies will form part of the redevelopments of our centres located at Secret Harbour, WA and Southgate Plaza, SA.
Portfolio property valuations increased by $86.7 million or 4.2%, with total weighted average cap rates continuing to firm, demonstrating the strong investor interest in this asset class.
Portfolio acquisitions and enhancementsWe have continued to enhance the quality of the portfolio through strategic acquisitions and divestments during the year, recycling out of non-core properties into larger assets with forecast higher growth characteristics.
We acquired four supermarket anchored shopping centres, two post balance date, for $192.0 million at an average initial yield of 7.2%. All centres – Coomera Square, Qld, Brickworks Marketplace, SA, Goulburn Plaza, NSW and Katherine Central, NT, are located in high growth corridors or operate as the primary shopping centre in the region, and are within the REIT’s investment criteria. These acquisitions were primarily funded using the proceeds from the sale of a number of non-core retail properties and a $50 million institutional placement, completed in August 2015.
We completed two major redevelopments during the year, Caboolture Square, Qld and Lansell Square, Vic. Lansell Square is trading in line with expectations and is 95.5% leased, with Caboolture Square taking longer to lease than originally expected, with stabilisation now expected by the end of FY16.
We are proud to have delivered a sound result for the year, reporting operating earnings of 29.7 cents per unit or $110.8 million, stable performance across our portfolio and an increase in the portfolio value by 13.5% to $2.26 billion1.
29.7 cpuOPERATING EARNINGS
$ 2.26 bPORTFOLIO VALUE
1 Includes Goulburn and Katherine, post balance date acquisitions.
2 Includes 147 non-comparable new lease deals that do not impact specialty rent growth.
For
per
sona
l use
onl
y

Annual Report 2015 3
Value enhancing redevelopments will always be a key element of our growth strategy. Further major redevelopments are planned at Secret Harbour, WA, with a number of minor project works currently underway across the portfolio, including anchor tenant expansions and communal space upgrades, to deliver real value to our existing centres, communities and unitholders.
Prudent capital managementWe completed a number of significant capital management initiatives and transactions during the year that will ensure that we are well positioned for the future, including the US$200 million (A$252 million) US Private Placement (USPP).
These initiatives have increased the REIT’s weighted average debt maturity from 3.7 years to 5.8 years. In recognition of our strong balance sheet, Moody’s assigned an issuer credit rating of Baa1 to the REIT.
The response from US investors to this inaugural issue was very positive, with the offering being approximately six times oversubscribed. This is a reflection of the quality of the REIT’s non-discretionary focused portfolio and its resilient income streams.
Given the REIT’s focus on financial management, strong balance sheet and liquidity, we are well positioned to capitalise on acquisition and redevelopment opportunities as they arise.
Final distributionThe Board was pleased to declare a distribution of 13.80 cents per unit for the half year ended 30 June 2015, representing a full year distribution of 27.50 cents per unit.
The active management of the portfolio continues to be a key focus, and we will continue to work with tenants to deliver enjoyable shopping centre experiences while focusing on leasing and development to maximise property returns for unitholders.
With ongoing investment in this asset class resulting in yields on high quality assets tightening sharply over the past six months, we are expecting to see growth in the value of the REIT’s portfolio over the balance of FY16.
An enormous amount has been achieved in FY15, and we would like to thank our team for their contribution through hard work, enthusiasm and dedication over the past 12 months. On behalf of the Board and management, we would like to thank all our unitholders, our tenants and the loyal shoppers who visit our centres every day for their continued support and investment in the REIT.
John HarknessChair
Scott DundasFund Manager
For
per
sona
l use
onl
y

4 Charter Hall Retail REIT
Our Key Results
With a focused and disciplined use of capital, the REIT has executed on its goal to establish a best practice capital structure, to align with its resilient property portfolio.”Philip SchretzmeyerDEPUTY FUND MANAGER
29.7cpuOPERATING EARNINGS PER UNIT
$ 110.8mOPERATING EARNINGS UP 5.2%
98.4%OCCUPANCY
27.50 cpuDISTRIBUTIONS PER UNIT – UP 0.7% ON FY14
For
per
sona
l use
onl
y

Annual Report 2015 5
$ 2.26 bAUSTRALIAN PORTFOLIO VALUE – 13.5% INCREASE IN VALUE
2.4%SAME PROPERTY NOI GROWTH
For
per
sona
l use
onl
y

6 Charter Hall Retail REIT
Our Strategy
OUR GOAL
To be the pre-eminent owner and manager of Australian neighbourhood and sub-regional supermarket anchored shopping centres.
“ Our team of retail property specialists have worked closely with our 1,667 tenants during the year to strengthen existing relationships and build new ones. This approach has seen the REIT complete its first two leasing transactions with Aldi, a complementary offering to the larger supermarket formats that already anchor our centres.”GREG CHubb, HEAD OF RETAIL PROPERTY SERVICES
“ Our focus is on continuing to strengthen and improve the quality of our portfolio. Brickworks Marketplace is a perfect fit for the REIT, with the centre servicing an established local community and providing much needed convenience based shopping to the area.” SCoTT DuNDAS, FUND MANAGER
“ The response from US investors to this inaugural issue was very positive, with the offering being approximately six times oversubscribed. This is a reflection of the quality of the REIT’s non-discretionary focused portfolio and reflects the REIT’s focus on prudent capital management.” PHILIP SCHRETzMEYER, DEPUTY FUND MANAGER
For
per
sona
l use
onl
y

Annual Report 2015 7
The introduction of Aldi to our portfolioThe active management of our portfolio remains our key focus. The strength of the Aldi business model and brand has seen them grow into the third force in the Australian grocery sector. This year we completed our first leasing transaction with Aldi which will see them form part of the redevelopment of the Secret Harbour Shopping Centre in WA.
This development will be completed in FY17 and will coincide with the introduction of the Aldi brand into this market.
In addition, Aldi has also committed to a lease at our Southgate Plaza shopping centre in SA. The centre occupies a prominent site in Adelaide’s southern suburb of Morphett Vale and is anchored by a Coles and Target. The addition of Aldi will complement these larger format retailers.
As the REIT focuses on redevelopments and enhancements we will seek to incorporate more Aldi stores into our centres which will add increased interest from national retailers and further deliver
an enjoyable and convenient shopping experience for the communities we operate in.
The active management of the portfolio and focus we place on building strong relationships with new and existing tenant customers further enhances our position as Australia’s leading owner of non-discretionary retail properties.
The REIT’s performance is underpinned by a focus on three key areas:
brickworks Marketplace, Adelaide SAIn line with its disciplined investment strategy, the REIT has continued to focus on recycling from non-core properties into larger assets with forecast higher growth characteristics.
Charter Hall Retail REIT acquired land in Torrensville, Adelaide SA in December 2014 from Woolworths Limited (Woolworths), through its joint venture partnership, known as Charter Hall Retail Partnership No.1 (CHRP1).
The land comprised the future site of Brickworks Marketplace, a shopping centre which was being developed by Woolworths.
Construction was completed in June 2015 on this new 16,896sqm sub-regional centre, anchored by a full line Woolworths supermarket, BIG W discount department store and Dan Murphy’s liquor store. When combined, these retailers account for 70% of GLA and 50% of annual base rent.
With approximately 5,100sqm of supporting retail specialty space, the centre is currently 99% leased with first year income post acquisition covered by a rental guarantee from Woolworths.
With a focus on continuing to strengthen and improve the quality of our portfolio, Brickworks Marketplace is a perfect
fit for the REIT. Positioned on a high profile corner site the centre services an established local community and provides much needed convenience based shopping to the area.
The centre further strengthens the REIT’s earnings and Charter Hall’s relationship with Woolworths, a key national tenant contributing 27% of annual base rent to the REIT.
Capital management initiatives2015 has been a very active year with the REIT repositioning its funding platform to enhance flexibility and scalability of its debt platform, whilst also minimising costs.
Further strengthening its position, the REIT completed a number of significant capital management initiatives during the period.
Capital partnerships were a key focus for the REIT which entered US debt markets for the first time, receiving a strong response from US investors for this inaugural issuance.
These initiatives have increased the REIT’s weighted average debt maturity from 3.7 years to 5.8 years and include:
• A US$200 million (A$252 million) US Private Placement (USPP) issuance: 12 year duration, Fixed US$ coupon of 3.55% which is 100% hedged in Australian dollars and represents a margin of 194 basis points over BBSW
• The transition to a fully unsecured debt facility: Completed on 28 September 2015
• A restructured syndicated bank debt facility: Tranches of 18 months ($150 million), three years ($150 million) and five years ($285 million) for a total facility limit of $585 million, from a previous limit of $535 million
Moody’s has assigned a credit rating of Baa1, following completion of these initiatives.
With a focused and disciplined use of capital, the REIT has executed on its goal to establish a best practice capital structure, to align with its defensive and resilient property portfolio.
Active asset managementMaintaining strong tenant relationships, optimising tenancy mix through proactive leasing and enhancing the overall shopper experience.
1
2
3
Enhancing the portfolio qualityThrough value enhancing redevelopments, selective acquisitions and non-core disposals.
Prudent capital managementFocused on a strong and flexible balance sheet.
For
per
sona
l use
onl
y

8 Charter Hall Retail REIT
Our Performance
Positive Australian portfolio performanceDuring the year, we continued to actively enhance the quality of our portfolio through maintaining strong tenant relationships, undertaking value enhancing redevelopments and prudent capital management. We also divested a number of non-core properties, reinvesting this capital into larger assets with forecast higher growth characteristics in key growth corridors.
Specialty rent growth of 1.5% was achieved from 122 lease renewals and 1851 new leases, including 15 major lease deals. We also completed our first two lease transactions with Aldi and will look to extend this relationship across our portfolio.
This active management approach has seen the REIT achieve a specialty tenant retention rate of 83% and stable portfolio occupancy of 98.4%. Same property NOI growth of 2.4% for the year is a strong result given current market conditions.
Woolworths Limited (including BIG W) and Wesfarmers (Coles, Kmart and Target) anchor tenant leases continue to provide 52% of annual base rent. Forty-five percent of anchor tenants are paying turnover rent, with a further 21% within 10% of their respective turnover thresholds.
All stable properties within the portfolio were independently valued during the period, increasing in value by $86.7 million or 4.2%, with total weighted average cap rates continuing to firm, demonstrating strong investor interest in the asset class.
1 Includes 147 non-comparable new lease deals that do not impact specialty rent growth.
* Including Soul Pattinson Priceline
** Including Brumby’s, Donut King, Michel’s Patisserie
WoolworthsLimited
Wesfarmerssubsidiaries
The RejectShop
AustralianPharmaceutical
Industries*
Retail Food Group**
26.9
25.3
1.6
1.4
1.2
TOP FIVE TENANTS BY ANNUAL BASE RENT (%)
Bateau Bay Square, NSW
For
per
sona
l use
onl
y

Annual Report 2015 9
We continued to actively enhance the quality of our portfolio focusing on strong tenant relationships, value enhancing redevelopment and prudent capital management.
Enhancing the Australian Portfolio
The REIT has also completed the sale of a number of non-core properties within the portfolio for a combined sale price of $37.6 million3 and a yield of 8.2%. This includes three non-core properties in Central Western NSW, with the $21.6 million sale price reflecting a 3.5% premium to the June 2014 book value.
The REIT’s joint venture entity, CHRP1, completed the sale of Windsor Marketplace, NSW in June and, as a result of these transactions and the redevelopment pipeline, the average asset value has increased from $28.6 million at June 2014 to $32.7 million at June 2015.
We continued to focus on delivering value to our centres, communities and unitholders through our redevelopment pipeline. We completed two major redevelopments at Caboolture Square, Qld and Lansell Square, Vic during the year.
A further $77.4 million of major and minor project works are planned across the portfolio in FY16 including the Secret Harbour, WA redevelopment, which will comprise a new 4,150sqm Coles supermarket, a new 1,550sqm Aldi, a new 1,200sqm Dan Murphy’s and expansion of the existing Woolworths.
Proactive capital managementThe REIT completed several key initiatives to restructure its debt funding platform, including a US Private Placement issuance of US$200 million (A$252 million) during the period. These initiatives have increased the REIT’s weighted average debt maturity from 3.7 years to 5.8 years and significantly reduced the weighted average debt margin of the REIT from 177 basis points to 155 basis points per annum.
The REIT’s strong financial discipline and balance sheet position has seen it assigned a definitive issuer credit rating of Baa1 by Moody’s.
The REIT also raised approximately $24.0 million in new equity from the Distribution Reinvestment Plan during FY15. These funds, combined with proceeds from the divestment of non-core assets, enable the REIT to capitalise on acquisition opportunities and fund current redevelopment projects which will drive earnings in future years.
2 100% value, CQR’s share is $37.9 million.
3 CQR’s share of the total sale price.
We acquired two supermarket anchored shopping centres for $97.1 million at an average initial yield of 7.2% during the period. Coomera City Centre, Qld and Brickworks Marketplace, SA are both located in high growth corridors and are within the REIT’s investment criteria. Post year end the REIT acquired a portfolio of two high quality sub-regional shopping centres located in Goulburn, NSW and Katherine, NT partially funded by a fully underwritten insitutional placement of $50 million, at an offer price of $4.02 per unit.
Katherine Central is located southeast of Darwin and services a community of approximately 24,000 people including the Tindal Air Force Base. The centre is the only convenience based shopping centre in the region and is anchored by a high turnover Woolworths supermarket and Target discount store that account for approximately 60% of the base rent. The purchase reflects an initial yield of 8.3% and the centre has an occupancy rate of 98.6%.
Brickworks Marketplace was acquired for $75.8 million2 with the centre located on a high profile site on South Road, Torrensville which carries an estimated 50,000 vehicles per day. It is a new 16,896sqm sub-regional shopping centre, anchored by a full line Woolworths supermarket, BIG W discount department store and Dan Murphy’s liquor store, which account for a combined 70% of GLA and 50% of annual base rent. The centre is currently 99% leased with the first year income post acquisition covered by a rental guarantee from Woolworths.
33.6 %LOOK THROUGH GEARING
5.8 yrsWEIGHTED AVERAGE DEBT MATURITY
Jun
10
$1.0
$1.5
$2.0
$2.5D
ec 1
0
Jun
11
Dec
11
Jun
12
Dec
12
Jun
13
Dec
13
Jun
14
Dec
14
Jun
15
CQR AUSTRALIAN OWNED PORTFOLIO VALUE ($b)
For
per
sona
l use
onl
y

10 Charter Hall Retail REIT
Sustainability
Sustainability is a core part of how we enhance value and manage risk across the portfolio. Last year we participated in Charter Hall Group’s review of its approach to Corporate Responsibility and Sustainability (CR&S).
As part of this review, Charter Hall Retail REIT aligned its sustainability aspirations with three of Charter Hall Group’s four business strategy pillars: Product, Performance and Partner (People was not included as the REIT does not employ people).
This move was to ensure that the steps Charter Hall and its managed funds, including Charter Hall Retail REIT, take to achieve their objectives are viewed within a sustainability context. F
or p
erso
nal u
se o
nly
Annual Report 2015 11
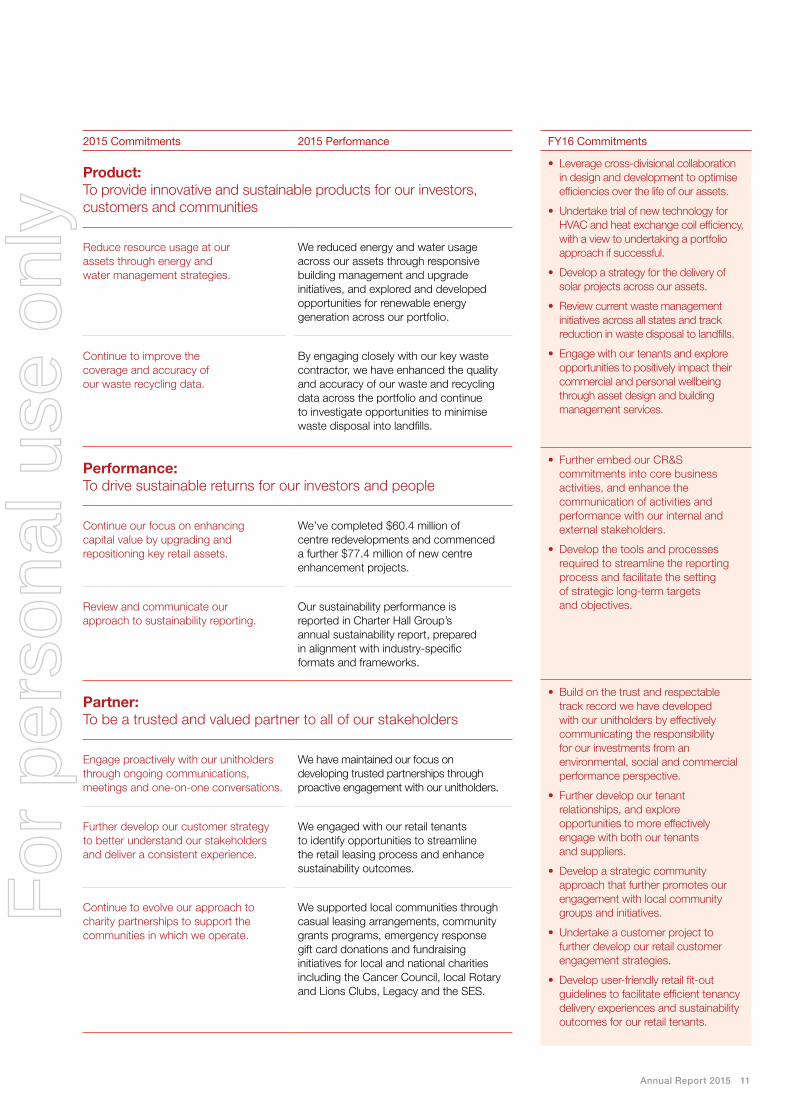
2015 Commitments 2015 Performance
Product: To provide innovative and sustainable products for our investors, customers and communities
Reduce resource usage at our assets through energy and water management strategies.
We reduced energy and water usage across our assets through responsive building management and upgrade initiatives, and explored and developed opportunities for renewable energy generation across our portfolio.
Continue to improve the coverage and accuracy of our waste recycling data.
By engaging closely with our key waste contractor, we have enhanced the quality and accuracy of our waste and recycling data across the portfolio and continue to investigate opportunities to minimise waste disposal into landfills.
Performance: To drive sustainable returns for our investors and people
Continue our focus on enhancing capital value by upgrading and repositioning key retail assets.
We’ve completed $60.4 million of centre redevelopments and commenced a further $77.4 million of new centre enhancement projects.
Review and communicate our approach to sustainability reporting.
Our sustainability performance is reported in Charter Hall Group’s annual sustainability report, prepared in alignment with industry-specific formats and frameworks.
Partner: To be a trusted and valued partner to all of our stakeholders
Engage proactively with our unitholders through ongoing communications, meetings and one-on-one conversations.
We have maintained our focus on developing trusted partnerships through proactive engagement with our unitholders.
Further develop our customer strategy to better understand our stakeholders and deliver a consistent experience.
We engaged with our retail tenants to identify opportunities to streamline the retail leasing process and enhance sustainability outcomes.
Continue to evolve our approach to charity partnerships to support the communities in which we operate.
We supported local communities through casual leasing arrangements, community grants programs, emergency response gift card donations and fundraising initiatives for local and national charities including the Cancer Council, local Rotary and Lions Clubs, Legacy and the SES.
FY16 Commitments
• Leverage cross-divisional collaboration in design and development to optimise efficiencies over the life of our assets.
• Undertake trial of new technology for HVAC and heat exchange coil efficiency, with a view to undertaking a portfolio approach if successful.
• Develop a strategy for the delivery of solar projects across our assets.
• Review current waste management initiatives across all states and track reduction in waste disposal to landfills.
• Engage with our tenants and explore opportunities to positively impact their commercial and personal wellbeing through asset design and building management services.
• Further embed our CR&S commitments into core business activities, and enhance the communication of activities and performance with our internal and external stakeholders.
• Develop the tools and processes required to streamline the reporting process and facilitate the setting of strategic long-term targets and objectives.
• Build on the trust and respectable track record we have developed with our unitholders by effectively communicating the responsibility for our investments from an environmental, social and commercial performance perspective.
• Further develop our tenant relationships, and explore opportunities to more effectively engage with both our tenants and suppliers.
• Develop a strategic community approach that further promotes our engagement with local community groups and initiatives.
• Undertake a customer project to further develop our retail customer engagement strategies.
• Develop user-friendly retail fit-out guidelines to facilitate efficient tenancy delivery experiences and sustainability outcomes for our retail tenants.
For
per
sona
l use
onl
y

12 Charter Hall Retail REIT
our $2.26 billion portfolio comprises 75 supermarket anchored shopping centres across Australia.
Australian Property Portfolio
Brickworks Marketplace, Torrensville, SA
For
per
sona
l use
onl
y

Annual Report 2015 13
ASSET VALUE BY STATE
NSW 39%
ACT 4%
Qld 22%
Vic 12%
SA 6%
WA 16%
Tas 1%
ASSET VALUE BY LOCATION
Non-Metro 70%
Metro 30%
For
per
sona
l use
onl
y

Sunnyside Mall Goonellabah Village
Dubbo Square
Tamworth City Plaza
Parkes Metroplaza
Orange Central
Balo Square
Narrabri
SingletonSquare
Mount Hutton Plaza
Cootamundra Tumut
Rutherford Marketplace
Highlands Marketplace
Mudgee Metroplaza
Lake Macquarie Fair
MorrisetShoppingCentre
Young
Cooma Jerrabomberra Village
Earlwood
Carnes Hill Marketplace
Pemulwuy
Marketplace
Rosehill West Ryde Marketplace
Gordon VillageCentre
Thornleigh Marketplace
Kings Langley Shopping Centre
SydneyCBD
Dickson
Manuka Terrace
Erindale Shopping Centre
Canberra
ACT Sydney metropolitan area
14 Charter Hall Retail REIT
New South Wales/Australian Capital Territory
Sub-regional
Neighbourhood
Freestanding supermarket
PROPERTY TYPE
TOTAL VALUE OF PROPERTY PORTFOLIO
$ 931.7 m
For
per
sona
l use
onl
y

Property LocationAsset Type
Metro/ Non-metro
Interest (%)
Anchor tenant
Anchor Tenant Lease
Expiries
Total GLA
(CQR Share)
Book Value (CQR
Share)
Cap rate (%)
ACTDickson Woolworths Dickson Freestander Metro 100 Woolworths 17-Aug-23 3,712 16.5 6.50
Erindale Shopping Centre Wanniassa Neighbourhood Metro 100 Woolworths 31-Aug-21 6,747 36.3 7.30
Manuka Terrace Manuka Neighbourhood Metro 100 Coles 28-May-30 6,745 42.7 7.00
ACT Total 17,204 95.5
NSWBalo Square Moree Neighbourhood Non-metro 100 Coles 24-Nov-27 5,206 14.3 8.00
Target 28-Feb-17
Carnes Hill Marketplace
Horningsea Park
Sub-regional Metro 50 Woolworths 31-Mar-41 8,701 51.3
6.50
BIG W 31-Mar-41
Dan Murphy’s 31-Mar-31
Cooma Woolworths Cooma Freestander Non-metro 100 Woolworths 22-Aug-19 3,101 12.4 7.25
Cootamundra Woolworths Cootamundra Freestander Non-metro 100 Woolworths 30-Jun-21 4,114 11.5 8.00
Dubbo Square Dubbo Sub-regional Non-metro 100 Coles 31-Aug-27 12,741 39.0 7.75
Target 31-Jul-24
Earlwood Coles Earlwood Freestander Metro 100 Coles 05-Dec-22 2,675 19.0 6.00
Goonellabah Village Goonellabah Neighbourhood Non-metro 100 Coles 28-Oct-20 6,146 14.5 8.00
Target Country 09-May-17
Gordon Village Centre Gordon Neighbourhood Metro 100 Woolworths 13-Jun-25 13,742 88.6 6.88
Harvey Norman 30-Jun-17
Highlands Marketplace Mittagong Sub-regional Non-metro 50 Woolworths 31-Mar-41 8,242 31.3 6.75
BIG W 31-Mar-41
Jerrabomberra Village Jerrabomberra Neighbourhood Non-metro 100 Woolworths 30-Sep-32 5,356 20.6 7.00%
Kings Langley Shopping Centre
Kings Langley Neighbourhood Metro 100 Coles 12-Nov-24 5,228 31.3 7.00
Lake Macquarie Fair Mount Hutton Sub-regional Non-metro 100 Woolworths 08-Nov-27 16,931 67.2 7.00
BIG W 29-Jul-22
Morisset Shopping Centre
Morisset Neighbourhood Non-metro 100 Coles 30-Apr-23 8,979 35.0 7.56
Target 01-Oct-18
Mount Hutton Plaza Mount Hutton Neighbourhood Non-metro 100 Coles 16-Dec-14 4,401 10.5 8.25
Mudgee Metroplaza Mudgee Neighbourhood Non-metro 100 Woolworths 02-Jul-21 4,031 22.8 7.25
Narrabri Coles Narrabri Freestander Non-metro 100 Coles 14-Jul-23 3,185 10.0 7.50
Target 30-Apr-16
Orange Central Orange Neighbourhood Non-metro 100 Coles 13-Mar-29 7,674 45.9 7.00
Parkes Metroplaza Parkes Neighbourhood Non-metro 100 Woolworths 25-Nov-30 4,412 19.9 7.25
Pemulwuy Marketplace Greystanes Neighbourhood Metro 50 Woolworths 31-Mar-36 2,608 12.2 7.25
Rosehill Woolworths Rosehill Freestander Metro 100 Woolworths 20-Nov-19 2,440 11.0 6.25
Rutherford Marketplace Rutherford Neighbourhood Non-metro 50 Woolworths 31-Mar-37 3,442 16.5 6.75
Singleton Square Singleton Sub-regional Non-metro 100% Woolworths 05-Jun-33 28,375 117.4
6.75 Coles 20-Aug-28
BIG W 06-Nov-32 First Choice
Liquor 20-Aug-28
Sunnyside Mall Murwillumbah Neighbourhood Non-metro 100 Coles 25-Nov-27 7,484 36.1
7.75
Target 31-Dec-15
Tamworth City Plaza Tamworth Sub-regional Non-metro 100 Coles 19-May-17 13,745 37.8
7.50
Kmart 19-May-17
Thornleigh Marketplace Thornleigh Neighbourhood Metro 50 Woolworths/Dan Murphy’s
31-Mar-38 3,445 17.5 6.75
Tumut Coles Tumut Freestander Non-metro 100 Coles 31-Jul-22 2,583 6.7 6.75
West Ryde Marketplace West Ryde Neighbourhood Metro 50 Woolworths 31-Mar-41 3,190 20.8 6.75
Young Woolworths Young Freestander Non-metro 100 Woolworths 27-Nov-22 3,139 15.1 7.00
NSW Total 195,316 836.2
Annual Report 2015 15
For
per
sona
l use
onl
y

16 Charter Hall Retail REIT
TasmaniaTOTAL VALUE OF PROPERTY PORTFOLIO
$ 24.0m
RenmarkPlaza
Brickworks Marketplace
WharflandsPlaza
SouthgatePlaza
Newstead
Smithton Wynyard
Lansell Plaza
RosebudPlaza
Moe – Coles
Moe – Kmart
KynetonShopping Centre
Kerang
BairnsdalePakingtonStrand
South AustraliaTOTAL VALUE OF PROPERTY PORTFOLIO
$ 118.7m
VictoriaTOTAL VALUE OF PROPERTY PORTFOLIO
$ 256.0m
Sub-regional
Neighbourhood
Freestanding supermarket
PROPERTY TYPE
For
per
sona
l use
onl
y
Property LocationAsset Type
Metro/ Non-metro
Interest (%)
Anchor tenant
Anchor Tenant Lease
Expiries
Total GLA
(CQR Share)
Book Value (CQR
Share)
Cap rate (%)
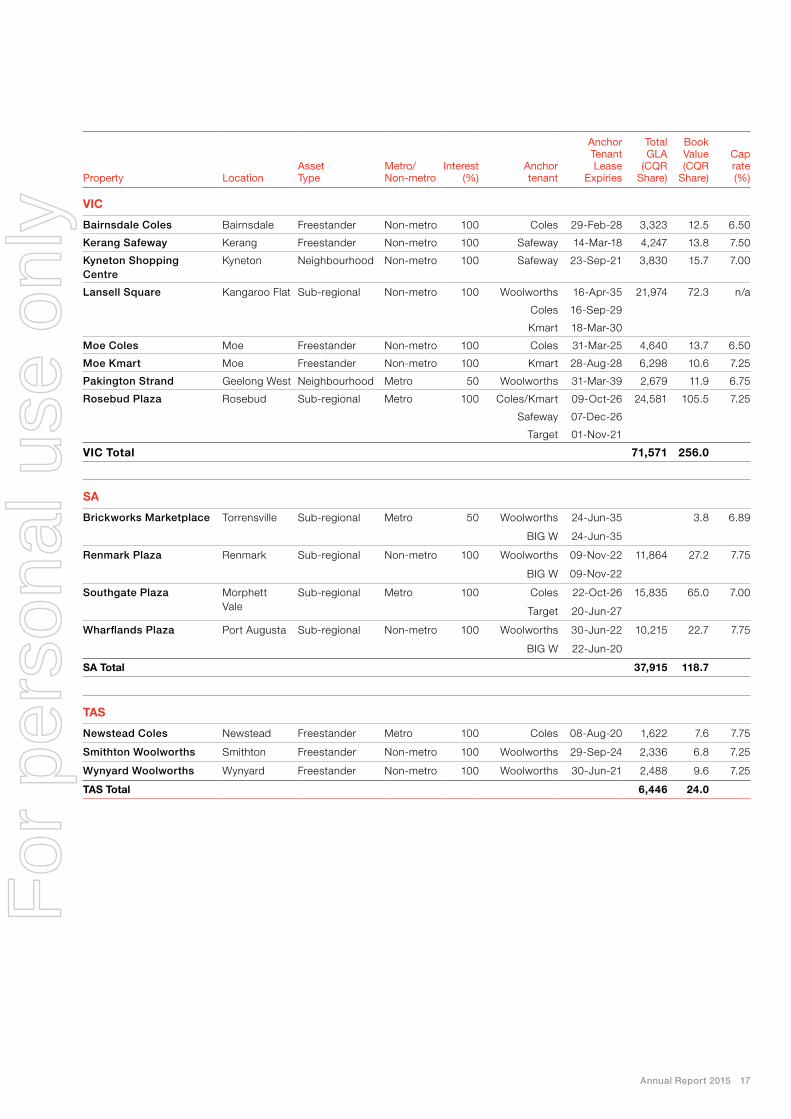
VIC
Bairnsdale Coles Bairnsdale Freestander Non-metro 100 Coles 29-Feb-28 3,323 12.5 6.50
Kerang Safeway Kerang Freestander Non-metro 100 Safeway 14-Mar-18 4,247 13.8 7.50
Kyneton Shopping Centre
Kyneton Neighbourhood Non-metro 100 Safeway 23-Sep-21 3,830 15.7 7.00
Lansell Square Kangaroo Flat Sub-regional Non-metro 100 Woolworths 16-Apr-35 21,974 72.3 n/a
Coles 16-Sep-29
Kmart 18-Mar-30
Moe Coles Moe Freestander Non-metro 100 Coles 31-Mar-25 4,640 13.7 6.50
Moe Kmart Moe Freestander Non-metro 100 Kmart 28-Aug-28 6,298 10.6 7.25
Pakington Strand Geelong West Neighbourhood Metro 50 Woolworths 31-Mar-39 2,679 11.9 6.75
Rosebud Plaza Rosebud Sub-regional Metro 100 Coles/Kmart 09-Oct-26 24,581 105.5 7.25
Safeway 07-Dec-26
Target 01-Nov-21
VIC Total 71,571 256.0
SA
Brickworks Marketplace Torrensville Sub-regional Metro 50 Woolworths 24-Jun-35 3.8 6.89
BIG W 24-Jun-35
Renmark Plaza Renmark Sub-regional Non-metro 100 Woolworths 09-Nov-22 11,864 27.2 7.75
BIG W 09-Nov-22
Southgate Plaza Morphett Vale
Sub-regional Metro 100 Coles 22-Oct-26 15,835 65.0 7.00
Target 20-Jun-27
Wharflands Plaza Port Augusta Sub-regional Non-metro 100 Woolworths 30-Jun-22 10,215 22.7 7.75
BIG W 22-Jun-20
SA Total 37,915 118.7
TAS
Newstead Coles Newstead Freestander Metro 100 Coles 08-Aug-20 1,622 7.6 7.75
Smithton Woolworths Smithton Freestander Non-metro 100 Woolworths 29-Sep-24 2,336 6.8 7.25
Wynyard Woolworths Wynyard Freestander Non-metro 100 Woolworths 30-Jun-21 2,488 9.6 7.25
TAS Total 6,446 24.0
Annual Report 2015 17
For
per
sona
l use
onl
y

18 Charter Hall Retail REIT
Gatton PlazaSpringfield Fair
MareebaPlaza
TablelandsVillage
Sydney Street Markets
Allenstown Plaza
Moranbah Fair
Bay PlazaCurrimundi Markets
Coomera Square Bribie Island Shopping Centre
GladstoneShopping Centre
Kallangur FairAlbany CreekCaboolture Park Shopping Centre
Western AustraliaTOTAL VALUE OF PROPERTY PORTFOLIO
$ 354.4m
QueenslandTOTAL VALUE OF PROPERTY PORTFOLIO
$ 477.9m
South Hedland Square
CarnarvonCentral
KalgoorlieCentral
Secret HarbourShopping
CentreEsperanceBoulevard
AlbanyPlaza
Collie CentralNarrogin
BallajuraCentral
Maylands Swan View Shopping Centre
WannerooCentral
Sub-regional
Neighbourhood
Freestanding supermarket
PROPERTY TYPEF
or p
erso
nal u
se o
nly

Property LocationAsset Type
Metro/ Non-metro
Interest (%)
Anchor tenant
Anchor Tenant Lease
Expiries
Total GLA
(CQR Share)
Book Value (CQR
Share)
Cap rate (%)
QLD
Albany Creek Square Brisbane Neighbourhood Metro 100 Coles 30-Jun-26 10,077 53.2 7.00
Allenstown Square Rockhampton Neighbourhood Non-metro 100 Woolworths 09-Apr-33 8,038 47.0 7.50
Bribie Island Shopping Centre
Bribie Island Sub-regional Non-metro 100 Woolworths 09-Dec-27 10,694 49.0 7.00
Target 07-Sep-20
Caboolture Square Caboolture Sub-regional Non-metro 100 Coles 30-Jun-28 15,768 39.3 n/a
Kmart 30-Jun-21
Coomera Square Coomera Neighbourhood Metro 100 Woolworths 13-Dec-27 9,113 59.3 6.75
Dan Murphy’s 04-Aug-34
Currimundi Markets Currimundi Neighbourhood Non-metro 100 Woolworths 21-Jun-21 5,669 32.0 6.75
Gatton Plaza Gatton Neighbourhood Non-metro 100 Coles 09-Jan-20 4,787 17.4 7.25
Gladstone Square Gladstone Neighbourhood Non-metro 50 Woolworths 20-Sep-19 3,420 14.2 7.50
Bay Plaza Hervey Bay Neighbourhood Non-metro 100 Woolworths 30-Oct-27 5,533 18.8 7.25
Kallangur Fair Kallangur Neighbourhood Non-metro 100 Woolworths 07-Dec-18 4,702 15.7 7.50
Mareeba Square Mareeba Neighbourhood Non-metro 100 Coles 28-Mar-23 4,269 14.9 7.25
Moranbah Fair Moranbah Neighbourhood Non-metro 100 Coles 12-Mar-28 7,054 25.5 8.25
Target 28-Feb-17
Springfield Fair Springfield Neighbourhood Metro 100 Coles 19-May-21 5,127 19.8 7.25
Sydney Street Markets Mackay Neighbourhood Non-metro 100 Coles 16-Jul-21 5,130 42.1 n/a
Tablelands Square Atherton Neighbourhood Non-metro 100 Woolworths 21-Feb-34 4,927 29.7 7.25
Target 27-May-17
QLD Total 104,308 477.9
WA
Albany Plaza Albany Sub-regional Non-metro 100 Coles 15-Sep-17 17,781 55.4 7.50 Kmart 15-Sep-17 Target 04-May-21
Ballajura Central Ballajura Neighbourhood Metro 100 Woolworths 30-Aug-21 4,677 11.0 6.75
Carnarvon Central Carnarvon Neighbourhood Non-metro 100 Woolworths 05-Nov-15 6,257 15.6 8.25
Collie Central Collie Neighbourhood Non-metro 100 Woolworths 23-Jun-20 4,507 7.2 7.75
Esperance Boulevard Esperance Neighbourhood Non-metro 100 Woolworths 11-Apr-34 7,601 27.7 7.25
Target Country 31-Jul-23
Kalgoorlie Central Kalgoorlie Neighbourhood Non-metro 100 Woolworths 31-Mar-26 8,803 35.0 7.25
Maylands Coles Maylands Freestander Metro 100 Coles 09-Dec-21 3,133 14.2 6.50
Narrogin Coles Narrogin Freestander Non-metro 100 Coles 30-Jul-20 3,133 10.7 6.75
Secret Harbour Shopping Centre
Secret HarbourNeighbourhood Non-metro 100 Woolworths 03-Dec-26 5,770 39.6 n/a
South Hedland Square South Hedland Sub-regional Non-metro 100 Coles 29-Aug-17 16,616 75.9 7.75
Kmart 28-Oct-28
Swan View Shopping Centre
Swan View Neighbourhood Metro 100 Coles 30-Nov-22 3,851 16.5 6.75
Wanneroo Central Wanneroo Sub-regional Metro 50 Coles 11-Aug-28 9,536 45.6 6.75 Kmart and
Kmart Tyre & Auto 02-Sep-29
Supa IGA 02-Sep-24
WA Total 91,665 354.4
Total CQR Portfolio 524,425 2,162.7
Annual Report 2015 19
South Hedland Square
CarnarvonCentral
KalgoorlieCentral
Secret HarbourShopping
CentreEsperanceBoulevard
AlbanyPlaza
Collie CentralNarrogin
BallajuraCentral
Maylands Swan View Shopping Centre
WannerooCentral
For
per
sona
l use
onl
y

20 Charter Hall Retail REIT
Our Board and Fund Management
John HarknessIndependent Chairman
John joined the Board in 2003 and was appointed Chairman in 2011.
A partner at KPMG for 25 years and National Executive Chairman for five years, John has held a number of non-executive director roles since leaving KPMG in 2000. He is currently an independent director of the Goodman Group as well as Chairman of Reliance Rail and Chairman of the National Foundation for Medical Research and Innovation.
John is a Fellow of both The Institute of Chartered Accountants (Australia) and the Australian Institute of Company Directors.
Alan Rattray-WoodIndependent Director
Alan joined the Board in 1996, and is a member of the Audit, Risk and Compliance Committee. He is an experienced industry participant with more than 30 years’ experience involving supermarket management, neighbourhood and regional sized shopping centre management, development and leasing, having held management roles with Woolworths, Westfield Holdings and other private developers. Since 1990, he has operated his own retail development consultancy practice, focusing on all facets of shopping centre development and retail chain insolvency workouts.
Maurice KoopIndependent Director B.Com, DipEd, MBA
Maurice joined the Board in 2002, and is Chairman of the Audit, Risk and Compliance Committee. A senior adviser to The Boston Consulting Group, Maurice has 27 years’ experience in consulting, with particular focus on consumer goods, retailing and the financial services industry. He has served as a non-executive director on a number of company boards including 13 years as a director of the Just Jeans Retail Group.
For
per
sona
l use
onl
y

Annual Report 2015 21
Scott DundasFund Manager Charter Hall Retail REIT LLB, Dip.Val, AAPI, FRICS
Scott joined Charter Hall in 2010 and has over 35 years’ experience in the property sector. After initially managing the REIT’s property assets between 1998 and 2000, Scott has been responsible for sourcing and implementing the majority of the REIT’s capital transactions in the United States, Europe, New Zealand and Australia, as well as the recycling of capital back into the Australian market. He was named Best CEO 2014 in the Next 100 Property Sector at the East Coles Corporate Performance awards in 2014.
Before joining Charter Hall, Scott worked in a range of senior roles at Macquarie. Prior to that, he was the State Real Estate Manager for Coles Supermarkets and Coles Myer Limited in NSW and has also held senior positions in organisations ranging from commercial real estate agencies to various NSW statutory authorities.
He is a Barrister of the Supreme Court of NSW, a Registered Valuer, a Licensed Real Estate Agent, an Associate of the Australian Property Institute (AAPI) and a Fellow of the Royal Institute of Chartered Surveyors (RICS).
David SouthonJoint Managing Director B.Bus (Land Economy)
28 years industry experience/24 years at Charter Hall Group
David is a co-founder of the Charter Hall Group and one of its Joint Managing Directors, with over 28 years of property industry experience. In consultation with the CHC Executive Leadership Group and Board, the Joint Managing Directors are responsible for the formulation and implementation of the Group’s strategy. David is directly responsible for overseeing the operation of the Property and Support Services Divisions including Retail, Office and Industrial Property Services; People, Brand and Community; Legal/CoSec and Technology, as well as strategic involvement in project origination and direction. Together the Joint Managing Directors share responsibility for the Chief Financial Officer in relation to Group Finance, Treasury and Capital Management.
David HarrisonJoint Managing Director B.Bus (Land Economy), G Dip App Fin
28 years industry experience/10 years at Charter Hall Group
As Charter Hall Group’s Joint Managing Director, David is responsible for all aspects of the Charter Hall business, with specific focus on Investment Management, Strategy, Corporate Transactions and Property Investment activities. David also sits as an Executive Member on all Fund Boards and Investment Committees. David has overseen the growth of the Charter Hall Group from $500 million to $14.5 billion of assets under management in 10 years. David has been principally responsible for transactions exceeding $18 billion of commercial, retail and industrial property assets across all property sectors over the past 28 years.
For
per
sona
l use
onl
y

22 Charter Hall Retail REIT
For
per
sona
l use
onl
y

Financial Report For the year ended 30 June 2015
Directors’ report 24
Auditor’s Independence Declaration 32
Consolidated statement of comprehensive income 33
Consolidated balance sheet 34
Consolidated statement of changes in equity 35
Consolidated cash flow statement 36
Notes to the consolidated financial statements 37
1. Summary of significant accounting policies 37
2. Segment information 42
3. Profit for the year from continuing operations 44
4. Distributions paid and payable 45
5. Earnings per unit 45
6. Cash and cash equivalents 45
7. Receivables 46
8. Derivative financial statements 46
9. Other assets 47
10. Assets and liabilities classified as held for sale and discontinued operations 47
11. Investment properties 49
12. Investment in joint venture entity 50
13. Payables 51
14. Distribution payable 52
15. Borrowings 52
16. Other liabilities 53
17. Contributed equity 53
18. Reserves 54
19. Accumulated losses 54
20. Net tangible assets 54
21. Cash flow information 55
22. Capital and financial risk management 56
23. Fair value measurement 61
24. Related party information 64
25. Remuneration of the auditor 68
26. Commitments and contingent liabilities 68
27. Significant contract terms and conditions 69
28. Parent entity financial information 69
29. Interest in other entities 70
30. Events occurring after balance date 70
Directors’ declaration to unitholders 71
Independent auditor’s report 72
Remuneration Report 74
Unitholder Analysis 76
Distribution History 78
Investor Information 79
Corporate DIrectory 80
Annual Report 2015 23
For
per
sona
l use
onl
y

24 Charter Hall Retail REIT
Directors’ ReportFor the year ended 30 June 2015
The Directors of Charter Hall Retail Management Limited (Responsible Entity or CHRML), the responsible entity of Charter Hall Retail REIT, present their report together with the consolidated financial statements of Charter Hall Retail REIT and its controlled entities (together, the REIT) for the year ended 30 June 2015.
Principal ActivitiesThe principal activity of the REIT during the year was property investment. There were no significant changes in the nature of the REIT’s activities during the year.
DirectorsThe following persons have held office as Directors of the Responsible Entity during the year and up to the date of this report, unless otherwise stated:• John Harkness – Chairman and Non-Executive Director• David Harrison – Executive Director and Joint-Managing
Director of Charter Hall Group• Maurice Koop – Non-Executive Director and Chairman of Audit,
Risk and Compliance Committee• Alan Rattray-Wood – Non-Executive Director• David Southon – Executive Director and Joint-Managing
Director of Charter Hall Group• Scott Dundas – Alternate for David Southon and David Harrison
DistributionsDistributions paid or declared by the REIT to unitholders:
2015 $’m
2014 $’m
Final distribution for the six months ended 30 June 2015 of 13.80 cents per unit payable on 31 August 2015 51.8 –Interim distribution for the six months ended 31 December 2014 of 13.70 cents per unit paid on 27 February 2015 51.1 –Final distribution for the six months ended 30 June 2014 of 13.65 cents per unit paid on 29 August 2014 – 50.4 Interim distribution for the six months ended 31 December of 13.65 cents per unit paid on 28 February 2014 – 49.5
102.9 99.9
A liability has been recognised in the consolidated financial statements as the final distribution had been declared as at the balance date.
Distribution Reinvestment Plan The REIT has established a Distribution Reinvestment Plan (DRP) under which unitholders may elect to have all or part of their distribution entitlements satisfied by the issue of new units rather than being paid in cash.
The DRP issue price is determined at a discount of 1.0% to the daily average of the volume weighted average market price of units traded on the ASX during the 15 business days commencing on the third business day following the distribution record date. The REIT raised $11.3 million from the DRP for the 31 December 2014 distribution and expects to raise $12.9 million from the DRP for the 30 June 2015 distribution.
Review and results of operationsThe REIT recorded a statutory profit for the year of $162.5 million compared to a statutory profit of $85.2 in 2014. Operating earnings amounted to $110.8 million compared to $105.3 million in 2014 due to:• Increased net property income from Australian properties
following acquisitions, developments and income growth during the year;
• Completion of the sale of all offshore portfolios; and• Equity raised and deployed during the 24 month period from
1 July 2013.
Operating earnings is a financial measure which represents the profit/(loss) under Australian Accounting Standards adjusted for certain unrealised and non-cash items, reserve transfers, capital transactions and other non-core items.
The inclusion of operating earnings as a measure of the REIT’s profitability provides investors with the same basis that is used internally for evaluating operating segment performance. Operating earnings is used by the Board to make strategic decisions and as a guide to assessing an appropriate distribution to declare.
For
per
sona
l use
onl
y

Annual Report 2015 25
The table below sets out income and expenses that comprise operating earnings:
2015 $’m
2014 $’m
Net property income from wholly owned properties 138.7 123.4 Net income from joint venture entity 11.0 10.3 Realised gains on derivative financial instruments – 0.9 Other income 0.3 0.2 Management fees (9.1) (8.1)Finance costs (26.9) (24.5)Other expenses (3.2) (3.5)Operating earnings from discontinued operations – 6.6
Operating earnings* 110.8 105.3
* Further detail on Operating Earnings is contained in Note 2.
Reconciliation of operating earnings to statutory profit is set out below:
2015 $’m
2014 $’m
Operating earnings 110.8 105.3 Net valuation gains on Australian investment properties 87.7 59.9 Impairment of acquisition costs incurred on Australian investment properties (5.5) (13.9)Net valuation losses on investment properties held for sale – (24.3)Unrealised and capital transaction related realised losses on derivative financial instruments (13.4) (8.8)Loss on sale of investment properties (1.6) (4.0)Write off of capitalised borrowing costs related to extinguished debt facilities (4.1) – Transfer from reserves of cumulative FX losses on disposal of assets held for sale (9.2) (30.6)Earnings from German operations** – 2.5Other (2.2) (0.9)
Statutory profit for the year 162.5 85.2
Basic weighted average number of units (millions) 373.1 355.7
Basic earnings per unit (cents) 43.55 23.95Operating earnings per unit (cents) 29.70 29.60
Distribution per unit (cents) 27.50 27.30
** Excluding unrealised and non-cash items relating to German operations.
For
per
sona
l use
onl
y

26 Charter Hall Retail REIT
Directors’ Report
Review and results of operations continuedThe 30 June 2015 financial results are summarised as follows:
2015 2014
Revenue ($ millions) 201.2 184.5 Net profit after tax ($ millions) 162.5 85.2 Basic earnings per unit (cents) 43.55 23.95 Operating earnings ($ millions) 110.8 105.3 Operating earnings per unit (cents) 29.70 29.60 Distributions ($ millions) 102.9 99.9 Distributions per unit (cents) 27.50 27.30 Total assets ($ millions) 2,103.7 2,065.0 Total liabilities ($ millions) 754.0 809.9 Net assets attributable to unitholders ($ millions) 1,349.7 1,255.1Units on issue (millions) 375.6 369.0Net assets per unit ($) 3.59 3.40
Look through gearing – total debt (net of cash) to total assets (net of cash) 33.6% 37.2%
Significant Changes in the State of AffairsCompletion of the sale of all offshore portfoliosIn August 2014, the REIT sold a 94.9% interest in the net equity of its German operations for a gross sale price of €1 ($1). The remaining 5.1% interest is subject to a put and call arrangement and is expected to settle in February 2016.
In addition, in August 2014, the REIT sold its remaining 50% interest in two New Zealand assets for NZ$8.2 million ($7.3 million), completing the sell down of its offshore exposure.
AcquisitionsIn July 2014, the REIT exercised its call option to acquire Coomera City Centre for a gross purchase price of $59.2 million and acquisition costs of $4.4 million.
In December 2014, Charter Hall Retail Partnership No.1 Trust (CHRP1), the REIT’s joint venture entity, acquired land comprising the former Brickworks site in Torrensville, Adelaide, South Australia for $7.55 million (100% interest) from Woolworths Limited (Woolworths). The land is the site of Brickworks Marketplace, a shopping centre that opened in June 2015 with an on-completion value of $76 million (100% interest) including land value. This acquisition was settled in July 2015.
DisposalsIn July 2014, the REIT sold McKenzie Mall, in Glen Innes, NSW for a gross sale price of $3.6 million.
In February 2015, the REIT sold Olive Tree Shopping Centre in Lilydale, Vic. for a gross sale price of $2.6 million.
In April 2015, the REIT entered into a call option deed to sell three non-core properties in Central Western NSW for $21.55 million. This option was exercised in May 2015 and proceeds from the sale were used to retire $18.5 million of Commercial Mortgage Backed Securities (CMBS) and pay down $2.6 million of the REIT’s revolving bank debt facility.
In December 2014, CHRP1 entered into a put and call deed to sell Windsor Marketplace for $19.6 million (100% interest). This option was exercised in June 2015. Proceeds from the sale have been used to partially fund the acquisition of Brickworks Marketplace.
Debt restructureIn April 2015, the REIT completed several key initiatives to restructure its debt funding platform:
• US$200 million (A$252 million) US Private Placement (USPP) issuance:
– 12 year duration – Funding to occur on 22 July 2015 – Fixed US$ coupon of 3.55% which is 100% hedged in
Australian dollars (principal and interest) and represent a margin of 194 basis points over BBSW
• Restructured syndicated bank debt facility with agreed terms for tranches of 18 months ($150 million), 3 years ($150 million) and 5 years ($285 million) for a total facility limit of $585 million, from a previous limit of $535 million.
Proceeds from the USPP issuance will be used to repay the existing CMBS facility which matures in September 2015 and is reflected as a current liability in this annual financial report.On 22 July the REIT moved to a partially unsecured debt structure with a financial covenant package including a look-through gearing covenant of 50% and interest cover ratio of 2.0 times. Moody’s have assigned a definitive issuer credit rating of Baa1. On 28 September 2015, on repayment of the CMBS, the REIT will move to a fully unsecured debt platform, excluding joint venture entities.
RedevelopmentsDuring the year the REIT completed two major redevelopments at Caboolture (Queensland) and Lansell (Victoria) and commenced one major redevelopment at Mackay (Queensland).
Business Strategies and ProspectsThe REIT’s strategy is to invest in neighbourhood and sub-regional supermarket anchored centres in Australia. When acquiring these properties the REIT’s investment criteria include the following provisions:
• Exposure to predominantly non-discretionary retailing;• Investing in regions with sound, long term demographic growth;• Consideration of the geographic diversity of the REIT’s portfolio;
and• Potential future development opportunity.
For
per
sona
l use
onl
y

Annual Report 2015 27
These centres typically range in area up to 25,000sqm and have capital and income growth potential. The REIT aims to maintain and enhance the existing portfolio through active asset and property management and to proactively manage its equity and debt.
The REIT has target look through gearing range of 30-40% and a target interest cover ratio of at least 2.5 times.
The material business risks faced by the REIT that are likely to have an effect on its financial performance include:
LeasingLease default, non-renewal and vacancy could result in a reduction in income received by the REIT. This risk is mitigated through active property and asset management of the REIT’s portfolio and its exposure to predominantly non-discretionary retailing. Any impact will depend on future economic conditions that are not known at balance date.
FundingAn inability to obtain the necessary funding or refinancing of an existing debt facility, or a material increase in the cost of such funding (including through increases in interest rates that are not hedged), may have an adverse impact on the REIT’s performance and financial position. The REIT seeks to minimise this risk through proactive refinancing and maintaining adequate liquidity to fund future forecast expenditure and hedging its interest rate and foreign exchange exposure in accordance with the Board approved Financial Risk Management Policy.
Development pipelineThe REIT has an identified development pipeline with the projects currently under construction at 30 June 2015 having a development cost of approximately $61.6 million. For these projects and for all future development activity undertaken by the REIT, achieving target returns will depend on achieving both practical completion on schedule and targets for leasing income. This risk is mitigated through fixed construction contracts and through pre-leasing the redevelopment both prior to and during construction.
Major anchor tenants’ sales growthThe REIT has leases linked to the level of sales achieved by its major tenants, with a base level of rent determined in the lease. This means the REIT is exposed to movement in the sales level of its major tenants, where they are trading above their threshold sales levels. An example of where sales could be impacted is in the event of an increase in competition following the introduction of a new or redeveloped centre within the shopping centre’s catchment.
Events Occurring after Balance DateOn 22 July 2015, the REIT received the proceeds of its US$200 million US Private Placement (USPP) which will be used to repay the existing CMBS facility which matures on 28 September 2015.
On 28 July 2015 the REIT executed conditional contracts to acquire Goulburn Plaza, NSW and Katherine Central, NT, for a combined purchase price of $94.9 million.
Furthermore, on 31 July 2015, Charter Hall Retail Partnership No.1 Trust (CHRP1), the REIT’s joint venture entity, completed the acquisition of Brickworks Marketplace for a total purchase price (including land) of $76 million.
Since the end of the year, the Directors of the Responsible Entity are not aware of any other matter or circumstance not otherwise dealt with in this report or the consolidated financial statements that has significantly affected or may significantly affect the operations of the REIT, the results of those operations or the state of affairs of the REIT in the financial years subsequent to 30 June 2015.
Likely Developments and Expected Results of OperationsThe consolidated financial statements have been prepared on the basis of current known market conditions. The extent to which a potential deterioration in either the capital or property markets that may have an impact on the results of the REIT are unknown. Such developments could influence property market valuations, the ability of borrowers, including the REIT, to raise or refinance debt and the cost of such debt, or the ability to raise equity.
At the date of this report and to the best of the Directors’ knowledge and belief, there are no other anticipated changes in the operations of the REIT which would have a material impact on the future results of the REIT. Property valuation changes, movements in the fair value of derivative financial instruments and movements in interest rates may have a material impact on the REIT’s results in future years; however, these cannot be reliably measured at the date of this report.
Indemnification and Insurance of Directors, Officers and AuditorDuring the year, the REIT, pursuant to Article 19 of its Constitution, paid a premium for a contract to insure all directors, secretaries and officers of the REIT and of each related body corporate of the REIT. The insurance does not provide cover for the independent auditors of the REIT or of a related body corporate of the REIT. In accordance with usual commercial practice, the insurance contract prohibits disclosure of details relating to the nature of the liabilities covered by the insurance, the limit of indemnity and the amount of the premium paid under the contract.
Provided the officers of the Responsible Entity act in accordance with the REIT’s constitution and the Corporations Act 2001, the officers are indemnified out of the assets of the REIT against losses incurred while acting on behalf of the REIT. The REIT indemnifies the auditor (PricewaterhouseCoopers Australia) against any liability (including legal costs) for third party claims arising from a breach by the REIT of the auditor’s engagement terms, except where prohibited by the Corporations Act 2001.
Fees Paid to, and Interests Held in the REIT by, the Responsible Entity or its AssociatesBase fees of $9,095,295 (2014: $8,671,937) were paid or are payable to the Responsible Entity, its associates or third party service providers for the services provided during the year, in accordance with the REIT constitution as disclosed in Note 24(d) to the consolidated financial statements.
The interests in the REIT held by the Responsible Entity or its associates as at 30 June 2015 and fees paid to its associates during the year are disclosed in Note 24 to the consolidated financial statements.
For
per
sona
l use
onl
y

28 Charter Hall Retail REIT
Interests in the REITThe movement in units of the REIT during the year is set out below:
2015 2014
Units on issue at the beginning of the year 369,040,750 337,582,974 Units issued during the year – via Distribution Reinvestment Plan 6,513,624 8,218,871 – via Placement issue – 23,238,905
Units on issue at the end of the year 375,554,374 369,040,750
Value of Assets
2015 $’m
2014 $’m
Value of REIT assets 2,103.7 2,065.0
The value of the REIT’s assets is derived using the basis set out in Note 1 to the consolidated financial statements.
Environmental RegulationsThe operations of the REIT are subject to environmental regulations under Commonwealth, State and Territory legislation in relation to property developments and the ownership of ten petrol stations.
Under the lease agreements for the petrol stations owned by the REIT, any environmental exposures are the responsibility of the tenant, and the REIT is indemnified against any losses resulting from environmental contamination.
In relation to the property developments, the REIT is obliged to ensure all works carried out under any development approval comply with that approval as well as any further relevant statutory requirements. The REIT ensures that contracts it enters into with builders for its developments stipulate that the builder must:
(a) ensure that in carrying out the contractor’s activities:
(i) it complies with all statutory requirements and other requirements of the contract for the protection of the environment;
(ii) it does not pollute, contaminate or otherwise damage the environment; and
(iii) its subcontractors comply with the requirements referred to in the contract;
(b) make good any pollution, contamination or damage to the environment arising out of, or in any way in connection with, the contractor’s activities, whether or not it has complied with all statutory requirements or other requirements of the contract for the protection of the environment; and
(c) indemnify the REIT to the full extent permitted by law against:
(i) any liability to or a claim by a third party; and
(ii) all fines, penalties, costs, losses or damages suffered or incurred by the REIT, arising out of or in connection with the contractor’s breach of the contract.
Approvals for property developments are required under various local, State and Territory environmental laws.
To the best of the Directors’ knowledge, the operations of the REIT have been undertaken in compliance with the applicable environmental regulations in each jurisdiction where the REIT operates.
Information on Current Directors
John HarknessAppointed 18 August 2003
Age: 70
John was appointed to the Board of the management company for the Charter Hall Retail REIT on 18 August 2003, and was appointed Chairman on 27 April 2011. John brings extensive financial and business skills to the Board. A partner at KPMG for 25 years and National Executive Chairman for five years, John has held a number of Non-Executive Director roles since leaving KPMG in 2000.
He is currently Chairman of Reliance Rail and an Independent Director of the Goodman Group. John is also Chairman of the National Foundation for Medical Research and Innovation.
John is a Fellow of both The Institute of Chartered Accountants (Australia) and the Australian Institute of Company Directors.
Current listed directorshipsGoodman Group (Director since 2005) (ASX: GMG)
Former listed directorships in last three yearsNil
Special responsibilitiesChairman of the Board of Directors, Member of the Audit, Risk and Compliance Committee
Interest in units of the REITNil
Directors’ Report
For
per
sona
l use
onl
y

Annual Report 2015 29
David HarrisonAppointed 1 March 2010
Age: 49
David has 27 years of property market experience across office, retail and industrial sectors. As Charter Hall Group’s Joint Managing Director, David is responsible for all aspects of the Charter Hall business, with specific focus on Investment Management, Strategy, Corporate Transactions and Property Investment activities.
David is directly responsible for overseeing operation of the Investment Management Divisions, including the Listed REIT’s, Wholesale Unlisted and Retail Unlisted Divisions, together with Investor Relations and Transactions. David also sits as an Executive Member on all Fund Boards and Investment Committees.
David has overseen the growth of the Charter Hall Group from $500 million to in excess of $14.5 billion of assets under management in 10 years. David has been principally responsible for transactions exceeding $18 billion of commercial, retail and industrial property assets across all property sectors over the past 28 years.
David holds a Bachelor of Business Degree (Land Economy) from the University of Western Sydney, is a Fellow Member of the Australian Property Institute (FAPI) and holds a Graduate Diploma in Applied Finance from the Securities Institute of Australia.
Current listed directorshipsCharter Hall Group (ASX: CHC)
Former listed directorships in last three yearsNil
Special responsibilitiesNil
Interest in units of the REITNil
Maurice KoopAppointed 12 August 2002
Age: 71
Maurice was appointed to the Board of the management company for the Charter Hall Retail REIT on 12 August 2002, and is Chairman of the Audit, Risk and Compliance Committee. His experience includes 26 years in consulting with particular focus on consumer goods, retailing and the financial services industry.
Maurice is a senior adviser to The Boston Consulting Group. He has served as a Non-Executive Director on a number of company boards including 13 years as a director of the Just Jeans Retail Group.
He has a BCom and a DipEd from Melbourne University and an MBA from the University of Toronto.
Current listed directorshipsNil
Former listed directorships in last three yearsNil
Special responsibilitiesChairman of Audit, Risk and Compliance Committee
Interest in units of the REIT48,404
For
per
sona
l use
onl
y

30 Charter Hall Retail REIT
Directors’ Report
Information on Current Directors continued
Alan Rattray-WoodAppointed 6 March 1996
Age: 63
Alan was appointed to the Board of the management company for the Charter Hall Retail REIT on 6 March 1996, and is a member of the Audit, Risk and Compliance Committee. He is an experienced industry participant with more than 35 years’ experience involving supermarket management, neighbourhood and regional sized shopping centre management, development and leasing. Alan has held management roles with Woolworths, Westfield Holdings, Knight Frank Agency and other private retail developers.
Since 1990, he has operated his own retail development consultancy practice, focusing on all facets of shopping centre development and retail chain insolvency workouts.
Current listed directorshipsNil
Former listed directorships in last three yearsNil
Special responsibilitiesMember of Audit, Risk and Compliance Committee
Interest in units of the REIT10,867
David SouthonAppointed 1 March 2010
Age: 49
David is a co-founder of the Charter Hall Group and one of its Joint Managing Directors, with over 28 years of property industry experience. Together and in conjunction with the CHC Executive Leadership Group and Board, the Joint Managing Directors are responsible for the formulation and implementation of the Group’s strategy. David is directly responsible for overseeing the operation of the Property Services Divisions including Retail, Office and Industrial Property Services; People, Brand and Community; Legal/CoSec; and Technology, as well as strategic involvement in project origination and direction. Together, the Joint Managing Directors share responsibility with the Chief Financial Officer in relation to Group Finance, Treasury and Capital Management.
In addition to being an Executive Director on the Charter Hall Group Board, David is an Executive Director on the Board of the Responsible Entity for Charter Hall Retail REIT, as well as the Responsible Entity Board of the Charter Hall Direct Funds. He is also a Non-Executive Director on the Board of Commercial Industrial Property (CIP), a member of the Charter Hall Diversity Committee, and a member of the investment committee of Charter Hall Opportunity Fund No.5, as well as our Valuation Sub Committee.
David is on the Board of Advisers NSW for the Property Industry Foundation.
David holds a Bachelor of Business Degree (Land Economy) and is a Fellow Member of the Australian Property Institute (FAPI).
Current listed directorshipsCharter Hall Group (ASX: CHC)
Former listed directorships in last three yearsNil
Special responsibilitiesNil
Interest in units of the REITNil
For
per
sona
l use
onl
y
Annual Report 2015 31
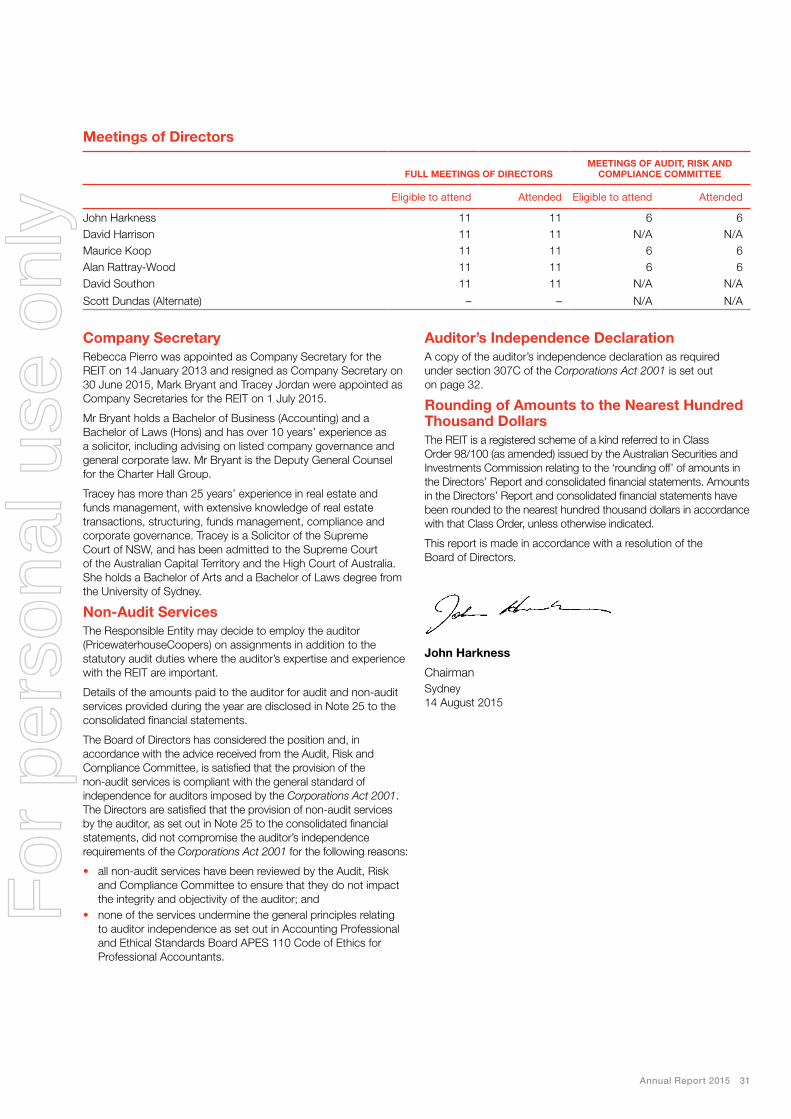
Meetings of Directors
FuLL MEETIngS OF DIRECTORSMEETIngS OF AuDIT, RISK AnD
COMPLIAnCE COMMITTEE
Eligible to attend Attended Eligible to attend Attended
John Harkness 11 11 6 6David Harrison 11 11 N/A N/AMaurice Koop 11 11 6 6Alan Rattray-Wood 11 11 6 6David Southon 11 11 N/A N/A
Scott Dundas (Alternate) – – N/A N/A
Company SecretaryRebecca Pierro was appointed as Company Secretary for the REIT on 14 January 2013 and resigned as Company Secretary on 30 June 2015, Mark Bryant and Tracey Jordan were appointed as Company Secretaries for the REIT on 1 July 2015.
Mr Bryant holds a Bachelor of Business (Accounting) and a Bachelor of Laws (Hons) and has over 10 years’ experience as a solicitor, including advising on listed company governance and general corporate law. Mr Bryant is the Deputy General Counsel for the Charter Hall Group.
Tracey has more than 25 years’ experience in real estate and funds management, with extensive knowledge of real estate transactions, structuring, funds management, compliance and corporate governance. Tracey is a Solicitor of the Supreme Court of NSW, and has been admitted to the Supreme Court of the Australian Capital Territory and the High Court of Australia. She holds a Bachelor of Arts and a Bachelor of Laws degree from the University of Sydney.
non-Audit ServicesThe Responsible Entity may decide to employ the auditor (PricewaterhouseCoopers) on assignments in addition to the statutory audit duties where the auditor’s expertise and experience with the REIT are important.
Details of the amounts paid to the auditor for audit and non-audit services provided during the year are disclosed in Note 25 to the consolidated financial statements.
The Board of Directors has considered the position and, in accordance with the advice received from the Audit, Risk and Compliance Committee, is satisfied that the provision of the non-audit services is compliant with the general standard of independence for auditors imposed by the Corporations Act 2001. The Directors are satisfied that the provision of non-audit services by the auditor, as set out in Note 25 to the consolidated financial statements, did not compromise the auditor’s independence requirements of the Corporations Act 2001 for the following reasons:
• all non-audit services have been reviewed by the Audit, Risk and Compliance Committee to ensure that they do not impact the integrity and objectivity of the auditor; and
• none of the services undermine the general principles relating to auditor independence as set out in Accounting Professional and Ethical Standards Board APES 110 Code of Ethics for Professional Accountants.
Auditor’s Independence DeclarationA copy of the auditor’s independence declaration as required under section 307C of the Corporations Act 2001 is set out on page 32.
Rounding of Amounts to the nearest Hundred Thousand DollarsThe REIT is a registered scheme of a kind referred to in Class Order 98/100 (as amended) issued by the Australian Securities and Investments Commission relating to the ‘rounding off’ of amounts in the Directors’ Report and consolidated financial statements. Amounts in the Directors’ Report and consolidated financial statements have been rounded to the nearest hundred thousand dollars in accordance with that Class Order, unless otherwise indicated.
This report is made in accordance with a resolution of the Board of Directors.
John Harkness
ChairmanSydney 14 August 2015
For
per
sona
l use
onl
y

32 Charter Hall Retail REIT
Auditor’s independence declarationFor the year ended 30 June 2015
Auditor’s Independence DeclarationAs lead auditor for the audit of Charter Hall Retail REIT for the year ended 30 June 2015, I declare that to the best of my knowledge and belief, there have been:
a) no contraventions of the auditor independence requirements of the Corporations Act 2001 in relation to the audit; and
b) no contraventions of any applicable code of professional conduct in relation to the audit.
This declaration is in respect of Charter Hall Retail REIT and the entities it controlled during the period.
Jane ReillyPartner SydneyPricewaterhouseCoopers 14 August 2015
PricewaterhouseCoopers, ABN 52 780 433 757Darling Park Tower 2, 201 Sussex Street, GPO BOX 2650, SYDNEY NSW 1171T: +61 2 8266 0000, F: +61 2 8266 9999, www.pwc.com.au
Liability limited by a scheme approved under Professional Standards Legislation.
For
per
sona
l use
onl
y

Annual Report 2015 33
Consolidated statement of comprehensive incomeFor the year ended 30 June 2015
Notes2015 $’m
2014 $’m
Revenue Gross rental income 200.9 184.3 Interest income 0.3 0.2
Total revenue 201.2 184.5
Other income
Share of net profit and valuation gains on investment in joint venture entity 12(b) 25.6 24.1 Net gain on movement in fair value of investment properties 3(a) 66.8 31.3
Total revenue and other income 293.6 239.9
ExpensesProperty expenses (64.2) (61.7)Net loss from derivative financial instruments 3(b) (12.9) (8.5)Net loss on disposal of investment properties 10(e) (0.9) (0.2)Management fees 24(d) (9.1) (8.1)Finance costs 3(c) (31.0) (24.5)Other expenses 3(d) (3.2) (3.5)
Total expenses (121.3) (106.5)
Profit for the year from continuing operations 172.3 133.4
Loss from discontinued operations 10(c) (9.8) (48.2)
Profit for the year 162.5 85.2
Other comprehensive income*Exchange differences on translation of foreign operations 18 (0.4) 1.6Transfer from reserves of cumulative FX losses on disposal of assets held for sale 18 9.2 30.6Change in the fair value of cash flow hedges 18 (0.1) –
Other comprehensive income 8.7 32.2
Total comprehensive income for the year 171.2 117.4
Basic and diluted earnings per ordinary unitholder of the REITEarnings per unit (cents) for profit from continuing operations 5 46.18 37.50Earnings per unit (cents) for loss from discontinued operations 5 (2.63) (13.55)
Earnings per unit (cents) 5 43.55 23.95
* All items in other comprehensive income can be reclassified into profit or loss.
The above consolidated statement of comprehensive income should be read in conjunction with the accompanying notes.
For
per
sona
l use
onl
y

34 Charter Hall Retail REIT
Consolidated balance sheetFor the year ended 30 June 2015
Notes2015 $’m
2014 $’m
Assets Current assets Cash and cash equivalents 6 6.5 12.0 Receivables 7 9.2 14.9 Derivative financial instruments 8 1.0 –Other assets 9 1.3 1.5
18.0 28.4
Assets classified as held for sale 10 – 132.0
Total current assets 18.0 160.4
non-current assetsInvestment properties 11 1,937.5 1,772.9 Investments in joint venture entity 12 148.2 129.8 Derivative financial instruments 8 – 1.9
Total non-current assets 2,085.7 1,904.6
Total assets 2,103.7 2,065.0
Liabilities
Current liabilities
Payables 13 21.5 20.7 Distribution payable 14 51.8 50.4 Borrowings 15 215.5 –Derivative financial instruments 8 1.0 –Other liabilities 16 0.4 0.3
290.2 71.4Liabilities directly associated with assets classified as held for sale 10 – 120.7
Total current liabilities 290.2 192.1
non-current liabilitiesBorrowings 15 432.2 613.4Derivative financial instruments 8 31.6 4.4
Total non-current liabilities 463.8 617.8
Total liabilities 754.0 809.9
net assets 1,349.7 1,255.1
EquityContributed equity 17 2,153.3 2,127.0Reserves 18 (0.1) (8.8)Accumulated losses 19 (803.5) (863.1)
Total equity 1,349.7 1,255.1
The above consolidated balance sheet should be read in conjunction with the accompanying notes.
For
per
sona
l use
onl
y

Annual Report 2015 35
Consolidated statement of changes in equityFor the year ended 30 June 2015
Notes
Contributedequity
$’m Reserves
$’m
Accumulatedlosses
$’m Consolidated
$’m
Total equity at 1 July 2013 2,010.5 (41.0) (848.4) 1,121.1Profit for the year – – 85.2 85.2 Other comprehensive income – 32.2 – 32.2
Total comprehensive income for the year – 32.2 85.2 117.4
Transactions with unitholders in their capacity as unitholders
– Contributions of equity, net of issue costs 17 116.5 – – 116.5 – Distributions paid and payable 4 – – (99.9) (99.9)
Total equity at 30 June 2014 2,127.0 (8.8) (863.1) 1,255.1
Total equity at 1 July 2014 2,127.0 (8.8) (863.1) 1,255.1
Profit for the year – – 162.5 162.5 Other comprehensive income – 8.7 – 8.7
Total comprehensive income for the year – 8.7 162.5 171.2
Transactions with unitholders in their capacity as unitholders– Contributions of equity, net of issue costs 17 26.3 – – 26.3– Distributions paid and payable 4 – – (102.9) (102.9)
Total equity at 30 June 2015 2,153.3 (0.1) (803.5) 1,349.7
The above consolidated statement of changes in equity should be read in conjunction with the accompanying notes.
For
per
sona
l use
onl
y

36 Charter Hall Retail REIT
Consolidated cash flow statementFor the year ended 30 June 2015
Notes2015 $’m
2014 $’m
Cash flows from operating activitiesProperty rental income received 221.3 205.2 Property expenses paid (67.7) (64.0)Distributions received from investment in joint venture entities 7.8 7.6 Distributions received from discontinued operations 0.3 3.5 Other operating expenses paid (21.1) (17.9)Finance costs paid (27.7) (25.3)Interest and other income 0.3 0.2 Settlement of derivative financial instruments – (18.7)
net cash flows from operating activities 21(a) 113.2 90.6
Cash flows from investing activitiesProceeds from sale of investment properties 34.0 290.8 Payments for investment properties and capital expenditure (124.5) (291.7)
net cash flows from investing activities (90.5) (0.9)
Cash flows from financing activitiesProceeds from borrowings 161.8 221.6 Repayment of borrowings (114.9) (330.9)Proceeds from issue of units – 86.5Distributions paid to unitholders, net of DRP (75.2) (65.1)
net cash flows from financing activities (28.3) (87.9)
Net increase in cash held (5.6) 1.8 Cash and cash equivalents at the beginning of the year 12.0 17.3 Effect of exchange rate changes on cash and cash equivalents 0.1 –Reclassification of cash and cash equivalents attributable to discontinued operations – (7.1)
Cash and cash equivalents at the end of the year 6 6.5 12.0
The above consolidated statement of cash flows should be read in conjunction with the accompanying notes.
For
per
sona
l use
onl
y

Annual Report 2015 37
notes to the consolidated financial statementsFor the year ended 30 June 2015
1. Summary of significant accounting policiesThe significant policies which have been adopted in the preparation of these consolidated financial statements for the year ended 30 June 2015 are set out below. These policies have been consistently applied to the years presented, unless otherwise stated.
(a) Basis of preparationThese general purpose financial statements have been prepared in accordance with the requirements of the REIT’s constitution, Australian Accounting Standards and Interpretations issued by the Australian Accounting Standards Board and the Corporations Act 2001. The REIT is a for-profit entity for the purpose of preparing the consolidated financial statements.
Compliance with IFRSThe financial statements of the REIT also comply with International Financial Reporting Standards (IFRS) as issued by the International Accounting Standards Board (IASB).
Historical cost conventionThe financial statements have been prepared on a historical cost basis, except for the following:
• derivative financial instruments – measured at fair value• investments in financial assets held at fair value – measured
at fair value• investment properties – measured at fair value
New and amended standards adoptedThe REIT has applied the following standards and amendments for the first time for the annual reporting period commencing 1 July 2014:
AASB 2013-3 Amendments to Australian Accounting Standards – Recoverable Amount Disclosures for Non-Financial AssetsThe AASB has made amendments to AASB 136 Impairment of Assets which requires disclosure of the recoverable amount of an asset or a cash generating unit when an impairment loss has been recognised or reversed and detailed disclosure of how the fair value less costs of disposal has been measured when an impairment loss has been recognised or reversed.
Critical accounting estimatesThe preparation of the consolidated financial statements in conformity with Australian Accounting Standards requires the use of certain critical accounting estimates and management to exercise its judgement in the process of applying the REIT’s accounting policies.
The areas involving significant estimates or judgements are:
Consolidation decisions and classification of joint arrangements – Note 1(b)
• Impairment of assets – Note 1(i)• Derivative financial instruments – Note 1(l)• Investment properties – Note 1(m)• Fair value estimation – Note 1(v)
Estimates and judgements are continually evaluated. They are based on historical experience and other factors, including expectations of future events that may have a financial impact on the REIT and that are believed to be reasonable under the circumstances.
Excess of current liabilities over current assetsThe REIT’s $231.5 million commercial mortgage backed securities (CMBS) mature in September 2015 and are reflected as a current liability in this annual financial report. These notes will be repaid using proceeds from US$200 million US Private Placement issuance that was funded on 22 July 2015.
The remaining excess of $40.7 million results from the REIT’s policy of using available cash generated from earnings prior to distribution to reduce drawn revolving debt facilities combined with the REIT’s distribution liability at the end of the reporting period. As at 22 July, the REIT had $403 million of undrawn debt capacity that can be used to fund its distribution liability and CMBS refinance.
(b) Principles of consolidation(i) Controlled entitiesSubsidiaries are all entities over which the REIT has control. The REIT controls an entity when the REIT is exposed to, or has rights to, variable returns from its involvement with the entity and has the ability to affect those returns through its power to direct the activities of the entity. Subsidiaries are fully consolidated from the date on which control is transferred to the REIT. They are deconsolidated from the date that control ceases.
Intercompany transactions, balances and unrealised gains on transactions between group companies are eliminated. Unrealised losses are also eliminated unless the transaction provides evidence of an impairment of the transferred asset. Accounting policies of controlled entities have been changed where necessary to ensure consistency with the policies adopted by the REIT.
(ii) Joint arrangementsUnder AASB 11 Joint Arrangements, investments in joint arrangements are classified as either joint operations or joint ventures. The classification depends on the contractual rights and obligations of each investor, rather than the legal structure of the joint arrangement.
During the year, the REIT had both joint operations and joint ventures.
Joint operationsThe REIT recognises its direct right to the assets, liabilities, revenues and expenses of joint operations and its share of any jointly held or incurred assets, liabilities, revenues and expenses. These are incorporated in the financial statements under the appropriate headings.
Joint venturesInterests in joint ventures are accounted for using the equity method, with investments initially recognised at cost and adjusted thereafter to recognise the REIT’s share of post-acquisition profits or losses of the investee in profit or loss, and the REIT’s share of movements in other comprehensive income of the investee in other comprehensive income. Dividends received or receivable from joint ventures are recognised as a reduction in the carrying amount of the investment.
When the REIT’s share of losses in an equity accounted investment equals or exceeds its interest in the entity, including any other unsecured long-term receivables, the REIT does not recognise further losses, unless it has incurred obligations or made payments on behalf of the other entity.
Unrealised gains on transactions between the REIT and its joint venture entities are eliminated to the extent of the REIT’s interest in these entities. Unrealised losses are also eliminated unless the transaction provides evidence of an impairment of the asset transferred. Accounting policies of equity accounted investees have been changed where necessary to ensure consistency with the policies adopted by the REIT.
There were no unrealised gains or losses on transactions between the REIT and its joint venture entities during the current and prior years.
For
per
sona
l use
onl
y

38 Charter Hall Retail REIT
Notes to the consolidated financial statements
1. Summary of significant accounting policies continued
(b) Principles of consolidation continued(iii) Changes of ownership interestsWhen the REIT ceases to have control or joint control, any retained interest in the entity is remeasured to its fair value with the change in carrying amount recognised in profit or loss. This fair value becomes the initial carrying amount for the purposes of subsequently accounting for the retained interest as a joint venture entity or financial asset. In addition, any amounts previously recognised in other comprehensive income in respect of that entity are accounted for as if the REIT had directly disposed of the related assets or liabilities. This may mean that amounts previously recognised in other comprehensive income are reclassified to profit or loss. The REIT treats transactions with non-controlling interests that do not result in a loss of control as transactions with equity owners of the REIT.
If the ownership interest in a joint venture entity is reduced but joint control is retained, only a proportionate share of the amounts previously recognised in other comprehensive income is reclassified to profit or loss where appropriate.
There were no changes in the REIT’s ownership interest in its joint venture entities during the current and prior years.
(c) Segment reportingSegment information is reported in a manner that is consistent with internal reporting provided to the chief operating decision maker. The chief operating decision maker, who is responsible for allocating resources and assessing performance of the operating segments, has been identified as the Board of the Responsible Entity.
(d) Foreign currency translation(i) Functional and presentation currenciesItems included in the financial statements of each of the REIT’s entities are measured using the currency of the primary economic environment in which the entity operates (the functional currency). The financial statements are presented in Australian dollars, which is the REIT’s functional and presentation currency.
(ii) Transactions and balancesForeign currency transactions are translated into the functional currency using the exchange rates prevailing at the dates of the transactions. Foreign exchange gains and losses resulting from the settlement of such transactions and from the translation at year end exchange rates of monetary assets and liabilities denominated in foreign currencies are recognised in the consolidated statement of comprehensive income, except when they are deferred in equity as qualifying cash flow hedges and qualifying net investment hedges or are attributable to part of the net investment in a foreign operation.
Non-monetary items that are measured at fair value in a foreign currency are translated using the exchange rates at the date when the fair value was determined. Translation differences on assets and liabilities carried at fair value are reported as part of the fair value gain or loss.
(iii) Foreign operationsThe results and financial position of foreign operations that have a functional currency different from the presentation currency are translated into the presentation currency as follows:
• assets and liabilities for each consolidated balance sheet presented are translated at the closing rate at the date of that consolidated balance sheet;
• income and expenses for each income statement and consolidated statement of comprehensive income are translated at average exchange rates; and
• all resulting exchange differences are recognised in other comprehensive income.
(iv) Foreign currency translationOn consolidation, exchange differences arising from the translation of any net investment in foreign entities, and of borrowings and other financial instruments designated as hedges of such investments, are recognised in other comprehensive income. On disposal of interest in foreign controlled entities, the cumulative foreign exchange gains/losses relating to these investments are transferred to the consolidated statement of comprehensive income in accordance with the requirements of AASB 121 The Effect of Changes in Foreign Exchange Rates.
At the balance date, the spot and average rates used were:
30 Jun 2015
30 Jun2014
Spot rateUS Dollar 0.7678 0.9395NZ Dollar 1.1369 1.0749Euro 0.6865 0.6883
Average rateUS Dollar 0.8298 0.9140
NZ Dollar 1.0799 1.1026
Euro 0.6963 0.6722
(e) Revenue recognitionProperty rental income represents income earned from the rental of REIT properties (inclusive of outgoings recovered from tenants) and is recognised on a straight line basis over the lease term. The portion of rental income relating to fixed increases in operating lease rentals in future years is recognised as a separate component of investment properties. Turnover rent is recognised on an accruals basis.
Interest income is recognised using the effective interest rate method.
Gains or losses on the sale of investment properties and investments in joint venture entities are calculated as the difference between the carrying amount of the asset at the date of disposal and the net proceeds from disposal and are included in the consolidated statement of comprehensive income in the year of disposal. Where revenue is obtained from the sale of properties or assets, it is recognised when the significant risks and rewards have transferred to the buyer. This will normally take place on settlement of the acquisition.
(f) ExpensesProperty expenses, other expenses and outgoings, including rates, taxes and other property outgoings incurred in relation to investment properties where such expenses are the responsibility of the REIT, are recognised on an accruals basis.
(g) Repairs and maintenanceRepairs and maintenance costs and minor renewals are charged as expenses when incurred. These repairs and maintenance costs will consist of those that, under the relevant lease agreements, are non-recoverable from tenants.
(h) Income taxUnder current Australian income tax legislation, the REIT is not liable to pay income tax provided its income for the year, as determined under the REIT’s constitution, is fully distributed to unitholders, by way of cash or reinvestment.
For
per
sona
l use
onl
y

Annual Report 2015 39
The liability for capital gains tax that may arise if the Australian properties were sold is not accounted for in these financial statements.
Where applicable, deferred income tax is determined using the balance sheet method, being the temporary differences arising between the tax bases of assets and liabilities and their carrying amounts in the consolidated financial statements. Deferred tax assets are recognised for deductible temporary differences and unused tax losses only if it is probable that future taxable amounts will be available to utilise those temporary differences and unused tax losses. However, the deferred income tax is not accounted for if it arises from initial recognition of an asset or liability in a transaction other than a business combination that at the time of the transaction affects neither accounting nor taxable profit or loss. Deferred income tax is determined using tax rates (and laws) that have been enacted or substantially enacted by the balance date and are expected to apply when the related deferred income tax asset is realised or the deferred income tax liability is settled.
Deferred tax assets and liabilities are offset when there is a legally enforceable right to offset current tax assets and liabilities and when the deferred tax balances relate to the same taxation authority. Measurement of deferred tax assets or liabilities reflects tax consequences that would follow from the way management expects to recover or settle the carrying amount of the relevant assets or liabilities, that is through use or through sale.
Current and deferred tax is recognised in profit or loss, except to the extent that it relates to items recognised in other comprehensive income or directly in equity. In this case, the tax is also recognised in other comprehensive income or directly in equity, respectively.
(i) Impairment of assetsAssets are reviewed for impairment whenever events or changes in circumstances indicate that the carrying amount may not be recoverable.
An impairment loss is recognised for the amount by which the asset’s carrying amount exceeds its recoverable amount. The recoverable amount is the higher of an asset’s fair value less costs to sell and value in use. For the purposes of assessing impairment, assets are grouped at the lowest levels for which there are separately identifiable cash inflows which are largely independent of the cash inflows from other assets or groups of assets (cash generating units). Non-financial assets that suffered impairment in prior years are reviewed for possible reversal of the impairment at each reporting date.
(j) Cash and cash equivalentsFor the purpose of presentation in the cash flow statement, cash and cash equivalents includes cash on hand, deposits held at call with financial institutions, other short-term, highly liquid investments with original maturities of three months or less that are readily convertible to known amounts of cash and which are subject to an insignificant risk of changes in value and bank overdrafts. Bank overdrafts are shown within borrowings in current liabilities in the consolidated balance sheet.
(k) Trade and other receivablesReceivables are initially recognised at the amounts due to the REIT. Rent and outgoings receivables are usually settled within 30 days of recognition and turnover rent receivables due to the REIT are usually settled within 90 days of the end of the tenants’ anniversary lease years.
Collectability of trade receivables is reviewed on an ongoing basis. Debts which are known to be uncollectible are written off in the year in which they are identified. A provision for doubtful debts is raised
where there is objective evidence that the REIT will not collect all amounts due. The amount of the provision is the difference between the carrying amount and estimated future cash flows. Cash flows relating to current receivables are not discounted.
(l) Derivative financial instrumentsDerivatives are initially recognised at fair value on the date a derivative contract is entered into and are subsequently remeasured to their fair value at the end of each reporting period. The accounting for subsequent changes in fair value depends on whether the derivative is designated as a hedging instrument, and if so, the nature of the item being hedged. The REIT designates certain derivatives as either:
• hedges of the fair value of recognised assets or liabilities or a firm commitment (fair value hedges) or
• hedges of a particular risk associated with the cash flows of recognised assets and liabilities and highly probable forecast transactions (cash flow hedges).
The REIT documents at the inception of the hedging transaction the relationship between hedging instruments and hedged items, as well as its risk management objective and strategy for undertaking various hedge transactions. The REIT also documents its assessment, both at hedge inception and on an ongoing basis, of whether the derivatives that are used in hedging transactions have been and will continue to be highly effective in offsetting changes in fair values or cash flows of hedged items.
The fair values of various derivative financial instruments used for hedging purposes are disclosed in Note 23. Movements in the hedging reserve in unitholders’ equity are shown in Note 18. The full fair value of a hedging derivative is classified as a non-current asset or liability when the remaining maturity of the hedged item is more than 12 months; it is classified as a current asset or liability when the remaining maturity of the hedged item is less than 12 months. Trading derivatives are classified as a current asset or liability.
Fair value hedgesChanges in the fair value of derivatives that are designated and qualify as fair value hedges are recorded in profit or loss, together with any changes in the fair value of the hedged asset or liability that are attributable to the hedged risk. The gain or loss relating to the effective portion of interest rate swaps hedging fixed rate borrowings is recognised in profit or loss within finance costs, while changes in the fair value of the hedged fixed rate borrowings attributable to interest rate risk are recognised within ‘Net gains/losses from derivative financial instruments’. The gain or loss relating to the ineffective portion is also recognised in profit or loss within ‘Net gains/losses from derivative financial instruments’. If the hedge no longer meets the criteria for hedge accounting, the adjustment to the carrying amount of a hedged item for which the effective interest method is used is amortised to profit or loss over the period to maturity using a recalculated effective interest rate.
Cash flow hedgesThe effective portion of changes in the fair value of derivatives that are designated and qualify as cash flow hedges is recognised in other comprehensive income and accumulated in reserves in equity. The gain or loss relating to the ineffective portion is recognised immediately in profit or loss within ‘Net gains/losses from derivative financial instruments’.
Amounts accumulated in equity are reclassified to profit or loss in the periods when the hedged item affects profit or loss (for instance when the forecast transaction that is hedged takes place). The gain or loss relating to the effective portion of cross currency interest rate swaps hedging fixed rate borrowings is recognised in profit or loss within ‘Finance costs’.
For
per
sona
l use
onl
y

40 Charter Hall Retail REIT
1. Summary of significant accounting policies continued
(l) Derivative financial instruments continuedCash flow hedges continuedWhen a hedging instrument expires or is sold or terminated, or when a hedge no longer meets the criteria for hedge accounting, any cumulative gain or loss existing in equity at that time remains in equity and is recognised when the forecast transaction is ultimately recognised in profit or loss. When a forecast transaction is no longer expected to occur, the cumulative gain or loss that was reported in equity is immediately reclassified to profit or loss.
Certain derivative instruments do not qualify for hedge accounting. Changes in the fair value of any derivative instrument that does not qualify for hedge accounting are recognised immediately in profit or loss and are included in other income or other expenses.
(m) Investment propertiesInvestment properties comprise investment interests in land and buildings (including integral plant and equipment) held for the purpose of producing rental income, including properties that are under construction for future use as investment properties.
Initially, investment properties are measured at cost including transaction costs. Subsequent to initial recognition, the investment properties are then stated at fair value. Fair value of investment property is the price at which the property could be exchanged between knowledgeable, willing parties in an arm’s length transaction. A “willing seller” is neither a forced seller nor one prepared to sell at a price not considered reasonable in the current market. The best evidence of fair value is given by current prices in an active market for similar property in the same location and condition. Gains and losses arising from changes in the fair values of investment properties are included in the consolidated statement of comprehensive income in the year in which they arise.
At each balance date, the fair values of the investment properties are assessed by the Responsible Entity with reference to independent valuation reports or through appropriate valuation techniques adopted by the Responsible Entity. Fair value is determined using a long term investment period. Specific circumstances of the owner are not taken into account.
The use of independent external valuers is on a progressive basis over a three year period, or earlier, where the Responsible Entity deems it appropriate or believes there may be a material change in the carrying value of the property.
Where an independent valuation is not obtained, the factors taken into account, where appropriate, by the Directors in determining fair value may include:
• Assuming a willing buyer and a willing seller, without duress and an appropriate time to market the property to maximise price;
• Information obtained from valuers, sales and leasing agents, market research reports, vendors and potential purchasers;
• Capitalisation rates used to value the asset, market rental levels and lease expiries;
• Changes in interest rates;• Asset replacement values;• Discounted cash flow models;• Available sales evidence;• Comparisons to valuation professionals performing valuation
assignments across the market: and• Contractual obligations to purchase, construct or develop
investment property or for repairs, maintenance or enhancements.
The carrying amount of investment properties recorded in the balance sheet takes into consideration components relating to lease incentives, leasing costs and assets relating to fixed increases in operating lease rentals in future years.
Where the REIT disposes of a property at fair value in an arm’s length transaction, the carrying value immediately prior to the sale is adjusted to the transaction price, and the adjustment is recorded in the income statement within net gain from fair value adjustment on investment property.
Investment property under construction is measured at fair value less costs to complete if the fair value is considered reliably determinable. Investment property under construction for which the fair value cannot be determined reliably, but for which the REIT expects that the fair value of the investment property will be reliably determinable when construction is completed, are measured at cost less impairment until the fair value becomes reliably determinable or construction is completed – whichever is earlier.
It may sometimes be difficult to determine reliably the fair value of the investment property under construction. In order to evaluate whether the fair value of an investment property under construction can be determined reliably, management considers, among others, the stage of completion, the level of reliability of cash inflows after completion, the development risk specific to property and the past experience with similar constructions.
As the fair value method has been adopted for investment properties, the buildings and any component thereof (including plant and equipment) are not depreciated. Taxation allowances for the depreciation of buildings and plant and equipment are claimed by the REIT and contribute to the tax deferred component of distributions.
Refer to Note 23(d) for the REIT’s valuation policy for Investment properties.
Investment properties held for saleInvestment properties are classified as held for sale when it is highly probable that the carrying amount will be recovered principally through a sale transaction rather than through continuing use. Investment properties classified as held for sale are classified as current assets and measured at fair value.
(n) Lease incentivesProspective lessees may be offered incentives as an inducement to enter into non-cancellable operating leases. These incentives may take various forms including rent-free periods, upfront cash payments, or a contribution to certain lessee costs such as a fitout contribution. Incentives are capitalised in the consolidated balance sheet as a component of investment properties and amortised over the term of the lease as an adjustment to net rental income.
(o) non-current assets classified as held for sale and discontinued operations
Non-current assets are classified as held for sale and carried as current assets if their carrying amount will be recovered principally through a sale transaction rather than through continuing use and a sale is considered highly probable. They are measured at the lower of their carrying amount and fair value less costs to sell, except for assets such as deferred tax assets and investment property that are carried at fair value.
An impairment loss is recognised for any initial or subsequent write-down of the asset to fair value less costs to sell. A gain is recognised for any subsequent increases in fair value less costs to sell of an asset, but not in excess of any cumulative impairment loss previously recognised. A gain or loss not previously recognised by the date of the sale of the non-current asset is recognised at the date of derecognition.
Notes to the consolidated financial statements
For
per
sona
l use
onl
y

Annual Report 2015 41
Non-current assets classified as held for sale are presented separately from the other assets in the consolidated balance sheet. The liabilities directly associated with assets classified as held for sale are also presented separately from other liabilities in the consolidated balance sheet.
A discontinued operation is a component of the REIT that has been disposed of or is classified as held for sale and that represents a separate major line of business or geographical area of operations, is part of a single co-ordinated plan to dispose of such a line of business or area of operations, or is a subsidiary acquired exclusively with a view to resale. The results of discontinued operations are presented separately in the consolidated statement of comprehensive income.
(p) Trade and other payablesLiabilities are recognised for amounts to be paid in the future for goods and services received, whether or not billed to the REIT. The amounts are unsecured and are usually paid within 30 days of recognition. Trade and other payables are presented as current liabilities unless payment is not due within 12 months after the reporting period. They are recognised initially at their fair value and subsequently measured at amortised cost using effective interest method.
(q) BorrowingsBorrowings are initially recognised at fair value and subsequently measured at amortised cost using the effective interest rate method or at their fair value at the time of acquisition in the case of assumed liabilities in a business combination. Under the effective interest rate method, any transaction fees, costs, discounts and premiums directly related to the borrowings are recognised in profit or loss over the expected life of the borrowings unless there is an effective fair value hedge of the borrowings, in which case a fair value adjustment will be applied based on the mark to market movement in the benchmark component of the borrowings and this movement is recognised in profit or loss. All borrowings with maturities greater than 12 months after reporting date are classified as non-current liabilities.
(r) Borrowing costsBorrowing costs associated with the acquisition or construction of a qualifying asset, including interest expense, are capitalised as part of the cost of that asset during the period that is required to complete and prepare the asset for its intended use. Borrowing costs not associated with qualifying assets are expensed.
The capitalisation rate used to determine the amount of borrowing costs to be capitalised is the interest rate applicable to the REIT’s outstanding bank borrowings during the year, in this case 5.73% per annum (2014: 4.89% per annum). The weighted average interest rate takes into consideration payments made in relation to the REIT’s interest rate swaps during the year.
(s) Contributed equityUnits on issue are classified as equity and recognised at the fair value of the consideration received by the REIT. Transaction costs arising on the issue of equity are recognised directly in equity as a reduction in the proceeds of units to which the costs relate.
(t) ReservesIn accordance with the REIT’s constitution, amounts may be transferred from reserves or contributed equity to fund distributions.
(u) Distributions paid and payableA liability is recognised for the amount of any distribution declared by the REIT on or before the end of the reporting period but not distributed at balance date.
(v) Fair value estimationThe fair value of financial assets and financial liabilities must be estimated for recognition and measurement or for disclosure purposes.
A fair value measurement of a non-financial asset takes into account the REIT’s ability to generate economic benefits by using the asset in its highest and best use or by selling it to another market participant that would use the asset in its highest and best use.
The fair value of financial instruments traded in active markets is determined using quoted market prices at the balance date. The quoted market price used for financial assets held by the REIT is the current bid price; the appropriate quoted market price for financial liabilities is the current ask price.
The fair value of financial instruments that are not traded in an active market is determined using valuation techniques. The REIT uses a variety of methods and makes assumptions that are based on market conditions existing at each balance date. Other techniques, such as estimated discounted cash flows, are used to determine fair value for the remaining financial instruments. The fair value of interest rate swaps is calculated as the present value of the estimated future cash flows.
The fair value of cross currency interest rate swaps is determined using forward foreign exchange market rates and the present value of the estimated future cash flows at the balance date.
The nominal value less estimated credit adjustments of trade receivables and payables approximate their fair values. The fair value of financial liabilities for disclosure purposes is estimated by discounting the future contractual cash flows at the current market interest rate that is available to the REIT for similar financial instruments.
(w) Earnings per unitBasic earnings per unit from continuing operations is determined by dividing profit from continuing operations attributable to the unitholders by the weighted average number of ordinary units on issue during the year.
Basic earnings per unit from discontinued operations is determined by dividing profit/(loss) from discontinued operations attributable to the unitholders by the weighted average number of ordinary units on issue during the year.
Basic earnings per unit is determined by dividing the profit by the weighted average number of ordinary units on issue during the year.
Diluted earnings per unit from continuing operations is determined by dividing profit from continuing operations attributable to the unitholders by the weighted average number of ordinary units and dilutive potential ordinary units on issue during the year.
Diluted earnings per unit from discontinued operations is determined by dividing profit/(loss) from discontinued operations attributable to the unitholders by the weighted average number of ordinary units and dilutive potential ordinary units on issue during the year.
Diluted earnings per unit is determined by dividing the profit by the weighted average number of ordinary units and dilutive potential ordinary units on issue during the year.
(x) goods and Services Tax (gST)Income, expenses, assets (with the exception of receivables) and liabilities (with the exception of payables) are recognised net of the amount of GST recoverable from the Australian Taxation Office (ATO). The non-recoverable GST is recognised as part of the income, expense, asset or liability.
For
per
sona
l use
onl
y

42 Charter Hall Retail REIT
1. Summary of significant accounting policies continued
(x) goods and Services Tax (gST) continuedReceivables and payables are inclusive of GST. The net amount of GST recoverable from or payable to the ATO is included in receivables or payables in the consolidated balance sheet.
Cash flows relating to GST are included in the consolidated statement of cash flows on a gross basis. The GST components of cash flows arising from investing or financing activities which are recoverable from, or payable to the ATO, are presented as operating cash flows.
(y) Parent entity financial informationThe financial information for the parent entity, Charter Hall Retail REIT, disclosed in Note 28, has been prepared on the same basis as the REIT’s financial statements except as set out below:
(i) Investments in controlled entitiesInvestments in controlled entities, associates and joint ventures are accounted for at cost in the financial statements of the parent entity. Such investments include both investments in equity securities issued by the controlled entity and other parent entity interests that in substance form part of the parent entity’s investment in the controlled entity. These include investments in the form of interest-free loans which have no fixed contractual term and which have been provided to the controlled entity as an additional source of long term capital.
Dividends and distributions received from controlled entities, associates and joint ventures are recognised in the parent entity’s statement of comprehensive income, rather than deducted from the carrying amount of these investments.
(ii) Receivables and payablesTrade amounts receivable from controlled entities in the normal course of business and other amounts advanced on commercial terms and conditions are included in receivables. Similarly, amounts payable to controlled entities are included in payables.
(iii) Recoverable amount of assetsThe carrying amounts of investments in controlled entities, associates and joint ventures valued on the cost basis are reviewed to determine whether they are in excess of their recoverable amount at balance date. If the carrying value exceeds their recoverable amount, the assets are written down to the lower value. The write-down is expensed in the year in which it occurs.
(z) Impact of new standards and interpretations issued but not yet adopted by the REIT
Certain new accounting standards and interpretations have been published that are not mandatory for the 30 June 2015 reporting period but are available for early adoption. The impact of these new standards (to the extent relevant to the REIT) and interpretations is set out below:
(i) AASB 9 Financial Instruments (Applicable 1 January 2018)AASB 9 Financial Instruments addresses the classification, measurement and derecognition of financial assets and liabilities and sets out new rules for hedge accounting. AASB 9 only permits the recognition of fair value gains and losses in other comprehensive income if they relate to equity investments that are not held for trading. Fair value gains and losses on available-for-sale debt investments, for example, would therefore have to be recognised directly in the statement of comprehensive income. The REIT has not yet decided when to adopt AASB 9 and management is currently assessing the impact of the new standard.
(ii) AASB 15 Revenue from Contracts with Customers (Applicable 1 January 2018)The standard is based on the principle that revenue is recognised when control of a good or service is transferred to a customer, so the notion of control replaces the notion of risks and rewards. It applies to all contracts with customers except leases, financial instruments and insurance contracts. AASB 15 requires reporting entities to provide users of financial statements with more informative, relevant disclosures. The REIT is in the process of assessing the implications of the new standard to its operational and financial results.
(iii) AASB 2014-3 Accounting for Acquisitions of Interests in Joint Operations (Applicable 1 January 2016)AASB 11 Joint Arrangements clarifies the accounting for the acquisition of an interest in a joint operation where the joint operation constitutes a business under AASB 3 Business Combinations. The changes are applicable from 1 January 2016. The REIT does not expect a significant impact from its application.
(aa) Comparative informationWhere necessary, comparative information has been adjusted to conform with changes in presentation in the current year.
(ab) Rounding of amountsThe REIT is a registered scheme of a kind referred to in Class Order 98/100 (as amended) issued by the Australian Securities and Investments Commission relating to the ‘rounding off’ of amounts in the financial statements. Amounts in the financial statements have been rounded to the nearest hundred thousand dollars in accordance with that Class Order, unless otherwise indicated.
2. Segment information(a) Description of segmentsThe Directors of the Responsible Entity have determined the operating segments based on the reports reviewed by the chief operating decision maker, being the Board of the Responsible Entity. Previously, the REIT’s results were split by geographic segments, which included Australia, New Zealand, Poland, Germany, United States and REIT operations. Since the REIT no longer holds interest in offshore properties, the Board has redefined the REIT’s operating segments as follows:
• Freestanding supermarkets – Standalone supermarket with no specialty shops;
• Neighbourhood shopping centres which comprises local shopping centres with one supermarket and a gross lettable area (GLA) less than 10,000 sqm;
• Sub-regional shopping centres which comprises medium sized shopping centres typically incorporating at least full line discount department store and a major supermarket with total GLA of up to 40,000sqm; and
• REIT operations, which includes all other income and expenses which are not directly attributable to these shopping centres.
Income is presented on the basis of each segment’s operating earnings. Presentation of prior year operating earnings was restated to conform to the presentation in the current year. The value of investments, income and expenses are included based on the REIT’s ownership percentage. Investment properties are presented on the basis set out in Note 11. All other assets and liabilities are presented on a consolidated basis, in line with the consolidated balance sheet. This is consistent with the manner in which the information is presented to the Board in its capacity as chief operating decision maker.
Notes to the consolidated financial statements
For
per
sona
l use
onl
y

Annual Report 2015 43
(b) Segment information provided to the BoardThe operating earnings reported to the Board for the operating segments for the year ended 30 June 2015 is as follows:
2015
Freestanding supermarkets
$’m
neighbourhood shopping
centres$’m
Sub-regional shopping
centres$’m
REIT operations
$’m Total $’m
Net property income from wholly owned properties 14.1 68.6 56.0 – 138.7 Net income from joint venture entity – 6.8 8.4 (4.2) 11.0 Other income – – – 0.3 0.3 Management fees – – – (9.1) (9.1)Finance costs – – – (26.9) (26.9)Other expenses – – – (3.2) (3.2)
Operating earnings 14.1 75.4 64.4 (43.1) 110.8
2014
Freestanding supermarkets
$’m
Neighbourhood shopping
centres$’m
Sub-regional shopping
centres$’m
REIT operations
$’m Total $’m
Net property income from wholly owned Australian properties 13.8 63.0 46.6 – 123.4 Net income from joint venture entity – 6.9 8.1 (4.7) 10.3 Realised gains on derivative financial instruments – – – 0.9 0.9 Other income – – – 0.2 0.2 Management fees – – – (8.1) (8.1)Finance costs – – – (24.5) (24.5)Other expenses – – – (3.5) (3.5)Operating earnings from discontinued operations – – – 6.6 6.6
Operating earnings 13.8 69.9 54.7 (33.1) 105.3
A reconciliation between operating earnings to the profit after tax is set out below:
2015 $’m
2014 $’m
Operating earnings 110.8 105.3
Unrealised net valuation gains on investment properties 82.2 21.7 Unrealised and capital transaction related realised losses on derivative financial instruments (13.4) (8.8)Loss on sale of investment properties (1.6) (4.0)Write off of capitalised borrowing costs related to extinguished debt facilities (4.1) –Transfer from reserves of cumulative FX losses on disposal of assets held for sale (9.2) (30.6)Earnings from German operations* – 2.5 Other (2.2) (0.9)
Profit from continuing and discontinued operations 162.5 85.2
* Excluding unrealised and non-cash items relating to German operations.
Operating earnings is a financial measure which represents the profit/(loss) under Australian Accounting Standards adjusted for certain unrealised and non-cash items, reserve transfers, capital transactions and other non-core items.
The inclusion of operating earnings as a measure of the REIT’s profitability provides investors with the same basis that is used internally for evaluating operating segment performance. Operating earnings is used by the Board to make strategic decisions and as a guide to assessing an appropriate distribution to declare.
Operating earnings also aligns to Funds from Operations (FFO) as defined by the Property Council of Australia.
For
per
sona
l use
onl
y
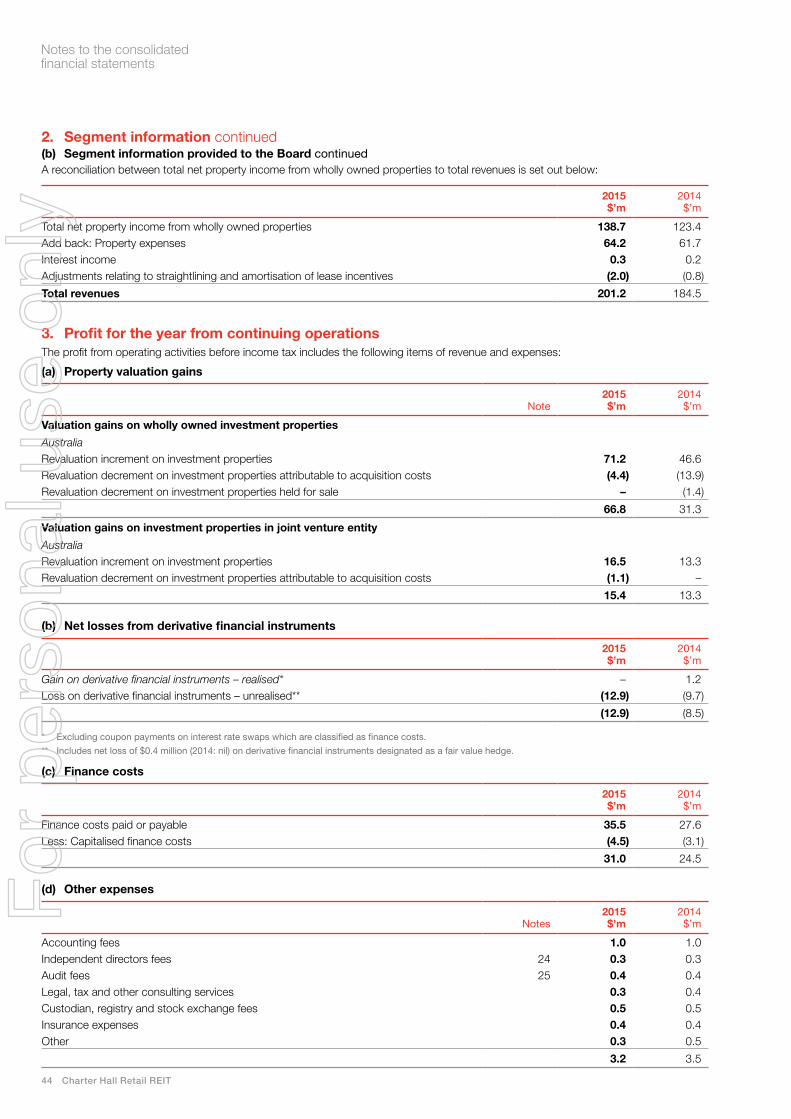
44 Charter Hall Retail REIT
2. Segment information continued(b) Segment information provided to the Board continuedA reconciliation between total net property income from wholly owned properties to total revenues is set out below:
2015 $’m
2014 $’m
Total net property income from wholly owned properties 138.7 123.4 Add back: Property expenses 64.2 61.7 Interest income 0.3 0.2 Adjustments relating to straightlining and amortisation of lease incentives (2.0) (0.8)
Total revenues 201.2 184.5
3. Profit for the year from continuing operationsThe profit from operating activities before income tax includes the following items of revenue and expenses:
(a) Property valuation gains
Note 2015 $’m
2014 $’m
Valuation gains on wholly owned investment properties
Australia
Revaluation increment on investment properties 71.2 46.6 Revaluation decrement on investment properties attributable to acquisition costs (4.4) (13.9)Revaluation decrement on investment properties held for sale – (1.4)
66.8 31.3
Valuation gains on investment properties in joint venture entity
Australia
Revaluation increment on investment properties 16.5 13.3 Revaluation decrement on investment properties attributable to acquisition costs (1.1) –
15.4 13.3
(b) net losses from derivative financial instruments
2015 $’m
2014 $’m
Gain on derivative financial instruments – realised* – 1.2 Loss on derivative financial instruments – unrealised** (12.9) (9.7)
(12.9) (8.5)
* Excluding coupon payments on interest rate swaps which are classified as finance costs.
** Includes net loss of $0.4 million (2014: nil) on derivative financial instruments designated as a fair value hedge.
(c) Finance costs
2015 $’m
2014 $’m
Finance costs paid or payable 35.5 27.6 Less: Capitalised finance costs (4.5) (3.1)
31.0 24.5
(d) Other expenses
Notes 2015 $’m
2014 $’m
Accounting fees 1.0 1.0 Independent directors fees 24 0.3 0.3 Audit fees 25 0.4 0.4 Legal, tax and other consulting services 0.3 0.4Custodian, registry and stock exchange fees 0.5 0.5 Insurance expenses 0.4 0.4 Other 0.3 0.5
3.2 3.5
Notes to the consolidated financial statements
For
per
sona
l use
onl
y

Annual Report 2015 45
4. Distributions paid and payable
Distribution cents per unit
Total amount
$’m
Tax deferred
%
CgTconcession
amount%
Taxable%
Ordinary unitholders
2015 distributions for the half year ended:31 December 2014 13.70 51.1 30 June 2015* 13.80 51.8
27.50 102.9 35.49 4.21 60.30
Ordinary unitholders
2014 distributions for the half year ended:31 December 2013 13.65 49.5 30 June 2014 13.65 50.4
27.30 99.9 44.78 – 55.22
* The distribution of 13.80 cents per unit for the year ended 30 June 2015 was declared prior to 30 June 2015 and will be paid on 31 August 2015.
Pursuant to the REIT constitution, the amount distributed to unitholders is at the discretion of the Responsible Entity. The Responsible Entity uses operating earnings (refer to Note 2) as a guide to assessing an appropriate distribution to declare.
5. Earnings per unit
2015 2014
Basic and diluted earnings per ordinary unitholder of the REIT Earnings per unit (cents) for profit from continuing operations 46.18 37.50 Earnings per unit (cents) for loss from discontinued operations (2.63) (13.55)Earnings per unit (cents) 43.55 23.95 Earnings used in the calculation of basic and diluted earnings per unit Net profit from continuing operations ($’m) 172.3 133.4 Net loss from discontinued operations ($’m) (9.8) (48.2)Net profit for the year ($’m) 162.5 85.2
Weighted average number of units used in the calculation of basic and diluted earnings per unit (millions)* 373.1 355.7
* Weighted average number of units is calculated from the date of issue.
6. Cash and cash equivalents
2015 $’m
2014 $’m
Operating accounts 6.5 12.0
6.5 12.0
(a) Operating accountsAll of the cash and cash equivalents is held in operating accounts earning market rates of interest.
For
per
sona
l use
onl
y

46 Charter Hall Retail REIT
7. Receivables
2015$’m
2014$’m
Rent receivable 2.6 3.3 Provision for doubtful debts (0.7) (0.5)
1.9 2.8 Turnover rent receivable 4.2 5.4 Outgoings receivable 2.4 3.7 GST receivable – 0.8 Distributions receivable 0.6 1.3 Sundry debtors 0.1 0.9
9.2 14.9
The REIT’s receivables are carried at amounts that approximate their fair value.
8. Derivative financial instruments
2015 $’m
2014 $’m
Assets
CurrentInterest rate swaps 1.0 –
1.0 –
non-current
Interest rate swaps – 1.9
– 1.9
Liabilities
CurrentInterest rate swaps 1.0 –
1.0 –
non-current
Interest rate swaps 15.6 4.4 Cross currency swaps 16.0 –
31.6 4.4
Interest rate swapsThe REIT has entered into interest rate swap agreements totalling $825.0 million (2014: $925.0 million) that entitle it to receive interest, at quarterly intervals, at a floating rate on a notional principal amount and oblige it to pay interest at a fixed rate on the same amount.
At 30 June 2015, the fixed rate varies from 2.59% to 3.75% per annum (2014: 2.64% to 3.75% per annum).
As at balance date the notional principal amounts and periods of expiry of the interest rate swap contracts which are linked to floating rates are as follows:
2015 $’m
2014 $’m
Swaps – REIT pays fixed rate and receives floating rate1 year or less 275.0 200.0 1 – 2 years – 375.0 2 – 3 years 100.0 – 3 – 4 years 100.0 275.0 4 – 5 years 350.0 75.0
net position – REIT pays fixed rate and receives floating rate 825.0 925.0
The REIT is also a party to an interest rate swap agreement totalling $40.0 million (2014: $40.0 million) that entitle it to receive interest, at quarterly intervals, at a fixed rate on a notional principal amount.
Notes to the consolidated financial statements
For
per
sona
l use
onl
y

Annual Report 2015 47
Cross currency swapsIn April 2015, the REIT entered into A$/US$ cross currency swap agreements that entitle it to receive interest, at semi-annual intervals, at a fixed rate on a notional principal amount of US$200.0 million and oblige it to pay, at quarterly intervals, at a floating rate on a notional principal amount of A$251.6 million. The swap matures in July 2027 and allows the REIT to hedge its US dollar borrowings into an Australian dollar interest rate.
These cross currency swaps hedge the REIT’s exposure to foreign currency and interest rate fluctuations arising from a US Private Placement (USPP) note issuance, funded in July 2015 (Refer to Note 26).
9. Other assets
2015 $’m
2014 $’m
CurrentPrepayments 1.3 1.3 Property acquisition costs and deposits – 0.2
1.3 1.5
10. Assets and liabilities classified as held for sale and discontinued operations(a) Details of discontinued operationsIn August 2014, the REIT sold a 94.9% interest in the net equity of its German operations for a gross sale price of €1 ($1). The remaining 5.1% interest is subject to a put and call arrangement and is expected to settle in February 2016.
In addition, in August 2014, the REIT sold its remaining 50% interest in two New Zealand assets for NZ$8.2 million ($7.3 million), completing the sell down of its offshore exposure.
(b) Details of assets and liabilities classified as held for sale and discontinued operationsThe table below sets out assets and liabilities that continue to be owned by the REIT as at balance date. These assets and liabilities are presented as aggregate amounts in the balance sheet.
2015 $’m
2014 $’m
Assets classified as held for saleCash and cash equivalents – 2.4 Receivables – 0.2 Investment properties – 129.4
Total assets classified as held for sale – 132.0
Liabilities classified as held for salePayables – 2.0 Borrowings – 117.1 Derivative financial instruments – 0.2 Other liabilities – 1.4
Total liabilities directly associated with assets classified as held for sale – 120.7
For
per
sona
l use
onl
y

48 Charter Hall Retail REIT
10. Assets and liabilities classified as held for sale and discontinued operations continuedc) Details of financial performance and cash flow information relating to discontinued operationsThe table below sets out the financial performance and cash flow information for the discontinued operations and shows the relevant financial performance and cash flow information up to the date of disposal.
Note 2015 $’m
2014 $’m
Net property income – 17.4 Other income – 0.3 Valuation losses on investment properties – (22.9)Net loss from derivative financial instruments – 2.9 Net realised losses from derivative financial instruments – (2.7)Management fees – (0.6)Finance costs – (7.2)Transfer from reserves of cumulative FX losses on disposal of assets held for sale 18 (9.2) (30.6)Other expenses – (0.7)
Loss before income tax (9.2) (44.1)
Current and withholding tax expense – (0.1)Deferred tax expense – (0.2)
Loss after income tax (9.2) (44.4)
Loss on sale of investment properties (0.6) (3.8)
Loss from discontinued operations (9.8) (48.2)
Net cash inflow from operating activities – 4.3
Net cash outflow from investing activities – (17.4)
Net decrease in cash generated by discontinued operations excluding sale proceeds – (13.1)
(d) Details of disposals As part of the REIT’s strategy to exit non-core assets, the REIT disposed of the following assets during the year:
Date of disposal Principal activity
Ownership interest
disposed
Total consideration
$’m
Australian portfolioGlen Innes, NSW (Freestanding supermarket) 31 Jul 2014 Investment property 100.0% 3.6 Olive Tree, Vic (Neighbourhood shopping centre) 2 Feb 2015 Investment property 100.0% 2.6 Bathurst, NSW (Neighbourhood shopping centre) 29 May 2015 Investment property 100.0% 15.5 Narromine, NSW (Neighbourhood shopping centre) 29 May 2015 Investment property 100.0% 3.4 Wellington, NSW (Freestanding supermarket) 29 May 2015 Investment property 100.0% 2.7
Equity interest in german portfolio 8 Aug 2014 Investment property 94.9% –
Residual nZ portfolio (Kaipoi, Beckenham) 27 Aug 2014 Investment property 50.0% 7.3
35.1
(e) net loss on disposals in discontinued operations and the general course of business
Discontinued operations
$’m
Assets held for sale
$’m 2015 $’m
2014 $’m
Details of disposals during the year:Sale price 7.3 27.8 35.1 302.7 Selling costs (0.2) (0.9) (1.1) (7.2)Carrying amount of net assets sold (7.7) (27.8) (35.5) (299.5)
Loss on sale before income tax (0.6) (0.9) (1.5) (4.0)Income tax expense – – – –
Loss on sale after income tax (0.6) (0.9) (1.5) (4.0)
Notes to the consolidated financial statements
For
per
sona
l use
onl
y

Annual Report 2015 49
11. Investment properties
2015 $’m
2014 $’m
non-currentFreestanding supermarkets 201.9 188.1 Neighbourhood shopping centres 962.1 868.0 Sub-regional shopping centres 773.5 716.8
1,937.5 1,772.9
Investment properties include a straightlining asset of $9.3 million (2014: $8.8 million) and unamortised lease incentives of $6.6 million (2014: $5.8 million).
A reconciliation of the carrying amount of investment properties at the beginning and end of the current and previous years is set out below:
Notes 2015 $’m
2014 $’m
Carrying amount at the beginning of the year 1,772.9 1,588.5 Additions 118.4 278.7 Acquisition costs incurred 4.4 13.9 Revaluation decrement attributable to acquisition costs 3(a) (4.4) (13.9)Revaluation increment 3(a) 70.1 44.6 Revaluation adjustments 3(a) 1.1 0.6 Straightlining of rental income 0.7 1.3 Amortisation of lease incentives (2.5) (2.1)Capitalised leasing fees (net of amortisation) 0.7 0.2 Foreign exchange rate differences on translation – 11.0 Reclassification of investment properties as held for sale (23.9) (149.9)
Carrying amount at the end of the year 1,937.5 1,772.9
At each balance date, the Directors update their assessment of the fair value of each property, taking into account the most recent independent valuations. The REIT determines a property’s value within a range of reasonable fair value estimates.
Key valuation assumptions used in the determination of the investment properties’ fair value and the REIT’s valuation policy are disclosed in Note 23.
Leasing arrangementsThe investment properties are leased to tenants under long term operating leases with rentals payable monthly. Minimum lease payments receivable on leases of investment properties are as follows:
2015 $’m
2014 $’m
Minimum lease payments under non-cancellable operating leases of investment properties not recognised in the financial statements are receivable as follows:Within 1 year 148.0 148.4 Later than 1 year but not later than 5 years 441.1 456.3 Later than 5 years 447.5 463.5
1,036.6 1,068.2
For
per
sona
l use
onl
y

50 Charter Hall Retail REIT
12. Investment in joint venture entityDuring the year, the REIT had an investment in one Australian joint venture entity. The REIT exercises joint control over the joint venture entity, but neither the REIT nor its joint venture partner have control in their own right, irrespective of their ownership interest. During the year, this investment has been accounted for in the consolidated annual financial statements using the equity method of accounting (refer to Note 1(b)).
Information relating to the joint venture entity is detailed below:
Joint venture entityCountry of establishment Principal activity
Ownership interest
2015%
2014%
Charter Hall Retail Partnership No.1 Trust Australia Property investment 50% 50%
(a) gross equity accounted value of investment in joint venture entity
Notes 2015 $’m
2014 $’m
Balance at the beginning of the year 129.8 114.6 Share of profits before property valuation gains 12(b) 10.2 10.8 Share of property valuation gains 12(b) 15.4 13.3 Distributions paid and payable (11.0) (13.6)Distributions reinvested 3.8 4.7
Balance at the end of the year 148.2 129.8
(b) Share of results attributable to joint venture entity
100% interest 50% interest
2015 $’m
2014 $’m
2015 $’m
2014 $’m
Income Property rental income 45.8 45.2 22.9 22.6 Property expenses (15.6) (14.8) (7.8) (7.4)
Net property income 30.2 30.4 15.1 15.2
ExpensesFinance costs (8.4) (9.4) (4.2) (4.7)Loss on disposal of investment property (0.2) - (0.1) - Net unrealised (loss)/gain on derivative financial instruments (1.0) 0.8 (0.5) 0.4 Other expenses (0.2) (0.2) (0.1) (0.1)
Total expenses (9.8) (8.8) (4.9) (4.4)
Profits before property valuation gains 20.4 21.6 10.2 10.8
Property valuation gainsRevaluation increment on investment properties 31.0 27.4 15.5 13.7 Revaluation adjustments* (0.2) (0.8) (0.1) (0.4)
Property valuation gains 30.8 26.6 15.4 13.3
Profits and valuation gains of investment in joint venture entity 51.2 48.2 25.6 24.1
Other comprehensive income – – – –
Total comprehensive income 51.2 48.2 25.6 24.1
* Adjustments relating to straightlining of rental income, amortisation of lease incentives and capitalisation of lease fees.
Notes to the consolidated financial statements
For
per
sona
l use
onl
y

Annual Report 2015 51
(c) Share of joint venture entity’s assets and liabilities
100% interest 50% interest
2015 $’m
2014 $’m
2015 $’m
2014 $’m
Current assetsCash and cash equivalents 2.2 3.4 1.1 1.7 Receivables 1.8 2.2 0.9 1.1 Other assets 0.6 0.6 0.3 0.3
4.6 6.2 2.3 3.1
non-current assetsInvestment properties 450.4 425.4 225.2 212.7
Total assets 455.0 431.6 227.5 215.8
Current liabilitiesPayables 4.4 6.8 2.2 3.4
4.4 6.8 2.2 3.4
non-current liabilitiesBorrowings 148.8 160.8 74.4 80.4 Derivative financial instruments 5.4 4.4 2.7 2.2
Total liabilities 158.6 172.0 79.3 86.0
net assets 296.4 259.6 148.2 129.8
Borrowings reflect a bank loan secured by registered mortgages over nine Australian properties owned in a joint venture entity. The carrying value of the REIT’s share of the properties pledged as security is $221.4 million (2014: $212.7 million) against the REIT’s share of the drawn balance of $74.9 million (2014: $81.0 million). The facility matures in July 2017.
The bank loan is repayable immediately if the joint venture entity defaults on payments of interest or principal, its total bank secured loan amount exceeds 55% of the carrying value of its total security pool assets or its security pool financial charges ratio falls below 2.00:1.
The joint venture entity has no contractual commitments as at 30 June 2015 (2014: $0.2 million).
13. Payables
2015 $’m
2014 $’m
CurrentIncome received in advance 4.1 7.4 Accrued property expenses 9.7 6.6 Accrued capital expenses 3.7 2.8 Management fees 2.3 2.4 Interest payable on interest bearing liabilities 0.4 0.6 Trade and sundry creditors 0.7 0.8 Custodian fees 0.1 0.1 GST payable 0.5 –
21.5 20.7
For
per
sona
l use
onl
y

52 Charter Hall Retail REIT
14. Distribution payable
Notes 2015 $’m
2014 $’m
Distributions to ordinary unitholdersOpening balance 50.4 45.6 Distributions declared 19 102.9 99.9 Paid during the year (75.2) (65.1)Distributions reinvested 17 (26.3) (30.0)
Closing balance 51.8 50.4
15. Borrowings
2015 $’m
2014 $’m
CurrentCommercial mortgage backed securities (CMBS) 231.5 – Movement in fair value of US PP commitment attributable to the hedged position (16.0) –
215.5 –
non-currentBank loan – term debt 432.9 367.5 Commercial mortgage backed securities (CMBS) – 250.0 Less: Unamortised transaction costs (0.7) (4.1)
432.2 613.4
Credit facilitiesAt 30 June 2015 and 2014, the REIT had access to: Bank loan facility Bank debt facility 535.0 475.0 CMBS notes 231.5 250.0
766.5 725.0
Amount of facilities used: Drawdown at year end – bank loan 432.9 367.5 Drawdown at year end – CMBS debt 231.5 250.0
664.4 617.5
Amount of facilities unused 102.1 107.5
Commercial mortgage backed securitiesThe CMBS are secured by registered mortgages over 38 Australian properties. The carrying amount of properties pledged as security as at 30 June 2015 amounts to $874.4 million (2014: $835.4 million). The interest rate under this facility is variable and reset periodically, usually after a period of 90 days. The CMBS matures in September 2015 and its repayment will be funded from the proceeds of the USPP issuance (refer to Note 26).
Movement in fair value of uS PP commitment attributable to the hedged positionThis adjustment reflects movement in the fair value of an unrecognised firm commitment to issue US PP notes which offsets the change in the fair value of cross currency swaps designated as a fair value hedge.
Bank loansThe bank debt facility is secured by registered mortgages over all wholly owned properties of the REIT, except those specifically pooled as security for the REIT’s CMBS debt. The carrying value of the properties pledged as security amounts to $1,063.1 million (2014: $941.1 million). During the year, the REIT extended the term of syndicated debt facility from August 2018 to August 2019. In addition, the facility limit was increased to $535.0 million (2014: $475.0 million).
The bank debt facility is repayable immediately if the REIT defaults on payments of interest or principal, its total bank secured loan amount exceeds 60% of the carrying value of its total security pool assets or its security pool financial charges ratio falls below 1.85:1. This facility was discharged and replaced with a new revolving bank debt facility post balance date, refer Note 26.
Interest rates on the bank loans are variable and are reset periodically, usually after a period of 90 days. As at 30 June 2015, the interest rate on the bank loan is 2.86% per annum (2014: 3.46% to 3.52% per annum).
Notes to the consolidated financial statements
For
per
sona
l use
onl
y

Annual Report 2015 53
Debt restructureIn April 2015, the REIT completed several key initiatives to restructure its debt funding platform:
• US$200 million (A$252 million) US Private Placement (USPP) issuance:
– 12 year duration
– funding to occur on 22 July 2015
– fixed US$ coupon of 3.55% which is 100% hedged in Australian dollars (principal and interest) and represents a margin of 194 basis points over BBSW
• Restructured syndicated bank debt facility with agreed terms for tranches of 18 months ($150 million), three years ($150 million) and five years ($285 million) for a total facility limit of $585 million, from a previous limit of $535 million.
Proceeds from the USPP issuance will be used to repay the existing CMBS facility which matures in September 2015 and is reflected as a current liability in this annual financial report.
On 22 July, the REIT moved to a partially unsecured debt structure with a financial covenant package including a look-through gearing covenant of 50% and interest cover ratio of 2.0 times. Moody’s has assigned a definite issuer credit rating of Baa1. On 28 September 2015, on the repayment of the CMBS, the REIT will move to a fully unsecured debt platform, excluding joint venture entities.
16. Other liabilities
2015 $’m
2014 $’m
Rental deposits 0.4 0.3
17. Contributed equity
no. of units DetailsDate of incomeentitlement
2015 $’m
2014 $’m
337,582,974 Units on issue 30 June 2013 2,010.5 4,260,906 DRP issue 1 July 2013 15.9
21,052,632 Placement issue 1 July 2013 78.6 2,186,273 Placement issue 1 January 2014 7.9 3,957,965 DRP issue 1 January 2014 14.1
369,040,750 Units on issue 30 June 2014 2,127.0 2,127.0 3,852,403 DRP issue 1 July 2014 15.0 2,661,221 DRP issue 1 January 2015 11.3
375,554,374 Units on issue 30 June 2015 2,153.3 2,127.0
As stipulated in the REIT’s constitution, each unit represents a right to an individual share in the REIT and does not extend to a right to the underlying assets of the REIT. There are no separate classes of units and each unit has the same rights attaching to it as all other units in the REIT.
Each unit confers the right to vote at meetings of unitholders, subject to any voting restrictions imposed on a unitholder under the Corporations Act 2001 and the Australian Securities Exchange Listing Rules.
Distribution reinvestment planThe REIT has established a Distribution Reinvestment Plan (DRP) under which unitholders may elect to have all or part of their distribution entitlements satisfied by the issue of new units rather than being paid in cash. This plan was in operation for the year ended 30 June 2015. The DRP issue price is determined at a discount of 1.0% to the daily average of the volume weighted average market price of units traded on the ASX during the 15 business days commencing on the third business day following the distribution record date.
For
per
sona
l use
onl
y

54 Charter Hall Retail REIT
18. Reserves
Note 2015 $’m
2014 $’m
Foreign currency translation reserveOpening balance (8.8) (41.0)Translation of foreign operations and foreign denominated borrowings (0.4) 1.6 Transfer to profit of cumulative FX losses on disposal of assets held for sale 10(c) 9.2 30.6
Closing balance – (8.8)
Cash flow hedge reserveOpening balance – – Changes in the fair value of cash flow hedges (0.1) –
Closing balance (0.1) –
(0.1) (8.8)
Foreign currency translation reserveForeign exchange differences arising on translation of the investments in foreign controlled entities and foreign joint venture entities are taken directly to the foreign currency translation reserve.
On repatriation of capital from the sale of the interest in the remaining foreign controlled entities, the cumulative foreign exchange losses relating to these investments were transferred to the consolidated statement of comprehensive income in accordance with the requirements of AASB 121 The Effect of Changes in Foreign Exchange Rates.
Cash flow hedge reserveThis reserve records the portion of the gain or loss on a hedging instrument in a cash flow hedge that is determined to be an effective hedge relationship.
19. Accumulated losses
Notes 2015 $’m
2014 $’m
Opening balance (863.1) (848.4)Profit after tax 162.5 85.2 Distributions paid and payable 14 (102.9) (99.9)
Closing balance (803.5) (863.1)
20. net tangible assets
2015 $’m
2014 $’m
Total assets 2,103.7 2,065.0 Less: Total liabilities (754.0) (809.9)
Net tangible assets attributable to the REIT 1,349.7 1,255.1
Total number of units on issue 375,554,374 369,040,750
Net tangible asset backing per unit $3.59 $3.40
Notes to the consolidated financial statements
For
per
sona
l use
onl
y

Annual Report 2015 55
21. Cash flow information(a) Reconciliation of profit after tax to net cash flows from operating activities
Notes 2015 $’m
2014 $’m
Profit after tax 162.5 85.2 Non-cash items
Straightlining of rental income (0.7) (1.5)Amortisation of lease incentives 2.9 2.2 Property valuation (gains)/losses Discontinued operations 10(c) – 22.9 Wholly owned entities 3(a) (66.8) (31.3) Joint venture entities 3(a) (15.4) (13.3)Loss on sale of investment properties 10(e),12(b) 1.6 4.0 Unrealised net gain on derivative financial instruments* 3(b),12(b) 13.4 6.4 Deferred tax expense – 0.2 Write off of capitalised borrowing cost related to extinguished debt facilities 4.1 –Transfer from reserves of cumulative FX losses on disposal of assets held for sale 18 9.2 30.6 Change in assets and liabilities
(Increase)/decrease in assets Receivables 5.7 (2.0) Prepayments – 1.3 Net income receivable from investment in joint venture entities (3.2) (2.8)Decrease in liabilities Payables (0.1) (11.3)
Net cash flows from operating activities 113.2 90.6
* Includes unrealised losses on derivative financial instruments in joint venture entities.
(b) non-cash financing and investing activitiesThe following non-cash financing activities are not reflected in the statement of cash flows:
Note 2015 $’m
2014 $’m
Distributions by the REIT during the year satisfied by the issue of units under the DRP 14 26.3 30.0
For
per
sona
l use
onl
y

56 Charter Hall Retail REIT
22. Capital and financial risk management(a) Capital risk managementThe key objective of the REIT’s capital risk management is to optimise capital through the mix of available capital sources whilst complying with statutory and constitutional capital and distribution requirements, maintaining gearing, interest cover ratios and other covenants within approved limits and continuing to operate as a going concern.
The REIT assesses its capital management approach as a key part of its overall strategy and this is regularly reviewed by management and the Board.
The REIT is able to alter its capital mix by issuing new units, activating the DRP, electing to have the DRP underwritten, adjusting the amount of distributions paid, activating a unit buyback program or selling assets to reduce borrowings.
The REIT has a target look-through gearing of 30% to 40% of debt to total assets.
Protection of the REIT’s assets or liabilities in foreign denominated assets is achieved through the use of cross currency swaps. The REIT’s policy is to hedge 100% of the gross asset or liability value by foreign currency.
The REIT also protects its assets by taking out insurance with creditworthy insurers.
(b) Financial risk managementThe REIT’s principal financial instruments comprise cash and cash equivalents, receivables, payables, interest bearing liabilities and derivative financial instruments.
The REIT’s activities expose it to a variety of financial risks: market risk (foreign exchange and interest rate risk), liquidity risk and credit risk.
The REIT manages its exposure to these financial risks in accordance with the REIT’s Financial Risk Management (FRM) policy as approved by the Board. The policy sets out the REIT’s approach to managing financial risks, the policies and controls utilised to minimise the potential impact of these risks on its performance and the roles and responsibilities of those involved in the management of these financial risks.
The REIT uses various measures to monitor exposures to these types of risks. The main methods include foreign exchange and interest rate sensitivity analysis, ageing analysis and counterparty credit assessment, and the use of future rolling cash flow forecasts.
The REIT uses derivative financial instruments such as interest rate swaps and cross currency swaps to manage its financial risk as permitted under the FRM policy. Such instruments are used exclusively for hedging purposes and not for trading or speculative purposes.
(i) Market risk
Foreign exchange riskForeign exchange risk is the risk that changes in foreign exchange rates will change the Australian dollar value of the REIT’s foreign denominated net assets or earnings. Foreign exchange risk arises when future commercial transactions and recognised assets and liabilities are denominated in a currency that is not the REIT’s functional currency.
Foreign incomeIn the prior years, the REIT was earning foreign denominated income from its investments in overseas assets. Net property income derived is naturally offset by local denominated expenses including interest and tax. Foreign exchange risk associated with the foreign income was hedged using forward foreign exchange contracts to convert net foreign denominated currency exposure back to Australian dollars at pre-determined exchange rates.
Foreign investmentsFollowing completion of the disposal program in the US, Poland and Germany, the REIT has minimal residual interest (less than 0.1% of total assets) in its remaining offshore structures.
As at the balance sheet date, the REIT is exposed to foreign exchange risk through commitments under its US Private Placement issuance. The risk was hedged using cross currency swaps to convert US dollar exposure into Australian dollars. The REIT has no other significant exposures to foreign exchange rates.
A movement in foreign currency exchange rates applied to the net exposures in foreign currencies may result in a change to the net assets of the REIT.
Notes to the consolidated financial statements
For
per
sona
l use
onl
y

Annual Report 2015 57
Interest rate risk The REIT has exposures to interest rate risk on its monetary assets and liabilities, which are mitigated by the use of interest rate swaps, as shown in the table below.
Australian dollars uS dollars1 Euros1 nZ dollars1 Total
2015 $’m
2014 $’m
2015 $’m
2014 $’m
2015 $’m
2014 $’m
2015 $’m
2014 $’m
2015 $’m
2014 $’m
Fixed rateBorrowings2 – – – – – – – – – –
net fixed rate exposure – – – – – – – – – –
Floating rateCash 5.9 11.2 – 0.1 0.6 0.7 – – 6.5 12.0 Cash – discontinued operations – – – – – 2.3 – 0.1 – 2.4 Cash – joint venture entities3 1.1 1.7 – – – – – – 1.1 1.7 Borrowings2 (664.4) (617.5) – – – (117.4) – – (664.4) (734.9)Borrowings – joint venture entities3 (74.9) (81.0) – – – – – – (74.9) (81.0)
(732.3) (685.6) – 0.1 0.6 (114.4) – 0.1 (731.7) (799.8)
Derivative financial instrumentsInterest rate swaps – floating to fixed4 630.0 490.0 – – – 48.7 – – 630.0 538.7
630.0 490.0 – – – 48.7 – – 630.0 538.7
net floating rate exposure (102.3) (195.6) – 0.1 0.6 (65.7) – 0.1 (101.7) (261.1)
1 Australian dollar equivalents of foreign denominated balances.
2 Unamortised borrowing costs are excluded as they are not impacted by interest rate risk.
3 The REIT’s share of financial assets and liabilities included within its net investment in joint venture entity.
4 The amounts represent the notional principal payable under the derivative contracts (excluding derivatives where cash flows have not commenced at balance sheet date).
At balance date, the REIT fixed 86.1% (2014: 67.4%) of its interest rate exposure.
Sensitivity analysisThe table below reflects the potential net increase/(decrease) in the profit and equity, resulting from changes in interest rates applicable at 30 June 2015, with all other variables remaining constant. The analysis was performed on the same basis for 30 June 2014.
2015 2014
Profit and loss
$’mReserves
$’m
Profit and loss
$’mReserves
$’m
Australian dollars + 1.00% (2014: + 1.00%) 10.1 – 5.1 –
– 1.00% (2014: – 1.00%) (10.9) – (5.1) –
A movement in interest rates applied to the net exposures in the table above would result in a change to the net assets of the REIT. This sensitivity has been used as it reflects management’s estimate of the reasonably possible movements in interest rates within the next 12 months, given recent trends.
The effect of changes in interest rates on the REIT’s profit and equity shown in the table above is mainly impacted by a change in interest payable on the REIT’s floating rate interest bearing liabilities, offset by changes in the fair value of derivative financial instruments hedging this exposure.
(ii) Liquidity riskLiquidity risk arises if the REIT has insufficient liquid assets to meet its obligations as they become due and payable. It is managed by maintaining sufficient cash balances and adequate committed credit facilities. Prudent liquidity management implies maintaining sufficient cash and marketable securities, the availability of funding through an adequate amount of committed credit facilities and the ability to close out market positions. The cash, debt and derivative instruments entered into by the REIT were selected to ensure sufficient funds would be available to meet the ongoing cash requirements of the REIT.
The following table provides the contractual maturity of the REIT’s fixed and floating rate financial liabilities and derivatives as at 30 June 2015. The amounts presented represent the future contractual undiscounted principal and interest cash inflows/(outflows) based on interest rates and foreign exchange rates prevailing at balance date and therefore do not equate to the value shown in the consolidated balance sheet. Repayments which are subject to notice are treated as if notice were given immediately.
For
per
sona
l use
onl
y

58 Charter Hall Retail REIT
22. Capital and financial risk management continued(b) Financial risk management continued(ii) Liquidity risk continued
Liquidity risk
Carrying value
$’m
Less than 1
year$’m
1 to 2 years
$’m
2 to 3 years
$’m
3 to 4 years
$’m
4 to 5 years
$’m
Over 5 years
$’m Total $’m
2015
Financial liabilitiesPayables (21.5) (21.5) – – – – – (21.5)Distribution payable (51.8) (51.8) – – – – – (51.8)Borrowings (663.7) 2.7 (172.9) (20.1) (165.4) (15.0) (460.1) (830.8)Derivative financial instruments Contractual amounts payable (32.6) (26.9) (28.4) (26.4) (23.5) (13.1) (325.2) (443.5) Contractual amounts receivable 1.0 21.5 21.1 19.4 17.3 10.9 326.7 416.9 Other liabilities (0.4) (0.4) – – – – – (0.4)
Total financial liabilities (769.0) (76.4) (180.2) (27.1) (171.6) (17.2) (458.6) (931.1)
2014
Financial liabilitiesPayables (20.7) (20.7) – – – – – (20.7)Distribution payable (50.4) (50.4) – – – – – (50.4)Borrowings* (734.9) (150.8) (273.1) (20.3) (97.6) (369.8) – (911.6)Derivative financial instruments Contractual amounts payable (4.4) (15.8) (12.2) (12.4) (5.0) (0.6) – (46.0) Contractual amounts receivable 1.9 15.0 10.9 9.3 3.6 0.4 – 39.2 Other liabilities (0.3) (0.3) – – – – – (0.3)
Total financial liabilities (808.8) (223.0) (274.4) (23.4) (99.0) (370.0) – (989.8)
* Includes interest bearing liabilities classified as liabilities directly associated with assets held for sale.
The amount of credit facilities unused by the REIT at 30 June 2015 is $102.1 million (2014: $107.5 million). Refer to Note 15.
Notes to the consolidated financial statements
For
per
sona
l use
onl
y

Annual Report 2015 59
(iii) Credit riskCredit risk is the risk that a contracting entity will not complete its obligations under a contract and will cause the REIT to make a financial loss. The REIT has exposure to credit risk on all of its financial assets included in the REIT’s consolidated balance sheet.
The REIT manages its risk on tenant receivables by performing credit reviews of prospective tenants, obtaining tenant collateral where appropriate and performing detailed reviews on any tenant arrears.
In respect of risk on financial instruments and derivatives, there is only a credit risk where the contracting entity is liable to pay the REIT in the event of a close out. The REIT has policies that limit the amount of credit exposure to any financial institution where practical and commercially appropriate. Derivative counterparties and cash transactions are limited to investment grade counterparties in accordance with the REIT’s FRM policy. The REIT monitors the public credit rating of its counterparties.
The REIT has policies to review the aggregate exposures of receivables and tenancies across its portfolio. As at 30 June 2015 the REIT has no significant concentrations of credit risk on its receivables other than exposure to the Woolworths and Wesfarmers businesses which contribute 51.8% (2014: 52.8%) of the total portfolio income including income generated by joint venture entities. The REIT holds collateral in the form of security deposits or bank guarantees over some receivables where appropriate.
The table below details the concentration of credit exposure of the REIT’s financial assets to significant geographical locations:
2015 $’m
2014 $’m
Australia
Cash and cash equivalents 6.1 11.3 Receivables 9.2 14.4 Derivative financial instruments 1.0 1.9
16.3 27.6
Offshore locations
Cash and cash equivalents 0.4 3.1
Receivables – 0.7
0.4 3.8
Total financial assets 16.7 31.4
Joint venture entitiesAustralia
Cash and cash equivalents 1.1 1.7 Receivables 0.9 1.1
2.0 2.8
Total financial assets including joint venture entities 18.7 34.2
Maximum exposure to credit risk before any credit enhancements at the end of each reporting period is the carrying amount of the financial assets reflected in the table above.
For
per
sona
l use
onl
y

60 Charter Hall Retail REIT
22. Capital and financial risk management continued(b) Financial risk management continued(iii) Credit risk continuedAll cash, derivative financial instruments and interest bearing assets are neither past due nor impaired. The table below shows the ageing analysis of those rent receivables of the REIT and its joint venture entities which are past due or impaired:
Past due but not impaired
Less than 30
days$’m
31 to 60 days$’m
61 to 90 days $’m
More than 90 days
$’mImpaired
$’m Total $’m
2015Rent receivables – Australia– Major tenants 0.1 0.1 0.1 0.5 – 0.8 – Specialty tenants 0.6 0.2 0.2 0.1 0.7 1.8
0.7 0.3 0.3 0.6 0.7 2.6 Rent receivables – joint venture entities 0.1 0.1 – – 0.1 0.3
0.8 0.4 0.3 0.6 0.8 2.9
2014
Rent receivables – Australia– Major tenants 0.7 0.1 0.2 – – 1.0 – Specialty tenants 0.8 0.7 0.3 – 0.5 2.3 Rent receivables – Germany 0.1 – – – 0.1 0.2
1.6 0.8 0.5 – 0.6 3.5 Rent receivables – joint venture entities 0.5 – – – – 0.5
2.1 0.8 0.5 – 0.6 4.0
Based on a review of rent receivables by management, a provision of $0.8 million (2014: $0.6 million) has been provided against rent receivables with a gross balance of $2.9 million (2014: $4.0 million).
The REIT holds $0.3 million (2014: $0.4 million) of collateral against the impaired rent receivables in the form of bank guarantees and security deposits and can also recover $0.1 million (2014: $0.1 million) GST from any uncollected rent. There are no significant financial assets that have had renegotiated terms that would otherwise have been past due or impaired.
(iv) Price riskThe REIT has no significant exposure to price risks as it does not hold any securities or commodities.
The REIT is exposed to price risk other than in respect of financial instruments, such as property price risk including property rentals risks. Refer to Note 23 for the sensitivity analysis.
(c) Offsetting financial assets and financial liabilitiesThe REIT is a party to the master agreement as published by International Swaps and Derivatives Associates, Inc. (ISDA) which allow the REIT’s counterparty, under certain conditions (i.e. event of default), to set off the position owing/receivable under a derivative contract to a net position outstanding. As the REIT does not have legally enforceable right to set off, none of the financial assets or financial liabilities are offset on the balance sheet of the REIT.
The table below demonstrates effect of offsetting positions should the REIT’s counterparties decide to enforce the legal right to set-off:
Consolidated entity
gross amounts of
financial instruments
$’m
Amounts subject to
set-off $’m
net amount post set-off
$’m
2015Derivative assets 1.0 (1.0) – Derivative liabilities (32.6) – (32.6)Borrowings (647.7) 1.0 (646.7)
(679.3) – (679.3)
2014
Derivative assets 1.9 (1.9) – Derivative liabilities (4.4) – (4.4)Borrowings (613.4) 1.9 (611.5)
(615.9) – (615.9)
Notes to the consolidated financial statements
For
per
sona
l use
onl
y

Annual Report 2015 61
23. Fair value measurement(a) Recognised fair value measurementsThe REIT measures and recognises derivative financial instruments (Refer to Note 8) at fair value on a recurring basis.
To provide an indication about the reliability of inputs used in determining fair value, the REIT classifies its financial instruments into three levels prescribed under the accounting standards. An explanation of each level is set out below:
(a) Level 1: Quoted prices (unadjusted) in active markets for identical assets or liabilities;
(b) Level 2: Inputs other than quoted prices included within level 1 that are observable for the asset or liability, either directly or indirectly; and
(c) Level 3: Inputs for the asset or liability that are not based on observable market data (unobservable inputs).
Financial assets and liabilities not carried at fair value have carrying values that reasonably approximate their fair values and are categorised within the fair value hierarchy as follows:
• Cash and cash equivalents – Level 1; and• All other financial assets and liabilities – Level 2.
The following table presents the REIT’s assets and liabilities measured and recognised at fair value:
Level 2 Level 3 Total
Notes2015$’m
2014$’m
2015$’m
2014$’m
2015$’m
2014$’m
Financial assets – recurring fair value measurementDerivative assets
Interest rate swaps 8 1.0 1.9 – – 1.0 1.9non-financial assets – recurring fair value measurementInvestment properties 11 – – 1,937.5 1,772.9 1,937.5 1,772.9non-financial assets – non-recurring fair value measurementInvestment properties 10(b) – – – 129.4 – 129.4
Total assets 1.0 1.9 1,937.5 1,902.3 1,938.5 1,904.2
Financial liabilities – recurring fair value measurementDerivative liabilities
Interest rate swaps 8 (16.6) (4.4) – – (16.6) (4.4)Cross currency swaps 8 (16.0) – – – (16.0) –
Total liabilities (32.6) (4.4) – – (32.6) (4.4)
There were no transfers between levels of fair value measurement during the year and there were no other financial assets or liabilities that were measured and recognised at fair value and classified as Level 1 or Level 3.
The policy of the REIT is to recognise transfers into and transfers out of the fair value hierarchy levels as at the end of the reporting period.
The REIT did not measure any financial assets or financial liabilities at fair value on a non-recurring basis as at 30 June 2015.
For
per
sona
l use
onl
y

62 Charter Hall Retail REIT
23. Fair value measurement continued(b) Disclosed fair valuesThe fair value of derivative financial instruments is disclosed in the balance sheet. The carrying amounts of receivables and payables are assumed to approximate their fair value due to their short-term nature.
The following table represents the carrying amounts and fair value of borrowings at 30 June 2015 and 30 June 2014. Their fair value is estimated by comparing the margin on the facility to the pricing of a similar facility in the current market.
2015 2014
Carrying amount
$’mFair value
$’m
Carrying amount
$’mFair value
$’m
Bank loan – term debt 432.9 433.7 367.5 368.0
Commercial mortgage backed securities (CMBS) 231.5 231.8 250.0 251.8
664.4 665.5 617.5 619.8
Borrowings directly associated with assets held for saleBank loan – term debt – – 117.4 118.2
– – 117.4 118.2
664.4 665.5 734.9 738.0
(c) Valuation techniques used to derive level 2 fair valuesThe fair value of derivative financial instruments is estimated internally using generally acceptable valuation models based on discounted cash flow analysis using quoted market inputs (i.e., interest rates, forward rates, etc.), adjusted for specific features of the derivative and debit or credit valuation adjustments.
Credit value adjustments are calculated based on the counterparty’s credit risk using the counterparty’s credit default swap curve as a benchmark. Debit value adjustments are calculated based on the REIT’s credit risk using debt financing available to the REIT as a benchmark.
(d) Valuation techniques used to derive level 3 fair valuesIn determining fair value of investment properties, management has considered the nature, characteristics and risks of its investment properties as well as the level of fair value hierarchy:
Class of propertyFair value hierarchy
Fair value as at30 June 2015$’m
Valuation technique
Significant unobservable inputs used to measure fair value
Range of unobservable
inputs
Recurring fair value adjustments
– Australia Level 3 1,937.5 DCF and income capitalisation method Gross market rent ($ p.a./sq.m.) $121 – $637
Adopted capitalisation rate 6.00 – 8.25%Adopted terminal yield 6.25 – 8.75%
Adopted discount rate 7.00 – 9.50%
Notes to the consolidated financial statements
For
per
sona
l use
onl
y

Annual Report 2015 63
Term Definition
Discounted Cash Flow (DCF) method
A method in which a discount rate is applied to future expected income streams to estimate the present value.
Income capitalisation method A valuation approach that provides an indication of value by converting future cash flows to a single current capital value.
Gross market rent The estimated amount for which an interest in real property should be leased on the valuation date between a willing lessor and a willing lessee on appropriate lease terms in an arm’s length transaction, after proper marketing and where the parties had each acted knowledgeably, prudently and without compulsion.
Capitalisation rate The return represented by the income produced by an investment, expressed as a percentage.Terminal yield A percentage return applied to the expected net income following a hypothetical sale at the end of the
cash flow period.
Discount rate A rate of return used to convert a future monetary sum or cash flow into present value.
In determining the valuation of all investment properties measured at recurring fair value, consideration has been given to the highest and best use of those properties.
Valuation processThe Board conducts an investment property valuation process on a semi-annual basis. All valuations are performed either by independent professionally qualified external valuers or by Charter Hall’s internal valuers who hold recognised relevant professional qualifications.
Stable propertiesIf the external valuation is more than 12 months old then the property is externally valued. For those with an external valuation less than 12 months old an assessment is made as to which properties are likely to have had material movements in the book value reported at the last reporting period to determine whether they should be revalued externally or whether an internal valuation is applicable. To make this assessment, the following steps are performed for each property:
1. perform initial desktop assessment of current value through a capitalisation of income and direct comparison approach by obtaining an estimate of the current capitalisation and rates per square metre, by reference to comparable sales evidence, and the net property income;
2. undertake discussions with external valuers and market participants to gauge the current market situation in more detail, specifically seeking “house” views on capitalisation/discount and terminal capitalisation rate movements along with rental growth forecasts, in order to reach an initial opinion of value;
3. compare the initial assessment of current value to the most recent book value and determine the percentage movement; and
4. if the property has been acquired in the last six months, the valuation on acquisition may still be valid but is reviewed against comparable sales/market data.
If the prior external valuation is under 12 months old and the change between the initial assessment and current book value is:
Change between initial assessment and current book value Outcome
Less than 5% The valuation will consist of the initial assessment which will be further documented for review purposes. This will include: • internal valuation model; or • external short form report.
5 to 10% The initial assessment will be supplemented by further internal or external analysis, which will be documented for review purposes, to determine the value. This will include: • full formal report (where externally valued over 12 months prior); or • external short form report (if valued less than 12 months prior); or • internal capitalisation rate & direct comparison.
More than 10% Recommend that further analysis be undertaken externally to determine the value. This will include: • External full formal report; or • External update report, if it is a revaluation exercise by the same valuation company as last full
formal report.For
per
sona
l use
onl
y

64 Charter Hall Retail REIT
23. Fair value measurement continued(d) Valuation techniques used to derive level 3 fair values continued
Valuation process continued
Development propertiesThe total cost of a development property is generally capitalised to its carrying value until development is complete. At the commencement of a development project, an estimated valuation on completion is obtained and the capitalised costs during the project are monitored against this initial valuation.
On completion, the property is externally valued with a full formal report and thereafter the stabilised asset valuation process applies.
At each reporting date, the carrying values of development properties are reviewed to determine whether they are in excess of their fair value. Where appropriate, a write-down is made to reflect fair value.
Sensitivity analysis
Significant inputFair value measurement sensitivity to significant increase in input
Fair value measurement sensitivity to significant decrease in input
Gross market rent ($ p.a./sqm) Increase DecreaseAdopted capitalisation rate (%, p.a.) Decrease IncreaseAdopted terminal yield (%, p.a.) Decrease Increase
Adopted discount rate (%, p.a.) Decrease Increase
24. Related party information(a) Responsible EntityThe Responsible Entity of the REIT is Charter Hall Retail Management Limited, a wholly owned controlled entity of Charter Hall. The registered office of the Responsible Entity is Level 20, No.1 Martin Place, Sydney NSW 2000.
(b) DirectorsThe following persons were Directors of the Responsible Entity during the year:
• John Harkness – Chairman and Non-Executive Director• David Harrison – Executive Director and Joint-Managing Director of Charter Hall Group• Maurice Koop – Non-Executive Director and Chairman of Audit, Risk and Compliance Committee• Alan Rattray-Wood – Non-Executive Director• David Southon – Executive Director and Joint-Managing Director of Charter Hall Group• Scott Dundas – Alternate for David Southon and David Harrison
No payments were made by the REIT or by the Responsible Entity on behalf of the REIT to the Executive Directors during the year.
Audit, Risk and Compliance Committee fees and Directors’ fees totalling $324,492 (2014: $324,492) were paid or payable by the REIT to the Independent Directors, being John Harkness, Maurice Koop and Alan Rattray-Wood, for the year, refer to Note 24(h) for detailed breakdown of these payments. These amounts are reviewed from time to time in consultation with external experts to ensure that remuneration reflects the services expected to be performed.
(c) Parent entityThe parent entity of the consolidated entity is Charter Hall Retail REIT. Refer to Note 28 for parent entity financial information.
(d) Management feesUnder the terms of the REIT constitution, the Responsible Entity is entitled to receive the following remuneration from the REIT, comprising a base fee and a performance fee:
Base feeThe base fee is calculated as:
(i) 0.45% per annum of the value of the total assets of the REIT up to $700 million; plus(ii) 0.40% per annum of the value of the total assets of the REIT over $700 million.
Total assets are adjusted in the fee calculation to add back total liabilities held by joint venture entities to the investment in joint venture entities.
The base fee is calculated six monthly and is paid quarterly in arrears with the first quarterly payment being a part payment on account for the half year.
Notes to the consolidated financial statements
For
per
sona
l use
onl
y

Annual Report 2015 65
Performance feeIn addition to the base management fees, the Responsible Entity is entitled to a performance fee satisfied by the issue of units in the REIT to the Responsible Entity, dependent upon the relative performance of the REIT to the Retail Property Trust Accumulation Index (Index). This Index, calculated from a peer group of property securities that have a principal focus on the retail sector, measures the income and capital growth of the unit prices of the representative trusts.
If the REIT’s performance on a semiannual is higher than the percentage increase in the Index, then the Responsible Entity is entitled to new units in the REIT with a total value equal to:
(i) 5% of the total Increased Unitholder Value from outperformance; plus(ii) 15% of the Increased Unitholder Value above 2% nominal outperformance per annum (1% per half year).
The Increased Unitholder Value is measured as the market capitalisation of the REIT at the commencement of the relevant year, multiplied by the nominal percentage outperformance of the REIT relative to the Index for that year.
The performance fee is calculated and payable, if entitled, each half year at December and June. The performance fee is payable, if entitled, subject to an annual cap, whereby total management fees paid in any one year must not exceed 80 basis points of the value of the gross assets of the REIT (except where the REIT has outperformed its sector peers continuously over a three year period). Any unpaid fees will continue to be paid up to 80 basis points of the value of the assets in any future year.
The total management fees for the year are detailed as follows:
2015 $’000
2014 $’000
Base fees 9,095 8,672 Performance fees – –
9,095 8,672
No performance fee was earned by the Responsible Entity during the year. In the calculation of the performance fee, outperformance will be assessed on a cumulative basis and accordingly, underperformance for the period from 1 January 2004 to 30 June 2015 will need to be recovered before the Responsible Entity is entitled to any future performance fees. For the period from 1 January 2004 to 30 June 2015, the Index increased in value by 140.1% compared to the REIT’s cumulative performance which increased by 51.4% (difference of 88.7%).
For
per
sona
l use
onl
y

66 Charter Hall Retail REIT
24. Related party information continued(e) Transactions with the Responsible Entity and its related partiesThe Responsible Entity and its related parties held 40,298,579 units as at 30 June 2015 (2014: 37,708,510).
Following is a summary of related party transactions, excluding base management fees, for the year ended 30 June 2015:
Basis of fee calculation Fee amount
Type of fee Method of fee calculation2015 $’m
2014 $’m
2015$
2014 $
Property management 3% of total property income 224.1 203.9 6,723,832 6,118,200
Acquisition0.75% of sale price less amounts paid to external agents 95.8 166.9 718,125 1,251,713
Disposal0.75% of sale price less amounts paid to external agents 10.9 309.6 81,851 386,804
Due diligence 0.25% of sale price 140.6 476.5 351,535 1,191,297
Development management3% of development cost if > $1m5% of development cost if < $1m 43.8 47.2 1,313,450 1,415,263
Development management cost recovery Cost recovery 825,926 688,184
Project management 6% of project cost 17.9 7.2 1,073,590 429,960
Majors and specialty leasing – new leases
20.0% – 15.0% of year one gross rent 22.5 26.2 3,437,524 3,477,573
Specialty leasing – renewals 10.0% – 7.5% of year one gross rent 13.3 10.8 1,250,327 965,874
Tenancy co-ordination and lease administration, (number of tenants)
Range from $500 – $4,500 per tenancy 520 567 1,066,350 1,146,574
Accounting services Annual fee 1,093,750 1,049,167
Other Various 32,300 33,950
17,968,560 18,154,559
Payments excluding management fees to the related parties for the year are further detailed below:
2015 $
2014 $
Charter Hall Holdings Pty Limited 17,968,560 18,103,025 Charter Hall Asset Services Europe Sp. z o.o. (Poland) – 51,534
17,968,560 18,154,559
Charter Hall Holdings Pty Limited was also reimbursed $9,918,242 (2014: $9,746,572) for centre and property management expenses incurred. These expenses include salaries, finance and IT costs and other overhead charges, of which approximately 38% (2014: 36%) were recovered in outgoings from tenants.
The above fees and transactions were based on market rates and normal commercial terms and conditions and were approved by the Independent Directors.
(f) Outstanding payable balance with the Responsible Entity and its related parties
2015 $’m
2014 $’m
Charter Hall Retail Management Limited 2,297,083 2,411,531
Charter Hall Holdings Pty Limited 1,990,588 866,823
4,287,671 3,278,354
Notes to the consolidated financial statements
For
per
sona
l use
onl
y

Annual Report 2015 67
(g) Key management personnelKey management personnel (KMP) are defined in AASB 124 Related Party Disclosures as those having authority and responsibility for planning, directing and controlling the activities of the entity. The Responsible Entity meets the definition of KMP as it has this authority in relation to the activities of the REIT. These powers have not been delegated by the Responsible Entity to any other person. Accordingly, the Fund Manager of the REIT is not considered to be KMP of the REIT as he does not have sufficient individual authority and responsibility for planning, directing and controlling the activities of the REIT.
Details of management fees charged to the REIT by the Responsible Entity and its related parties are included in Note 24(d).
(h) Directors’ fees and Fund Manager remunerationIndependent Directors’ fees are as follows:
John Harkness
$
MauriceKoop
$
AlanRattray-Wood
$Total
$
2015
Director fee 74,420 49,614 49,614 173,648 Compliance fee 52,621 35,080 35,080 122,781 Audit committee fee 8,018 12,027 8,018 28,063
Total director fees 135,059 96,721 92,712 324,492
2014
Director fee 74,420 49,614 49,614 173,648 Compliance fee 52,621 35,080 35,080 122,781 Audit committee fee 8,018 12,027 8,018 28,063
Total director fees 135,059 96,721 92,712 324,492
The level of fees is not related to the performance of the REIT. The board of the Responsible Entity considers remuneration payable to its independent directors from time to time. Remuneration of independent directors is approved by the Board and any increases are benchmarked to market rates.
The executive directors of the Responsible Entity and Fund Manager of the REIT are employees of Charter Hall Holdings Pty Ltd and are remunerated by Charter Hall Holdings Pty Ltd.
Scott Dundas, Fund Manager of the REIT, received, on a cash basis, remuneration of $635,116 from 1 July 2014 to 30 June 2015 ($606,222 from 1 July 2013 to 30 June 2014). In addition, deferred rights to CQR units were granted to the Fund Manager to the value of $91,758 from 1 July 2014 to 30 June 2015 ($66,611 from 1 July 2013 to 30 June 2014) as part of his incentive program. Half of these units will vest one year after they have been granted with the remaining units vesting two years following their grant date.
(i) Directors’ interests in REIT unitsThe number of units held directly, indirectly or beneficially by the Directors of the Responsible Entity or the Directors’ related parties at 30 June is as follows:
units held 2015
Units held 2014
John Harkness – –
David Harrison – – Maurice Koop 48,404 48,404 Alan Rattray-Wood 10,867 10,867 David Southon – –
Scott Dundas (alternate) 35,923 23,775
For
per
sona
l use
onl
y

68 Charter Hall Retail REIT
24. Related party information continued(i) Directors’ interests in REIT units continuedThe aggregate number of units of the REIT acquired by the Directors of the Responsible Entity or their related parties during the year is set out below.
units 2015
Units 2014
Scott Dundas 12,148 1,673
No units of the REIT were sold by the Directors of the Responsible Entity or their related parties during the year.
No options in the REIT are held by Directors of the Responsible Entity.
25. Remuneration of the auditor
2015$’000
2014$’000
Amounts paid or payable to PricewaterhouseCoopers Australian firm for:
Audit services 396 388
396 388
Amounts paid or payable to related practices of PricewaterhouseCoopers Australian firm for:Audit services - 33Taxation compliance services 44 312
44 345
440 733
In addition to the above fees, PricewaterhouseCoopers was remunerated with $10,000 (2014: $9,700) in connection with the audit of the REIT’s joint venture entities. This amount represents the REIT’s share of the fees and is recorded within share of profits from investment in joint venture entities.
26. Commitments and contingent liabilitiesDebt restructureIn June 2015, the REIT committed to issue US$200 million ($252 million) of USPP notes under the following conditions:
• 12 year duration;
• Funding to occur on 22 July 2015; and
• Fixed US$ coupon of 3.55% which is 100% hedged in Australian dollars (principal and interest) and represent a margin of 194 basis points over BBSW.
In addition, the REIT secured a new bank debt facility to commence on funding of the USPP with the following terms:
• Three tranches of 18 months ($150 million), 3 years ($150 million) and 5 years ($285 million) with a total facility limit of $585 million;
• Mortgage on all wholly owned Australian properties of the REIT, except those specifically pooled as security for the REIT’s CMBS debt, has been discharged in July 2015; and
• Financial covenants that include requirement to maintain look through gearing of no more than 50% and an interest cover ratio of no less than 2.00 times.
Other commitmentsThe REIT has entered into contracts for the acquisition, construction and development of properties in Australia. The commitments of the REIT total $8.0 million (2014: $29.2 million). These commitments have not been reflected in the consolidated financial statements of the REIT.
Unless otherwise disclosed in the consolidated financial statements, there have been no material changes to the REIT’s commitments or contingent liabilities since the last consolidated financial statements.
Notes to the consolidated financial statements
For
per
sona
l use
onl
y

Annual Report 2015 69
27. Significant contract terms and conditionsPre-emptive rightsUnder the joint ownership arrangements in place with Telstra Superannuation Scheme, should CHRML cease to be the responsible entity of the REIT, the joint venture partner will have the right to acquire the REIT’s proportion of the respective portfolio at market value.
Financing documentsUnder loan documents in place with independent third party lenders, the lender may be entitled to call for early repayment of the facility or may place additional conditions upon the REIT if:
• CHRML ceases to be the responsible entity of the REIT;
• CHRML ceases to be under the Control of Charter Hall Limited (CHL) or a wholly-owned subsidiary of CHL;
• any one person (or persons acting together) acquires control of the REIT; or
• the units in the REIT cease to be listed on the Australian Securities Exchange.
28. Parent entity financial information(a) Summary financial informationThe individual financial statements for the parent entity show the following aggregate amounts:
Parent 2015
$’m
Parent 2014
$’m
Balance sheetCurrent assets 17.6 57.5 Assets held for sale – 3.6 Non-current assets 2,097.5 1,921.5
Total assets 2,115.1 1,982.6
Current liabilities 300.7 318.5 Non-current liabilities 465.1 367.8
Total liabilities 765.8 686.3
EquityContributed equity 2,153.3 2,127.0 Reserves (155.4) (164.5)Accumulated losses (648.6) (666.2)
Total equity 1,349.3 1,296.3
Statement of comprehensive incomeProfit after tax 121.7 104.8
Total comprehensive income 121.7 104.8
(b) guarantees and contingent liabilitiesThe parent entity did not have any other contingent liabilities which are material, either individually or as a class, at 30 June 2015 (2014: nil).
(c) CommitmentsDebt restructureIn June 2015, the REIT committed to issue US$200 million ($252 million) of USPP notes under the following conditions:
• 12 year duration;
• Funding to occur on 22 July 2015;
• Fixed US$ coupon of 3.55% which is 100% hedged in Australian dollars (principal and interest) and represent a margin of 194 basis points over BBSW.
In addition, the REIT secured a new bank debt facility to commence on funding of the USPP with the following terms:
• Three tranches of 18 months ($150 million), 3 years ($150 million) and 5 years ($285 million) with a total facility limit of $585 million;
• Mortgage on all wholly owned Australian properties of the REIT, except those specifically pooled as security for the REIT’s CMBS debt, has been discharged in July 2015;
• Financial covenants that include requirement to maintain look through gearing of no more than 50% and an interest cover ratio of no less than 2.00 times
For
per
sona
l use
onl
y

70 Charter Hall Retail REIT
28. Parent entity financial information continued(c) Commitments continued
Other commitmentsThe parent entity has entered into contracts for the construction and development of properties in Australia. The commitments of the parent entity total $8.0 million (2014: $29.2 million). These commitments have not been reflected in the financial information of the parent entity.
There have been no other material changes to the parent entity’s commitments since the last financial statement.
29. Interest in other entitiesMaterial subsidiariesThe REIT’s principal subsidiaries at 30 June 2015 are set out below. Unless otherwise stated, they have contributed equity consisting solely of ordinary shares/units that are held directly by the REIT, and the proportion of ownership interests held equals the voting rights held by the REIT.
Name of entityCountry of
incorporationPlace of
business 2015 2014 Principal activities
Charter Hall Retail Finance Pty Limited Australia Australia 100% 100%Issuer of the REIT's CMBS Notes
Charter Hall Retail JV Trust Australia Australia 100% 100% Property investment
Information relating to the REIT’s joint venture entities accounted for using equity method is disclosed in Note 11.
30. Events occurring after balance dateOn 22 July 2015, the REIT completed the issuance of a US$200 million US Private Placement (USPP) which will be used to repay the existing CMBS facility which matures on 28 September 2015.
On 28 July 2015 the REIT executed conditional contracts to acquire Goulburn Plaza, NSW and Katherine Central, NT, for a combined purchase price of $94.9 million.
Furthermore, on 31 July 2015, Charter Hall Retail Partnership No.1 Trust (CHRP1), the REIT’s joint venture entity, completed the acquisition of Brickworks Marketplace for a total purchase price (including land) of $76 million.
Since the end of the year, the Directors of the Responsible Entity are not aware of any other matter or circumstance not otherwise dealt with in this report or the consolidated financial statements that has significantly affected or may significantly affect the operations of the REIT, the results of those operations or the state of affairs of the REIT in the financial years subsequent to 30 June 2015.
Notes to the consolidated financial statements
For
per
sona
l use
onl
y

Annual Report 2015 71
Directors’ declaration to unitholdersFor the year ended 30 June 2015
In the opinion of the Directors of Charter Hall Retail Management Limited, the Responsible Entity of Charter Hall Retail REIT:
(a) the consolidated financial statements and notes set out on pages 33 to 70 are in accordance with the Corporations Act 2001, including:
– complying with Accounting Standards, the Corporations Regulations 2001 and other mandatory professional reporting requirements; and
– giving a true and fair view of the consolidated entity’s financial position as at 30 June 2015 and of its performance for the year ended on that date; and
(b) there are reasonable grounds to believe that the REIT will be able to pay its debts as and when they become due and payable.
Note 1(a) confirms that the consolidated financial statements also comply with the International Financial Reporting Standards as issued by the International Accounting Standards Board.
The Directors have been given the declarations by the Fund Manager, who performs the Chief Executive Officer function, and the Deputy Fund Manager, who performs the Chief Financial Officer function, required by section 295A of the Corporations Act 2001.
This declaration is made in accordance with a resolution of the Board of Directors.
John Harkness Chairman
Sydney 14 August 2015
For
per
sona
l use
onl
y

72 Charter Hall Retail REIT
Independent auditor’s reportFor the year ended 30 June 2015
Independent auditor’s report to the unitholders of Charter Hall Retail REIT
Report on the financial reportWe have audited the accompanying financial report of Charter Hall Retail REIT (the REIT), which comprises the consolidated balance sheet as at 30 June 2015, the consolidated statement of comprehensive income, consolidated statement of changes in equity and consolidated cash flow statement for the year ended on that date, a summary of significant accounting policies, other explanatory notes and the directors’ declaration for Charter Hall Retail REIT (the consolidated entity). The consolidated entity comprises the REIT and the entities it controlled at year’s end or from time to time during the financial year.
Directors’ responsibility for the financial reportThe directors of Charter Hall Retail Management Limited (the “responsible entity”) are responsible for the preparation of the financial report that gives a true and fair view in accordance with Australian Accounting Standards and the Corporations Act 2001 and for such internal control as the directors determine is necessary to enable the preparation of the financial report that is free from material misstatement, whether due to fraud or error. In Note 1, the directors also state, in accordance with Accounting Standard AASB 101 Presentation of Financial Statements, that the financial statements comply with International Financial Reporting Standards.
Auditor’s responsibilityOur responsibility is to express an opinion on the financial report based on our audit. We conducted our audit in accordance with Australian Auditing Standards. Those standards require that we comply with relevant ethical requirements relating to audit engagements and plan and perform the audit to obtain reasonable assurance whether the financial report is free from material misstatement.
An audit involves performing procedures to obtain audit evidence about the amounts and disclosures in the financial report. The procedures selected depend on the auditor’s judgement, including the assessment of the risks of material misstatement of the financial report, whether due to fraud or error. In making those risk assessments, the auditor considers internal control relevant to the consolidated entity’s preparation and fair presentation of the financial report in order to design audit procedures that are appropriate in the circumstances, but not for the purpose of expressing an opinion on the effectiveness of the entity’s internal control. An audit also includes evaluating the appropriateness of accounting policies used and the reasonableness of accounting estimates made by the directors, as well as evaluating the overall presentation of the financial report.
We believe that the audit evidence we have obtained is sufficient and appropriate to provide a basis for our audit opinion.
Independence In conducting our audit, we have complied with the independence requirements of the Corporations Act 2001.
PricewaterhouseCoopers, ABN 52 780 433 757Darling Park Tower 2, 201 Sussex Street, GPO BOX 2650, SYDNEY NSW 1171T: +61 2 8266 0000, F: +61 2 8266 9999, www.pwc.com.au
Liability limited by a scheme approved under Professional Standards Legislation.
For
per
sona
l use
onl
y
Annual Report 2015 73
Auditor’s opinionIn our opinion:
(a) the financial report of Charter Hall Retail REIT is in accordance with the Corporations Act 2001, including:
(i) giving a true and fair view of the consolidated entity's financial position as at 30 June 2015 and of its performance for the year ended on that date; and
(ii) complying with Australian Accounting Standards (including the Australian Accounting Interpretations) and the Corporations Regulations 2001.
(b) the financial report and notes also comply with International Financial Reporting Standards as disclosed in Note 1.
PricewaterhouseCoopers
Jane Reilly SydneyPartner 14 August 2015
For
per
sona
l use
onl
y

74 Charter Hall Retail REIT
Remuneration Report
Charter Hall Retail REIT (REIT) is a Charter Hall Group (Charter Hall) managed Australian Real Estate Investment Trust. Charter Hall Retail Management Limited (CHRML) is the responsible entity (and manager) of the REIT.
The REIT is externally managed and accordingly has no employees. Instead, Charter Hall makes available employees, including senior executives, to discharge their obligations to the REIT. These employees are employed by entities in Charter Hall and are made available through formalised resourcing arrangements with CHRML. Their remuneration is not a REIT expense. It is paid by Charter Hall. Instead, the REIT pays management fees set out in the REIT’s Constitution to CHRML in return for providing management services. Under the Corporations Act, it is only Australian listed companies that are required to prepare a remuneration report. However, in order to provide appropriate remuneration disclosure for the REIT, details of the management fees and non-executive directors’ fees paid by CHRML, together with qualitative disclosure detailing how Charter Hall employees working on the REIT are incentivised and their interests aligned with the REIT, are set out here.
Management feesThe manager of the REIT is CHRML, a subsidiary of Charter Hall. Under the terms of the REIT’s Constitution, CHRML is entitled to receive the following remuneration from the REIT, comprising a base fee and a performance fee.
Base feesThe base fee is currently calculated as:i) 0.45% per annum of the value of the total assets of the REIT
up to $700 million; plus
ii) 0.40% per annum of the value of the total assets of the REIT over $700 million.
The total asset value is calculated in accordance with the REIT’s Constitution. The valuations are audited for the 30 June half year but not for the 31 December half year, although the latter have been subject to a review by the Auditor.
The base fee is calculated six monthly and paid quarterly in arrears. The March and September payments are interim payments based on valuations as at the end of the previous half year. The June and December payments are based on valuations at that time. They are in effect adjusting payments in that the entire half year period fee is calculated and the March or September amount that has been paid on account is deducted to arrive at the balance of the fee payable for the current June or December half year period.
CHRML has agreed to waive the 0.40% base fee on any derivative mark-to-market asset value included in total assets of the REIT. The base fees paid or payable by the REIT to CHRML for the financial year ending 30 June 2015 were $9.1 million.
Performance feesIn addition to the base management fee, CHRML is currently entitled to a performance fee dependent upon the relative performance of the REIT to the Retail Property REIT Accumulation Index (Index). This Index, calculated from a peer group of property securities that have a principal focus on the retail sector, measures the income and capital growth of the unit prices of the representative REITs.
If the REIT’s performance during a six month period is higher than the percentage increase in the Index for the relevant period, then CHRML is entitled to new units in the REIT or a payment with a total value equal to:i) 5% of the total Increased Unitholder Value from outperformance;
plus
ii) 15% of the Increased Unitholder Value above 2% nominal outperformance per annum (1% per half year).
The Increased Unitholder Value is measured as the market capitalisation of the REIT at the commencement of the relevant year, multiplied by the nominal percentage outperformance of the REIT relative to the Index for that year.
The performance fee is calculated and payable, if entitled, each half year at December and June. The performance fee is payable, if entitled, subject to an annual cap, whereby total management fees paid in any one year must not exceed 80 basis points of the value of the gross assets of the REIT (except where the REIT has outperformed its sector peers continuously over a three year period).
Any unpaid fees will continue to be paid up to 80 basis points of the value of the assets in any future year. There were no performance fees paid or payable for the financial year ending 30 June 2015. In the calculation of the performance fee, outperformance will be assessed on a cumulative basis and, accordingly, any underperformance will need to be recovered before CHRML is entitled to any future performance fees.
Oversight of fee paymentsThere is independent oversight in respect of the calculation and payment of management fees as follows:i) the calculation and payment of management fees (both base and
performance fees) are audited as part of the Annual Financial Statement audit and through audit of the REIT’s compliance plan;
ii) the calculation of every performance fee to be paid is checked by an independent firm; and
iii) the REIT’s independent directors review the external certifications and authorise payment of the performance fee.
Changes to management feesThe fee arrangements were fully disclosed to investors on the REIT’s inception (and have been amended from time to time with Unitholder approval) and continue to be disclosed on the REIT website and in Annual Reports. Investors originally invested and continue to invest with this knowledge. Any changes to the structure of the fee provisions that would have the effect of increasing the fees would need to be approved by unitholders.
CHRML may accept lower fees or defer fees.
Expense reimbursementCHRML is also entitled to be reimbursed for expenses incurred by it in relation to the proper performance of its duties, out of the assets of the REIT. This includes routine ongoing expenses such as the third party costs of acquiring assets and the use of specialist technical advice from time to time, as well as capital raising costs, registry, audit, accounting, marketing, tax, insurance, compliance costs and other expenses as set out in the REIT’s Constitution.
For
per
sona
l use
onl
y

Annual Report 2015 75
DirectorsNon-executive directors’ fees for the financial year ended 30 June 2015 are as follows:
2014John
Harkness Maurice
Koop
Alan Rattray-
Wood Total
Director fee 74,420 49,614 49,614 173,648
Compliance fee 52,621 35,080 35,080 122,781
Audit committee fee 8,018 12,027 8,018 28,063
Total director fees 135,059 96,721 92,712 324,492
The level of fees is not related to the performance of the REIT. The Board of CHRML will consider remuneration payable to its non-executive directors from time to time. Remuneration for non-executive directors is approved by the Board and any increases are benchmarked to market rates. None of the non-executive directors are entitled to options or securities issued by the REIT or to retirement benefits as part of their remuneration package.
Executive directors of CHRML are employees of Charter Hall and are remunerated by Charter Hall.
ExecutivesExecutives and senior managers who have responsibility for the business activities of the REIT are employees of Charter Hall.
Their remuneration is paid by Charter Hall and is not recharged to the REIT. Scott Dundas, Fund Manager of the REIT, received, on a cash basis, $635,116 remuneration for the year ended 30 June 2015 (2014: $606,222).
While the REIT’s management are Charter Hall employees, there is a strong alignment of interest between those employees and the REIT’s unitholders. Charter Hall’s remuneration framework ensures that a meaningful amount of remuneration is ‘at risk’ and solely dependent on performance. The total remuneration package of all Charter Hall senior executives consists of Fixed Remuneration, a Short Term Incentive (STI) (consisting of cash and deferred equity delivered equally over two years) and a Long Term Incentive (LTI). From FY14,Scott Dundas, CQR Fund Manager, has deferred STI allocated in Charter Hall Retail REIT (CQR) units rather than Charter Hall Group (CHC) units to align with fund investor expectations. These rights amounted to $91,758 for the year ended 30 June 2015 (2014: $66,611). Half of these units will vest one year after they have been granted with the remaining units vesting two years following the grant date.
Fixed remuneration is reviewed annually taking into account individual performance, skills and experience and market remuneration for the role. STI is an ‘at risk’ incentive awarded annually designed to reward executives subject to performance against agreed financial and non-financial Key Performance Indicators (KPIs). Any STI awarded to executives provides substantial incentives for superior performance but low or no participation for less satisfactory outcomes.
The REIT’s management may also receive Long-Term Incentives (LTI) through participation in the Charter Hall Performance Rights and Options Plan, as part of their remuneration package. The LTI is in the form of Performance Rights which vest fully at three years subject to Total Return hurdles. STI and LTI allocations are therefore highly variable and can comprise a high proportion of total remuneration in the case of superior performance. For executives involved in the management of the REIT, a substantial component of the STI and LTI allocation is directly dependent on the performance of the REIT.
Alignment of interestsAlignment between Charter Hall and the REIT’s unitholders is also demonstrated through the interest Charter Hall holds in the REIT. At 30 June 2015, Charter Hall held a relevant interest of approximately 10.7% (2014: 10.2%) of REIT units.
For
per
sona
l use
onl
y

76 Charter Hall Retail REIT
unitholder Analysis
Top 20 registered unitholders as at 10 September 2015
Rank name units %
1 HSBC CUSTODY NOMINEES (AUSTRALIA) LIMITED 102,114,046 26.11
2 J P MORGAN NOMINEES AUSTRALIA LIMITED 47,985,200 12.27
3 TRUST COMPANY LIMITED 46,182,553 11.81
4 NATIONAL NOMINEES LIMITED 36,499,016 9.33
5 CITICORP NOMINEES PTY LIMITED 33,529,001 8.57
6 RBC INVESTOR SERVICES AUSTRALIA NOMINEES PTY LIMITED 20,180,233 5.16
7 BNP PARIBAS NOMS PTY LTD 11,427,352 2.92
8 RBC INVESTOR SERVICES AUSTRALIA NOMINEES PTY LIMITED 6,772,922 1.73
9 GALAXY NOMINEES NO 3 PTY LTD 5,734,534 1.47
10 GALAXY NOMINEES NO 2 PTY LTD 5,734,533 1.47
10 GALAXY NOMINEES NO 1 PTY LTD 5,734,533 1.47
10 GALAXY NOMINEES NO 4 PTY LTD 5,734,533 1.47
11 CITICORP NOMINEES PTY LIMITED 2,917,516 0.75
12 AMP LIFE LIMITED 1,916,736 0.49
13 RBC INVESTOR SERVICES AUSTRALIA NOMINEES PTY LIMITED 1,250,000 0.32
14 SCJ PTY LTD 1,000,000 0.26
15 UBS WEALTH MANAGEMENT AUSTRALIA NOMINEES PTY LTD 936,280 0.24
16 THE AUSTRALIAN NATIONAL UNIVERSITY 822,554 0.21
17 BOND STREET CUSTODIANS LIMITED 792,865 0.20
18 RABINOV HOLDINGS PTY LTD 615,995 0.16
19 HSBC CUSTODY NOMINEES (AUSTRALIA) LIMITED 601,747 0.15
20 NATIONAL NOMINEES LIMITED 597,001 0.15
Total 339,079,150 86.71
Balance of register 51,968,088 13.29
grand total 391,047,238 100.00
Range of units summary as at 10 September 2015
Range Securities % no. of holders
100,001 and Over 346,086,644 88.50 57
50,001 to 100,000 2,645,239 0.68 39
10,001 to 50,000 17,510,117 4.48 943
5,001 to 10,000 11,645,858 2.98 1,643
1,001 to 5,000 12,351,138 3.16 4,620
1 to 1,000 808,242 0.21 1,705
Total 391,047,238 100.00 9,007
Unmarketable Parcels 7,376 0.00 384
The number of security investors holding less than a marketable parcel of 126 securities is 384 and they hold 7376 securities.
Data from OscarFor
per
sona
l use
onl
y

Annual Report 2015 77
Voting rightsOn a poll, each unitholder has one vote for each dollar of the value of their total interest in the REIT.On a show of hands, each unitholder has one vote.
Substantial unitholder notices as at 10 September 2015
Company Date of change units Ownership (%)
Mondrian Investment Partners 23/06/2015 45,139,346 12.02
Charter Hall Group 31/08/2015 44,115,984 11.28
Gandel Group 25/10/2012 21,454,177 6.55
Legg Mason Asset Management Australia Limited 3/06/2015 22,724,282 6.05
APN Property Group Limited 29/01/2015 18,765,207 5.03
The Vanguard Group 10/07/2014 18,452,968 5.00
For
per
sona
l use
onl
y

78 Charter Hall Retail REIT
Distribution History
Period end
Cash distrib-utions Taxable amount 1
Tax deferred amount
Capital gain
concession 2Tax-free amount
Foreign tax
credit
DRP issue1 price
Period end
price
Cents/ unit
Cents/ unit %
Cents/ unit %
Cents/ unit %
Cents/ unit $ $
30-Jun-96 5.610 2.273 40.510 3.167 56.450 – – 0.171 3.040 – 0.763 0.760
30-Jun-97 10.300 6.776 65.783 3.233 31.389 – – 0.291 2.828 – 1.218 1.280
30-Jun-98 12.006 8.864 73.830 2.592 21.590 – – 0.550 4.580 – 1.420 1.410
30-Jun-99 12.655 8.273 65.374 3.728 29.459 – – 0.654 5.167 – 1.463 1.460
30-Jun-00 13.050 10.853 83.163 1.463 11.207 – – 0.735 5.630 – 1.405 1.470
30-Jun-01 13.100 9.684 73.920 2.972 22.690 – – 0.444 3.390 – 1.365 1.380
30-Jun-02 13.400 8.995 67.130 4.047 30.200 0.358 2.670 – – 0.0390 1.581 1.610
30-Jun-03 13.650 10.79 79.047 2.544 18.639 0.316 2.314 – – 0.1220 1.677 1.710
30-Jun-04 14.300 8.757 61.239 5.233 36.591 0.310 2.170 – – 0.0850 1.687 1.720
30-Jun-05 14.800 7.863 53.127 6.555 44.287 0.383 2.586 – – 0.1200 1.871 1.915
30-Jun-06 15.400 7.159 46.490 8.241 53.510 – – – – 0.5120 1.772 1.820
30-Jun-07 15.600 8.622 55.271 5.119 32.814 1.859 11.915 – – 0.1250 1.986 2.020
30-Jun-08 15.000 8.458 56.384 6.378 42.520 0.164 1.096 – – 0.6020 0.922 0.900
30-Jun-09 7.000 4.757 67.958 1.031 14.732 1.212 17.310 – – 0.1900 0.507 0.545
30-Jun-10 5.300 2.739 51.685 2.561 48.315 – – – – – 0.544 0.550
30-Jun-11 24.800 12.000 48.385 7.221 29.120 5.579 22.500 – – – – 3.210
30-Jun-12 26.100 13.376 51.248 12.724 48.752 – – – – 0.221 – 3.310
30-Jun-13 26.800 10.433 38.928 16.367 61.072 – – – – 0.024 3.721 3.810
30-Jun-14 27.300 15.074 55.216 12.226 44.784 – – – – – 3.735 3.880
30-Jun-15 27.500 16.582 60.298 9.760 35.491 1.158 4.211 – – – 4.226 4.240
1. The taxable amount includes capital gains but does not include the foreign tax credit that appears in this table
2. Capital gain is included in the cash distribution
Note One for five consolidation, effective 15 September 2010
From 1 July 2004, tax components are advised annually in the annual tax statement. For purposes of section 12-415 of Schedule 1 of the Taxation Administration Act 1953 (Cth), estimated tax components and a ‘fund payment’ amount for each distribution are advised to investors and announced to the ASX when distribution payments are made. However, Australian resident unitholders should only use final tax components shown on the annual tax statement (usually issued in August each year) when completing their tax returns.
For
per
sona
l use
onl
y

Annual Report 2015 79
How do I invest in Charter Hall Retail REIT?Charter Hall Retail REIT units are listed on the Australian Securities Exchange (ASX: CQR). Unitholders will need to use the services of a stockbroker or an online broking facility to invest in Charter Hall Retail REIT.
Where can I find more information about Charter Hall Retail REIT?Charter Hall Retail REIT’s website, www.charterhall.com.au/cqr contains extensive information on our Board, corporate governance (including its corporate governance statement), sustainability, property portfolio, unit price and all investor communications including distribution and tax information, reports and presentations, and profit results. The website also provides information on the broader Charter Hall Group including other managed funds available for investment.
You can register your details on our website to receive ASX announcements by an email alert as they are being released. To register your details, please visit our website at http://www.charterhall.com.au.
Can I receive my Annual Report electronically?Charter Hall Retail REIT provides its annual report in both PDF and online formats (HTML). You can elect via your Investor login to receive notification that this report is available online. Alternatively, you can elect to receive the report in hard copy by contacting the registry.
How do I receive my distribution?Charter Hall Retail REIT pays its distribution via direct credit. This enables you to receive automatic payment of your distributions quickly and securely. You can nominate any Australian or New Zealand bank, building society, credit union or cash management account for direct payment by downloading a direct credit form using the Investor Login facility and sending to Link Market Services. On the day of payment you will be sent a statement via post or email confirming that the payment has been made and setting out details of the payment.
The REIT no longer pays distributions by cheque.
Can I reinvest my distribution?The Distribution Reinvestment Plan (DRP) allows you to have your distributions reinvested in additional securities in Charter Hall Retail REIT, rather than having your distributions paid to you. If you would like to participate in the DRP, you can do so online using the Investor Login facility available on our website, or you can complete a DRP Application Form available from our registry.
Do I need to supply my Tax File number?You are not required by law to supply your Tax File Number (TFN), Australian Business Number (ABN) or exemption. However, if you do not provide these details, withholding tax may be deducted at the highest marginal rate from your distributions. If you wish to provide your TFN, ABN or exemption, please contact Link Market Services on 1300 303 063 or your sponsoring broker. You can also update your details directly online at www.charterhall.com.au using the Investor Login facility.
How do I complete my annual tax return for the distributions I receive from Charter Hall Retail REIT?At the end of each financial year, we issue unitholders with an Annual Taxation Statement. This statement includes information required to complete your tax return. The distributions paid in February and August are required to be included in your tax return for the financial year the income was earned, that is, the distribution income paid in August 2014 should be included in your 2014 financial year tax return.
How do I make a complaint?Unitholders wishing to lodge a complaint should do so in writing and forward it to the Compliance Manager, Charter Hall Retail REIT at the address shown in the Directory.
In the event that a complaint cannot be resolved within a reasonable time frame (usually 45 days) or you are not satisfied with our response, you can seek assistance from the Financial Ombudsman Service (FOS), an independent dispute resolution scheme available to those investors who have first raised their complaint with us and who remain dissatisfied. FOS’s contact details are below:
Financial Ombudsman ServiceGPO Box 3Melbourne Vic. 3001Tel: 1300 780 808Fax: +61 3 9613 6399Email: [email protected]: www.fos.org.au
Contact detailsRegistryTo access information on your holding or update/change your details including name, address, tax file number, payment instructions and document requests, contact:
Link Market Services LimitedLocked Bag A14Sydney South NSW 1235Tel: 1300 303 063 (within Australia) +61 2 8280 7134 (outside Australia)Fax: +61 2 9287 0303Email: [email protected]: www.linkmarketservices.com.au
Investor relationsAll other enquiries related to Charter Hall Retail REIT can be directed to Investor Relations:
Charter Hall Retail Management LimitedGPO Box 2704Sydney NSW 2001Tel: 1300 365 585 (local call cost) + 61 2 8651 9000 (outside Australia)Fax: +61 2 9221 4655Email: [email protected]: www.charterhall.com.au
Investor InformationF
or p
erso
nal u
se o
nly

80 Charter Hall Retail REIT
Corporate Directory
Responsible Entity (and Manager)Charter Hall Retail Management LimitedABN 46 069 709 468AFSL 246996
Registered officeLevel 20, No.1 Martin PlaceSydney NSW 2000
Directors of the Responsible EntityJohn Harkness (Chairman)David HarrisonMaurice KoopDavid SouthonAlan Rattray-Wood
Fund ManagerScott Dundas
Company SecretaryMark Bryant
Responsible Entity’s officeLevel 20, No.1 Martin PlaceSydney NSW 2000GPO Box 2704Sydney NSW 2001
Tel: 1300 365 585 (local call cost) +61 2 8651 9000 (outside Australia)Fax: +61 2 9221 4655
Email: [email protected]: www.charterhall.com.au/cqrASX code: CQR
CustodianPerpetual LimitedLevel 12, Angel Place123 Pitt StreetSydney NSW 2000
AuditorPricewaterhouseCoopersDarling Park Tower 2201 Sussex StreetSydney NSW 1171
unit registryTo access information on your holding or update/change your details including name, address, tax file number, payment instructions and document requests, contact:
Link Market Services LimitedLocked Bag A14Sydney South NSW 1235
Tel: 1300 303 063 (local call cost) +61 2 8280 7134 (outside Australia)Fax: +61 2 9287 0303
Email: [email protected]: www.linkmarketservices.com.au
For
per
sona
l use
onl
y

Important Notice
Charter Hall Retail Management Limited ABN 46 069 709 468; AFSL 246996 (CHRML) is the responsible entity of Charter Hall Retail REIT ARSN 093 143 965 (REIT). CHRML is a controlled entity of Charter Hall Limited ABN 57 113 531 150 (Charter Hall).
Past performance is not a reliable indicator of future performance. Due care and attention has been exercised in the preparation of forecast information; however, forecasts, by their very nature, are subject to uncertainty and contingencies, many of which are outside the control of CHRML. Actual results may vary from forecasts and any variation may be materially positive or negative.
This report has been prepared for general information purposes only and is not an offer or invitation for subscription or purchase of, or recommendation of, securities. It does not take into account the investment objectives, financial situation or needs of any investor. Before investing, the investor or prospective investor should consider whether such an investment is appropriate to their particular investment needs, objectives and financial circumstances and consult an investment adviser if necessary.
CHRML does not receive fees in respect of the general financial product advice it may provide; however, it will receive fees for operating the REIT which, in accordance with the REIT’s constitution, are calculated by reference to the value of the assets and the performance of the REIT. Controlled entities of Charter Hall may also receive fees for managing the assets of, and providing resources to, the REIT. Charter Hall and its related entities, together with their officers and directors, may hold securities in the REIT from time to time.
© Charter Hall
This report is printed on Pacesetter Laser. Pacesetter Laser is PEFC certified, 30% recycled and manufactured elemental chlorine free.
For
per
sona
l use
onl
y

www.charterhall.com.au/cqr
For
per
sona
l use
onl
y