for personal use only - asx · 03 operations review 4 overview millennium operates the nullagine...
TRANSCRIPT

ANNUAL REPORT
2013 ABN 85 003 257 556
For
per
sona
l use
onl
y
3
CONTENTS
02 Chairman’s letter
03 Operations Review
06 Corporate Governance Statement
16 Financial Report
CORPORATE DIRECTORY
DIRECTORS
Chairman Peter Rowe
Managing Director & Chief Executive Officer Brian Rear
Non-Executive Director Ross Gillon
Non-Executive Director John Morton
Non-Executive Director Richard Procter
Secretary Pierre Malherbe
REGISTERED OFFICE AND BUSINESS ADDRESS
Ground Floor 10 Kings Park Road West Perth, Western Australia 6005
Postal: PO Box 117 West Perth, Western Australia 6872
Telephone: +61 8 9216 9011 Facsimile: +61 8 9481 2088 Email: [email protected]
WEBSITE
Millennium Minerals maintains a web site where all announcements to the ASX are available
www.millenniumminerals.com.au
SHARE REGISTRY
Advanced Share Registry Services 150 Stirling Highway Nedlands, Western Australia 6009 Telephone: +61 8 9389 8033 Facsimile: +61 8 9389 7871
HOME EXCHANGE
Australian Securities Exchange Limited Exchange Plaza 2 The Esplanade Perth, Western Australia 6000 Quoted on the official lists of the Australian Securities Exchange ASX Ordinary Share Code: “MOY”
AUDITORS
Rothsays Chartered Accountants Level 1, Lincoln House 4 Ventnor Avenue West Perth, Western Australia 6005
LEGAL ADVISERS
Allion Legal 50 Kings Park Road West Perth, Western Australia 6005
For
per
sona
l use
onl
y
02 CHAIRMAN’S LETTER
3
Dear Shareholders,
I am pleased to report to you that despite a challenging year Millennium delivered an audited maiden after tax profit of $41.7 million in what was its first year of commercial production. Following a rapid ramp up period late 2012 the Company declared commercial production as of 1 January 2013. By the end of December 2013, the Company had poured 63,247 ounces of fine gold for the financial year and 75,000 ounces since commissioning in September 2012. At the mine operating level, the gross profit for calendar year 2013 was $22.5 million based on revenue from operations of $103.3 million and cost of sales of $80.8 million. Mine level EBITDA was $31.1 million. The average net income margin at the mine level was $667 per gold ounce poured. A number of Project development activities continued into 2013, notably completion of the stage 1 tailings storage facility, construction of the Golden Gate haul road and preparation of the Golden Gate deposits in readiness for mining. The augmentation of the source of water supply was a further key development with the establishment of the Eastern bore field late in the year. Gold production and performance was below guidance in the December 2013 quarter due to a number of operational factors, including water restriction, lower grades achieved from Golden Eagle, and delays with permitting for works to begin at Golden Gate. I am pleased to report, however that by year-end management had overcome most of those issues and the operation is better placed heading into 2014 and beyond. Despite a limited exploration budget our exploration team achieved notable success across most of our current deposits that were drilled and the results of that activity are set out in the Operations Report. In addition to the drilling results the team advanced a number of new exploration prospects that show historical gold intersections and other useful indicators of prospectivity that materially extends the pipeline of targets to be addressed in future years. The exploration focus in the year ahead is Ore Reserve development and continuing exploration along strike and at depth to exploit extensions in and around our existing deposits. Looking ahead
Ongoing volatility in the financial markets in general and the gold market in particular provides a challenging business environment. Nonetheless your Company is now better prepared to weather this environment than it was last year in terms of technical and operational flexibility, as well as better understanding the performance characteristics of the project. The results achieved in calendar year 2013, despite the setbacks, are due to the efforts of our dedicated management, staff and those service providers who work with us. On behalf of my fellow directors, I thank them very sincerely for delivering a profitable year in trying circumstances and look forward to another rewarding year in 2014. I also thank very much our many loyal shareholders for their strong support over past year.
Peter Rowe Chairman Perth 28 March 2014
For
per
sona
l use
onl
y

03 OPERATIONS REVIEW
4
OVERVIEW Millennium operates the Nullagine Gold Project, located in the Pilbara Region in Western Australia (Figure 1). The Project comprises 7 deposits on granted mining leases. The largest deposit, Golden Eagle, is located approximately 10 km south of the Nullagine Township. The 1.5 Mtpa CIL processing plant was commissioned in August 2012 and first gold was poured in September 2012. Commercial production was declared effective from January 2013.
The end of calendar year 2013 marks the end of the first full year of production for the Company. For the 12 month period, the Project produced 63,247 ounces of fine gold and proceeds from gold sales amounted to $100.2
1 million. In addition to this, the Company held bullion on hand of approximately $3.08 million at year
end. The Company declared an audited net profit of $41.7 million for the 12 month period ended 31 December 2013.
Guidance for calendar year 2014 is for gold production of 76,000 ounces at a processing throughput rate of 1.6 million tonnes milled. C1 cash cost
2 for calendar year 2014 is forecast to be $975 per ounce and sustaining
cash cost3 of $1,140 per ounce.
Corporately, the Company had repaid approximately 32% ($16.8 million) of the senior project finance and equipment lease facilities. The current outstanding balance of the senior project finance facility is $31.0 million Subject to final documentation and various conditions, the Company’s senior debt providers have agreed to extend the waiver period and to reschedule debt so that it is repaid progressively over the period from 2014 to the maturity date of June 2016. In August 2013, the Company restructured its share capital by consolidating its shares on a 22:1 basis (pre consolidation / post consolidation). Post the consolidation, the Company undertook a non-renounceable 2 for 21 Rights Issue at $0.32 per share raising approximately $6 million. As at 31 December 2013, the Company had approximately 217.7 million shares on issue.
Exploration continued during the first half of the year with approximately 18,900 metres drilled throughout the Company’s tenement holding. High tenor gold intercepts announced to the market during the year bode well for material increases in the Mineral Resource and potentially Ore Reserve inventories. In addition, the Beatons Creek Inferred Mineral Resource was added to the Mineral Resource inventory (subject to the Novo Resources earn-in) as was the AU81 Inferred Mineral Resource.
The Company intends to continue exploration activities during 2014 in order to convert a high proportion of a large Mineral Resource inventory of 1.9 million ounces into the Ore Reserve.
1 All currency amounts are Australian dollars unless otherwise denoted
2 C1 Cash Costs represents the costs for mining, processing, administration, by-product credits and the accounting movements for
stockpiles, gold-in-circuit and waste stripping. It does not include sustaining capital costs, mine development, exploration, royalties or
corporate administration costs. 3 Sustaining cost per ounce includes C1 cash cost, royalties, sustaining capital expenditure and corporate administration costs. It does not
include exploration or mine development expenditure.
For
per
sona
l use
onl
y

03 OPERATIONS REVIEW
5
Figure 1: Nullagine Gold Project Location Plan
For
per
sona
l use
onl
y
OPERATIONS REVIEW
6
OPERATIONS
First Full Production Year 2013
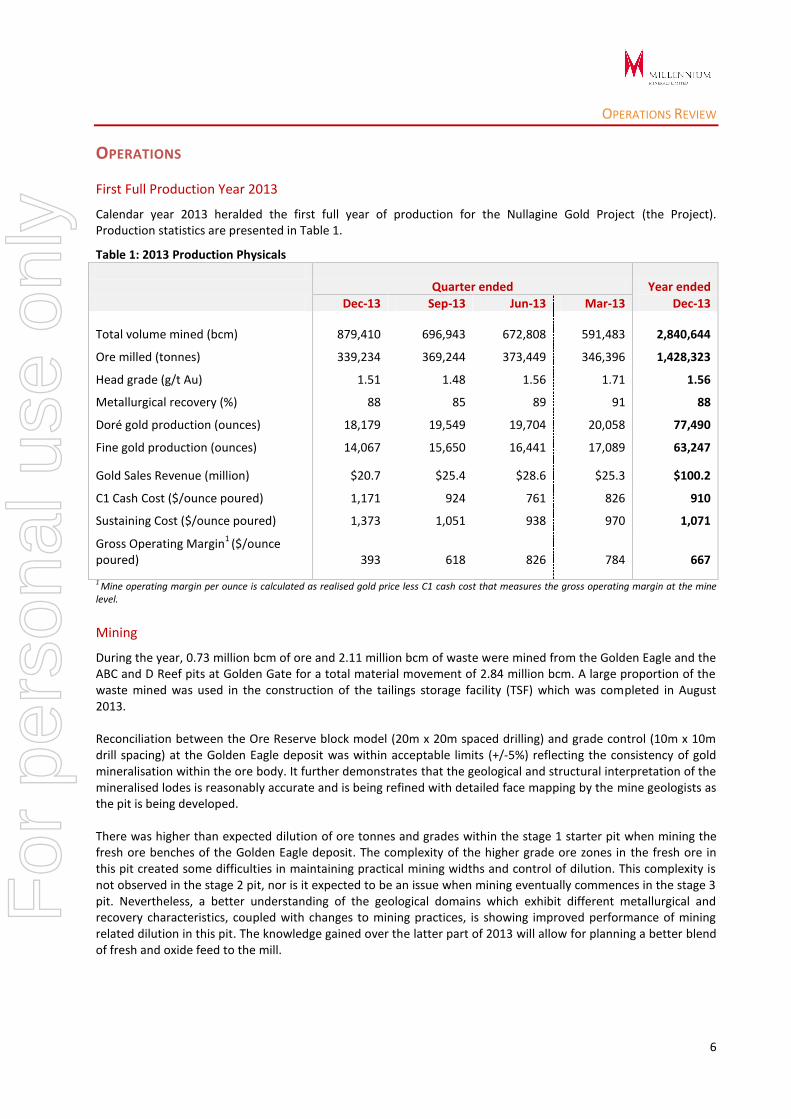
Calendar year 2013 heralded the first full year of production for the Nullagine Gold Project (the Project). Production statistics are presented in Table 1.
Table 1: 2013 Production Physicals
Quarter ended Year ended
Dec-13 Sep-13 Jun-13 Mar-13 Dec-13
Total volume mined (bcm) 879,410 696,943 672,808 591,483 2,840,644
Ore milled (tonnes) 339,234 369,244 373,449 346,396 1,428,323
Head grade (g/t Au) 1.51 1.48 1.56 1.71 1.56
Metallurgical recovery (%) 88 85 89 91 88
Doré gold production (ounces) 18,179 19,549 19,704 20,058 77,490
Fine gold production (ounces) 14,067 15,650 16,441 17,089 63,247
Gold Sales Revenue (million) $20.7 $25.4 $28.6 $25.3 $100.2
C1 Cash Cost ($/ounce poured) 1,171 924 761 826 910
Sustaining Cost ($/ounce poured) 1,373 1,051 938 970 1,071
Gross Operating Margin1
($/ounce poured) 393 618 826 784 667 1 Mine operating margin per ounce is calculated as realised gold price less C1 cash cost that measures the gross operating margin at the mine level.
Mining
During the year, 0.73 million bcm of ore and 2.11 million bcm of waste were mined from the Golden Eagle and the ABC and D Reef pits at Golden Gate for a total material movement of 2.84 million bcm. A large proportion of the waste mined was used in the construction of the tailings storage facility (TSF) which was completed in August 2013. Reconciliation between the Ore Reserve block model (20m x 20m spaced drilling) and grade control (10m x 10m drill spacing) at the Golden Eagle deposit was within acceptable limits (+/-5%) reflecting the consistency of gold mineralisation within the ore body. It further demonstrates that the geological and structural interpretation of the mineralised lodes is reasonably accurate and is being refined with detailed face mapping by the mine geologists as the pit is being developed. There was higher than expected dilution of ore tonnes and grades within the stage 1 starter pit when mining the fresh ore benches of the Golden Eagle deposit. The complexity of the higher grade ore zones in the fresh ore in this pit created some difficulties in maintaining practical mining widths and control of dilution. This complexity is not observed in the stage 2 pit, nor is it expected to be an issue when mining eventually commences in the stage 3 pit. Nevertheless, a better understanding of the geological domains which exhibit different metallurgical and recovery characteristics, coupled with changes to mining practices, is showing improved performance of mining related dilution in this pit. The knowledge gained over the latter part of 2013 will allow for planning a better blend of fresh and oxide feed to the mill.
For
per
sona
l use
onl
y
OPERATIONS REVIEW
7
OPERATIONS (CONTINUED)
Milling
Milled production for the year was 1.428Mt processed at a head grade of 1.56 g/t Au for 63,247 ounces of fine gold poured. Plant utilisation averaged 93.5% which contributed to lower plant throughput for the year. This is not unusual during the first year of operation as the processing plant is tuned to accept the material fed to it. Due to excessive wear on certain plant components as a result of feeding more abrasive fresh ore, 2 extra shutdowns were conducted during the year, specifically to change out worn mill liners and lifters. This excessive wear problem has been largely mitigated by liner design changes that are demonstrating longer wear life. Going forward mine scheduling will ensure the mill feed will be a blend of ore types that will not only even out wear but will also allow average mill throughput rates to be maintained at a higher rate. As a result, plant utilisation will increase further and the budget assumption for mill run time is now set at 96%. Throughput was also impacted by water restrictions during the latter half of 2013 where tonnes per hour were restricted at times in order to conserve water. This was alleviated in December 2013 when the new Eastern Bore field was successfully commissioned. The additional water capacity now supports throughput performance well above design in the range of 200tph to 230tph. Gold metallurgical recovery averaged 88% for the year but importantly reflects the lower recoveries achieved from feeding fresh ore alone over the last 5 months of the year. A blend of oxide (50%) and fresh ore (50%) now being targeted should see recoveries improve to at least 90% on average for 2014. Full year gold production totalled 63,247 ounces. Gold sales revenue for the year was $100.2 million, generated
from 63,446 ounces sold at an average price received of $1,576 per ounce, benefitting from the Company’s
hedging at $1,612 per ounce and an average spot price received of $1,458 per ounce.
CORPORATE
Debt Funding
At 31 December 2013, the Company’s “in the money” hedge book had a mark-to-market valuation of $14.6 million based on the spot price of $1,352 per ounce at that time. The hedge structure at 31 December 2013 requires 62,100 ounces to be delivered by September 2015 at an average forward price of $1,627 per ounce.
For calendar year 2013, the Company had repaid approximately 32% ($16.8 million) of the outstanding principal on the senior project finance and on the equipment lease facilities.
The current outstanding balance of the senior project finance facility is $31.0 million Subject to final documentation and various conditions, the Company’s senior debt providers have agreed to extend the waiver period and to reschedule debt so that it is repaid progressively over the period from 2014 to the maturity date of June 2016.
For
per
sona
l use
onl
y

OPERATIONS REVIEW
8
CORPORATE (CONTINUED)
Maiden Profit Declared
The Company reported an audited after tax profit of $41.7 million for the twelve month period ended 31 December 2013.
The after tax profit includes an unrealised derivative gain of $16.2 million related to the valuation of the Company’s hedge book on 31 December 2013 and the recognition of deferred tax assets resulting in an income tax benefit of $11.6 million. The underlying profit before treasury, tax and finance for the twelve month period was $17.9 million.
At the mine operating level, the gross profit for calendar year 2013 was $22.5 million based on revenue from operations of $103.3 million and cost of sales of $80.8 million. The cost of sales includes depreciation, amortisation, waste stripping, stockpile adjustments and revaluations of $8.6 million. Mine level EBITDA was $31.1 million.
Share Capital Restructure
At the General Meeting on 23 July 2013, the shareholders of the Company approved a one for twenty two consolidation of the Company’s shares. The consolidation involved the conversion of every 22 fully paid pre consolidated ordinary shares on issue into one fully paid post consolidated ordinary share. The purpose of this was to bring its total number of shares on issue more int line with its peers.
While the share consolidation had no effect on the underlying value of the Company, the effect on the Company share price at the time of conversion was to trade at 22 times the price at which it previously traded.
As at 31 December 2013 the Company had approximately 217.7 million shares on issue.
Capital Raising
In August 2013, the Company undertook a fully underwritten non-renounceable rights issue of 2 fully paid ordinary shares for every 21 shares held at $0.32 per share to raise approximately $6 million before raising costs. The proceeds were used to fund the Debt Service Reserve Account as part of the Company’s senior debt facility and for general working capital purposes and exploration.
EXPLORATION For the year ended 31 December 2013, a total of 18,947 metres of RC drilling was completed on the Company’s tenements. Drilling was specifically targeting strike and depth extensions to the known gold deposits (Figures 2 -8). This programme of drilling was successful in adding a further 36,000 ounces to the Ore Reserve, principally from around the deposits at Golden Gate. A breakdown of drilled metres is given in Table 2.
For
per
sona
l use
onl
y
OPERATIONS REVIEW
9
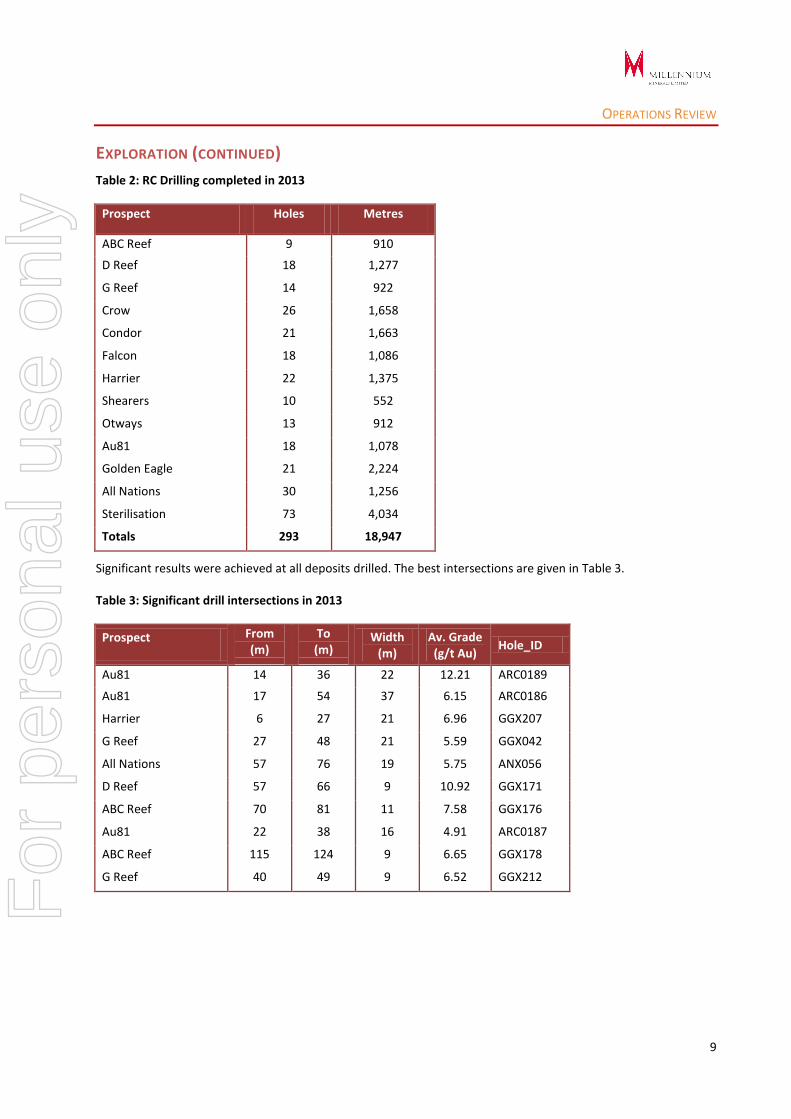
EXPLORATION (CONTINUED)
Table 2: RC Drilling completed in 2013
Prospect Holes Metres
ABC Reef 9 910
D Reef 18 1,277
G Reef 14 922
Crow 26 1,658
Condor 21 1,663
Falcon 18 1,086
Harrier 22 1,375
Shearers 10 552
Otways 13 912
Au81 18 1,078
Golden Eagle 21 2,224
All Nations 30 1,256
Sterilisation 73 4,034
Totals 293 18,947
Significant results were achieved at all deposits drilled. The best intersections are given in Table 3.
Table 3: Significant drill intersections in 2013
Prospect From (m)
To (m)
Width (m)
Av. Grade (g/t Au)
Hole_ID
Au81 14 36 22 12.21 ARC0189
Au81 17 54 37 6.15 ARC0186
Harrier 6 27 21 6.96 GGX207
G Reef 27 48 21 5.59 GGX042
All Nations 57 76 19 5.75 ANX056
D Reef 57 66 9 10.92 GGX171
ABC Reef 70 81 11 7.58 GGX176
Au81 22 38 16 4.91 ARC0187
ABC Reef 115 124 9 6.65 GGX178
G Reef 40 49 9 6.52 GGX212 For
per
sona
l use
onl
y

OPERATIONS REVIEW
10
Figure 2: Cross Section Au81
Figure 3: D Reef Deposit Drill Hole Layout Insert (Plan)
For
per
sona
l use
onl
y

OPERATIONS REVIEW
11
Figure 4: D Reef Cross Section GGX171
Figure 5: ABC Reef Cross Section GGX183
For
per
sona
l use
onl
y

OPERATIONS REVIEW
12
Figure 6: All Nations Deposit Drill Hole Layout (Plan)
For
per
sona
l use
onl
y

OPERATIONS REVIEW
13
Figure 7: Northern All Nations Deposit Drill Hole Layout Insert (Plan)
For
per
sona
l use
onl
y
OPERATIONS REVIEW
14
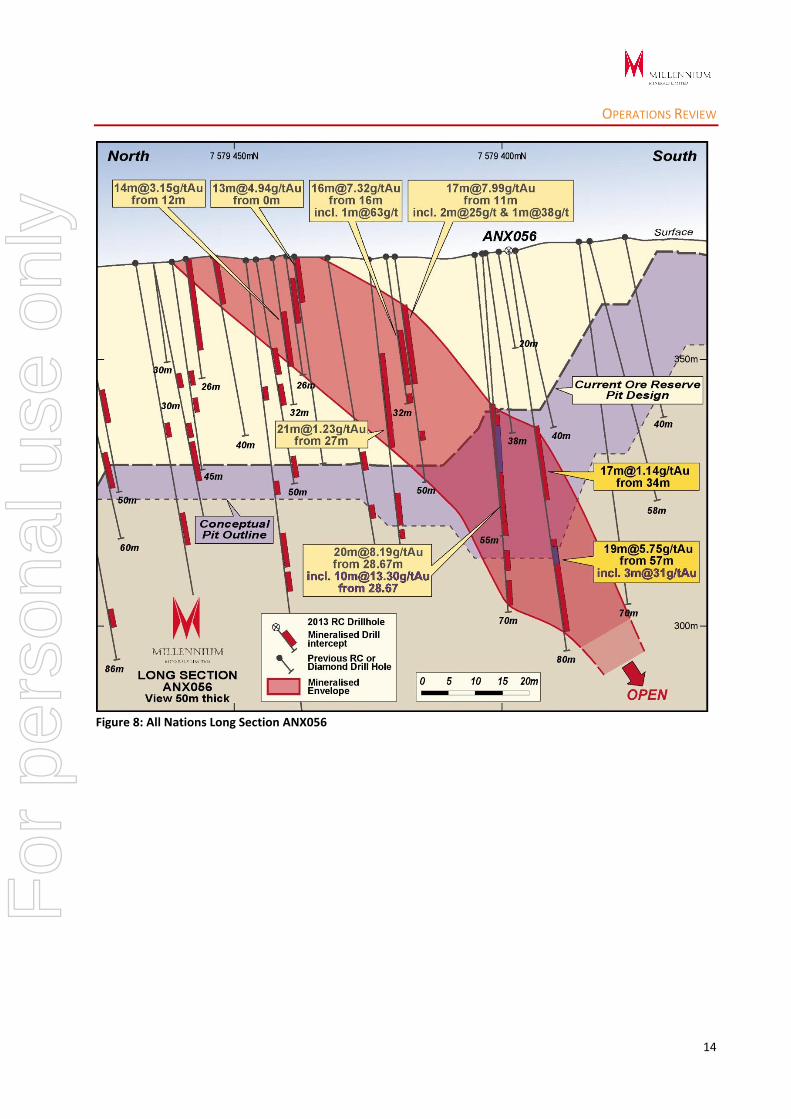
Figure 8: All Nations Long Section ANX056
For
per
sona
l use
onl
y

OPERATIONS REVIEW
15
CAMEL CREEK JOINT VENTURE
During 2013, a maiden Ore Reserve1 was estimated for the Camel Creek Joint Venture deposits (Little Wonder East
and West, Junction and Roscoes Reward) using a $1,400 per ounce gold sell price and current operating costs and recoveries from the Company’s operation. The Ore Reserve was estimated at 1.075 Mt @ 1.40 g/t Au for 48,300 oz of gold. This was revised in March 2014 to reflect higher processing unit cost assumptions and lower recovery assumptions. The Ore Reserve for the CCJV is now estimated at 0.66 Mt @ 1.57 g/t Au for 35,400 contained gold ounces.
The Camel Creek Joint Venture is a 50:50 mining joint venture between Northwest and Millennium. Under the joint venture, the parties are each entitled to 50% of physical gold produced from the initial four joint venture deposits (Junction, Roscoes Reward, Little Wonder and Round Hill). Ore from the joint venture deposits will be mined and processed by Millennium through its Golden Eagle treatment plant and the parties will share equally the joint venture mining, processing and rehabilitation costs. Millennium is the manager of the joint venture.
The maiden Ore Reserve was prepared by Auralia Mining Consultants Pty Limited (Auralia) and includes estimates for the Junction and Roscoes Reward deposits, and the joint venture component of the Little Wonder deposit (Table 4). The Ore Reserve estimate is based on the 2012 Mineral Resource estimate for the Junction, Roscoes Reward and Little Wonder deposits prepared by CSA Global Pty Limited (CSA Global). A location map of the joint venture deposits is provided in Figure 9. The Ore Reserve numbers given in Table 1 are reported in full with 50% being attributable to the Company.
Table 4: Ore Reserves for the Camel Creek Joint Venture
Proven Probable Total
Deposit Ore
(t)
Grade
(g/t Au)
Ore
(t)
Grade
(g/t Au)
Ore
(t)
Grade
(g/t Au)
Metal
(oz Au)
Little Wonder 211,800 1.61 4,900 1.60 216,700 1.61 11,200
Junction 86,000 2.31 8,800 2.38 94,800 2.32 7,000
Roscoes Reward 306,500 1.35 46,500 1.33 352,900 1.35 15,300
Total 604,300 1.58 60,100 1.5 664,400 1.57 35,400
Figure 9: Camel Creek Joint Venture Deposit Location Plan
1 All references to Mineral Resource or Ore Reserve are reported under the 2012 JORC Code
For
per
sona
l use
onl
y

OPERATIONS REVIEW
16
BEATONS CREEK FARM OUT (NOVO RESOURCES (NVO:CNX) EARNING 70%) Novo Resources Corp (Novo) has an option to earn a 70% interest in the Company’s Beatons Creek tenements, located immediately to the north of Nullagine township. The Beatons Creek Tenements cover extensive exposures of the Beatons Creek conglomerates, a series of Archaean age pyritic conglomerates hosting gold mineralization similar to that of the Witwatersrand Basin in the Republic of South Africa.
During the year, Novo established a NI43-101 compliant Mineral Resource within the 800 metre by 700 metre target area as defined by results from drilling during 2011 and 2012. Gold bearing reefs targeted by this drill programme lie within 100 metres of surface and may have the potential for open cut mining.
The Mineral Resource estimate was classified as Inferred and contains 421,000 ounces gold within 8.9 million tonnes at a grade of 1.47 g/t Au.
This Inferred Mineral Resource was defined by 16,107 meters of vertical RC drilling. Density measurements were taken from core samples from eight diamond drill holes totalling 478 meters. Costs related to drilling totalled approximately $2.5 million making the cost of discovery about $6 per ounce gold.
Most of this Mineral Resource is contained within two shallow, sub-horizontal gold-bearing conglomerate horizons (reefs) displaying strong lateral continuity.
Mineralization remains open to the north, west and south into the basin. There is a good potential for expanding this Mineral Resource through further drilling given the strong sub-surface continuity of these reefs as demonstrated by drilling coupled with Novo’s success in tracing their surface expression along the northern and northwestern perimeter of the basin.
This Inferred Mineral Resource enables the undertaking of a preliminary economic assessment planned for 2014. It is expected that upgrading this Mineral Resource to the Indicated category can be accomplished by drilling approximately 3,710 meters more infill RC holes. Doing so would enable advancement towards a prefeasibility study.
The Beatons Creek NI 43-101 Mineral Resource estimate is summarized in Table 5.
Table 5: Beatons Creek Inferred Mineral Resource
Classification Au Cut-off (g/t) Tonnage (Mt) Au Grade (g/t) Contained Au
(troy ounces)
Inferred
0.2 9.2 1.44 424,000
0.3 9.2 1.44 424,000
0.5 8.9 1.47 421,000
0.6 8.6 1.50 415,000
0.8 7.1 1.67 381,000
1.0 5.5 1.89 334,000
1.5 3.0 2.43 236,000
2.0 1.6 3.02 160,000
2.5 0.9 3.71 106,000
3.0 0.6 4.22 78,000
For
per
sona
l use
onl
y
OPERATIONS REVIEW
17
RESOURCES AND RESERVES
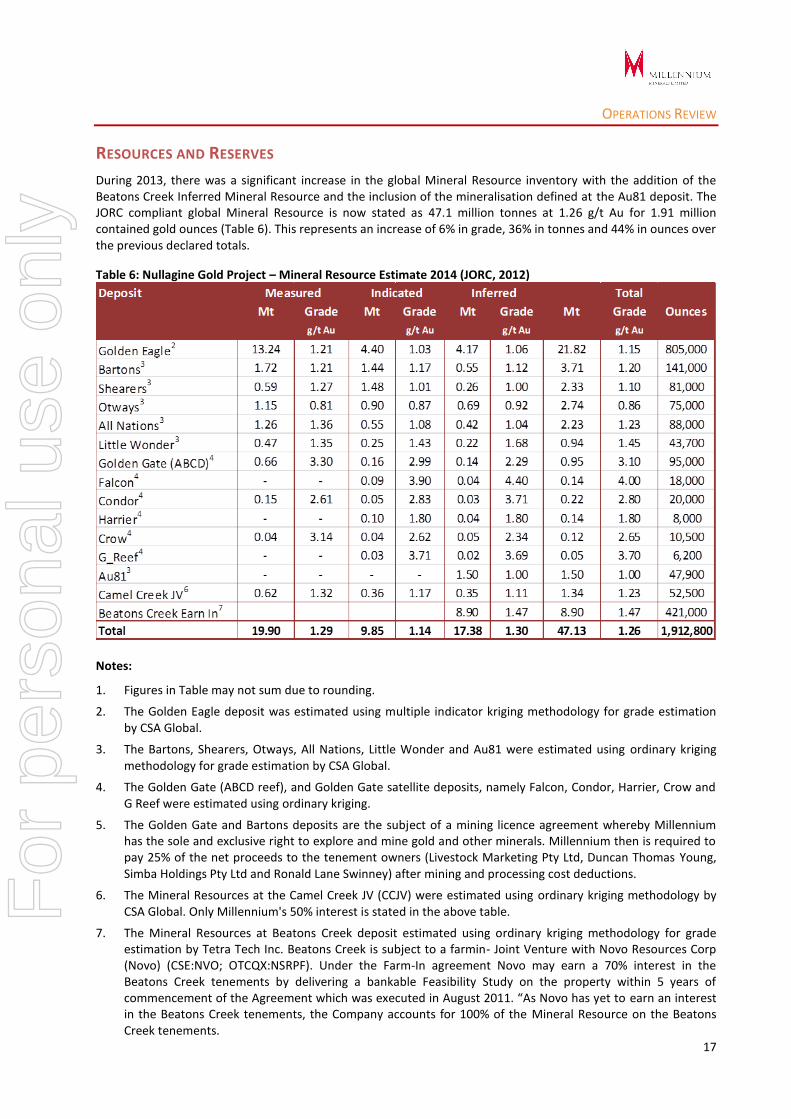
During 2013, there was a significant increase in the global Mineral Resource inventory with the addition of the Beatons Creek Inferred Mineral Resource and the inclusion of the mineralisation defined at the Au81 deposit. The JORC compliant global Mineral Resource is now stated as 47.1 million tonnes at 1.26 g/t Au for 1.91 million contained gold ounces (Table 6). This represents an increase of 6% in grade, 36% in tonnes and 44% in ounces over the previous declared totals.
Table 6: Nullagine Gold Project – Mineral Resource Estimate 2014 (JORC, 2012)
Notes:
1. Figures in Table may not sum due to rounding.
2. The Golden Eagle deposit was estimated using multiple indicator kriging methodology for grade estimation by CSA Global.
3. The Bartons, Shearers, Otways, All Nations, Little Wonder and Au81 were estimated using ordinary kriging methodology for grade estimation by CSA Global.
4. The Golden Gate (ABCD reef), and Golden Gate satellite deposits, namely Falcon, Condor, Harrier, Crow and G Reef were estimated using ordinary kriging.
5. The Golden Gate and Bartons deposits are the subject of a mining licence agreement whereby Millennium has the sole and exclusive right to explore and mine gold and other minerals. Millennium then is required to pay 25% of the net proceeds to the tenement owners (Livestock Marketing Pty Ltd, Duncan Thomas Young, Simba Holdings Pty Ltd and Ronald Lane Swinney) after mining and processing cost deductions.
6. The Mineral Resources at the Camel Creek JV (CCJV) were estimated using ordinary kriging methodology by CSA Global. Only Millennium's 50% interest is stated in the above table.
7. The Mineral Resources at Beatons Creek deposit estimated using ordinary kriging methodology for grade estimation by Tetra Tech Inc. Beatons Creek is subject to a farmin- Joint Venture with Novo Resources Corp (Novo) (CSE:NVO; OTCQX:NSRPF). Under the Farm-In agreement Novo may earn a 70% interest in the Beatons Creek tenements by delivering a bankable Feasibility Study on the property within 5 years of commencement of the Agreement which was executed in August 2011. “As Novo has yet to earn an interest in the Beatons Creek tenements, the Company accounts for 100% of the Mineral Resource on the Beatons Creek tenements.
For
per
sona
l use
onl
y

OPERATIONS REVIEW
18
Competent Persons Statements – Exploration Results
Mr Irvine Hay (MAIG), a geologist employed full-time by Millennium Minerals Limited, compiled the technical aspects of this
Report. Mr Hay is a member of the Australian Institute of Geoscientists and has sufficient experience that is relevant to this style
of mineralization and type of deposit under consideration and to the activity that is being reported on to qualify as a Competent
Person as defined in the 2012 edition of the “Australasian Code for Reporting of Exploration Results, Mineral Resources and Ore
Reserves”. Mr Hay consents to the inclusion in the report of the matters in the form and context in which it appears.
Competent Persons Statements – Mineral Resources
The information in this Report which relates to the Golden Eagle, Bartons, Shearers, Otways, All Nations, Little Wonder, CC JV,
Golden Gate ABCD reef, and satellites Condor & Crow Mineral Resource estimates accurately reflects information prepared by
competent persons (as defined by the Australasian Code for Reporting of Exploration Results, Mineral Resources and Ore
Reserves). The Golden Eagle, Bartons, Shearers, Otways, All Nations, Little Wonder, Golden Gate ABCD reef, and Condor & Crow
Golden Gate satellite deposits Mineral Resource estimates have been compiled and prepared by Dr Bielin Shi, (MAusIMM) of CSA
Global Pty. Ltd. who is a Competent Person as defined by the Australasian Code for the reporting of Exploration Results, Mineral
Resources and Ore Reserves (JORC Code) 2012 Edition and who consents to the inclusion in this report of the matters based on
the information in the form and context in which it appears.
The information in this Report which relates to the Au81 Mineral Resource estimate accurately reflects information prepared by
competent persons (as defined by the Australasian Code for Reporting of Exploration Results, Mineral Resources and Ore
Reserves). The Au81 deposit Mineral Resource estimate has been compiled and prepared by Grant Louw, (MAIG, MGSSA) of CSA
Global Pty. Ltd. who is a Competent Person as defined by the Australasian Code for the reporting of Exploration Results, Mineral
Resources and Ore Reserves (JORC, 2012) and who consents to the inclusion in this report of the matters based on the
information in the form and context in which it appears.
The information in this Report which relates to the Golden Gate G reef Mineral Resource estimate accurately reflects
information prepared by competent persons (as defined by the Australasian Code for Reporting of Exploration Results, Mineral
Resources and Ore Reserves). The Golden Gate G reef deposit Mineral Resource estimate has been compiled and prepared by
Dmitry Pertel, (MAIG, MGSSA) of CSA Global Pty. Ltd. who is a Competent Person as defined by the Australasian Code for the
reporting of Exploration Results, Mineral Resources and Ore Reserves (JORC, 2012) and who consents to the inclusion in this
report of the matters based on the information in the form and context in which it appears.
The information in this Report which relates to the Golden Gate Falcon and Harrier Mineral Resource estimates accurately
reflects information prepared by competent persons (as defined by the Australasian Code for Reporting of Exploration Results,
Mineral Resources and Ore Reserves). The Golden Gate Falcon & Harrier satellite deposits Mineral Resource estimates have been
compiled and prepared by Steven Hodgson, (MAIG) formerly of CSA Global Pty. Ltd. who is a Competent Person as defined by the
Australasian Code for the reporting of Exploration Results, Mineral Resources and Ore Reserves (JORC Code) 2012 Edition and
who consents to the inclusion in this report of the matters based on the information in the form and context in which it appears.
Patrick Huxtable of Tetra Tech, Perth, Australia, has prepared the Mineral Resource Estimate for the Beatons Creek Gold
Project, and is independent of Novo Resources Corporation for purposes of National Instrument 43‐101 ‐ Standards of
Disclosure for Mineral Projects ("NI 43‐101"). Mr Huxtable (RPGeo MAIG) is a Qualified Person as defined by NI 43‐101. Mineral
resources that are not mineral reserves do not have demonstrated economic viability. The estimate of mineral resources may be
materially affected by environmental, permitting, legal, title, taxation, sociopolitical, marketing, or other relevant issues. The
quantity and grade of reported inferred resources in this estimation are uncertain in nature and there has been insufficient
exploration to define these inferred resources as an indicated or measured mineral resource and it is uncertain if further
exploration will result in upgrading them to an indicated or measured mineral resource category. The mineral resources in this
news release were estimated using current Canadian Institute of Mining, Metallurgy and Petroleum (CIM) standards, definitions
and guidelines.
For
per
sona
l use
onl
y
OPERATIONS REVIEW
19
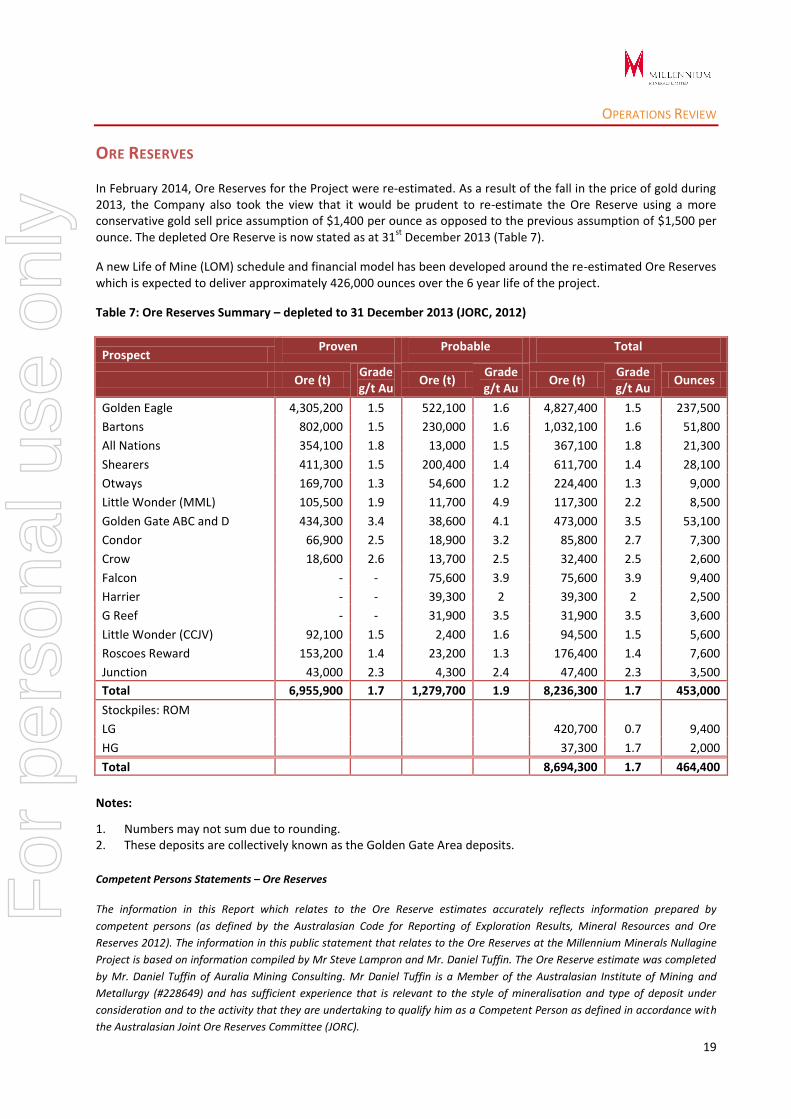
ORE RESERVES In February 2014, Ore Reserves for the Project were re-estimated. As a result of the fall in the price of gold during 2013, the Company also took the view that it would be prudent to re-estimate the Ore Reserve using a more conservative gold sell price assumption of $1,400 per ounce as opposed to the previous assumption of $1,500 per ounce. The depleted Ore Reserve is now stated as at 31
st December 2013 (Table 7).
A new Life of Mine (LOM) schedule and financial model has been developed around the re-estimated Ore Reserves which is expected to deliver approximately 426,000 ounces over the 6 year life of the project.
Table 7: Ore Reserves Summary – depleted to 31 December 2013 (JORC, 2012)
Prospect Proven
Probable
Total
Ore (t)
Grade g/t Au
Ore (t) Grade g/t Au
Ore (t) Grade g/t Au
Ounces
Golden Eagle 4,305,200 1.5 522,100 1.6 4,827,400 1.5 237,500
Bartons 802,000 1.5 230,000 1.6 1,032,100 1.6 51,800
All Nations 354,100 1.8 13,000 1.5 367,100 1.8 21,300
Shearers 411,300 1.5 200,400 1.4 611,700 1.4 28,100
Otways 169,700 1.3 54,600 1.2 224,400 1.3 9,000
Little Wonder (MML) 105,500 1.9 11,700 4.9 117,300 2.2 8,500
Golden Gate ABC and D 434,300 3.4 38,600 4.1 473,000 3.5 53,100
Condor 66,900 2.5 18,900 3.2 85,800 2.7 7,300
Crow 18,600 2.6 13,700 2.5 32,400 2.5 2,600
Falcon - - 75,600 3.9 75,600 3.9 9,400
Harrier - - 39,300 2 39,300 2 2,500
G Reef - - 31,900 3.5 31,900 3.5 3,600
Little Wonder (CCJV) 92,100 1.5 2,400 1.6 94,500 1.5 5,600
Roscoes Reward 153,200 1.4 23,200 1.3 176,400 1.4 7,600
Junction 43,000 2.3 4,300 2.4 47,400 2.3 3,500
Total 6,955,900 1.7 1,279,700 1.9 8,236,300 1.7 453,000
Stockpiles: ROM
LG 420,700 0.7 9,400
HG 37,300 1.7 2,000
Total 8,694,300 1.7 464,400
Notes:
1. Numbers may not sum due to rounding. 2. These deposits are collectively known as the Golden Gate Area deposits.
Competent Persons Statements – Ore Reserves
The information in this Report which relates to the Ore Reserve estimates accurately reflects information prepared by
competent persons (as defined by the Australasian Code for Reporting of Exploration Results, Mineral Resources and Ore
Reserves 2012). The information in this public statement that relates to the Ore Reserves at the Millennium Minerals Nullagine
Project is based on information compiled by Mr Steve Lampron and Mr. Daniel Tuffin. The Ore Reserve estimate was completed
by Mr. Daniel Tuffin of Auralia Mining Consulting. Mr Daniel Tuffin is a Member of the Australasian Institute of Mining and
Metallurgy (#228649) and has sufficient experience that is relevant to the style of mineralisation and type of deposit under
consideration and to the activity that they are undertaking to qualify him as a Competent Person as defined in accordance with
the Australasian Joint Ore Reserves Committee (JORC).
For
per
sona
l use
onl
y
OPERATIONS REVIEW
20
COMPANY STRATEGY A feature of the updated Life of Mine plan is the greater flexibility available to the Company due to the recent establishment of multiple ore sources and associated mining operations. Future mining and processing operations have available oxidised, transition and fresh ore from the Golden Eagle deposit, higher grade oxidised ore at Golden Gate deposit and substantial medium grade stockpiles located at the process plant. Proper blending of these materials will allow for more uniform head grades, gold recovery and mill throughput over the currently planned life of the Project. In addition, the remaining deposits included in the mining schedule yet to be developed will largely add oxidised and transition ore types to the mining and milling plan so the proportion of fresh ore included in the mill feed blend will progressively decrease from around 50% in 2014 -2015, to below 30% for the remaining production plan.
The Company views the current mine life of six years more than adequate as an Ore Reserve base to allow for the
future development of additional Ore Reserves from the 1.9 million ounce Mineral Resource inventory it now has.
Beyond this near term period, the Company has a highly prospective pipeline of walk-up targets within its mining
leases that show potential for further Mineral Resource development. These targets need to be drilled out over
the next two years and assessed before that potential can be determined. The benchmark is to materially increase
the Mineral Resources such that an Ore Reserve can be defined that provides the basis for an operating scale of
100,000 ounces of gold per annum over a 10 year mine life at no less than a gross operating margin of
$400/ounce. There is no guarantee that this objective will be achieved.
The Company’s tenements cover 40 kilometres of strike length, with the potential for 30 kilometres of this to be
prospective. The interval between Golden Eagle and Bartons has not been systematically drilled. Broad spaced
(>200 m) RAB traverses produced a series of robust intercepts, including 13 m at 3.55 g/t Au at Angela, 6 m at 4.7
g/t Au at Geisha and 13 m at 1.12 g/t Au at Five Mile. Further work is planned for the coming year in and around
existing deposits and on the abovementioned targets.
Brian Rear Managing Director and Chief Executive Officer Perth 28 March 2014
For
per
sona
l use
onl
y

06 CORPORATE GOVERNANCE STATEMENT
21
INTRODUCTION
The Company has systems of control and accountability as the basis for the administration of corporate governance. The Board is committed to administering the policies and procedures with openness and integrity and pursuing the true spirit of corporate governance commensurate with the Company’s needs. To the extent they are applicable; the Company has adopted the Eight Essential Corporate Governance Principles and Best Practice Recommendations (“Recommendations”) as published by ASX Corporate Governance Council. As the Company’s activities develop in size, nature and scope, including through the Nullagine Gold Project, the size of the Board and the implementation of additional corporate governance structures will be given further consideration.
The Company’s Board Charter, Code of Conduct, Trading Policy, and Company Securities policy documents have been posted on the Company’s website.
BOARD COMPOSITION AND REMUNERATION
The skills, experience and expertise relevant to the position of each Director who is in office at the date of the financial report and their term of office are detailed in the Directors' Report. There is no formal policy or procedure regarding the taking of professional advice by the independent directors; however no restrictions are placed on the independent directors to take advice on matters arising from their roles as independent directors of the company, or the reimbursement of the costs incurred by the Company. Mr Rowe, Mr Procter and Mr Gillon are considered by the Board to be independent directors. The determination by the Board as to whether individual directors are independent is a matter of judgement. In making this determination the Board has followed the guidance in Box 2.1 of the Recommendations and the Guide to Reporting on Principle 2. The Board considers the relationships the independent directors have with the company do not materially impact on their independence. In determining the materiality of these relationships, the Board has considered both quantitative and qualitative factors. In determining the quantitative factors the Board considers that a relationship is immaterial where it is equal to or less than 5% of the base amount. In applying this level of materiality to the relationship of the independent directors in the case of shareholders and suppliers, the Board considers that the independent directors’ interest is less than 5% of the base amount. In respect to the qualitative measures the Board has considered the factors affecting the independent directors’ relationship with the Company and consider these qualitative factors to be immaterial in the assessment of their independence. There is an agreed procedure by the board of directors to take independent professional advice at the expense of the Company. Disclosure as to the nature and amount of remuneration paid to the Directors of the Company is included in the Directors report and notes to the financial statements in the Company’s annual report each year. The structure and objectives of the remuneration policy and its links to the Company’s performance is disclosed in the annual Directors’ Report. The only form of retirement benefit to which non-executive directors are entitled, is superannuation.
For
per
sona
l use
onl
y

CORPORATE GOVERNANCE STATEMENT
22
BOARD COMPOSITION AND REMUNERATION (CONTINUED)
The Board has accepted the following definition of an Independent Director:
“An Independent Director is a Director who is not a member of management (a Non-Executive Director) and who:
is not a substantial shareholder of the Company or an officer of, or otherwise associated, directly or indirectly, with a substantial shareholder of the Company;
has not within the last three years been employed in an executive capacity by the Company or another group member, or been a Director after ceasing to hold any such employment;
is not a principal of a professional adviser to the Company or another group member;
is not a significant consultant, supplier or customer of the Company or another group member, or an officer of or otherwise associated, directly or indirectly, with a significant consultant, supplier or customer;
has no significant contractual relationship with the Company or another group member other than as a Director of the Company;
has not served on the Board for a period which could, or could reasonably be perceived to, materially interfere with the Director’s ability to act in the best interests of the Company; and
is free from any interest and any business or other relationship which could, or could reasonably be perceived to, materially interfere with the Director’s ability to act in the best interests of the Company.”
Millennium considers a significant consultant, supplier or customer to be material if the total of their annual invoices amounts to more than 5% of the Company’s total expenditure in that category. Consistent with the Corporations Act the Company considers that the Board should have at least three Directors and strives to have a majority of Independent Directors. Currently the Board has five directors, with four being non-executives. The board does not consider Mr Morton to be independent by virtue of his employment by a substantial shareholder (the IMC Group) and the perceived influence this may have over him. Mr Bittar is not considered to be independent as he is providing consulting services to a substantial shareholder (the IMC Group). The number of Directors is maintained at a level which optimises the spread of the workload and efficient decision making. The composition of the Board is reviewed on an ongoing basis to ensure the Board has the appropriate mix of expertise and experience. Where a vacancy exists, through whatever cause, or where it is considered that the Board would benefit from the services of a new Director with particular skills, the Board determines the selection criteria for the position based on the skills deemed necessary for the Board to best carry out its responsibilities and then appoints the most suitable candidate who must stand for election at the next general meeting of shareholders.
PERFORMANCE OF DIRECTORS
The performance of Directors is assessed through review by the Board as a whole of director’s attendance at and involvement in Board meetings, his performance and other matters identified by the Board or other directors. Due to the Board’s assessment of the effectiveness of these processes, the Board has not otherwise formalised measures of a director’s performance. The Company has not conducted a performance evaluation of the members of the Board during the reporting period. However, the Board conducts a review of the performance of the Company against budgeted targets on an ongoing basis.
For
per
sona
l use
onl
y

CORPORATE GOVERNANCE STATEMENT
23
CONFLICT OF INTEREST
In accordance with the Corporations Act 2001 and the Company’s constitution, Directors must keep the Board advised, on an ongoing basis, of any interest that could potentially conflict with those of the Company. Where the Board believes a significant conflict exists, the Director concerned does not receive the relevant Board papers and is not present at the Board meeting whilst the item is considered. Details of Directors related entity transactions with the Company are set out in the related parties note in the financial statements.
CORPORATE REPORTING
The Chief Executive Officer and Chief Financial Officer have made the following certifications to the board:
that the Company’s financial reports are complete and present a true and fair view, in all material respects, of the financial condition and operational results of the Company and are in accordance with relevant accounting standards;
that the above statement is founded on a sound system of risk management and internal compliance and control which implements the policies adopted by the Board and that the Company’s risk management and internal compliance and controls are operating efficiently and effectively in all material respects.
CODE OF CONDUCT
The Company has developed a Code of Conduct (the Code) which has been fully endorsed by the Board and applies to all directors and employees. The Code is regularly reviewed and updated as necessary to ensure it reflects the highest standards of behaviour and professionalism and the practices necessary to maintain confidence in the Company’s integrity. The Code of Conduct appears on the company’s website. In summary, the Code requires that at all times all company personnel act with the utmost integrity, objectivity, in the best interests of the Company and in compliance with the letter and the spirit of the law and company policies. Any breaches of the Code are reported to the Chairman in the first instance for notification to the Board. The directors are satisfied that the Company has complied with its policies on ethical standards, including trading in securities.
CONTINUOUS DISCLOSURE AND SHAREHOLDER COMMUNICATION
The Company has a policy that information concerning the Company that a reasonable person would expect to have a material effect on the price of the Company’s securities is continuously disclosed as required under the Australian Securities Exchange (ASX) listing rules. The Company encourages communication with shareholders and the attendance and effective participation by shareholders at general meetings. F
or p
erso
nal u
se o
nly

CORPORATE GOVERNANCE STATEMENT
24
CONTINUOUS DISCLOSURE AND SHAREHOLDER COMMUNICATION (CONTINUED)
The Company Secretary has been nominated as the person responsible for communications with the ASX. This role includes responsibility for ensuring compliance with the continuous disclosure requirements of the ASX Listing Rules and overseeing and co-coordinating information disclosure to the ASX, analysts, brokers, shareholders, the media and the public.
All information disclosed to the ASX is posted on the company’s website as soon as it is disclosed to the ASX. Annual and half yearly reports are made available on the company’s website and mailed to those shareholders who request a hard copy.
EXPLANATIONS FOR DEPARTURES FROM BEST PRACTICE RECOMMENDATIONS
Principle 1 recommendation 1.1, 1.2, 1.3
Notification of Departure: The Company has not:
(1) formally disclosed the functions reserved to the Board and those delegated to management;
(2) the process for evaluating the performance of senior executives; and
(3) whether a performance evaluation for senior executives has taken place in the reporting period and whether it was in accordance with the process which is to be disclosed.
Explanation for Departure: The Board recognises the importance of distinguishing between the respective roles and responsibilities of the Board and management, and evaluating the performance of senior executives. The Board has established a framework for the management of the Company and the roles and responsibilities of the Board and management. Previously, due to the small size of the Board and of the Company, the Board did not think that it was necessary to formally document the roles of the Board and management as these roles were clearly understood by all members of the Board and management. The Board is responsible for the strategic direction of the Company, establishing goals for management and monitoring the achievement of these goals, monitoring the overall corporate governance of the Company and ensuring that shareholder value is increased.
Principle 2 Recommendation 2.4
Notification of Departure: The full Board carries out the role of a nomination committee. The Board has not adopted a charter relevant to the specific functions of a nomination committee. The Board does have a separate remuneration committee to oversee recruitment, performance and remuneration at CEO and senior management levels. Explanation for Departure: The Board considers that no efficiencies or other benefits would be gained by establishing a separate nomination committee. In the future, as the company grows and increases in size and level of activity including through the Nullagine Gold Project, the Board will reconsider the establishment of a separate nomination committee. F
or p
erso
nal u
se o
nly
CORPORATE GOVERNANCE STATEMENT
25
EXPLANATIONS FOR DEPARTURES FROM BEST PRACTICE RECOMMENDATIONS (CONTINUED) Principle 2 Recommendation 2.5
Notification of Departure: The Company has not disclosed the process for evaluating the performance of the board and of individual directors. Explanation for Departure: The Board considers that at this time no efficiencies or other benefits would be gained by introducing formal evaluations. In the future, as the company grows and increases in size and activity, the Board will consider the establishment of formal board and individual director evaluation processes.
Principle 2 Recommendation 2.6
Notification of Departure: A performance evaluation for the board and directors has not taken place in the reporting period. Explanation for Departure: The Board considers that at this time no efficiencies or other benefits would be gained by introducing formal evaluations. In the future, as the Company grows and increases in size and activity, the Board will consider the establishment of formal board and individual director evaluation processes.
Principle 6 Recommendation 6.1, 6.2
Notification of Departure: The Company does not have a formal documented Shareholder communication policy. Explanation for Departure: The Company encourages shareholders to communicate with the Company and the Board. General meetings provide a deeper insight into the Company and an opportunity for shareholders to have their questions answered. As the Company grows in size, the board is very keen to develop more formal and expansive communications with shareholders.
Principle 7 Recommendation 7.1
Notification of Departure: The Company has not disclosed its risk management policies and assessment framework. Explanation for Departure: While the Company has informal risk management policies and frameworks, it is in the process of formalizing these, and they will then be placed on the Company’s website.
INDEPENDENT PROFESSIONAL ADVICE AND ACCESS TO COMPANY INFORMATION
Each Director has the right of access to all relevant Company information and to the Company’s executives and, subject to prior consultation with the Chairman, may seek independent professional advice at the Company’s expense. A copy of advice received by the Director is made available to all other members of the Board.
For
per
sona
l use
onl
y

CORPORATE GOVERNANCE STATEMENT
26
REMUNERATION
The Board of Directors maintains remuneration policies which are aimed at attracting and retaining a motivated workforce and management team. The intention is to match the outcomes from the remuneration system with the performance of the Company and ultimately the value received by our shareholders on a long-term basis.
The Company embodies the following principles in its remuneration framework:
retention and motivation of key executives;
attraction of quality management to the Company; and
performance incentives which allow executives to share the rewards of the success of the Company.
Full details of Directors’ and specified executives’ remuneration is set out in the Directors’ Report and in the Directors’ and Executives’ Disclosures note in the financial statements.
ETHICS
It is the policy of Millennium that all Directors, managers and employees are expected to act with the utmost integrity and objectivity, striving at all times to enhance the reputation and performance of Millennium.
RISK MANAGEMENT
The Company has in place a framework to safeguard company assets and ensure that business risks are identified and properly managed. The Company has in place a number of risk management controls which include the following:
Budget controls;
Guidelines and limits for the commitment of funds for operating expenditure, capital expenditure and investments;
A comprehensive insurance programme;
Monitoring the status of Mining Tenements; and
Compliance with continuous disclosure obligations. Management is required to provide to the Board regular reports on all these matters. The Board receives regular reports about the financial condition and operating results of the Company. The Chief Executive Officer and the Chief Financial Officer annually provide a formal statement to the Board that in all material respects and to the best of their knowledge and belief:
the Company’s financial reports present a true and fair view of the Company’s financial condition and operational results and are in accordance with relevant accounting standards; and
the Company’s risk management and internal control systems are sound, appropriate and operating efficiently and effectively. F
or p
erso
nal u
se o
nly

CORPORATE GOVERNANCE STATEMENT
27
TRADING IN THE COMPANY’S SECURITIES BY DIRECTORS AND EMPLOYEES
The Board has adopted a policy in relation to dealings in the Company’s securities which applies to all directors and employees. Under the policy, directors are prohibited from short term or “active” trading in the Company’s securities and directors and employees are prohibited from dealing in the Company’s securities whilst in possession of price sensitive information. The Chairman or Company Secretary must be notified of any proposed transaction.
ROLE OF SHAREHOLDERS
The shareholders of the Company play an important role in corporate governance by virtue of their responsibilities for voting on the appointment of directors. The Board ensures that shareholders are kept fully informed on developments affecting the Company through:
the Annual Report;
compliance with Australian Securities Exchange’s continuous disclosure requirements (and subsequent shareholder announcements); and
the annual general meeting and other meetings called to obtain approval for Board action.
DIVERSITY – BOARD COMPOSITION
The mix of skills and diversity for which the company is looking to achieve in membership of the board is one that is as diverse as practicable given the size and scope of the company’s operations.
DIVERSITY – MEASURABLE OBJECTIVES
The company’s primary objectives with regard to diversity are as follows:
the company’s composition of board, executive, management and employees to be as diverse as practicable; and
to provide equal opportunities for all positions within the company and continue the company’s commitment to employment based on merit.
Primary objectives set by the company with regard to diversity have been met, as described below:
blend of skills – wide range of backgrounds: geology, mining, exploration, finance and corporate experience
cultural backgrounds
gender
age The above points relate to the composition of the board and the company.
DIVERSITY – ANNUAL REPORTING
The company’s annual reporting on the percentage of females in the organisation is as follows:
Percentage of Females
Employees 17.5%
Executives and Board Members -
For
per
sona
l use
onl
y

16 FINANCIAL REPORTS
28
CONTENTS
29 Directors Report
38 Remuneration Report (Audited)
44 Auditor’s Independence Declaration
45 Statement of Profit and Loss and Other Comprehensive Income
46 Statement of Financial Position
47 Statement of Changes in Equity
48 Cash Flow Statement
49 Notes to the Financial Statements
77 Directors’ Declaration
78 Independent Auditor’s Report
80 Supplementary Information
For
per
sona
l use
onl
y

DIRECTORS’ REPORT
29
The Directors of Millennium Minerals Limited (“Company” or “Millennium”) present their report on the Company for the financial year ended 31 December 2013.
DIRECTORS
The names of the Company’s directors in office during the financial year and up to the date of this report are as below. Directors were in office for this entire period unless otherwise indicated.
Peter Rowe (Non-executive Chairman)
Brian Rear (Managing Director and Chief Executive Officer) appointed as Managing Director on 21 June 2013
Ross Gillon (Non-executive Director)
John Morton (Non-executive Director), appointed on 21 June 2013
Richard Procter (Non-executive Director)
Simon Durack (Non-executive Director) retired on 30 June 2013
Gregory Bittar (Non-executive Director), appointed 19 March 2014
NATURE OF OPERATIONS AND PRINCIPAL ACTIVITIES
The principal activities of the Company during the financial year were mining and processing of gold, undertaking exploration activities and development of mining projects.
There has been no significant change in the nature of those activities during the year.
FINANCIAL POSITION AND PERFORMANCE
Revenue from operations was $103.31 million.
C1 cash cost2 during the year was $910 per ounce and sustaining cash cost
3 was $1,071 per ounce.
Reported net profit after tax attributable to members of $41.7 million.
“In the money” hedge book was value at $14.6 million as at 31 December 2013 (mark-to-market at a gold spot price of $1,352 per ounce) based on remaining 62,100 ounces hedged at an average price pf $1,627per ounce.
As of 31 December 2013, the Company has repaid approximately 32% of the outstanding principal on the senior project finance facility and equipment lease facilities.
Net financing outflows of $11.9 million included $6.6 million raised in a fully underwritten rights issue. Repayments of $16.8 million made against debt and lease facilities and interest payments of $3.4 million.
1 All currency amounts are Australian dollars unless otherwise denoted
2 C1 Cash Costs represents the costs for mining, processing, administration, by-product credits and the accounting movements for stockpiles, gold-
in-circuit and waste stripping. It does not include sustaining capital costs, mine development, exploration, royalties or corporate administration costs. 3 Sustaining cost per ounce includes C1 cash cost, royalties, sustaining capital expenditure and corporate administration costs. It does not include
exploration or mine development expenditure.
For
per
sona
l use
onl
y
DIRECTORS’ REPORT
30
DIVIDENDS
No dividend was paid during the financial year and the directors do not recommend payment of a dividend.
REVIEW OF OPERATIONS
The Company gold production for the year was 63,247 ounces.
SIGNIFICANT CHANGES IN THE STATE OF AFFAIRS
In the opinion of the Directors, there were no other significant changes to the state of affairs of the Company that occurred during the financial year under review not otherwise disclosed in this report or the financial statements.
SIGNIFICANT EVENTS AFTER REPORTING DATE
On 10 March 2014, the Company announced an updated ore reserve of 464,000 ounces. This represented a reduction from the previously released ore reserve due to mining depletion and the use of a lower gold price of $1,400 vs $1,500 previously.
On 19 March 2014, the Company announced updated Life of Mine plan metrics and provided guidance for calendar year 2014. The Life of Mine plan forecasts 426,000 ounces of gold production over a six year mine life at a C1 cash cost of $989 per ounce and a sustaining cash cost of $1,160 per ounce. Guidance for calendar year 2014 is 76,000 ounces at a processing throughput rate of 1.6 million tonnes milled. C1 cash costs for calendar year 2014 are forecast to be $975 per ounce and sustaining unit cash cost of $1,140 per ounce.
On 19 March 2014 the Company announced that a $7 million subordinated working capital facility (Facility) had been agreed with major shareholder, the IMC Group (IMC). The Facility is subordinated to the Senior Facility Agreement (the “Senior Facility”) that Millennium currently has with BNP Paribas and National Australia Bank and to the Finance Lease facility provided by National Australia Bank. The Facility is unsecured and attracts fees and an interest rate typical for a facility of this nature. In consideration of the provision of the Facility, Millennium will issue 10 million three year options to IMC. The exercise price will be the lower of the ten day VWAP following the release by Millennium of the updated Life of Mine (LOM) metrics and 2014 guidance and the price of any substantial capital raising undertaken by Millennium in the future. The maturity date of the Facility is 30 days following the repayment in full of the Senior Facility unless repaid earlier as a result of a refinancing.
On 19 March 2014 the Company announced the appointment of Gregory Bittar as a Non-Executive Director. Mr Bittar’s appointment was proposed by IMC Group, the company’s major shareholder. Mr Bittar is an advisor to IMC in relation to its investment in Millennium, including in relation to the Facility.
On 28 March 2014, the Company’s senior debt providers agreed an extension to the previous waiver and subject to final documentation and various conditions, to revise the schedule of principal repayments and the maturity date of the Senior Facility. The revised schedule of principal repayments for 2014, 2015 and 2016 is $13.0 million, $11.9 million and $6.1 million respectively. The previous repayment profile that was in existence at 31 December 2014 that governed the current versus non-current classification of the liability in the statement of financial position was $26.4 million for 2014 and $4.6 million for 2015. This restructure significantly improves the working capital position of the company. The restructure incorporates an extension of the facility by 9 months to June 2016 and up to 70,000 ounces of additional hedging over the life of the facility. After the additional hedging, the company will have approximately 130,000 ounces hedged which represents approximately 28% for the Company’s ore reserve.
For
per
sona
l use
onl
y
DIRECTORS’ REPORT
31
LIKELY DEVELOPMENTS AND EXPECTED RESULTS
Subject to weather events, two further milling campaigns of Golden Gate oxide ore are expected to be milled during the March 2014 Quarter, amounting to approximately 75,000 tonnes in total.
Better understanding of the fresh ore zones, improved dilution control from mining activity and the availability of oxide and transition material from development of the stage 2 pit in Golden Eagle is expected to improve future operating performance.
Guidance for calendar 2014 is for gold production of 76,000 ounces at a processing throughput rate of 1.6 million tonnes milled. C1 cash costs for calendar year 2014 are forecast to be $975 per ounce and sustaining unit cash cost of $1,140 per ounce.
The Company currently expects gold production for the March 2014 quarter to be between 16,000 ounces and 18,000 ounces. This includes an allowance for weather impacts that occurred during January and February this year.
ENVIRONMENTAL REGULATIONS AND PERFORMANCE
The Company’s operations are subject to environmental regulation under the laws of the Commonwealth and of the State, with specific conditions relating to rehabilitation.
In the case of Approved Notices of Intent to Mine, bonds are held by the Company’s bank which may be released to the Company when Department of Minerals and Energy is satisfied that conditions imposed on those licences have been met.
Notices of Intent to Mine incorporate environmental conditions, including those related to noise, dust, water run-off, rare and endangered flora and fauna, sites of historical and aboriginal significance as well as rehabilitation criteria.
The Directors advise that during the year ended 31 December 2013, no claim has been made by any competent authority that any environmental issues condition of licence or notice of intent have been breached, or any bond forfeited.
INFORMATION ON DIRECTORS AND OFFICERS
Particulars of the qualifications and experience of each person who was a Director during the year ended 31 December 2013 and up to the date of this report are set out below:
Director Experience and expertise Listed entity directorship in last three years Special responsibilities
Peter Rowe
Independent Non-Executive Chairman Appointed on 21 July 2009
Mr Rowe has broad international mining industry experience gained over a 35 year career based mainly in Australia and South Africa. Following 20 years with Anglo American and De Beers, he moved to Australia in the early 1990s.
Mr Rowe was project director of the
Fimiston Expansion (Kalgoorlie Superpit),
general manager of the Boddington Gold
Mine and of the Boddington Expansion
Project and managing director and CEO of
Bulong Nickel.
Non-Executive Director of Adamus Resources Limited – resigned December 2011
Non-Executive Director of Ammtec Limited – resigned November 2010
Non-Executive Director of Kimberley Rare Earths Limited – resigned November 2011
Member of the Audit Committee
Member of the Remuneration Committee F
or p
erso
nal u
se o
nly

DIRECTORS’ REPORT
32
INFORMATION ON DIRECTORS AND OFFICERS (CONTINUED)
Director Experience and expertise Listed entity directorship in last three years Special responsibilities
Peter Rowe (continued)
He headed up AngloGold Ashanti Australia and recently retired from his position as executive vice president - business effectiveness based In South Africa.
Mr Rowe holds a chemical engineering degree and is a Fellow of the AusIMM and of the Australian Institute of Company Directors.
Non-Executive Director of ENK plc – resigned November 2012
Brian Rear
Managing Director and Chief Operating Officer
Appointed on 21 June 2013
Mr Rear is a graduate of the Western Australian School of Mines (AWASM Metallurgy), The Royal School of Mines (MSc London, Mineral Process Design, DIC) and holds a Masters Degree in Business Leadership from the Business School of the University of South Africa.
He is a member of the Australian Institute of Company Directors. He has extensive international experience in process engineering, project development and company management having successfully developed three green-field projects and the turnaround of a fourth covering base metals and thermal coal.
His career includes stints with Rio Tinto, Anglo Vaal Limited, Straits Resources (founding director and CEO) and CopperCo Limited covering commodities as diverse as thermal coal, gold, uranium, base metals and industrial minerals. Mr Rear has accumulated significant experience in the development and in the operation of copper heap leach SX-EW projects, feasibility studies and project finance.
He has work experience in Papua New Guinea, Indonesia, Southern Africa, United Kingdom, East Asia and Australia.
Non-Executive Director of Queensland Mining Corporation Limited – resigned April 2013
None
For
per
sona
l use
onl
y
DIRECTORS’ REPORT
33
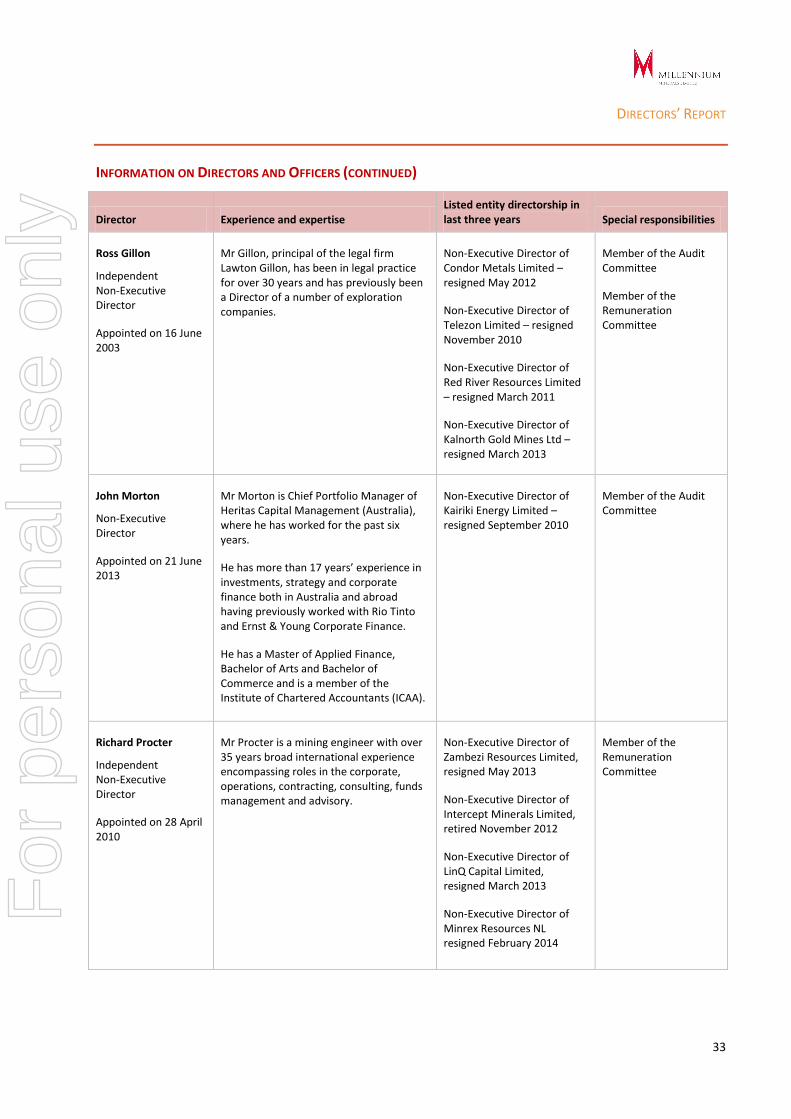
INFORMATION ON DIRECTORS AND OFFICERS (CONTINUED)
Director Experience and expertise Listed entity directorship in last three years Special responsibilities
Ross Gillon
Independent Non-Executive Director
Appointed on 16 June 2003
Mr Gillon, principal of the legal firm Lawton Gillon, has been in legal practice for over 30 years and has previously been a Director of a number of exploration companies.
Non-Executive Director of Condor Metals Limited – resigned May 2012
Non-Executive Director of Telezon Limited – resigned November 2010
Non-Executive Director of Red River Resources Limited – resigned March 2011
Non-Executive Director of Kalnorth Gold Mines Ltd – resigned March 2013
Member of the Audit Committee
Member of the Remuneration Committee
John Morton
Non-Executive Director
Appointed on 21 June 2013
Mr Morton is Chief Portfolio Manager of Heritas Capital Management (Australia), where he has worked for the past six years.
He has more than 17 years’ experience in investments, strategy and corporate finance both in Australia and abroad having previously worked with Rio Tinto and Ernst & Young Corporate Finance.
He has a Master of Applied Finance, Bachelor of Arts and Bachelor of Commerce and is a member of the Institute of Chartered Accountants (ICAA).
Non-Executive Director of Kairiki Energy Limited – resigned September 2010
Member of the Audit Committee
Richard Procter
Independent Non-Executive Director
Appointed on 28 April 2010
Mr Procter is a mining engineer with over 35 years broad international experience encompassing roles in the corporate, operations, contracting, consulting, funds management and advisory.
Non-Executive Director of Zambezi Resources Limited, resigned May 2013
Non-Executive Director of Intercept Minerals Limited, retired November 2012
Non-Executive Director of LinQ Capital Limited, resigned March 2013
Non-Executive Director of Minrex Resources NL resigned February 2014
Member of the Remuneration Committee
For
per
sona
l use
onl
y

DIRECTORS’ REPORT
34
INFORMATION ON DIRECTORS AND OFFICERS (CONTINUED)
Director Experience and expertise Listed entity directorship in last three years Special responsibilities
Richard Procter (continued)
He has held senior industry positions that have demonstrated leadership and management of base and precious metal mining companies (both underground and open pit); development of project assessments including definitive/bankable feasibility studies and their conversion into mining operations; managed teams undertaking mining asset evaluations and valuations, including technical and operational audits (encompassing complete mining asset due diligence, M & A and expert reports).
He also has been involved in many mining operation start-ups (both small and large) - as well as the re-engineering of large ongoing operations.
Mr Procter has an MBA, is a Chartered Engineer (MIMMM) and has a BSc(Eng)
Gregory Bittar
Independent Non-Executive Director
Appointed on 19 March 2014
Mr Bittar has a Bachelor Economics and Bachelor of Laws (University of Sydney) and Masters in Finance (London Business School), and has over 15 years investment banking and mining resource sector experience in Australia and overseas - having worked for Bankers Trust, Baring Brothers Burrows and following the completion of his Masters in Finance in 2000, he joined Morgan Stanley, working in London, Melbourne and Sydney.
He has extensive experience in public and private markets mergers and acquisitions, capital markets and strategic advisory assignments across a range of sectors including general industrials, metals and mining, mining services and energy. Since leaving Morgan Stanley in 2010, Mr Bittar has had a number of roles in the resources sector, in both management and
consulting roles.
Managing Director of Sherwin Iron Limited – resigned July 2011
None
For
per
sona
l use
onl
y

DIRECTORS’ REPORT
35
INFORMATION ON DIRECTORS AND OFFICERS (CONTINUED)
Director Experience and expertise Listed entity directorship in last three years Special responsibilities
Simon Durack
Non-Executive Director
Appointed on 2 February 2009
Resigned on 30 June 2013
Mr Durack is an experienced Chartered
Accountant, practicing Company Secretary
and Director, and brings to the Company
over 30 years commercial experience
gained working in Australia, South East
Asia and Europe.
Mr Durack has held many senior Financial,
Secretarial and Director positions with
both large public and private entities in a
diverse range of industries.
Non-Executive Director of Minrex Resources NL – appointed May 2011
Member of the Audit Committee
COMPANY SECRETARY
Mr Pierre Malherbe
BCom(Acc), BCom(InvMgt), MCom (Company Secretary – Appointed 16 April 2010)
Mr Malherbe previously served as Chief Financial Officer of the Company before being appointed Company Secretary on 16 April 2010 and has a sound knowledge of the Company and its operations. Mr Malherbe's experience both in South Africa and Australia includes 25 years in the Investment Banking, Finance and Mining industries gained with some of the major banks in South Africa where he held senior financial and managerial positions within these Banks and was responsible for managerial, transactional and financial input across all spectrums, including: mining, construction, aviation and other capital intensive projects as well as senior management positions within mining and financial industries in Australia. In addition, Mr Malherbe holds a Master of Business Management (Master of Commerce) postgraduate degree from the University of Johannesburg, an Honours degree majoring in Accounting - Bachelor of Commerce (Hons)(Acc) and a Bachelor of Commerce Investment Management degree from the University of Johannesburg.
For
per
sona
l use
onl
y
DIRECTORS’ REPORT
36
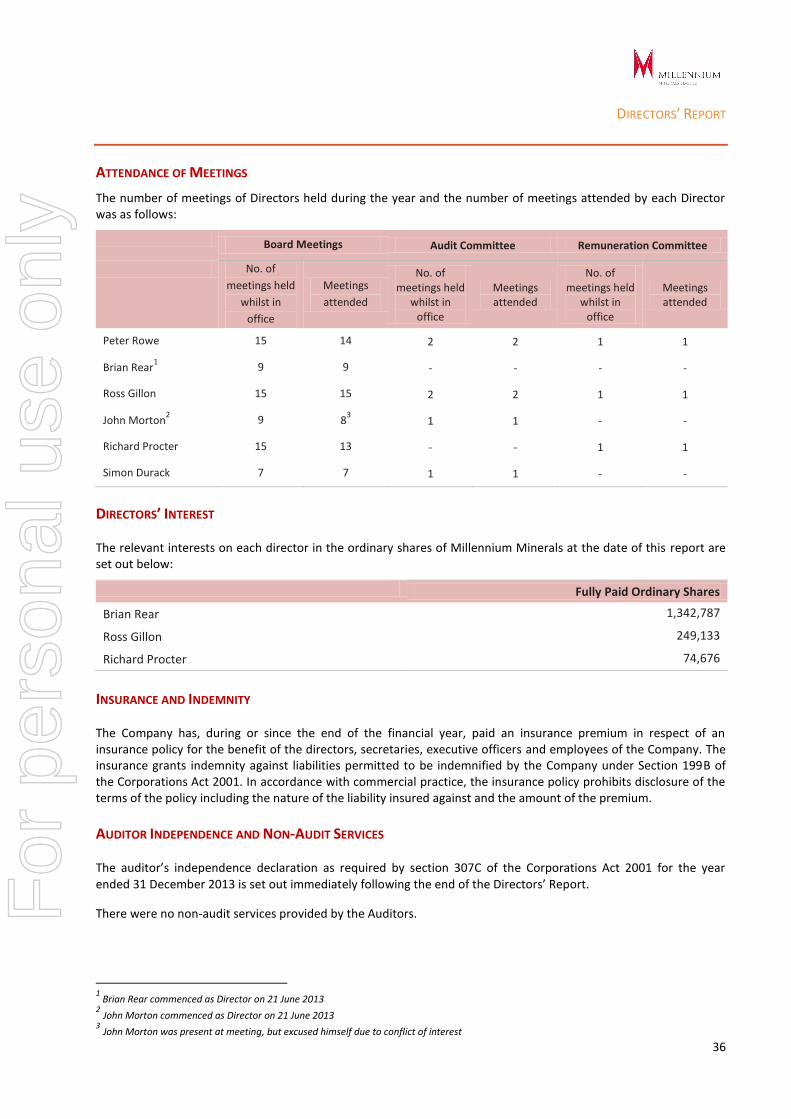
ATTENDANCE OF MEETINGS
The number of meetings of Directors held during the year and the number of meetings attended by each Director was as follows:
Board Meetings Audit Committee Remuneration Committee
No. of
meetings held
whilst in
office
Meetings
attended
No. of meetings held
whilst in office
Meetings attended
No. of meetings held
whilst in office
Meetings attended
Peter Rowe 15 14 2 2 1 1
Brian Rear1 9 9 - - - -
Ross Gillon 15 15 2 2 1 1
John Morton2 9 8
3 1 1 - -
Richard Procter 15 13 - - 1 1
Simon Durack 7 7 1 1 - -
DIRECTORS’ INTEREST The relevant interests on each director in the ordinary shares of Millennium Minerals at the date of this report are set out below:
Fully Paid Ordinary Shares
Brian Rear 1,342,787
Ross Gillon 249,133
Richard Procter 74,676
INSURANCE AND INDEMNITY The Company has, during or since the end of the financial year, paid an insurance premium in respect of an insurance policy for the benefit of the directors, secretaries, executive officers and employees of the Company. The insurance grants indemnity against liabilities permitted to be indemnified by the Company under Section 199B of the Corporations Act 2001. In accordance with commercial practice, the insurance policy prohibits disclosure of the terms of the policy including the nature of the liability insured against and the amount of the premium.
AUDITOR INDEPENDENCE AND NON-AUDIT SERVICES The auditor’s independence declaration as required by section 307C of the Corporations Act 2001 for the year ended 31 December 2013 is set out immediately following the end of the Directors’ Report.
There were no non-audit services provided by the Auditors.
1 Brian Rear commenced as Director on 21 June 2013
2 John Morton commenced as Director on 21 June 2013
3 John Morton was present at meeting, but excused himself due to conflict of interest
For
per
sona
l use
onl
y
DIRECTORS’ REPORT
37
ROUNDING OF AMOUNTS The Company has applied the relief available to it In Australian Securities and investments Commission (ASIC) Class Order 98/0100 and accordingly certain amounts in the financial report and the Directors’ Report have been rounded to the nearest $1,000.
REMUNERATION REPORT The Remuneration Report which has been audited is set out on pages 38 to 43 and forms part of the Directors Report. Signed in accordance with a resolution of the Directors.
Peter Rowe Brian Rear Chairman Managing Director and Chief Executive Officer Perth Perth 28 March 2014 28 March 2014
For
per
sona
l use
onl
y
REMUNERATION REPORT (AUDITED)
38
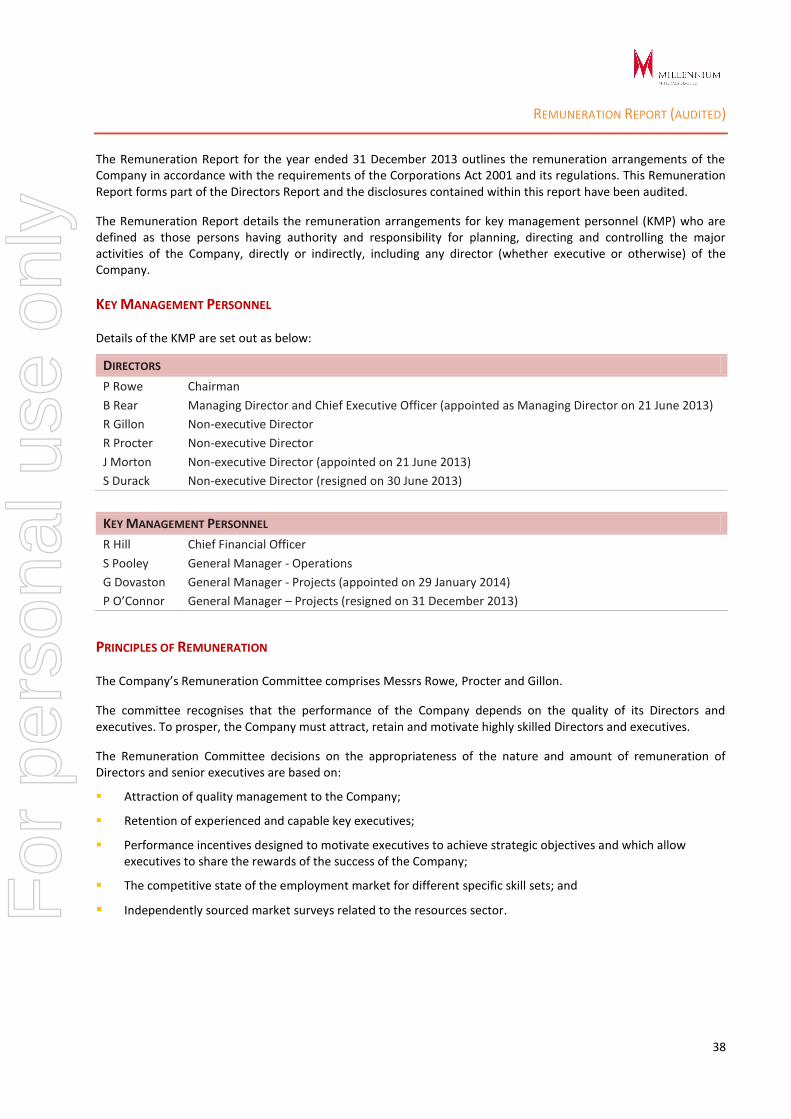
The Remuneration Report for the year ended 31 December 2013 outlines the remuneration arrangements of the Company in accordance with the requirements of the Corporations Act 2001 and its regulations. This Remuneration Report forms part of the Directors Report and the disclosures contained within this report have been audited.
The Remuneration Report details the remuneration arrangements for key management personnel (KMP) who are defined as those persons having authority and responsibility for planning, directing and controlling the major activities of the Company, directly or indirectly, including any director (whether executive or otherwise) of the Company.
KEY MANAGEMENT PERSONNEL Details of the KMP are set out as below:
DIRECTORS
P Rowe Chairman
B Rear Managing Director and Chief Executive Officer (appointed as Managing Director on 21 June 2013)
R Gillon Non-executive Director
R Procter Non-executive Director
J Morton Non-executive Director (appointed on 21 June 2013)
S Durack Non-executive Director (resigned on 30 June 2013)
KEY MANAGEMENT PERSONNEL
R Hill Chief Financial Officer
S Pooley General Manager - Operations
G Dovaston General Manager - Projects (appointed on 29 January 2014)
P O’Connor General Manager – Projects (resigned on 31 December 2013)
PRINCIPLES OF REMUNERATION The Company’s Remuneration Committee comprises Messrs Rowe, Procter and Gillon.
The committee recognises that the performance of the Company depends on the quality of its Directors and executives. To prosper, the Company must attract, retain and motivate highly skilled Directors and executives.
The Remuneration Committee decisions on the appropriateness of the nature and amount of remuneration of Directors and senior executives are based on:
Attraction of quality management to the Company;
Retention of experienced and capable key executives;
Performance incentives designed to motivate executives to achieve strategic objectives and which allow executives to share the rewards of the success of the Company;
The competitive state of the employment market for different specific skill sets; and
Independently sourced market surveys related to the resources sector. For
per
sona
l use
onl
y

REMUNERATION REPORT (AUDITED)
39
REMUNERATION STRUCTURE
FIXED REMUNERATION
The structure of non-executive Director and senior executive remuneration is separate and distinct.
Fixed remuneration of non-executive Directors comprises fees determined having regard to industry practice and the need to attract appropriately qualified persons. Fees do not contain any non-monetary elements.
Fixed remuneration of senior executives comprises base remuneration (including any fringe benefits tax charges related to employee benefits) and employer contributions to superannuation funds.
Remuneration levels are reviewed by the Remuneration Committee and are determined after consideration is given to individual and overall performance of the Company, to competitive commercial rates of remuneration for similar levels of responsibility, industry practices and the need to retain appropriately qualified persons to fill the management positions necessary for the Company to meet its strategic objectives.
PERFORMANCE LINKED REMUNERATION
Performance linked remuneration includes both short term and long-term incentives and is designed to reward key management personnel for meeting or exceeding their objectives.
SHORT TERM INCENTIVES
Each year the executives of the Company review the performance of the key management personnel and make recommendations to the Remuneration Committee in relation to the awarding of any short-term incentives.
In addition, the Remuneration Committee assess the actual performance of the Company, the separate departments and the individuals' personal performance. A cash bonus may be recommended at the discretion of the Remuneration Committee where Company and department objectives have been met or exceeded or individual personal performance expectations have been exceeded.
LONG TERM INCENTIVES
Performance rights are issued under the Performance Rights Plan. Performance rights are rights to acquire ordinary shares subject to the satisfaction of specified performance conditions in a specified performance period. The objective of the Performance Rights Plan is to link the achievement of the Company's operational targets with the remuneration received by the key management personnel charged with meeting those targets. The total potential long term incentive available is set at a level so as to provide sufficient incentive to the key management personnel to achieve the operational targets such that the cost to the Company is reasonable in the circumstances.
Each year the Remuneration Committee reviews the objectives of the company and makes a recommendation to the Board to grant rights to acquire ordinary shares subject to the satisfaction of specified performance conditions within a specified performance period.
For
per
sona
l use
onl
y

REMUNERATION REPORT (AUDITED)
40
REMUNERATION STRUCTURE (CONTINUED)
LONG TERM INCENTIVES (CONTINUED)
Criteria used by the Remuneration Committee to set performance conditions for rights and to assess the performance of directors and executives may include historical and current earnings, gold production, operating costs and safety performance, execution of development projects, exploration success and growth of the business through acquisitions.
The Remuneration Committee recommends the rights to be granted to executives for approval by the Board. The Board grants the rights by giving further consideration to the seniority of the employee’s position, the ability of the employee to impact the achievement of the company’s objectives and the need to retain highly qualified employees and executive team. The granting of rights is in substance a performance incentive which allows employees to share the rewards of the success of the Company.
Assessment is made by the Remuneration Committee regarding the achievement of the performance conditions and a recommendation is provided to the Board detailing the number of rights to vest into ordinary shares that is commensurate with the level of achievement of the predetermined performance conditions. The Board approves the vesting of rights into shares and all unvested rights are subsequently cancelled.
During the current year no rights were granted to key management personnel.
DIRECTORS AND KEY MANAGEMENT REMUNERATION Details of remuneration of each Director of Millennium, including their personally-related entities, for the year ended 31 December 2013 are set out as follows:
Post
Employment Long Term
Equity
Compensation
YearCash salary and
fees Cash bonus
Non-Monetary
Benefits
Super-
annuation
Long Service
Leave
Value of share
options Total$ $ $ $ $ $ $
Executive Director
2013 464,090 45,100 - 25,000 - - 534,19095% 5%
2012 392,250 - - 28,817 - 538,953 960,02093% 7%
Short Term
Mr B Rear (1)
For
per
sona
l use
onl
y

REMUNERATION REPORT (AUDITED)
41
DIRECTORS AND KEY MANAGEMENT REMUNERATION (CONTINUED)
Post
Employment Long Term
Equity
Compensation
YearCash salary and
fees Cash bonus
Non-Monetary
Benefits
Super-
annuation
Long Service
Leave
Value of share
options Total$ $ $ $ $ $ $
Non-Executive Directors
2013 82,474 - - 7,526 - - 90,00092% 8%
2012 75,688 - - 6,812 - - 82,50091% 9%
2013 60,000 - - - - - 60,000
2012 55,000 - - - - - 55,000
2013 60,000 - - - - - 60,000
2012 55,000 - - - - - 55,000
2013 30,000 - - - - - 30,000
2012 - - - - - -
2013 30,000 - - - - - 30,000
2012 55,000 - - - - - 55,000
Key Management Personnel
2013 275,000 13,750 26,331 315,08191% 9%
2012 226,529 20,387 231,016 477,93291% 9%
2013 362,600 33,087 395,68792% 8%
2012 347,630 72,883 31,287 320,208 772,00891% 9%
2013 454,262 26,705 32,820 50,689 564,47693% 7%
2012 341,330 30,720 320,208 692,25891% 9%
(1) Mr Rear was appointed to the role of Managing Director and Chief Executive Officer on 21 June 2013.
(2) Mr Morton commenced with the Company in the role of Non-Executive Director on 21 June 2013.
(3) Mr Durack res igned from the Company in the role of Non-Executive Director on 30 June 2013.
(4) Mr Hi l l commenced with the Company in the role of Chief Financia l Officer on 9 January 2012.
(5) Mr O'Connor res igned from the Company in the role of Genera l Manager Projects on 31 December 2013.
Mr S Durack (3)
Mr R Hill (4)
Mr S Pooley
Mr P O'Connor (5)
Short Term
Mr P Rowe
Mr R Gillon
Mr R Procter
Mr J Morton (2)
For
per
sona
l use
onl
y
REMUNERATION REPORT (AUDITED)
42
KEY MANAGEMENT EMPLOYMENT CONTRACTS
The Chief Executive Officer, Brian Rear, is employed under contract. His current employment contract commenced on May 2009 and there is no termination date. Under the terms of the contract:
Mr Rear may resign from his position and thus terminate this contract by giving 6 months written notice.
The Company may terminate this employment agreement by providing 6 months written notice or provide payment in lieu of the notice period (based on the fixed component of Mr Rear’s remuneration)
Mr Rear accrues 4 weeks of annual leave entitlements per year and 8 weeks of long service leave entitlements after 5 years, with an entitlement to a pro-rata amount if the employment is terminated after 3 years. Long service leave will accrue at the rate of 1.6 weeks per every year thereafter.
Mr Hill (Chief Financial Officer) is employed under a standard rolling employment contract. His current employment contract commenced on 9 January 2012 and there is no termination date. Under the terms of the contract:
Mr Hill may resign from his position and thus terminate this contract by giving 4 weeks written notice.
The Company may terminate this employment agreement by providing 4 weeks written notice or provide payment in lieu of the notice period (based on the fixed component of Mr Hill’s remuneration)
Mr Hill accrues 4 weeks of annual leave entitlements per year and 8.7 weeks of long service leave entitlements after 7 years and 1.24 weeks per every year thereafter.
Mr Pooley (General Manager - Operations) is employed under a standard rolling employment contract. His current employment contract commenced on 1 March 2010 and there is no termination date. Under the terms of the contract:
Mr Pooley may resign from his position and thus terminate this contract by giving 3 months written notice.
The Company may terminate this employment agreement by providing 3 months written notice or provide payment in lieu of the notice period (based on the fixed component of Mr Pooley’s remuneration)
Mr Pooley accrues 4 weeks of annual leave entitlements per year and 8 weeks of long service leave entitlements after 5 years, with an entitlement to a pro-rata amount if the employment is terminated after 3 years.
Mr O’Connor (General Manager - Projects) was employed under a standard rolling employment contract. His current employment contract commenced on 18 January 2010 and there is no termination date. Under the terms of the contract:
Mr O’Connor may resign from his position and thus terminate this contract by giving 3 months written notice.
The Company may terminate this employment agreement by providing 4 weeks written notice or provide payment in lieu of the notice period (based on the fixed component of Mr O’Connor’s remuneration)
Mr O’Connor accrues 4 weeks of annual leave entitlements per year and 3 calendar months of long service leave entitlements after 7 years, with an entitlement to a pro-rata amount if the employment is terminated after 3 years.
Mr O’Connor resigned from the Company on 31 December 2013.
Mr Dovaston (General Manager – Nullagine Gold Operations) was employed under a standard rolling employment contract. His current employment contract commenced on 29 January 2014 and there is no termination date. Under the terms of the contract:
Mr Dovaston may resign from his position and thus terminate this contract by giving 3 months written notice.
The Company may terminate this employment agreement by providing 4 weeks written notice or provide payment in lieu of the notice period (based on the fixed component of Mr Dovaston’s remuneration)
Mr Dovaston accrues 4 weeks of annual leave entitlements per year and 13 weeks of long service leave entitlements after 7 years, with an entitlement to a pro-rata amount if the employment is terminated after 3 years.
For
per
sona
l use
onl
y

REMUNERATION REPORT (AUDITED)
43
NON-EXECUTIVE DIRECTORS Non-executive directors’ fees cover all main board activities and membership of board committees. Non-executive directors do not receive any benefits on retirement other than superannuation. From time to time, non-executive directors may provide consulting services to the Company and in these cases they are paid consulting fees in line with industry rates.
At the date of this report, base fees for the non-executive chairman is $90,000 per annum and $60,000 per annum for the other non-executive directors.
Signed in accordance with a resolution of the Directors.
Brian Rear Managing Director and Chief Executive Officer Perth 28 March 2014
For
per
sona
l use
onl
y
For
per
sona
l use
onl
y
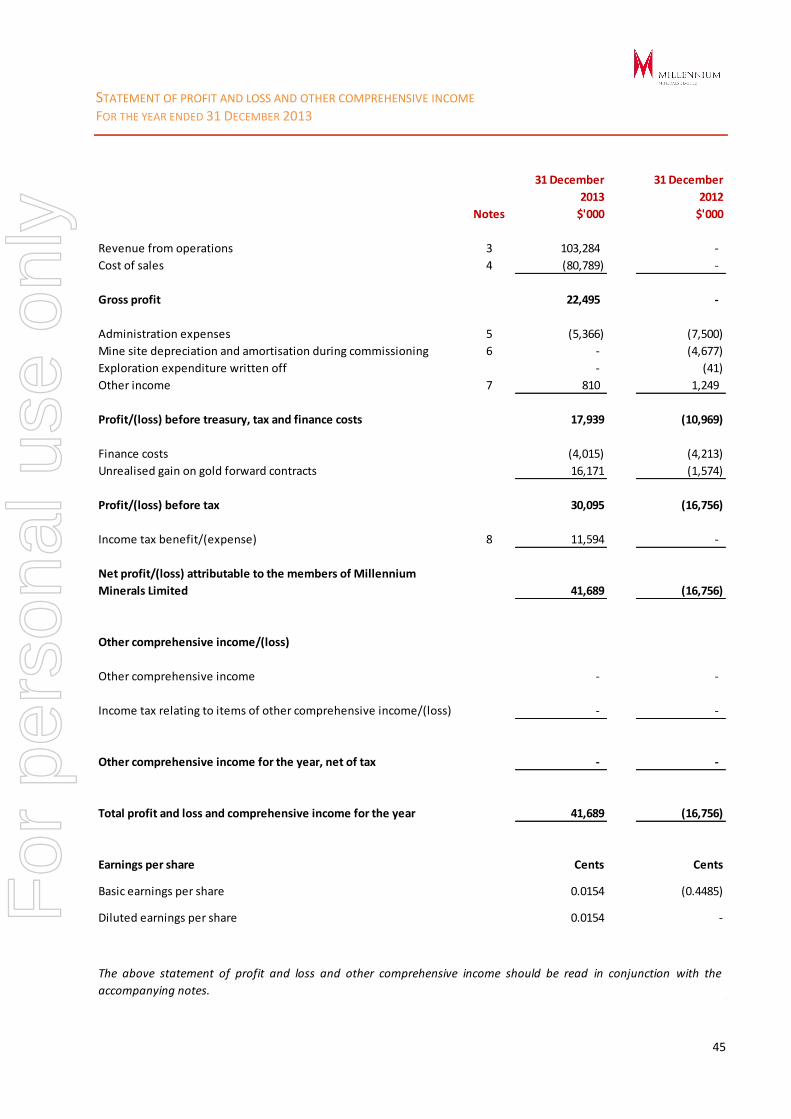
STATEMENT OF PROFIT AND LOSS AND OTHER COMPREHENSIVE INCOME FOR THE YEAR ENDED 31 DECEMBER 2013
45
31 December 31 December
2013 2012
Notes $'000 $'000
Revenue from operations 3 103,284 -
Cost of sales 4 (80,789) -
Gross profit 22,495 -
Administration expenses 5 (5,366) (7,500)
Mine site depreciation and amortisation during commissioning 6 - (4,677)
Exploration expenditure written off - (41)
Other income 7 810 1,249
Profit/(loss) before treasury, tax and finance costs 17,939 (10,969)
Finance costs (4,015) (4,213)
Unrealised gain on gold forward contracts 16,171 (1,574)
Profit/(loss) before tax 30,095 (16,756)
Income tax benefit/(expense) 8 11,594 -
Net profit/(loss) attributable to the members of Millennium
Minerals Limited 41,689 (16,756)
Other comprehensive income/(loss)
Other comprehensive income - -
Income tax relating to items of other comprehensive income/(loss) - -
Other comprehensive income for the year, net of tax - -
Total profit and loss and comprehensive income for the year 41,689 (16,756)
Earnings per share Cents Cents
Basic earnings per share 0.0154 (0.4485)
Diluted earnings per share 0.0154 -
The above statement of profit and loss and other comprehensive income should be read in conjunction with the
accompanying notes.
For
per
sona
l use
onl
y

STATEMENT OF FINANCIAL POSITION AS AT 31 DECEMBER 2013
46
31 December 31 December
2013 2012
Notes $'000 $'000
Assets
Current Assets
Cash and cash equiva lents 9 2,231 2,831
Trade and other receivables 10 1,268 2,556
Inventories 11 16,219 5,806
Other assets 12 6,761 2,857
Other financia l assets 13 9,739 202
Tota l current assets 36,218 14,252
Non-current assets
Deferred mining costs 14 7,645 3,225
Minera l exploration and evaluation expenditure 15 11,762 13,099
Mine development 16 38,443 37,631
Property, plant and equipment 17 81,579 87,704
Other financia l assets 13 4,858 -
Deferred tax asset 8 21,043 -
Tota l non-current assets 165,330 141,659
Total Assets 201,548 155,911
Liabilities
Current liabilities
Trade and other payables 18 18,104 14,820
Provis ions 19 813 392
Borrowings 20 26,394 24,075
Lease l iabi l i ties 21 2,789 2,634
Tota l current l iabi l i ties 48,100 41,921
Non-current liabilities
Provis ions 19 4,554 3,869
Borrowings 20 7,423 22,495
Lease l iabi l i ties 21 2,871 4,928
Other financia l l iabi l i ties 13 - 1,777
Deferred tax l iabi l i ties 8 9,449 -
Tota l non-current l iabi l i ties 24,297 33,069
Total Liabilities 72,397 74,990
Net Assets 129,151 80,921
Equity
Contributed equity 22 143,940 137,399
Reserves 23 2,081 2,081
Accumulated losses 23 (16,870) (58,559)
Total Equity 129,151 80,921
The above statement of financial position should be read in conjunction with the accompanying notes.
For
per
sona
l use
onl
y
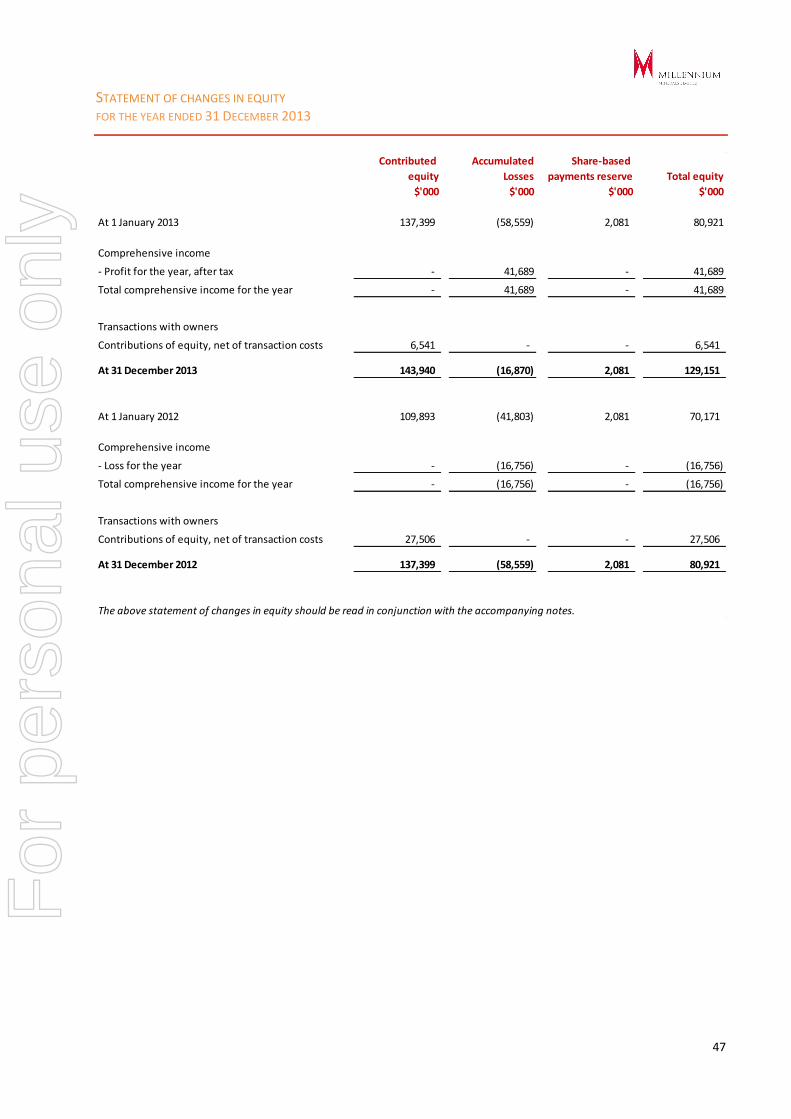
STATEMENT OF CHANGES IN EQUITY FOR THE YEAR ENDED 31 DECEMBER 2013
47
Contributed Accumulated Share-based
equity Losses payments reserve Total equity
$'000 $'000 $'000 $'000
At 1 January 2013 137,399 (58,559) 2,081 80,921
Comprehensive income
- Profit for the year, after tax - 41,689 - 41,689
Total comprehensive income for the year - 41,689 - 41,689
Transactions with owners
Contributions of equity, net of transaction costs 6,541 - - 6,541
At 31 December 2013 143,940 (16,870) 2,081 129,151
At 1 January 2012 109,893 (41,803) 2,081 70,171
Comprehensive income
- Loss for the year - (16,756) - (16,756)
Total comprehensive income for the year - (16,756) - (16,756)
Transactions with owners
Contributions of equity, net of transaction costs 27,506 - - 27,506
At 31 December 2012 137,399 (58,559) 2,081 80,921
The above statement of changes in equity should be read in conjunction with the accompanying notes.
For
per
sona
l use
onl
y
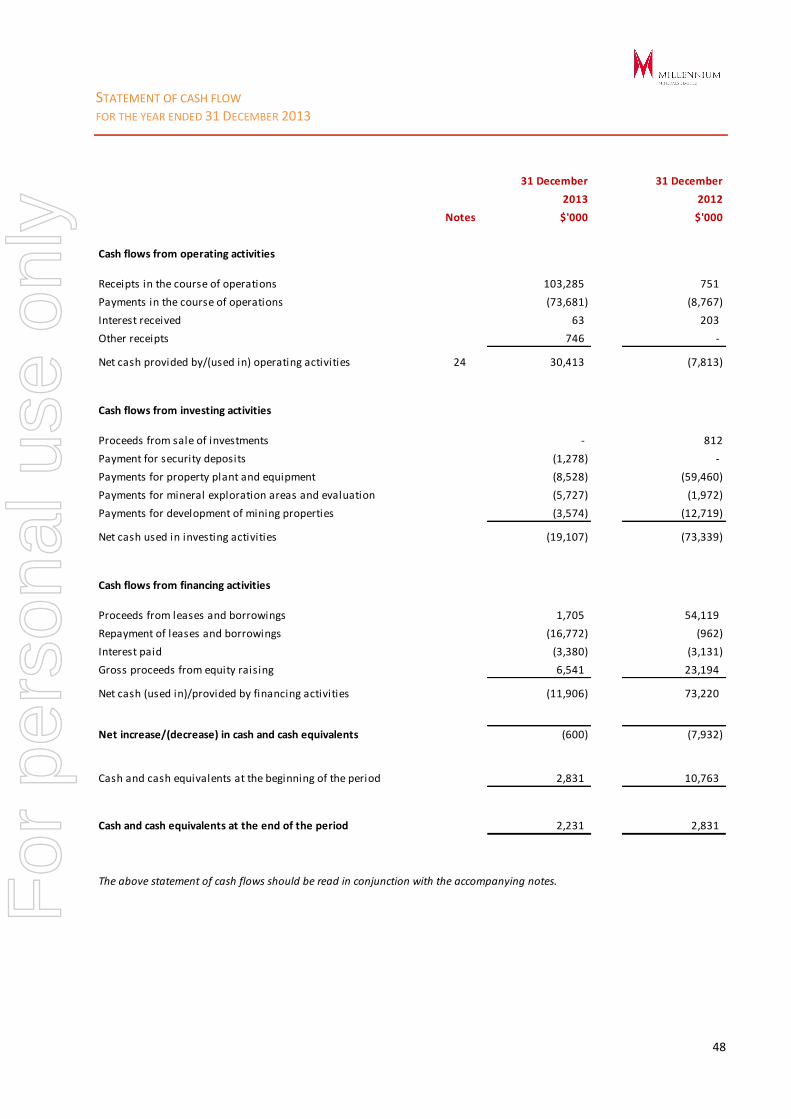
STATEMENT OF CASH FLOW FOR THE YEAR ENDED 31 DECEMBER 2013
48
31 December 31 December
2013 2012
Notes $'000 $'000
Cash flows from operating activities
Receipts in the course of operations 103,285 751
Payments in the course of operations (73,681) (8,767)
Interest received 63 203
Other receipts 746 -
Net cash provided by/(used in) operating activities 24 30,413 (7,813)
Cash flows from investing activities
Proceeds from sale of investments - 812
Payment for security deposits (1,278) -
Payments for property plant and equipment (8,528) (59,460)
Payments for mineral exploration areas and evaluation (5,727) (1,972)
Payments for development of mining properties (3,574) (12,719)
Net cash used in investing activities (19,107) (73,339)
Cash flows from financing activities
Proceeds from leases and borrowings 1,705 54,119
Repayment of leases and borrowings (16,772) (962)
Interest paid (3,380) (3,131)
Gross proceeds from equity raising 6,541 23,194
Net cash (used in)/provided by financing activities (11,906) 73,220
Net increase/(decrease) in cash and cash equivalents (600) (7,932)
Cash and cash equivalents at the beginning of the period 2,831 10,763
Cash and cash equivalents at the end of the period 2,231 2,831
The above statement of cash flows should be read in conjunction with the accompanying notes.For
per
sona
l use
onl
y
NOTES TO, AND FORMING PART OF, THE FINANCIAL STATEMENTS FOR THE YEAR ENDED 31 DECEMBER 2013
49
Note 1 Corporate Information Millennium Minerals Limited (“Millennium” or the “Company”) is a public listed limited Company that is incorporated and domiciled in Australia.
During the year, the principal activity of Millennium was gold exploration and development of the Nullagine Gold Project in Western Australia.
Note 2 Summary of Significant Accounting Policies
(a) Basis of Presentation
The financial report is a general purpose financial report of the Company that has been prepared in accordance with the requirements of the Corporations Act 2001, Australian Accounting Standards and other authoritative pronouncements of the Australian Accounting Standards Board. The accounting policies have been consistently applied.
All amounts are presented in Australian dollars and the values are rounded to the nearest thousand dollars ($’000) unless otherwise stated.
The financial statements have been prepared on a historical cost basis, unless otherwise stated
(b) Statement of Compliance
The full year financial report complies with Australian Accounting Standards, which include Australian equivalents to International Financial Reporting Standards (‘AIFRS’). Compliance with AIFRS ensures that the full year financial report, comprising the financial statements and notes thereto, complies with International Financial Reporting Standards (‘IFRS’).
(c) Adoption of New and Revised Standards
(i) Early adoption of accounting standards
The Company has not elected to apply any pronouncements before their operative date in the annual reporting year beginning 1 January 2013.
(ii) New and amended standards adopted by the Company
None of the new standards and amendments to standards that are mandatory for the first time for the financial year beginning 1 January 2013 affected any of the amounts recognised in the current year or any prior period and are not likely to affect future periods.
Certain new accounting standards and interpretations have been published that are not mandatory for 31 December 2014 reporting years. The Company’s assessment of the impact of these new and amended standards and interpretations that may have an impact on the Company is set out below:
AASB 9 Financial Instruments (effective 1 January 2015) AASB 9 includes requirements for the classification and measurement of financial assets.
There is no material impact for the Company.
AASB 11 Joint Arrangements (effective 1 January 2013) This standard establishes requirements for financial reporting by entities that have interests in arrangements which are controlled jointly.
There is no material impact for the company.
For
per
sona
l use
onl
y

NOTES TO, AND FORMING PART OF, THE FINANCIAL STATEMENTS FOR THE YEAR ENDED 31 DECEMBER 2013
50
Note 2 Summary of Significant Accounting Policies (continued)
(c) Adoption of New and Revised Standards (continued)
(ii) New and amended standards adopted by the Company (continued) AASB 12 Disclosure of Interests in Other Entities (effective 1 January 2013) This standard sets out the disclosures required for entities that have interests in joint arrangements and associates.
There is no material impact for the company. AASB 128 Investments in Associates and Joint Ventures (effective 1 January 2013) This standard sets out the requirements when accounting for investments in associates and joint ventures.
There is no material impact for the company. AASB 2011-4 Amendments to AASB 1024 KMP Disclosures (effective from 1 January 2014) This Standard makes amendments to remove individual key management personnel disclosure requirements from AASB 124. AASB 2011-7 Amendments to Australian Accounting Standards arising from the Consolidation and Joint Arrangements Standards (effective 1 January 2013) These amendments relate to the accounting treatment and disclosures for arrangements that are jointly controlled, associates or consolidated.
There is no material impact for the company.
(d) Going Concern
The Directors have prepared the financial statements on a going concern basis, which contemplates continuity of normal business activities and the realisation of assets and extinguishment of liabilities in the ordinary course of business.
The Company has recorded a net profit of $41.7 million incorporating a mine level EBITDA of $31.1 million for the 2013 financial year. The statement of financial position displays a net working capital deficiency of $11.9 million as at the reporting date. The Directors believe the going concern basis is appropriate for the following reasons:
- Gold production for the financial year ended 31 December 2014 is forecast to be 76,000 ounces at a C1 cash cost of $975 per ounce and sustaining cash cost of $1,140 per ounce indicating ongoing profitable mining operations; and
- Subsequent to year end, the Company’s senior debt providers agreed to extend the previous waiver and subject to final documentation and various conditions, to revise the schedule of principal repayments and the maturity date of the Senior Facility. The revised schedule of principal repayments for 2014 is $13.0 million. The previous repayment profile that was in existence at 31 December 2014 that governed the current versus non-current classification of the liability in the statement of financial position required repayments of $26.4 million for 2014 (note 20). This restructure significantly improves the working capital position of the company.
- Subsequent to year end, the Company has entered into a $7 million subordinated loan agreement with IMC Resources Gold Holdings Pte Ltd and on 21 March 2014 and had drawn down the funds.
For
per
sona
l use
onl
y
NOTES TO, AND FORMING PART OF, THE FINANCIAL STATEMENTS FOR THE YEAR ENDED 31 DECEMBER 2013
51
Note 2 Summary of Significant Accounting Policies (continued)
(e) Income Tax
Income tax on the income statement for the periods presented comprises current and deferred tax. Income tax is recognised in the income statement except to the extent that it relates to items recognised directly in equity, in which case it is recognised in equity.
Current tax is the expected tax payable on the taxable income for the year, using tax rates enacted or substantially enacted at the reporting date, and any adjustment to tax payable in respect of previous years.
Deferred tax is provided using the balance sheet method, providing for temporary differences between the carrying amounts of assets and liabilities for financial reporting purposes and the amounts used for taxation purposes.
Deferred tax is measured at the tax rates that are expected to be applied to the temporary differences when they reverse, based on the laws that have been enacted and substantively enacted by the reporting date.
A deferred tax asset is recognised only to the extent that it is probable that future taxable profits will be available against which the asset can be utilised. Deferred tax assets are reviewed at each reporting date and are reduced to the extent that it is no longer probable that the related tax benefit will be realised.
(f) Property, Plant and Equipment
Cost and valuation
Items of property, plant and equipment are carried at cost less accumulated depreciation and any accumulated impairment in value. Cost includes expenditure that is directly attributable to the acquisition, installation and commissioning of an item.
The carrying amounts are reviewed annually by directors to ensure it is not in excess of the recoverable amount from these assets. The recoverable amount is assessed on the basis of the expected net cash flows that will be received from the assets employed and subsequent disposal. The expected net cash flows is discounted to their net present values in determining recoverable amounts.
Costs subsequent to the initial recognition of an asset are included in the assets carrying amount or recognised as a separate asset, as appropriate, only when it is probable that future economic benefits associated with the item will flow to the Company and the cost of the item can be measured reliably. All other repairs and maintenance are charged to the income statement during the financial period in which they are incurred.
Depreciation
Depreciation of plant and equipment is calculated on a straight line basis to write off the net cost of each item over its expected useful life to the Company.
The expected useful life of mine specific plant, equipment and buildings is the shorter of the life of the mine and the useful life of the individual item.
The expected useful life of non-mine specific plant, equipment and buildings is the useful life of the individual item as follows: 5-10 years.
The directors review the carrying amounts, useful lives and depreciation method annually, with the effect of any changes recognised on a prospective basis.
The gain or loss arising on disposal or retirement of an item of property, plant and equipment is determined as the difference between the sales proceeds and the carrying amount of the asset and is recognised in the profit and loss.
For
per
sona
l use
onl
y
NOTES TO, AND FORMING PART OF, THE FINANCIAL STATEMENTS FOR THE YEAR ENDED 31 DECEMBER 2013
52
Note 2 Summary of Significant Accounting Policies (continued) (g) Exploration and Evaluation Expenditure
Exploration and evaluation assets include the costs of acquiring licences, costs associated with exploration and evaluation activity. Exploration and evaluation expenditure is capitalised on an area of interest basis.
The application of the Company’s accounting policy for exploration and evaluation expenditure requires judgement to determine whether future economic benefits related to an area of interest are likely.
Exploration and evaluation costs related to an area of interest are carried forward only when rights of tenure to the area are current and provided that one of the following conditions is met:
such costs are expected to be recouped through successful development and exploitation of the area of interest, or alternatively by its sale; or
exploration and/or evaluation activities in the area have not, at the reporting date, reached a stage which permits a reasonable assessment of the existence or otherwise of economically recoverable reserves, and active operations in, or relating to, the area are continuing.
This policy requires management to make certain estimates and assumptions about future events or circumstances, in particular, whether an economically viable extraction operation can be established. Estimates and assumptions may change if new information becomes available. If, after expenditure is capitalised, information becomes available suggesting that the recovery of expenditure is unlikely, the amount capitalised is written off to the statement of comprehensive income in full in the period when the new information becomes available.
Exploration and evaluation assets are assessed for impairment if (i) sufficient data exists to determine technical feasibility and commercial viability, and (ii) facts and circumstances suggest the carrying value exceeds the recoverable amount. For the purposes of impairment testing, exploration and evaluation assets are allocated to cash generating units to which the exploration activity relates.
Once the technical feasibility and commercial viability of the extraction of mineral resources in an area of interest are demonstrable and extraction activities has commenced, exploration and evaluation assets attributable to the area of interest are reclassified to mine development.
(h) Mine Development Costs
Mine development represents expenditure in respect of exploration, evaluation, feasibility and pre-production operating costs incurred previously and carried forward in relation to areas of interest in which mining has now commenced. Mine development is stated at cost, less accumulated amortisation and accumulated impairment losses.
Where a mine operates several open pits that are regarded as separate operations for the purpose of mine planning, mine development costs are accounted for separately by reference to the ore from each separate pit. If, however, the pits are highly integrated for the purpose of the mine planning, the second and subsequent pits are regarded as extensions of the first pit in accounting for mine development costs
Accumulated mine development costs are amortised on a unit-of-production (UOP) basis over the economically recoverable reserves of the mine. The UOP rate for the depreciation/amortisation of mine development costs takes into account expenditures incurred to date. F
or p
erso
nal u
se o
nly

NOTES TO, AND FORMING PART OF, THE FINANCIAL STATEMENTS FOR THE YEAR ENDED 31 DECEMBER 2013
53
Note 2 Summary of Significant Accounting Policies (continued) (i) Deferred Mining Costs
Stripping costs incurred in the development of a mine before production commences are capitalised as part of the cost of constructing the mine and subsequently amortised over the life of the mine on a units-of-production basis.
Stripping costs incurred subsequently during the production stage of operations are deferred to the extent that the current period strip ratio (i.e. the ratio of waste to ore) exceeds the life of mine strip ratio.
Such deferred costs are then charged to the Statement of Comprehensive Income to the extent that, in subsequent periods, the current period ratio falls short of the life of mine strip ratio. The calculated strip ratio and the remaining life of mine are reassessed by the directors annually. Changes are accounted for prospectively from the date of change.
(j) Investments and Other Financial Assets
The Company classifies its investments in the following categories: financial assets at fair value through profit and loss, loan and receivables, held-to-maturity investments, and available-for-sale financial assets. The classification depends on the purpose for which the investments were acquired. Management determines the classification of its investments at initial recognition and re-evaluates this designation at each reporting date.
(k) Derivatives
The Company uses derivative financial instruments such as gold call options to manage the risk associated with commodity price fluctuations.
Derivatives are initially recognised at fair value on the date the derivative contract is entered into and are subsequently measured at fair value. The fair value of derivative financial instruments that are traded on an active market is determined using appropriate valuation techniques.
Changes in fair value are recognised in statement of comprehensive income net of any transaction costs.
(l) Inventories
Finished goods, gold concentrate, gold in circuit and stockpiles of unprocessed ore are valued at the lower of cost and estimated net realisable value.
Cost is determined on the basis of weighted average costs and comprises the costs of direct materials and the costs of production which include:
Labour costs, materials and contractor expenses and production overheads which are directly attributable to the extraction and processing of ore;
Depreciation of property plant and equipment used in the extraction and processing or ore; and
Amortisation of capitalised mine development for the area of interest from which the ore is extracted.
Net realisable value tests are performed at each reporting date. Net realisable value is determined with reference to the estimated selling price in the ordinary course of business, less estimated costs to completion and costs of selling the final product.
Consumables are valued at the lower of cost and net realisable value. For
per
sona
l use
onl
y

NOTES TO, AND FORMING PART OF, THE FINANCIAL STATEMENTS FOR THE YEAR ENDED 31 DECEMBER 2013
54
Note 2 Summary of Significant Accounting Policies (continued)
(m) Leases
Leases are classified at their inception as either operating or finance leases based on the economic substance of the agreement so as to reflect the risks and benefits incidental to ownership.
Operating leases
The minimum lease payments of operating leases, where the lessor effectively retains substantially all of the risks and benefits of ownership of the leased item, are recognised as an expense on a straight line basis.
Contingent rentals are recognised as an expense in the financial year in which they are incurred.
Finance leases
Leases which effectively transfer substantially all of the risks and benefits incidental to ownership of the leased item to the economic entity are capitalised at the present value of the minimum lease payments. A lease liability of equal value is also recognised.
Capitalised lease assets are depreciated over the estimated useful life of the assets. Minimum lease payments are allocated between interest expense and reduction of the lease liability with the interest expense calculated using the interest rate implicit in the lease and charged directly to the Statement of Comprehensive Income.
The cost of improvements to or on leasehold property is capitalised, disclosed as leasehold improvements, and amortised over the unexpired period of the lease or the estimated useful lives of the improvements, whichever is the shorter.
(n) Segment Reporting
A segment is a distinguishable component of the Company that is engaged either in providing products or services (business segment), or in providing products or services within a particular economic environment (geographical segment), which is subject to risks and rewards that are different from those of other segments. Operating segments have been identified based on the information provided to the chief operating decision makers, being the executive management team.
(o) Goods and Services Tax
Revenue, expenses and assets are recognised net of the amount of goods and services tax (“GST”), except where the amount of GST incurred is not recoverable from the taxation authority. In these circumstances, the GST is recognised as part of the cost of acquisition of the asset or as part of the expense.
Receivables and payables are stated with the amount of GST included. The net amount of GST recoverable from, or payable to, the ATO is included as a current asset or liability in the Statement of Financial Position.
Cash Flows are included in the statement of cash flows on a gross basis. The GST components of cash flows arising from investing and financing activities which are recoverable from, or payable to, the ATO are classified as operating cash flows.
For
per
sona
l use
onl
y

NOTES TO, AND FORMING PART OF, THE FINANCIAL STATEMENTS FOR THE YEAR ENDED 31 DECEMBER 2013
55
Note 2 Summary of Significant Accounting Policies (continued) (p) Trade Payables, Other Creditors and Provisions
These amounts represent liabilities for goods and services provided to the Company prior to the end of the financial year and which are unpaid, together with assets ordered before the end of the financial year. Because of their short term nature, trade payables and other creditors are not discounted.
Provisions are recognised when the Company has a present obligation and it is probable that an outflow of resources will be required to settle the obligation and the amount has been reliably estimated. Where the effect of the time value of money is material, provisions are determined by discounting the expected future cash flows at a pre-tax rate that reflect current market assessments of the time value of money and, where appropriate, the risks specific to the liability.
Site rehabilitation
The Company records the present value of the estimated cost of legal and constructive obligations to restore the operating location in the period in which the obligation is incurred. The nature of rehabilitation activities includes dismantling operating facilities, closure of plant and waste sites and restoration, reclamation and revegetation of affected areas. Typically the obligation arises when the assets are installed at the production location. The provision is the best estimate of the present value of the expenditure required to settle the rehabilitation obligation at the reporting date, based on current legal requirements and technology.
When the liability is initially recorded, the estimated cost is capitalised by increasing the carrying amount of the related mining asset. Over time, the liability is increased for the change in present value based on the discount rates that reflect current market assessments and the risks specific to the liability. This increase in the provision due to the passage of time is recognised as a finance cost in the statement of comprehensive income. Additional disturbances or changes in rehabilitation costs will be recognised as additions or changes to the corresponding asset and rehabilitation provision when incurred.
(q) Trade Receivables and Revenue Recognition
Interest revenue is recognised on a proportional basis taking into account the interest rates applicable to the financial assets.
Other debtors are recognised at the amount receivable and are usually due for settlement within 30 days from the end of the month in which services were provided.
(r) Cash and Cash Equivalents
Cash and cash equivalents include cash on hand and in banks and investments in money market instruments, net of any outstanding bank overdraft.
(s) Borrowing Costs
Borrowing costs are expensed as finance costs when incurred. Borrowing costs consist of interest and other costs that an entity incurs in connection with the borrowing of funds.
(t) Interest Bearing Loans and Borrowings
All loans and borrowings are initially recognised at cost. Any accrued interest is recorded in payables. For
per
sona
l use
onl
y
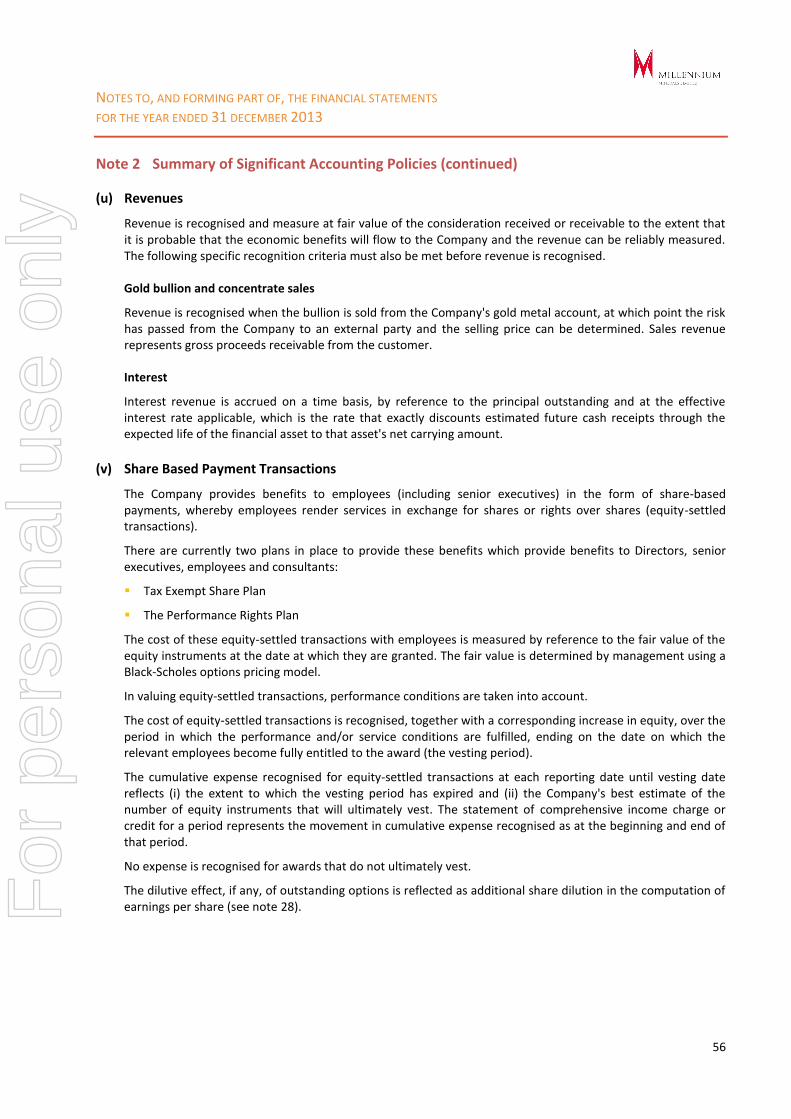
NOTES TO, AND FORMING PART OF, THE FINANCIAL STATEMENTS FOR THE YEAR ENDED 31 DECEMBER 2013
56
Note 2 Summary of Significant Accounting Policies (continued)
(u) Revenues
Revenue is recognised and measure at fair value of the consideration received or receivable to the extent that it is probable that the economic benefits will flow to the Company and the revenue can be reliably measured. The following specific recognition criteria must also be met before revenue is recognised. Gold bullion and concentrate sales
Revenue is recognised when the bullion is sold from the Company's gold metal account, at which point the risk has passed from the Company to an external party and the selling price can be determined. Sales revenue represents gross proceeds receivable from the customer.
Interest
Interest revenue is accrued on a time basis, by reference to the principal outstanding and at the effective interest rate applicable, which is the rate that exactly discounts estimated future cash receipts through the expected life of the financial asset to that asset's net carrying amount.
(v) Share Based Payment Transactions
The Company provides benefits to employees (including senior executives) in the form of share-based payments, whereby employees render services in exchange for shares or rights over shares (equity-settled transactions).
There are currently two plans in place to provide these benefits which provide benefits to Directors, senior executives, employees and consultants:
Tax Exempt Share Plan
The Performance Rights Plan
The cost of these equity-settled transactions with employees is measured by reference to the fair value of the equity instruments at the date at which they are granted. The fair value is determined by management using a Black-Scholes options pricing model.
In valuing equity-settled transactions, performance conditions are taken into account.
The cost of equity-settled transactions is recognised, together with a corresponding increase in equity, over the period in which the performance and/or service conditions are fulfilled, ending on the date on which the relevant employees become fully entitled to the award (the vesting period).
The cumulative expense recognised for equity-settled transactions at each reporting date until vesting date reflects (i) the extent to which the vesting period has expired and (ii) the Company's best estimate of the number of equity instruments that will ultimately vest. The statement of comprehensive income charge or credit for a period represents the movement in cumulative expense recognised as at the beginning and end of that period.
No expense is recognised for awards that do not ultimately vest.
The dilutive effect, if any, of outstanding options is reflected as additional share dilution in the computation of earnings per share (see note 28). F
or p
erso
nal u
se o
nly

NOTES TO, AND FORMING PART OF, THE FINANCIAL STATEMENTS FOR THE YEAR ENDED 31 DECEMBER 2013
57
Note 2 Summary of Significant Accounting Policies (continued)
(w) Employee Entitlements
(i) Wages, salaries and annual Leave
Liabilities for wages and salaries, and annual leave are recognised as employee benefits in respect of employee services up to the reporting date. They are measured at the amounts expected to be paid when the liabilities are settled.
(ii) Employee benefits on-costs
Employee benefit on-costs including payroll tax and superannuation guarantee charges are charged as expenses when incurred.
(iii) Long service leave
The liability for long service leave is recognised and measured as the present value of expected future payments to be made in respect of services provided by employees up to a reporting date.
(x) Impairment of Assets
At each reporting date, the Company assesses whether there is an indication than an asset is impaired. Where an indication of impairment exists, the Company makes a formal estimate of recoverable amount. Where the carrying amount of an asset exceeds its recoverable amount the asset is considered impaired and is written down to its recoverable amount.
The recoverable amount is the higher of an asset’s fair value less costs to sell and value in use. For the purposes of assessing impairment, assets are grouped at the lowest levels for which there are separately identifiable cash inflows which are largely independent of the cash flows from other assets or groups of assets (cash generating units). An impairment loss is recognised for the amount by which the asset’s carrying amount exceeds its recoverable amount.
(y) Earnings per share
The Company presents basic and diluted earnings per share (EPS) data for ordinary shares. Basic EPS is calculated by dividing the profit or loss attributable to ordinary shareholders of the Company by the weighted average number of ordinary shares outstanding during the period.
Diluted EPS is determined by adjusting the profit or loss attributable to ordinary shareholders and the weighted average number of ordinary shares outstanding for the effects of all dilutive potential ordinary shares, which comprise listed options and all unlisted share options granted but not necessarily exercised.
(z) Critical Accounting Estimates and Judgements
The preparation of the financial statements in conformity with Australian Accounting Standards requires management to make judgements, estimates and assumptions that affect the application of policies and reported amounts of assets and liabilities, income and expenses. The estimates and associated assumptions are based on historical experience and various other factors that are believed to be reasonable under the circumstances. These form the basis of making judgements about carrying values of assets and liabilities that are not readily apparent from other sources. F
or p
erso
nal u
se o
nly

NOTES TO, AND FORMING PART OF, THE FINANCIAL STATEMENTS FOR THE YEAR ENDED 31 DECEMBER 2013
58
Note 2 Summary of Significant Accounting Policies (continued)
(z) Critical Accounting Estimates and Judgements (continued)
The estimates and underlying assumptions are reviewed on an on-going basis. Revisions to accounting estimates are recognised in the period in which the estimate is revised if the revision affects only that period or in the period of revision and future periods if the revision affects both current and future periods.
Management has identified the following critical accounting policies for which significant judgements, estimates and assumptions are made. Actual results may differ from these estimates under different assumptions and conditions and may materially affect financial position reported in future periods.
Further details of the nature of these assumptions and conditions may be found in the relevant notes to the financial statements.
(i) Significant Accounting Judgements
In the process of applying the Company’s accounting policies, management has made the following judgements, apart from those involving estimations, which have the most significant effect on the amounts recognised in the financial statements:
Determination of Mineral Resources and Ore Reserves
The determination of mineral resources and ore reserves impacts the accounting for asset carrying values. Millennium Minerals Ltd estimates its minerals resources and ore reserves in accordance with the Australian Code for Reporting of Exploration Results, Mineral Resources and Ore Reserves ( JORC 2012). The information on Minerals Resources and Ore Reserves was prepared by or under the supervision of Competent Persons as defined in the JORC Code. The amounts presented are based on the Mineral Resources and Ore Reserves determined under the JORC Code.
There are numerous uncertainties inherent in estimating Minerals Resources and Ore Reserves, and assumptions that are valid at the time of estimation may change significantly when new information becomes available. Changes in the forecast prices of commodities, exchange rates, production costs or recovery rates may change the economic status of reserves and may ultimately result in reserves being restated.
Recovery of deferred tax assets
Judgement is required in determining whether deferred tax assets are recognised in the statement of financial position. Deferred tax assets, including those arising from unutilised tax losses, require management to assess the likelihood that the Company will generate taxable earnings in future periods, in order to utilise recognised deferred tax assets. Estimates of future taxable income are based in forecast cash flows from operations and the application of existing tax laws in Australia.
To the extent that future cash flows and taxable income differ significantly from estimates, the ability of the Company to realise the net deferred tax assets recorded at the reporting date could be impacted. Additionally, future changes in tax laws in Australia could limit the ability of the Group to obtain tax deductions in future periods. Capitalisation of exploration and evaluation expenditure
The Company has capitalised significant exploration and evaluation expenditure on the basis either that this is expected to be recouped through future successful development (or alternatively sale) of the Areas of Interest concerned or on the basis that it is not yet possible to assess whether it will be recouped.
For
per
sona
l use
onl
y

NOTES TO, AND FORMING PART OF, THE FINANCIAL STATEMENTS FOR THE YEAR ENDED 31 DECEMBER 2013
59
Note 2 Summary of Significant Accounting Policies (continued) (z) Critical Accounting Estimates and Judgements (continued)
(ii) Significant Accounting Estimates and Assumptions
The carrying amounts of certain assets and liabilities are often determined based on estimates and assumptions of future events. The key estimates and assumptions that have a significant risk of causing a material adjustment to the carrying amounts of certain assets and liabilities within the next annual reporting period are:
Impairment of capitalised exploration, evaluation and development expenditure
The future recoverability of capitalised exploration and evaluation expenditure is dependent on an number of factors, including whether the Company decides to exploit the related lease itself, or, if not, whether it successfully recovers the related exploration and evaluation asset through sale.
Factors that could impact the future recoverability include the level of reserves and resources, future technological changes, costs of drilling and production, production rates, future legal changes (including changes to environmental restoration obligations) and changes to commodity prices. As at 31 December 2013, the carrying value of exploration expenditure of the Company was $11.762m (2012: $13.099m).
Share based payment transactions
The Company measures the cost of equity-settled transactions with employees by reference to the fair value of the equity instruments at the date at which they are granted. The fair value is determined using a Black-Scholes option pricing model.
The Company measures the cost of cash-settled share-based payments at fair value at the grant date using the Black-Scholes formula taking into account the terms and conditions upon which the instruments were granted. Impairment of non-financial assets other than goodwill
The Company assesses impairment of all assets at each reporting date by evaluating conditions specific to the Company and to the particular asset that may lead to impairment. These include economic and political environments and the future exploration and development expectations. If an impairment trigger exists, the recoverable amount of the asset is determined. This involves value in use calculations, which incorporate a number of key estimates and assumptions.
Mine rehabilitation provision
The Company assesses its mine rehabilitation provision half-yearly in accordance with the accounting policy stated in note 2(p). Significant judgement is required in determining the provision for mine rehabilitation as there are many transactions and other factors that will affect the ultimate liability payable to rehabilitate the mine site. Factors that will affect this liability include future development, changes in technology, commodity price changes and changes in interest rates. When these factors change or become known in the future, such differences will impact the mine rehabilitation provision in the period in which they change or become known, which in turn would impact future financial results. F
or p
erso
nal u
se o
nly
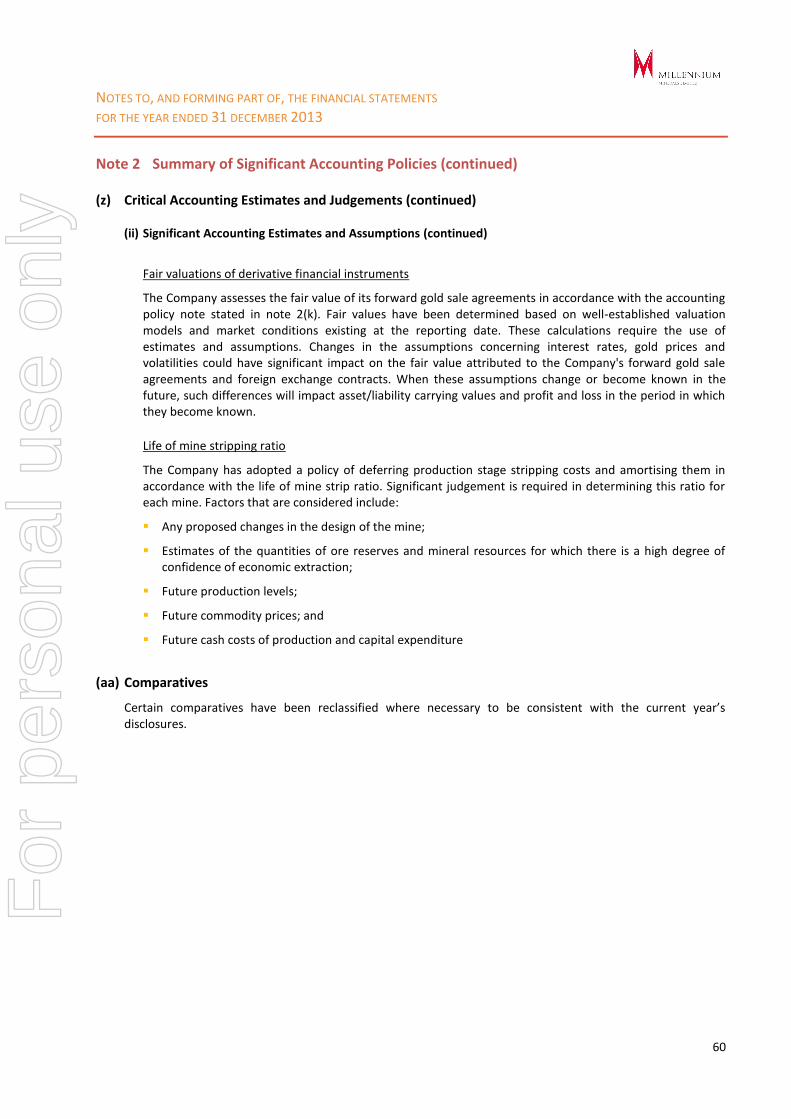
NOTES TO, AND FORMING PART OF, THE FINANCIAL STATEMENTS FOR THE YEAR ENDED 31 DECEMBER 2013
60
Note 2 Summary of Significant Accounting Policies (continued) (z) Critical Accounting Estimates and Judgements (continued)
(ii) Significant Accounting Estimates and Assumptions (continued)
Fair valuations of derivative financial instruments
The Company assesses the fair value of its forward gold sale agreements in accordance with the accounting policy note stated in note 2(k). Fair values have been determined based on well-established valuation models and market conditions existing at the reporting date. These calculations require the use of estimates and assumptions. Changes in the assumptions concerning interest rates, gold prices and volatilities could have significant impact on the fair value attributed to the Company's forward gold sale agreements and foreign exchange contracts. When these assumptions change or become known in the future, such differences will impact asset/liability carrying values and profit and loss in the period in which they become known.
Life of mine stripping ratio
The Company has adopted a policy of deferring production stage stripping costs and amortising them in accordance with the life of mine strip ratio. Significant judgement is required in determining this ratio for each mine. Factors that are considered include:
Any proposed changes in the design of the mine;
Estimates of the quantities of ore reserves and mineral resources for which there is a high degree of confidence of economic extraction;
Future production levels;
Future commodity prices; and
Future cash costs of production and capital expenditure
(aa) Comparatives
Certain comparatives have been reclassified where necessary to be consistent with the current year’s disclosures.
For
per
sona
l use
onl
y

NOTES TO, AND FORMING PART OF, THE FINANCIAL STATEMENTS FOR THE YEAR ENDED 31 DECEMBER 2013
61
Note 3 Revenue
31 December 2013 31 December 2012
$'000 $'000
Gold sa les 92,485 -
Si lver sa les 264 -
Real ised ga in on gold forward contracts 10,535 -
103,284 -
Note 4 Cost of sales
Mining expenses 30,106 -
Process ing expenses 31,799 -
Si te adminis tration expenses 7,437 -
Royalties 2,892 -
Changes in inventories (9,775) -
Deferred mining costs (4,420) -
Depreciation and amortisation 22,177 -
Net rea l i sable va lue adjustment to inventory 573
80,789 -
Note 5 Administrative expenses
Corporate expenses 4,312 3,549
Diminution of investments - 150
Assets wri tten off - 82
Investors relations 592 291
Statutory compl iance 197 154
Share-based payments - 3,026
Di rectors ' fees 265 248
5,366 7,500
Note 6 Mine site depreciation and amortisation during
commissioning
Changes in inventories - (1,110)
Depreciation and amortisation - 5,787
- 4,677
Note 7 Other income
Interest received 63 203
Renta l & others 4 347
Research and development tax incentive refund 743 699
810 1,249
For
per
sona
l use
onl
y
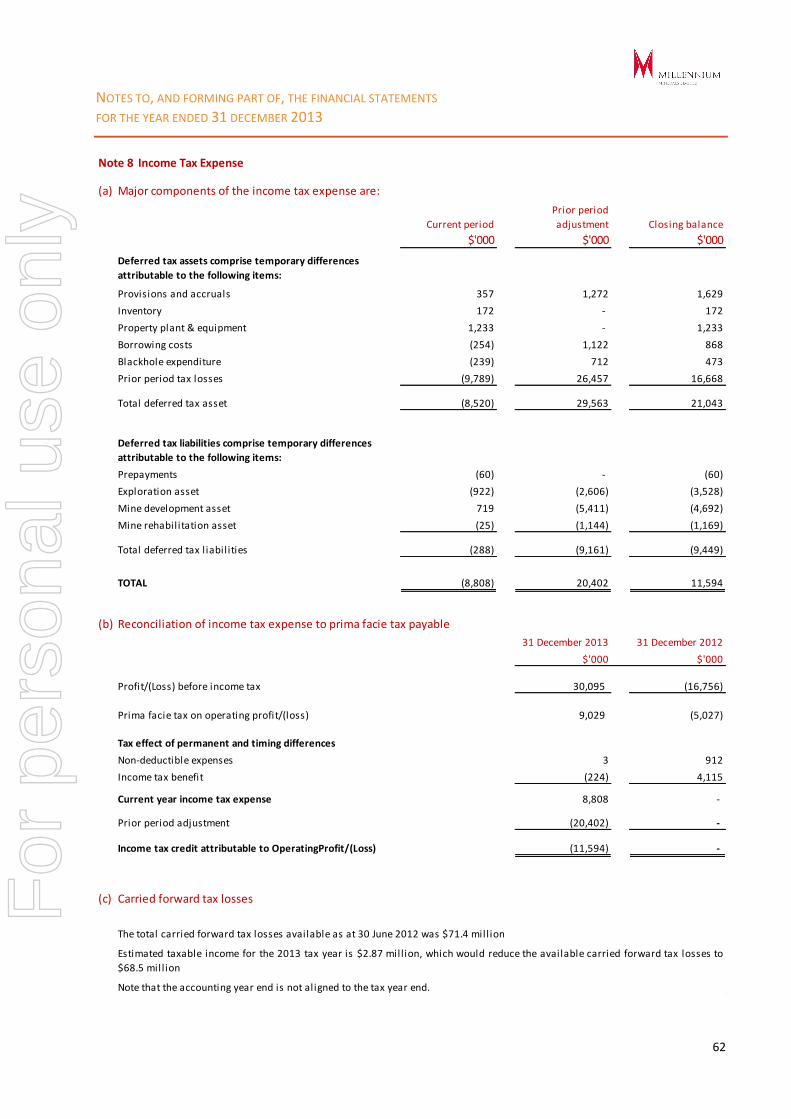
NOTES TO, AND FORMING PART OF, THE FINANCIAL STATEMENTS FOR THE YEAR ENDED 31 DECEMBER 2013
62
Note 8 Income Tax Expense
(a) Major components of the income tax expense are:
Current period
Prior period
adjustment Closing balance
$'000 $'000 $'000
Deferred tax assets comprise temporary differences
attributable to the following items:
Provisions and accruals 357 1,272 1,629
Inventory 172 - 172
Property plant & equipment 1,233 - 1,233
Borrowing costs (254) 1,122 868
Blackhole expenditure (239) 712 473
Prior period tax losses (9,789) 26,457 16,668
Total deferred tax asset (8,520) 29,563 21,043
Deferred tax liabilities comprise temporary differences
attributable to the following items:
Prepayments (60) - (60)
Exploration asset (922) (2,606) (3,528)
Mine development asset 719 (5,411) (4,692)
Mine rehabilitation asset (25) (1,144) (1,169)
Total deferred tax l iabilities (288) (9,161) (9,449)
TOTAL (8,808) 20,402 11,594
(b) Reconciliation of income tax expense to prima facie tax payable
31 December 2013 31 December 2012
$'000 $'000
Profit/(Loss) before income tax 30,095 (16,756)
Prima facie tax on operating profit/(loss) 9,029 (5,027)
Tax effect of permanent and timing differences
Non-deductible expenses 3 912
Income tax benefit (224) 4,115
Current year income tax expense 8,808 -
Prior period adjustment (20,402) -
Income tax credit attributable to OperatingProfit/(Loss) (11,594) -
(c) Carried forward tax losses
The total carried forward tax losses available as at 30 June 2012 was $71.4 mill ion
Note that the accounting year end is not aligned to the tax year end.
Estimated taxable income for the 2013 tax year is $2.87 mill ion, which would reduce the available carried forward tax losses to
$68.5 mill ion
For
per
sona
l use
onl
y

NOTES TO, AND FORMING PART OF, THE FINANCIAL STATEMENTS FOR THE YEAR ENDED 31 DECEMBER 2013
63
Note 9 Cash and cash equivalents
31 December 2013 31 December 2012
$'000 $'000
Cash at bank and on hand 2,231 2,831
Note 10 Trade and other receivables
Gold bullion awaiting settlement - 1,540
Sundry debtors 1 -
GST refundable 900 726
Diesel fuel rebate 367 290
1,268 2,556
Note 11 Inventories
Consumables 2,018 824
Ore stockpile at cost 8,687 580
Gold in circuit at fair value 1,885 1,615
Bullion on hand at fair value 3,629 2,787
16,219 5,806
Note 12 Other assets
Secured deposits* 2,924 1,590
Refundable deposits 2 57
Prepaid royalties 2,382 -
Prepayments 1,453 1,210
6,761 2,857
Note 13 Other financial assets
Financial assets
- derivative instruments current 9,739 202
- derivative instruments non-current 4,858 -
14,597 202
Financial l iabil ities
- derivative instruments non-current - (1,777)
- (1,777)
At 31 December 2013, the Company had gold forward contracts amounting to 62,100 ounces with an average price of
$1,627 per ounce.
*Secured deposits are unconditional performance bonds held by the Department of Mines in respect of exploration licences
and mining leases.
For
per
sona
l use
onl
y

NOTES TO, AND FORMING PART OF, THE FINANCIAL STATEMENTS FOR THE YEAR ENDED 31 DECEMBER 2013
64
Note 14 Deferred mining costs
31 December 2013 31 December 2012
$'000 $'000
Deferred mining costs 7,645 3,225
These costs represent mining expenses, deferred in accordance with the accounting policies disclosed in 2(i).
Note 15 Mineral exploration and evaluation expenditure
Geological, geophysical, dril l ing and other costs for exploration
and purchased mine properties - at cost 11,762 13,099
The costs carried forward above have been determined as follows:
Opening balance 13,099 29,470
Costs incurred during the year 5,319 2,554
Share of Camel Creek JV exploration costs* 407 391
Transfer to capitalised mining costs (7,063) (19,275)
Costs written off during the year - (41)
11,762 13,099
Note 16 Mine development
Opening balance 37,631 2,982
Addition to rehabilitation assets 429 3,850
Expenditure during the year 3,574 12,719
Reclassifications / transfers 7,063 19,275
Recognition of prepaid royalties (2,824) -
Amortisation charge for the year (7,430) (1,195)
38,443 37,631
The ultimate recoupment of costs carried forward for exploration and evaluation phases is dependent on the successful
development and commercial exploitation or sale of the respective mining areas. The directors have assessed the carrying
amount of the asset for impairment as at balance date as required by AASB 6, and concluded that the asset is not impaired,
and that the carrying amount does not exceed the recoverable amount.
* These tenements are owned by Northwest Resources Limited and $15,700 was expended on these tenements in 2013.
For
per
sona
l use
onl
y

NOTES TO, AND FORMING PART OF, THE FINANCIAL STATEMENTS FOR THE YEAR ENDED 31 DECEMBER 2013
65
Note 17 Property plant and equipment
Plant and
equipment Motor vehicles
Land and
buildings Critical spares Infrastructure
Capital works
in progress Leased assets Total
2013 $'000 $'000 $'000 $'000 $'000 $'000 $'000 $'000
At cost 59,970 1,201 17,411 1,863 18,276 904 1,337 100,962
Accumulated depreciation (11,945) (246) (3,199) (359) (2,965) - (669) (19,383)
Closing carrying amount 48,025 955 14,212 1,504 15,311 904 668 81,579
Reconciliation of carrying amounts
Opening carrying amount 56,510 1,105 15,128 1,773 8,602 3,480 1,106 87,704
Additions 132 - - - - 8,396 - 8,528
Transfer / reclassification 195 - 1,539 - 9,238 (10,972) - -
Disposals - - - - - - - -
Depreciation expense (8,812) (150) (2,455) (269) (2,529) - (438) (14,653)
Closing carrying amount 48,025 955 14,212 1,504 15,311 904 668 81,579
2012
At cost 59,643 1,200 15,872 1,863 9,038 3,480 1,337 92,433
Accumulated depreciation (3,133) (95) (744) (90) (436) - (231) (4,729)
Closing carrying amount 56,510 1,105 15,128 1,773 8,602 3,480 1,106 87,704
Reconciliation of carrying amounts
Opening carrying amount 378 127 424 - - - - 929
Additions 42,689 1,072 7,317 687 6,117 28,551 1,337 87,770
Transfer / reclassification 16,421 - 8,131 1,176 2,921 (25,071) - 3,578
Depreciation expense (2,978) (94) (744) (90) (436) - (231) (4,573)
Closing carrying amount 56,510 1,105 15,128 1,773 8,602 3,480 1,106 87,704
For
per
sona
l use
onl
y

NOTES TO, AND FORMING PART OF, THE FINANCIAL STATEMENTS FOR THE YEAR ENDED 31 DECEMBER 2013
66
Note 18 Trade and other payables
31 December 2013 31 December 2012
$'000 $'000
Trade payables 10,778 8,642
Royalties payable 482 497
Insurance premium funding 1,185 1,032
Employee entitlements 764 502
Accruals 4,626 4,026
Other payables 269 121
18,104 14,820
Due to the short nature of these payables, their carrying values are assumed to approximate their fair value.
Note 19 Provisions
Current
Employee benefits 813 392
Non-current
Employee benefits 160 -
Rehabilitation 4,394 3,869
4,554 3,869
Employee benefits
Movements in provisions
Balance at beginning of year 392 94
Additional provisions 581 298
Balance at end of year 973 392
Mine rehabilitation
Movements in provisions
Balance at beginning of year 3,869 -
Unwinding of discount 94 19
Additional provisions 431 3,850
Balance at end of year 4,394 3,869
Note 20 Borrowings
Current
Syndicated loan facil ities (i) 26,394 24,075
Non-current
Syndicated loan facil ities 4,600 20,925
Syndicated bond facil ity 2,823 1,570
7,423 22,495
(i) As at 31 December 2013, the Company had repaid $14 mill ion which represents approximately 31% of the principal amount of
the syndicated loan facil ities.
Subsequent to year end, the Company’s senior debt providers agreed, an extension to the previous waiver and subject to final
documentation and various conditions, to revise the schedule of principal repayments and the maturity date of the syndicated
loan facil ities. The revised schedule of principal repayments for 2014 is $13.0 mill ion. The previous repayment profile that
governed the current versus non-current classification of the liability within the statement of financial position as disclosed
above required repayments of $26.4 mill ion for 2014.
The revised loan repayment schedule requires full repayment by June 2016. The loan attracts a variable interest rate.
For
per
sona
l use
onl
y

NOTES TO, AND FORMING PART OF, THE FINANCIAL STATEMENTS FOR THE YEAR ENDED 31 DECEMBER 2013
67
Note 21 Lease liabilities
31 December 2013 31 December 2012
$'000 $'000
Hire purchase liabilities 389 381
Finance lease liabilities 2,400 2,253
2,789 2,634
Non-current
Hire purchase liabilities 187 571
Finance lease liabilities 2,684 4,357
2,871 4,928
Note 22 Contributed equity
(a) Contributed equity
Contributed equity 143,940 137,399
These are ordinary shares issued and fully paid.
No. of shares
'000s $'000
Movement in ordinary shares on issue
At 1 January 2012 2,999,835 109,893
Issued on exercise of l isted options 4,192 126
Issued on placement in March 2012 876,370 16,651
Issued on placement in November 2012 300,000 8,100
Issued as consideration under a Joint Venture Agreement with
Northwest Resources Limited 52,532 1,051
Issue as consideration under tenement purchase agreement with
Wakeford Holdings Pty Ltd 10,638 202
Issued under the shareholder approved Tax Exempt Share Plan 1,765 33
Issued under conversion of Performance Rights 100,872 3,026
Transaction costs (1,683)
At 31 December 2012 4,346,204 137,399
Issued on exercise of l isted options 26,578 796
Reduction due to share consolidation (4,174,017) -
Non-renounceable Rights Issue @ $0.32 18,930 6,058
Transaction costs (313)
At 31 December 2013 217,695 143,940
The holders of ordinary shares are entitled to receive dividends as declared from time to time and, on a poll, are entitled to
one vote per share at meetings of the Company. The Company does not have authorised capital or par value in respect of its
issued shares.
For
per
sona
l use
onl
y

NOTES TO, AND FORMING PART OF, THE FINANCIAL STATEMENTS FOR THE YEAR ENDED 31 DECEMBER 2013
68
Note 22 Contributed equity (continued)
(a) Contributed equity (continued)
Share consolidation
Capital management
(b) Options on issue
31 December 2013 31 December 2012
'000s '000s
Listed options
At beginning of year 1,563,219 1,567,411
Exercised during year - (4,192)
Expired during year (1,563,219)
At end of year - 1,563,219
Unlisted options
At beginning of year 25,000 25,000
Reduction due to share consolidation (23,864) -
At end of year 1,136 25,000
Note 23 Reserves and accumulated losses
31 December 2013 31 December 2012
$'000 $'000
(a) Reserves
Share-based payment reserve 2,081 2,081
(b) Accumulated losses
Movements in accumulated losses are as follows:
Balance at beginning of year (58,559) (41,803)
Net profit/(loss) for the year 41,689 (16,756)
Balance at end of year (16,870) (58,559)
No. of options
Millennium Minerals Limited completed its one for twenty two share consolidation in August 2013 following approval by
shareholders in July 2013. The share consolidation involved the conversion of every twenty two fully paid ordinary shares
on issue into one fully paid ordinary share. Where the share consolidation resulted in a shareholder having a fractional
entitlement to a share, the entitlement was rounded up to the next whole number of shares. Upon the completion of the
share consolidation in August 2013, the number of Millennium Minerals Limited shares on issue reduced from
4,372,781,946 shares to 198,765,340 shares as at the date.
The Company's objective when managing capital is to safeguard its ability to continue as a going concern, so that it may
continue to provide returns for shareholders and benefits for other stakeholders and to maintain a capital structure that is
appropriate for the Company's current and/or projected financial position.
For
per
sona
l use
onl
y
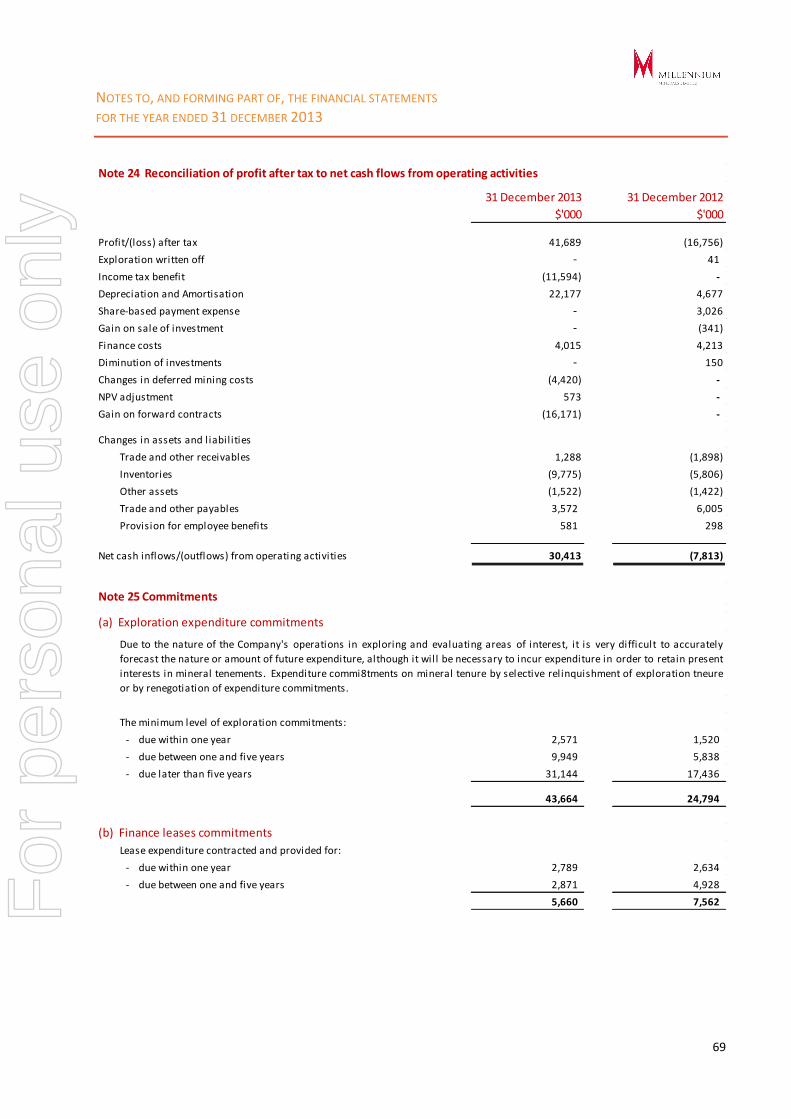
NOTES TO, AND FORMING PART OF, THE FINANCIAL STATEMENTS FOR THE YEAR ENDED 31 DECEMBER 2013
69
Note 24 Reconciliation of profit after tax to net cash flows from operating activities
31 December 2013 31 December 2012
$'000 $'000
Profit/(loss) after tax 41,689 (16,756)
Exploration written off - 41
Income tax benefit (11,594) -
Depreciation and Amortisation 22,177 4,677
Share-based payment expense - 3,026
Gain on sale of investment - (341)
Finance costs 4,015 4,213
Diminution of investments - 150
Changes in deferred mining costs (4,420) -
NPV adjustment 573 -
Gain on forward contracts (16,171) -
Changes in assets and liabilities
Trade and other receivables 1,288 (1,898)
Inventories (9,775) (5,806)
Other assets (1,522) (1,422)
Trade and other payables 3,572 6,005
Provision for employee benefits 581 298
Net cash inflows/(outflows) from operating activities 30,413 (7,813)
Note 25 Commitments
(a) Exploration expenditure commitments
The minimum level of exploration commitments:
- due within one year 2,571 1,520
- due between one and five years 9,949 5,838
- due later than five years 31,144 17,436
43,664 24,794
(b) Finance leases commitments
Lease expenditure contracted and provided for:
- due within one year 2,789 2,634
- due between one and five years 2,871 4,928
5,660 7,562
Due to the nature of the Company's operations in exploring and evaluating areas of interest, it is very difficult to accurately
forecast the nature or amount of future expenditure, although it will be necessary to incur expenditure in order to retain present
interests in mineral tenements. Expenditure commi8tments on mineral tenure by selective relinquishment of exploration tneure
or by renegotiation of expenditure commitments.
For
per
sona
l use
onl
y

NOTES TO, AND FORMING PART OF, THE FINANCIAL STATEMENTS FOR THE YEAR ENDED 31 DECEMBER 2013
70
Note 25 Commitments (continued)
31 December 2013 31 December 2012
$'000 $'000
(c) Operating leases commitments
Lease expenditure contracted and provided for:
- due within one year 221 175
- due between one and five years 80 -
301 175
(d) Operating leases commitmentsContractual commitments
Note 26 Remuneration of auditors
Amounts received, due and receivable by Rothsays Chartered Accountants for:
- Auditing services 60 50
- Other services - -
60 50
On 31 October 2011, the Company entered into an agreement with Pacific Energy (KPS) Pty Ltd for the supply of electricity to the
Nullagine Gold Project. The terms of this agreement commit the Company to purchasing a minimum amount of electricity per
month for a 5 year period commencing 1 July 2012. The Company has the ability to terminate at any time by providing 21 days
notice subject to paying a break fee. As at 31 December 2013, the break fee was $4.4 mill ion (31 December 2012: $4.5 mill ion).
Note 27 Financial instruments and risk management
Short term deposits
Trade payables and accruals
The Company's accounting policies, including the terms and conditions of each class of financial liability and equity
instrument, both recognised and unrecognised at balance date, are as follows:
Short term deposits are stated at the lower of cost and net realisable value. Interest is recognised in the Statement of
Comprehensive Income when earned.
Liabilities are recognised for amounts to be paid in the future for goods and services received, whether or not billed to the
Company. Trade liabilities are normally settled on 30 day terms.
For
per
sona
l use
onl
y
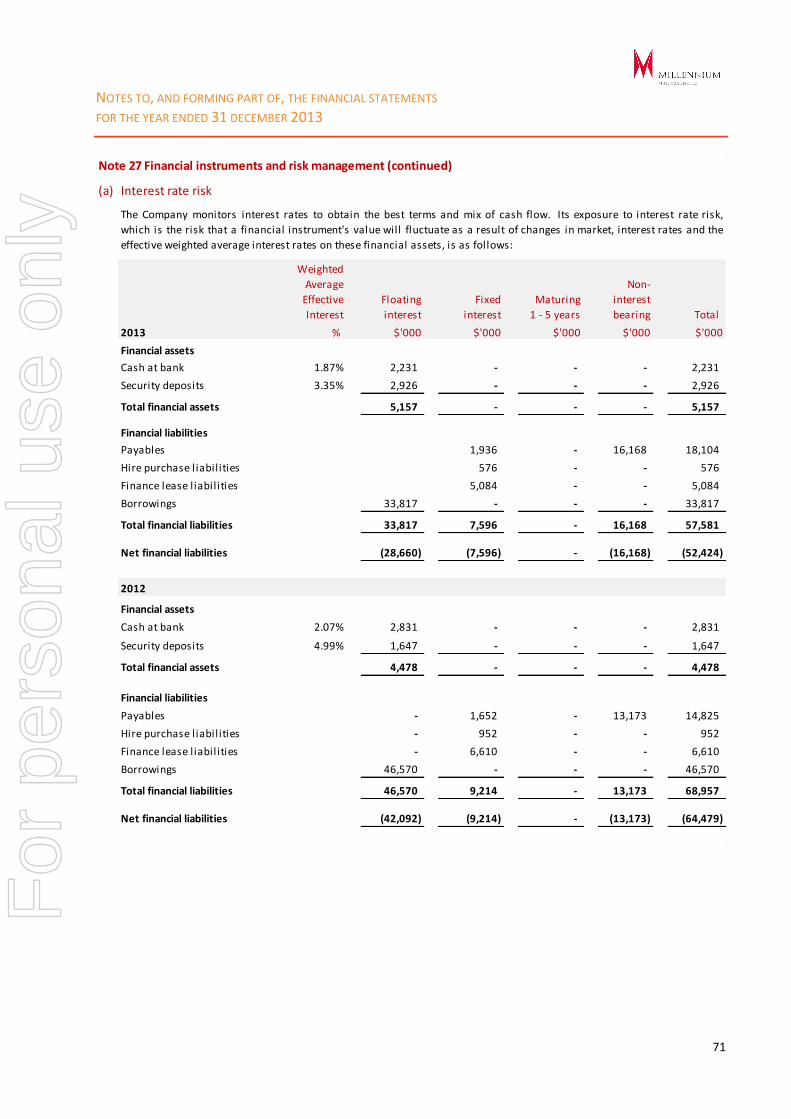
NOTES TO, AND FORMING PART OF, THE FINANCIAL STATEMENTS FOR THE YEAR ENDED 31 DECEMBER 2013
71
Note 27 Financial instruments and risk management (continued)
(a) Interest rate risk
Weighted
Average
Effective
Interest
Floating
interest
Fixed
interest
Maturing
1 - 5 years
Non-
interest
bearing Total
2013 % $'000 $'000 $'000 $'000 $'000
Financial assets
Cash at bank 1.87% 2,231 - - - 2,231
Security deposits 3.35% 2,926 - - - 2,926
Total financial assets 5,157 - - - 5,157
Financial liabilities
Payables 1,936 - 16,168 18,104
Hire purchase liabilities 576 - - 576
Finance lease liabilities 5,084 - - 5,084
Borrowings 33,817 - - - 33,817
Total financial liabilities 33,817 7,596 - 16,168 57,581
Net financial liabilities (28,660) (7,596) - (16,168) (52,424)
2012
Financial assets
Cash at bank 2.07% 2,831 - - - 2,831
Security deposits 4.99% 1,647 - - - 1,647
Total financial assets 4,478 - - - 4,478
Financial liabilities
Payables - 1,652 - 13,173 14,825
Hire purchase liabilities - 952 - - 952
Finance lease liabilities - 6,610 - - 6,610
Borrowings 46,570 - - - 46,570
Total financial liabilities 46,570 9,214 - 13,173 68,957
Net financial liabilities (42,092) (9,214) - (13,173) (64,479)
The Company monitors interest rates to obtain the best terms and mix of cash flow. Its exposure to interest rate risk,
which is the risk that a financial instrument's value will fluctuate as a result of changes in market, interest rates and the
effective weighted average interest rates on these financial assets, is as follows:
For
per
sona
l use
onl
y
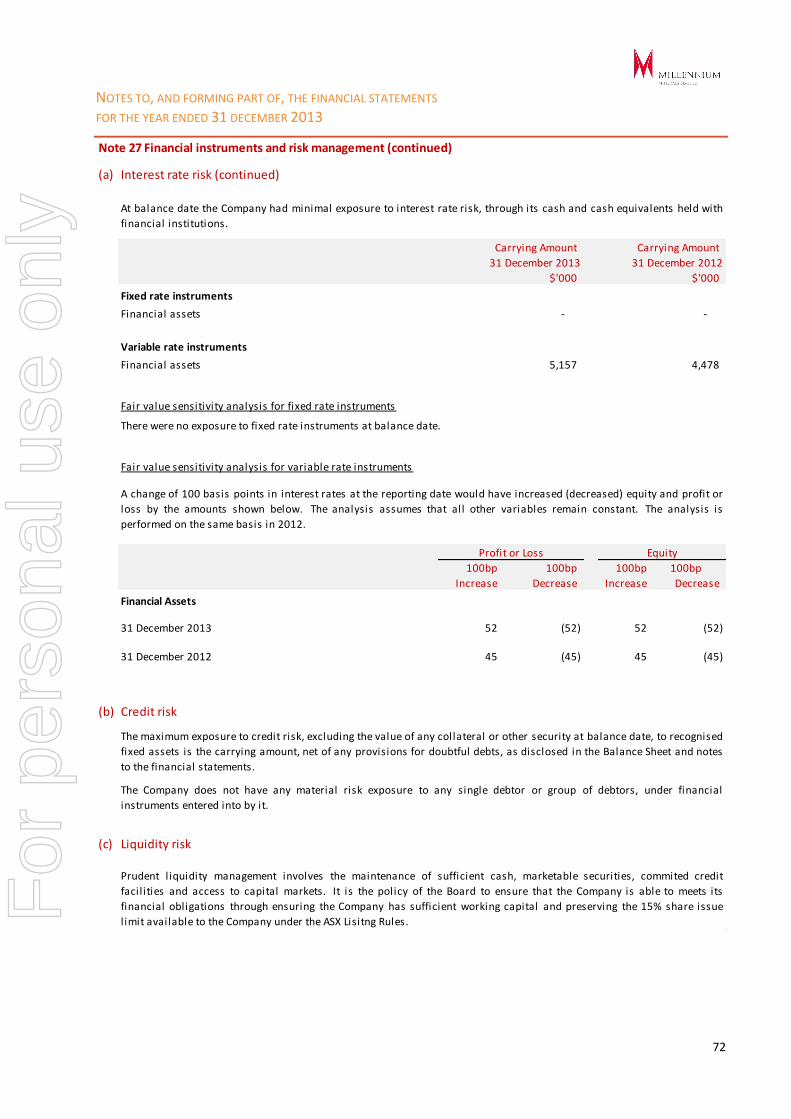
NOTES TO, AND FORMING PART OF, THE FINANCIAL STATEMENTS FOR THE YEAR ENDED 31 DECEMBER 2013
72
Note 27 Financial instruments and risk management (continued)
(a) Interest rate risk (continued)
$'000 $'000
Fixed rate instruments
Financial assets - -
Variable rate instruments
Financial assets 5,157 4,478
Fair value sensitivity analysis for fixed rate instruments
There were no exposure to fixed rate instruments at balance date.
Fair value sensitivity analysis for variable rate instruments
100bp 100bp 100bp 100bp
Increase Decrease Increase Decrease
Financial Assets
31 December 2013 52 (52) 52 (52)
31 December 2012 45 (45) 45 (45)
(b) Credit risk
(c) Liquidity risk
At balance date the Company had minimal exposure to interest rate risk, through its cash and cash equivalents held with
financial institutions.
Carrying Amount
31 December 2012
Carrying Amount
31 December 2013
Profit or Loss Equity
The maximum exposure to credit risk, excluding the value of any collateral or other security at balance date, to recognised
fixed assets is the carrying amount, net of any provisions for doubtful debts, as disclosed in the Balance Sheet and notes
to the financial statements.
The Company does not have any material risk exposure to any single debtor or group of debtors, under financial
instruments entered into by it.
Prudent liquidity management involves the maintenance of sufficient cash, marketable securities, commited credit
facil ities and access to capital markets. It is the policy of the Board to ensure that the Company is able to meets its
financial obligations through ensuring the Company has sufficient working capital and preserving the 15% share issue
limit available to the Company under the ASX Lisitng Rules.
A change of 100 basis points in interest rates at the reporting date would have increased (decreased) equity and profit or
loss by the amounts shown below. The analysis assumes that all other variables remain constant. The analysis is
performed on the same basis in 2012.
For
per
sona
l use
onl
y

NOTES TO, AND FORMING PART OF, THE FINANCIAL STATEMENTS FOR THE YEAR ENDED 31 DECEMBER 2013
73
Note 27 Financial instruments and risk management (continued)
(d) Net fair values
Methods and assumptions used in determining net fair value:
(e) Financial risk management
$'000 $'000
Financial assets
- derivative instruments current 9,739 202
- derivative instruments non-current 4,858 -
14,597 202
Financial l iabil ities
- derivative instruments non-current - 1777
(f) Commodity price risk
Volume Price
Value of
committed
sales
2013 ounces $ $'000
Not later than one year 50,008 1,574 78,727
Later than one year and not later than five 22,050 1,637 36,102
72,058 1,594 114,829
2012
Not later than one year 32,000 1,646 52,679
Later than one year and not later than five 62,100 1,687 104,733
94,100 1,673 157,412
For assets and other liabilities, the net fair value approximates their carrying value. No financial assets and financial
l iabilities are readily traded on organised markets in standardised form, other than listed investments. The Company has
no financial assets where carrying amount exceeds net fair values at balance date.
The aggregate net fair values and carrying amounts of financial assets and financial l iabilities are disclosed in the
Statement of Financial Position and in the notes to and forming part of the financial statements.
The maximum exposure to credit risk, excluding the value of any collateral or other security, at balance date, to
recognised financial assets is the carrying amount, net of any provisions for doubtful debts, as disclosed in the Statement
of Financial Position and notes to the fnancial statements.
31 December 2013 31 December 2012
Fair values of derivative instruments are determined using valuation techniques incorporating observable market data
relevant to the hedge position.
The Company is exposed to movements in the gold price. As part of the risk management policy of the Company and in
compliance with the conditions required by the Company's financier, the Company has entered into AUD gold forward
contracts to manage the gold price of a proportion of anticipated sales of gold. It is management's intention to settle each
contract through physical delivery of gold. The following table summarised the gold hedging facil ities held with BNP
Paribas and National Australia Bank.
The forward sale programme is managed in accordance with policies approved by the Board. Performance under these
policies is regularly reported to the Board.
For
per
sona
l use
onl
y
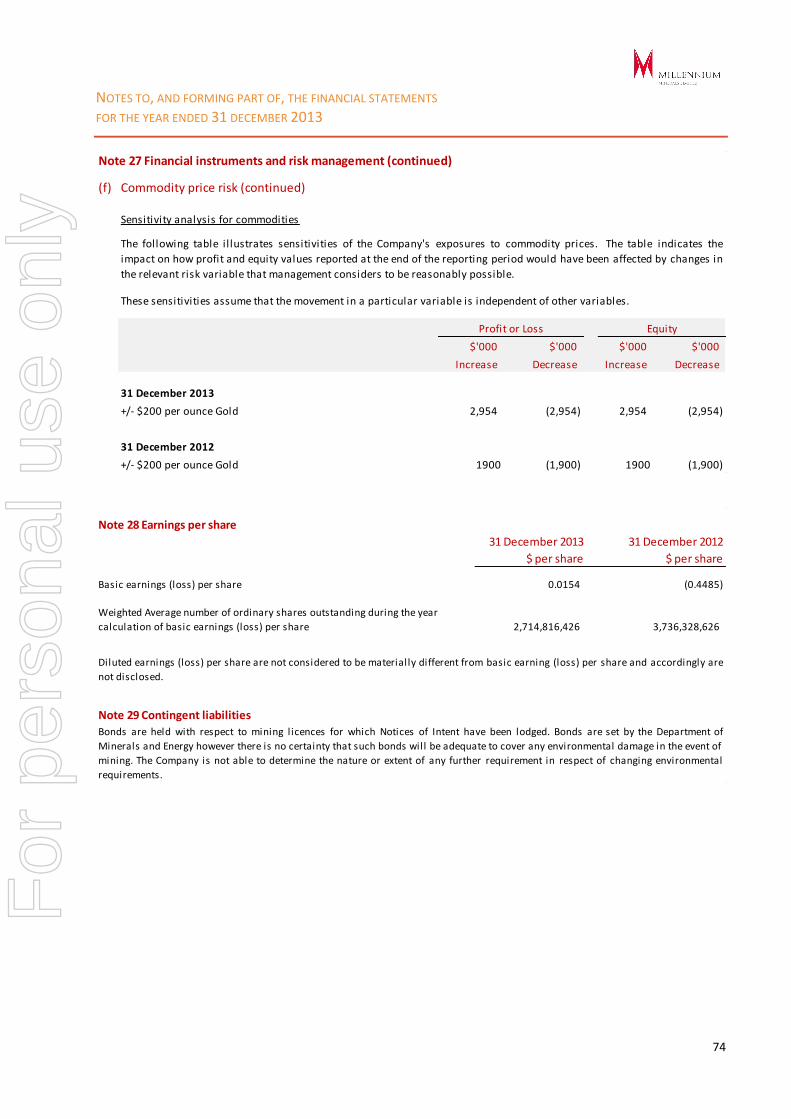
NOTES TO, AND FORMING PART OF, THE FINANCIAL STATEMENTS FOR THE YEAR ENDED 31 DECEMBER 2013
74
Note 27 Financial instruments and risk management (continued)
(f) Commodity price risk (continued)
Sensitivity analysis for commodities
$'000 $'000 $'000 $'000
Increase Decrease Increase Decrease
31 December 2013
+/- $200 per ounce Gold 2,954 (2,954) 2,954 (2,954)
31 December 2012
+/- $200 per ounce Gold 1900 (1,900) 1900 (1,900)
The following table illustrates sensitivities of the Company's exposures to commodity prices. The table indicates the
impact on how profit and equity values reported at the end of the reporting period would have been affected by changes in
the relevant risk variable that management considers to be reasonably possible.
These sensitivities assume that the movement in a particular variable is independent of other variables.
Profit or Loss Equity
Note 28 Earnings per share
31 December 2013 31 December 2012
$ per share $ per share
Basic earnings (loss) per share 0.0154 (0.4485)
2,714,816,426 3,736,328,626
Note 29 Contingent liabilities
Weighted Average number of ordinary shares outstanding during the year
calculation of basic earnings (loss) per share
Diluted earnings (loss) per share are not considered to be materially different from basic earning (loss) per share and accordingly are
not disclosed.
Bonds are held with respect to mining licences for which Notices of Intent have been lodged. Bonds are set by the Department of
Minerals and Energy however there is no certainty that such bonds will be adequate to cover any environmental damage in the event of
mining. The Company is not able to determine the nature or extent of any further requirement in respect of changing environmental
requirements.
For
per
sona
l use
onl
y

NOTES TO, AND FORMING PART OF, THE FINANCIAL STATEMENTS FOR THE YEAR ENDED 31 DECEMBER 2013
75
Note 30 Key management personnel
(a) Names of Directors and key management personnel
The persons holding positions as Directors and key management personnel of the Company during the financial year were:
Directors
P Rowe Chairman
B Rear Managing Director and Chief Executive Officer (appointed as Managing Director on 21 June 2013)
R Gillon Non-executive Director
R Procter Non-executive Director
J Morton Non-executive Director (appointed on 21 June 2013)
S Durack Non-executive Director (retired on 30 June 2013)
Key management personnel
R Hill Chief Financial Officer
S Pooley General Manager - Operations
G Dovaston General Manager - Projects (appointed on 29 January 2014)
P O’Connor General Manager – Projects (retired on 31 December 2013)
(b) Executives remuneration
(c) Key management personnel remuneration
(d) Director's interest
(e) Other transactions with specific directors
(f) Related party transactions
Other than the transactions disclosed above there are no other transactions between related parties that require disclosure.
The Company has taken advantage of the relief provided by Corporations Regulation 2M.6.04 and has transferred the directors’
interests disclosures to the Directors’ Report. The relevant information can be found within the Remuneration Report section of the
Directors’ Report.
Mr Simon Durack is a director of Advanced Management Services Australia Pty Ltd, a company owned and controlled by him,
which was paid a total of $14,286 (2012: $60,000) for corporate secretarial services.
These fees and disbursements exclude benefits included in the aggregate amount of emoluments received or due and receivable by
Directors as director’s fees and shown in the financial statements, prepared in accordance with the Corporations Regulations, or
the fixed salary of a full time employee.
The Company has taken advantage of the relief provided by Corporations Regulation 2M.6.04 and has transferred the directors’
interests disclosures to the Directors’ Report. The relevant information can be found within the Remuneration Report section of the
Directors’ Report.
The Company has taken advantage of the relief provided by Corporations Regulation 2M.6.04 and has transferred the directors’
interests disclosures to the Directors’ Report. The relevant information can be found within the Remuneration Report section of the
Directors’ Report.
For
per
sona
l use
onl
y

NOTES TO, AND FORMING PART OF, THE FINANCIAL STATEMENTS FOR THE YEAR ENDED 31 DECEMBER 2013
76
Note 31 Events subsequent to balance date
On 19 March 2014 the Company announced that a $7 million subordinated working capital facil ity (Facility) had been agreed with
major shareholder, the IMC Group (IMC). The Facility is subordinated to the Senior Facility Agreement (the “Senior Facility”) that
Millennium currently has with BNP Paribas and National Australia Bank and to the Finance Lease facility provided by National
Australia Bank. The Facility is unsecured and attracts fees and an interest rate typical for a facility of this nature. In consideration of
the provision of the Facility, Millennium will issue 10 million three year options to IMC. The exercise price will be the lower of the ten
day VWAP following the release by Millennium of the updated Life of Mine (LOM) metrics and 2014 guidance and the price of any
substantial capital raising undertaken by Millennium in the future. The maturity date of the Facility is 30 days following the
repayment in full of the Senior Facility unless repaid earlier as a result of a refinancing.
Subsequent to year end, the Company’s senior debt providers agreed to extend the previous waiver and subject to final documentation
and various conditions, to revise the schedule of principal repayments and the maturity date of the Senior Facility. The revised
schedule of principal repayments for 2014 is $13.0 million. The previous repayment profile that was in existence at 31 December 2014
that governed the current versus non-current classification of the liability in the statement of financial position required repayments
of $26.4 mill ion for 2014 (note 20). This restructure significantly improves the working capital position of the company.
For
per
sona
l use
onl
y
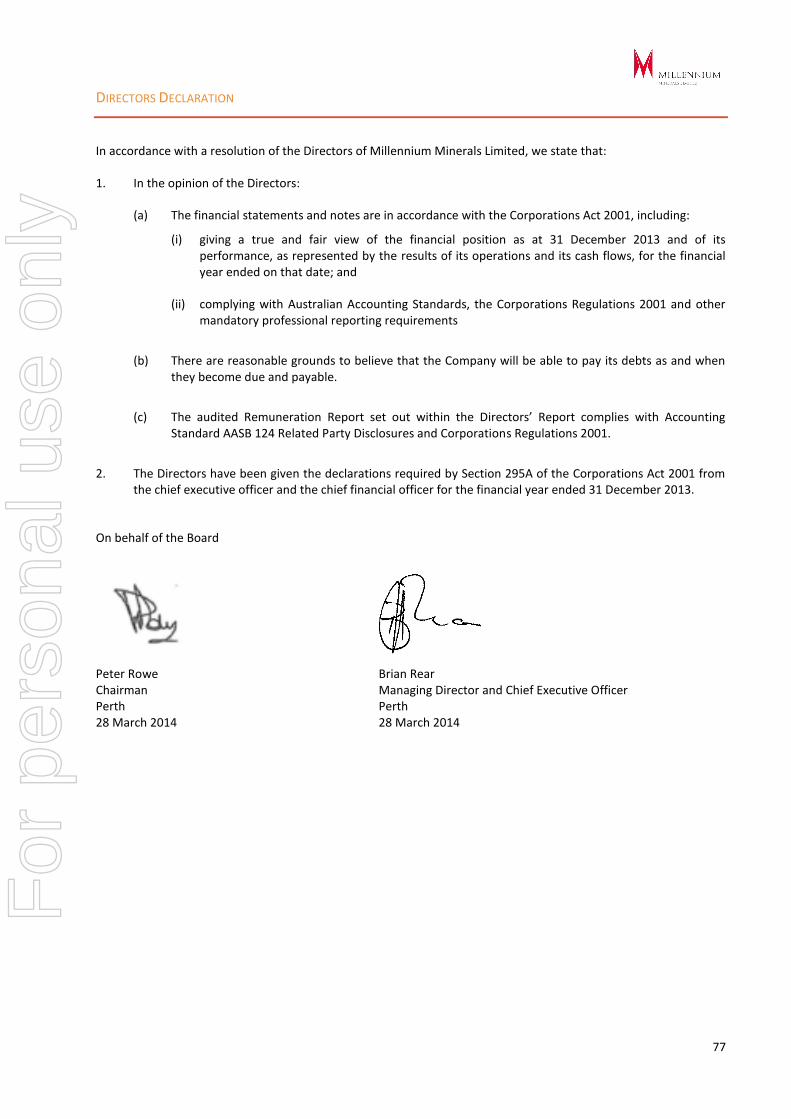
DIRECTORS DECLARATION
77
In accordance with a resolution of the Directors of Millennium Minerals Limited, we state that:
1. In the opinion of the Directors:
(a) The financial statements and notes are in accordance with the Corporations Act 2001, including:
(i) giving a true and fair view of the financial position as at 31 December 2013 and of its performance, as represented by the results of its operations and its cash flows, for the financial year ended on that date; and
(ii) complying with Australian Accounting Standards, the Corporations Regulations 2001 and other mandatory professional reporting requirements
(b) There are reasonable grounds to believe that the Company will be able to pay its debts as and when they become due and payable.
(c) The audited Remuneration Report set out within the Directors’ Report complies with Accounting Standard AASB 124 Related Party Disclosures and Corporations Regulations 2001.
2. The Directors have been given the declarations required by Section 295A of the Corporations Act 2001 from the chief executive officer and the chief financial officer for the financial year ended 31 December 2013.
On behalf of the Board
Peter Rowe Brian Rear Chairman Managing Director and Chief Executive Officer Perth Perth 28 March 2014 28 March 2014
For
per
sona
l use
onl
y

For
per
sona
l use
onl
y
For
per
sona
l use
onl
y
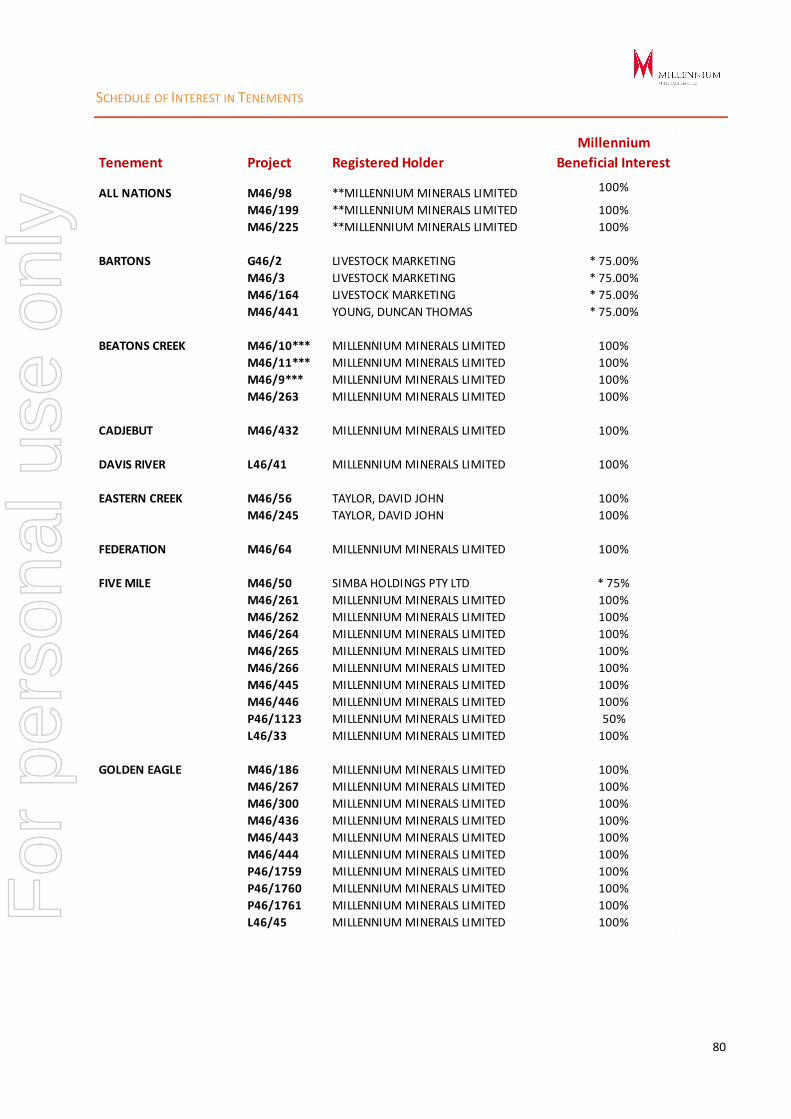
SCHEDULE OF INTEREST IN TENEMENTS
80
Tenement Project Registered Holder
Millennium
Beneficial Interest
ALL NATIONS M46/98 **MILLENNIUM MINERALS LIMITED 100%
M46/199 **MILLENNIUM MINERALS LIMITED 100%
M46/225 **MILLENNIUM MINERALS LIMITED 100%
BARTONS G46/2 LIVESTOCK MARKETING * 75.00%
M46/3 LIVESTOCK MARKETING * 75.00%
M46/164 LIVESTOCK MARKETING * 75.00%
M46/441 YOUNG, DUNCAN THOMAS * 75.00%
BEATONS CREEK M46/10*** MILLENNIUM MINERALS LIMITED 100%
M46/11*** MILLENNIUM MINERALS LIMITED 100%
M46/9*** MILLENNIUM MINERALS LIMITED 100%
M46/263 MILLENNIUM MINERALS LIMITED 100%
CADJEBUT M46/432 MILLENNIUM MINERALS LIMITED 100%
DAVIS RIVER L46/41 MILLENNIUM MINERALS LIMITED 100%
EASTERN CREEK M46/56 TAYLOR, DAVID JOHN 100%
M46/245 TAYLOR, DAVID JOHN 100%
FEDERATION M46/64 MILLENNIUM MINERALS LIMITED 100%
FIVE MILE M46/50 SIMBA HOLDINGS PTY LTD * 75%
M46/261 MILLENNIUM MINERALS LIMITED 100%
M46/262 MILLENNIUM MINERALS LIMITED 100%
M46/264 MILLENNIUM MINERALS LIMITED 100%
M46/265 MILLENNIUM MINERALS LIMITED 100%
M46/266 MILLENNIUM MINERALS LIMITED 100%
M46/445 MILLENNIUM MINERALS LIMITED 100%
M46/446 MILLENNIUM MINERALS LIMITED 100%
P46/1123 MILLENNIUM MINERALS LIMITED 50%
L46/33 MILLENNIUM MINERALS LIMITED 100%
GOLDEN EAGLE M46/186 MILLENNIUM MINERALS LIMITED 100%
M46/267 MILLENNIUM MINERALS LIMITED 100%
M46/300 MILLENNIUM MINERALS LIMITED 100%
M46/436 MILLENNIUM MINERALS LIMITED 100%
M46/443 MILLENNIUM MINERALS LIMITED 100%
M46/444 MILLENNIUM MINERALS LIMITED 100%
P46/1759 MILLENNIUM MINERALS LIMITED 100%
P46/1760 MILLENNIUM MINERALS LIMITED 100%
P46/1761 MILLENNIUM MINERALS LIMITED 100%
L46/45 MILLENNIUM MINERALS LIMITED 100%For
per
sona
l use
onl
y
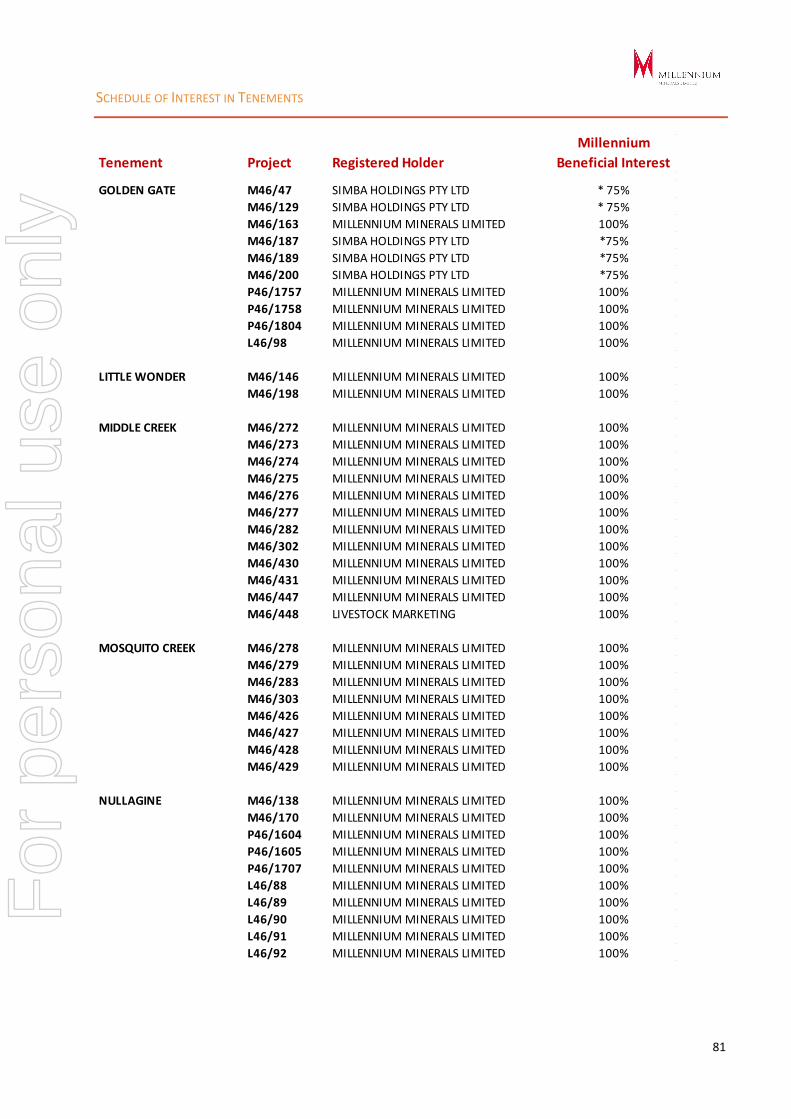
SCHEDULE OF INTEREST IN TENEMENTS
81
Tenement Project Registered Holder
Millennium
Beneficial Interest
GOLDEN GATE M46/47 SIMBA HOLDINGS PTY LTD * 75%
M46/129 SIMBA HOLDINGS PTY LTD * 75%
M46/163 MILLENNIUM MINERALS LIMITED 100%
M46/187 SIMBA HOLDINGS PTY LTD *75%
M46/189 SIMBA HOLDINGS PTY LTD *75%
M46/200 SIMBA HOLDINGS PTY LTD *75%
P46/1757 MILLENNIUM MINERALS LIMITED 100%
P46/1758 MILLENNIUM MINERALS LIMITED 100%
P46/1804 MILLENNIUM MINERALS LIMITED 100%
L46/98 MILLENNIUM MINERALS LIMITED 100%
LITTLE WONDER M46/146 MILLENNIUM MINERALS LIMITED 100%
M46/198 MILLENNIUM MINERALS LIMITED 100%
MIDDLE CREEK M46/272 MILLENNIUM MINERALS LIMITED 100%
M46/273 MILLENNIUM MINERALS LIMITED 100%
M46/274 MILLENNIUM MINERALS LIMITED 100%
M46/275 MILLENNIUM MINERALS LIMITED 100%
M46/276 MILLENNIUM MINERALS LIMITED 100%
M46/277 MILLENNIUM MINERALS LIMITED 100%
M46/282 MILLENNIUM MINERALS LIMITED 100%
M46/302 MILLENNIUM MINERALS LIMITED 100%
M46/430 MILLENNIUM MINERALS LIMITED 100%
M46/431 MILLENNIUM MINERALS LIMITED 100%
M46/447 MILLENNIUM MINERALS LIMITED 100%
M46/448 LIVESTOCK MARKETING 100%
MOSQUITO CREEK M46/278 MILLENNIUM MINERALS LIMITED 100%
M46/279 MILLENNIUM MINERALS LIMITED 100%
M46/283 MILLENNIUM MINERALS LIMITED 100%
M46/303 MILLENNIUM MINERALS LIMITED 100%
M46/426 MILLENNIUM MINERALS LIMITED 100%
M46/427 MILLENNIUM MINERALS LIMITED 100%
M46/428 MILLENNIUM MINERALS LIMITED 100%
M46/429 MILLENNIUM MINERALS LIMITED 100%
NULLAGINE M46/138 MILLENNIUM MINERALS LIMITED 100%
M46/170 MILLENNIUM MINERALS LIMITED 100%
P46/1604 MILLENNIUM MINERALS LIMITED 100%
P46/1605 MILLENNIUM MINERALS LIMITED 100%
P46/1707 MILLENNIUM MINERALS LIMITED 100%
L46/88 MILLENNIUM MINERALS LIMITED 100%
L46/89 MILLENNIUM MINERALS LIMITED 100%
L46/90 MILLENNIUM MINERALS LIMITED 100%
L46/91 MILLENNIUM MINERALS LIMITED 100%
L46/92 MILLENNIUM MINERALS LIMITED 100%
For
per
sona
l use
onl
y
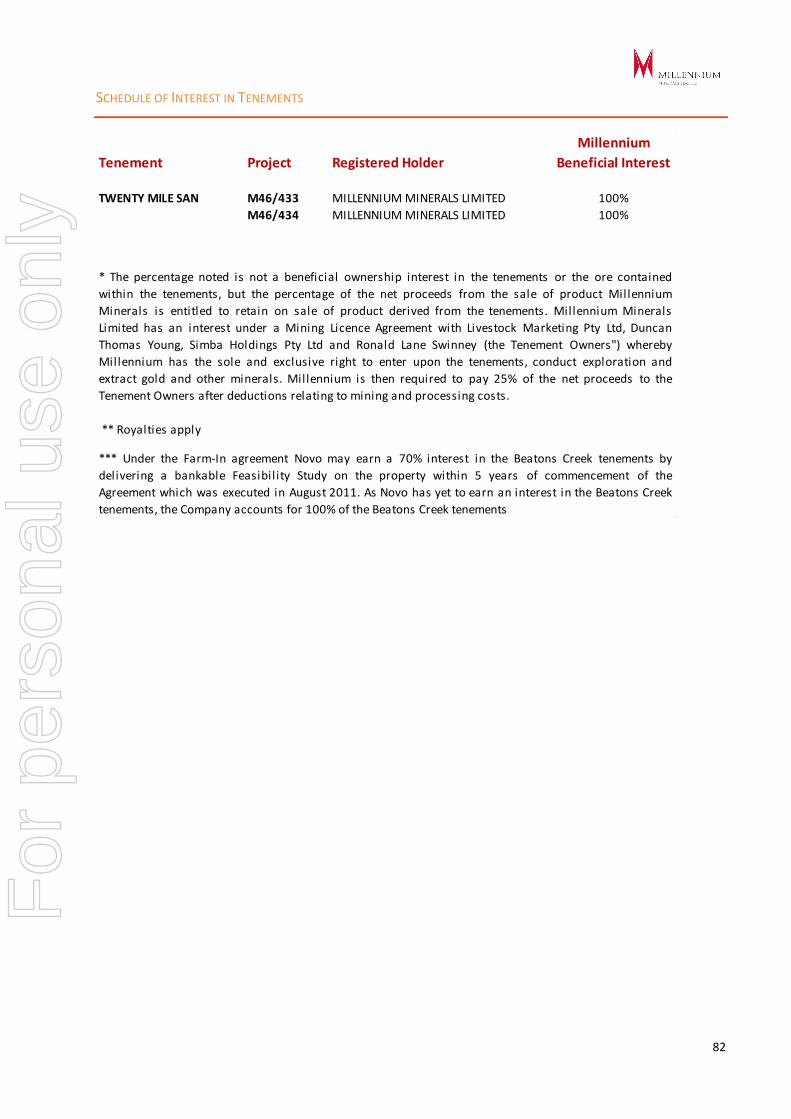
SCHEDULE OF INTEREST IN TENEMENTS
82
Tenement Project Registered Holder
Millennium
Beneficial Interest
TWENTY MILE SAN M46/433 MILLENNIUM MINERALS LIMITED 100%
M46/434 MILLENNIUM MINERALS LIMITED 100%
** Royalties apply
* The percentage noted is not a beneficial ownership interest in the tenements or the ore contained
within the tenements, but the percentage of the net proceeds from the sale of product Millennium
Minerals is entitled to retain on sale of product derived from the tenements. Millennium Minerals
Limited has an interest under a Mining Licence Agreement with Livestock Marketing Pty Ltd, Duncan
Thomas Young, Simba Holdings Pty Ltd and Ronald Lane Swinney (the Tenement Owners") whereby
Millennium has the sole and exclusive right to enter upon the tenements, conduct exploration and
extract gold and other minerals. Millennium is then required to pay 25% of the net proceeds to the
Tenement Owners after deductions relating to mining and processing costs.
*** Under the Farm-In agreement Novo may earn a 70% interest in the Beatons Creek tenements by
delivering a bankable Feasibility Study on the property within 5 years of commencement of the
Agreement which was executed in August 2011. As Novo has yet to earn an interest in the Beatons Creek
tenements, the Company accounts for 100% of the Beatons Creek tenements
For
per
sona
l use
onl
y

SUPPLEMENTARY INFORMATION
83
Stock Exchange Listing
Substantial Shareholders (Holding not less than 5%)
Total Number of
Voting Share in the
Company in which
the Substantial
Shareholders and
its Associates Hold
Relevant Interests
Percentage of Total
Number of Voting
Shares (%)
RBC INVESTOR SERVICES AUSTRALIA NOMINEES PTY LIMITED <RVGAF2 A/C> 44,374,951 20.38
CITICORP NOMINEES PTY LIMITED 24,524,070 11.27
J P MORGAN NOMINEES AUSTRALIA LIMITED 14,380,904 6.61
IMC RESOURCES LTD 14,075,424 6.47
PERSHING AUSTRALIA NOMINEES PTY LTD <PETRA ACCOUNT> 12,515,020 5.75
Class of Shares and Voting Rights
(a)
(b)
(c)
Distribution of Security Holders
Number of Shares Held Number of Shareholders
1 - 1,000 1,792
1,001 - 5,000 1,570
5,001 - 10,000 528
10,001 - 100,000 986
100,001 and over 152
5,028
Millennium Minerals Limited shares are l isted on the Australian Securities Exchange. The Company’s ASX code is MOY.
As at 11th March 2014
As at 11th of March 2014 there were 5,028 holders of 217,695,372 ordinary fully paid shares of the Company. The voting rights
attaching to the ordinary shares are in accordance with the Company’s Constitution being that:
There are no voting rights attached to the options in the Company. Voting rights will be attached to the unissued ordinary shares when
options have been exercised.
each Shareholder entitled to vote may vote in person or by proxy, attorney or Representative;
on a show of hands, every person present who is a Shareholder or a proxy, attorney or Representative of a shareholder has one
vote; and
on a poll, every person present who is a shareholder or a proxy, attorney or Representative of a shareholder shall, in respect of
each fully paid Share held by him, or in respect of which he is appointed a proxy, attorney or Representative, have one vote for
the Share, but in respect of partly paid Shares, shall, have such number of votes as bears the proportion which the paid amount
(not credited) is of the total amounts paid and payable (excluding amounts credited).
Name of Shareholder
For
per
sona
l use
onl
y

SUPPLEMENTARY INFORMATION
84
Cash Usage
Listing of 20 Largest Shareholders
Name of Ordinary Shareholder
Number of Shares
Held
Percentage of
Shares Held (%)
1 RBC INVESTOR SERVICES AUSTRALIA NOMINEES PTY LIMITED <RVGAF2 A/C> 44,374,951 20.384
2 CITICORP NOMINEES PTY LIMITED 24,524,070 11.265
3 J P MORGAN NOMINEES AUSTRALIA LIMITED 14,380,904 6.606
4 IMC RESOURCES LTD 14,075,424 6.466
5 PERSHING AUSTRALIA NOMINEES PTY LTD 12,515,020 5.749
6 FOCUS ASSET MANAGEMENT PTY LTD <KEY GRAND SUPER FUND A/C> 6,623,685 3.043
7 HSBC CUSTODY NOMINEES (AUSTRALIA) LIMITED 6,249,806 2.871
8 DOG MEAT PTY LTD <DM A/C> 3,800,000 1.746
9 OAKAJEE CORPORATION LTD C/- GDA CORPORATE 3,484,850 1.601
10 YANDAL INVESTMENTS PTY LTD 2,454,546 1.128
11 EQUITAS NOMINEES PTY LIMITED <2952441 A/C> 2,399,626 1.102
12 GLENEAGLE SECURITIES NOMINEES PTY LIMITED 2,000,000 0.919
13 PATICOA NOMINEES PTY LTD 1,806,870 0.83
14 NEFCO NOMINEES PTY LTD 1,702,555 0.782
15 MS ELIZA SIMPSON CLAPIN 1,400,863 0.643
16 CHEMCO SUPERANNUATION FUND PTY LTD 995,672 0.457
17 MR SHANE TEOH 988,637 0.454
18 MR MICHAEL WILLIAM RIDLEY 983,951 0.452
19 JMTL INVESTMENTS PTY LTD <JMTL SUPER FUND A/C> 977,273 0.449
20 TIERRA DE SUENOS SA 968,182 0.445
146,706,885 67.392
Unquoted Securities on Issue
Securities issued by the Company which are not l isted on the ASX are as follows:
Securities Number Holders
Name of holders
>80% Number held
1,136,000 2 - -
Options exercisable at 3.25 cents on or before
31 December 2014
Since the time of l isting on ASX, the entity has used its cash and assets in a form readily converted to cash that it had at the time of
admission to the official l ist of ASX in a manner which is consistent with its business objectives.
For
per
sona
l use
onl
y