for personal use only2020/04/17 · for personal use only over the course of the year, the group...
TRANSCRIPT

FRONTIER DIGITAL VENTURES LIMITED
ABN 25 609 183 959
ANNUAL REPORT For the financial year ended 31 December 2019
For
per
sona
l use
onl
y
Frontier Digital Ventures Limited And Controlled Entities
Chairman’s Letter
CHAIRMAN’S LETTER Fellow Shareholders, 2019 was another successful year for Frontier Digital Ventures. FDV invests in local entrepreneurs running online marketplaces in emerging markets. This strategy has been consistent since FDV listed in 2016, and our management group has continued to execute solidly against this strategy. Our portfolio companies grew total portfolio revenue strongly by approximately 74% year on year, whilst FDV‘s economic share of revenue grew by around 65%. Importantly, more of our portfolio companies than ever approached profitability in 2019, with four companies achieving positive EBITDA for the year. FDV’s share of portfolio EBITDA losses as a percentage of revenue fell from just under 27% in 2018, to less than 10% in 2019. During the last year FDV invested additional capital to increase our shareholdings in Infocasas and Autodeal, and since the year end, in iMyanmarhouse and LankaPropertyWeb. These companies all exhibit quality growth metrics and we were happy to increase our shareholdings. At the time of writing this letter to you the economic impact of the various measures being applied to deal with the COVID-19 disease was being felt all around the globe. Whilst this letter addresses Frontier Digital Venture’s last financial year, our portfolio companies are not, of course, immune against the economic impacts of the measures introduced to address the disease. As a result, Shaun and his team have been ensuring that portfolio companies realised the significance of the impact and that appropriate expense reductions and other measures were adopted in mitigation. We know that 2020 will be a challenging year for all of our portfolio companies. We will continue to assist them to weather the coronavirus economic storm, with the aim of achieving an even stronger market position when growth returns. Regards, Anthony Klok Chairman
For
per
sona
l use
onl
y
Frontier Digital Ventures Limited and Controlled Entities
CONTENTS
Page Directors’ Report 1 Remuneration Report 10 Consolidated Statement of Comprehensive Income 21 Consolidated Statement of Financial Position 23 Consolidated Statement of Changes in Equity 25 Consolidated Statement of Cash Flows 26 Notes to the Financial Statements 27 Directors’ Declaration 71 Independent Auditor’s Report to the Members of Frontier Digital Ventures Limited 72 Shareholder Information 77 Corporate Directory 79
For
per
sona
l use
onl
y
Frontier Digital Ventures Limited and Controlled Entities
Directors’ Report
1
DIRECTORS’ REPORT
The Directors of Frontier Digital Ventures Limited (“the Company” or “Frontier”) submit the annual financial report of the
Company and its subsidiaries (“the Group”) for the financial year ended 31 December 2019. In order to comply with the
provisions of the Corporations Act 2001, the Directors’ report is as follows:
Information about the Directors and senior management
The names and particulars of the Directors of the Company during, or since the end of, the financial year are as follows:
Anthony Klok Independent Director, non-executive Chairman
Shaun Di Gregorio Non-independent executive Director and Chief Executive Officer
Mark Licciardo Independent, non-executive Director and Joint Company Secretary
Belinda Cleminson Joint Company Secretary
Details of Directors of the Company, the Company Secretary, the Chief Executive Officer and key management personnel in
office at the date of this report, and each of their qualifications, experience and special responsibilities are below.
Name Experience
Anthony Klok (Independent Director, non-
executive Chairman)
Mr Klok has more than 35 years’ advisory and operational experience in
diverse areas including legal, corporate advisory, media and technology and
internet businesses. Mr Klok is an experienced lawyer and senior executive
with considerable experience in sourcing, negotiating and investing in online
and technology companies. Mr Klok has significant Board experience within
the online classifieds sector as a former non- executive Director of both
Carsales and Seek. Mr Klok’s current and previous board positions include
Friendsurance International, Friendsurance Australia, Genero (alternate),
Betfair Australia, Zoom2U, Temando, Service Seeking, Open Agent, Fox
Sports, Carsales, Seek, NineMSN, Ticketek, Sydney SuperDome, Wizard
and TMS.
Mr Klok holds a double degree of Bachelor of Commerce and Laws from
the University of Tasmania.
Shaun Di Gregorio (Non-independent
executive Director and Chief Executive
Officer)
During Mr Di Gregorio’s four year tenure as CEO of ASX listed company,
iProperty Group Limited, he led the transformation of iProperty Group from
a small online business with a market capitalisation of approximately $15
million into one of the largest listed Internet companies in ASEAN with a
market capitalisation of approximately $524 million. He was a non-executive
director of iCar Asia (ASX:ICQ) until June of 2016 and is an advisor to online
classifieds businesses around the world.
Mr Di Gregorio spent eight years as General Manager at Australia-based
REA Group, a global leader and publisher of as many as 20 real estate
websites in 12 countries. As General Manager of the core Australian
business and global leader at ‘realestate.com.au’, Mr Di Gregorio grew the
business alongside a team of eight people with revenue of AU$5million into
a company with more than 300 staff and revenues exceeding AU$150
million.
Mr Di Gregorio holds a Master of Business Administration from the
Australian Graduate School of Management, part of the University of New
South Wales.
For
per
sona
l use
onl
y
Frontier Digital Ventures Limited and Controlled Entities
Directors’ Report
2
Directors’ Report (cont’d) Information about the Directors and senior management (cont’d)
Name Experience
Mark Licciardo (Independent, non-
executive Director and Company
Secretary)
Mr Licciardo is the founder and Managing Director of Mertons Corporate
Services Pty Ltd. As a former company secretary of ASX 50 companies,
Transurban Group and Australian Foundation Investment Company Limited,
his expertise includes working with boards of directors in the areas of
corporate governance, business management, administration, consulting
and company secretarial matters. He is also the former Chairman of the
Governance Institute of Australia Victoria division, Academy of Design (LCI
Melbourne) and Melbourne Fringe Festival and a current non-executive
director of a number of public and private companies.
Mr Licciardo holds a Bachelor of Business Degree (Accounting) from Victoria
University and a Graduate Diploma in Company Secretarial Practice, is a
Fellow of the Australian Institute of Company Directors, the Institute of
Chartered Secretaries and Administrators and the Governance Institute of
Australia
Mr Licciardo is currently a director of Ensogo Limited and Mobilicom Limited,
ASX listed entities. He was recently a director of iCar Asia Limited.
Chan Shiao Mae
(Chief Financial Officer)
Miss Chan was previously the CFO of iProperty Group, holding office
through the period of acquisition by REA Group Ltd in 2016. Before joining
iProperty Group, she served as the Finance Director of Redgrave Partners
Group, a multi-tiered recruitment group based in London with operations in
Hong Kong and Singapore. Prior to that she was Group Financial
Accountant for AIM-listed Imprint PLC.
Miss Chan holds a Bachelor of Laws from the University of Exeter and is a
Fellow of the Institute of Chartered Accountants in England and Wales.
Jason Thoe
(Director of Growth & Operations - Auto
Verticals)
An established digital marketplace professional, Mr Thoe has held various
roles in successful online classifieds, technology and marketing consulting
entities throughout his career. Prior to joining FDV as Director of Growth &
Operations, he was instrumental in driving iCarAsia’s rapid growth in
various capacities across its 7 brands in 3 markets over his 4 year tenure.
Before that, he served as the head of marketing at PropertyGuru during its
pioneering phase in Malaysia.
Mr Thoe holds a Bachelor of Business Management (Hons.) from the
University of Queensland.
For
per
sona
l use
onl
y
Frontier Digital Ventures Limited and Controlled Entities
Directors’ Report
3
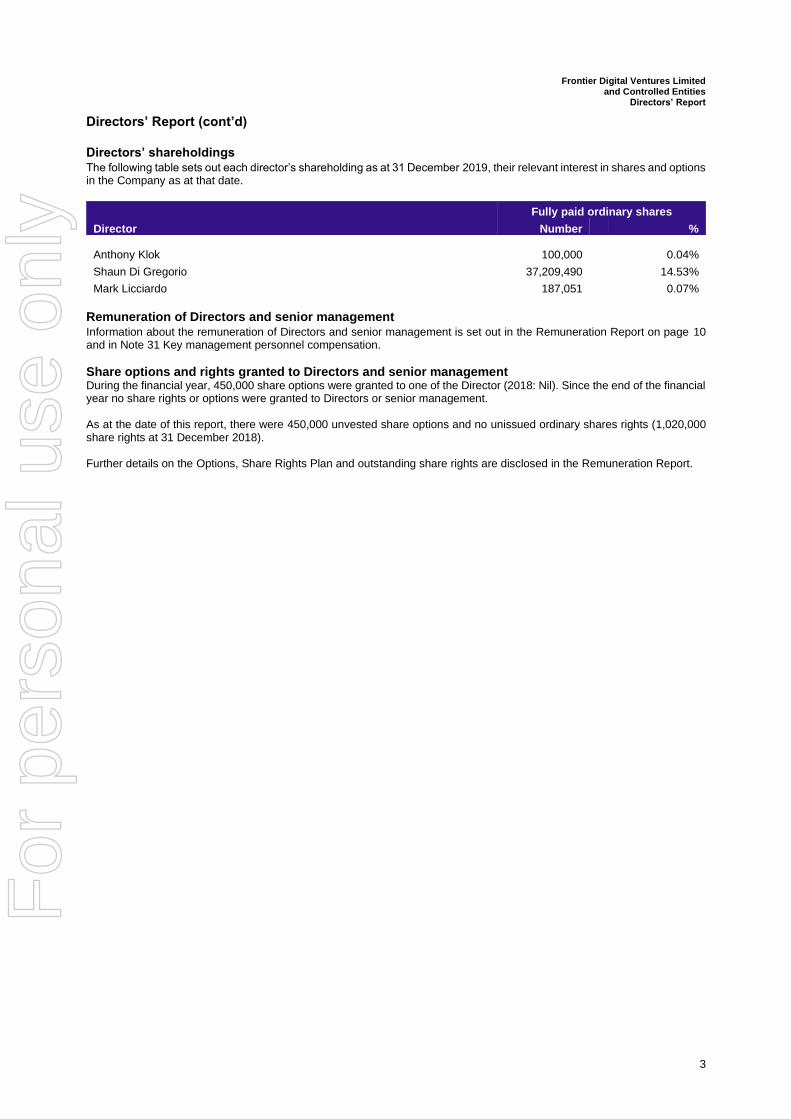
Directors’ Report (cont’d) Directors’ shareholdings The following table sets out each director’s shareholding as at 31 December 2019, their relevant interest in shares and options in the Company as at that date.
Fully paid ordinary shares
Director Number % Anthony Klok 100,000 0.04%
Shaun Di Gregorio 37,209,490 14.53%
Mark Licciardo 187,051 0.07%
Remuneration of Directors and senior management Information about the remuneration of Directors and senior management is set out in the Remuneration Report on page 10 and in Note 31 Key management personnel compensation.
Share options and rights granted to Directors and senior management During the financial year, 450,000 share options were granted to one of the Director (2018: Nil). Since the end of the financial year no share rights or options were granted to Directors or senior management. As at the date of this report, there were 450,000 unvested share options and no unissued ordinary shares rights (1,020,000 share rights at 31 December 2018). Further details on the Options, Share Rights Plan and outstanding share rights are disclosed in the Remuneration Report.
For
per
sona
l use
onl
y
Frontier Digital Ventures Limited and Controlled Entities
Directors’ Report
4
Directors’ Report (cont’d)
Principal activities The principal activity of the Group during the year was investing in and operating developing online classifieds businesses (“Operating Companies”) in emerging and developing countries or regions (“Target Markets”) which are markets at an early stage of online development, but with anticipated strong growth prospects. Over the course of the year, the Group has continued its geographical focus on Target Markets in developing Asia (excluding China and India), Central and South America, and Africa/MENA, with particular focus on South East Asia and South America.
Changes in State of Affairs The issued share capital of the Company increased by $9,165,392 from the issue of 11,951,903 shares during the year. As a result of a share placement, 6,759,097 ordinary shares were issued for cash of $5,238,300. A further 3,749,412 ordinary shares with a value $3,187,000 were issued as purchase consideration for an investment. The remaining shares of 1,443,394 with a value of $740,092 were issued to Directors and employees as share based payments.
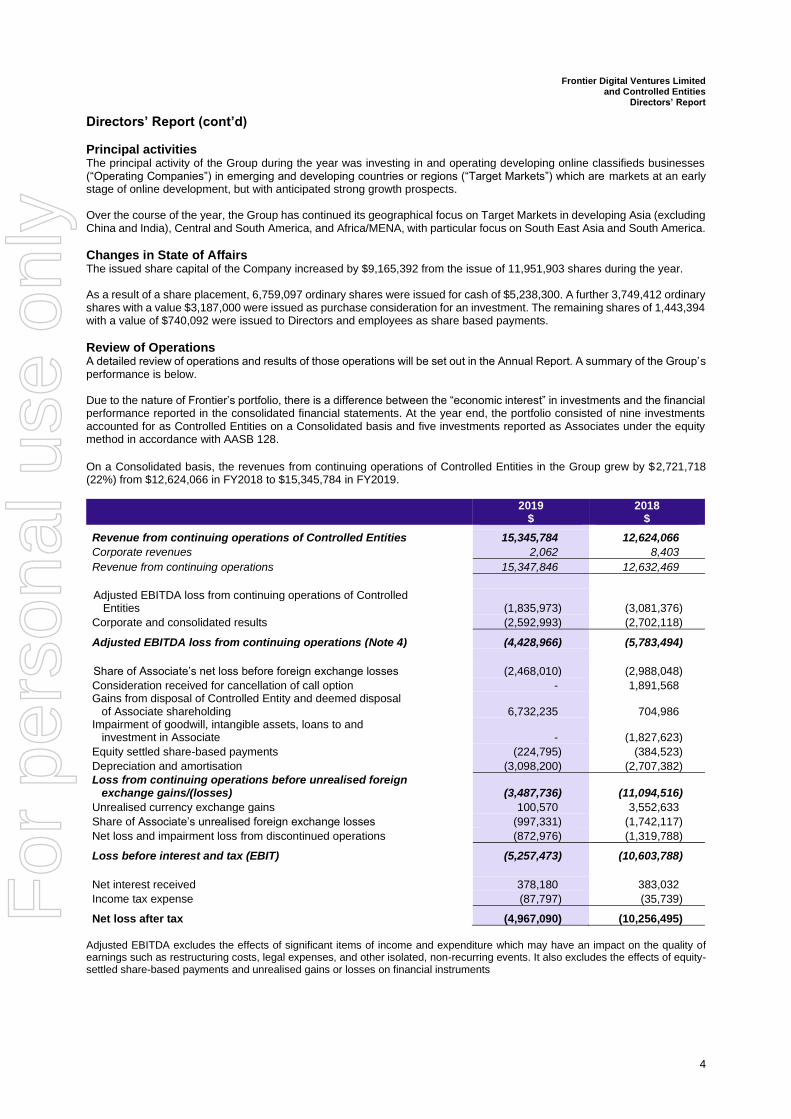
Review of Operations A detailed review of operations and results of those operations will be set out in the Annual Report. A summary of the Group’s performance is below. Due to the nature of Frontier’s portfolio, there is a difference between the “economic interest” in investments and the financial performance reported in the consolidated financial statements. At the year end, the portfolio consisted of nine investments accounted for as Controlled Entities on a Consolidated basis and five investments reported as Associates under the equity method in accordance with AASB 128.
On a Consolidated basis, the revenues from continuing operations of Controlled Entities in the Group grew by $2,721,718 (22%) from $12,624,066 in FY2018 to $15,345,784 in FY2019.
2019 $
2018 $
Revenue from continuing operations of Controlled Entities 15,345,784 12,624,066
Corporate revenues 2,062 8,403
Revenue from continuing operations 15,347,846 12,632,469
Adjusted EBITDA loss from continuing operations of Controlled Entities (1,835,973) (3,081,376)
Corporate and consolidated results (2,592,993) (2,702,118)
Adjusted EBITDA loss from continuing operations (Note 4) (4,428,966) (5,783,494)
Share of Associate’s net loss before foreign exchange losses (2,468,010) (2,988,048)
Consideration received for cancellation of call option - 1,891,568 Gains from disposal of Controlled Entity and deemed disposal of Associate shareholding 6,732,235 704,986 Impairment of goodwill, intangible assets, loans to and investment in Associate - (1,827,623)
Equity settled share-based payments (224,795) (384,523)
Depreciation and amortisation (3,098,200) (2,707,382)
Loss from continuing operations before unrealised foreign exchange gains/(losses) (3,487,736) (11,094,516)
Unrealised currency exchange gains 100,570 3,552,633
Share of Associate’s unrealised foreign exchange losses (997,331) (1,742,117)
Net loss and impairment loss from discontinued operations (872,976) (1,319,788)
Loss before interest and tax (EBIT) (5,257,473) (10,603,788)
Net interest received 378,180 383,032
Income tax expense (87,797) (35,739)
Net loss after tax (4,967,090) (10,256,495)
Adjusted EBITDA excludes the effects of significant items of income and expenditure which may have an impact on the quality of earnings such as restructuring costs, legal expenses, and other isolated, non-recurring events. It also excludes the effects of equity-settled share-based payments and unrealised gains or losses on financial instruments
For
per
sona
l use
onl
y

Frontier Digital Ventures Limited and Controlled Entities
Directors’ Report
5
Directors’ Report (cont’d)
Review of Operations (cont’d) During the year, the Group increased its equity interest in Autodeal and Infocasas to above 50% of issued shares. In doing so the Group acquired accounting control of Infocasas, generating a gain on deemed disposal of shareholdings in an associate of $6,732,235. The Group entered into a sale agreement to dispose of its entire shareholding in TechAfrica during the year. Completion conditions are expected to be fulfilled within 12 months and as such, TechAfrica is disclosed as an asset held for sale in the balance sheet. As part of the terms of the deal, outstanding loans from the Group to TechAfrica will be discharged following completion. The overall effect of this transaction will be a charge to the profit and loss account of $712,166. Since completion is expected to occur after the year end, the impairment loss recognised in the financial year was only $444,231. The remaining loss of $267,935 will be charged to the profit and loss upon completion of the disposal. The Group continues to carry a significant exposure to movements in the currency exchange rates between the United States Dollar (USD) and the Australian Dollar (AUD) although the impact of unrealised and realised foreign exchange gains and losses in 2019 is significantly less than in previous years. Most acquisitions are denominated in USD and USD is the functional currency of the intermediate holding company of the Group as well as a number of significant subsidiaries. The Group held 48% (2018: 33%) of its cash and Term Deposit balances in USD denominated accounts at the year end. Since the Group reports its financial results in AUD, it continues to carry significant currency reporting risks. This is reflected in the unrealised currency exchange gains of $100,570 reported in the current period (2018: unrealised currency exchange gains of $3,552,633). Portfolio of Operating Entities Economic Share Basis A more accurate reflection of the Group’s performance and contribution to shareholder wealth is the cumulative sum of the Group’s proportionate share of the Operating Entities, measuring the performance of each investments on an econom ic share basis, regardless of control and the accounting treatment applied. On an economic share basis, below is a summary of Revenue and Adjusted EBITDA since FY2016 for the full portfolio of Operating Entities:
Economic Share basis (Operating Entities)
2016 $’000
2017 $’000
2018 $’000
2019 $’000
Revenue 3,897 8,896 14,377 23,730
Revenue Growth (%) N/A 128% 62% 65%
Adjusted EBITDA (4,311) (4,352) (3,843) (2,263)
EBITDA loss (%) (111%) (49%) (27%) (10%)
Share price at 31 December $0.487 $0.695 $0.500 $0.815
100% Basis While a review of performance on an economic share basis is the best indicator of shareholder wealth through a valuation of the sum of parts, the best measure of underlying performances of the Operating Entities is through a review of performances on a 100% basis. Outlined below is a reconciliation bridging Revenues on an 100% basis to an economic share basis and to the accounting treatment for FY19.
72.7
15.5
57.2
Full year revenuefor all
investments(100%)
Revenue fromassociates
Full year revenuefor consolidated
investments(100%)
Accounting breakdown72.7
23.7
48.9
Full year revenuefor all
investments(100% basis)
Revenueattributable to
othershareholders
Fontier economicshare of full year
revenue
Economic breakdown
For
per
sona
l use
onl
y
Frontier Digital Ventures Limited and Controlled Entities
Directors’ Report
6
Directors’ Report (cont’d)
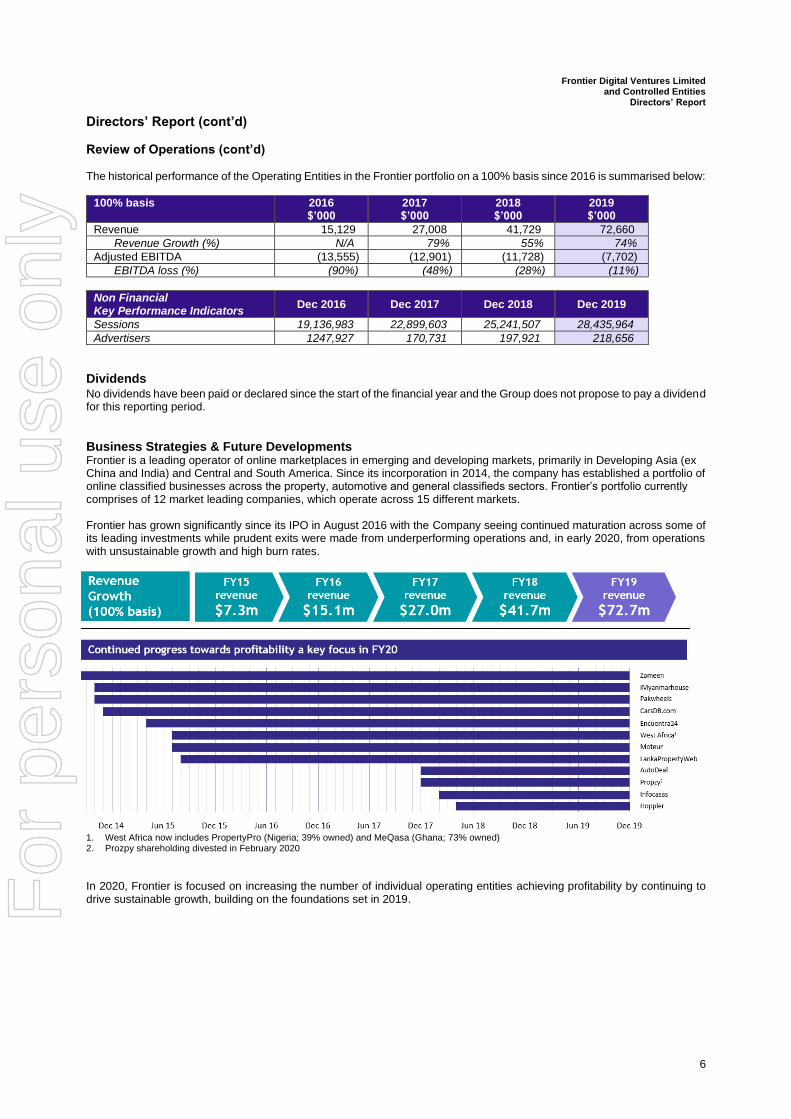
Review of Operations (cont’d) The historical performance of the Operating Entities in the Frontier portfolio on a 100% basis since 2016 is summarised below:
100% basis 2016 $’000
2017 $’000
2018 $’000
2019 $’000
Revenue 15,129 27,008 41,729 72,660
Revenue Growth (%) N/A 79% 55% 74%
Adjusted EBITDA (13,555) (12,901) (11,728) (7,702)
EBITDA loss (%) (90%) (48%) (28%) (11%)
Non Financial Key Performance Indicators
Dec 2016 Dec 2017 Dec 2018 Dec 2019
Sessions 19,136,983 22,899,603 25,241,507 28,435,964
Advertisers 1247,927 170,731 197,921 218,656
Dividends No dividends have been paid or declared since the start of the financial year and the Group does not propose to pay a dividend for this reporting period.
Business Strategies & Future Developments Frontier is a leading operator of online marketplaces in emerging and developing markets, primarily in Developing Asia (ex China and India) and Central and South America. Since its incorporation in 2014, the company has established a portfolio of online classified businesses across the property, automotive and general classifieds sectors. Frontier’s portfolio currently comprises of 12 market leading companies, which operate across 15 different markets. Frontier has grown significantly since its IPO in August 2016 with the Company seeing continued maturation across some of its leading investments while prudent exits were made from underperforming operations and, in early 2020, from operations with unsustainable growth and high burn rates.
1. West Africa now includes PropertyPro (Nigeria; 39% owned) and MeQasa (Ghana; 73% owned) 2. Prozpy shareholding divested in February 2020
In 2020, Frontier is focused on increasing the number of individual operating entities achieving profitability by continuing to drive sustainable growth, building on the foundations set in 2019.
For
per
sona
l use
onl
y
Frontier Digital Ventures Limited and Controlled Entities
Directors’ Report
7
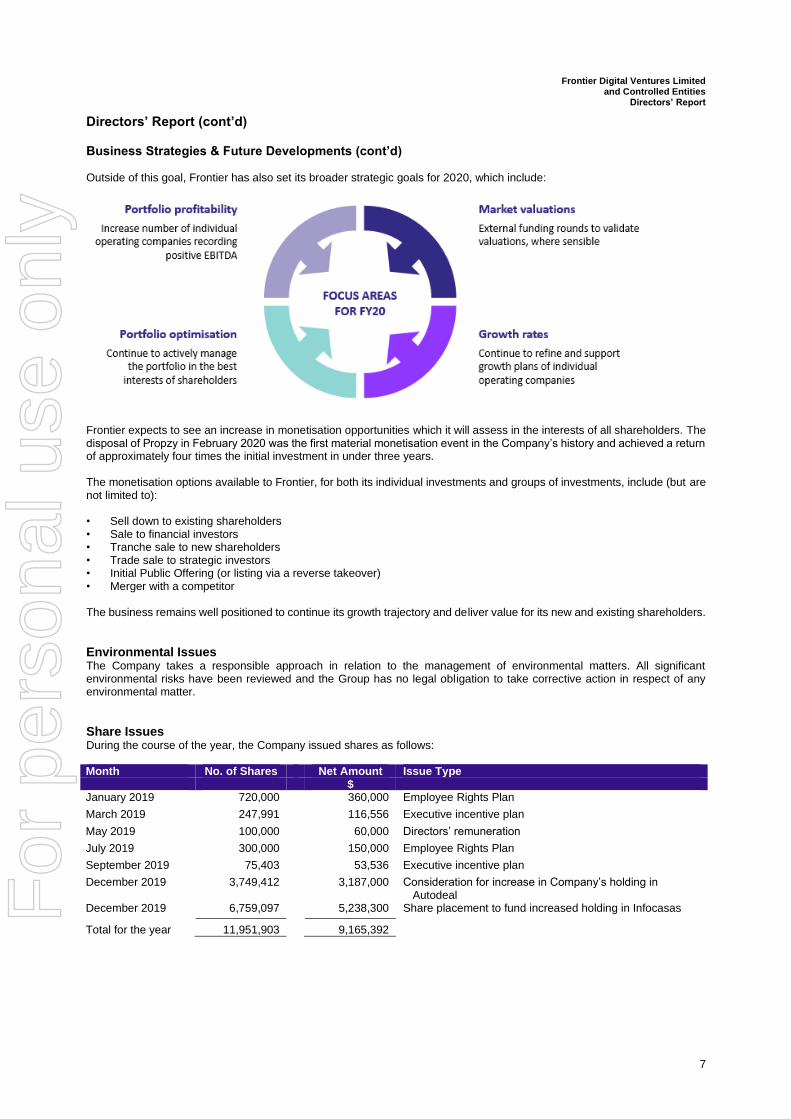
Directors’ Report (cont’d) Business Strategies & Future Developments (cont’d) Outside of this goal, Frontier has also set its broader strategic goals for 2020, which include:
Frontier expects to see an increase in monetisation opportunities which it will assess in the interests of all shareholders. The disposal of Propzy in February 2020 was the first material monetisation event in the Company’s history and achieved a return of approximately four times the initial investment in under three years. The monetisation options available to Frontier, for both its individual investments and groups of investments, include (but are not limited to): • Sell down to existing shareholders • Sale to financial investors • Tranche sale to new shareholders • Trade sale to strategic investors • Initial Public Offering (or listing via a reverse takeover) • Merger with a competitor The business remains well positioned to continue its growth trajectory and deliver value for its new and existing shareholders.
Environmental Issues The Company takes a responsible approach in relation to the management of environmental matters. All significant environmental risks have been reviewed and the Group has no legal obligation to take corrective action in respect of any environmental matter.
Share Issues During the course of the year, the Company issued shares as follows: Month No. of Shares Net Amount Issue Type $ January 2019 720,000 360,000 Employee Rights Plan
March 2019 247,991 116,556 Executive incentive plan
May 2019 100,000 60,000 Directors’ remuneration
July 2019 300,000 150,000 Employee Rights Plan
September 2019 75,403 53,536 Executive incentive plan
December 2019 3,749,412 3,187,000 Consideration for increase in Company’s holding in Autodeal
December 2019 6,759,097 5,238,300 Share placement to fund increased holding in Infocasas
Total for the year 11,951,903 9,165,392
For
per
sona
l use
onl
y
Frontier Digital Ventures Limited and Controlled Entities
Directors’ Report
8
Directors’ Report (cont’d)
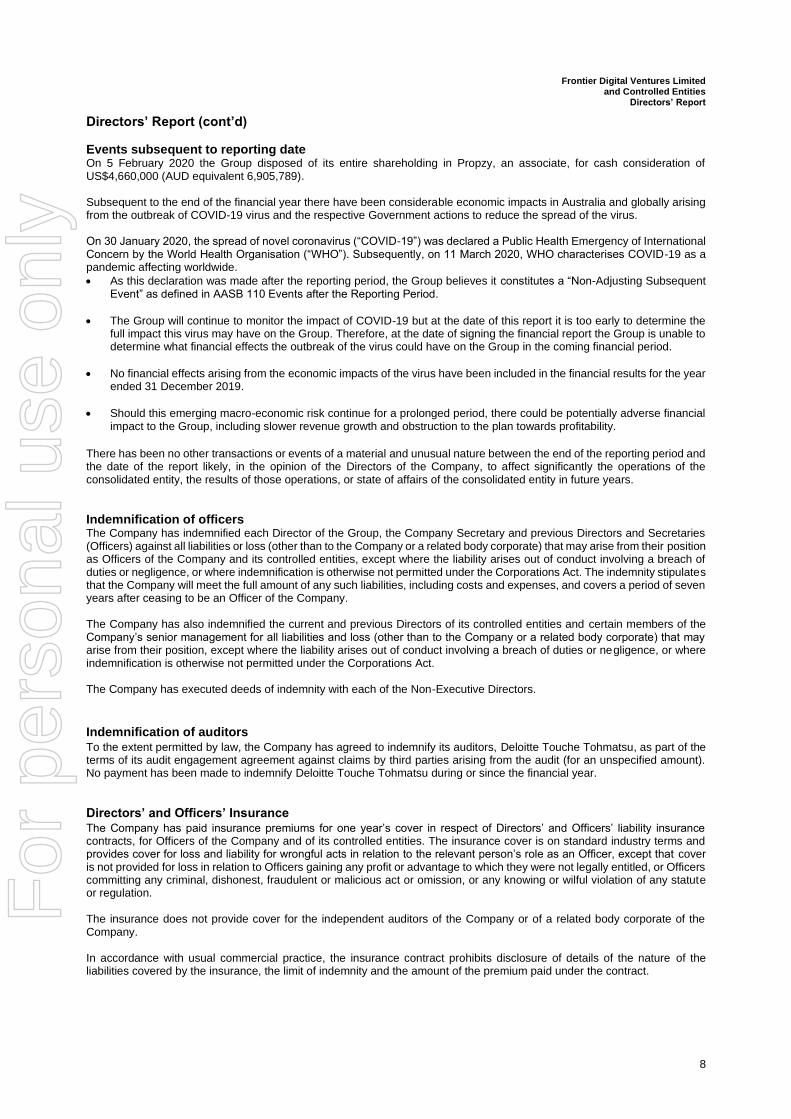
Events subsequent to reporting date On 5 February 2020 the Group disposed of its entire shareholding in Propzy, an associate, for cash consideration of US$4,660,000 (AUD equivalent 6,905,789). Subsequent to the end of the financial year there have been considerable economic impacts in Australia and globally arising from the outbreak of COVID-19 virus and the respective Government actions to reduce the spread of the virus. On 30 January 2020, the spread of novel coronavirus (“COVID-19”) was declared a Public Health Emergency of International Concern by the World Health Organisation (“WHO”). Subsequently, on 11 March 2020, WHO characterises COVID-19 as a pandemic affecting worldwide.
• As this declaration was made after the reporting period, the Group believes it constitutes a “Non-Adjusting Subsequent Event” as defined in AASB 110 Events after the Reporting Period.
• The Group will continue to monitor the impact of COVID-19 but at the date of this report it is too early to determine the full impact this virus may have on the Group. Therefore, at the date of signing the financial report the Group is unable to determine what financial effects the outbreak of the virus could have on the Group in the coming financial period.
• No financial effects arising from the economic impacts of the virus have been included in the financial results for the year ended 31 December 2019.
• Should this emerging macro-economic risk continue for a prolonged period, there could be potentially adverse financial impact to the Group, including slower revenue growth and obstruction to the plan towards profitability.
There has been no other transactions or events of a material and unusual nature between the end of the reporting period and the date of the report likely, in the opinion of the Directors of the Company, to affect significantly the operations of the consolidated entity, the results of those operations, or state of affairs of the consolidated entity in future years.
Indemnification of officers The Company has indemnified each Director of the Group, the Company Secretary and previous Directors and Secretaries (Officers) against all liabilities or loss (other than to the Company or a related body corporate) that may arise from their position as Officers of the Company and its controlled entities, except where the liability arises out of conduct involving a breach of duties or negligence, or where indemnification is otherwise not permitted under the Corporations Act. The indemnity stipulates that the Company will meet the full amount of any such liabilities, including costs and expenses, and covers a period of seven years after ceasing to be an Officer of the Company. The Company has also indemnified the current and previous Directors of its controlled entities and certain members of the Company’s senior management for all liabilities and loss (other than to the Company or a related body corporate) that may arise from their position, except where the liability arises out of conduct involving a breach of duties or negligence, or where indemnification is otherwise not permitted under the Corporations Act. The Company has executed deeds of indemnity with each of the Non-Executive Directors.
Indemnification of auditors To the extent permitted by law, the Company has agreed to indemnify its auditors, Deloitte Touche Tohmatsu, as part of the terms of its audit engagement agreement against claims by third parties arising from the audit (for an unspecified amount). No payment has been made to indemnify Deloitte Touche Tohmatsu during or since the financial year.
Directors’ and Officers’ Insurance The Company has paid insurance premiums for one year’s cover in respect of Directors’ and Officers’ liability insurance contracts, for Officers of the Company and of its controlled entities. The insurance cover is on standard industry terms and provides cover for loss and liability for wrongful acts in relation to the relevant person’s role as an Officer, except that cover is not provided for loss in relation to Officers gaining any profit or advantage to which they were not legally entitled, or Officers committing any criminal, dishonest, fraudulent or malicious act or omission, or any knowing or wilful violation of any statute or regulation. The insurance does not provide cover for the independent auditors of the Company or of a related body corporate of the Company. In accordance with usual commercial practice, the insurance contract prohibits disclosure of details of the nature of the liabilities covered by the insurance, the limit of indemnity and the amount of the premium paid under the contract.
For
per
sona
l use
onl
y
Frontier Digital Ventures Limited and Controlled Entities
Directors’ Report
9
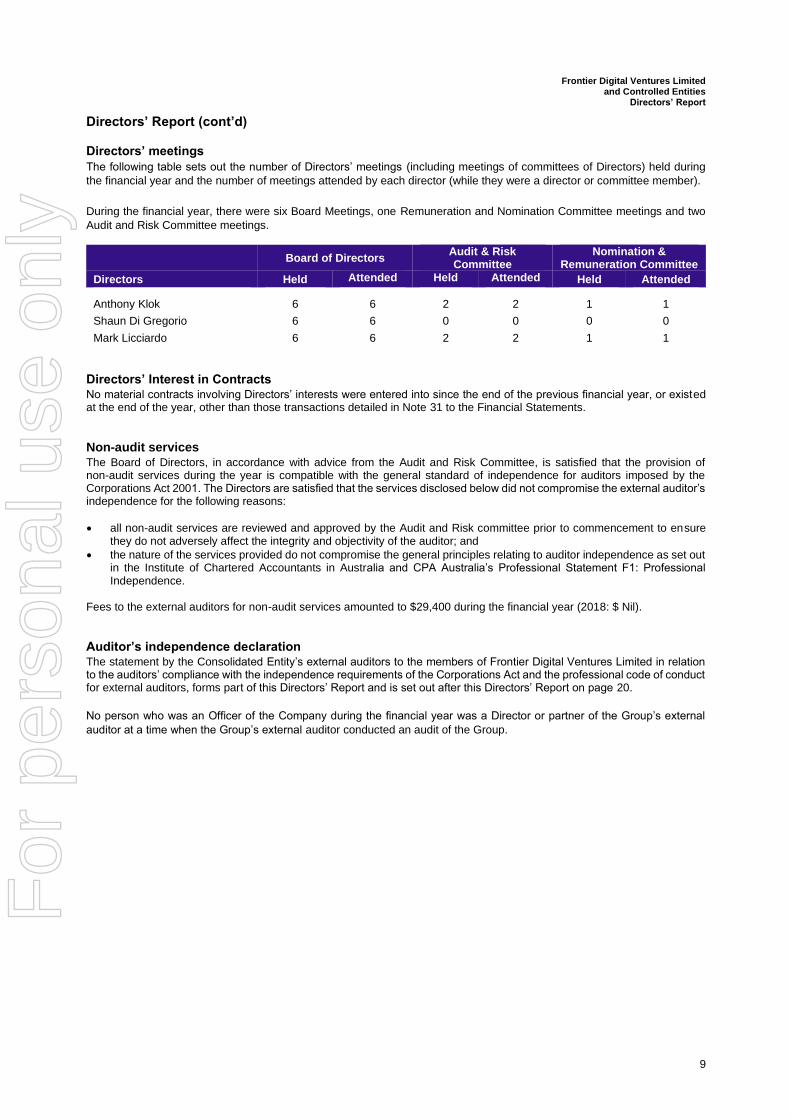
Directors’ Report (cont’d) Directors’ meetings
The following table sets out the number of Directors’ meetings (including meetings of committees of Directors) held during
the financial year and the number of meetings attended by each director (while they were a director or committee member).
During the financial year, there were six Board Meetings, one Remuneration and Nomination Committee meetings and two
Audit and Risk Committee meetings.
Board of Directors Audit & Risk Committee
Nomination & Remuneration Committee
Directors Held Attended Held Attended Held Attended
Anthony Klok 6 6 2 2 1 1
Shaun Di Gregorio 6 6 0 0 0 0
Mark Licciardo 6 6 2 2 1 1
Directors’ Interest in Contracts No material contracts involving Directors’ interests were entered into since the end of the previous financial year, or existed at the end of the year, other than those transactions detailed in Note 31 to the Financial Statements.
Non-audit services The Board of Directors, in accordance with advice from the Audit and Risk Committee, is satisfied that the provision of non-audit services during the year is compatible with the general standard of independence for auditors imposed by the Corporations Act 2001. The Directors are satisfied that the services disclosed below did not compromise the external auditor’s independence for the following reasons:
• all non-audit services are reviewed and approved by the Audit and Risk committee prior to commencement to ensure they do not adversely affect the integrity and objectivity of the auditor; and
• the nature of the services provided do not compromise the general principles relating to auditor independence as set out in the Institute of Chartered Accountants in Australia and CPA Australia’s Professional Statement F1: Professional Independence.
Fees to the external auditors for non-audit services amounted to $29,400 during the financial year (2018: $ Nil).
Auditor’s independence declaration The statement by the Consolidated Entity’s external auditors to the members of Frontier Digital Ventures Limited in relation to the auditors’ compliance with the independence requirements of the Corporations Act and the professional code of conduct for external auditors, forms part of this Directors’ Report and is set out after this Directors’ Report on page 20.
No person who was an Officer of the Company during the financial year was a Director or partner of the Group’s external
auditor at a time when the Group’s external auditor conducted an audit of the Group.
For
per
sona
l use
onl
y
Frontier Digital Ventures Limited and Controlled Entities
Remuneration Report
10
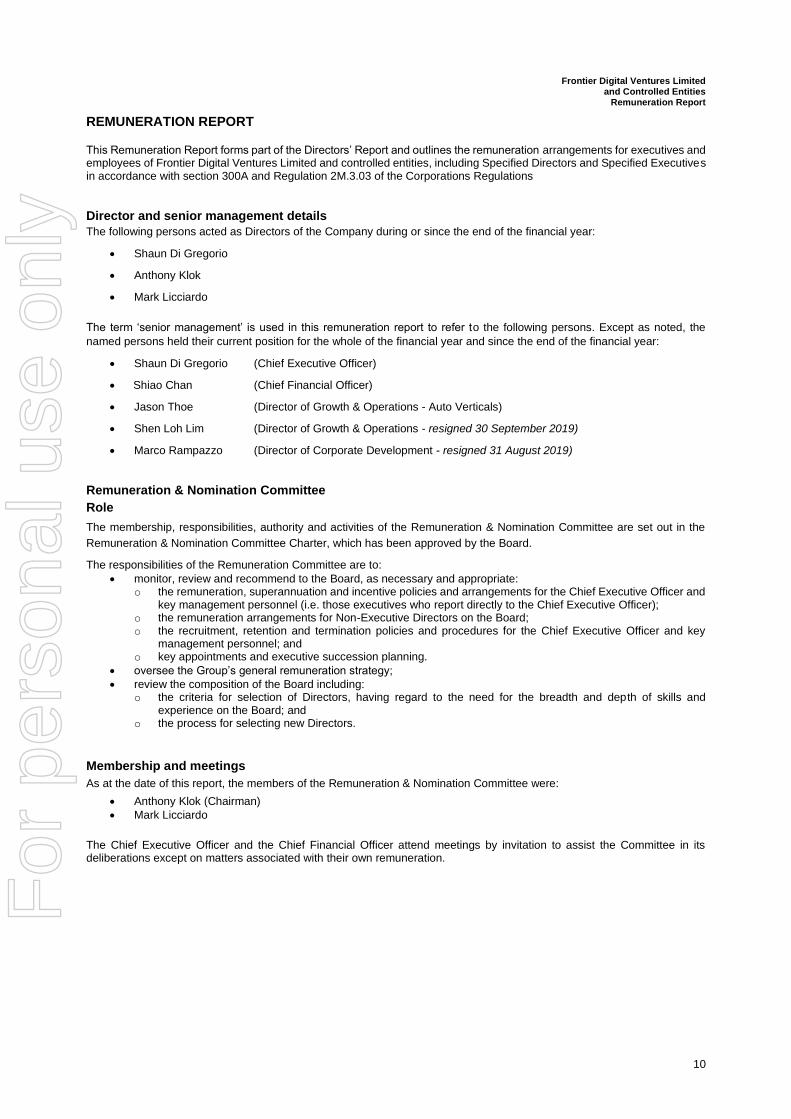
REMUNERATION REPORT
This Remuneration Report forms part of the Directors’ Report and outlines the remuneration arrangements for executives and employees of Frontier Digital Ventures Limited and controlled entities, including Specified Directors and Specified Executives in accordance with section 300A and Regulation 2M.3.03 of the Corporations Regulations
Director and senior management details
The following persons acted as Directors of the Company during or since the end of the financial year:
• Shaun Di Gregorio
• Anthony Klok
• Mark Licciardo
The term ‘senior management’ is used in this remuneration report to refer to the following persons. Except as noted, the
named persons held their current position for the whole of the financial year and since the end of the financial year:
• Shaun Di Gregorio (Chief Executive Officer)
• Shiao Chan (Chief Financial Officer)
• Jason Thoe (Director of Growth & Operations - Auto Verticals)
• Shen Loh Lim (Director of Growth & Operations - resigned 30 September 2019)
• Marco Rampazzo (Director of Corporate Development - resigned 31 August 2019)
Remuneration & Nomination Committee
Role
The membership, responsibilities, authority and activities of the Remuneration & Nomination Committee are set out in the
Remuneration & Nomination Committee Charter, which has been approved by the Board.
The responsibilities of the Remuneration Committee are to:
• monitor, review and recommend to the Board, as necessary and appropriate: o the remuneration, superannuation and incentive policies and arrangements for the Chief Executive Officer and
key management personnel (i.e. those executives who report directly to the Chief Executive Officer); o the remuneration arrangements for Non-Executive Directors on the Board; o the recruitment, retention and termination policies and procedures for the Chief Executive Officer and key
management personnel; and o key appointments and executive succession planning.
• oversee the Group’s general remuneration strategy;
• review the composition of the Board including: o the criteria for selection of Directors, having regard to the need for the breadth and depth of skills and
experience on the Board; and o the process for selecting new Directors.
Membership and meetings
As at the date of this report, the members of the Remuneration & Nomination Committee were:
• Anthony Klok (Chairman)
• Mark Licciardo
The Chief Executive Officer and the Chief Financial Officer attend meetings by invitation to assist the Committee in its deliberations except on matters associated with their own remuneration.
For
per
sona
l use
onl
y
Frontier Digital Ventures Limited and Controlled Entities
Remuneration Report
11
Remuneration Report (cont’d)
Advisers
External specialist remuneration advice is sought on an as-needs basis in respect of remuneration arrangements for Non-Executive Directors of the Board and key management personnel of the Group. General reward advice is sought on an ad hoc basis. No external reward advice was received during the financial year in respect of executive rights (2018: Nil).
Reward policy
The Company has an established policy for determining the nature and amount of emoluments of Board members and key management personnel of the Company to align remuneration with the performance of the Group. The remuneration structure for the key management personnel seeks to emphasise payment for results.
Reward philosophy
The Company’s overall philosophy is to manage the remuneration to:
• create an environment that will attract top talent, and where people can be motivated with energy and passion to deliver superior performance;
• recognise capabilities and promote opportunities for career and professional development;
• provide rewards, benefits and conditions that are competitive within the markets in which the Group operates; and
• provide fair and consistent rewards across the Group, which support corporate principles.
The Company has a policy of ensuring that at least part of the remuneration of key management personnel is based on the performance of the Company. Key management personnel are compensated with fixed remuneration and “at risk” remuneration based on revenue and earnings targets.
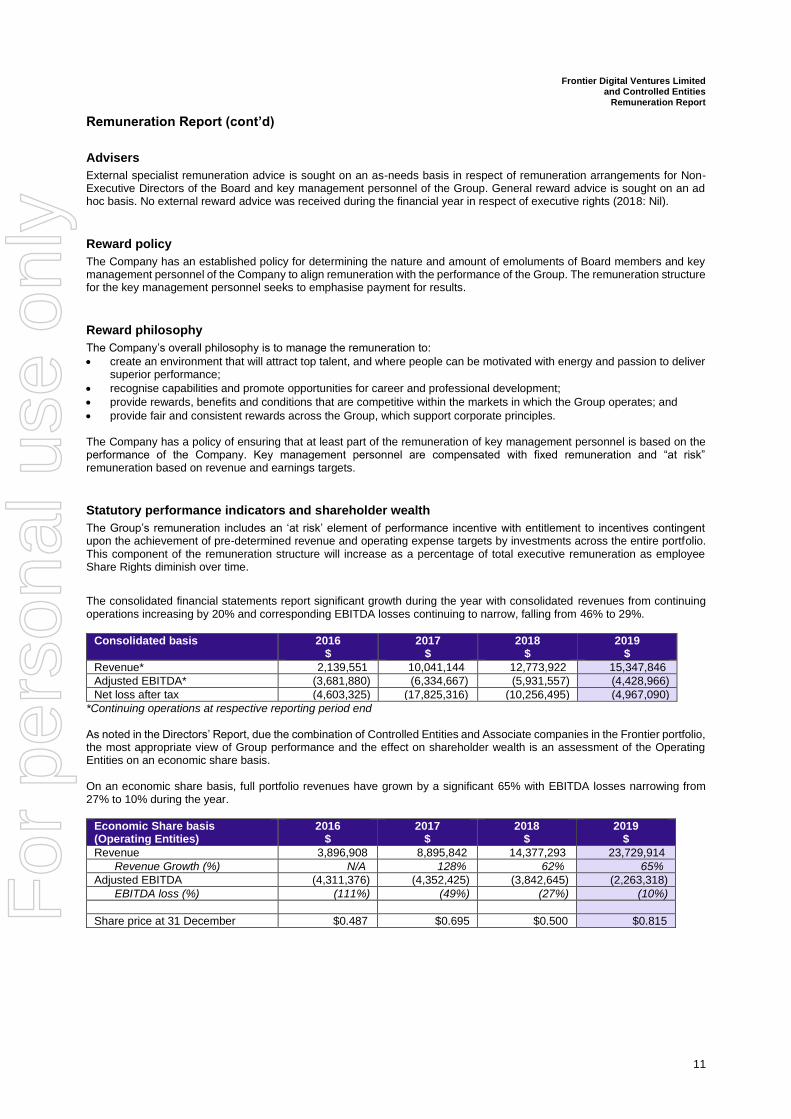
Statutory performance indicators and shareholder wealth
The Group’s remuneration includes an ‘at risk’ element of performance incentive with entitlement to incentives contingent upon the achievement of pre-determined revenue and operating expense targets by investments across the entire portfolio. This component of the remuneration structure will increase as a percentage of total executive remuneration as employee Share Rights diminish over time.
The consolidated financial statements report significant growth during the year with consolidated revenues from continuing operations increasing by 20% and corresponding EBITDA losses continuing to narrow, falling from 46% to 29%.
Consolidated basis 2016 $
2017 $
2018 $
2019 $
Revenue* 2,139,551 10,041,144 12,773,922 15,347,846
Adjusted EBITDA* (3,681,880) (6,334,667) (5,931,557) (4,428,966)
Net loss after tax (4,603,325) (17,825,316) (10,256,495) (4,967,090)
*Continuing operations at respective reporting period end As noted in the Directors’ Report, due the combination of Controlled Entities and Associate companies in the Frontier portfolio, the most appropriate view of Group performance and the effect on shareholder wealth is an assessment of the Operating Entities on an economic share basis. On an economic share basis, full portfolio revenues have grown by a significant 65% with EBITDA losses narrowing from 27% to 10% during the year.
Economic Share basis (Operating Entities)
2016 $
2017 $
2018 $
2019 $
Revenue 3,896,908 8,895,842 14,377,293 23,729,914
Revenue Growth (%) N/A 128% 62% 65%
Adjusted EBITDA (4,311,376) (4,352,425) (3,842,645) (2,263,318)
EBITDA loss (%) (111%) (49%) (27%) (10%)
Share price at 31 December $0.487 $0.695 $0.500 $0.815
For
per
sona
l use
onl
y
Frontier Digital Ventures Limited and Controlled Entities
Remuneration Report
12
Remuneration Report (cont’d)
Key Management Personnel and Executive Director Remuneration
The Company aims to reward key management personnel with a level and mix of remuneration commensurate with their position and responsibilities within the Company and:
• Reward key management personnel for achievement of pre-determined key performance indicators;
• Link reward with the strategic goals and performance of the Company; and
• Ensure total remuneration is competitive by market standards. The Remuneration for key management personnel and staff includes an annual review using a formal performance appraisal process. The Remuneration Committee recommends to the Board the level of fixed remuneration for the CEO each year based on his performance. The remuneration structure is in two parts:
• Fixed remuneration; and
• Variable remuneration
Fixed remuneration
The level of fixed remuneration is set so as to provide a base level of remuneration which is both appropriate to the position and is competitive in the market. Fixed remuneration comprises of payroll salary, superannuation and other benefits.
Variable Remuneration
Comprises a short term incentive plan and a long term incentive plan.
• Short term incentive plan (STI)
Short term incentives are used to reward performance on a year by year basis. The principal performance indicator of the short term incentive plan will be the financial performance of the Operating Entities within the Group, including both controlled entities and associate companies, during the year. The percentage and threshold level can differ for each individual and will be reviewed each year. These financial performance targets must be met in order to trigger payments to key management personnel under the STI. Payments will be made in the form of cash and shares. Key employees of Frontier will be eligible to participate in the STI program by invitation from the Board.
• Long term incentive plan (LTI)
Frontier established a long term incentive plan called the Frontier Digital Ventures Limited Rights Plan (“Rights Plan”) designed to align the interests of employees with the interests of Shareholders by providing an opportunity for employees to receive an equity interest in Frontier. The last vest and exercise of the Share Rights under this Rights Plan occurred on 2 July 2019. A new Long Term Incentive Plan has since been introduced, called the Frontier Digital Ventures Limited Long Term Incentive Plan (“LTI Plan”). These long term incentive plans are part of the Company’s remuneration strategy and are designed to align the interests of management and shareholders and assist Frontier in the attraction, motivation and retention of executives. In particular, the plans are designed to provide relevant executives with an incentive for future performance, with conditions of vesting and exercise of performance rights under the respective plans, encouraging those executives to remain with the Company and contribute to the future performance of the Company. Employees will be eligible to participate in these plans by invitation from the Board. The adoption of the LTI Plan was approved at the Annual General Meeting of the shareholders of the Company on 24 May 2019.
For
per
sona
l use
onl
y
Frontier Digital Ventures Limited and Controlled Entities
Remuneration Report
13
Remuneration Report (cont’d)
Key Management Personnel and Executive Director Remuneration (cont’d)
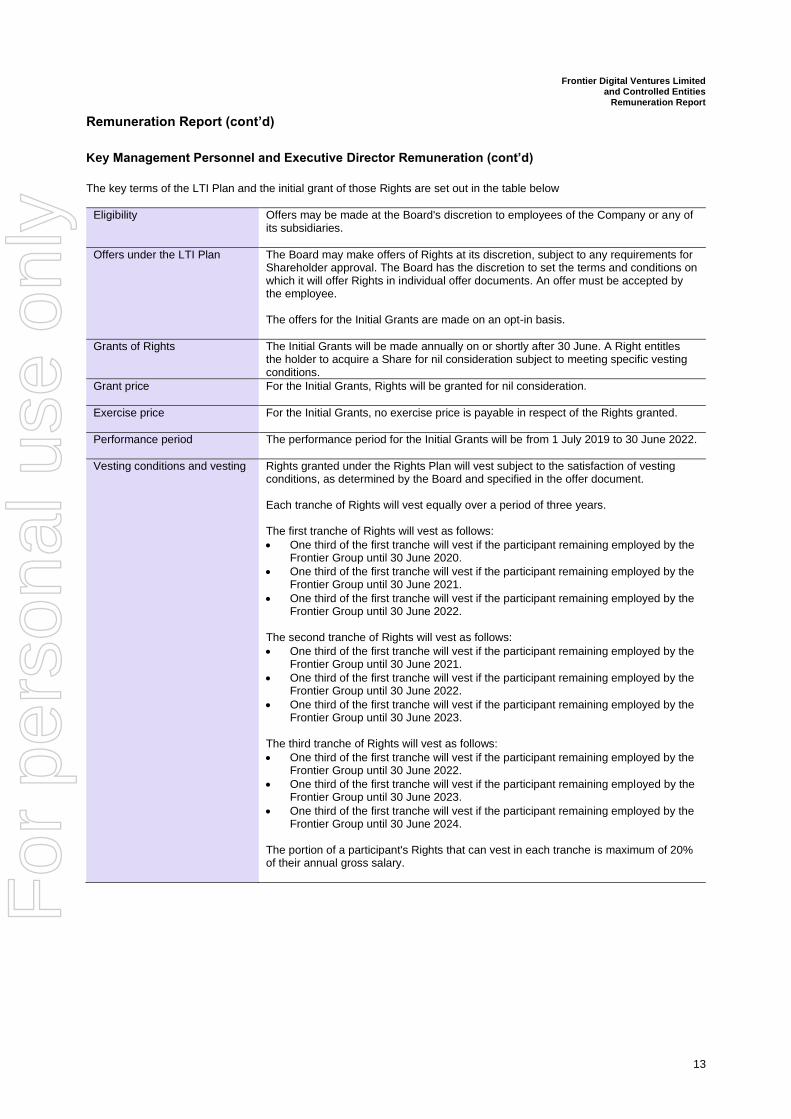
The key terms of the LTI Plan and the initial grant of those Rights are set out in the table below
Eligibility Offers may be made at the Board's discretion to employees of the Company or any of its subsidiaries.
Offers under the LTI Plan The Board may make offers of Rights at its discretion, subject to any requirements for Shareholder approval. The Board has the discretion to set the terms and conditions on which it will offer Rights in individual offer documents. An offer must be accepted by the employee. The offers for the Initial Grants are made on an opt-in basis.
Grants of Rights The Initial Grants will be made annually on or shortly after 30 June. A Right entitles the holder to acquire a Share for nil consideration subject to meeting specific vesting conditions.
Grant price For the Initial Grants, Rights will be granted for nil consideration.
Exercise price For the Initial Grants, no exercise price is payable in respect of the Rights granted.
Performance period The performance period for the Initial Grants will be from 1 July 2019 to 30 June 2022.
Vesting conditions and vesting Rights granted under the Rights Plan will vest subject to the satisfaction of vesting conditions, as determined by the Board and specified in the offer document. Each tranche of Rights will vest equally over a period of three years. The first tranche of Rights will vest as follows:
• One third of the first tranche will vest if the participant remaining employed by the Frontier Group until 30 June 2020.
• One third of the first tranche will vest if the participant remaining employed by the Frontier Group until 30 June 2021.
• One third of the first tranche will vest if the participant remaining employed by the Frontier Group until 30 June 2022.
The second tranche of Rights will vest as follows:
• One third of the first tranche will vest if the participant remaining employed by the Frontier Group until 30 June 2021.
• One third of the first tranche will vest if the participant remaining employed by the Frontier Group until 30 June 2022.
• One third of the first tranche will vest if the participant remaining employed by the Frontier Group until 30 June 2023.
The third tranche of Rights will vest as follows:
• One third of the first tranche will vest if the participant remaining employed by the Frontier Group until 30 June 2022.
• One third of the first tranche will vest if the participant remaining employed by the Frontier Group until 30 June 2023.
• One third of the first tranche will vest if the participant remaining employed by the Frontier Group until 30 June 2024.
The portion of a participant's Rights that can vest in each tranche is maximum of 20% of their annual gross salary.
F
or p
erso
nal u
se o
nly
Frontier Digital Ventures Limited and Controlled Entities
Remuneration Report
14
Remuneration Report (cont’d)
Key Management Personnel and Executive Director Remuneration (cont’d)
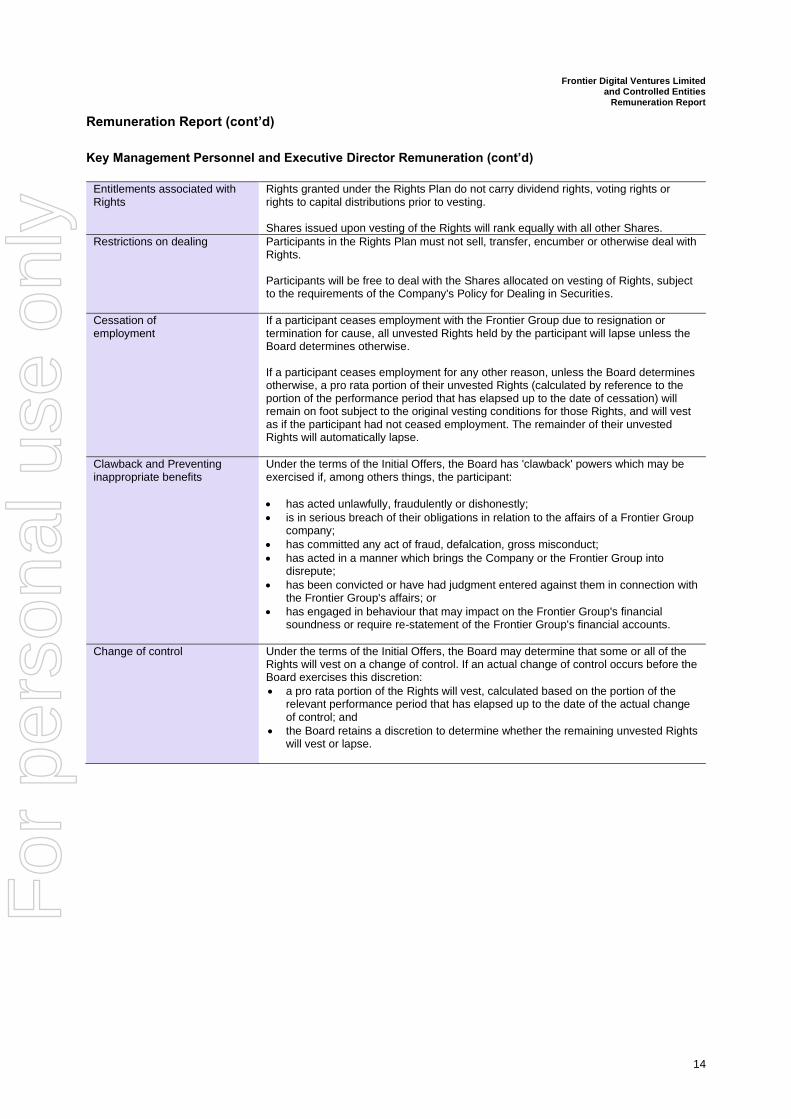
Entitlements associated with Rights
Rights granted under the Rights Plan do not carry dividend rights, voting rights or rights to capital distributions prior to vesting. Shares issued upon vesting of the Rights will rank equally with all other Shares.
Restrictions on dealing Participants in the Rights Plan must not sell, transfer, encumber or otherwise deal with Rights. Participants will be free to deal with the Shares allocated on vesting of Rights, subject to the requirements of the Company's Policy for Dealing in Securities.
Cessation of employment
If a participant ceases employment with the Frontier Group due to resignation or termination for cause, all unvested Rights held by the participant will lapse unless the Board determines otherwise. If a participant ceases employment for any other reason, unless the Board determines otherwise, a pro rata portion of their unvested Rights (calculated by reference to the portion of the performance period that has elapsed up to the date of cessation) will remain on foot subject to the original vesting conditions for those Rights, and will vest as if the participant had not ceased employment. The remainder of their unvested Rights will automatically lapse.
Clawback and Preventing inappropriate benefits
Under the terms of the Initial Offers, the Board has 'clawback' powers which may be exercised if, among others things, the participant:
• has acted unlawfully, fraudulently or dishonestly;
• is in serious breach of their obligations in relation to the affairs of a Frontier Group company;
• has committed any act of fraud, defalcation, gross misconduct;
• has acted in a manner which brings the Company or the Frontier Group into disrepute;
• has been convicted or have had judgment entered against them in connection with the Frontier Group's affairs; or
• has engaged in behaviour that may impact on the Frontier Group's financial soundness or require re-statement of the Frontier Group's financial accounts.
Change of control Under the terms of the Initial Offers, the Board may determine that some or all of the Rights will vest on a change of control. If an actual change of control occurs before the Board exercises this discretion:
• a pro rata portion of the Rights will vest, calculated based on the portion of the relevant performance period that has elapsed up to the date of the actual change of control; and
• the Board retains a discretion to determine whether the remaining unvested Rights will vest or lapse.
For
per
sona
l use
onl
y
Frontier Digital Ventures Limited and Controlled Entities
Remuneration Report
15
Remuneration Report (cont’d)
Rights Plan
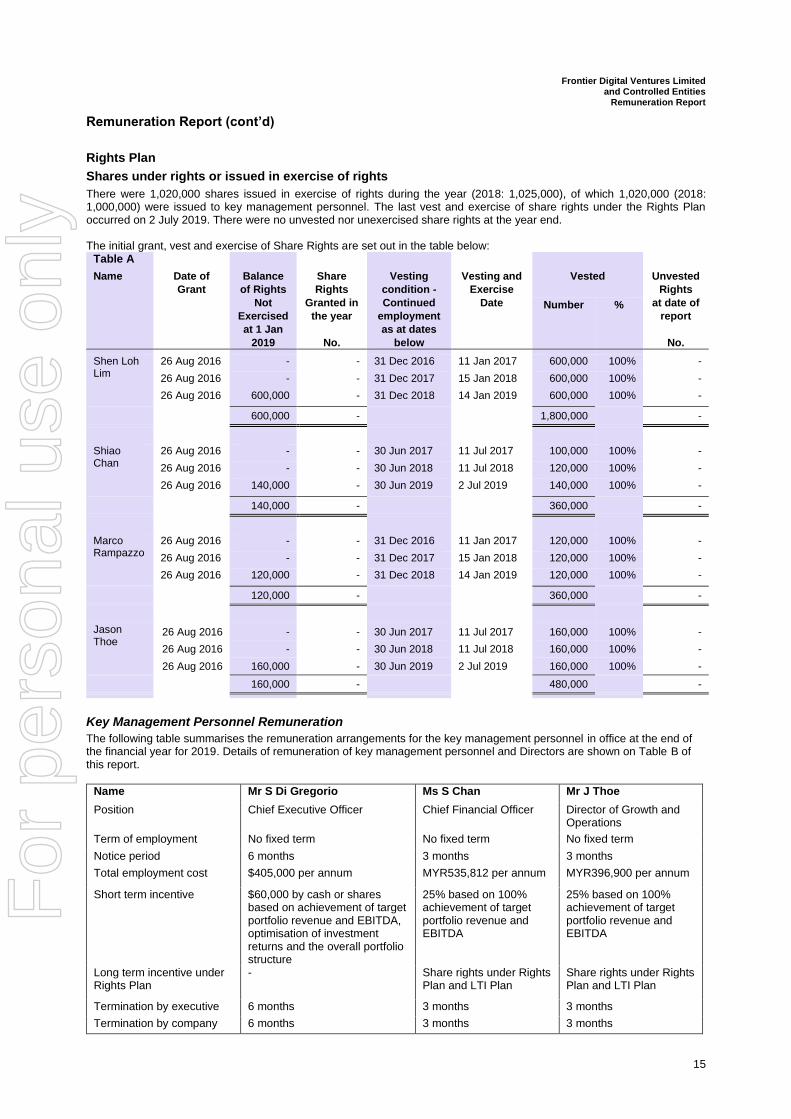
Shares under rights or issued in exercise of rights
There were 1,020,000 shares issued in exercise of rights during the year (2018: 1,025,000), of which 1,020,000 (2018: 1,000,000) were issued to key management personnel. The last vest and exercise of share rights under the Rights Plan occurred on 2 July 2019. There were no unvested nor unexercised share rights at the year end. The initial grant, vest and exercise of Share Rights are set out in the table below:
Table A
Name Date of
Grant
Balance
of Rights
Not
Exercised
at 1 Jan
2019
Share
Rights
Granted in
the year
No.
Vesting
condition -
Continued
employment
as at dates
below
Vesting and
Exercise
Date
Vested Unvested
Rights
at date of
report
No.
Number %
Shen Loh Lim
26 Aug 2016 - - 31 Dec 2016 11 Jan 2017 600,000 100% -
26 Aug 2016 - - 31 Dec 2017 15 Jan 2018 600,000 100% -
26 Aug 2016 600,000 - 31 Dec 2018 14 Jan 2019 600,000 100% -
600,000 - 1,800,000 -
Shiao Chan
26 Aug 2016 - - 30 Jun 2017 11 Jul 2017 100,000 100% -
26 Aug 2016 - - 30 Jun 2018 11 Jul 2018 120,000 100% -
26 Aug 2016 140,000 - 30 Jun 2019 2 Jul 2019 140,000 100% -
140,000 - 360,000 -
Marco Rampazzo
26 Aug 2016 - - 31 Dec 2016 11 Jan 2017 120,000 100% -
26 Aug 2016 - - 31 Dec 2017 15 Jan 2018 120,000 100% -
26 Aug 2016 120,000 - 31 Dec 2018 14 Jan 2019 120,000 100% -
120,000 - 360,000 -
Jason Thoe
26 Aug 2016 - - 30 Jun 2017 11 Jul 2017 160,000 100% -
26 Aug 2016 - - 30 Jun 2018 11 Jul 2018 160,000 100% -
26 Aug 2016 160,000 - 30 Jun 2019 2 Jul 2019 160,000 100% -
160,000 - 480,000 -
Key Management Personnel Remuneration
The following table summarises the remuneration arrangements for the key management personnel in office at the end of the financial year for 2019. Details of remuneration of key management personnel and Directors are shown on Table B of this report.
Name Mr S Di Gregorio Ms S Chan Mr J Thoe
Position Chief Executive Officer Chief Financial Officer Director of Growth and Operations
Term of employment No fixed term No fixed term No fixed term
Notice period 6 months 3 months 3 months
Total employment cost $405,000 per annum MYR535,812 per annum MYR396,900 per annum
Short term incentive $60,000 by cash or shares based on achievement of target portfolio revenue and EBITDA, optimisation of investment returns and the overall portfolio structure
25% based on 100% achievement of target portfolio revenue and EBITDA
25% based on 100% achievement of target portfolio revenue and EBITDA
Long term incentive under Rights Plan
- Share rights under Rights Plan and LTI Plan
Share rights under Rights Plan and LTI Plan
Termination by executive 6 months 3 months 3 months
Termination by company 6 months 3 months 3 months
For
per
sona
l use
onl
y
Frontier Digital Ventures Limited and Controlled Entities
Remuneration Report
16
Remuneration Report (cont’d)
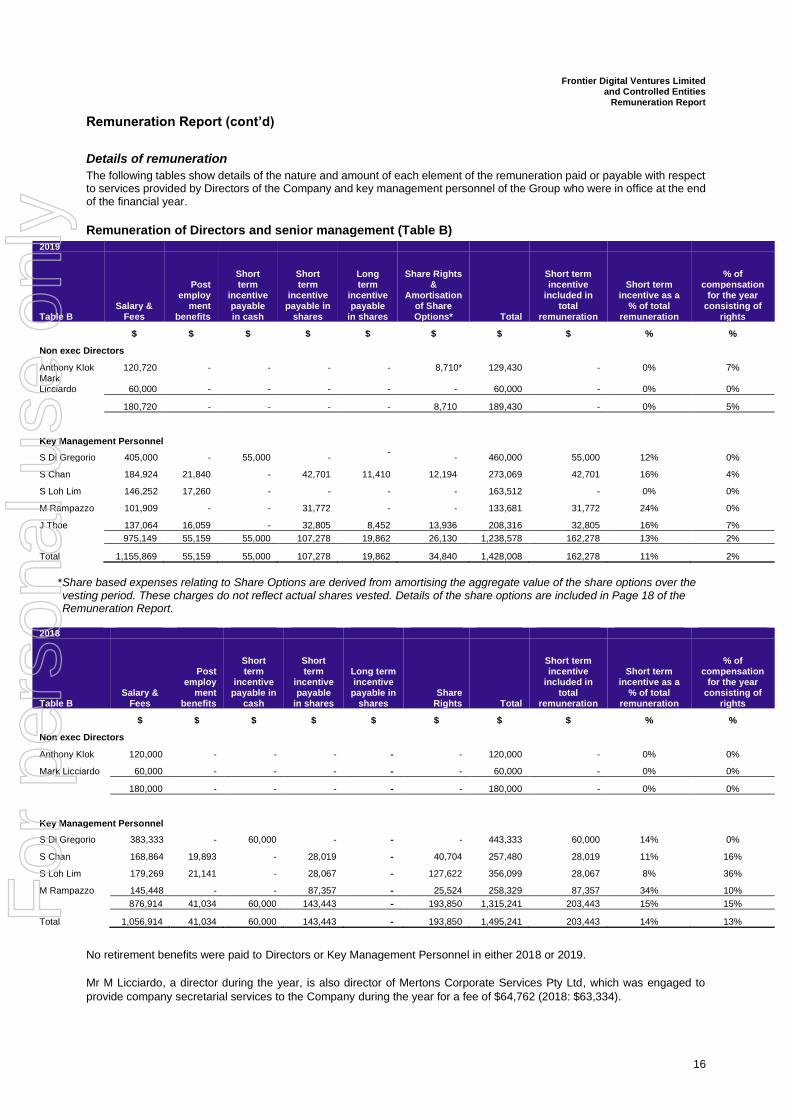
Details of remuneration
The following tables show details of the nature and amount of each element of the remuneration paid or payable with respect to services provided by Directors of the Company and key management personnel of the Group who were in office at the end of the financial year.
Remuneration of Directors and senior management (Table B)
2019
Table B Salary &
Fees
Post employ
ment benefits
Short term
incentive payable in cash
Short term
incentive payable in
shares
Long term
incentive payable
in shares
Share Rights &
Amortisation of Share Options* Total
Short term incentive
included in total
remuneration
Short term incentive as a
% of total remuneration
% of compensation
for the year consisting of
rights
$ $ $ $ $ $ $ $ % %
Non exec Directors
Anthony Klok 120,720 - - - - 8,710* 129,430 - 0% 7% Mark Licciardo 60,000 - - - - - 60,000 - 0% 0%
180,720 - - - - 8,710 189,430 - 0% 5%
Key Management Personnel
S Di Gregorio 405,000 - 55,000 - -
- 460,000 55,000 12% 0%
S Chan 184,924 21,840 - 42,701 11,410 12,194 273,069 42,701 16% 4%
S Loh Lim 146,252 17,260 - - - - 163,512 - 0% 0%
M Rampazzo 101,909 - - 31,772 - - 133,681 31,772 24% 0%
J Thoe 137,064 16,059 - 32,805 8,452 13,936 208,316 32,805 16% 7%
975,149 55,159 55,000 107,278 19,862 26,130 1,238,578 162,278 13% 2%
Total 1,155,869 55,159 55,000 107,278 19,862 34,840 1,428,008 162,278 11% 2%
*Share based expenses relating to Share Options are derived from amortising the aggregate value of the share options over the vesting period. These charges do not reflect actual shares vested. Details of the share options are included in Page 18 of the Remuneration Report.
2018
Table B Salary &
Fees
Post employ
ment benefits
Short term
incentive payable in
cash
Short term
incentive payable
in shares
Long term incentive
payable in shares
Share Rights Total
Short term incentive
included in total
remuneration
Short term incentive as a
% of total remuneration
% of compensation
for the year consisting of
rights
$ $ $ $ $ $ $ $ % %
Non exec Directors
Anthony Klok 120,000 - - - - - 120,000 - 0% 0%
Mark Licciardo 60,000 - - - - - 60,000 - 0% 0%
180,000 - - - - - 180,000 - 0% 0%
Key Management Personnel
S Di Gregorio 383,333 - 60,000 - - - 443,333 60,000 14% 0%
S Chan 168,864 19,893 - 28,019 - 40,704 257,480 28,019 11% 16%
S Loh Lim 179,269 21,141 - 28,067 - 127,622 356,099 28,067 8% 36%
M Rampazzo 145,448 - - 87,357 - 25,524 258,329 87,357 34% 10%
876,914 41,034 60,000 143,443 - 193,850 1,315,241 203,443 15% 15%
Total 1,056,914 41,034 60,000 143,443 - 193,850 1,495,241 203,443 14% 13%
No retirement benefits were paid to Directors or Key Management Personnel in either 2018 or 2019.
Mr M Licciardo, a director during the year, is also director of Mertons Corporate Services Pty Ltd, which was engaged to
provide company secretarial services to the Company during the year for a fee of $64,762 (2018: $63,334).
For
per
sona
l use
onl
y
Frontier Digital Ventures Limited and Controlled Entities
Remuneration Report
17
Remuneration Report (cont’d)
Share based payments to executives
Total remuneration to key management personnel included short term incentive payable in shares to executives of $74,994 (2018: $143,443).
On 14 March 2019, the Directors approved the issue of 84,267 (2018: 158,819) shares with a fair value of $39,605 (2018:$117,526) to Key Management Personnel who were in office at the end of the year, as part of the company executive incentive plan. Further, 239,127 shares (2018: Nil) with a fair value of $130,487 were issued to Key Management Personnel who left office during the year. At the end of the financial year, $77,091 (2018: $124,181) in value of shares were yet to be issued to key management personnel. Based on the variable VWAP of shares over the period of service, a total of 113,485 (2018: 206,968) shares are outstanding to all key management personnel. The VWAP for the year ended 31 December 2019 was 67.93 cents (2018: 60.00 cents).
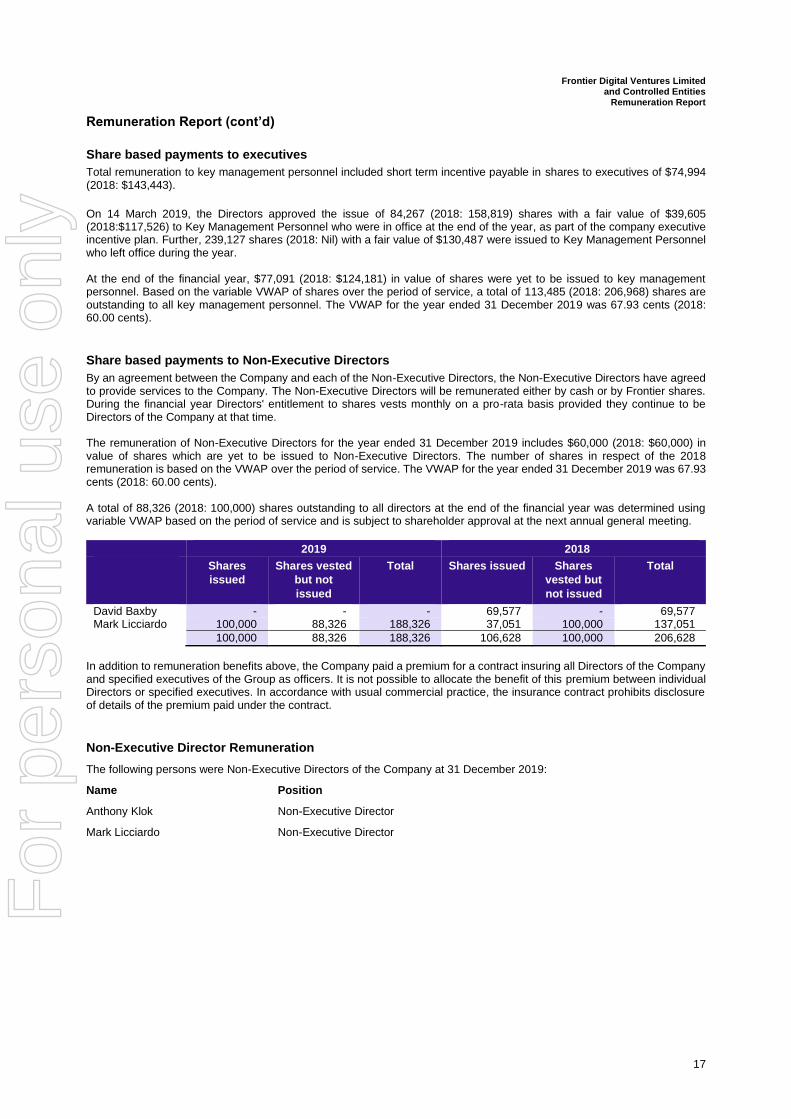
Share based payments to Non-Executive Directors
By an agreement between the Company and each of the Non-Executive Directors, the Non-Executive Directors have agreed to provide services to the Company. The Non-Executive Directors will be remunerated either by cash or by Frontier shares. During the financial year Directors' entitlement to shares vests monthly on a pro-rata basis provided they continue to be Directors of the Company at that time. The remuneration of Non-Executive Directors for the year ended 31 December 2019 includes $60,000 (2018: $60,000) in value of shares which are yet to be issued to Non-Executive Directors. The number of shares in respect of the 2018 remuneration is based on the VWAP over the period of service. The VWAP for the year ended 31 December 2019 was 67.93 cents (2018: 60.00 cents). A total of 88,326 (2018: 100,000) shares outstanding to all directors at the end of the financial year was determined using variable VWAP based on the period of service and is subject to shareholder approval at the next annual general meeting.
2019 2018
Shares
issued
Shares vested
but not
issued
Total Shares issued
Shares
vested but
not issued
Total
David Baxby - - - 69,577 - 69,577 Mark Licciardo 100,000 88,326 188,326 37,051 100,000 137,051
100,000 88,326 188,326 106,628 100,000 206,628
In addition to remuneration benefits above, the Company paid a premium for a contract insuring all Directors of the Company and specified executives of the Group as officers. It is not possible to allocate the benefit of this premium between individual Directors or specified executives. In accordance with usual commercial practice, the insurance contract prohibits disclosure of details of the premium paid under the contract.
Non-Executive Director Remuneration
The following persons were Non-Executive Directors of the Company at 31 December 2019:
Name Position
Anthony Klok Non-Executive Director
Mark Licciardo Non-Executive Director
For
per
sona
l use
onl
y
Frontier Digital Ventures Limited and Controlled Entities
Remuneration Report
18
Remuneration Report (cont’d)
Remuneration Policy
Fees are established from time to time for the Chairman, Deputy Chairman and Non-Executive Directors. The appointment letters for the Non-Executive Directors set out the terms and conditions of their appointments. These terms and conditions are in conjunction with, and subject to, the Company’s Constitution and the charters and policies approved by the Board from time to time. Each Non-Executive Director receives a fee for being a Director of the Company. These fees are either paid in cash or by the issue of Frontier shares. Options
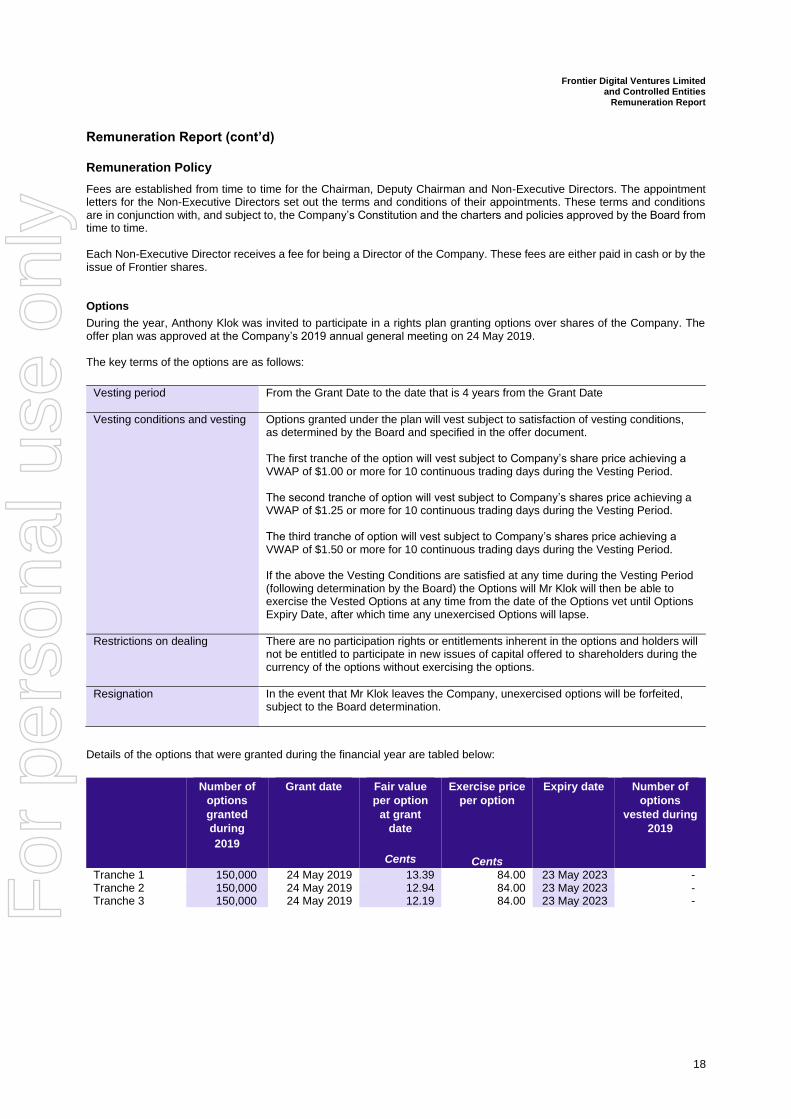
During the year, Anthony Klok was invited to participate in a rights plan granting options over shares of the Company. The offer plan was approved at the Company’s 2019 annual general meeting on 24 May 2019. The key terms of the options are as follows:
Vesting period From the Grant Date to the date that is 4 years from the Grant Date
Vesting conditions and vesting Options granted under the plan will vest subject to satisfaction of vesting conditions, as determined by the Board and specified in the offer document. The first tranche of the option will vest subject to Company’s share price achieving a VWAP of $1.00 or more for 10 continuous trading days during the Vesting Period. The second tranche of option will vest subject to Company’s shares price achieving a VWAP of $1.25 or more for 10 continuous trading days during the Vesting Period. The third tranche of option will vest subject to Company’s shares price achieving a VWAP of $1.50 or more for 10 continuous trading days during the Vesting Period. If the above the Vesting Conditions are satisfied at any time during the Vesting Period (following determination by the Board) the Options will Mr Klok will then be able to exercise the Vested Options at any time from the date of the Options vet until Options Expiry Date, after which time any unexercised Options will lapse.
Restrictions on dealing
There are no participation rights or entitlements inherent in the options and holders will not be entitled to participate in new issues of capital offered to shareholders during the currency of the options without exercising the options.
Resignation
In the event that Mr Klok leaves the Company, unexercised options will be forfeited, subject to the Board determination.
Details of the options that were granted during the financial year are tabled below:
Number of
options
granted
during
2019
Grant date Fair value
per option
at grant
date
Cents
Exercise price
per option
Cents
Expiry date Number of
options
vested during
2019
Tranche 1 150,000 24 May 2019 13.39 84.00 23 May 2023 - Tranche 2 150,000 24 May 2019 12.94 84.00 23 May 2023 - Tranche 3 150,000 24 May 2019 12.19 84.00 23 May 2023 -
For
per
sona
l use
onl
y

Frontier Digital Ventures Limited and Controlled Entities
Remuneration Report
19
Signed in accordance with a resolution of the Directors made pursuant to s.298 (2) of the Corporations Act 2001.
On behalf of the Directors Dated 25 March 2020 ……………………………… Anthony Klok Chairman
For
per
sona
l use
onl
y
Liability limited by a scheme approved under Professional Standards Legislation.
Member of Deloitte Touche Tohmatsu Limited 20
Deloitte Touche Tohmatsu ABN 74 490 121 060 550 Bourke Street Melbourne VIC 3000 GPO Box 78 Melbourne VIC 3001 Australia DX: 111 Tel: +61 (0) 3 9671 7000 Fax: +61 (0) 9671 7001 www.deloitte.com.au
25 March 2020 Dear Board of Directors
Auditor’s Independence Declaration to Frontier Digital Ventures Limited
In accordance with section 307C of the Corporations Act 2001, I am pleased to provide the following declaration of independence to the Directors of Frontier Digital Ventures Limited. As lead audit partner for the audit of the financial report of Frontier Digital Ventures Limited for the year ended 31 December 2019, I declare that to the best of my knowledge and belief, there have been no contraventions of:
(i) the auditor independence requirements of the Corporations Act 2001 in relation to the audit; and
(ii) any applicable code of professional conduct in relation to the audit. Yours faithfully DELOITTE TOUCHE TOHMATSU Anneke du Toit Partner Chartered Accountants
Board of Directors Frontier Digital Ventures Limited Level 7, 330 Collins Street Melbourne VIC 3000
For
per
sona
l use
onl
y
Frontier Digital Ventures Limited and Controlled Entities
Consolidated Statement of Comprehensive Income
21
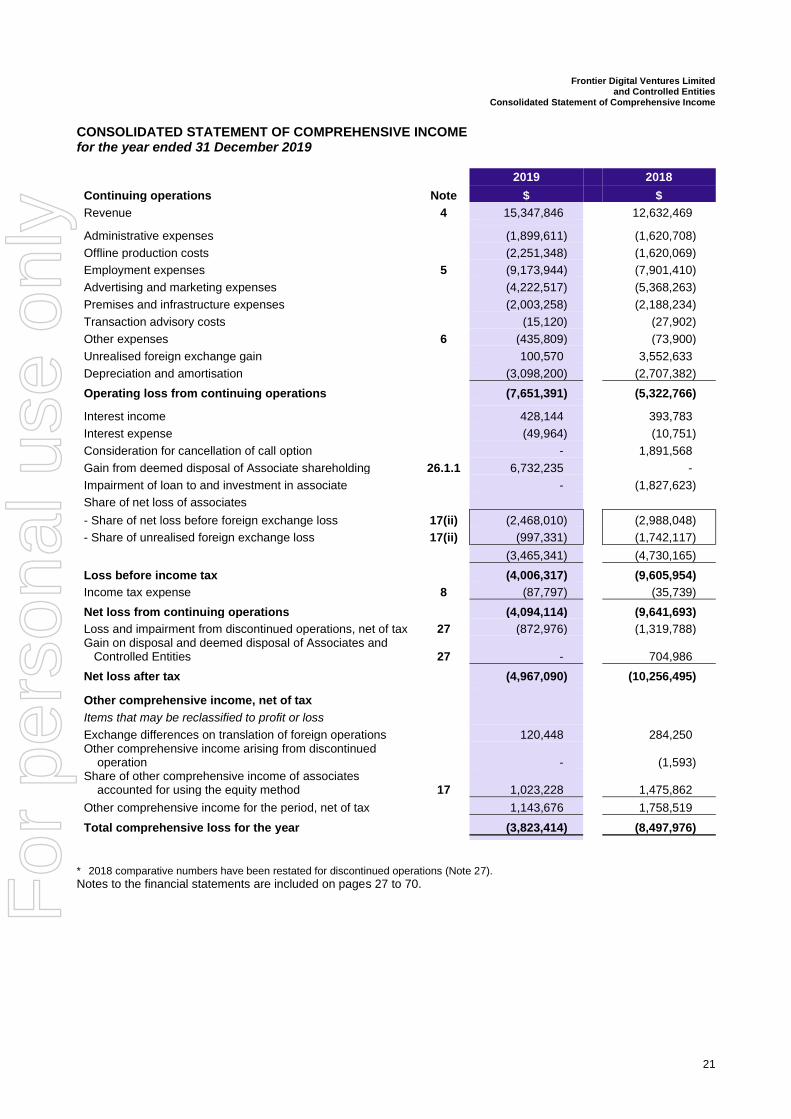
CONSOLIDATED STATEMENT OF COMPREHENSIVE INCOME for the year ended 31 December 2019
2019 2018
Continuing operations Note $ $
Revenue 4 15,347,846 12,632,469 Administrative expenses (1,899,611) (1,620,708)
Offline production costs (2,251,348) (1,620,069)
Employment expenses 5 (9,173,944) (7,901,410)
Advertising and marketing expenses (4,222,517) (5,368,263)
Premises and infrastructure expenses (2,003,258) (2,188,234)
Transaction advisory costs (15,120) (27,902)
Other expenses 6 (435,809) (73,900)
Unrealised foreign exchange gain 100,570 3,552,633
Depreciation and amortisation (3,098,200) (2,707,382)
Operating loss from continuing operations (7,651,391) (5,322,766) Interest income 428,144 393,783
Interest expense (49,964) (10,751)
Consideration for cancellation of call option - 1,891,568
Gain from deemed disposal of Associate shareholding 26.1.1 6,732,235 -
Impairment of loan to and investment in associate - (1,827,623)
Share of net loss of associates
- Share of net loss before foreign exchange loss 17(ii) (2,468,010) (2,988,048)
- Share of unrealised foreign exchange loss 17(ii) (997,331) (1,742,117)
(3,465,341) (4,730,165)
Loss before income tax (4,006,317) (9,605,954)
Income tax expense 8 (87,797) (35,739)
Net loss from continuing operations (4,094,114) (9,641,693)
Loss and impairment from discontinued operations, net of tax 27 (872,976) (1,319,788) Gain on disposal and deemed disposal of Associates and Controlled Entities 27 - 704,986
Net loss after tax (4,967,090) (10,256,495) Other comprehensive income, net of tax
Items that may be reclassified to profit or loss
Exchange differences on translation of foreign operations 120,448 284,250 Other comprehensive income arising from discontinued operation - (1,593) Share of other comprehensive income of associates accounted for using the equity method 17 1,023,228 1,475,862
Other comprehensive income for the period, net of tax 1,143,676 1,758,519
Total comprehensive loss for the year (3,823,414) (8,497,976)
* 2018 comparative numbers have been restated for discontinued operations (Note 27).
Notes to the financial statements are included on pages 27 to 70. For
per
sona
l use
onl
y
Frontier Digital Ventures Limited and Controlled Entities
Consolidated Statement of Comprehensive Income
22
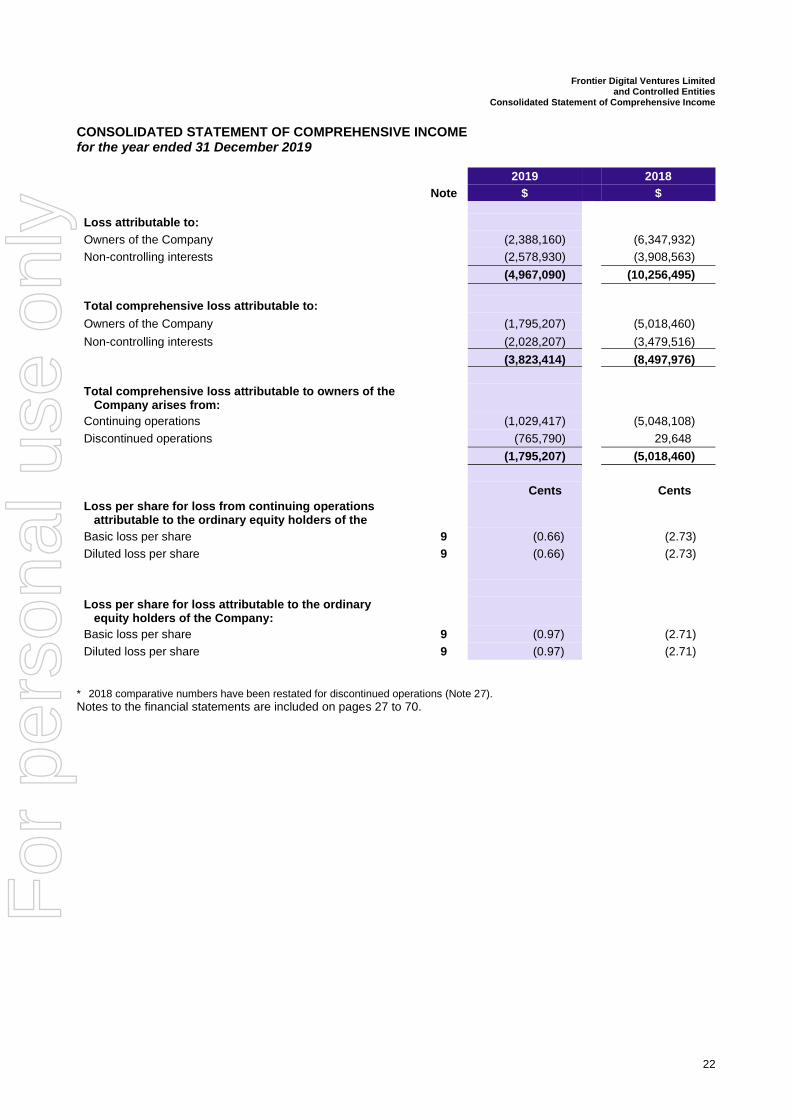
CONSOLIDATED STATEMENT OF COMPREHENSIVE INCOME for the year ended 31 December 2019
2019 2018 Note $ $ Loss attributable to:
Owners of the Company (2,388,160) (6,347,932)
Non-controlling interests (2,578,930) (3,908,563) (4,967,090) (10,256,495)
Total comprehensive loss attributable to:
Owners of the Company (1,795,207) (5,018,460)
Non-controlling interests (2,028,207) (3,479,516)
(3,823,414) (8,497,976)
Total comprehensive loss attributable to owners of the Company arises from:
Continuing operations (1,029,417) (5,048,108)
Discontinued operations (765,790) 29,648
(1,795,207) (5,018,460)
Cents Cents
Loss per share for loss from continuing operations attributable to the ordinary equity holders of the Company:
Basic loss per share 9 (0.66) (2.73)
Diluted loss per share 9 (0.66) (2.73)
Loss per share for loss attributable to the ordinary equity holders of the Company:
Basic loss per share 9 (0.97) (2.71)
Diluted loss per share 9 (0.97) (2.71)
* 2018 comparative numbers have been restated for discontinued operations (Note 27).
Notes to the financial statements are included on pages 27 to 70.
For
per
sona
l use
onl
y
Frontier Digital Ventures Limited and Controlled Entities
Consolidated Statement of Financial Position
23
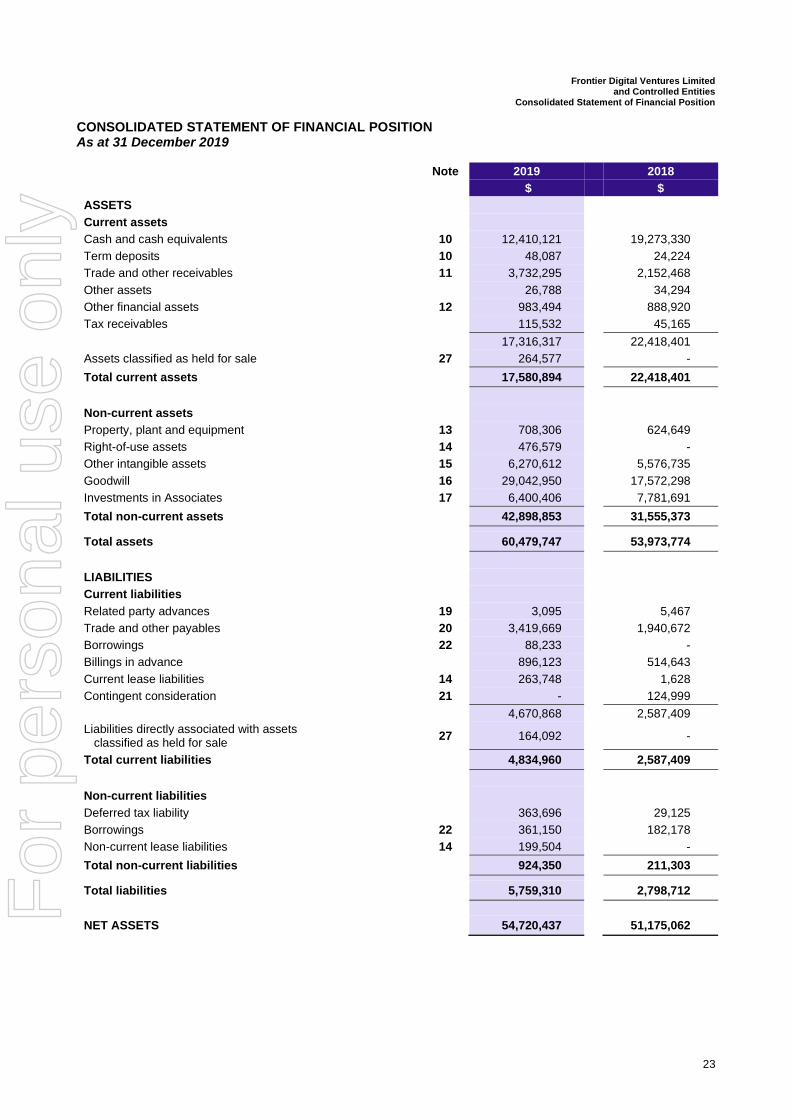
CONSOLIDATED STATEMENT OF FINANCIAL POSITION As at 31 December 2019
Note 2019 2018
$ $
ASSETS
Current assets
Cash and cash equivalents 10 12,410,121 19,273,330
Term deposits 10 48,087 24,224
Trade and other receivables 11 3,732,295 2,152,468
Other assets 26,788 34,294
Other financial assets 12 983,494 888,920
Tax receivables 115,532 45,165
17,316,317 22,418,401
Assets classified as held for sale 27 264,577 -
Total current assets 17,580,894 22,418,401
Non-current assets
Property, plant and equipment 13 708,306 624,649
Right-of-use assets 14 476,579 -
Other intangible assets 15 6,270,612 5,576,735
Goodwill 16 29,042,950 17,572,298
Investments in Associates 17 6,400,406 7,781,691
Total non-current assets 42,898,853 31,555,373
Total assets 60,479,747 53,973,774
LIABILITIES
Current liabilities
Related party advances 19 3,095 5,467
Trade and other payables 20 3,419,669 1,940,672
Borrowings 22 88,233 -
Billings in advance 896,123 514,643
Current lease liabilities 14 263,748 1,628
Contingent consideration 21 - 124,999
4,670,868 2,587,409
Liabilities directly associated with assets classified as held for sale
27 164,092 -
Total current liabilities 4,834,960 2,587,409
Non-current liabilities
Deferred tax liability 363,696 29,125
Borrowings 22 361,150 182,178
Non-current lease liabilities 14 199,504 -
Total non-current liabilities 924,350 211,303
Total liabilities 5,759,310 2,798,712
NET ASSETS 54,720,437 51,175,062
For
per
sona
l use
onl
y
Frontier Digital Ventures Limited and Controlled Entities
Consolidated Statement of Financial Position
24
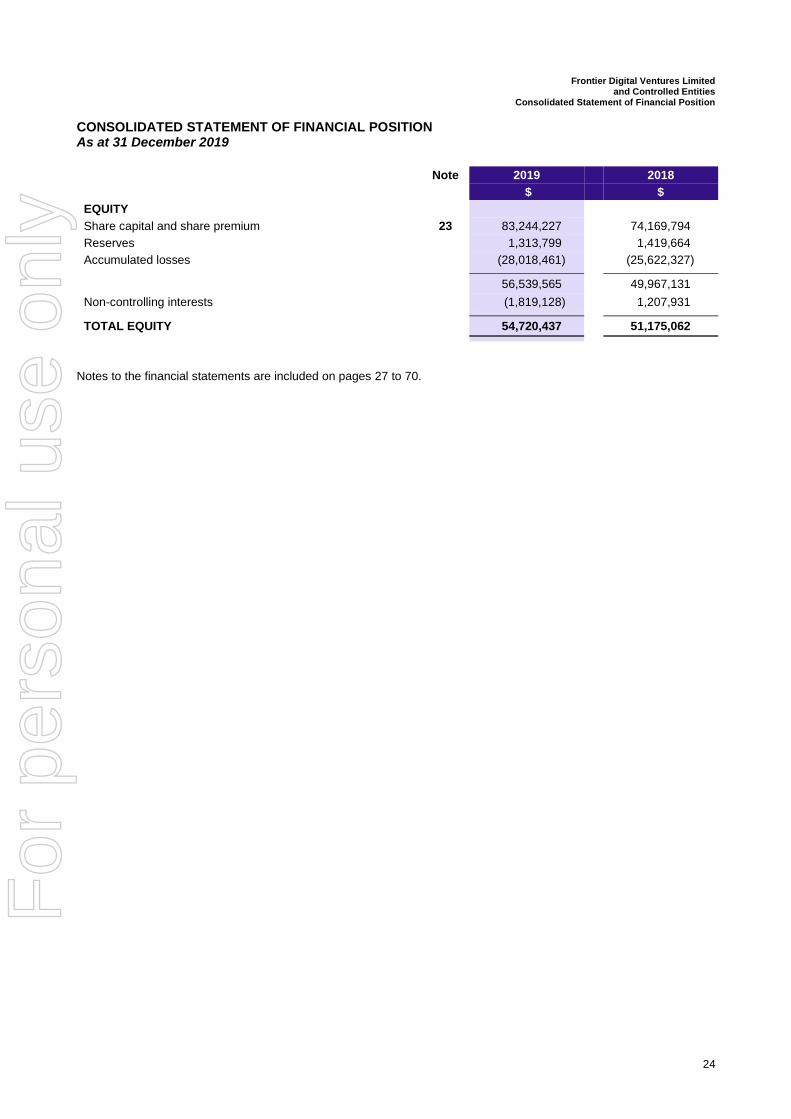
CONSOLIDATED STATEMENT OF FINANCIAL POSITION As at 31 December 2019
Note 2019 2018
$ $
EQUITY
Share capital and share premium 23 83,244,227 74,169,794
Reserves 1,313,799 1,419,664
Accumulated losses (28,018,461) (25,622,327)
56,539,565 49,967,131
Non-controlling interests (1,819,128) 1,207,931
TOTAL EQUITY 54,720,437 51,175,062
Notes to the financial statements are included on pages 27 to 70.
For
per
sona
l use
onl
y
Frontier Digital Ventures Limited and Controlled Entities
Consolidated Statement of Changes in Equity
25
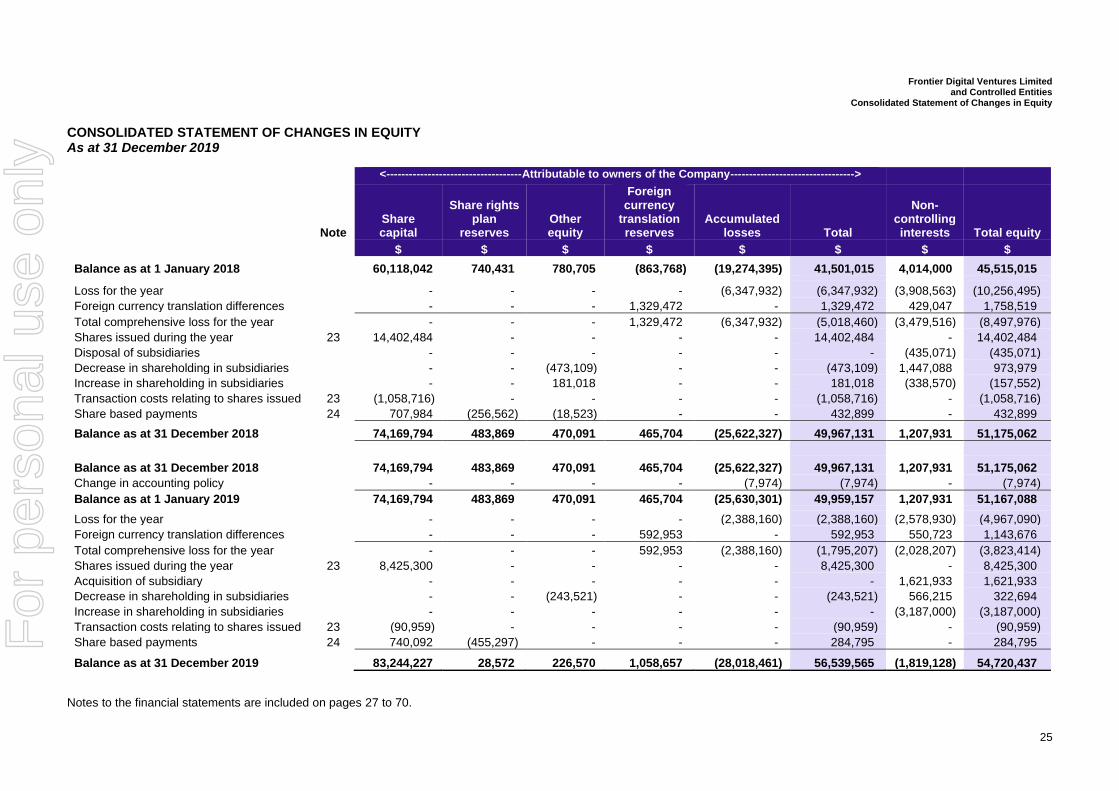
CONSOLIDATED STATEMENT OF CHANGES IN EQUITY As at 31 December 2019
<------------------------------------Attributable to owners of the Company--------------------------------->
Note Share capital
Share rights plan
reserves Other equity
Foreign currency
translation reserves
Accumulated losses Total
Non-controlling interests Total equity
$ $ $ $ $ $ $ $
Balance as at 1 January 2018 60,118,042 740,431 780,705 (863,768) (19,274,395) 41,501,015 4,014,000 45,515,015 Loss for the year - - - - (6,347,932) (6,347,932) (3,908,563) (10,256,495)
Foreign currency translation differences - - - 1,329,472 - 1,329,472 429,047 1,758,519
Total comprehensive loss for the year - - - 1,329,472 (6,347,932) (5,018,460) (3,479,516) (8,497,976)
Shares issued during the year 23 14,402,484 - - - - 14,402,484 - 14,402,484
Disposal of subsidiaries - - - - - - (435,071) (435,071)
Decrease in shareholding in subsidiaries - - (473,109) - - (473,109) 1,447,088 973,979
Increase in shareholding in subsidiaries - - 181,018 - - 181,018 (338,570) (157,552)
Transaction costs relating to shares issued 23 (1,058,716) - - - - (1,058,716) - (1,058,716)
Share based payments 24 707,984 (256,562) (18,523) - - 432,899 - 432,899
Balance as at 31 December 2018 74,169,794 483,869 470,091 465,704 (25,622,327) 49,967,131 1,207,931 51,175,062
Balance as at 31 December 2018 74,169,794 483,869 470,091 465,704 (25,622,327) 49,967,131 1,207,931 51,175,062
Change in accounting policy - - - - (7,974) (7,974) - (7,974)
Balance as at 1 January 2019 74,169,794 483,869 470,091 465,704 (25,630,301) 49,959,157 1,207,931 51,167,088 Loss for the year - - - - (2,388,160) (2,388,160) (2,578,930) (4,967,090)
Foreign currency translation differences - - - 592,953 - 592,953 550,723 1,143,676
Total comprehensive loss for the year - - - 592,953 (2,388,160) (1,795,207) (2,028,207) (3,823,414)
Shares issued during the year 23 8,425,300 - - - - 8,425,300 - 8,425,300
Acquisition of subsidiary - - - - - - 1,621,933 1,621,933
Decrease in shareholding in subsidiaries - - (243,521) - - (243,521) 566,215 322,694
Increase in shareholding in subsidiaries - - - - - - (3,187,000) (3,187,000)
Transaction costs relating to shares issued 23 (90,959) - - - - (90,959) - (90,959)
Share based payments 24 740,092 (455,297) - - - 284,795 - 284,795
Balance as at 31 December 2019 83,244,227 28,572 226,570 1,058,657 (28,018,461) 56,539,565 (1,819,128) 54,720,437
Notes to the financial statements are included on pages 27 to 70.
For
per
sona
l use
onl
y
Frontier Digital Ventures Limited and Controlled Entities
Consolidated Statement of Cash Flows
26
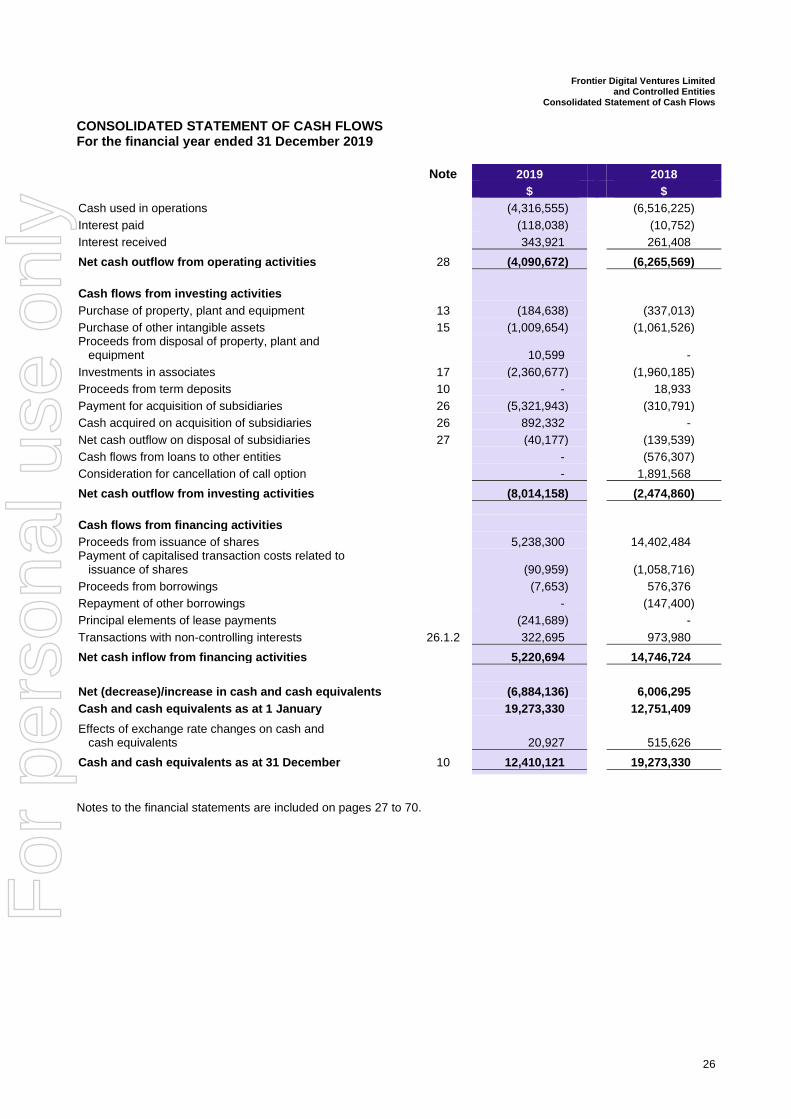
CONSOLIDATED STATEMENT OF CASH FLOWS For the financial year ended 31 December 2019
Note 2019 2018
$ $
Cash used in operations (4,316,555) (6,516,225)
Interest paid (118,038) (10,752)
Interest received 343,921 261,408
Net cash outflow from operating activities 28 (4,090,672) (6,265,569)
Cash flows from investing activities
Purchase of property, plant and equipment 13 (184,638) (337,013)
Purchase of other intangible assets 15 (1,009,654) (1,061,526) Proceeds from disposal of property, plant and equipment 10,599 -
Investments in associates 17 (2,360,677) (1,960,185)
Proceeds from term deposits 10 - 18,933
Payment for acquisition of subsidiaries 26 (5,321,943) (310,791)
Cash acquired on acquisition of subsidiaries 26 892,332 -
Net cash outflow on disposal of subsidiaries 27 (40,177) (139,539)
Cash flows from loans to other entities - (576,307)
Consideration for cancellation of call option - 1,891,568
Net cash outflow from investing activities (8,014,158) (2,474,860)
Cash flows from financing activities
Proceeds from issuance of shares 5,238,300 14,402,484 Payment of capitalised transaction costs related to issuance of shares (90,959) (1,058,716)
Proceeds from borrowings (7,653) 576,376
Repayment of other borrowings - (147,400)
Principal elements of lease payments (241,689) -
Transactions with non-controlling interests 26.1.2 322,695 973,980
Net cash inflow from financing activities 5,220,694 14,746,724
Net (decrease)/increase in cash and cash equivalents (6,884,136) 6,006,295
Cash and cash equivalents as at 1 January 19,273,330 12,751,409
Effects of exchange rate changes on cash and cash equivalents 20,927 515,626
Cash and cash equivalents as at 31 December 10 12,410,121 19,273,330
Notes to the financial statements are included on pages 27 to 70.
For
per
sona
l use
onl
y
Frontier Digital Ventures Limited and Controlled Entities
Notes to the Financial Statements
27
NOTES TO THE FINANCIAL STATEMENTS
1. General information The financial statements for the financial year ended 31 December 2019 were authorised for issue in accordance with a resolution on the 25 March 2020 have been audited. The principal activity of the Company is to invest in developing online classified businesses in underdeveloped, emerging countries or regions. The principal activities of its subsidiaries and associated companies are online classified advertising and overseas headquarters. The registered office of the Company is located at Level 7, 330 Collins Street, Melbourne VIC 3000. The principal place of business of the Company is located at 39-8, The Boulevard Mid Valley City Lingkaran Syed Putra, 59200 Kuala Lumpur, Malaysia.
2. Summary of significant accounting policies
Statement of compliance The financial report is a general purpose financial report which has been prepared in accordance with the Corporations
Act 2001, Australian Accounting Standards and interpretations issued by the Australian Accounting Standards Board,
and complies with other requirements of the law.
These financial statements also comply with International Financial Reporting Standards (IFRS) as issued by the
International Accounting Standards Board (IASB).
The financial statements were authorised for issue by the Directors on 25 March 2020. The Directors have the power
to amend and reissue the financial report.
Basis of preparation The financial report has been prepared on an accruals basis and is based on historical cost, except for financial
instruments measured at fair value through profit or loss. All amounts are presented in Australian dollars and are
rounded to the nearest dollar unless otherwise stated.
The preparation of the financial statements requires management to exercise its judgement in the process of applying
the Group’s accounting policies. It also requires the use of certain critical accounting estimates and assumptions. The
areas involving a higher degree of judgement or complexity, or areas where assumptions and estimates are significant
to the financial statements, are disclosed in Note 3.
The accounting policies set out below have been consistently applied to all years, except for the impact of the
Standards and Interpretations described below.
For
per
sona
l use
onl
y
Frontier Digital Ventures Limited and Controlled Entities
Notes to the Financial Statements
28
2. Summary of significant accounting policies (cont’d) Adoption of new and revised Accounting Standards
Amendments to Accounting Standards that are mandatorily effective for the current reporting period The Group has adopted all of the new and revised Standards and Interpretations issued by the Australian Accounting Standards Board (the AASB) that are relevant to their operations and effective for an accounting period that begins on or after 1 January 2019. New and revised Standards and amendments thereof and Interpretations effective for the current year that are relevant to the Group include:
• AASB 16 Leases
• AASB 2017-7 Amendments to Australian Accounting Standards – Long-term Interests in Associates and Joint Ventures
• AASB 2018-1 Amendments to Australian Accounting Standards – Annual Improvements 2015-2017 Cycle
• Interpretation 23 Uncertainty over Income Tax Treatments
New and revised Australian Accounting Standards in issue but not yet effective At the date of authorisation of the financial statements, the Group has not applied the following new and revised Australian Accounting Standards, Interpretations and amendments that have been issued but are not yet effective:
Standards/amendment
Effective for annual
reporting periods
beginning on or after
Expected to be initially applied in the financial year ending
AASB 2018-7 Amendments to Australian Accounting Standards – Definition of Material [AASB 101 and AASB 108]
1 January 2020 31 December 2020
AASB 2018-6 Amendments to Australian Accounting Standards – Definition of a Business [AASB 3]
1 January 2020 31 December 2020
Revised Conceptual Framework for Financial Reporting, AASB 2019-1 Amendments to Australian Accounting Standards – References to the Conceptual Framework
1 January 2020 31 December 2020
AASB 2014-10 Amendments to Australian Accounting Standards – Sale or Contribution of Assets between an Investor and its Associate or Joint Venture [AASB 10 & AASB 128], AASB 2015-10 Amendments to Australian Accounting Standards – Effective Date of Amendments to AASB 10 and AASB 128 and AASB 2017-5 Amendments to Australian Accounting Standards – Effective Date of Amendments to AASB 10 and AASB 128 and Editorial Corrections
1 January 2022 31 December 2022
AASB 2019-3 Amendments to Australian Accounting Standards – Interest Rate Benchmark Reform
1 January 2020 31 December 2020
The potential impact of the revised Standards/Interpretations on the Company's financial statements has not yet been determined. In addition, at the date of authorization of the financial statements the following IASB Standards and IFRIC Interpretations were on issue but not yet effective, but for which Australian equivalent Standards and Interpretations have not yet been issued.
Standard/amendment
Effective for annual reporting periods
beginning on or after
Amendments to References to the Conceptual Framework in IFRS Standards 1 January 2020
Amendments to Accounting Standards that are mandatorily effective for the current reporting period AASB 16: Leases AASB 16 introduces new or amended requirements with respect to lease accounting. The date of initial application of AASB 16 for the Group was 1 January 2019 and the Group elected to apply the modified retrospective approach as permitted under AASB 16 (C5)(b)). The cumulative effect of the initial application of AASB 16 is recognised as an adjustment to retained earnings at the date of initial application and comparative figures for the year ended 31 December 2018 are not restated to reflect the adoption of AASB 16.
For
per
sona
l use
onl
y
Frontier Digital Ventures Limited and Controlled Entities
Notes to the Financial Statements
29
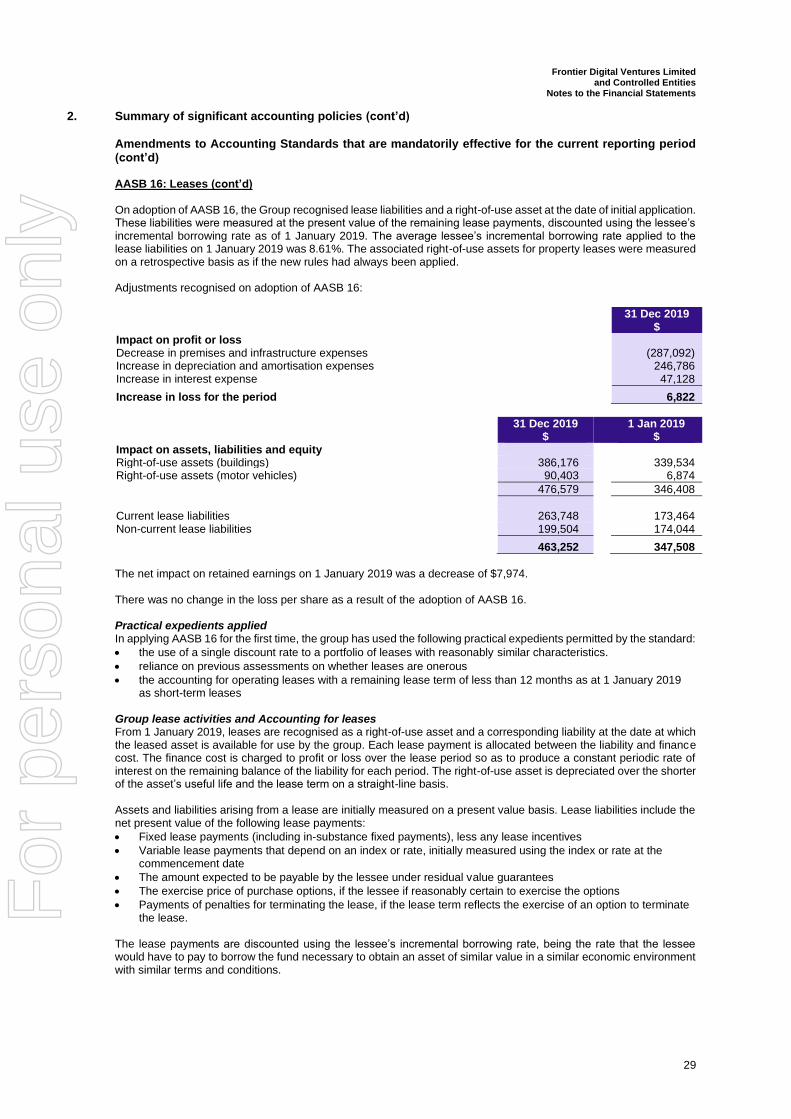
2. Summary of significant accounting policies (cont’d) Amendments to Accounting Standards that are mandatorily effective for the current reporting period (cont’d) AASB 16: Leases (cont’d) On adoption of AASB 16, the Group recognised lease liabilities and a right-of-use asset at the date of initial application. These liabilities were measured at the present value of the remaining lease payments, discounted using the lessee’s incremental borrowing rate as of 1 January 2019. The average lessee’s incremental borrowing rate applied to the lease liabilities on 1 January 2019 was 8.61%. The associated right-of-use assets for property leases were measured on a retrospective basis as if the new rules had always been applied. Adjustments recognised on adoption of AASB 16: 31 Dec 2019
$ Impact on profit or loss Decrease in premises and infrastructure expenses (287,092) Increase in depreciation and amortisation expenses 246,786 Increase in interest expense 47,128
Increase in loss for the period 6,822
31 Dec 2019
$ 1 Jan 2019
$ Impact on assets, liabilities and equity Right-of-use assets (buildings) 386,176 339,534 Right-of-use assets (motor vehicles) 90,403 6,874
476,579 346,408
Current lease liabilities 263,748 173,464 Non-current lease liabilities 199,504 174,044
463,252 347,508
The net impact on retained earnings on 1 January 2019 was a decrease of $7,974. There was no change in the loss per share as a result of the adoption of AASB 16. Practical expedients applied In applying AASB 16 for the first time, the group has used the following practical expedients permitted by the standard:
• the use of a single discount rate to a portfolio of leases with reasonably similar characteristics.
• reliance on previous assessments on whether leases are onerous
• the accounting for operating leases with a remaining lease term of less than 12 months as at 1 January 2019 as short-term leases
Group lease activities and Accounting for leases From 1 January 2019, leases are recognised as a right-of-use asset and a corresponding liability at the date at which the leased asset is available for use by the group. Each lease payment is allocated between the liability and finance cost. The finance cost is charged to profit or loss over the lease period so as to produce a constant periodic rate of interest on the remaining balance of the liability for each period. The right-of-use asset is depreciated over the shorter of the asset’s useful life and the lease term on a straight-line basis. Assets and liabilities arising from a lease are initially measured on a present value basis. Lease liabilities include the net present value of the following lease payments:
• Fixed lease payments (including in-substance fixed payments), less any lease incentives
• Variable lease payments that depend on an index or rate, initially measured using the index or rate at the commencement date
• The amount expected to be payable by the lessee under residual value guarantees
• The exercise price of purchase options, if the lessee if reasonably certain to exercise the options
• Payments of penalties for terminating the lease, if the lease term reflects the exercise of an option to terminate the lease.
The lease payments are discounted using the lessee’s incremental borrowing rate, being the rate that the lessee would have to pay to borrow the fund necessary to obtain an asset of similar value in a similar economic environment with similar terms and conditions.
For
per
sona
l use
onl
y
Frontier Digital Ventures Limited and Controlled Entities
Notes to the Financial Statements
30
2. Summary of significant accounting policies (cont’d) Amendments to Accounting Standards that are mandatorily effective for the current reporting period (cont’d) AASB 16: Leases (cont’d) Right-of-use assets are measured at cost comprising the following:
• the amount of the initial measurement of lease liability
• any lease payments made at or before the commencement date less any lease incentives received
• any initial direct costs, and
• restoration costs. Payments associated with short-term leases and leases of low-value assets are recognised on a straight-line basis as an expense in profit or loss. Short-term leases are leases with a lease term of 12 months or less. Low-value assets comprise IT equipment and small items of office furniture. The following significant accounting policies have been adopted in the preparation and presentation of the financial report:
a) Principles of consolidation and equity accounting
The consolidated financial statements comprise the financial statements of Frontier Digital Ventures Limited,
the Company, and its subsidiaries (referred to as the “Group” in these financial statements). Control is achieved
where the Group is exposed, or has rights, to variable returns from its investment with the investee and has
the ability to affect those returns through it through its power over the investee. Specifically, the Group controls
an investee if, and only if, the Group has:
• Power over the investee (i.e., existing rights that give it the current ability to direct the relevant activities
of the investee);
• Exposure, or rights, to variable returns from the involvement with the investee; and
• The ability to use its power over the investee to affect its returns. (i) Subsidiaries
Subsidiaries are all entities (including structured entities) over which the group has control. The group controls an entity when the group is exposed to, or has rights to, variable returns from its involvement with the entity and has the ability to affect those returns through its power to direct the activities of the entity. Subsidiaries are fully consolidated from the date on which control is transferred to the group. They are deconsolidated from the date that control ceases.
The acquisition method of accounting is used to account for business combinations by the group (note 2(b)). Non-controlling interests in the results and equity of subsidiaries are shown separately in the consolidated statement of profit or loss, statement of comprehensive income, statement of changes in equity and balance sheet respectively. In preparing the consolidated financial statements, all intercompany balances, transactions, unrealised gains and losses resulting from intra-group transactions and dividends have been eliminated in full. Accounting policies of subsidiaries have been changed where necessary to ensure consistency with the policies adopted by the group.
(ii) Associates
Associates are all entities over which the group has significant influence but not control or joint control. Investments in associates are accounted for using the equity method of accounting, see Note 16, after initially being recognised at cost.
(iii) Equity method Under the equity method of accounting, the investments are initially recognised at cost and adjusted thereafter to recognise the group’s share of the post-acquisition profits or losses of the investee in profit or loss, and the group’s share of movements in other comprehensive income of the investee in other comprehensive income. Dividends received or receivable from associates and joint ventures are recognised as a reduction in the carrying amount of the investment.
For
per
sona
l use
onl
y
Frontier Digital Ventures Limited and Controlled Entities
Notes to the Financial Statements
31
2. Summary of significant accounting policies (cont’d)
a) Principles of consolidation and equity accounting (cont’d) (iii) Equity method (cont’d)
Goodwill is included in the carrying amount of the investment and is not tested for impairment individually. Instead, the entire carrying amount of the investment is tested for impairment as a single asset when there is objective evidence of impairment. When the group’s share of losses in an equity-accounted investment equals or exceeds its interest in the entity, including any other unsecured long-term receivables, the group does not recognise further losses, unless it has incurred obligations or made payments on behalf of the other entity. The carrying amount of equity-accounted investments is tested for impairment in accordance with the policy described in see Note 2(k).
(iv) Changes in ownership interests
The group treats transactions with non-controlling interests that do not result in a loss of control as transactions with equity owners of the group. A change in ownership interest results in an adjustment between the carrying amounts of the controlling and non-controlling interests to reflect their relative interests in the subsidiary. Any difference between the amount of the adjustment to non-controlling interests and any consideration paid or received is recognised in a separate reserve within equity attributable to owners of the Company. When the group ceases to consolidate or equity account for an investment because of a loss of control, joint control or significant influence, any retained interest in the entity is remeasured to its fair value with the change in carrying amount recognised in profit or loss. This fair value becomes the initial carrying amount for the purposes of subsequently accounting for the retained interest as a joint venture, associate or financial asset. In addition, any amounts previously recognised in other comprehensive income in respect of that entity are accounted for as if the group had directly disposed of the related assets or liabilities. This may mean that amounts previously recognised in other comprehensive income are reclassified to profit or loss.
b) Business combinations
Business combinations are accounted for using the acquisition method. The consideration for each acquisition
is measured at the aggregate of the fair values (at the date of exchange) of assets given, liabilities incurred or
assumed, and equity instruments issued by the Group in exchange for control of the acquiree. Acquisition-
related costs are recognised in the income statement as incurred.
Where applicable, the consideration for the acquisition includes any asset or liability resulting from a contingent
consideration arrangement are measured at the acquisition date fair value and any adjustments to the fair
value are recognised in the income statement.
Where a business combination is achieved in stages, the Group’s previously held interests in the acquired
entity are remeasured to fair value at the acquisition date (i.e. the date the Group attains control) and the
resulting gain or loss, if any, is recognised in profit or loss. Amounts arising from interests in the acquiree prior
to the acquisition date that have previously been recognised in other comprehensive income are reclassified
to profit or loss, where such treatment would be appropriate if that interest were disposed of.
The acquiree’s identifiable assets, liabilities and contingent liabilities that meet the conditions for recognition
under AASB 3 are recognised at their fair value at the acquisition date.
If the initial accounting for a business combination is incomplete by the end of the reporting period in which the
combination occurs, the Group reports provisional amounts for the items for which the accounting is
incomplete. Those provisional amounts are adjusted during the measurement period (see below), or additional
assets or liabilities are recognised, to reflect new information obtained about facts and circumstances that
existed as of the acquisition date that, if known, would have affected the amounts recognised as of that date.
The measurement period is the period from the date of acquisition to the date the Group obtains complete
information about facts and circumstances that existed as of the acquisition date – and is subject to a maximum
of one year.
For
per
sona
l use
onl
y
Frontier Digital Ventures Limited and Controlled Entities
Notes to the Financial Statements
32
c) Foreign currency translation (i) Functional and presentation currency
Items included in the financial statements of each of the Group’s entities are measured using the currency of the primary economic environment in which the entity operates (the functional currency). The consolidated financial statements are presented in Australian Dollars, which is the Company’s functional and presentation currency.
(ii) Transactions and balances
Foreign currency transactions are translated into the functional currency using the exchange rates at the dates of the transactions. Foreign exchange gains and losses resulting from the settlement of such transactions and from the translation of monetary assets and liabilities denominated in foreign currencies at year end exchange rates are generally recognised in profit or loss on a net basis within other income or other expenses. Non-monetary items that are measured at fair value in a foreign currency are translated using the exchange rates at the date when the fair value was determined. Translation differences on assets and liabilities carried at fair value are reported as part of the fair value gain or loss. For example, translation differences on non-monetary assets and liabilities such as equities held at fair value through profit or loss are recognised in profit or loss as part of the fair value gain or loss.
(iii) Group companies
The results and financial position of foreign operations (none of which has the currency of a hyperinflationary economy) that have a functional currency different from the presentation currency are translated into the presentation currency as follows:
• assets and liabilities for each statement of financial position presented are translated at the closing rate at the reporting date;
• income and expenses for each statement of profit or loss and statement of comprehensive income are translated at average exchange rates (unless this is not a reasonable approximation of the cumulative effect of the rates prevailing on the transaction dates, in which case income and expenses are translated at the dates of the transactions); and
• all resulting exchange differences are recognised in other comprehensive income. On consolidation, exchange differences arising from the translation of any net investment in foreign entities, and of borrowings and other financial instruments designated as hedges of such investments, are recognised in other comprehensive income. When a foreign operation is sold or any borrowings forming part of the net investment are repaid, the associated exchange differences are reclassified to profit or loss, as part of the gain or loss on sale. Goodwill and fair value adjustments arising on the acquisition of a foreign operation are treated as assets and liabilities of the foreign operation and translated at the closing rate.
d) Revenue recognition The Group recognises revenue from the following major sources:
• Classified subscription revenue; and
• Transaction commission revenue. Revenue is measured based on the consideration to which the Group expects to be entitled in a contract with a customer and excludes amounts collected on behalf of third parties. The Group recognises revenue when it transfers control of a product or service to a customer. Classified subscription revenue The Group provides classified subscription services that provide customers the ability to publish advertisements for sale items on websites operated by the group over a specific term. Such services are recognised as a performance obligation satisfied over time. Revenue is recognised for these subscription services is recognized uniformly over the term of the contract. Payment for classified subscription services are usually received upfront and deferred over the term of the contract. Amounts deferred are reported as “Billed in advance” in the Statement of Financial Position. Transaction commission revenue The Group receives transaction revenue for services provided to customers in order to secure a sale of their asset. The performance obligation is recognized at the point in time that the transaction has been completed and the asset’s ownership has transferred from the customer to a third party. Completed transactions cannot be cancelled and are non-refundable. Payment is usually received after the services are completed. Amounts received on transaction commission revenue is recognised on a net basis as the Group acts as an agent to these transactions. The disaggregation of revenue is presented in the segment note (Note 4) which presents operations by website and geographic region (disclosed in Notes 17 and 18) which is considered to best reflect the nature, amount, timing and uncertainty of revenue and cash flows are affected by economic factors. Disaggregation by recognition over time or at a point in time has been considered immaterial based on the average term of the Group’s contracts.
For
per
sona
l use
onl
y
Frontier Digital Ventures Limited and Controlled Entities
Notes to the Financial Statements
33
e) Employee benefits A liability is recognised for benefits accruing to employees in respect of wages and salaries, annual leave, long service leave and sick leave when it is probable that settlement will be required and they are capable of being measured reliably. Amounts expected to be paid under short term incentive plans are recognised if the Group has a present legal or constructive obligation to pay the amount as a result of past service provided by employees. Liabilities recognised in respect of employee benefits expected to be settled within 12 months, are measured at their nominal values using the remuneration rate expected to apply at the time of settlement. Liabilities recognised in respect of employee benefits which are not expected to be settled within 12 months are measured as the present value of the estimated future cash outflows to be made by the Group in respect of services provided by employees up to reporting. Share-based payments The fair value of share rights granted to employees is recognised as an employee benefit expense over the period during which the employees become unconditionally entitled to the rights with a corresponding increase in equity. The total amount to be expensed is determined by reference to the fair value of the rights granted, which excludes the impact of any service and non-market performance vesting conditions. Non-market vesting conditions are included in assumptions about the number of rights that are expected to vest which are revised at the end of each reporting period. The impact of the revision to original estimates, if any, is recognised in the consolidated statement of comprehensive income, with a corresponding adjustment to equity. The fair value is measured at grant date and the expense recognised over the life of the plan.
f) Financial instruments
Recognition and Derecognition Financial assets and financial liabilities are recognised when the Company becomes a party to the contractual provisions of the financial instrument. Financial assets Financial assets are derecognised when the contractual rights to the cash flows from the financial asset expire, or when the financial asset and substantially all the risks and rewards are transferred. A financial liability is derecognised when it is extinguished, discharged, cancelled or expires. Classification of Financial assets Debt instruments that meet the following conditions are measured subsequently at amortised cost:
• The financial asset is held within a business model whose objective is to hold financial assets in order to collect contractual cash flows
• The contractual terms of the financial asset give rise on specified dates to cash flows that are solely payments of principal and interest on the principal amount outstanding.
Debt instruments that meet the following conditions are measured subsequently at fair value through other
comprehensive income (FVTOCI):
• The financial asset is held within a business model whose objective is achieved by both collecting
contractual cash flows and selling the financial assets
• The contractual terms of the financial asset give rise on specified dates to cash flows that are solely
payments of principal and interest on the principal amount outstanding.
The Group does not have any Debt instruments at fair value through other comprehensive income (FVTOCI).
By default, all other financial assets are measured subsequently at fair value through profit or loss (FVTPL).
Despite the foregoing, the entity may make the following irrevocable election / designation at initial recognition
of a financial asset:
• The entity may irrevocably elect to present subsequent changes in fair value of an equity investment in
other comprehensive income if certain criteria are met; and
• The entity may irrevocably designate a debt investment that meets the amortised cost or FVTOCI criteria
as measured at FVTPL if doing so eliminates or significantly reduces an accounting mismatch.
Initial measurement of financial assets
Financial assets are classified according to their business model and the characteristics of their contractual
cash flows. Except for those trade receivables that do not contain a significant financing component and are
measured at the transaction price in accordance with AASB 15, all financial assets are initially measured at
fair value adjusted for transaction costs.
For
per
sona
l use
onl
y
Frontier Digital Ventures Limited and Controlled Entities
Notes to the Financial Statements
34
f) Financial instruments (cont’d)
Subsequent measurement of financial assets
For the purpose of subsequent measurement, financial assets, other than those designated and effective as
hedging instruments, are classified into the following four categories:
• Financial assets at amortised cost
• Debt instruments at fair value through other comprehensive income (FVTOCI)
• Equity instruments at FVTOCI
• Financial assets at FVTPL
(i) Amortised cost and effective interest method
The effective interest method is a method of calculating the amortised cost of a debt instrument and of
allocating interest income over the relevant period.
(ii) Financial assets at fair value through profit or loss (FVTPL)
Financial assets at FVTPL are measured at fair value at the end of each reporting period, with any fair
value gains or losses recognised in profit or loss to the extent they are not part of a designated hedging
relationship. The net gain or loss recognised in profit or loss includes any dividend or interest earned on
the financial asset and is included in the ‘other gains and losses’ line.
Impairment of financial assets
The entity recognises a loss allowance for expected credit losses on investments in debt instruments that are
measured at amortised cost or at FVTOCI, lease receivables, trade receivables and contract assets, as well
as on financial guarantee contracts. The amount of expected credit losses is updated at each reporting date
to reflect changes in credit risk since initial recognition of the respective financial instrument.
Trade and other receivables and contract assets
The Company makes use of a simplified approach in accounting for trade and other receivables as well as
contract assets and records the loss allowance at the amount equal to the expected lifetime credit losses. In
using this practical expedient, the Company uses its historical experience, external indicators and forward-
looking information to calculate the expected credit losses using a provision matrix.
Financial liabilities
Financial liabilities at FVTPL
Financial liabilities at FVTPL are measured at fair value, with any gains or losses arising on changes in fair
value recognised in profit or loss to the extent that they are not part of a designated hedging relationship. The
net gain or loss recognised in profit or loss incorporates any interest paid on the financial liability and is included
in the ‘other gains and losses’ line item in profit or loss.
g) Disposal groups held for sale and discontinued operations Disposal groups are classified as held for sale if their carrying amount will be recovered principally through a
sale transaction rather than through continuing use and a sale is considered highly probable. They are
measured at the lower of their carrying amount and fair value less costs to sell, except for assets such as
deferred tax assets, assets arising from employee benefits, financial assets and investment property that are
carried at fair value and contractual rights under insurance contracts, which are specifically exempt from this
requirement.
An impairment loss is recognised for any initial or subsequent write-down of the asset (or disposal group) to
fair value less costs to sell. A gain is recognised for any subsequent increases in fair value less costs to sell of
an asset (or disposal group), but not in excess of any cumulative impairment loss previously recognised. A
gain or loss not previously recognised by the date of the sale of the non-current asset (or disposal group) is
recognised at the date of derecognition.
Non-current assets (including those that are part of a disposal group) are not depreciated or amortised while
they are classified as held for sale, interest and other expenses attributable to the liabilities of a disposal group
classified as held for sale continue to be recognised.
Non-current assets classified as held for sale and the assets of a disposal group classified as held for sale are
presented separately from the other assets in the balance sheet. The liabilities of a disposal group classified
as held for sale are presented separately from other liabilities in the balance sheet.
A discontinued operation is a component of the entity that has been disposed of or is classified as held for sale
and that represents a separate major line of business or geographical area of operations, is part of single co-
ordinated plan to dispose of such a line of business or area of operations, or is a subsidiary acquired exclusively
with a view of resale. The results of discontinued operations are presented separately in the statement of profit
or loss.
For
per
sona
l use
onl
y
Frontier Digital Ventures Limited and Controlled Entities
Notes to the Financial Statements
35
h) Property, plant and equipment Plant and equipment, leasehold improvements and equipment under finance lease are stated at cost less
accumulated depreciation and impairment. Cost includes expenditure that is directly attributable to the
acquisition of the item. In the event that settlement of all or part of the purchase consideration is deferred, cost
is determined by discounting the amounts payable in the future to their present value as at the date of
acquisition.
Depreciation is provided on property, plant and equipment. Depreciation is calculated using either straight line
or diminishing value based on the assessed appropriateness of each method for each entity within the
Company. Leasehold improvements are depreciated over the period of the lease or estimated useful life,
whichever is the shorter. The estimated useful lives, residual values and depreciation method are reviewed at
the end of each annual reporting period, with the effect of any changes recognised on a prospective basis.
The following estimated useful lives are used in the calculation of depreciation on a straight line basis:
Useful lives
Computer equipment 3 years
Leasehold improvements Life of lease
Motor vehicles 5 years
Office equipment, furniture & fittings 5 years
Plant and machinery 5 years
i) Leases Leases of plant and equipment where the group, as lessee, has substantially all the risks and rewards of ownership are classified as finance leases. Finance leases are capitalised at the lease’s inception at the fair value of the leased property or, if lower, the present value of the minimum lease payments. The corresponding rental obligations, net of finance charges, are included in other short-term and long-term payables. Each lease payment is allocated between the liability and finance cost. The finance cost is charged to the profit or loss over the lease period so as to produce a constant periodic rate of interest on the remaining balance of the liability for each period. The plant and equipment acquired under finance leases is depreciated over the asset’s useful life or over the shorter of the asset’s useful life and the lease term if there is no reasonable certainty that the group will obtain ownership at the end of the lease term. Leases in which a significant portion of the risks and rewards of ownership are not transferred to the group as lessee are classified as operating leases. Payments made under operating leases (net of any incentives received from the lessor) are charged to profit or loss on a straight-line basis over the period of the lease. Lease income from operating leases where the group is a lessor is recognised in income on a straight-line basis over the lease term. The respective leased assets are included in the statement of financial position based on their nature.
j) Intangible assets Goodwill
Goodwill arising in a business combination is recognised as an asset at the date that control is acquired (the
acquisition date). Goodwill is measured as the excess of the sum of the consideration transferred, the amount
of any non-controlling interests in the acquiree, and the fair value of the acquirer’s previously held equity
interest in the acquire (if any) over the net of the acquisition-date amounts of the identifiable assets acquired
and the liabilities assumed.
If, after reassessment, the Group’s interest in the fair value of the acquiree’s identifiable net assets exceeds
the sum of the consideration transferred, the amount of any non-controlling interests in the acquiree and the
fair value of the acquirer’s previously held equity interest in the acquire (if any), the excess is recognised
immediately in profit or loss as a bargain purchase gain.
Other intangible assets
Brands and other website development costs acquired in a business combination are recognised at fair value
at the acquisition date. They have a finite useful life and are subsequently carried at cost less accumulated
amortisation and impairment losses.
Directly attributable costs that are capitalised as part of software and website development include employee
costs. Capitalised development costs are recorded as intangible assets and amortised on a straight line basis
from the point at which the asset is ready for use.
Useful lives
Brands 5 years
Customer lists 2 years
Non competes 3 years
Software development costs 5 years
Website development costs 3 years
For
per
sona
l use
onl
y
Frontier Digital Ventures Limited and Controlled Entities
Notes to the Financial Statements
36
k) Impairment of non-financial assets Goodwill and intangible assets that have an indefinite useful life are not subject to amortisation and are tested annually for impairment, or more frequently if events or changes in circumstances indicate that they might be impaired. Other assets are tested for impairment whenever events or changes in circumstances indicate that the carrying amount may not be recoverable. An impairment loss is recognised for the amount by which the asset’s carrying amount exceeds its recoverable amount. The recoverable amount is the higher of an asset’s fair value less costs of disposal and value in use. For the purposes of assessing impairment, assets are grouped at the lowest levels for which there are separately identifiable cash inflows which are largely independent of the cash inflows from other assets or groups of assets (cash-generating units). Non-financial assets other than goodwill that suffered an impairment are reviewed for possible reversal of the impairment at the end of each reporting period.
l) Cash and cash equivalents For the purpose of presentation in the statement of cash flows, cash and cash equivalents includes cash on hand, deposits held at call with financial institutions, other short-term, highly liquid investments with original maturities of three months or less that are readily convertible to known amounts of cash and which are subject to an insignificant risk of changes in value, and bank overdrafts.
m) Provisions Provisions for legal claims, service warranties and make good obligations are recognised when the group has a present legal or constructive obligation as a result of past events, it is probable that an outflow of resources will be required to settle the obligation and the amount can be reliably estimated. Provisions are not recognised for future operating losses. Where there are a number of similar obligations, the likelihood that an outflow will be required in settlement is determined by considering the class of obligations as a whole. A provision is recognised even if the likelihood of an outflow with respect to any one item included in the same class of obligations may be small. Provisions are measured at the present value of management’s best estimate of the expenditure required to settle the present obligation at the end of the reporting period. The discount rate used to determine the present value is a pre-tax rate that reflects current market assessments of the time value of money and the risks specific to the liability. The increase in the provision due to the passage of time is recognised as interest expense.
n) Segment reporting Operating segments are reported in a manner consistent with the internal reporting provided to the chief operating decision maker. The Chief Executive Officer of the Group, who is responsible for allocating resources and assessing performance of the operating segments, has been identified as the chief operating decision maker that makes strategic decisions. The financial performances of each operating segment are disclosed in Note 4 Segment information and Note 17 Investments in associates.
o) Contributed equity Ordinary shares are classified as equity. Incremental costs directly attributable to the issue of new shares or options are shown in equity as a deduction, net of tax, from the proceeds.
p) Fair value measurements Fair value of an asset or a liability, except for share-based payment and lease transactions, is determined as the price that would be received to sell an asset or paid to transfer a liability in an orderly transaction between market participants at the measurement date. The measurement assumes that the transaction to sell the asset or transfer the liability takes place either in the principal market or in the absence of a principal market, in the most advantageous market. For a non-financial asset, the fair value measurement takes into account a market participant’s ability to generate economic benefits by using the asset in its highest and best use or by selling it to another market participant that would use the asset in its highest and best use. When measuring the fair value of an asset or a liability, the Group uses observable market data as far as possible. Fair value is categorised into different levels in a fair value hierarchy based on the input used in the valuation technique as follows:
For
per
sona
l use
onl
y
Frontier Digital Ventures Limited and Controlled Entities
Notes to the Financial Statements
37
q) Fair value measurements (cont’d) Level 1: Quoted prices (unadjusted) in active markets for identical assets or liabilities that the Group
can access at the measurement date. Level 2: Inputs other than quoted prices included within Level 1 that are observable for the asset or
liability, either directly or indirectly. Level 3: Unobservable inputs for the asset or liability. The Group recognises transfers between levels of the fair value hierarchy as of the date of the event or change in circumstances that caused the transfers.
r) Income taxes Current tax Current tax is calculated by reference to the amount of income taxes payable or recoverable in respect of the taxable profit or tax loss for the period in the countries where the group operates and generates taxable income. It is calculated using tax rates and tax laws that have been enacted or substantively enacted by reporting date. Current tax for current and prior periods is recognised as a liability (or asset) to the extent that it is unpaid (or refundable). Current income tax relating to items recognised directly in equity is recognised in equity and not in the income statement. Deferred tax Deferred tax is accounted for using the balance sheet liability method. Temporary differences are differences between the tax base of an asset or liability and its carrying amount in the balance sheet at the reporting date. The tax base of an asset or liability is the amount attributed to that asset or liability for tax purposes. In principle, deferred tax liabilities are recognised for all taxable temporary differences. Deferred tax assets are recognised to the extent that it is probable that sufficient taxable amounts will be available against which deductible temporary differences or unused tax losses and tax offsets can be utilised. However, deferred tax assets and liabilities are not recognised if the temporary differences giving rise to them arise from the initial recognition of assets and liabilities (other than as a result of a business combination) which affects neither taxable income nor accounting profit. Furthermore, a deferred tax liability is not recognised in relation to taxable temporary differences arising from the initial recognition of goodwill. Deferred tax liabilities are recognised for taxable temporary differences associated with investments in subsidiaries, branches and associates, and interests in joint ventures except where the Group is able to control the reversal of the temporary differences and it is probable that the temporary differences will not reverse in the foreseeable future. Deferred tax assets arising from deductible temporary differences associated with these investments and interests are only recognised to the extent that it is probable that there will be sufficient taxable profits against which to utilise the benefits of the temporary differences and they are expected to reverse in the foreseeable future. Deferred tax assets and liabilities are measured at the tax rates that are expected to apply to the period(s) when the asset and liability giving rise to them are realised or settled, based on tax rates (and tax laws) that have been enacted or substantively enacted by reporting date. The measurement of deferred tax liabilities and assets reflects the tax consequences that would follow from the manner in which the Group expects, at the reporting date, to recover or settle the carrying amount of its assets and liabilities. Deferred tax assets and liabilities are offset when they relate to income taxes levied by the same taxation authority and the Company intends to settle its current tax assets and liabilities on a net basis.
For
per
sona
l use
onl
y
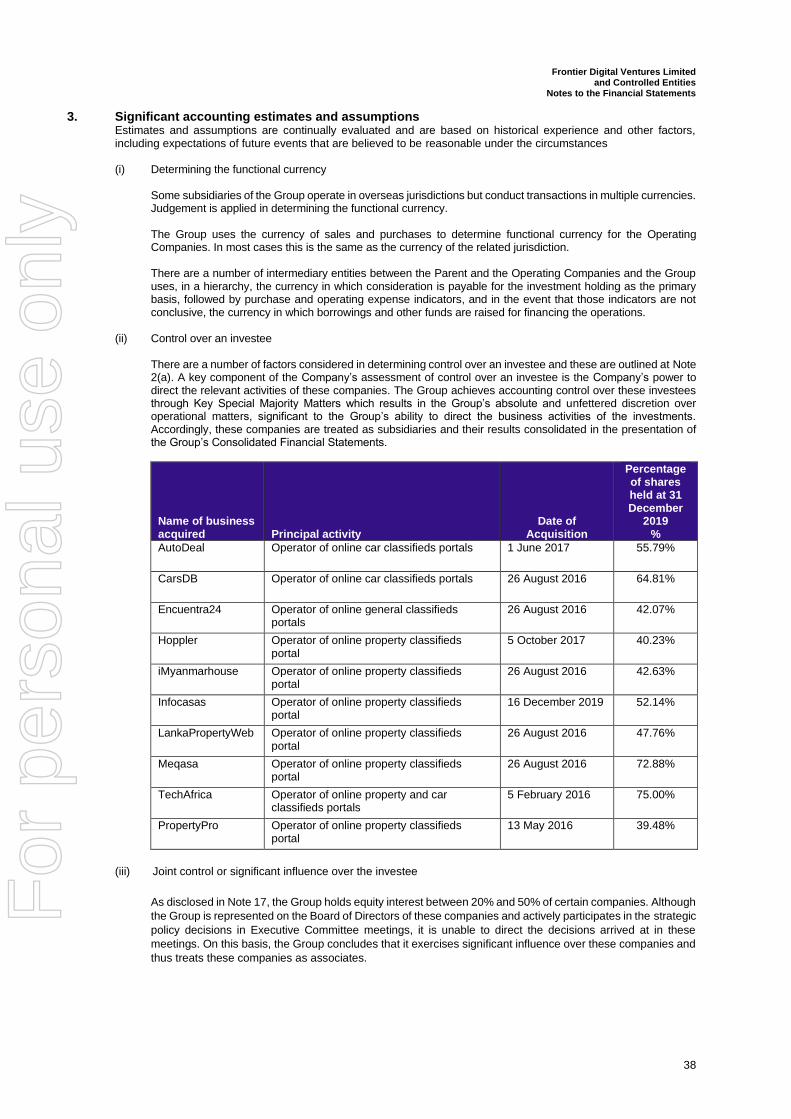
Frontier Digital Ventures Limited and Controlled Entities
Notes to the Financial Statements
38
3. Significant accounting estimates and assumptions Estimates and assumptions are continually evaluated and are based on historical experience and other factors, including expectations of future events that are believed to be reasonable under the circumstances (i) Determining the functional currency
Some subsidiaries of the Group operate in overseas jurisdictions but conduct transactions in multiple currencies. Judgement is applied in determining the functional currency. The Group uses the currency of sales and purchases to determine functional currency for the Operating Companies. In most cases this is the same as the currency of the related jurisdiction. There are a number of intermediary entities between the Parent and the Operating Companies and the Group uses, in a hierarchy, the currency in which consideration is payable for the investment holding as the primary basis, followed by purchase and operating expense indicators, and in the event that those indicators are not conclusive, the currency in which borrowings and other funds are raised for financing the operations.
(ii) Control over an investee There are a number of factors considered in determining control over an investee and these are outlined at Note 2(a). A key component of the Company’s assessment of control over an investee is the Company’s power to direct the relevant activities of these companies. The Group achieves accounting control over these investees through Key Special Majority Matters which results in the Group’s absolute and unfettered discretion over operational matters, significant to the Group’s ability to direct the business activities of the investments. Accordingly, these companies are treated as subsidiaries and their results consolidated in the presentation of the Group’s Consolidated Financial Statements.
Name of business acquired Principal activity
Date of Acquisition
Percentage of shares held at 31 December
2019 %
AutoDeal Operator of online car classifieds portals 1 June 2017 55.79%
CarsDB Operator of online car classifieds portals 26 August 2016 64.81%
Encuentra24 Operator of online general classifieds portals
26 August 2016 42.07%
Hoppler Operator of online property classifieds portal
5 October 2017 40.23%
iMyanmarhouse Operator of online property classifieds portal
26 August 2016 42.63%
Infocasas Operator of online property classifieds portal
16 December 2019 52.14%
LankaPropertyWeb Operator of online property classifieds portal
26 August 2016 47.76%
Meqasa Operator of online property classifieds portal
26 August 2016 72.88%
TechAfrica Operator of online property and car classifieds portals
5 February 2016 75.00%
PropertyPro Operator of online property classifieds portal
13 May 2016 39.48%
(iii) Joint control or significant influence over the investee
As disclosed in Note 17, the Group holds equity interest between 20% and 50% of certain companies. Although
the Group is represented on the Board of Directors of these companies and actively participates in the strategic
policy decisions in Executive Committee meetings, it is unable to direct the decisions arrived at in these
meetings. On this basis, the Group concludes that it exercises significant influence over these companies and
thus treats these companies as associates.
For
per
sona
l use
onl
y
Frontier Digital Ventures Limited and Controlled Entities
Notes to the Financial Statements
39
3. Significant accounting estimates and assumptions (cont’d)
(iv) Valuation technique
The finance department of the group performs the valuations of non-property items required for financial
reporting purposes.
The main areas of significant accounting estimates used by the Group in relation to valuations are derived and
evaluated as follows:
a) In present value calculations
• Discount rates for financial assets and financial liabilities are determined using a capital asset pricing
model to calculate a pre-tax rate that reflects current market assessments of the time value of money
and the risks specific to the asset.
• Specific risk adjustments are derived from credit risk gradings incorporating country risk premiums.
b) In purchase price allocation for business combinations
• Valuation of brands
o Relief from royalty method applied.
o Revenue growth factor for unlisted equity securities are estimated based on the Group’s
expectations from past experience of similar types of companies and specific knowledge of each
investment.
• Valuation of website and software development costs
o Based on replacement cost derived from estimated man hours and cost per hour.
(v) Impairment of non-financial assets The Group assesses impairment of non-financial assets whenever the events or changes in circumstances indicate that the carrying amount of an asset may not be recoverable i.e. the carrying amount of the asset is more than the recoverable amount. This assessment of impairment is carried out on the carrying value of investments in associated companies as well as the carrying value of goodwill on acquisitions. For the purpose of assessing impairment, assets (including goodwill) are grouped at the lowest level where there are separately identifiable cash flows (cash-generating units). Recoverable amount is measured at the higher of the fair value less cost of disposal for that asset and its value-in-use. Management has determined recoverable amounts by assessing fair value less cost of disposal based on management’s measured and reasonable expectation of selling price achievable in the open market. In doing so, a range of possible discounted cash flow scenarios are modelled over 5 years with a revenue multiple, appropriate for the markets the CGUs operate, applied to terminal year revenue. The valuation is considered to be level 2 and level 3 in the fair value hierarchy due to combination of observable and unobservable inputs used in the valuation.
(vi) Useful lives of other intangible assets
The Group estimates the useful lives to amortise other intangible assets based on the future performance of the assets acquired and management’s judgement of the period over which economic benefits will be derived from the assets. The estimated useful lives of other intangible assets are reviewed periodically, taking into consideration factors such as changes in technology. The amount and timing of recorded expenses for any period would be affected by changes in the estimates. A reduction in the estimated useful lives of the other intangible assets would increase the recorded expenses and decrease the non-current assets. The carrying amounts of the other intangible assets are disclosed Note 14.
4. Segment Information AASB 8 requires operating segments to be identified on the basis of internal reports about components of the Group that are regularly reviewed by the chief operating decision maker in order to allocate resources to the segment and to assess its performance. Information reported to the Group’s Chief Executive Officer for the purposes of resource allocation and assessment of performance is focused on each individual business combinations, essentially by brand. Due to the widespread geography and variety of types of classifieds portals (property, automotive and general classifieds) there is little commonality between each business combination and hence each business combination reviewed separately.
For
per
sona
l use
onl
y
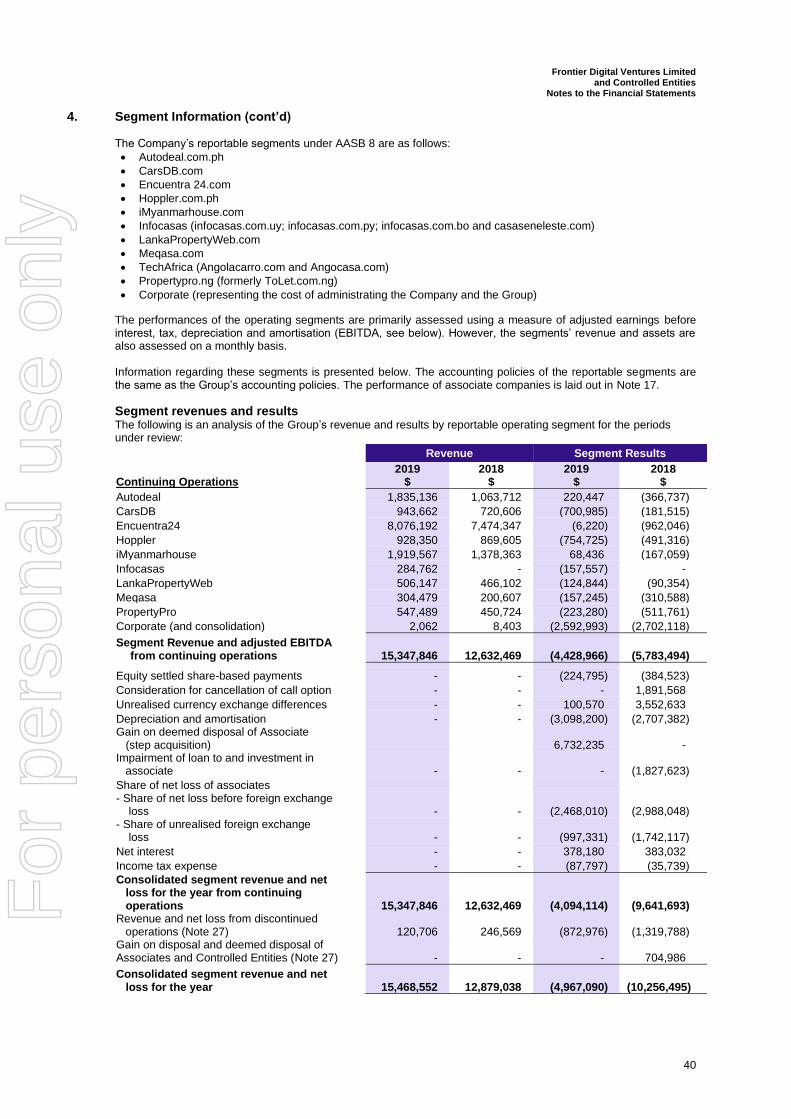
Frontier Digital Ventures Limited and Controlled Entities
Notes to the Financial Statements
40
4. Segment Information (cont’d) The Company’s reportable segments under AASB 8 are as follows:
• Autodeal.com.ph
• CarsDB.com
• Encuentra 24.com
• Hoppler.com.ph
• iMyanmarhouse.com
• Infocasas (infocasas.com.uy; infocasas.com.py; infocasas.com.bo and casaseneleste.com)
• LankaPropertyWeb.com
• Meqasa.com
• TechAfrica (Angolacarro.com and Angocasa.com)
• Propertypro.ng (formerly ToLet.com.ng)
• Corporate (representing the cost of administrating the Company and the Group)
The performances of the operating segments are primarily assessed using a measure of adjusted earnings before interest, tax, depreciation and amortisation (EBITDA, see below). However, the segments’ revenue and assets are also assessed on a monthly basis. Information regarding these segments is presented below. The accounting policies of the reportable segments are the same as the Group’s accounting policies. The performance of associate companies is laid out in Note 17.
Segment revenues and results
The following is an analysis of the Group’s revenue and results by reportable operating segment for the periods under review: Revenue Segment Results
Continuing Operations 2019
$ 2018
$ 2019
$ 2018
$
Autodeal 1,835,136 1,063,712 220,447 (366,737)
CarsDB 943,662 720,606 (700,985) (181,515)
Encuentra24 8,076,192 7,474,347 (6,220) (962,046)
Hoppler 928,350 869,605 (754,725) (491,316)
iMyanmarhouse 1,919,567 1,378,363 68,436 (167,059)
Infocasas 284,762 - (157,557) -
LankaPropertyWeb 506,147 466,102 (124,844) (90,354)
Meqasa 304,479 200,607 (157,245) (310,588)
PropertyPro 547,489 450,724 (223,280) (511,761)
Corporate (and consolidation) 2,062 8,403 (2,592,993) (2,702,118)
Segment Revenue and adjusted EBITDA from continuing operations 15,347,846 12,632,469 (4,428,966) (5,783,494)
Equity settled share-based payments - - (224,795) (384,523)
Consideration for cancellation of call option - - - 1,891,568
Unrealised currency exchange differences - - 100,570 3,552,633
Depreciation and amortisation - - (3,098,200) (2,707,382) Gain on deemed disposal of Associate (step acquisition) 6,732,235 - Impairment of loan to and investment in associate - - - (1,827,623)
Share of net loss of associates - Share of net loss before foreign exchange loss - - (2,468,010) (2,988,048) - Share of unrealised foreign exchange loss - - (997,331) (1,742,117)
Net interest - - 378,180 383,032
Income tax expense - - (87,797) (35,739)
Consolidated segment revenue and net loss for the year from continuing operations
15,347,846 12,632,469 (4,094,114) (9,641,693) Revenue and net loss from discontinued operations (Note 27) 120,706 246,569 (872,976) (1,319,788) Gain on disposal and deemed disposal of Associates and Controlled Entities (Note 27) - - - 704,986
Consolidated segment revenue and net loss for the year 15,468,552 12,879,038 (4,967,090) (10,256,495)
For
per
sona
l use
onl
y
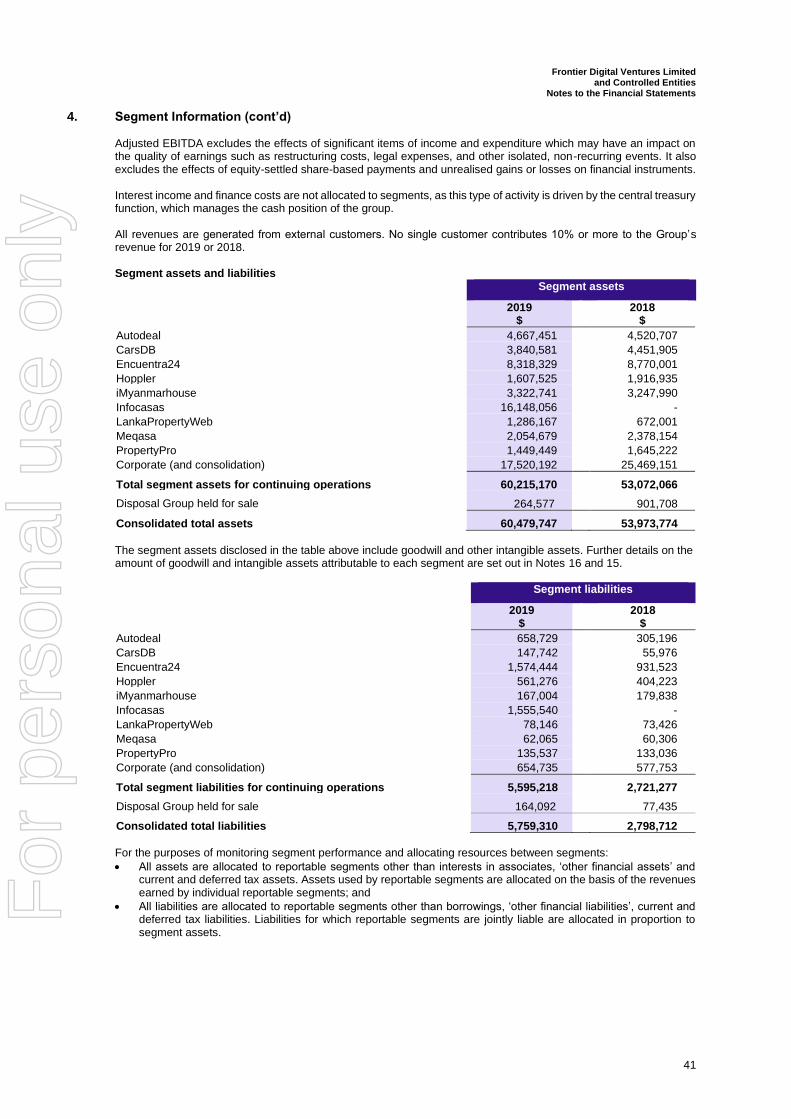
Frontier Digital Ventures Limited and Controlled Entities
Notes to the Financial Statements
41
4. Segment Information (cont’d) Adjusted EBITDA excludes the effects of significant items of income and expenditure which may have an impact on the quality of earnings such as restructuring costs, legal expenses, and other isolated, non-recurring events. It also excludes the effects of equity-settled share-based payments and unrealised gains or losses on financial instruments. Interest income and finance costs are not allocated to segments, as this type of activity is driven by the central treasury function, which manages the cash position of the group. All revenues are generated from external customers. No single customer contributes 10% or more to the Group’s revenue for 2019 or 2018. Segment assets and liabilities Segment assets
2019 $
2018 $
Autodeal 4,667,451 4,520,707
CarsDB 3,840,581 4,451,905
Encuentra24 8,318,329 8,770,001
Hoppler 1,607,525 1,916,935
iMyanmarhouse 3,322,741 3,247,990
Infocasas 16,148,056 -
LankaPropertyWeb 1,286,167 672,001
Meqasa 2,054,679 2,378,154
PropertyPro 1,449,449 1,645,222
Corporate (and consolidation) 17,520,192 25,469,151
Total segment assets for continuing operations 60,215,170 53,072,066
Disposal Group held for sale 264,577 901,708
Consolidated total assets 60,479,747 53,973,774
The segment assets disclosed in the table above include goodwill and other intangible assets. Further details on the amount of goodwill and intangible assets attributable to each segment are set out in Notes 16 and 15. Segment liabilities
2019 $
2018 $
Autodeal 658,729 305,196
CarsDB 147,742 55,976
Encuentra24 1,574,444 931,523
Hoppler 561,276 404,223
iMyanmarhouse 167,004 179,838
Infocasas 1,555,540 -
LankaPropertyWeb 78,146 73,426
Meqasa 62,065 60,306
PropertyPro 135,537 133,036
Corporate (and consolidation) 654,735 577,753
Total segment liabilities for continuing operations 5,595,218 2,721,277
Disposal Group held for sale 164,092 77,435
Consolidated total liabilities 5,759,310 2,798,712
For the purposes of monitoring segment performance and allocating resources between segments:
• All assets are allocated to reportable segments other than interests in associates, ‘other financial assets’ and current and deferred tax assets. Assets used by reportable segments are allocated on the basis of the revenues earned by individual reportable segments; and
• All liabilities are allocated to reportable segments other than borrowings, ‘other financial liabilities’, current and deferred tax liabilities. Liabilities for which reportable segments are jointly liable are allocated in proportion to segment assets.
For
per
sona
l use
onl
y
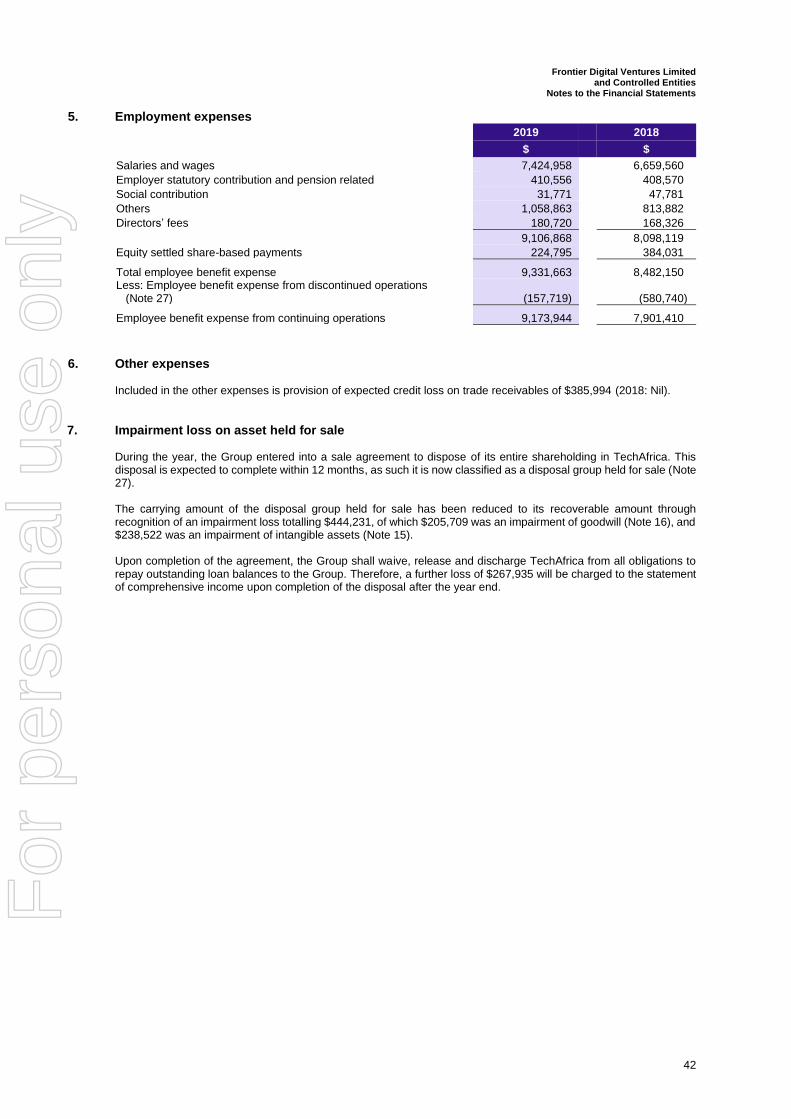
Frontier Digital Ventures Limited and Controlled Entities
Notes to the Financial Statements
42
5. Employment expenses 2019 2018 $ $
Salaries and wages 7,424,958 6,659,560
Employer statutory contribution and pension related 410,556 408,570
Social contribution 31,771 47,781
Others 1,058,863 813,882
Directors’ fees 180,720 168,326
9,106,868 8,098,119
Equity settled share-based payments 224,795 384,031
Total employee benefit expense 9,331,663 8,482,150 Less: Employee benefit expense from discontinued operations (Note 27) (157,719) (580,740)
Employee benefit expense from continuing operations 9,173,944 7,901,410
6. Other expenses Included in the other expenses is provision of expected credit loss on trade receivables of $385,994 (2018: Nil).
7. Impairment loss on asset held for sale During the year, the Group entered into a sale agreement to dispose of its entire shareholding in TechAfrica. This disposal is expected to complete within 12 months, as such it is now classified as a disposal group held for sale (Note 27). The carrying amount of the disposal group held for sale has been reduced to its recoverable amount through recognition of an impairment loss totalling $444,231, of which $205,709 was an impairment of goodwill (Note 16), and $238,522 was an impairment of intangible assets (Note 15). Upon completion of the agreement, the Group shall waive, release and discharge TechAfrica from all obligations to repay outstanding loan balances to the Group. Therefore, a further loss of $267,935 will be charged to the statement of comprehensive income upon completion of the disposal after the year end.
For
per
sona
l use
onl
y
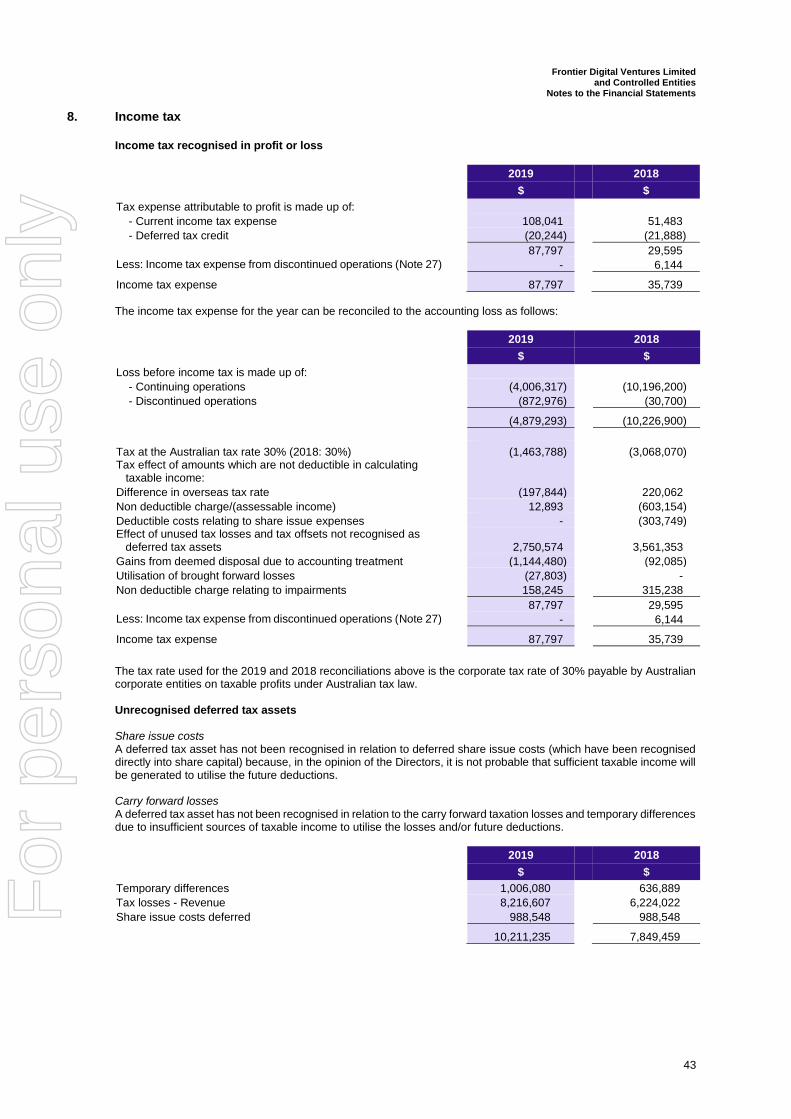
Frontier Digital Ventures Limited and Controlled Entities
Notes to the Financial Statements
43
8. Income tax
Income tax recognised in profit or loss
2019 2018 $ $
Tax expense attributable to profit is made up of:
- Current income tax expense 108,041 51,483
- Deferred tax credit (20,244) (21,888)
87,797 29,595
Less: Income tax expense from discontinued operations (Note 27) - 6,144
Income tax expense 87,797 35,739
The income tax expense for the year can be reconciled to the accounting loss as follows:
2019 2018
$ $
Loss before income tax is made up of:
- Continuing operations (4,006,317) (10,196,200)
- Discontinued operations (872,976) (30,700)
(4,879,293) (10,226,900)
Tax at the Australian tax rate 30% (2018: 30%) (1,463,788) (3,068,070) Tax effect of amounts which are not deductible in calculating taxable income:
Difference in overseas tax rate (197,844) 220,062
Non deductible charge/(assessable income) 12,893 (603,154)
Deductible costs relating to share issue expenses - (303,749) Effect of unused tax losses and tax offsets not recognised as deferred tax assets 2,750,574 3,561,353
Gains from deemed disposal due to accounting treatment (1,144,480) (92,085)
Utilisation of brought forward losses (27,803) -
Non deductible charge relating to impairments 158,245 315,238
87,797 29,595
Less: Income tax expense from discontinued operations (Note 27) - 6,144
Income tax expense 87,797 35,739
The tax rate used for the 2019 and 2018 reconciliations above is the corporate tax rate of 30% payable by Australian corporate entities on taxable profits under Australian tax law. Unrecognised deferred tax assets Share issue costs A deferred tax asset has not been recognised in relation to deferred share issue costs (which have been recognised directly into share capital) because, in the opinion of the Directors, it is not probable that sufficient taxable income will be generated to utilise the future deductions. Carry forward losses A deferred tax asset has not been recognised in relation to the carry forward taxation losses and temporary differences due to insufficient sources of taxable income to utilise the losses and/or future deductions.
2019 2018
$ $
Temporary differences 1,006,080 636,889
Tax losses - Revenue 8,216,607 6,224,022
Share issue costs deferred 988,548 988,548
10,211,235 7,849,459
For
per
sona
l use
onl
y
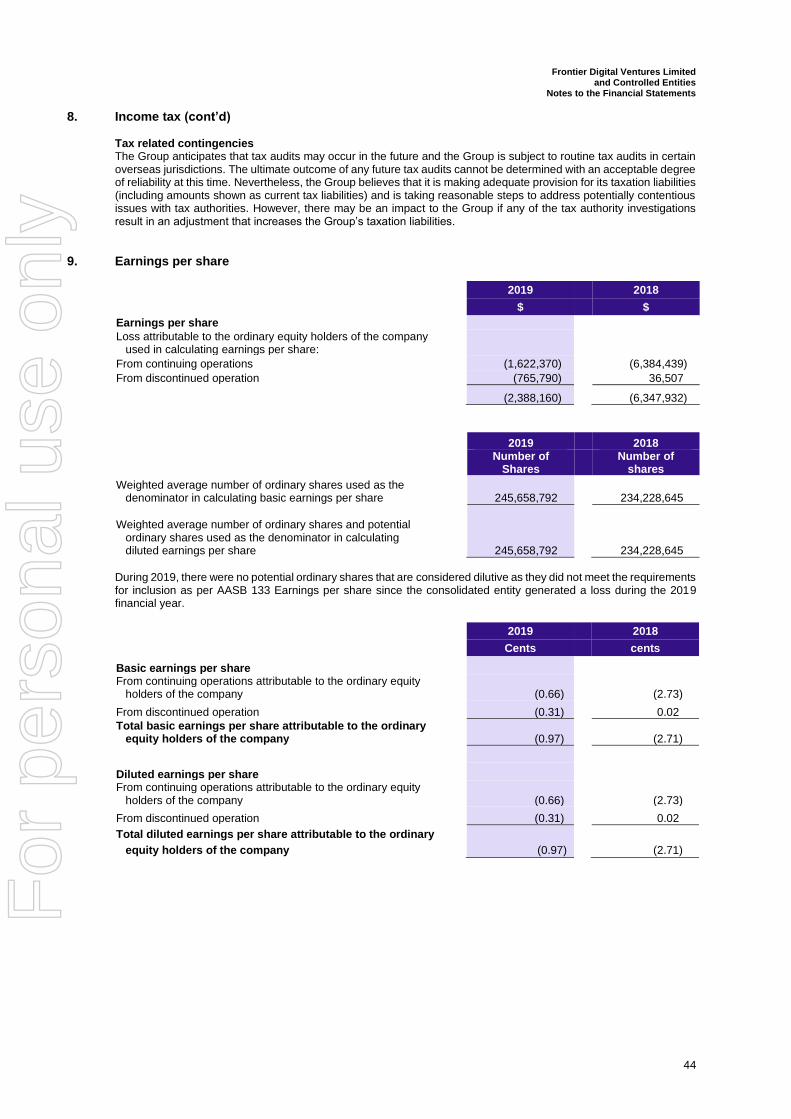
Frontier Digital Ventures Limited and Controlled Entities
Notes to the Financial Statements
44
8. Income tax (cont’d) Tax related contingencies The Group anticipates that tax audits may occur in the future and the Group is subject to routine tax audits in certain overseas jurisdictions. The ultimate outcome of any future tax audits cannot be determined with an acceptable degree of reliability at this time. Nevertheless, the Group believes that it is making adequate provision for its taxation liabilities (including amounts shown as current tax liabilities) and is taking reasonable steps to address potentially contentious issues with tax authorities. However, there may be an impact to the Group if any of the tax authority investigations result in an adjustment that increases the Group’s taxation liabilities.
9. Earnings per share
2019 2018
$ $
Earnings per share
Loss attributable to the ordinary equity holders of the company used in calculating earnings per share:
From continuing operations (1,622,370) (6,384,439)
From discontinued operation (765,790) 36,507
(2,388,160) (6,347,932)
2019 2018
Number of
Shares Number of
shares
Weighted average number of ordinary shares used as the denominator in calculating basic earnings per share 245,658,792 234,228,645
Weighted average number of ordinary shares and potential ordinary shares used as the denominator in calculating diluted earnings per share 245,658,792 234,228,645
During 2019, there were no potential ordinary shares that are considered dilutive as they did not meet the requirements for inclusion as per AASB 133 Earnings per share since the consolidated entity generated a loss during the 2019 financial year.
2019 2018
Cents cents
Basic earnings per share From continuing operations attributable to the ordinary equity holders of the company (0.66) (2.73)
From discontinued operation (0.31) 0.02
Total basic earnings per share attributable to the ordinary equity holders of the company (0.97) (2.71)
Diluted earnings per share From continuing operations attributable to the ordinary equity holders of the company (0.66) (2.73)
From discontinued operation (0.31) 0.02
Total diluted earnings per share attributable to the ordinary
equity holders of the company (0.97) (2.71)
F
or p
erso
nal u
se o
nly
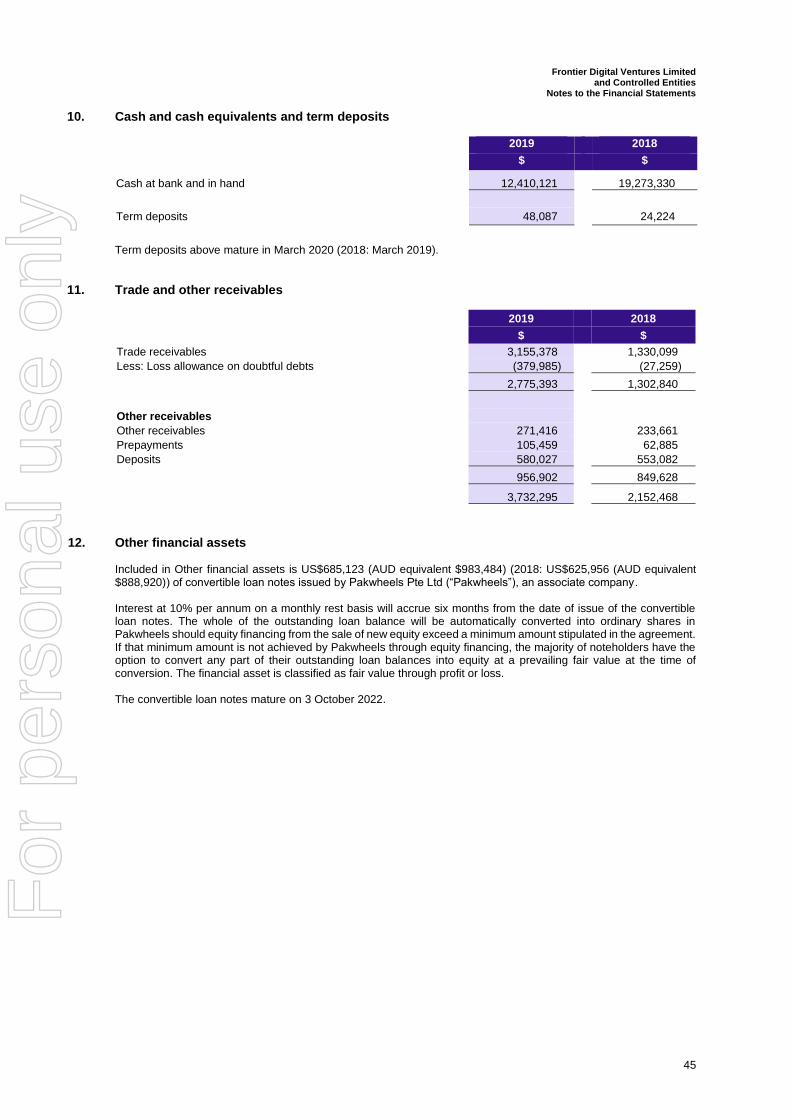
Frontier Digital Ventures Limited and Controlled Entities
Notes to the Financial Statements
45
10. Cash and cash equivalents and term deposits 2019 2018
$ $
Cash at bank and in hand 12,410,121 19,273,330
Term deposits 48,087 24,224
Term deposits above mature in March 2020 (2018: March 2019).
11. Trade and other receivables
2019 2018
$ $
Trade receivables 3,155,378 1,330,099
Less: Loss allowance on doubtful debts (379,985) (27,259)
2,775,393 1,302,840
Other receivables
Other receivables 271,416 233,661
Prepayments 105,459 62,885
Deposits 580,027 553,082
956,902 849,628
3,732,295 2,152,468
12. Other financial assets Included in Other financial assets is US$685,123 (AUD equivalent $983,484) (2018: US$625,956 (AUD equivalent $888,920)) of convertible loan notes issued by Pakwheels Pte Ltd (“Pakwheels”), an associate company. Interest at 10% per annum on a monthly rest basis will accrue six months from the date of issue of the convertible loan notes. The whole of the outstanding loan balance will be automatically converted into ordinary shares in Pakwheels should equity financing from the sale of new equity exceed a minimum amount stipulated in the agreement. If that minimum amount is not achieved by Pakwheels through equity financing, the majority of noteholders have the option to convert any part of their outstanding loan balances into equity at a prevailing fair value at the time of conversion. The financial asset is classified as fair value through profit or loss. The convertible loan notes mature on 3 October 2022.
For
per
sona
l use
onl
y
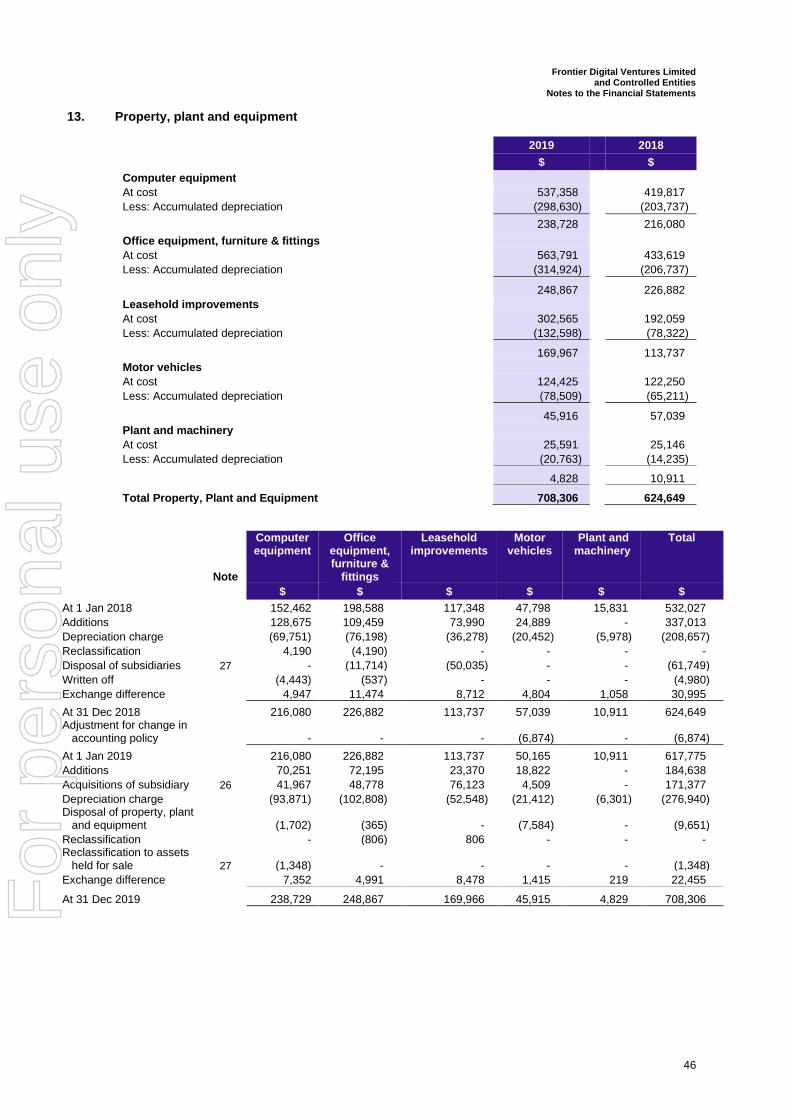
Frontier Digital Ventures Limited and Controlled Entities
Notes to the Financial Statements
46
13. Property, plant and equipment
2019 2018
$ $
Computer equipment
At cost 537,358 419,817
Less: Accumulated depreciation (298,630) (203,737)
238,728 216,080
Office equipment, furniture & fittings
At cost 563,791 433,619
Less: Accumulated depreciation (314,924) (206,737)
248,867 226,882
Leasehold improvements
At cost 302,565 192,059
Less: Accumulated depreciation (132,598) (78,322)
169,967 113,737
Motor vehicles
At cost 124,425 122,250
Less: Accumulated depreciation (78,509) (65,211)
45,916 57,039
Plant and machinery
At cost 25,591 25,146
Less: Accumulated depreciation (20,763) (14,235)
4,828 10,911
Total Property, Plant and Equipment 708,306 624,649
Note
Computer equipment
Office equipment, furniture &
fittings
Leasehold improvements
Motor vehicles
Plant and machinery
Total
$ $ $ $ $ $
At 1 Jan 2018 152,462 198,588 117,348 47,798 15,831 532,027
Additions 128,675 109,459 73,990 24,889 - 337,013
Depreciation charge (69,751) (76,198) (36,278) (20,452) (5,978) (208,657)
Reclassification 4,190 (4,190) - - - -
Disposal of subsidiaries 27 - (11,714) (50,035) - - (61,749)
Written off (4,443) (537) - - - (4,980)
Exchange difference 4,947 11,474 8,712 4,804 1,058 30,995
At 31 Dec 2018 216,080 226,882 113,737 57,039 10,911 624,649 Adjustment for change in accounting policy - - - (6,874) - (6,874)
At 1 Jan 2019 216,080 226,882 113,737 50,165 10,911 617,775
Additions 70,251 72,195 23,370 18,822 - 184,638
Acquisitions of subsidiary 26 41,967 48,778 76,123 4,509 - 171,377
Depreciation charge (93,871) (102,808) (52,548) (21,412) (6,301) (276,940) Disposal of property, plant and equipment (1,702) (365) - (7,584) - (9,651)
Reclassification - (806) 806 - - - Reclassification to assets held for sale 27 (1,348) - - - - (1,348)
Exchange difference 7,352 4,991 8,478 1,415 219 22,455
At 31 Dec 2019 238,729 248,867 169,966 45,915 4,829 708,306
For
per
sona
l use
onl
y
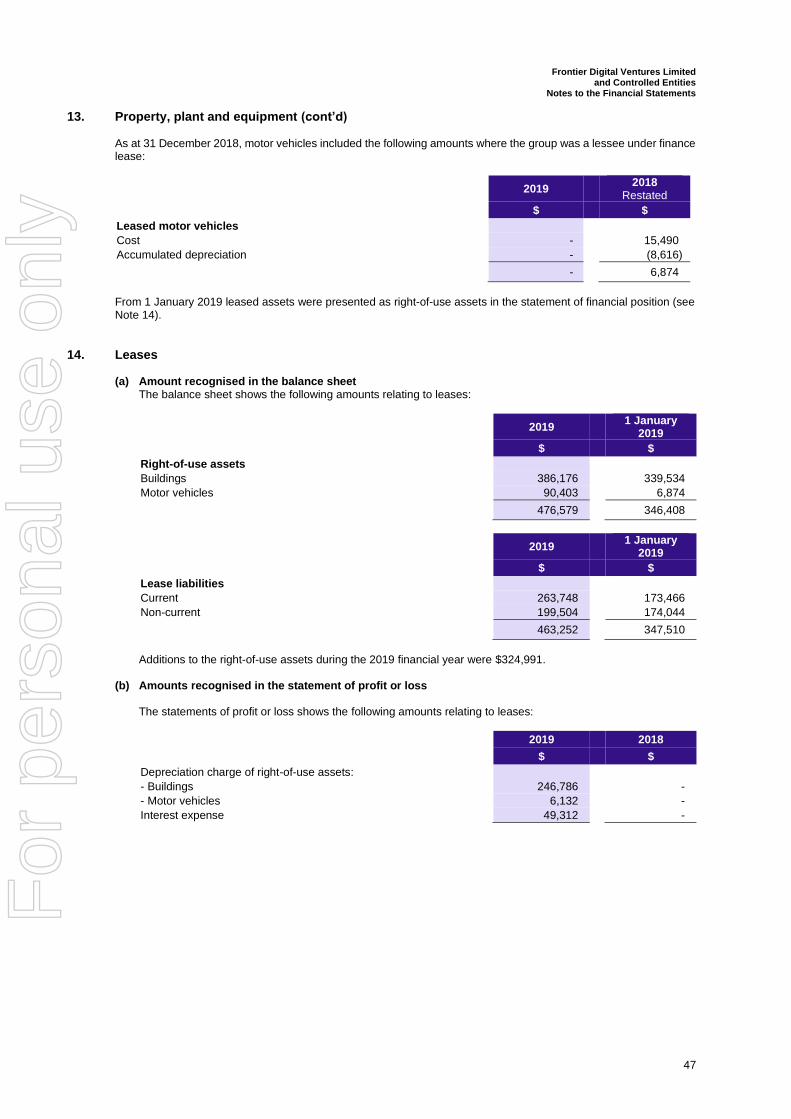
Frontier Digital Ventures Limited and Controlled Entities
Notes to the Financial Statements
47
13. Property, plant and equipment (cont’d) As at 31 December 2018, motor vehicles included the following amounts where the group was a lessee under finance lease:
2019
2018 Restated
$ $
Leased motor vehicles
Cost - 15,490
Accumulated depreciation - (8,616)
- 6,874
From 1 January 2019 leased assets were presented as right-of-use assets in the statement of financial position (see Note 14).
14. Leases (a) Amount recognised in the balance sheet
The balance sheet shows the following amounts relating to leases:
2019
1 January 2019
$ $
Right-of-use assets
Buildings 386,176 339,534
Motor vehicles 90,403 6,874
476,579 346,408
2019
1 January 2019
$ $
Lease liabilities
Current 263,748 173,466
Non-current 199,504 174,044
463,252 347,510
Additions to the right-of-use assets during the 2019 financial year were $324,991.
(b) Amounts recognised in the statement of profit or loss
The statements of profit or loss shows the following amounts relating to leases:
2019 2018
$ $
Depreciation charge of right-of-use assets:
- Buildings 246,786 -
- Motor vehicles 6,132 -
Interest expense 49,312 -
For
per
sona
l use
onl
y
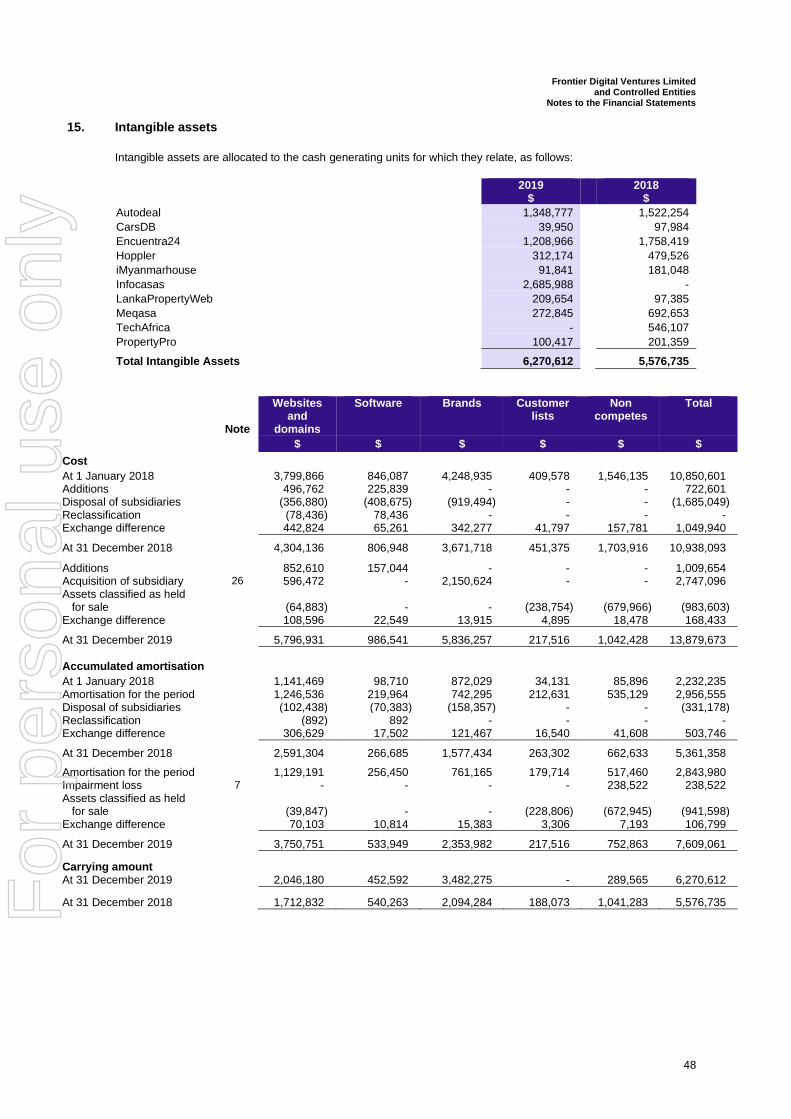
Frontier Digital Ventures Limited and Controlled Entities
Notes to the Financial Statements
48
15. Intangible assets
Intangible assets are allocated to the cash generating units for which they relate, as follows:
2019 $
2018 $
Autodeal 1,348,777 1,522,254
CarsDB 39,950 97,984
Encuentra24 1,208,966 1,758,419
Hoppler 312,174 479,526
iMyanmarhouse 91,841 181,048
Infocasas 2,685,988 -
LankaPropertyWeb 209,654 97,385
Meqasa 272,845 692,653
TechAfrica - 546,107
PropertyPro 100,417 201,359
Total Intangible Assets 6,270,612 5,576,735
Note
Websites and
domains
Software Brands Customer lists
Non competes
Total
$ $ $ $ $ $
Cost
At 1 January 2018 3,799,866 846,087 4,248,935 409,578 1,546,135 10,850,601 Additions 496,762 225,839 - - - 722,601 Disposal of subsidiaries (356,880) (408,675) (919,494) - - (1,685,049) Reclassification (78,436) 78,436 - - - - Exchange difference 442,824 65,261 342,277 41,797 157,781 1,049,940
At 31 December 2018
4,304,136 806,948 3,671,718 451,375 1,703,916 10,938,093 Additions 852,610 157,044 - - - 1,009,654 Acquisition of subsidiary 26 596,472 - 2,150,624 - - 2,747,096 Assets classified as held for sale
(64,883) - - (238,754) (679,966) (983,603) Exchange difference 108,596 22,549 13,915 4,895 18,478 168,433
At 31 December 2019
5,796,931 986,541 5,836,257 217,516 1,042,428 13,879,673
Accumulated amortisation At 1 January 2018 1,141,469 98,710 872,029 34,131 85,896 2,232,235 Amortisation for the period 1,246,536 219,964 742,295 212,631 535,129 2,956,555 Disposal of subsidiaries (102,438) (70,383) (158,357) - - (331,178) Reclassification (892) 892 - - - - Exchange difference 306,629 17,502 121,467 16,540 41,608 503,746
At 31 December 2018
2,591,304 266,685 1,577,434 263,302 662,633 5,361,358 Amortisation for the period 1,129,191 256,450 761,165 179,714 517,460 2,843,980 Impairment loss 7 - - - - 238,522 238,522 Assets classified as held for sale
(39,847) - - (228,806) (672,945) (941,598) Exchange difference 70,103 10,814 15,383 3,306 7,193 106,799
At 31 December 2019
3,750,751 533,949 2,353,982 217,516 752,863 7,609,061
Carrying amount At 31 December 2019 2,046,180 452,592 3,482,275 - 289,565 6,270,612
At 31 December 2018 1,712,832 540,263 2,094,284 188,073 1,041,283 5,576,735
For
per
sona
l use
onl
y
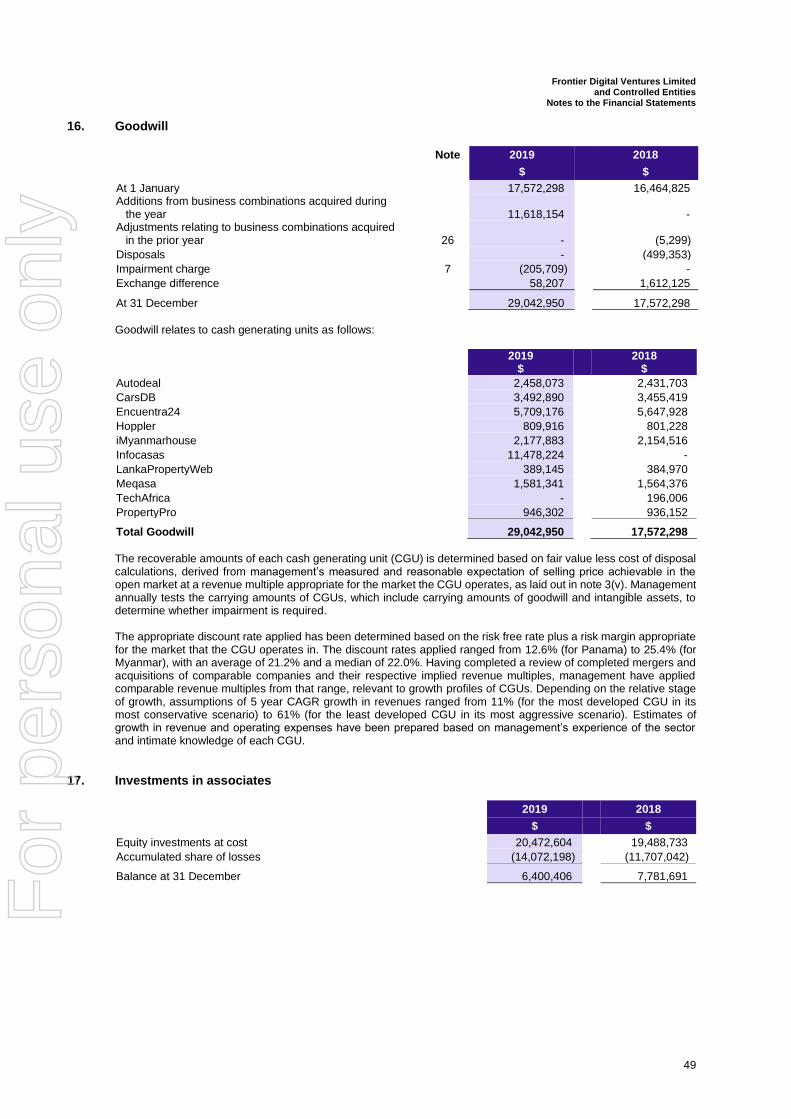
Frontier Digital Ventures Limited and Controlled Entities
Notes to the Financial Statements
49
16. Goodwill
Note 2019 2018
$ $
At 1 January 17,572,298 16,464,825 Additions from business combinations acquired during the year 11,618,154 - Adjustments relating to business combinations acquired in the prior year 26 - (5,299)
Disposals - (499,353)
Impairment charge 7 (205,709) -
Exchange difference 58,207 1,612,125
At 31 December 29,042,950 17,572,298
Goodwill relates to cash generating units as follows:
2019
$ 2018
$
Autodeal 2,458,073 2,431,703
CarsDB 3,492,890 3,455,419
Encuentra24 5,709,176 5,647,928
Hoppler 809,916 801,228
iMyanmarhouse 2,177,883 2,154,516
Infocasas 11,478,224 -
LankaPropertyWeb 389,145 384,970
Meqasa 1,581,341 1,564,376
TechAfrica - 196,006
PropertyPro 946,302 936,152
Total Goodwill 29,042,950 17,572,298
The recoverable amounts of each cash generating unit (CGU) is determined based on fair value less cost of disposal calculations, derived from management’s measured and reasonable expectation of selling price achievable in the open market at a revenue multiple appropriate for the market the CGU operates, as laid out in note 3(v). Management annually tests the carrying amounts of CGUs, which include carrying amounts of goodwill and intangible assets, to determine whether impairment is required. The appropriate discount rate applied has been determined based on the risk free rate plus a risk margin appropriate for the market that the CGU operates in. The discount rates applied ranged from 12.6% (for Panama) to 25.4% (for Myanmar), with an average of 21.2% and a median of 22.0%. Having completed a review of completed mergers and acquisitions of comparable companies and their respective implied revenue multiples, management have applied comparable revenue multiples from that range, relevant to growth profiles of CGUs. Depending on the relative stage of growth, assumptions of 5 year CAGR growth in revenues ranged from 11% (for the most developed CGU in its most conservative scenario) to 61% (for the least developed CGU in its most aggressive scenario). Estimates of growth in revenue and operating expenses have been prepared based on management’s experience of the sector and intimate knowledge of each CGU.
17. Investments in associates
2019 2018
$ $
Equity investments at cost 20,472,604 19,488,733
Accumulated share of losses (14,072,198) (11,707,042)
Balance at 31 December 6,400,406 7,781,691
For
per
sona
l use
onl
y
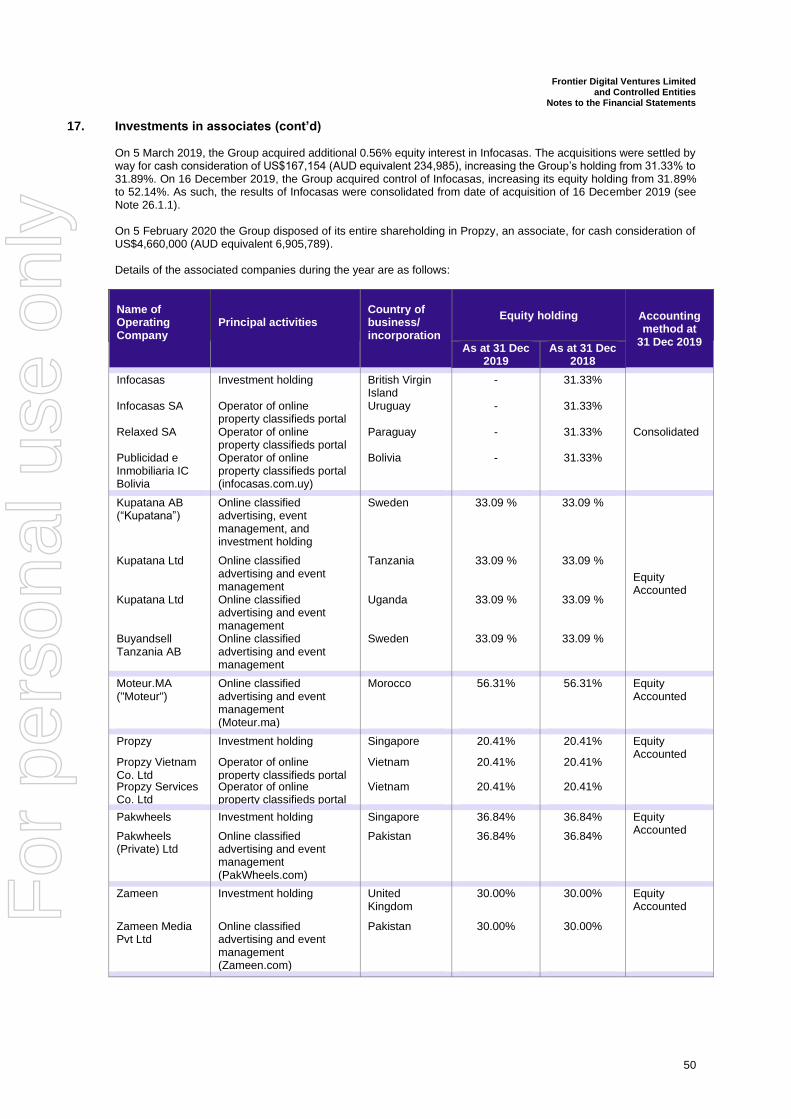
Frontier Digital Ventures Limited and Controlled Entities
Notes to the Financial Statements
50
17. Investments in associates (cont’d) On 5 March 2019, the Group acquired additional 0.56% equity interest in Infocasas. The acquisitions were settled by way for cash consideration of US$167,154 (AUD equivalent 234,985), increasing the Group’s holding from 31.33% to 31.89%. On 16 December 2019, the Group acquired control of Infocasas, increasing its equity holding from 31.89% to 52.14%. As such, the results of Infocasas were consolidated from date of acquisition of 16 December 2019 (see Note 26.1.1). On 5 February 2020 the Group disposed of its entire shareholding in Propzy, an associate, for cash consideration of US$4,660,000 (AUD equivalent 6,905,789). Details of the associated companies during the year are as follows:
Name of Operating Company
Principal activities
Country of business/ incorporation
Equity holding Accounting method at
31 Dec 2019 As at 31 Dec
2019 As at 31 Dec
2018
Infocasas Investment holding British Virgin Island
- 31.33%
Consolidated
Infocasas SA Operator of online property classifieds portal
Uruguay - 31.33%
Relaxed SA Operator of online property classifieds portal
Paraguay - 31.33%
Publicidad e Inmobiliaria IC Bolivia
Operator of online property classifieds portal (infocasas.com.uy)
Bolivia
-
31.33%
Kupatana AB (“Kupatana”)
Online classified advertising, event management, and investment holding
Sweden 33.09 % 33.09 %
Equity Accounted
Kupatana Ltd Online classified advertising and event management
Tanzania 33.09 % 33.09 %
Kupatana Ltd Online classified advertising and event management
Uganda 33.09 % 33.09 %
Buyandsell Tanzania AB
Online classified advertising and event management
Sweden 33.09 % 33.09 %
Moteur.MA ("Moteur")
Online classified advertising and event management (Moteur.ma)
Morocco 56.31% 56.31% Equity Accounted
Propzy Investment holding Singapore 20.41% 20.41%
Equity Accounted
Propzy Vietnam Co. Ltd
Operator of online property classifieds portal
Vietnam 20.41% 20.41%
Propzy Services Co. Ltd
Operator of online property classifieds portal
Vietnam 20.41% 20.41%
Pakwheels Investment holding Singapore 36.84% 36.84% Equity
Accounted Pakwheels (Private) Ltd
Online classified advertising and event management (PakWheels.com)
Pakistan 36.84% 36.84%
Zameen Investment holding United
Kingdom 30.00% 30.00% Equity
Accounted
Zameen Media Pvt Ltd
Online classified advertising and event management (Zameen.com)
Pakistan 30.00% 30.00%
For
per
sona
l use
onl
y
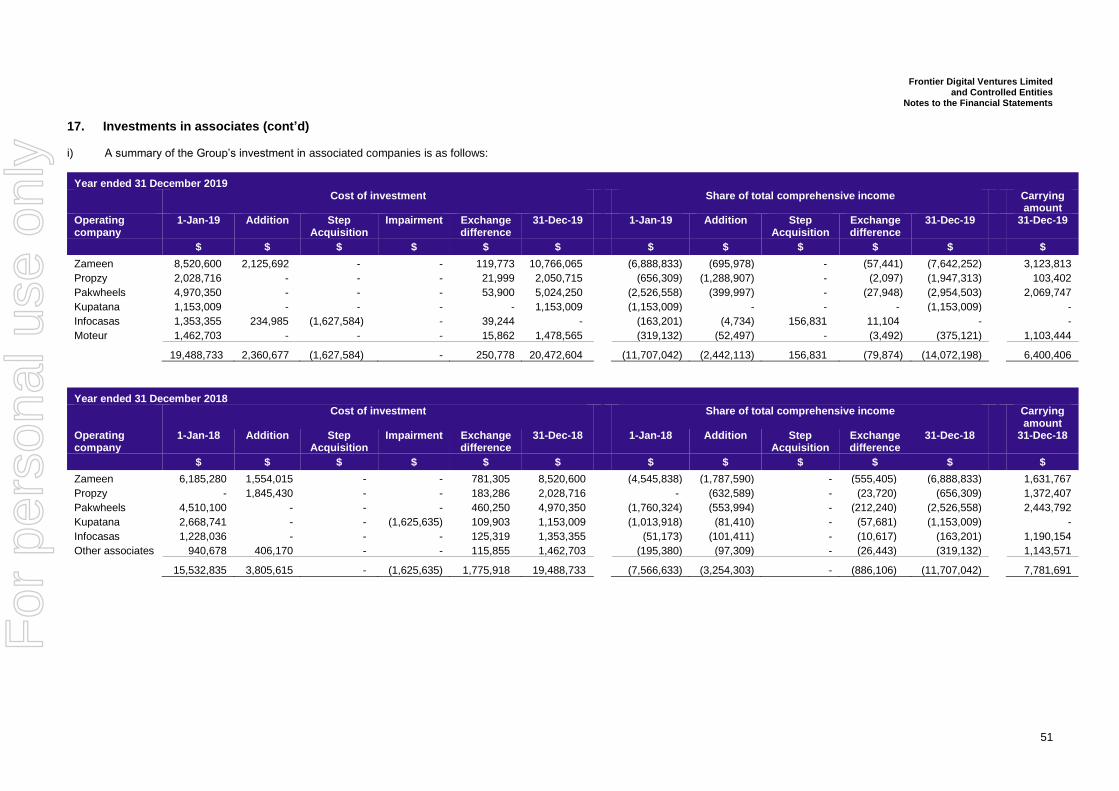
Frontier Digital Ventures Limited and Controlled Entities
Notes to the Financial Statements
51
17. Investments in associates (cont’d) i) A summary of the Group’s investment in associated companies is as follows:
Year ended 31 December 2019 Cost of investment Share of total comprehensive income Carrying
amount Operating company
1-Jan-19 Addition Step Acquisition
Impairment Exchange difference
31-Dec-19 1-Jan-19 Addition Step Acquisition
Exchange difference
31-Dec-19 31-Dec-19
$ $ $ $ $ $ $ $ $ $ $ $
Zameen 8,520,600 2,125,692 - - 119,773 10,766,065 (6,888,833) (695,978) - (57,441) (7,642,252) 3,123,813
Propzy 2,028,716 - - - 21,999 2,050,715 (656,309) (1,288,907) - (2,097) (1,947,313) 103,402
Pakwheels 4,970,350 - - - 53,900 5,024,250 (2,526,558) (399,997) - (27,948) (2,954,503) 2,069,747
Kupatana 1,153,009 - - - - 1,153,009 (1,153,009) - - - (1,153,009) -
Infocasas 1,353,355 234,985 (1,627,584) - 39,244 - (163,201) (4,734) 156,831 11,104 - -
Moteur 1,462,703 - - - 15,862 1,478,565 (319,132) (52,497) - (3,492) (375,121) 1,103,444
19,488,733 2,360,677 (1,627,584) - 250,778 20,472,604 (11,707,042) (2,442,113) 156,831 (79,874) (14,072,198) 6,400,406
Year ended 31 December 2018 Cost of investment Share of total comprehensive income Carrying
amount Operating company
1-Jan-18 Addition Step Acquisition
Impairment Exchange difference
31-Dec-18 1-Jan-18 Addition Step Acquisition
Exchange difference
31-Dec-18 31-Dec-18
$ $ $ $ $ $ $ $ $ $ $ $
Zameen 6,185,280 1,554,015 - - 781,305 8,520,600 (4,545,838) (1,787,590) - (555,405) (6,888,833) 1,631,767
Propzy - 1,845,430 - - 183,286 2,028,716 - (632,589) - (23,720) (656,309) 1,372,407
Pakwheels 4,510,100 - - - 460,250 4,970,350 (1,760,324) (553,994) - (212,240) (2,526,558) 2,443,792
Kupatana 2,668,741 - - (1,625,635) 109,903 1,153,009 (1,013,918) (81,410) - (57,681) (1,153,009) -
Infocasas 1,228,036 - - - 125,319 1,353,355 (51,173) (101,411) - (10,617) (163,201) 1,190,154
Other associates 940,678 406,170 - - 115,855 1,462,703 (195,380) (97,309) - (26,443) (319,132) 1,143,571
15,532,835 3,805,615 - (1,625,635) 1,775,918 19,488,733 (7,566,633) (3,254,303) - (886,106) (11,707,042) 7,781,691
For
per
sona
l use
onl
y
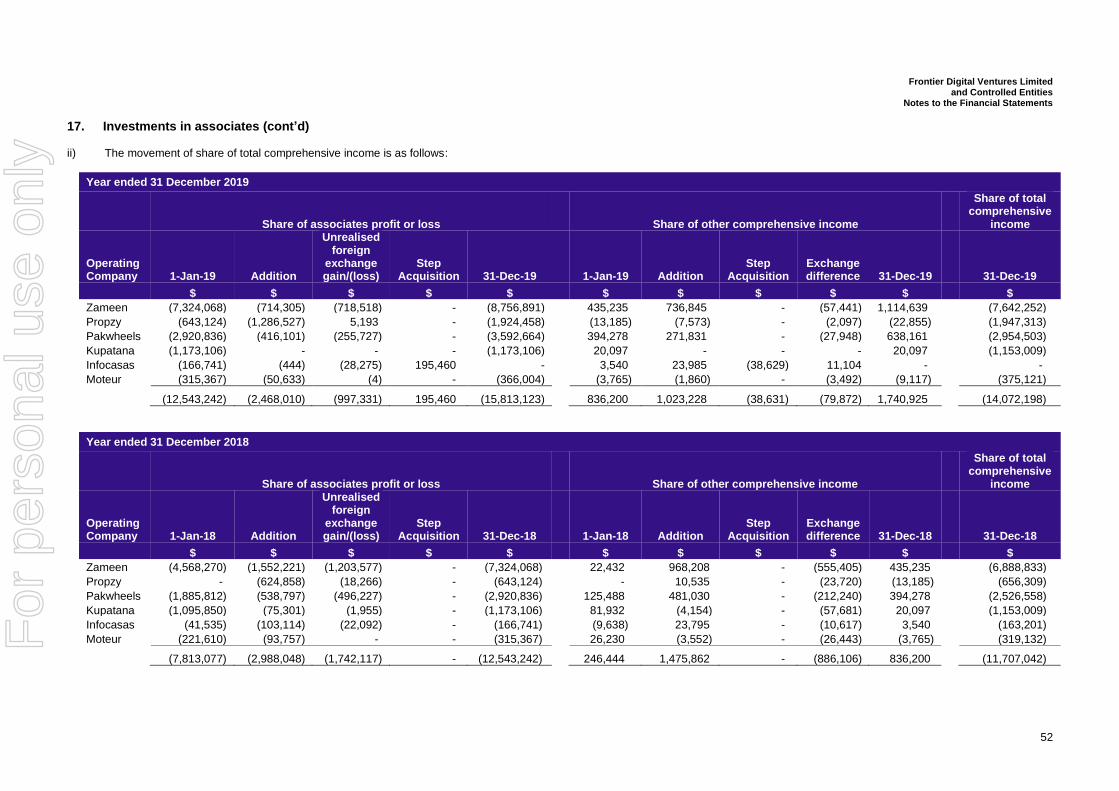
Frontier Digital Ventures Limited and Controlled Entities
Notes to the Financial Statements
52
17. Investments in associates (cont’d) ii) The movement of share of total comprehensive income is as follows:
Year ended 31 December 2019
Share of associates profit or loss Share of other comprehensive income
Share of total comprehensive
income
Operating Company 1-Jan-19 Addition
Unrealised foreign
exchange gain/(loss)
Step Acquisition 31-Dec-19 1-Jan-19 Addition
Step Acquisition
Exchange difference 31-Dec-19 31-Dec-19
$ $ $ $ $ $ $ $ $ $ $
Zameen (7,324,068) (714,305) (718,518) - (8,756,891) 435,235 736,845 - (57,441) 1,114,639 (7,642,252)
Propzy (643,124) (1,286,527) 5,193 - (1,924,458) (13,185) (7,573) - (2,097) (22,855) (1,947,313)
Pakwheels (2,920,836) (416,101) (255,727) - (3,592,664) 394,278 271,831 - (27,948) 638,161 (2,954,503)
Kupatana (1,173,106) - - - (1,173,106) 20,097 - - - 20,097 (1,153,009)
Infocasas (166,741) (444) (28,275) 195,460 - 3,540 23,985 (38,629) 11,104 - -
Moteur (315,367) (50,633) (4) - (366,004) (3,765) (1,860) - (3,492) (9,117) (375,121)
(12,543,242) (2,468,010) (997,331) 195,460 (15,813,123) 836,200 1,023,228 (38,631) (79,872) 1,740,925 (14,072,198)
Year ended 31 December 2018
Share of associates profit or loss Share of other comprehensive income
Share of total comprehensive
income
Operating Company 1-Jan-18 Addition
Unrealised foreign
exchange gain/(loss)
Step Acquisition 31-Dec-18 1-Jan-18 Addition
Step Acquisition
Exchange difference 31-Dec-18 31-Dec-18
$ $ $ $ $ $ $ $ $ $ $
Zameen (4,568,270) (1,552,221) (1,203,577) - (7,324,068) 22,432 968,208 - (555,405) 435,235 (6,888,833)
Propzy - (624,858) (18,266) - (643,124) - 10,535 - (23,720) (13,185) (656,309)
Pakwheels (1,885,812) (538,797) (496,227) - (2,920,836) 125,488 481,030 - (212,240) 394,278 (2,526,558)
Kupatana (1,095,850) (75,301) (1,955) - (1,173,106) 81,932 (4,154) - (57,681) 20,097 (1,153,009)
Infocasas (41,535) (103,114) (22,092) - (166,741) (9,638) 23,795 - (10,617) 3,540 (163,201)
Moteur (221,610) (93,757) - - (315,367) 26,230 (3,552) - (26,443) (3,765) (319,132)
(7,813,077) (2,988,048) (1,742,117) - (12,543,242) 246,444 1,475,862 - (886,106) 836,200 (11,707,042)
For
per
sona
l use
onl
y
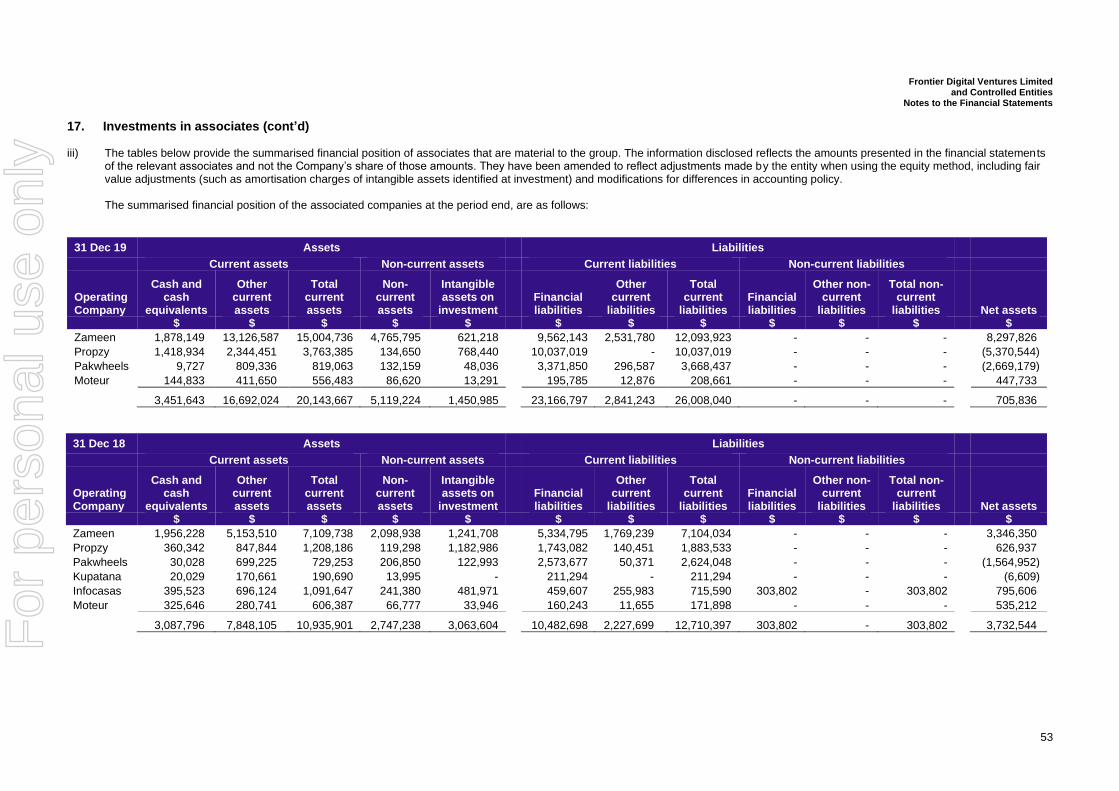
Frontier Digital Ventures Limited and Controlled Entities
Notes to the Financial Statements
53
17. Investments in associates (cont’d) iii) The tables below provide the summarised financial position of associates that are material to the group. The information disclosed reflects the amounts presented in the financial statements
of the relevant associates and not the Company’s share of those amounts. They have been amended to reflect adjustments made by the entity when using the equity method, including fair value adjustments (such as amortisation charges of intangible assets identified at investment) and modifications for differences in accounting policy.
The summarised financial position of the associated companies at the period end, are as follows:
31 Dec 19 Assets Liabilities
Current assets Non-current assets Current liabilities Non-current liabilities
Operating Company
Cash and cash
equivalents
Other current assets
Total current assets
Non-current assets
Intangible assets on
investment
Financial liabilities
Other current
liabilities
Total current
liabilities Financial liabilities
Other non-current
liabilities
Total non-current
liabilities Net assets
$ $ $ $ $ $ $ $ $ $ $ $
Zameen 1,878,149 13,126,587 15,004,736 4,765,795 621,218 9,562,143 2,531,780 12,093,923 - - - 8,297,826
Propzy 1,418,934 2,344,451 3,763,385 134,650 768,440 10,037,019 - 10,037,019 - - - (5,370,544)
Pakwheels 9,727 809,336 819,063 132,159 48,036 3,371,850 296,587 3,668,437 - - - (2,669,179)
Moteur 144,833 411,650 556,483 86,620 13,291 195,785 12,876 208,661 - - - 447,733
3,451,643 16,692,024 20,143,667 5,119,224 1,450,985 23,166,797 2,841,243 26,008,040 - - - 705,836
31 Dec 18 Assets Liabilities
Current assets Non-current assets Current liabilities Non-current liabilities
Operating Company
Cash and cash
equivalents
Other current assets
Total current assets
Non-current assets
Intangible assets on
investment
Financial liabilities
Other current
liabilities
Total current
liabilities Financial liabilities
Other non-current
liabilities
Total non-current
liabilities Net assets
$ $ $ $ $ $ $ $ $ $ $ $
Zameen 1,956,228 5,153,510 7,109,738 2,098,938 1,241,708 5,334,795 1,769,239 7,104,034 - - - 3,346,350
Propzy 360,342 847,844 1,208,186 119,298 1,182,986 1,743,082 140,451 1,883,533 - - - 626,937
Pakwheels 30,028 699,225 729,253 206,850 122,993 2,573,677 50,371 2,624,048 - - - (1,564,952)
Kupatana 20,029 170,661 190,690 13,995 - 211,294 - 211,294 - - - (6,609)
Infocasas 395,523 696,124 1,091,647 241,380 481,971 459,607 255,983 715,590 303,802 - 303,802 795,606
Moteur 325,646 280,741 606,387 66,777 33,946 160,243 11,655 171,898 - - - 535,212
3,087,796 7,848,105 10,935,901 2,747,238 3,063,604 10,482,698 2,227,699 12,710,397 303,802 - 303,802 3,732,544
For
per
sona
l use
onl
y
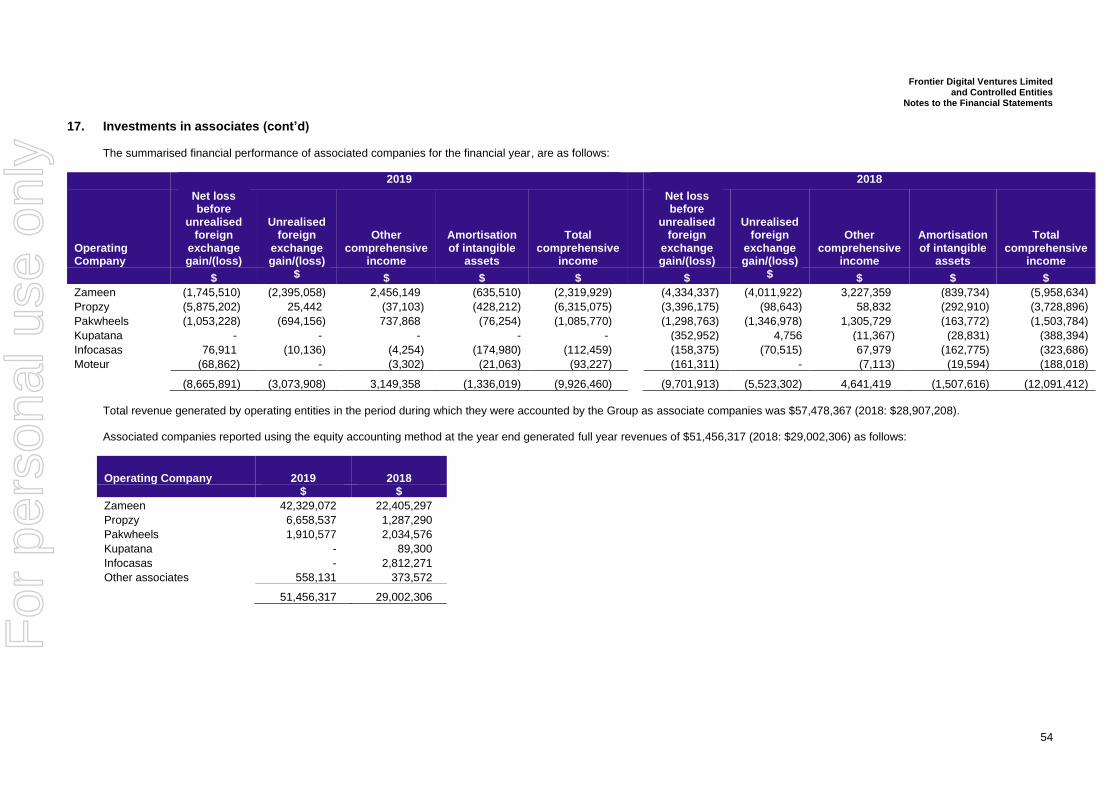
Frontier Digital Ventures Limited and Controlled Entities
Notes to the Financial Statements
54
17. Investments in associates (cont’d)
The summarised financial performance of associated companies for the financial year, are as follows:
2019 2018
Operating Company
Net loss before
unrealised foreign
exchange gain/(loss)
Unrealised foreign
exchange gain/(loss)
Other comprehensive
income
Amortisation of intangible
assets
Total comprehensive
income
Net loss before
unrealised foreign
exchange gain/(loss)
Unrealised foreign
exchange gain/(loss)
Other comprehensive
income
Amortisation of intangible
assets
Total comprehensive
income
$ $ $ $ $ $ $ $ $ $
Zameen (1,745,510) (2,395,058) 2,456,149 (635,510) (2,319,929) (4,334,337) (4,011,922) 3,227,359 (839,734) (5,958,634)
Propzy (5,875,202) 25,442 (37,103) (428,212) (6,315,075) (3,396,175) (98,643) 58,832 (292,910) (3,728,896)
Pakwheels (1,053,228) (694,156) 737,868 (76,254) (1,085,770) (1,298,763) (1,346,978) 1,305,729 (163,772) (1,503,784)
Kupatana - - - - - (352,952) 4,756 (11,367) (28,831) (388,394)
Infocasas 76,911 (10,136) (4,254) (174,980) (112,459) (158,375) (70,515) 67,979 (162,775) (323,686)
Moteur (68,862) - (3,302) (21,063) (93,227) (161,311) - (7,113) (19,594) (188,018)
(8,665,891) (3,073,908) 3,149,358 (1,336,019) (9,926,460) (9,701,913) (5,523,302) 4,641,419 (1,507,616) (12,091,412)
Total revenue generated by operating entities in the period during which they were accounted by the Group as associate companies was $57,478,367 (2018: $28,907,208). Associated companies reported using the equity accounting method at the year end generated full year revenues of $51,456,317 (2018: $29,002,306) as follows:
Operating Company 2019 2018
$ $
Zameen 42,329,072 22,405,297
Propzy 6,658,537 1,287,290
Pakwheels 1,910,577 2,034,576
Kupatana - 89,300
Infocasas - 2,812,271
Other associates 558,131 373,572
51,456,317 29,002,306
For
per
sona
l use
onl
y
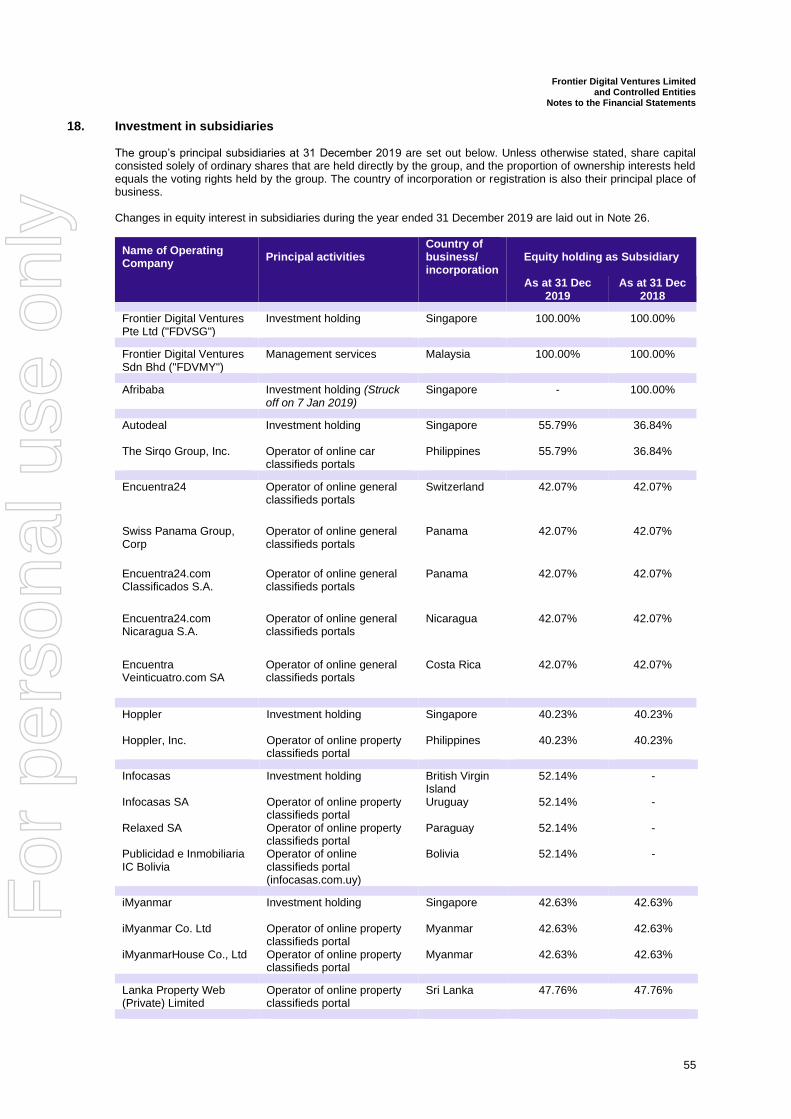
Frontier Digital Ventures Limited and Controlled Entities
Notes to the Financial Statements
55
18. Investment in subsidiaries The group’s principal subsidiaries at 31 December 2019 are set out below. Unless otherwise stated, share capital consisted solely of ordinary shares that are held directly by the group, and the proportion of ownership interests held equals the voting rights held by the group. The country of incorporation or registration is also their principal place of business. Changes in equity interest in subsidiaries during the year ended 31 December 2019 are laid out in Note 26.
Name of Operating Company
Principal activities Country of business/ incorporation
Equity holding as Subsidiary
As at 31 Dec
2019 As at 31 Dec
2018
Frontier Digital Ventures Pte Ltd ("FDVSG")
Investment holding Singapore 100.00% 100.00%
Frontier Digital Ventures Sdn Bhd ("FDVMY")
Management services Malaysia 100.00% 100.00%
Afribaba Investment holding (Struck
off on 7 Jan 2019) Singapore - 100.00%
Autodeal
Investment holding
Singapore
55.79%
36.84%
The Sirqo Group, Inc. Operator of online car classifieds portals
Philippines 55.79% 36.84%
Encuentra24 Operator of online general
classifieds portals Switzerland 42.07% 42.07%
Swiss Panama Group, Corp
Operator of online general classifieds portals
Panama 42.07% 42.07%
Encuentra24.com Classificados S.A.
Operator of online general classifieds portals
Panama 42.07% 42.07%
Encuentra24.com Nicaragua S.A.
Operator of online general classifieds portals
Nicaragua 42.07% 42.07%
Encuentra Veinticuatro.com SA
Operator of online general classifieds portals
Costa Rica 42.07% 42.07%
Hoppler
Investment holding
Singapore
40.23%
40.23%
Hoppler, Inc. Operator of online property classifieds portal
Philippines 40.23% 40.23%
Infocasas Investment holding British Virgin
Island 52.14% -
Infocasas SA Operator of online property classifieds portal
Uruguay 52.14% -
Relaxed SA Operator of online property classifieds portal
Paraguay 52.14% -
Publicidad e Inmobiliaria IC Bolivia
Operator of online classifieds portal (infocasas.com.uy)
Bolivia 52.14% -
iMyanmar Investment holding
Singapore 42.63% 42.63%
iMyanmar Co. Ltd Operator of online property classifieds portal
Myanmar 42.63% 42.63%
iMyanmarHouse Co., Ltd Operator of online property classifieds portal
Myanmar 42.63% 42.63%
Lanka Property Web (Private) Limited
Operator of online property classifieds portal
Sri Lanka 47.76% 47.76%
For
per
sona
l use
onl
y
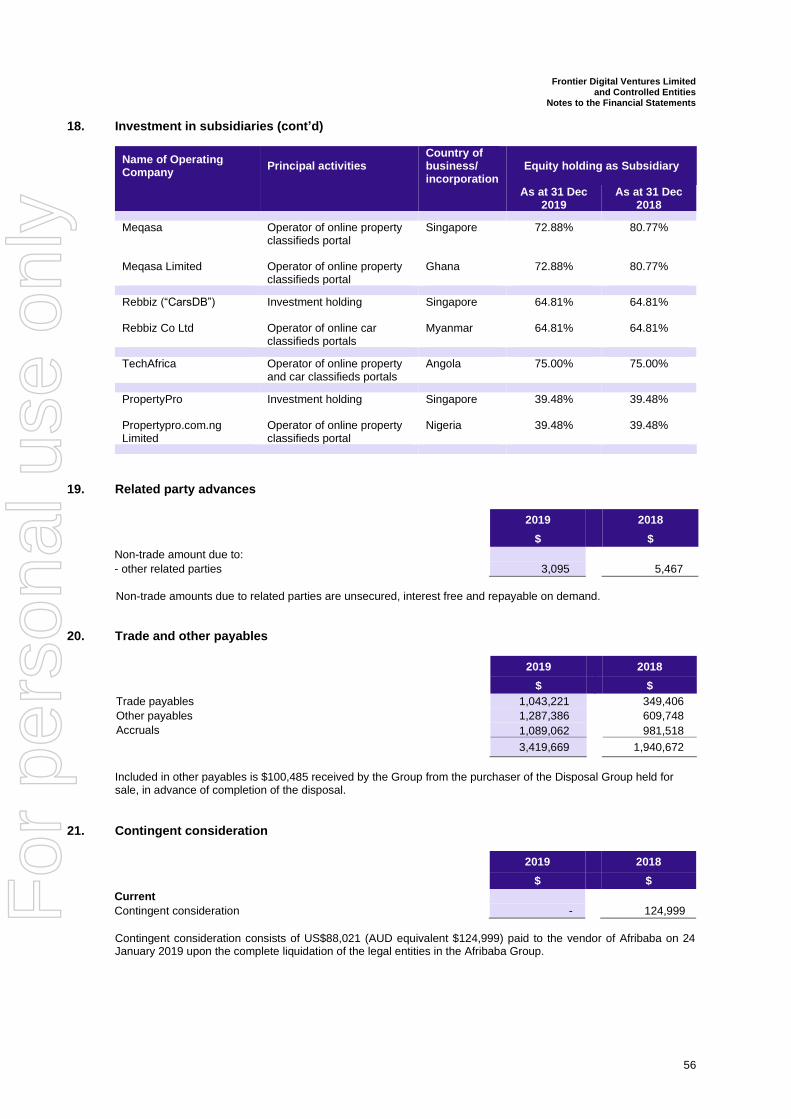
Frontier Digital Ventures Limited and Controlled Entities
Notes to the Financial Statements
56
18. Investment in subsidiaries (cont’d)
Name of Operating Company
Principal activities Country of business/ incorporation
Equity holding as Subsidiary
As at 31 Dec
2019 As at 31 Dec
2018 Meqasa Operator of online property
classifieds portal
Singapore 72.88% 80.77%
Meqasa Limited Operator of online property classifieds portal
Ghana 72.88% 80.77%
Rebbiz (“CarsDB”) Investment holding
Singapore 64.81% 64.81%
Rebbiz Co Ltd Operator of online car classifieds portals
Myanmar 64.81% 64.81%
TechAfrica Operator of online property
and car classifieds portals Angola 75.00% 75.00%
PropertyPro Investment holding
Singapore 39.48% 39.48%
Propertypro.com.ng Limited
Operator of online property classifieds portal
Nigeria 39.48% 39.48%
19. Related party advances 2019 2018
$ $
Non-trade amount due to:
- other related parties 3,095 5,467
Non-trade amounts due to related parties are unsecured, interest free and repayable on demand.
20. Trade and other payables
2019 2018
$ $
Trade payables 1,043,221 349,406
Other payables 1,287,386 609,748
Accruals 1,089,062 981,518 3,419,669 1,940,672
Included in other payables is $100,485 received by the Group from the purchaser of the Disposal Group held for sale, in advance of completion of the disposal.
21. Contingent consideration
2019 2018
$ $
Current
Contingent consideration - 124,999
Contingent consideration consists of US$88,021 (AUD equivalent $124,999) paid to the vendor of Afribaba on 24 January 2019 upon the complete liquidation of the legal entities in the Afribaba Group.
For
per
sona
l use
onl
y
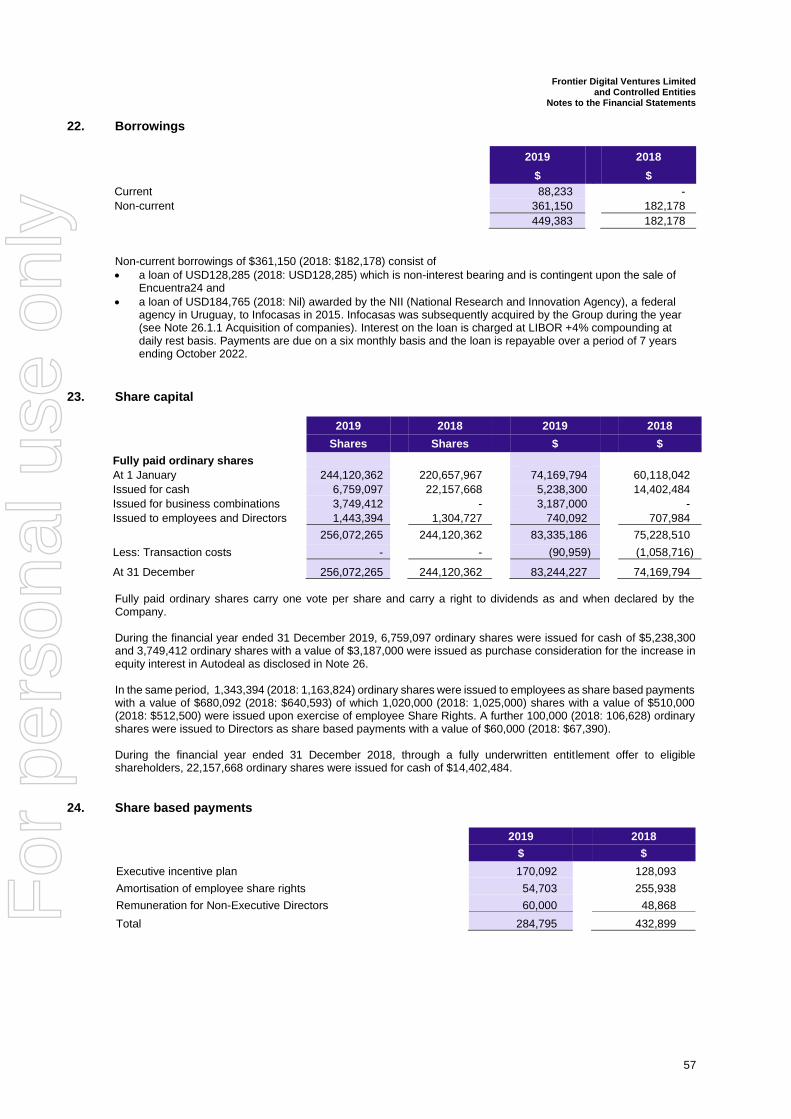
Frontier Digital Ventures Limited and Controlled Entities
Notes to the Financial Statements
57
22. Borrowings
2019 2018
$ $
Current 88,233 -
Non-current 361,150 182,178
449,383 182,178
Non-current borrowings of $361,150 (2018: $182,178) consist of
• a loan of USD128,285 (2018: USD128,285) which is non-interest bearing and is contingent upon the sale of Encuentra24 and
• a loan of USD184,765 (2018: Nil) awarded by the NII (National Research and Innovation Agency), a federal agency in Uruguay, to Infocasas in 2015. Infocasas was subsequently acquired by the Group during the year (see Note 26.1.1 Acquisition of companies). Interest on the loan is charged at LIBOR +4% compounding at daily rest basis. Payments are due on a six monthly basis and the loan is repayable over a period of 7 years ending October 2022.
23. Share capital
2019 2018 2019 2018
Shares Shares $ $
Fully paid ordinary shares
At 1 January 244,120,362 220,657,967 74,169,794 60,118,042
Issued for cash 6,759,097 22,157,668 5,238,300 14,402,484
Issued for business combinations 3,749,412 - 3,187,000 -
Issued to employees and Directors 1,443,394 1,304,727 740,092 707,984 256,072,265 244,120,362 83,335,186 75,228,510
Less: Transaction costs - - (90,959) (1,058,716)
At 31 December 256,072,265 244,120,362 83,244,227 74,169,794
Fully paid ordinary shares carry one vote per share and carry a right to dividends as and when declared by the Company. During the financial year ended 31 December 2019, 6,759,097 ordinary shares were issued for cash of $5,238,300 and 3,749,412 ordinary shares with a value of $3,187,000 were issued as purchase consideration for the increase in equity interest in Autodeal as disclosed in Note 26. In the same period, 1,343,394 (2018: 1,163,824) ordinary shares were issued to employees as share based payments with a value of $680,092 (2018: $640,593) of which 1,020,000 (2018: 1,025,000) shares with a value of $510,000 (2018: $512,500) were issued upon exercise of employee Share Rights. A further 100,000 (2018: 106,628) ordinary shares were issued to Directors as share based payments with a value of $60,000 (2018: $67,390). During the financial year ended 31 December 2018, through a fully underwritten entitlement offer to eligible shareholders, 22,157,668 ordinary shares were issued for cash of $14,402,484.
24. Share based payments
2019 2018
$ $
Executive incentive plan 170,092 128,093
Amortisation of employee share rights 54,703 255,938
Remuneration for Non-Executive Directors 60,000 48,868
Total 284,795 432,899
For
per
sona
l use
onl
y
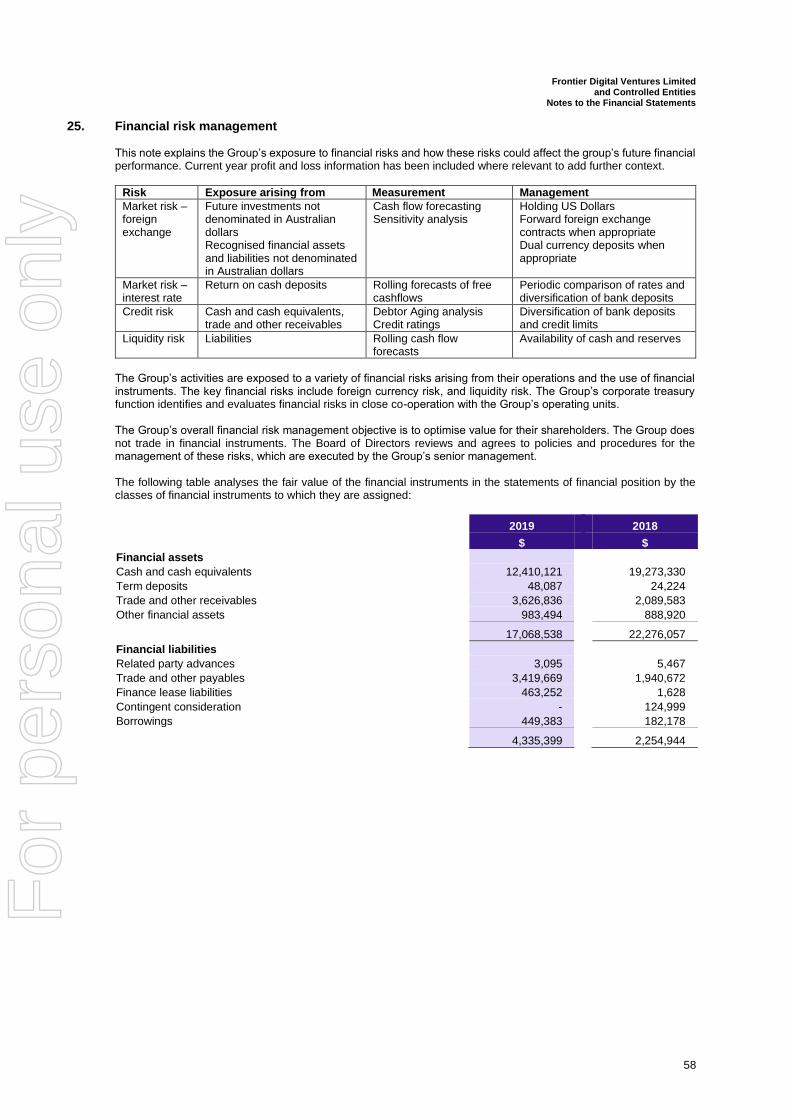
Frontier Digital Ventures Limited and Controlled Entities
Notes to the Financial Statements
58
25. Financial risk management This note explains the Group’s exposure to financial risks and how these risks could affect the group’s future financial performance. Current year profit and loss information has been included where relevant to add further context.
Risk Exposure arising from Measurement Management
Market risk – foreign exchange
Future investments not denominated in Australian dollars Recognised financial assets and liabilities not denominated in Australian dollars
Cash flow forecasting Sensitivity analysis
Holding US Dollars Forward foreign exchange contracts when appropriate Dual currency deposits when appropriate
Market risk – interest rate
Return on cash deposits Rolling forecasts of free cashflows
Periodic comparison of rates and diversification of bank deposits
Credit risk Cash and cash equivalents, trade and other receivables
Debtor Aging analysis Credit ratings
Diversification of bank deposits and credit limits
Liquidity risk Liabilities Rolling cash flow forecasts
Availability of cash and reserves
The Group’s activities are exposed to a variety of financial risks arising from their operations and the use of financial instruments. The key financial risks include foreign currency risk, and liquidity risk. The Group’s corporate treasury function identifies and evaluates financial risks in close co-operation with the Group’s operating units. The Group’s overall financial risk management objective is to optimise value for their shareholders. The Group does not trade in financial instruments. The Board of Directors reviews and agrees to policies and procedures for the management of these risks, which are executed by the Group’s senior management. The following table analyses the fair value of the financial instruments in the statements of financial position by the classes of financial instruments to which they are assigned:
2019 2018
$ $
Financial assets
Cash and cash equivalents 12,410,121 19,273,330
Term deposits 48,087 24,224
Trade and other receivables 3,626,836 2,089,583
Other financial assets 983,494 888,920
17,068,538 22,276,057
Financial liabilities
Related party advances 3,095 5,467
Trade and other payables 3,419,669 1,940,672
Finance lease liabilities 463,252 1,628
Contingent consideration - 124,999
Borrowings 449,383 182,178
4,335,399 2,254,944
For
per
sona
l use
onl
y
Frontier Digital Ventures Limited and Controlled Entities
Notes to the Financial Statements
59
25. Financial risk management (cont’d)
(a) Foreign currency risk Foreign currency risk is the risk of fluctuation in fair value or future cash flows of a financial instrument as a result of changes in foreign exchange rates. The Group’s exposure to the risk of changes in foreign exchange rates relates primarily to the Group’s net investments in foreign subsidiaries, which is predominantly denominated in United States Dollars (USD). The Group carries a significant exposure to movements in the currency exchange rates between the United States Dollar (USD) and the Australian Dollar (AUD). Most acquisitions are denominated in USD and USD is the functional currency of the intermediate holding company of the Group as well as a number of significant subsidiaries. There is no other material exposure to foreign currency risks within the financial assets and financial liabilities outside of each operating entity’s functional currency, and as such no foreign currency exposure arises. However, the translation of these foreign entities’ results from their respective non-Australian dollar functional currencies into the Australian dollar presentation currency of the Group represents a foreign currency reporting risk to the Group. A 5% movement in the average exchange rate of the USD over the course of the year would have impacted earnings by $183,439 (2018: $409,749) and a 5% movement in the spot rate of the USD would have impacted cash and cash equivalents reported at the year end by $317,345 (2018: $317,790). Management has set up a practise to monitor changes in foreign exchange rates on an ongoing basis. The Group also takes advantage of any natural effects of its foreign currencies revenues and expenses by maintaining current accounts in foreign currencies.
(b) Interest rate risk management The Group’s exposure to interest rate risk is limited to the movement in interest rate in terms of its cash held at bank. Interest rate sensitivity If interest rates had been 50 basis points higher/lower and all other variables were held constant, the Group’s profit for the year ended 31 December 2019 would increase/decrease by $72,129 (2018: $74,808). This is mainly attributable to the Group’s exposure to interest rates on its cash held at bank. The Group earned $428,144 in interest income (2018: $304,145) which is an average annual return of 1.91% (2018: 1.79%) on its average cash balance for the year.
(c) Credit risk management Credit risk refers to the risk that a counterparty will default on its contractual obligations resulting in financial loss to the Group. The Group adopted a policy of generally dealing with reputable counterparties as a means of mitigating the risk of financial loss from defaults. Trade receivables consist of a large number of customers and ongoing credit evaluation is performed on the accounts regularly. The Group does not have any significant credit risk exposure to any single counterparty or any group of counterparties. The carrying amount of financial assets recorded in the financial statements, net of any allowance for losses, represents the Group’s maximum exposure to credit risk. The Group measures the loss allowance for trade receivables at an amount equal to lifetime ECL. The expected credit losses on trade receivables are estimated using a provision matrix by reference to past default experience of the debtor and an analysis of the debtor’s current financial position. However, due to the short trading history of the Group, the information available on past default experience is limited. The expected credit losses on trade receivables is further adjusted for factors that are specific to the debtors, general economic conditions of the industry in which the debtors operate and an assessment of both the current as well as the forecast direction of conditions at the reporting date. There has been no change in the estimation techniques or significant assumptions made during the current reporting period.
For
per
sona
l use
onl
y
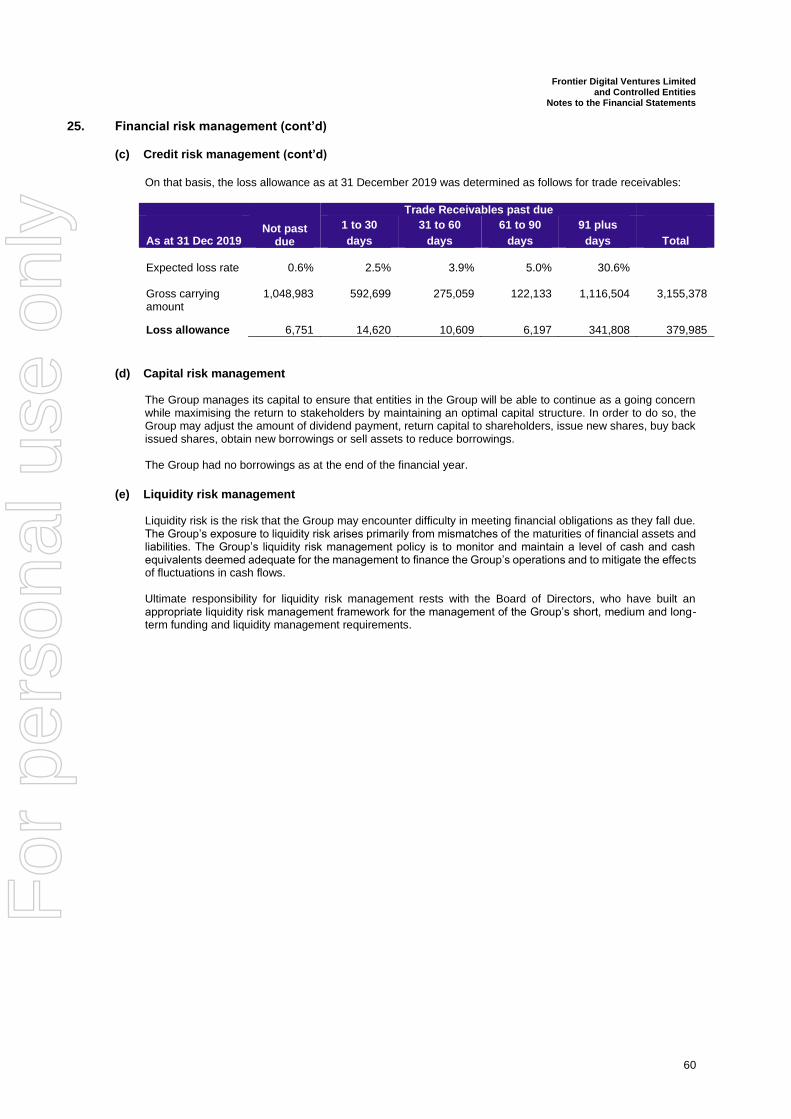
Frontier Digital Ventures Limited and Controlled Entities
Notes to the Financial Statements
60
25. Financial risk management (cont’d) (c) Credit risk management (cont’d)
On that basis, the loss allowance as at 31 December 2019 was determined as follows for trade receivables:
Not past due
Trade Receivables past due
As at 31 Dec 2019
1 to 30
days
31 to 60
days
61 to 90
days
91 plus
days Total
Expected loss rate 0.6% 2.5% 3.9% 5.0% 30.6% Gross carrying amount
1,048,983 592,699 275,059 122,133 1,116,504 3,155,378
Loss allowance 6,751 14,620 10,609 6,197 341,808 379,985
(d) Capital risk management The Group manages its capital to ensure that entities in the Group will be able to continue as a going concern while maximising the return to stakeholders by maintaining an optimal capital structure. In order to do so, the Group may adjust the amount of dividend payment, return capital to shareholders, issue new shares, buy back issued shares, obtain new borrowings or sell assets to reduce borrowings. The Group had no borrowings as at the end of the financial year.
(e) Liquidity risk management Liquidity risk is the risk that the Group may encounter difficulty in meeting financial obligations as they fall due. The Group’s exposure to liquidity risk arises primarily from mismatches of the maturities of financial assets and liabilities. The Group’s liquidity risk management policy is to monitor and maintain a level of cash and cash equivalents deemed adequate for the management to finance the Group’s operations and to mitigate the effects of fluctuations in cash flows. Ultimate responsibility for liquidity risk management rests with the Board of Directors, who have built an appropriate liquidity risk management framework for the management of the Group’s short, medium and long-term funding and liquidity management requirements.
For
per
sona
l use
onl
y
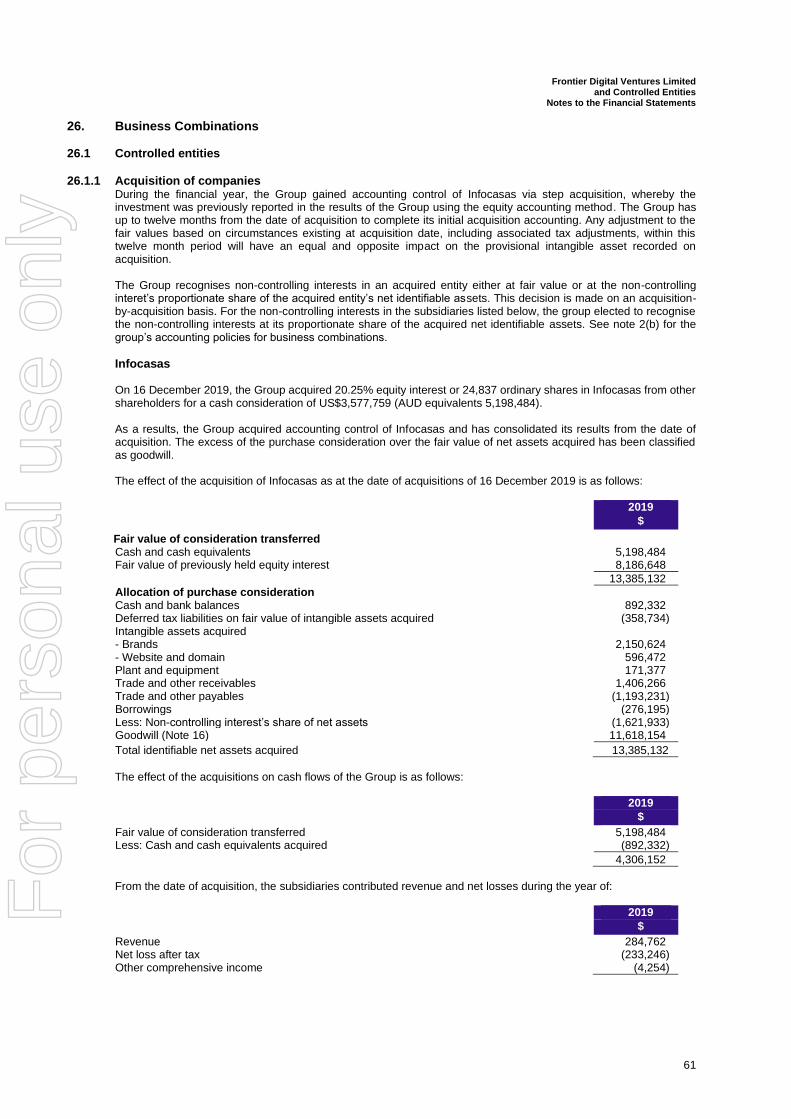
Frontier Digital Ventures Limited and Controlled Entities
Notes to the Financial Statements
61
26. Business Combinations
26.1 Controlled entities
26.1.1 Acquisition of companies During the financial year, the Group gained accounting control of Infocasas via step acquisition, whereby the investment was previously reported in the results of the Group using the equity accounting method. The Group has up to twelve months from the date of acquisition to complete its initial acquisition accounting. Any adjustment to the fair values based on circumstances existing at acquisition date, including associated tax adjustments, within this twelve month period will have an equal and opposite impact on the provisional intangible asset recorded on acquisition. The Group recognises non-controlling interests in an acquired entity either at fair value or at the non-controlling interet’s proportionate share of the acquired entity’s net identifiable assets. This decision is made on an acquisition-by-acquisition basis. For the non-controlling interests in the subsidiaries listed below, the group elected to recognise the non-controlling interests at its proportionate share of the acquired net identifiable assets. See note 2(b) for the group’s accounting policies for business combinations.
Infocasas On 16 December 2019, the Group acquired 20.25% equity interest or 24,837 ordinary shares in Infocasas from other shareholders for a cash consideration of US$3,577,759 (AUD equivalents 5,198,484). As a results, the Group acquired accounting control of Infocasas and has consolidated its results from the date of acquisition. The excess of the purchase consideration over the fair value of net assets acquired has been classified as goodwill. The effect of the acquisition of Infocasas as at the date of acquisitions of 16 December 2019 is as follows:
2019
$
Fair value of consideration transferred
Cash and cash equivalents 5,198,484 Fair value of previously held equity interest 8,186,648
13,385,132
Allocation of purchase consideration Cash and bank balances 892,332 Deferred tax liabilities on fair value of intangible assets acquired (358,734) Intangible assets acquired - Brands 2,150,624 - Website and domain 596,472 Plant and equipment 171,377 Trade and other receivables 1,406,266 Trade and other payables (1,193,231) Borrowings (276,195) Less: Non-controlling interest’s share of net assets (1,621,933) Goodwill (Note 16) 11,618,154
Total identifiable net assets acquired 13,385,132
The effect of the acquisitions on cash flows of the Group is as follows:
2019
$
Fair value of consideration transferred 5,198,484 Less: Cash and cash equivalents acquired (892,332)
4,306,152
From the date of acquisition, the subsidiaries contributed revenue and net losses during the year of:
2019
$
Revenue 284,762 Net loss after tax (233,246) Other comprehensive income (4,254)
For
per
sona
l use
onl
y
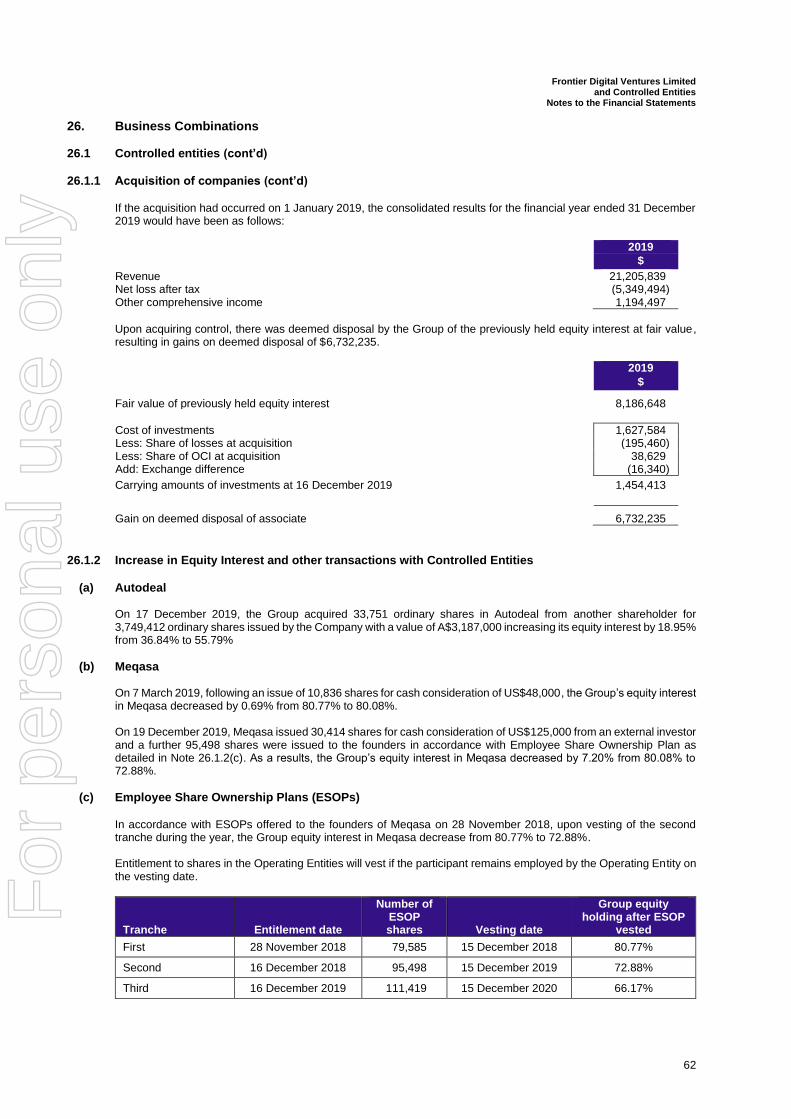
Frontier Digital Ventures Limited and Controlled Entities
Notes to the Financial Statements
62
26. Business Combinations
26.1 Controlled entities (cont’d)
26.1.1 Acquisition of companies (cont’d) If the acquisition had occurred on 1 January 2019, the consolidated results for the financial year ended 31 December 2019 would have been as follows:
2019
$
Revenue 21,205,839 Net loss after tax (5,349,494) Other comprehensive income 1,194,497
Upon acquiring control, there was deemed disposal by the Group of the previously held equity interest at fair value, resulting in gains on deemed disposal of $6,732,235.
2019
$
Fair value of previously held equity interest 8,186,648
Cost of investments 1,627,584 Less: Share of losses at acquisition (195,460) Less: Share of OCI at acquisition 38,629 Add: Exchange difference (16,340)
Carrying amounts of investments at 16 December 2019 1,454,413
Gain on deemed disposal of associate 6,732,235
26.1.2 Increase in Equity Interest and other transactions with Controlled Entities
(a) Autodeal On 17 December 2019, the Group acquired 33,751 ordinary shares in Autodeal from another shareholder for 3,749,412 ordinary shares issued by the Company with a value of A$3,187,000 increasing its equity interest by 18.95% from 36.84% to 55.79%
(b) Meqasa On 7 March 2019, following an issue of 10,836 shares for cash consideration of US$48,000, the Group’s equity interest in Meqasa decreased by 0.69% from 80.77% to 80.08%. On 19 December 2019, Meqasa issued 30,414 shares for cash consideration of US$125,000 from an external investor and a further 95,498 shares were issued to the founders in accordance with Employee Share Ownership Plan as detailed in Note 26.1.2(c). As a results, the Group’s equity interest in Meqasa decreased by 7.20% from 80.08% to 72.88%.
(c) Employee Share Ownership Plans (ESOPs) In accordance with ESOPs offered to the founders of Meqasa on 28 November 2018, upon vesting of the second tranche during the year, the Group equity interest in Meqasa decrease from 80.77% to 72.88%. Entitlement to shares in the Operating Entities will vest if the participant remains employed by the Operating Entity on the vesting date.
Tranche Entitlement date
Number of ESOP shares Vesting date
Group equity holding after ESOP
vested
First 28 November 2018 79,585 15 December 2018 80.77%
Second 16 December 2018 95,498 15 December 2019 72.88%
Third 16 December 2019 111,419 15 December 2020 66.17%
For
per
sona
l use
onl
y
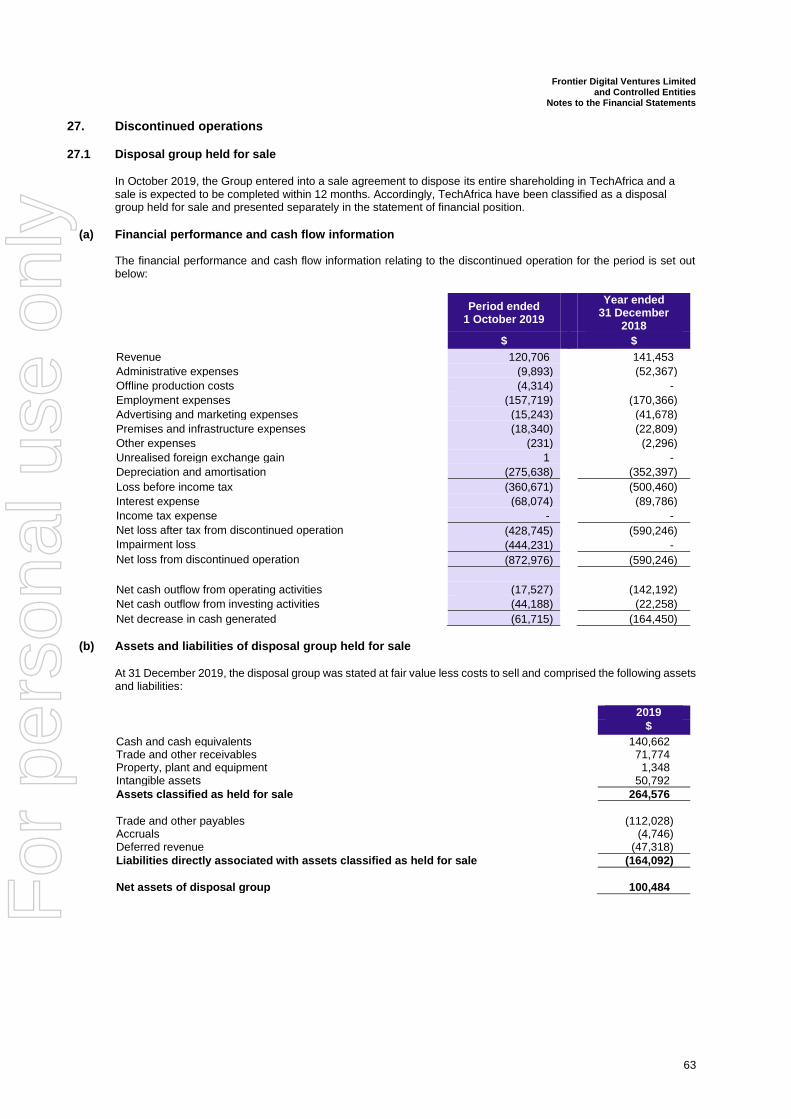
Frontier Digital Ventures Limited and Controlled Entities
Notes to the Financial Statements
63
27. Discontinued operations
27.1 Disposal group held for sale
In October 2019, the Group entered into a sale agreement to dispose its entire shareholding in TechAfrica and a sale is expected to be completed within 12 months. Accordingly, TechAfrica have been classified as a disposal group held for sale and presented separately in the statement of financial position.
(a) Financial performance and cash flow information
The financial performance and cash flow information relating to the discontinued operation for the period is set out below:
Period ended
1 October 2019
Year ended 31 December
2018
$ $
Revenue 120,706 141,453
Administrative expenses (9,893) (52,367)
Offline production costs (4,314) -
Employment expenses (157,719) (170,366)
Advertising and marketing expenses (15,243) (41,678)
Premises and infrastructure expenses (18,340) (22,809)
Other expenses (231) (2,296)
Unrealised foreign exchange gain 1 -
Depreciation and amortisation (275,638) (352,397)
Loss before income tax (360,671) (500,460)
Interest expense (68,074) (89,786)
Income tax expense - -
Net loss after tax from discontinued operation (428,745) (590,246)
Impairment loss (444,231) -
Net loss from discontinued operation (872,976) (590,246)
Net cash outflow from operating activities (17,527) (142,192)
Net cash outflow from investing activities (44,188) (22,258)
Net decrease in cash generated (61,715) (164,450)
(b) Assets and liabilities of disposal group held for sale At 31 December 2019, the disposal group was stated at fair value less costs to sell and comprised the following assets and liabilities:
2019
$
Cash and cash equivalents 140,662 Trade and other receivables 71,774 Property, plant and equipment 1,348 Intangible assets 50,792
Assets classified as held for sale 264,576
Trade and other payables (112,028) Accruals (4,746) Deferred revenue (47,318)
Liabilities directly associated with assets classified as held for sale (164,092)
Net assets of disposal group 100,484
For
per
sona
l use
onl
y
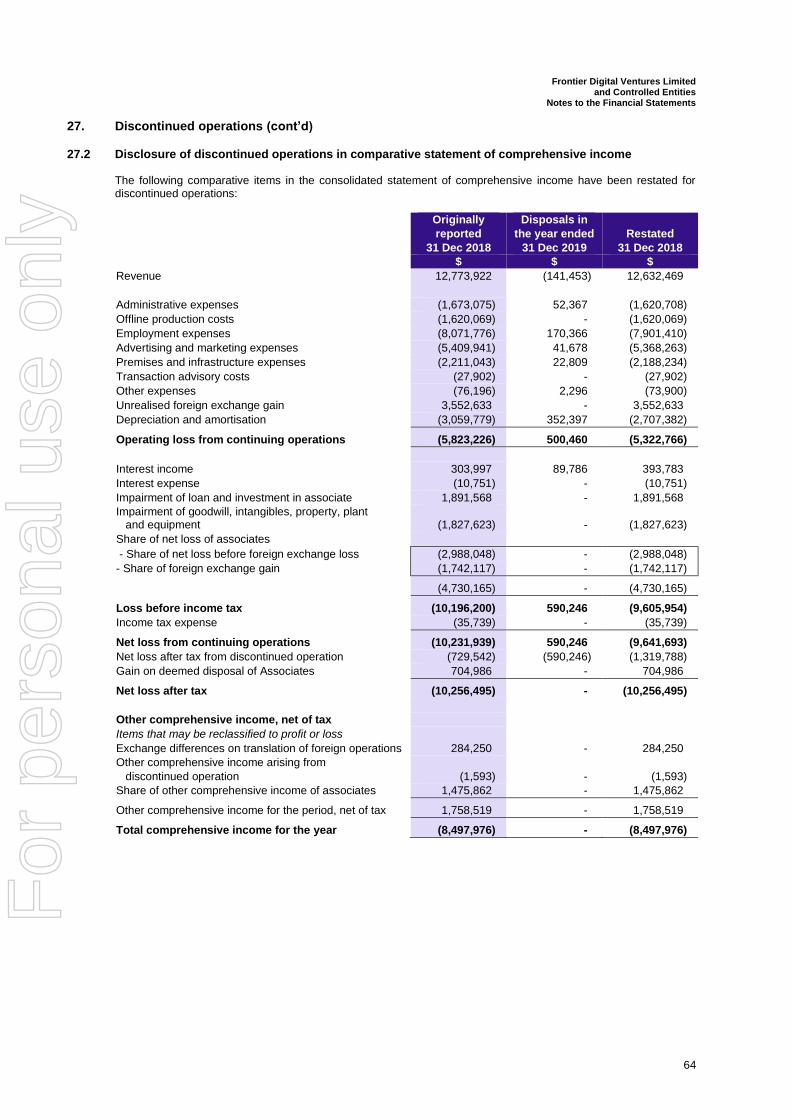
Frontier Digital Ventures Limited and Controlled Entities
Notes to the Financial Statements
64
27. Discontinued operations (cont’d) 27.2 Disclosure of discontinued operations in comparative statement of comprehensive income
The following comparative items in the consolidated statement of comprehensive income have been restated for discontinued operations:
Originally
reported
31 Dec 2018
Disposals in
the year ended
31 Dec 2019
Restated
31 Dec 2018 $ $ $
Revenue 12,773,922 (141,453) 12,632,469
Administrative expenses (1,673,075) 52,367 (1,620,708)
Offline production costs (1,620,069) - (1,620,069)
Employment expenses (8,071,776) 170,366 (7,901,410)
Advertising and marketing expenses (5,409,941) 41,678 (5,368,263)
Premises and infrastructure expenses (2,211,043) 22,809 (2,188,234)
Transaction advisory costs (27,902) - (27,902)
Other expenses (76,196) 2,296 (73,900)
Unrealised foreign exchange gain 3,552,633 - 3,552,633
Depreciation and amortisation (3,059,779) 352,397 (2,707,382)
Operating loss from continuing operations (5,823,226) 500,460 (5,322,766)
Interest income 303,997 89,786 393,783
Interest expense (10,751) - (10,751)
Impairment of loan and investment in associate 1,891,568 - 1,891,568
Impairment of goodwill, intangibles, property, plant and equipment (1,827,623) - (1,827,623)
Share of net loss of associates
- Share of net loss before foreign exchange loss (2,988,048) - (2,988,048)
- Share of foreign exchange gain (1,742,117) - (1,742,117)
(4,730,165) - (4,730,165)
Loss before income tax (10,196,200) 590,246 (9,605,954)
Income tax expense (35,739) - (35,739)
Net loss from continuing operations (10,231,939) 590,246 (9,641,693)
Net loss after tax from discontinued operation (729,542) (590,246) (1,319,788)
Gain on deemed disposal of Associates 704,986 - 704,986
Net loss after tax (10,256,495) - (10,256,495)
Other comprehensive income, net of tax
Items that may be reclassified to profit or loss
Exchange differences on translation of foreign operations 284,250 - 284,250
Other comprehensive income arising from
discontinued operation (1,593) - (1,593)
Share of other comprehensive income of associates 1,475,862 - 1,475,862
Other comprehensive income for the period, net of tax 1,758,519 - 1,758,519
Total comprehensive income for the year (8,497,976) - (8,497,976)
For
per
sona
l use
onl
y
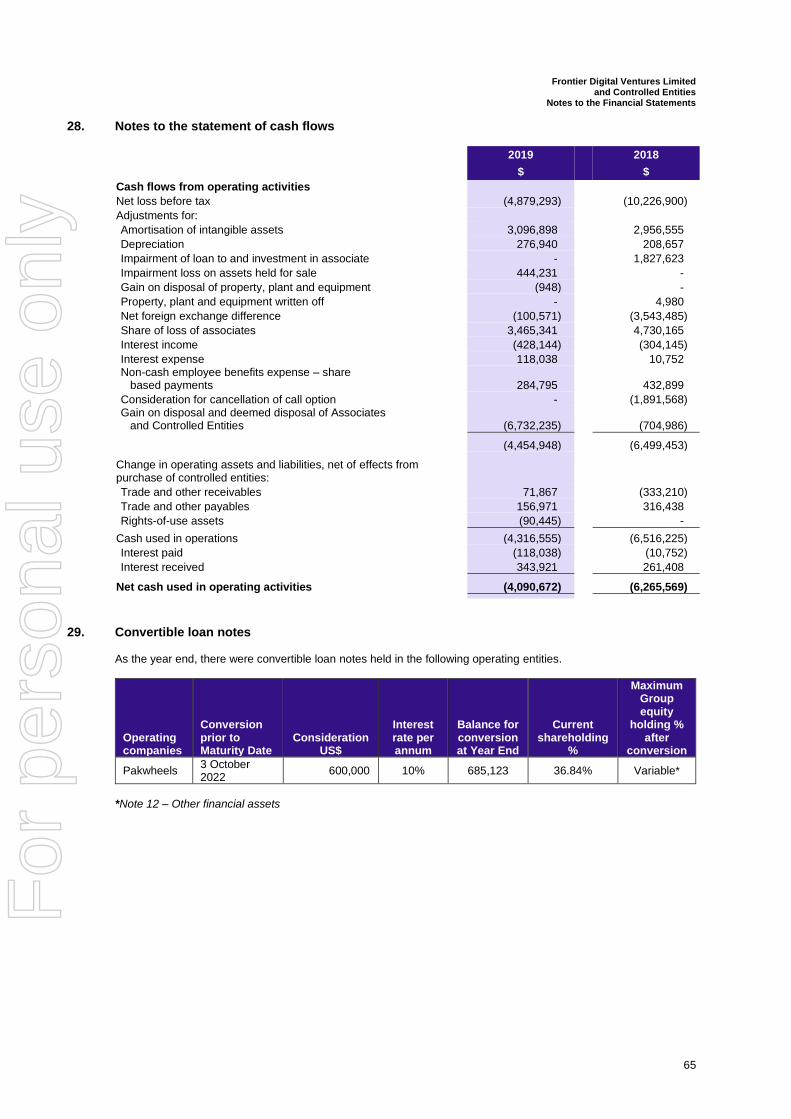
Frontier Digital Ventures Limited and Controlled Entities
Notes to the Financial Statements
65
28. Notes to the statement of cash flows
2019 2018
$ $
Cash flows from operating activities
Net loss before tax (4,879,293) (10,226,900)
Adjustments for:
Amortisation of intangible assets 3,096,898 2,956,555
Depreciation 276,940 208,657
Impairment of loan to and investment in associate - 1,827,623
Impairment loss on assets held for sale 444,231 -
Gain on disposal of property, plant and equipment (948) -
Property, plant and equipment written off - 4,980
Net foreign exchange difference (100,571) (3,543,485)
Share of loss of associates 3,465,341 4,730,165
Interest income (428,144) (304,145)
Interest expense 118,038 10,752 Non-cash employee benefits expense – share based payments 284,795 432,899
Consideration for cancellation of call option - (1,891,568) Gain on disposal and deemed disposal of Associates and Controlled Entities (6,732,235) (704,986)
(4,454,948) (6,499,453)
Change in operating assets and liabilities, net of effects from purchase of controlled entities:
Trade and other receivables 71,867 (333,210)
Trade and other payables 156,971 316,438
Rights-of-use assets (90,445) -
Cash used in operations (4,316,555) (6,516,225)
Interest paid (118,038) (10,752)
Interest received 343,921 261,408
Net cash used in operating activities (4,090,672) (6,265,569)
29. Convertible loan notes As the year end, there were convertible loan notes held in the following operating entities.
Operating companies
Conversion prior to Maturity Date
Consideration US$
Interest rate per annum
Balance for conversion at Year End
Current shareholding
%
Maximum Group equity
holding % after
conversion
Pakwheels 3 October 2022
600,000 10% 685,123 36.84% Variable*
*Note 12 – Other financial assets
For
per
sona
l use
onl
y
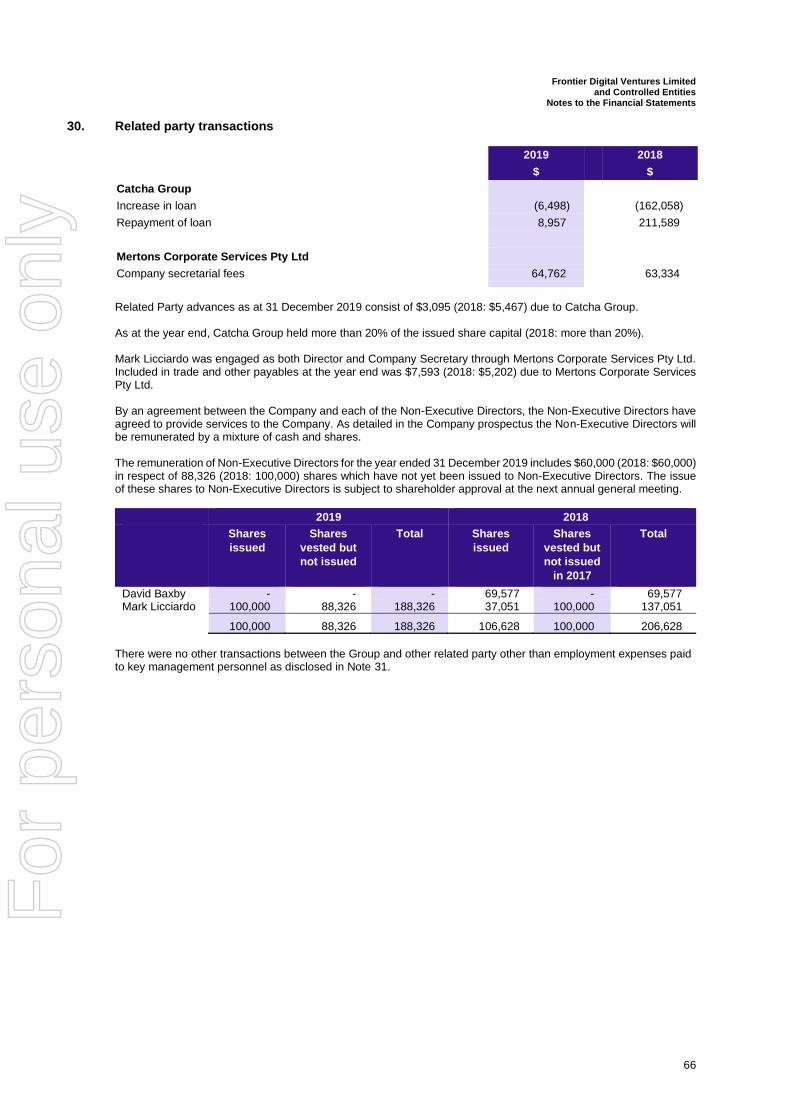
Frontier Digital Ventures Limited and Controlled Entities
Notes to the Financial Statements
66
30. Related party transactions
2019 2018
$ $
Catcha Group
Increase in loan (6,498) (162,058)
Repayment of loan 8,957 211,589
Mertons Corporate Services Pty Ltd
Company secretarial fees 64,762 63,334
Related Party advances as at 31 December 2019 consist of $3,095 (2018: $5,467) due to Catcha Group. As at the year end, Catcha Group held more than 20% of the issued share capital (2018: more than 20%). Mark Licciardo was engaged as both Director and Company Secretary through Mertons Corporate Services Pty Ltd. Included in trade and other payables at the year end was $7,593 (2018: $5,202) due to Mertons Corporate Services Pty Ltd. By an agreement between the Company and each of the Non-Executive Directors, the Non-Executive Directors have agreed to provide services to the Company. As detailed in the Company prospectus the Non-Executive Directors will be remunerated by a mixture of cash and shares. The remuneration of Non-Executive Directors for the year ended 31 December 2019 includes $60,000 (2018: $60,000) in respect of 88,326 (2018: 100,000) shares which have not yet been issued to Non-Executive Directors. The issue of these shares to Non-Executive Directors is subject to shareholder approval at the next annual general meeting.
2019 2018
Shares
issued
Shares
vested but
not issued
Total Shares
issued
Shares
vested but
not issued
in 2017
Total
David Baxby - - - 69,577 - 69,577 Mark Licciardo 100,000 88,326 188,326 37,051 100,000 137,051
100,000 88,326 188,326 106,628 100,000 206,628
There were no other transactions between the Group and other related party other than employment expenses paid to key management personnel as disclosed in Note 31.
For
per
sona
l use
onl
y
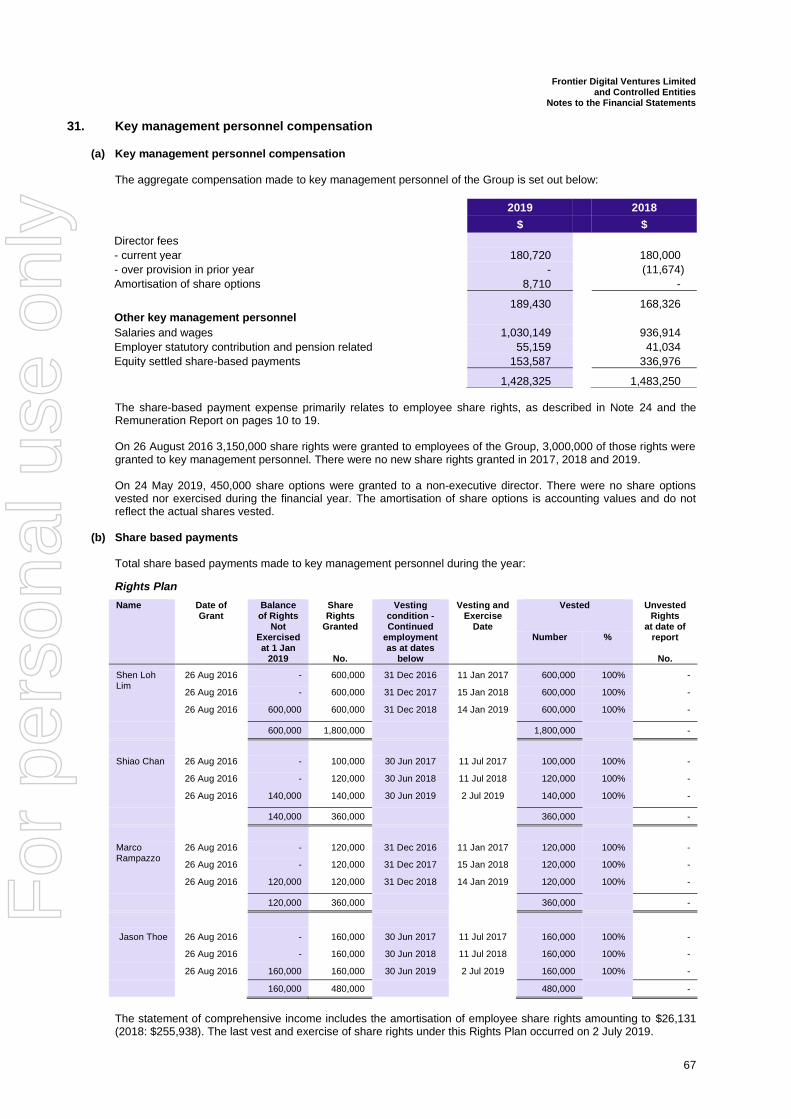
Frontier Digital Ventures Limited and Controlled Entities
Notes to the Financial Statements
67
31. Key management personnel compensation
(a) Key management personnel compensation The aggregate compensation made to key management personnel of the Group is set out below:
2019 2018
$ $
Director fees
- current year 180,720 180,000
- over provision in prior year - (11,674)
Amortisation of share options 8,710 -
189,430 168,326
Other key management personnel
Salaries and wages 1,030,149 936,914
Employer statutory contribution and pension related 55,159 41,034
Equity settled share-based payments 153,587 336,976
1,428,325 1,483,250 The share-based payment expense primarily relates to employee share rights, as described in Note 24 and the Remuneration Report on pages 10 to 19. On 26 August 2016 3,150,000 share rights were granted to employees of the Group, 3,000,000 of those rights were granted to key management personnel. There were no new share rights granted in 2017, 2018 and 2019. On 24 May 2019, 450,000 share options were granted to a non-executive director. There were no share options vested nor exercised during the financial year. The amortisation of share options is accounting values and do not reflect the actual shares vested.
(b) Share based payments Total share based payments made to key management personnel during the year:
Rights Plan
Name Date of Grant
Balance of Rights
Not Exercised at 1 Jan
2019
Share Rights
Granted
No.
Vesting condition - Continued
employment as at dates
below
Vesting and Exercise
Date
Vested Unvested Rights
at date of report
No.
Number %
Shen Loh Lim
26 Aug 2016 - 600,000 31 Dec 2016 11 Jan 2017 600,000 100% -
26 Aug 2016 - 600,000 31 Dec 2017 15 Jan 2018 600,000 100% -
26 Aug 2016 600,000 600,000 31 Dec 2018 14 Jan 2019 600,000 100% -
600,000 1,800,000 1,800,000 -
Shiao Chan 26 Aug 2016 - 100,000 30 Jun 2017 11 Jul 2017 100,000 100% -
26 Aug 2016 - 120,000 30 Jun 2018 11 Jul 2018 120,000 100% -
26 Aug 2016 140,000 140,000 30 Jun 2019 2 Jul 2019 140,000 100% -
140,000 360,000 360,000 -
Marco Rampazzo
26 Aug 2016 - 120,000 31 Dec 2016 11 Jan 2017 120,000 100% -
26 Aug 2016 - 120,000 31 Dec 2017 15 Jan 2018 120,000 100% -
26 Aug 2016 120,000 120,000 31 Dec 2018 14 Jan 2019 120,000 100% -
120,000 360,000 360,000 -
Jason Thoe 26 Aug 2016 - 160,000 30 Jun 2017 11 Jul 2017 160,000 100% -
26 Aug 2016 - 160,000 30 Jun 2018 11 Jul 2018 160,000 100% -
26 Aug 2016 160,000 160,000 30 Jun 2019 2 Jul 2019 160,000 100% -
160,000 480,000 480,000 -
The statement of comprehensive income includes the amortisation of employee share rights amounting to $26,131 (2018: $255,938). The last vest and exercise of share rights under this Rights Plan occurred on 2 July 2019.
For
per
sona
l use
onl
y
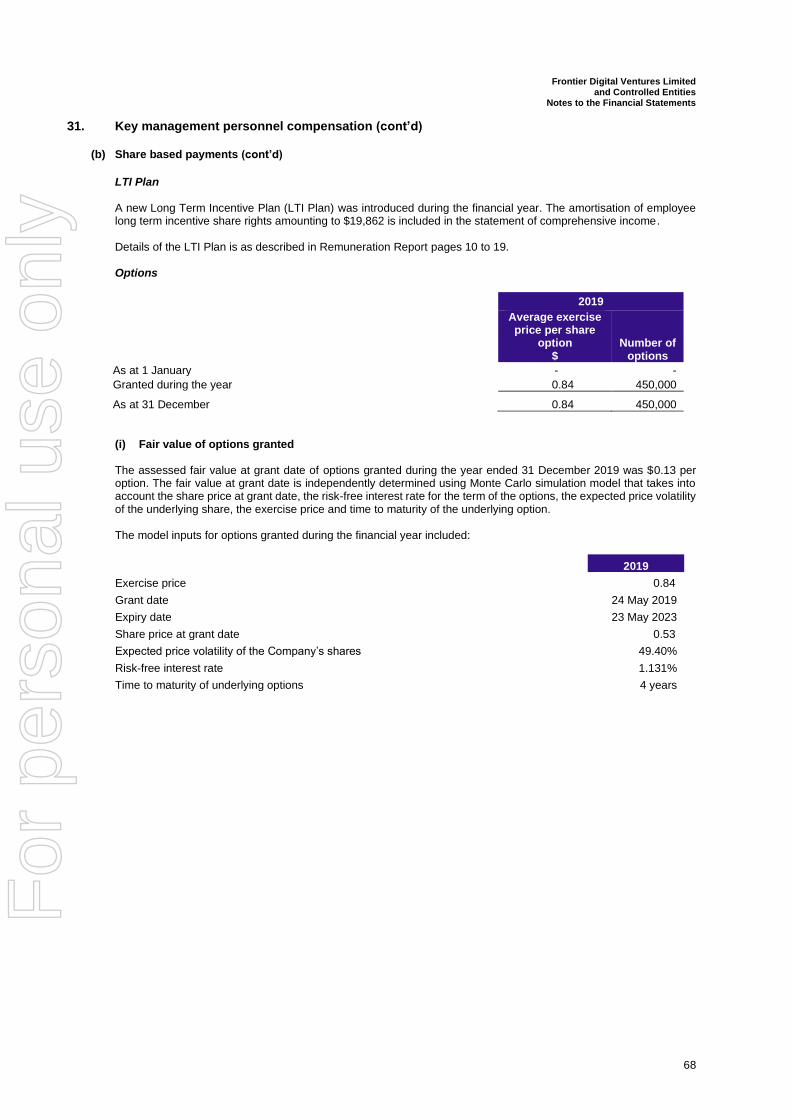
Frontier Digital Ventures Limited and Controlled Entities
Notes to the Financial Statements
68
31. Key management personnel compensation (cont’d)
(b) Share based payments (cont’d)
LTI Plan A new Long Term Incentive Plan (LTI Plan) was introduced during the financial year. The amortisation of employee long term incentive share rights amounting to $19,862 is included in the statement of comprehensive income. Details of the LTI Plan is as described in Remuneration Report pages 10 to 19. Options
2019
Average exercise price per share
option $
Number of options
As at 1 January - -
Granted during the year 0.84 450,000
As at 31 December 0.84 450,000
(i) Fair value of options granted The assessed fair value at grant date of options granted during the year ended 31 December 2019 was $0.13 per option. The fair value at grant date is independently determined using Monte Carlo simulation model that takes into account the share price at grant date, the risk-free interest rate for the term of the options, the expected price volatility of the underlying share, the exercise price and time to maturity of the underlying option. The model inputs for options granted during the financial year included:
2019
Exercise price 0.84
Grant date 24 May 2019
Expiry date 23 May 2023
Share price at grant date 0.53
Expected price volatility of the Company’s shares 49.40%
Risk-free interest rate 1.131%
Time to maturity of underlying options 4 years
For
per
sona
l use
onl
y
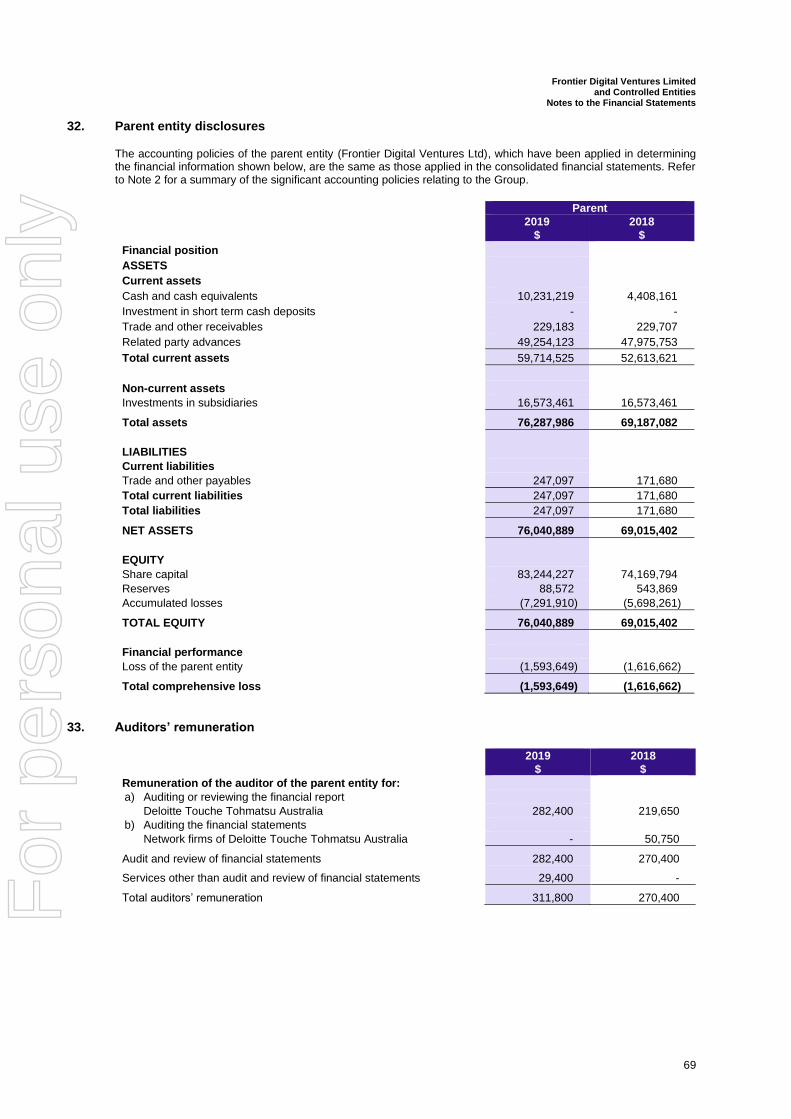
Frontier Digital Ventures Limited and Controlled Entities
Notes to the Financial Statements
69
32. Parent entity disclosures The accounting policies of the parent entity (Frontier Digital Ventures Ltd), which have been applied in determining the financial information shown below, are the same as those applied in the consolidated financial statements. Refer to Note 2 for a summary of the significant accounting policies relating to the Group.
Parent
2019
$
2018
$
Financial position
ASSETS
Current assets
Cash and cash equivalents 10,231,219 4,408,161
Investment in short term cash deposits - -
Trade and other receivables 229,183 229,707
Related party advances 49,254,123 47,975,753
Total current assets 59,714,525 52,613,621
Non-current assets
Investments in subsidiaries 16,573,461 16,573,461
Total assets 76,287,986 69,187,082
LIABILITIES
Current liabilities
Trade and other payables 247,097 171,680
Total current liabilities 247,097 171,680
Total liabilities 247,097 171,680
NET ASSETS 76,040,889 69,015,402
EQUITY
Share capital 83,244,227 74,169,794
Reserves 88,572 543,869
Accumulated losses (7,291,910) (5,698,261)
TOTAL EQUITY 76,040,889 69,015,402
Financial performance
Loss of the parent entity (1,593,649) (1,616,662)
Total comprehensive loss (1,593,649) (1,616,662)
33. Auditors’ remuneration
2019
$
2018
$
Remuneration of the auditor of the parent entity for:
a) Auditing or reviewing the financial report
Deloitte Touche Tohmatsu Australia 282,400 219,650
b) Auditing the financial statements
Network firms of Deloitte Touche Tohmatsu Australia - 50,750
Audit and review of financial statements 282,400 270,400
Services other than audit and review of financial statements 29,400 -
Total auditors’ remuneration 311,800 270,400
For
per
sona
l use
onl
y
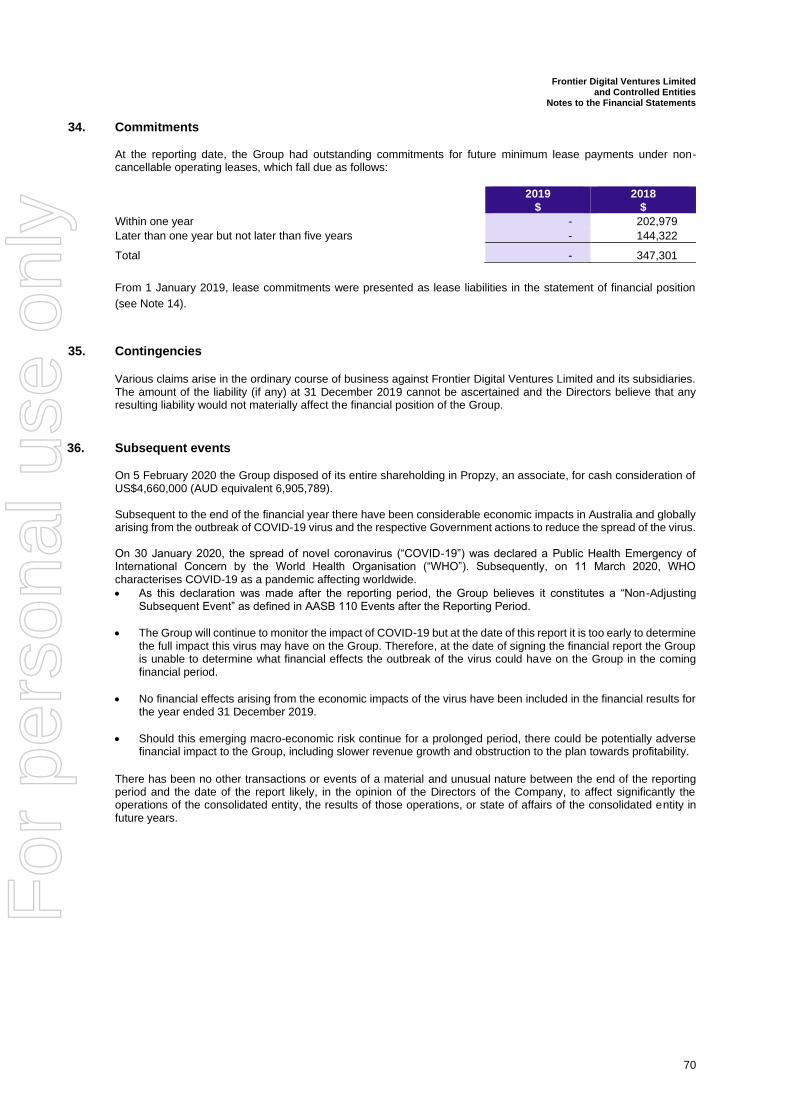
Frontier Digital Ventures Limited and Controlled Entities
Notes to the Financial Statements
70
34. Commitments At the reporting date, the Group had outstanding commitments for future minimum lease payments under non- cancellable operating leases, which fall due as follows:
2019
$
2018
$
Within one year - 202,979
Later than one year but not later than five years - 144,322
Total - 347,301
From 1 January 2019, lease commitments were presented as lease liabilities in the statement of financial position
(see Note 14).
35. Contingencies Various claims arise in the ordinary course of business against Frontier Digital Ventures Limited and its subsidiaries. The amount of the liability (if any) at 31 December 2019 cannot be ascertained and the Directors believe that any resulting liability would not materially affect the financial position of the Group.
36. Subsequent events On 5 February 2020 the Group disposed of its entire shareholding in Propzy, an associate, for cash consideration of US$4,660,000 (AUD equivalent 6,905,789). Subsequent to the end of the financial year there have been considerable economic impacts in Australia and globally arising from the outbreak of COVID-19 virus and the respective Government actions to reduce the spread of the virus. On 30 January 2020, the spread of novel coronavirus (“COVID-19”) was declared a Public Health Emergency of International Concern by the World Health Organisation (“WHO”). Subsequently, on 11 March 2020, WHO characterises COVID-19 as a pandemic affecting worldwide.
• As this declaration was made after the reporting period, the Group believes it constitutes a “Non-Adjusting Subsequent Event” as defined in AASB 110 Events after the Reporting Period.
• The Group will continue to monitor the impact of COVID-19 but at the date of this report it is too early to determine the full impact this virus may have on the Group. Therefore, at the date of signing the financial report the Group is unable to determine what financial effects the outbreak of the virus could have on the Group in the coming financial period.
• No financial effects arising from the economic impacts of the virus have been included in the financial results for the year ended 31 December 2019.
• Should this emerging macro-economic risk continue for a prolonged period, there could be potentially adverse financial impact to the Group, including slower revenue growth and obstruction to the plan towards profitability.
There has been no other transactions or events of a material and unusual nature between the end of the reporting period and the date of the report likely, in the opinion of the Directors of the Company, to affect significantly the operations of the consolidated entity, the results of those operations, or state of affairs of the consolidated entity in future years.
For
per
sona
l use
onl
y
Frontier Digital Ventures Limited and Controlled
Directors' Declaration
71
DIRECTORS’ DECLARATION
In accordance with a resolution of the Directors of Frontier Digital Ventures Limited, the Directors declare that: 1. In the opinion of the Directors:
(a) The financial statements and notes of Frontier Digital Ventures Limited for the financial year ended 31 December 2019: (i) Give a true and fair view of the financial position and performance of the Group (ii) Comply with Australian Accounting Standards and the Corporations Regulations 2001
(b) The financial statements and notes also comply with International Financial Reporting Standards as disclosed in Note 2
(c) There are reasonable grounds to believe that the Company will be able to pay its debts as and when they
become due and payable.
2. This declaration has been made after receiving the declarations required to be made to the Directors in accordance with section 295A of the Corporations Act 2001 for the financial year ended 31 December 2019.
On behalf of the Board, Dated 25 March 2020 ................................................
Anthony Klok
Chairman
For
per
sona
l use
onl
y
Liability limited by a scheme approved under Professional Standards Legislation Member of Deloitte Asia Pacific Limited and the Deloitte Network
72
Deloitte Touche Tohmatsu ABN 74 490 121 060 550 Bourke Street Melbourne VIC 3000 GPO Box 78 Melbourne VIC 3001 Australia DX: 111 Tel: +61 (0) 3 9671 7000 Fax: +61 (0) 9671 7001 www.deloitte.com.au
Independent Auditor’s Report to the Members of Frontier Digital Ventures Limited
Report on the Audit of the Financial Report Opinion We have audited the financial report of Frontier Digital Ventures Limited (the “Company”) and its subsidiaries (the “Group”) which comprises the consolidated statement of financial position as at 31 December 2019, the consolidated statement of comprehensive income, the consolidated statement of changes in equity and the consolidated statement of cash flows for the year then ended, and notes to the financial statements, including a summary of significant accounting policies and other explanatory information, and the directors’ declaration. In our opinion, the accompanying financial report of the Group is in accordance with the Corporations Act 2001, including: (i) giving a true and fair view of the Group’s financial position as at 31 December 2019 and of
its financial performance for the year then ended; and (ii) complying with Australian Accounting Standards and the Corporations Regulations 2001. Basis for Opinion We conducted our audit in accordance with Australian Auditing Standards. Our responsibilities under those standards are further described in the Auditor’s Responsibilities for the Audit of the Financial Report section of our report. We are independent of the Group in accordance with the auditor independence requirements of the Corporations Act 2001 and the ethical requirements of the Accounting Professional and Ethical Standards Board’s APES 110 Code of Ethics for Professional Accountants (the Code) that are relevant to our audit of the financial report in Australia. We have also fulfilled our other ethical responsibilities in accordance with the Code. We confirm that the independence declaration required by the Corporations Act 2001, which has been given to the directors of the Company, would be in the same terms if given to the directors as at the time of this auditor’s report. We believe that the audit evidence we have obtained is sufficient and appropriate to provide a basis for our opinion.
For
per
sona
l use
onl
y
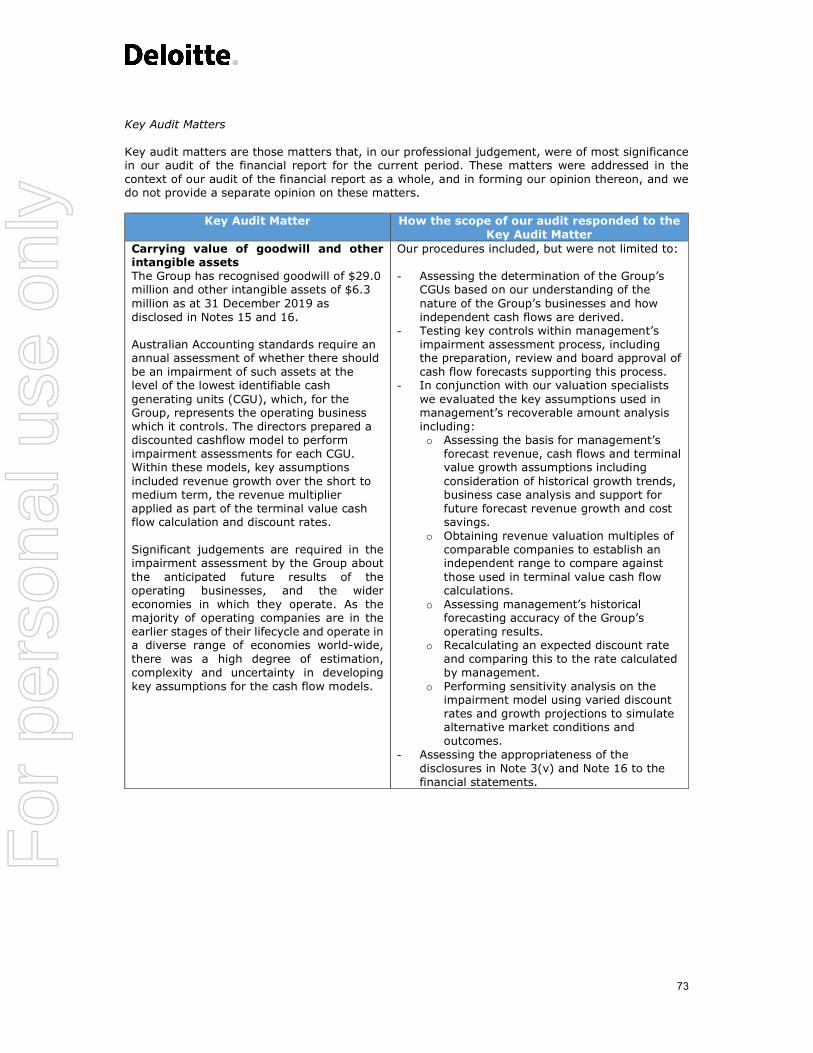
73
Key Audit Matters Key audit matters are those matters that, in our professional judgement, were of most significance in our audit of the financial report for the current period. These matters were addressed in the context of our audit of the financial report as a whole, and in forming our opinion thereon, and we do not provide a separate opinion on these matters.
Key Audit Matter How the scope of our audit responded to the Key Audit Matter
Carrying value of goodwill and other intangible assets The Group has recognised goodwill of $29.0 million and other intangible assets of $6.3 million as at 31 December 2019 as disclosed in Notes 15 and 16. Australian Accounting standards require an annual assessment of whether there should be an impairment of such assets at the level of the lowest identifiable cash generating units (CGU), which, for the Group, represents the operating business which it controls. The directors prepared a discounted cashflow model to perform impairment assessments for each CGU. Within these models, key assumptions included revenue growth over the short to medium term, the revenue multiplier applied as part of the terminal value cash flow calculation and discount rates. Significant judgements are required in the impairment assessment by the Group about the anticipated future results of the operating businesses, and the wider economies in which they operate. As the majority of operating companies are in the earlier stages of their lifecycle and operate in a diverse range of economies world-wide, there was a high degree of estimation, complexity and uncertainty in developing key assumptions for the cash flow models.
Our procedures included, but were not limited to: - Assessing the determination of the Group’s
CGUs based on our understanding of the nature of the Group’s businesses and how independent cash flows are derived.
- Testing key controls within management’s impairment assessment process, including the preparation, review and board approval of cash flow forecasts supporting this process.
- In conjunction with our valuation specialists we evaluated the key assumptions used in management’s recoverable amount analysis including: o Assessing the basis for management’s
forecast revenue, cash flows and terminal value growth assumptions including consideration of historical growth trends, business case analysis and support for future forecast revenue growth and cost savings.
o Obtaining revenue valuation multiples of comparable companies to establish an independent range to compare against those used in terminal value cash flow calculations.
o Assessing management’s historical forecasting accuracy of the Group’s operating results.
o Recalculating an expected discount rate and comparing this to the rate calculated by management.
o Performing sensitivity analysis on the impairment model using varied discount rates and growth projections to simulate alternative market conditions and outcomes.
- Assessing the appropriateness of the disclosures in Note 3(v) and Note 16 to the financial statements.
For
per
sona
l use
onl
y
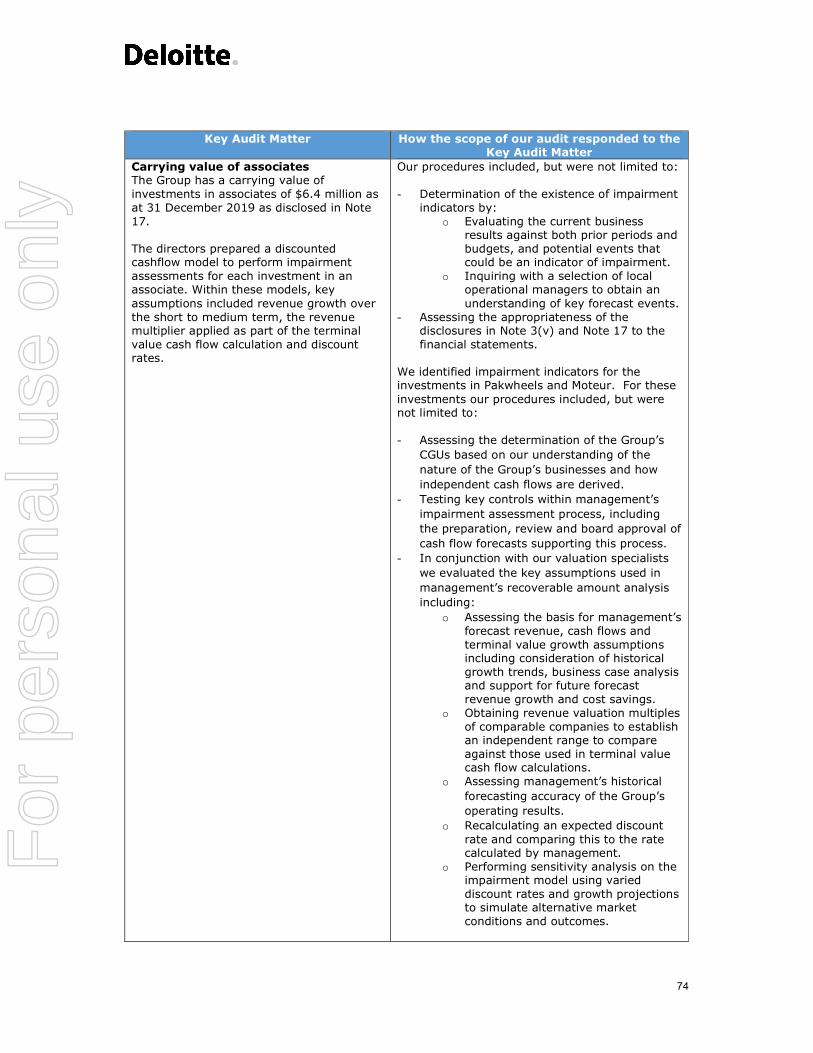
74
Key Audit Matter How the scope of our audit responded to the Key Audit Matter
Carrying value of associates The Group has a carrying value of investments in associates of $6.4 million as at 31 December 2019 as disclosed in Note 17. The directors prepared a discounted cashflow model to perform impairment assessments for each investment in an associate. Within these models, key assumptions included revenue growth over the short to medium term, the revenue multiplier applied as part of the terminal value cash flow calculation and discount rates.
Our procedures included, but were not limited to: - Determination of the existence of impairment
indicators by: o Evaluating the current business
results against both prior periods and budgets, and potential events that could be an indicator of impairment.
o Inquiring with a selection of local operational managers to obtain an understanding of key forecast events.
- Assessing the appropriateness of the disclosures in Note 3(v) and Note 17 to the financial statements.
We identified impairment indicators for the investments in Pakwheels and Moteur. For these investments our procedures included, but were not limited to: - Assessing the determination of the Group’s
CGUs based on our understanding of the nature of the Group’s businesses and how independent cash flows are derived.
- Testing key controls within management’s impairment assessment process, including the preparation, review and board approval of cash flow forecasts supporting this process.
- In conjunction with our valuation specialists we evaluated the key assumptions used in management’s recoverable amount analysis including:
o Assessing the basis for management’s forecast revenue, cash flows and terminal value growth assumptions including consideration of historical growth trends, business case analysis and support for future forecast revenue growth and cost savings.
o Obtaining revenue valuation multiples of comparable companies to establish an independent range to compare against those used in terminal value cash flow calculations.
o Assessing management’s historical forecasting accuracy of the Group’s operating results.
o Recalculating an expected discount rate and comparing this to the rate calculated by management.
o Performing sensitivity analysis on the impairment model using varied discount rates and growth projections to simulate alternative market conditions and outcomes.
For
per
sona
l use
onl
y
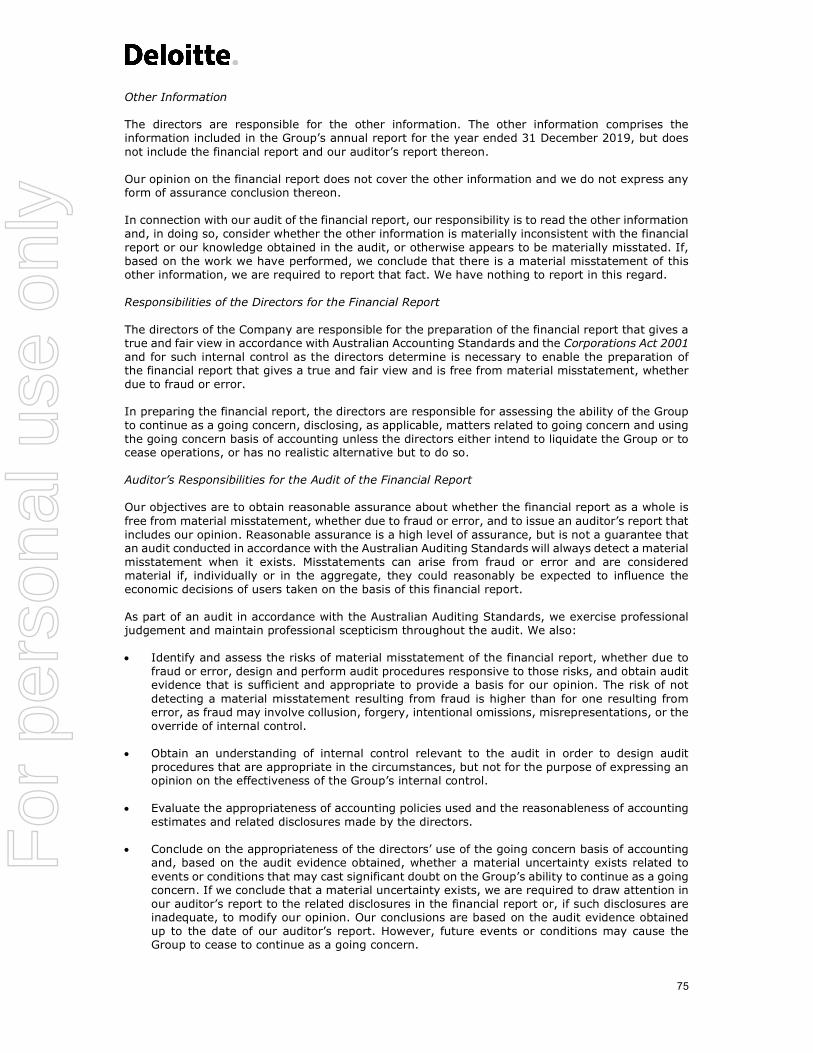
75
Other Information The directors are responsible for the other information. The other information comprises the information included in the Group’s annual report for the year ended 31 December 2019, but does not include the financial report and our auditor’s report thereon. Our opinion on the financial report does not cover the other information and we do not express any form of assurance conclusion thereon. In connection with our audit of the financial report, our responsibility is to read the other information and, in doing so, consider whether the other information is materially inconsistent with the financial report or our knowledge obtained in the audit, or otherwise appears to be materially misstated. If, based on the work we have performed, we conclude that there is a material misstatement of this other information, we are required to report that fact. We have nothing to report in this regard. Responsibilities of the Directors for the Financial Report The directors of the Company are responsible for the preparation of the financial report that gives a true and fair view in accordance with Australian Accounting Standards and the Corporations Act 2001 and for such internal control as the directors determine is necessary to enable the preparation of the financial report that gives a true and fair view and is free from material misstatement, whether due to fraud or error. In preparing the financial report, the directors are responsible for assessing the ability of the Group to continue as a going concern, disclosing, as applicable, matters related to going concern and using the going concern basis of accounting unless the directors either intend to liquidate the Group or to cease operations, or has no realistic alternative but to do so. Auditor’s Responsibilities for the Audit of the Financial Report Our objectives are to obtain reasonable assurance about whether the financial report as a whole is free from material misstatement, whether due to fraud or error, and to issue an auditor’s report that includes our opinion. Reasonable assurance is a high level of assurance, but is not a guarantee that an audit conducted in accordance with the Australian Auditing Standards will always detect a material misstatement when it exists. Misstatements can arise from fraud or error and are considered material if, individually or in the aggregate, they could reasonably be expected to influence the economic decisions of users taken on the basis of this financial report. As part of an audit in accordance with the Australian Auditing Standards, we exercise professional judgement and maintain professional scepticism throughout the audit. We also: Identify and assess the risks of material misstatement of the financial report, whether due to
fraud or error, design and perform audit procedures responsive to those risks, and obtain audit evidence that is sufficient and appropriate to provide a basis for our opinion. The risk of not detecting a material misstatement resulting from fraud is higher than for one resulting from error, as fraud may involve collusion, forgery, intentional omissions, misrepresentations, or the override of internal control.
Obtain an understanding of internal control relevant to the audit in order to design audit
procedures that are appropriate in the circumstances, but not for the purpose of expressing an opinion on the effectiveness of the Group’s internal control.
Evaluate the appropriateness of accounting policies used and the reasonableness of accounting
estimates and related disclosures made by the directors.
Conclude on the appropriateness of the directors’ use of the going concern basis of accounting and, based on the audit evidence obtained, whether a material uncertainty exists related to events or conditions that may cast significant doubt on the Group’s ability to continue as a going concern. If we conclude that a material uncertainty exists, we are required to draw attention in our auditor’s report to the related disclosures in the financial report or, if such disclosures are inadequate, to modify our opinion. Our conclusions are based on the audit evidence obtained up to the date of our auditor’s report. However, future events or conditions may cause the Group to cease to continue as a going concern.
For
per
sona
l use
onl
y
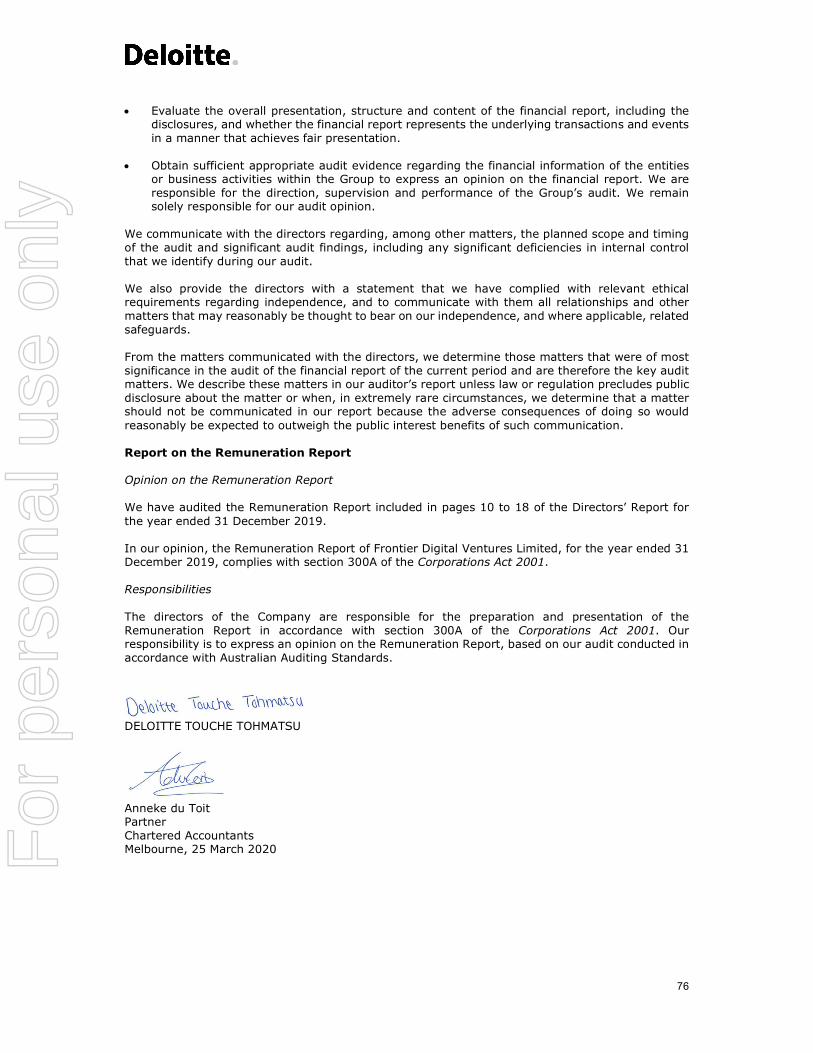
76
Evaluate the overall presentation, structure and content of the financial report, including the
disclosures, and whether the financial report represents the underlying transactions and events in a manner that achieves fair presentation.
Obtain sufficient appropriate audit evidence regarding the financial information of the entities or business activities within the Group to express an opinion on the financial report. We are responsible for the direction, supervision and performance of the Group’s audit. We remain solely responsible for our audit opinion.
We communicate with the directors regarding, among other matters, the planned scope and timing of the audit and significant audit findings, including any significant deficiencies in internal control that we identify during our audit. We also provide the directors with a statement that we have complied with relevant ethical requirements regarding independence, and to communicate with them all relationships and other matters that may reasonably be thought to bear on our independence, and where applicable, related safeguards. From the matters communicated with the directors, we determine those matters that were of most significance in the audit of the financial report of the current period and are therefore the key audit matters. We describe these matters in our auditor’s report unless law or regulation precludes public disclosure about the matter or when, in extremely rare circumstances, we determine that a matter should not be communicated in our report because the adverse consequences of doing so would reasonably be expected to outweigh the public interest benefits of such communication. Report on the Remuneration Report Opinion on the Remuneration Report We have audited the Remuneration Report included in pages 10 to 18 of the Directors’ Report for the year ended 31 December 2019. In our opinion, the Remuneration Report of Frontier Digital Ventures Limited, for the year ended 31 December 2019, complies with section 300A of the Corporations Act 2001. Responsibilities The directors of the Company are responsible for the preparation and presentation of the Remuneration Report in accordance with section 300A of the Corporations Act 2001. Our responsibility is to express an opinion on the Remuneration Report, based on our audit conducted in accordance with Australian Auditing Standards. DELOITTE TOUCHE TOHMATSU Anneke du Toit Partner Chartered Accountants Melbourne, 25 March 2020
For
per
sona
l use
onl
y
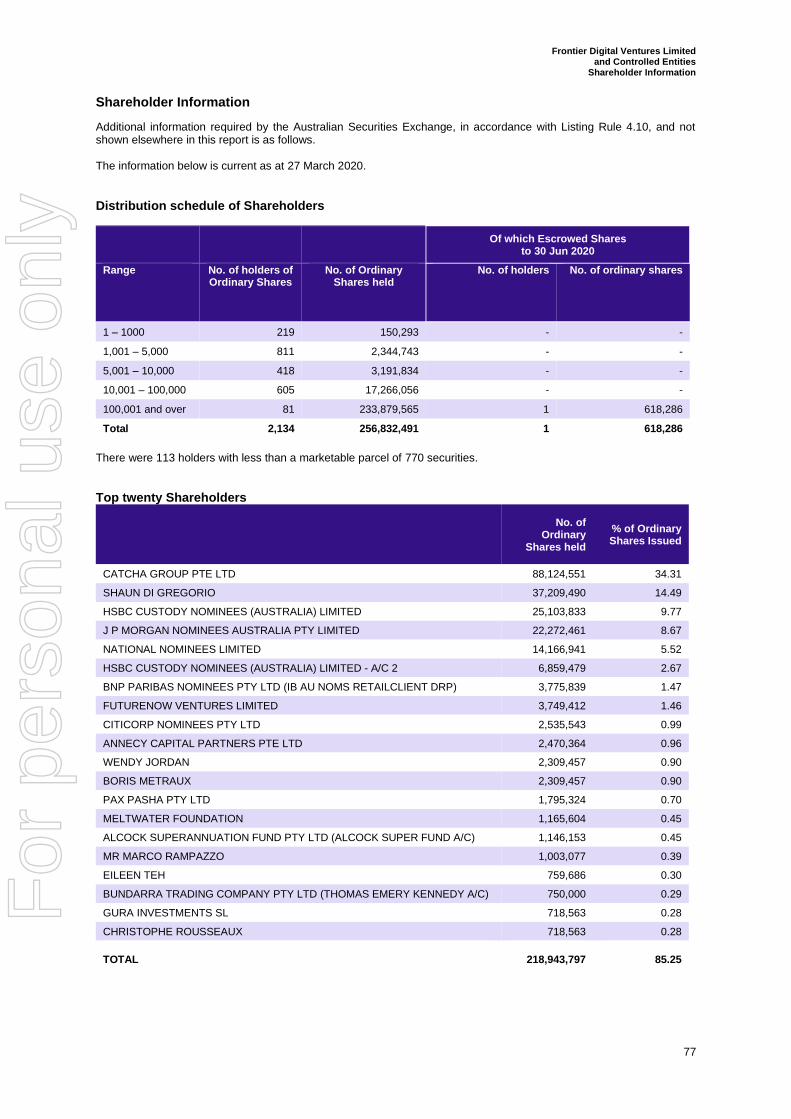
Frontier Digital Ventures Limited and Controlled Entities
Shareholder Information
77
Shareholder Information
Additional information required by the Australian Securities Exchange, in accordance with Listing Rule 4.10, and not shown elsewhere in this report is as follows. The information below is current as at 27 March 2020.
Distribution schedule of Shareholders
Of which Escrowed Shares
to 30 Jun 2020
Range No. of holders of Ordinary Shares
No. of Ordinary Shares held
No. of holders No. of ordinary shares
1 – 1000 219 150,293 - -
1,001 – 5,000 811 2,344,743 - -
5,001 – 10,000 418 3,191,834 - -
10,001 – 100,000 605 17,266,056 - -
100,001 and over 81 233,879,565 1 618,286
Total 2,134 256,832,491 1 618,286
There were 113 holders with less than a marketable parcel of 770 securities.
Top twenty Shareholders
No. of
Ordinary Shares held
% of Ordinary Shares Issued
CATCHA GROUP PTE LTD 88,124,551 34.31
SHAUN DI GREGORIO 37,209,490 14.49
HSBC CUSTODY NOMINEES (AUSTRALIA) LIMITED 25,103,833 9.77
J P MORGAN NOMINEES AUSTRALIA PTY LIMITED 22,272,461 8.67
NATIONAL NOMINEES LIMITED 14,166,941 5.52
HSBC CUSTODY NOMINEES (AUSTRALIA) LIMITED - A/C 2 6,859,479 2.67
BNP PARIBAS NOMINEES PTY LTD (IB AU NOMS RETAILCLIENT DRP) 3,775,839 1.47
FUTURENOW VENTURES LIMITED 3,749,412 1.46
CITICORP NOMINEES PTY LTD 2,535,543 0.99
ANNECY CAPITAL PARTNERS PTE LTD 2,470,364 0.96
WENDY JORDAN 2,309,457 0.90
BORIS METRAUX 2,309,457 0.90
PAX PASHA PTY LTD 1,795,324 0.70
MELTWATER FOUNDATION 1,165,604 0.45
ALCOCK SUPERANNUATION FUND PTY LTD (ALCOCK SUPER FUND A/C) 1,146,153 0.45
MR MARCO RAMPAZZO 1,003,077 0.39
EILEEN TEH 759,686 0.30
BUNDARRA TRADING COMPANY PTY LTD (THOMAS EMERY KENNEDY A/C) 750,000 0.29
GURA INVESTMENTS SL 718,563 0.28
CHRISTOPHE ROUSSEAUX 718,563 0.28
TOTAL 218,943,797 85.25
For
per
sona
l use
onl
y
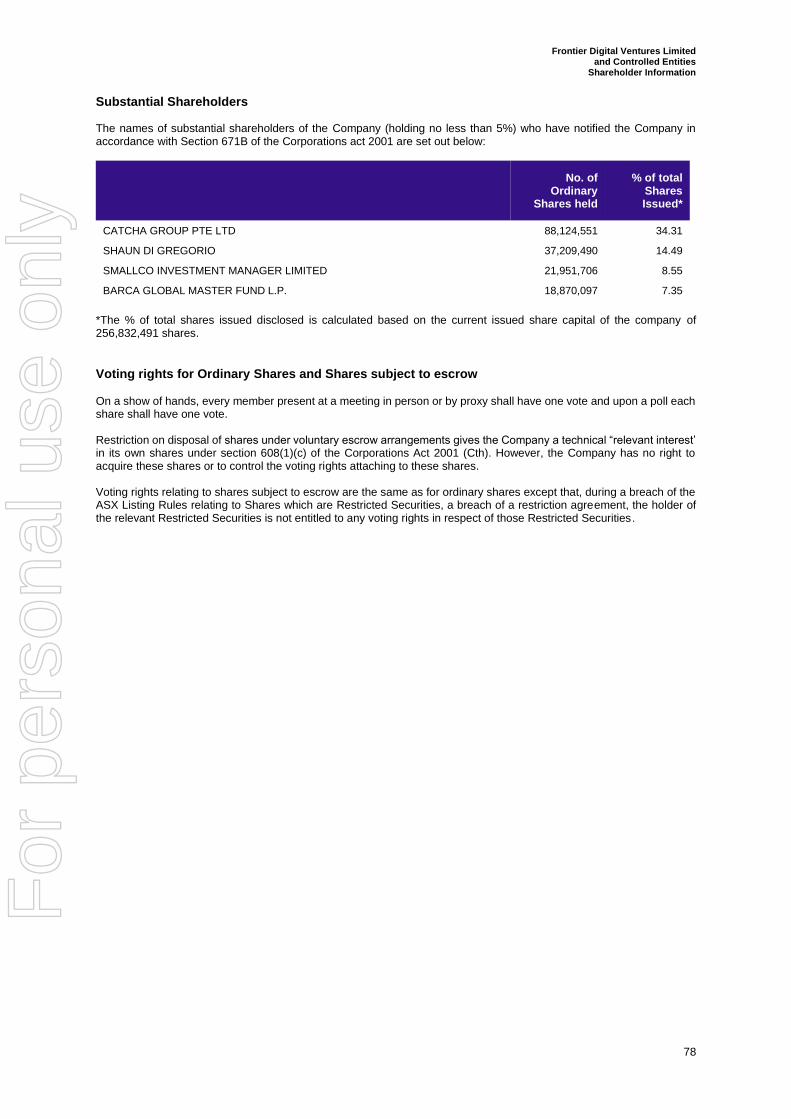
Frontier Digital Ventures Limited and Controlled Entities
Shareholder Information
78
Substantial Shareholders The names of substantial shareholders of the Company (holding no less than 5%) who have notified the Company in accordance with Section 671B of the Corporations act 2001 are set out below:
No. of
Ordinary Shares held
% of total Shares Issued*
CATCHA GROUP PTE LTD 88,124,551 34.31
SHAUN DI GREGORIO 37,209,490 14.49
SMALLCO INVESTMENT MANAGER LIMITED 21,951,706 8.55
BARCA GLOBAL MASTER FUND L.P. 18,870,097 7.35
*The % of total shares issued disclosed is calculated based on the current issued share capital of the company of 256,832,491 shares.
Voting rights for Ordinary Shares and Shares subject to escrow On a show of hands, every member present at a meeting in person or by proxy shall have one vote and upon a poll each share shall have one vote. Restriction on disposal of shares under voluntary escrow arrangements gives the Company a technical “relevant interest’ in its own shares under section 608(1)(c) of the Corporations Act 2001 (Cth). However, the Company has no right to acquire these shares or to control the voting rights attaching to these shares. Voting rights relating to shares subject to escrow are the same as for ordinary shares except that, during a breach of the ASX Listing Rules relating to Shares which are Restricted Securities, a breach of a restriction agreement, the holder of the relevant Restricted Securities is not entitled to any voting rights in respect of those Restricted Securities.
For
per
sona
l use
onl
y
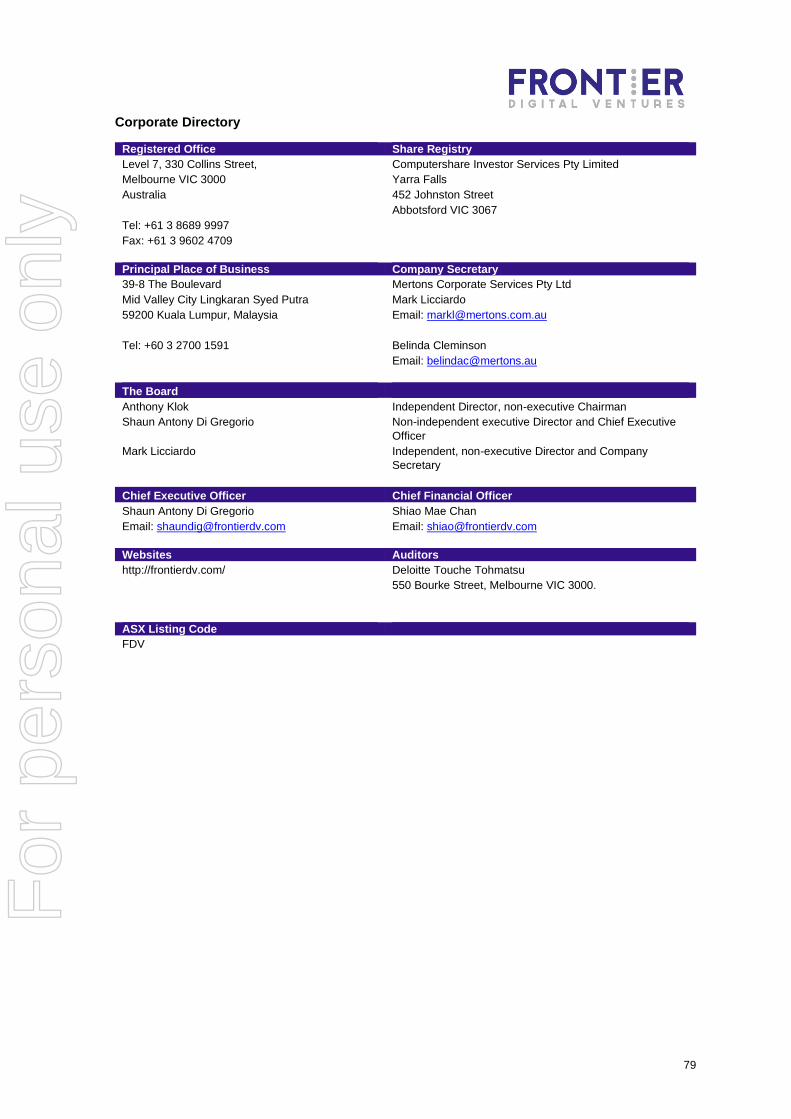
79
Corporate Directory
Registered Office Share Registry
Level 7, 330 Collins Street, Computershare Investor Services Pty Limited
Melbourne VIC 3000 Yarra Falls
Australia
452 Johnston Street
Abbotsford VIC 3067
Tel: +61 3 8689 9997
Fax: +61 3 9602 4709
Principal Place of Business Company Secretary
39-8 The Boulevard
Mid Valley City Lingkaran Syed Putra
59200 Kuala Lumpur, Malaysia
Mertons Corporate Services Pty Ltd
Mark Licciardo
Email: [email protected]
Tel: +60 3 2700 1591 Belinda Cleminson
Email: [email protected]
The Board
Anthony Klok Independent Director, non-executive Chairman
Shaun Antony Di Gregorio Non-independent executive Director and Chief Executive
Officer
Mark Licciardo Independent, non-executive Director and Company
Secretary
Chief Executive Officer Chief Financial Officer
Shaun Antony Di Gregorio Shiao Mae Chan
Email: [email protected] Email: [email protected]
Websites Auditors
http://frontierdv.com/ Deloitte Touche Tohmatsu
550 Bourke Street, Melbourne VIC 3000.
ASX Listing Code
FDV
For
per
sona
l use
onl
y