for personal use only · 2020. 8. 19. · partners, enabling huntly power station to support the...
TRANSCRIPT

G E N E S I S E N E R G Y L I M I T E D annual report 2020 / te pūrongo ā-tau 2020
With you. For you.
For
per
sona
l use
onl
y

Chairman & Chief Executive's joint letter3
Independent Auditor’s Report74
Results at a glance5
Introduction toTask Force on Climate-related Financial Disclosures (TCFD) Reporting
13
TCFD 1. Strategy14
TCFD 2. Metrics and Targets20
TCFD 3. Governance23
Putting control in our customers' hands7
Consolidated Financial Statements39
Corporate governance77
Director and Executive remuneration79
Statutory disclosures83
People, Community and Partnerships25
TCFD 4. Risk Management24
Board of Directors and Executive team35
TCFD Appendix88
For
per
sona
l use
onl
y

4G E N E S I S A N N U A L R E P O R T 2 0 2 03 G E N E S I S A N N U A L R E P O R T 2 0 2 0
Kia ora shareholders,
This year has been amongst the most impactful in our history, forcing radical changes to how we operate our business.
2020 will be remembered as the year of COVID-19, a once-in-a-generation event. But it is also worth reflecting on a financial year that started out with intense and prolonged climate change protest action across the globe, the passing of the Zero Carbon Act domestically and concluded with the announced closure of Tiwai Point aluminium smelter in Southland, which will permanently realign the domestic electricity market.
We are proud of how our teams have stood up and performed under pressure, supporting our customers through trying times. This is testament to our strong team culture. We are confident in stating that our business has been stress tested at every level and we have come through well.
Chairman and Chief Executive’s joint letter
Stress tested
As New Zealand’s largest energy retailer to residential homes, maintaining service to our customers through the COVID-19 lockdown was crucial. Our long-standing investments in technology, innovation and flexible working were invaluable. This enabled our customer service teams to rapidly adapt, maintaining high levels of customer service while working safely and remotely from their homes.
We also used the relationships built through School-gen to partner with Mind Lab to make online learning content available to New Zealand children throughout the COVID-19 lockdown.
Our generation and LPG operations staff have been continuing their essential work to ensure energy is delivered to New Zealand homes and businesses.
Our Tekapo upgrade works, which ran from January to June, were able to continue throughout the lockdown, safely and efficiently. This phase was completed with only minor delays and utilised new technologies such as HoloLens Augmented Reality helmets.
He tuhinga nā te Tiamana māua ko te Manahautū
C H A I R A N D C E O J O I N T L E T T E R C H A I R A N D C E O J O I N T L E T T E R
Strong retail performance
A strong retail performance has been anchored by the development of our digital capability, with 77 per cent of customers engaging with our products via our digital platforms. More than 150,000 customers took up our last Power Shout, and 141,000 unique users engaged with EnergyIQ in May alone. We’re using the insights gained from these interactions to iterate and improve our products, to help us innovate into a data-driven future and Reimagine Energy for our customers.
Beyond our technological innovation, we’re also partnering with Emirates Team New Zealand ahead of the 2021 America’s Cup and we’ve leveraged our
40 per cent equity position in electric car share company, Zilch, to support our new Auckland office in Wynyard Quarter. This will not only solidify our own ‘electric’ first approach to our staff transportation, but also provides a low-carbon car share option to the local business community.
Wholesale market volatility
The wholesale market has been extremely volatile this year, and the value provided by our diverse portfolio of generation assets has been clear. The North Island drought during the second half of the year saw the second lowest inflows in 95 years, with some lakes dropping to as low as 20 per cent of capacity. Kupe, Pohokura and the HVDC Inter-Island link's planned outages meant Genesis’ Rankine units were vital in stabilising electricity prices.
Towards the end of the year, all swaptions were activated with our partners, enabling Huntly Power Station to support the other major generators facing similar hydrology challenges, as well as smaller retailers.
Proposed Tiwai Point closure
The proposed closure of Tiwai Point Aluminium Smelter in August 2021 is disappointing news for the people of Southland. This will equate to the removal of approximately 13 per cent of New Zealand’s national electricity demand. As such, this marks a fundamental shift in the New Zealand electricity market’s supply/demand balance. The announcement was not unexpected and is a scenario we have planned for. Genesis Energy's fuel and generation flexibility will be able to react well to the conditions as they change. Most notably, it removes a large uncertainty that has hung over the sector for many years. This presents an opportunity to accelerate the electrification of industry and transportation, something we have been a strong advocate for.
Regulatory reform
We have responded to regulatory changes, such as the opportunities presented by the Electricity Pricing Review in late 2019 to redesign our residential products to better meet our customers’ needs. These new
products better position our digital capabilities and put control in our customers' hands. Our EnergyIQ platform continues to go from strength to strength, and new features such as EcoTracker have enabled our customers to make better decisions about their energy use and manage their own carbon footprints.
The recent Zero Carbon Act and changes to the emissions trading scheme have been significant movements in New Zealand’s response to climate change, and you will see throughout this report a range of measures to increase transparency and support our transition to a low-carbon future.
Future-gen and climate-related risk
Future-gen is Genesis’ strategy to identify renewable opportunities that enable the transition away from baseload thermal generation. Thermal will still fulfil an important function in New Zealand’s electricity market, filling the gaps when the rain doesn’t fall or the wind doesn’t blow. We see Huntly Power Station continuing this backup role for the near future, which is necessary for the New Zealand energy sector’s resilience.
You can read more about this strategy throughout this report. It has been one of the reasons we have been quite ambitious in reporting our climate change-related targets this year.
There are a number of firsts here
Barbara Chapman CNZM C H A I R M A N
Marc England C H I E F E X E C U T I V E
– this will be the first time we’ve reported in line with the Task Force on Climate Related Financial Disclosures’ recommendations, which forms the basis of this report.
It is also the first time as a publicly listed company we will report our Scope 1, 2 and 3 emissions in our Annual Report. We will also be setting a Science Based Target in FY21 which demonstrates alignment between our low-carbon transition with the commitments of the Paris agreement, and we have set ourselves an ambitious target of 2,650GWh of new renewables generation development. Waipipi Wind Farm will achieve the first 450GWh.
We were also accredited as a Living Wage employer earlier this year and reported our gender pay gap for the first time – important milestones that further support our people.
We firmly believe Genesis is going to be a key enabler to New Zealand’s decarbonisation journey over the next decade, maintaining a secure and affordable electricity system for all New Zealanders and backing up the renewable system.
The underlying strength and flexibility of Genesis’ business strategy, leadership and governance has been strongly validated this year. We are confident that our strong and resilient business culture positions Genesis well for the future.
Ngā mihi,
Barbara Chapman CNZM Chairman
Marc England Chief Executive
Considered Genesis the most preferred brand in the residential market¹
Increase in 'brand love' amongst existing customers during COVID-19²
1: Purpose Business Monthly Brand Tracking June 2020.
2: Purpose Business Campaign Tracking May 2020.
% %+
For
per
sona
l use
onl
y

6G E N E S I S A N N U A L R E P O R T 2 0 2 05 G E N E S I S A N N U A L R E P O R T 2 0 2 0
Results at a glanceResults at a glance
55 G E N E S I S A N N U A L R E P O R T 2 0 1 9
Ngā tīpakotanga
R E S U L T S A T A G L A N C E
1. Refer to note A1 on page 46 for a reconciliation to net profit after tax.2. EBITDAF: Earnings before net finance expense, income tax, depreciation, depletion, amortisation, impairment, fair value changes,
and other gains and losses. Refer to the consolidated income statement on page 40 for reconciliation to net profit after tax.3. CPS: Cents per share.4. Includes US Private Placement (USPP) translated using Cross Currency Interest Rate Swap (CCIRS) fixed rate.5. Operating expenses is made up of other operating expenses and employee benefits as disclosed in note A2 on page 48.
Net Profit After Tax (NPAT) FY19 $59m (restated)
EBITDAF2
FY19 $369m (restated)
RevenueFY19 $2.7b
Underlying earnings1
FY19 $64m (restated)
Operating expenses FY19 $251m (restated)
$
Free Cash flow FY19 $178m (restated)
$
Total Dividendrelating to FY20 resultFY19 17.05 cps
cps3
Net debt4 FY19 $1,240m (restated)
5For
per
sona
l use
onl
y

8G E N E S I S A N N U A L R E P O R T 2 0 2 07 G E N E S I S A N N U A L R E P O R T 2 0 2 0
Genesis has strategically positioned its business for a low emissions economy. Developing innovative new ways of reducing the Company’s emissions, outside of its generation activities, remains a key strategic focus for the business.
Enabling greater energy efficiency and managing peak demand is a critical part of meeting New Zealand's energy challenges, both now and into the future.
Genesis works alongside its customers to help them better manage their energy use, control their costs and lower their environmental impact.
Genesis does this by enabling greater consumer choice at the household/retail level through its multiple EnergyIQ propositions,
which can be read about on the coming pages.
Key to all of this is providing accessible information to our customers that enables better decision-making. Although investments in energy efficiency are already economically sound, customers often defer them due to competing priorities.
HomeGen, for example, supports renewables at the household level by increasing the price paid for energy produced from Genesis customers’ rooftop solar panels.
Genesis believes providing the appropriate incentives, for suppliers and consumers, will lower the information barrier and fast-track meaningful action to reduce energy consumption in the short term.
Kei ō tātou kiritaki te mana
Zilch Electric Car Share
Genesis acquired a 40 per cent ownership interest in Zilch, New Zealand’s only fully electric vehicle (EV) car-sharing business.
As part of the design of the new Auckland office, Genesis will focus on encouraging low emissions commuting by our staff by using a combination of our EV fleet and Zilch for work trips during the day.
Our teams will also benefit from staff discounts for Zilch use outside work hours, and the creation of Zilch parking pods in Wynyard Quarter will also enable the local business community to lower their carbon footprints.
I N N O V A T I O N
Putting control in our customers' hands
Power Shout 8Free electricity that can be used whenever customers want
EnergyIQ’s Eco TrackerHelping customers make sustainable consumption choices Last year Genesis launched Eco Tracker, a tool within its EnergyIQ platform that allows Genesis customers to view New Zealand’s carbon emissions from electricity generation in real time and plan their energy usage accordingly.
Eco Tracker is designed to help educate customers about how electricity is generated, how it comes through the grid to homes and how it impacts customers' carbon footprints. Combined with EnergyIQ’s energy saving tips, the goal is to provide customers with clear suggestions about how to change their usage habits and make more sustainable choices.
Genesis Power Shouts are a gift of free electricity to say thank you to our customers for being with Genesis.
Eligible Genesis customers can jump into EnergyIQ and choose when they want to activate their free hour of power and plan ahead of time when to perform energy intensive tasks, such as running the dryer and heaters.
Genesis decided to bring Power Shout 8 forward by a month to support customers during COVID-19 lockdown.
70% of customers engaging with Eco Tracker have expressed a willingness to take an action, proof that information is the best tool to help kiwis lower their household carbon emissions.
In May 2020 nearly 141,000 customers engaged with EnergyIQ
Genesis broke a number of its own records:
• A record 16 hours of free power offered to customers, in two blocks of eight hours.
• A record 141,000 customers redeeming their Power Shouts in May – a 71 per cent redemption rate (also a record).
• All up, Genesis gave away a record 2.1 million hours or 240 years of free power.
I N N O V A T I O N
Eco Tracker
Unique users
For
per
sona
l use
onl
y

10G E N E S I S A N N U A L R E P O R T 2 0 2 09 G E N E S I S A N N U A L R E P O R T 2 0 2 0
Kenehi@Wynyard: Genesis’ new sustainable home
In October Genesis will be moving its Auckland office to 155 Fanshawe Street, in Auckland’s innovation hub, Wynyard Quarter. The name Kenehi@Wynyard (K@W) was chosen by staff.
The 6 Green Star-rated office building is currently under construction by Mansons TCLM. It boasts world-class facilities, superior transport options and new ways to network and collaborate with customers and business partners.
The office will align to Genesis’ wider sustainability goals. K@W is being built to the highest quality energy efficiency standards: it recycles rainwater, utilises solar power and onsite battery storage and also features state-of-the-art heating and cooling systems.
Genesis will also take on the role of site energy manager, enabling Genesis to showcase its solar management systems and demonstrate its innovative digital
products and customer service first-hand. It also enhances brand proximity to sponsor partner Emirates Team New Zealand ahead of the America’s Cup in 2021.
To reduce Genesis’ carbon footprint, it will feature on-site EV parking spaces and chargers for its electric vehicle fleet and end-of-trip facilities to encourage teams to cycle and run to work. No staff car parking will be made available by design, lowering Genesis' commute emissions, but also reducing congestion and encouraging the use of Auckland’s public transport network.
Electric car sharing is an innovative and cost-effective way for businesses to reduce the emissions associated with fleet management.
As part of the Company's Zilch investment (see Page 7) EV car-sharing will be a key part of the new office’s transport infrastructure.
New 6 Green Star-rated office will focus on sustainable transport options
The central location presents a great opportunity to weave car-sharing transport options throughout Genesis’ operations and push the future of sustainable mobility.
I N N O V A T I O N
Genesis installs curved solar panels to power Emirates Team New Zealand
In a first of its kind solar installation for New Zealand, Genesis has fitted curved solar panels to the unique roof of the Emirates Team New Zealand base. The solar installation was a year in the making, from planning, design, production, testing and installation, on one of Auckland’s most iconic buildings. These panels will power Emirates Team New Zealand through their defence of the 36th America’s Cup and supply the building with energy for many years to come.
Revolve Energy worked with Genesis to explore the feasibility, design and installation of the solar panels, as well as monitoring and optimising energy production. The panels were designed not only to suit the unique design of the building but to withstand the waterfront’s strong winds. Solar panels are typically rigid and bolted to the roof but, due to the curved shape of the roof, the project used bonded flexible solar modules.
Genesis also provides electricity, solar and energy monitoring to the base, including tracking and sharing
how much energy the solar panels are generating in real time and bringing that data to life through a dashboard. Both the team and public can now see it displayed on the giant digital screen outside the base, and those not in Auckland will be able to see it on the Genesis website.
Genesis thanks all the partners who helped make this project a success, especially the teams at Revolve Energy, Reid Technology, SuperCity Solar, Regional Facilities Auckland and Panuku Development.
Genesis is the official energy partner for Emirates Team New Zealand
I N N O V A T I O N
For
per
sona
l use
onl
y

12G E N E S I S A N N U A L R E P O R T 2 0 2 011 G E N E S I S A N N U A L R E P O R T 2 0 2 0
New ways of keeping our people safe
Safety and Wellness innovations
In FY20 Genesis built its new Safety and Wellness Management Framework, completely overhauling its existing health and safety management systems. The new framework includes a new strategic focus on mental health and wellbeing, prioritisation of critical risks, as well as improved quality and transparency of safety reporting. Genesis has continued to see the roll out of new technologies to manage workplace hazards, such as the AutoSense fatigue and distraction management system for our heavy and light vehicle fleets. Over this period Genesis has seen a 44 per cent decline in contractor injuries, which is a very pleasing result.
Underwater drone inspections at Moawhango
Genesis also completed over 20 inspections using both aerial and submersible drones, with one notable inspection being the assessment of the Moawhango Dam Diversion Valve Intake, located 50 metres below the surface of Lake Moawhango. The use of drone technology has significantly reduced the Company's critical risk exposure, reduced the costs of inspection, reduced outage time and improved inspection data quality.
Tekapo Power Station intake gate worksGenesis’ sole South Island generation asset, the Tekapo Power Scheme, underwent substantial upgrades and maintenance works, including rebuilding its intake gate. This involved alternating shutdowns of Tekapo A and Tekapo B power stations across the January to June 2020 period. Genesis was designated as an Essential Services provider during the COVID-19 lockdown and worked closely with government agencies to ensure this work was uninterrupted, while also keeping our dedicated engineers and contractors safe. The project was completed with minimal delay due to the exceptional efforts of these teams. These upgrades will further enhance the efficiency and reliability of this valuable generation asset.
The first major work took place at Tekapo in 1951, using very different 'dive' technologies and safety standards.
I N N O V A T I O N
New ways of workingNew tools and technologies to not only support our operations, but our people’s safety and wellbeing
Genesis' Predictive Analytics PlatformGenesis’ Predictive Analytics Platform (GPAP) utilises machine learning algorithms to examine historical and current data from thousands of sensors on the power generation sites to predict when the health of an asset is deteriorating and at risk of failure. This provides valuable early warning and intervention on emerging issues with the aim of reducing plant down time and repair costs.
Built completely on open source software developed inhouse, the project has now been live for a year. In that time Genesis has more than 900 predictive models running on the platform, covering approximately 80 per cent of its key generation assets. Already GPAP has identified more than 40 asset health issues that would not have been picked up as quickly using traditional, manual asset monitoring techniques.
This industry-leading programme provides greater certainty to engineers and asset management planners on the ground, but also reinforces Genesis’ vital role in providing security of supply to the entire New Zealand electricity market.
‘Virtual maintenance’ via Augmented Reality
Microsoft’s HoloLens is an augmented reality headset that allows Genesis staff to engage teams remotely, by virtually overlaying blueprints, drawings and instructions over an operator's field of vision. Engineers can interact from thousands of kilometres away via a laptop – drawing lines, circling or pointing arrows at power station components in the operator's field of view while they’re talking – while also keeping the worker's hands free.
Genesis moved HoloLens out of its testing phase in FY20, and its
implementation was accelerated by COVID-19. Specialists in the Hamilton office were able to engage with remote workers at Tekapo, assisting in their maintenance and inspections while travel was banned during lockdown.
It also allowed engineers at Huntly Power Station to successfully perform a re-certification of vacuum sealers via overseas inspectors 20,000kms away in the UK, in real time. This also would not have been able to be completed under COVID-19 Level 4 due to international travel restrictions.
Genesis is now using HoloLens as a part of its training programmes, recording veterans performing tasks on legacy technology to train the next generation of engineers.
I N N O V A T I O N
Genesis uses Blue Robotics BlueROV2 drones to conduct underwater inspections, saving on the health and safety risks (and costs) of commercial diver-based inspections
For
per
sona
l use
onl
y

14G E N E S I S A N N U A L R E P O R T 2 0 2 013 G E N E S I S A N N U A L R E P O R T 2 0 2 0
TCFD Recommendations
1. StrategyPage 14
Disclose the actual and potential impacts of climate-related risks and opportunities on the organisation’s businesses, strategy, and financial planning where such information is material.
a) Describe the climate-related risks and opportunities the organisation has identified over the short, medium, and long term.
b) Describe the impact of climate-related risks and opportunities on the organisation’s businesses, strategy, and financial planning.
c) Describe the resilience of the organisation’s strategy, taking into consideration different climate-related scenarios, including a 2°C or lower scenario.
2. Metrics and TargetsPage 20
Disclose the metrics and targets used to assess and manage relevant climate-related risks and opportunities where such information is material.
a) Disclose the metrics used by the organisation to assess climate-related risks and opportunities in line with its strategy and risk management process.
b) Disclose Scope 1, Scope 2, and if appropriate, Scope 3 greenhouse gas (GHG) emissions, and the related risks.
c) Disclose the targets used by the organisation to manage climate-related risks and opportunities and performance against targets.
3. GovernancePage 23
Disclose the organisation’s governance around climate-related risks and opportunities.
a) Describe the board’s oversight of climate-related risks and opportunities.
b) Describe management’s role in assessing and managing climate-related risks and opportunities.
4. Risk ManagementPage 24
Disclose how the organisation identifies, assesses, and manages climate-related risks.
a) Describe the organisation’s processes for identifying and assessing climate-related risks.
b) Describe the organisation’s processes for managing climate-related risks.
c) Describe how processes for identifying, assessing, and managing climate-related risks are integrated into the organisation’s overall risk management.
The Task Force on Climate-related Financial Disclosures (TCFD) was created in 2015 to develop a set of voluntary recommendations for companies and investors to report the risks faced to their organisations by climate change.
It was formed by the Financial Stability Board (FSB) as a means of coordinating disclosures among companies impacted by climate change all over the world. A key goal of the TCFD is to encourage sustainable investments and build an economy which is resilient in the face of climate-related uncertainties.
The TCFD consists of 31 members selected by the FSB. Members are made up of both users and preparers of disclosures and represents members of the G20 across numerous sectors and industries.The TCFD’s recommendations are widely regarded as best practice for climate-related financial disclosures.
TCFD requirement
a) Describe the climate-related risks and opportunities the organisation has identified over the short, medium, and long term.
Genesis has a comprehensive risk identification and assessment process, further detail of which is provided in the risk management disclosures on page 24. These processes result in a comprehensive register of risks that are actively managed.
Physical climate impacts can be 'acute' arising from extreme weather events (such as floods or droughts) or 'chronic' arising from the longer-term shifts in climate patterns (i.e. increasing temperatures and changes to hydro lake inflows). These changes may result in financial risks or opportunities due to the direct and indirect impacts they can
Climate change risks
have on business operations, assets, markets or supply chains.
Transitional climate impacts refer to risks and opportunities resulting from the policy, legal, technology and market changes occurring in the transition to a low-carbon economy. Depending on the nature, speed and focus of these changes, transition impacts may pose varying levels of financial and reputational risk or opportunity.
Opportunities arising Many of the transitional risks represent an evolution or change in the market. Some are an expected transition and some are less predictable, such as the speed of
technology advancement. In all cases these changes also reflect opportunities that Genesis is well positioned to capitalise on.
An overview of Genesis’ highest rated climate-related risks and opportunities are included below.
Each category has been assessed according to the most relevant timeframe and level of potential impact. Recognising that the climate scenario is dynamic and unknown to a certain extent, the classification represents Genesis’ current assessment of the risk landscape.
1. StrategyIntroduction The Task Force on Climate-related Financial Disclosures (TCFD)
For greater detail on the risks and opportunities presented above, refer to TCFD Strategy Appendix on page 88.
Category description Risk/Opportunity Category TimeframeImpact rating*
Regulatory changes that impact thermal generation
Risk & some opportunity TransitionalShort term (1-10 years)
Moderate
Environmental and physical changes that impact thermal generation
Risk PhysicalShort term (1-10 years)
Moderate
Consumer and investor preference impacting our operating landscape
Risk & some opportunity TransitionalShort to Medium term (1-20 years)
Moderate
Technological disruption Risk & opportunity TransitionalShort to Medium term (1-20 years)
High
Long-term climate changes that impact hydro generation
Risk & opportunity PhysicalLong term (gradual increase in likelihood over next 20-30 years)
High
Acute climate events causing damage to critical infrastructure and assets
Risk Physical Long term (gradual increase in likelihood over next 20-30 years)
High
*Note: Impact rating corresponds to a defined Genesis risk management matrix. For example, ‘high’ impact risks or opportunities have the potential to materially impact the business and require significant action across multiple business units.
He rautaki
S T R A T E G Y S T R A T E G Y
For
per
sona
l use
onl
y

16G E N E S I S A N N U A L R E P O R T 2 0 2 015 G E N E S I S A N N U A L R E P O R T 2 0 2 0
b) Describe the impact of climate-related risks and opportunities on the organisation’s businesses, strategy, and financial planning.
All climate-related risks and opportunities affect the Company’s short-medium term strategy and financial planning. These strike a balance between several key objectives, and are underpinned by extensive scenario mapping, including those that span different carbon transition pathways.
Genesis recognises the impact climate change is already having and supports meaningful, economy-wide planning to reduce emissions and transition New Zealand to a low-carbon future.
Genesis, along with the wider electricity sector, must play a critical role in driving decarbonisation
1. Reference: UMR/Genesis Research: Coal, gas and renewable energy, February 2020.
through electrifying the more carbon-intensive parts of the economy, in particular industrial processes and transport. With one of the most renewable electricity systems in the OECD, New Zealand has an opportunity to lead the world in electrification. However, this transition is subject to its own climate-related risks. For example, poor regulatory or policy settings could have the opposite effect and disincentivise electrification through a higher-cost and less reliable electricity system.
Genesis has a plan to transition its thermal generation assets away from baseload, while still providing backup options for renewable generation. The economics of renewable baseload electricity generation have now reached the tipping point where it is cost-effective to build geothermal, wind and solar. Consumers have also stated that they want secure and low-cost electricity¹. Currently, there are limited commercially feasible zero-carbon options to manage the
seasonal challenges in New Zealand.The wholesale electricity market will become increasingly tested as the country becomes more reliant on renewable generation, which is subject to seasonal and intra-day weather conditions that could intensify with climate change.
This does not take away from the fact that as New Zealand’s largest thermal electricity generator, Genesis is very aware of the role it plays – and the responsibility it has – in supporting New Zealand’s transition to a low-carbon future.
TCFD requirement
Building a renewable future
Transitioning thermal baseload to a backup role is necessary as the electricity sector as a whole decarbonises and in order for New Zealand to reach its carbon obligations.
Careful consideration is required to ensure the 'energy trilemma' elements of sustainability, reliability and affordability are balanced to the maximum benefit of consumers and the economy.
The electricity sector is responsible for approximately 4.2 per cent of
2. Reference: Ministry of Business, Innovation and Employment – Energy in New Zealand 2019.
3. Reference: Ministry of Business, Innovation and Employment, Electricity Demand and Generation Scenarios July 2019.
The transition away from coal is under way- A ten-year window points to exit
2008 2010 2012 2014 2016 2018 2020 2022 2024 2026 2028 2030
Average
Coal use for abnormal conditions
Coal use normal conditions
Genesis Energy’s coal use and intention
Transitioning baseload thermal generation to renewables
New Zealand’s annual emissions and is already largely decarbonised, with approximately 84 per cent of electricity generated annually from renewable sources². This decarbonisation is set to continue, with renewable electricity generation anticipated to increase to around 90 per cent by 2035 and around 95 per cent by 2050 under all the Ministry of Business, Innovation and Employment’s modelled scenarios³. The costs of new wind and geothermal generation are already comparable to those of gas baseload generation.
Already Genesis has removed 1.8 million tonnes of carbon from its generation activities across the last ten years and aims to remove a further one million tonnes across the next ten.
Genesis has made a commitment to cease coal use at Huntly Power Station by 2025 under normal market conditions and has stated an intent to end coal use altogether by 2030. Gas will still be required to support thermal backup generation for many years to come.
Source: Ministry for the Environment, Gross Greenhouse
Gas Emissions 2018 (published: April 2020).
Note: these figures may not add up to exactly 100% due to rounding
Industrialprocesses and waste11.6%
Energy 40.5%
Agriculture 47.8%
New Zealand’s Greenhouse Gas
Emissions
Opportunity to decarbonise process heat through electrification
Transport%.
Electricity Generation
%.
Manufacturing(including process heat)%.
Other%.
1. StrategyHe rautaki
1. StrategyHe rautaki
.Fugitive Emissions
%
S T R A T E G Y S T R A T E G Y
For
per
sona
l use
onl
y

18G E N E S I S A N N U A L R E P O R T 2 0 2 017 G E N E S I S A N N U A L R E P O R T 2 0 2 0
Seasonal and dry year storage challengesThe increasing proportion of electricity from renewable generation will not solve New Zealand’s fundamental challenge of seasonal storage. New Zealand currently requires about 7,000 GWh of deep energy storage to deal with the seasonal shifts in demand – in which 2,000 GWh more energy is needed in winter than summer. In dry years inflows can be as much as 5,000 GWh or more below average. This effect may be exacerbated by climate change over time.
Existing hydro lakes provide about 4,000 GWh of that storage, leaving a 3,000 GWh gap. For scale, 3,000 GWh is about five times what Lake Taupō currently stores for generation⁴ or 140 Tesla Powerwall batteries for every household in New Zealand. The Tesla option would cost in the order of $2 million per dwelling. That storage gap is currently met by thermal electricity generation, particularly at Huntly Power Station.
New Zealand has 60 per cent of electricity generated from hydro-power stations, yet only six weeks of hydro storage at any given time (this assumes ideal hydrological conditions and full lake storage).
4,000
3,500
3,000
2,500
2,000
1,500
1,000
500
0
400
350
300
250
200
150
100
50
0
Mon
thly
Tot
als
(GW
h)
Sola
r M
onth
ly T
otal
s (G
Wh)
South Island Inflow National Demand Solar Generation (per 1000MW Installed)
Jan Feb Mar Apr May Jun Jul Aug Sep Oct Nov Dec
As an island, New Zealand does not have any international interconnect backup options when renewables aren't available. There are also additional risks from the North Island/South Island split and how supply/demand is managed via transmission over the HVDC Inter-Island link.
Thermal electricity generation (including at times coal) provides the crucial backup support that has allowed New Zealand to enjoy such a high level of renewable electricity. The multi-month seasonal risk we face when the lakes are low is unique to New Zealand and will require longer-term technology solutions that are currently uneconomic, particularly if we are to keep
4. At the currently consented operating range of 1.4 metres.
electricity prices low enough to encourage other sectors to decarbonise through electrification.
In addition, the wholesale electricity market will become more volatile as New Zealand further increases electricity generation from renewable sources, given the intermittent nature of wind generation in particular and as the cost of owning the remaining thermal plant that runs less and less becomes unsustainable. These risks are all exacerbated by long-term effects of climate change.
c) Describe the resilience of the organisation’s strategy, taking into consideration different climate-related scenarios, including a 2°C or lower scenario.
• Genesis stress tests its strategy against a number of scenarios, these include (but are not limited to) three scenarios specifically modelled to align to climate-related risks. These scenarios contribute towards a comprehensive climate-related risk assessment.
• The first two scenarios involve global efforts to heavily reduce emissions and limit global temperature increase to below 2°C (ideally 1.5 °C). These two scenarios differ in their methods needed to reach this target. The first scenario is driven primarily by stringent government legislation. The second is energy sector transformation via the private sector, such as innovative technological advances and change in consumer choices. Both potentially succeed in being the main driving force in keeping climate change within the 2°C goal of the Paris Agreement.
• The third scenario defined, is where greenhouse gas concentrations continue unabated (the IPCC's Representative Concentration Pathway (RCP) 8.5) and includes greater climate change and associated physical impacts.
• These scenarios were selected to provide integrated scenarios with a mix of factors but also allowed a stress test against extremes from both a transitional and physical perspective. Specifics of the scenarios were created from published climate-risk related models, including work published by NIWA and the Ministry for the Environment for physical risks. This is supported by long-term scenarios mapping the supply and demand balance in the New Zealand electricity system from internal subject matter experts.
• The scenarios used to test company strategy have differing timescales applied. For the three climate-specific scenarios, the timeframes applied are:
» Short Term: one to 10 years » Medium Term: 10 to 20 years » Long Term: 20+ years
TCFD requirement
• In all scenarios modelled Genesis' strategy proved resilient. A key aspect is that with many risks, a corresponding opportunity is also created. Genesis' strategy seeks to identify these opportunities, while also providing a level of risk mitigation where executed successfully.
• An example would be the entrance of new types of renewables into the market. While this is needed to reduce the reliance on thermal generation, and potentially diversify away from hydro-dominated renewables, this also creates a financial risk of displacement for Genesis' thermal assets. However, this also places the Company in a strong position to make informed and structured investment in renewables in the long term.
Climate change scenario mapping
New Zealand's Unique Winter Challenge
1. StrategyHe rautaki
1. StrategyHe rautaki
S T R A T E G Y S T R A T E G Y
For
per
sona
l use
onl
y

20G E N E S I S A N N U A L R E P O R T 2 0 2 019 G E N E S I S A N N U A L R E P O R T 2 0 2 0
Renewable energy has a different role in the market to thermal generation
Generation Role Thermal (Gas) Thermal (Coal) Hydro Geothermal Wind & Solar Batteries
Baseload Runs 24/7
Daily Flex Can turn it on/off (or up/down) for a few hours
Baseload Can turn it on/off (or up/down) for a few days
Baseload Has fuel storage to run in droughts (c. 3000 GWh)
Always Sometimes
a) Disclose the metrics used by the organisation to assess climate-related risks and opportunities in line with its strategy and risk management process.
b) Disclose Scope 1, Scope 2, and, if appropriate, Scope 3 greenhouse gas (GHG) emissions, and the related risks.
c) Describe the targets used by the organisation to manage climate-related risks and opportunities and performance against targets.
TCFD requirement
Goal:Reduce generation emissions by one million tonnes
• In the past 10 years (2009-2019) Genesis has removed more than 1.8 million tonnes of CO2 from its generation activity (a reduction of 42 per cent).
• Genesis aims to reduce its net carbon emissions by one million tonnes over the next ten years.
• As part of the Science-based Targets Initiative, Genesis has committed to set a Science-based Target covering generation emissions by the end of FY21.
• Genesis has committed to cease coal use at Huntly Power Station by 2025 under normal market conditions, and its intention is to phase out coal use completely by 2030.
• Genesis has reduced coal use by 72 per cent since the 2006 peak (2006: 54.8PJ, 2019: 15.2PJ).
Goal: Identify 2,650GWh of renewable opportunities to transition away from baseload thermal generation
• Genesis' Future-gen Strategy presents a pathway to economically displace baseload thermal generation with renewable alternatives, with a long-term goal of an additional 2,650GWh of incremental renewables development.
• Genesis has partnered with Tilt Renewables to buy the entire output of Waipipi Wind Farm (133MW, 450GWh per annum) for 20 years. This will enable a reduction of 250,000 tonnes of carbon per annum.
• Genesis is currently evaluating a number of additional geothermal, solar and wind generation opportunities to reduce its carbon footprint.
Future-gen
More renewables
Future-gen can be broken down into three key focus areas:
Genesis will actively seek new technologies that could contribute to a more renewable future. Genesis supports Government initiatives exploring advances in energy, such as hydrogen. We are also driving efficiencies across our generation fleet.
As transport and industrial heating sectors look to electrify in the coming years, wind, solar and geothermal projects will meet the increased demand with affordable, renewable generation.
Manage the transition
Genesis is working to mitigate our existing emissions through partnerships such as Drylandcarbon, a partnership between Genesis, Contact Energy, Z Energy and Air New Zealand. This partnership will establish forests that will help offset carbon emissions from the partner companies.
New technologies
Genesis’ Future-gen strategy identifies renewable opportunities to transition away from baseload thermal generation, while seeking to ensure that reliable and affordable electricity continues to enable electrification.
Genesis’ partnership with Tilt Renewables for the $277 million, 133MW Waipipi Wind Farm, is currently under construction and scheduled to be operational in the second half of FY21. This demonstrates the Company’s ongoing commitment to proactively
displace its baseload thermal generation with new renewable generation.
Genesis will buy Waipipi’s entire output of zero emissions, renewable electricity, and it is anticipated that this will displace about 20 per cent of the Company’s baseload thermal generation.
The Company is also considering other renewable opportunities, including new solar, wind and geothermal generation projects.
The announcement of the closure
of the Tiwai Point aluminium smelter in Southland is an opportunity for New Zealand to accelerate the electrification of industrial processes. It also removes a layer of market uncertainty and allows for clearer long-term planning.
This surplus of renewable energy will accelerate our Future-gen strategy, which in the long term will lead to thermal generation displacement. This also falls in line with our 2030 coal commitments (see 'Metrics and Targets' on page 20).
1. StrategyHe rautaki
2. Metrics and TargetsNgā Whāinga
M E T R I C S A N D T A R G E T SS T R A T E G Y
For
per
sona
l use
onl
y
22G E N E S I S A N N U A L R E P O R T 2 0 2 021 G E N E S I S A N N U A L R E P O R T 2 0 2 0
2. Metrics and TargetsNgā Whāinga
Goal:Create at least two new products that help customers make sustainable choices by 2020
• Genesis’ customer engagement app, EnergyIQ, allows users to forecast their energy usage over seven days (based upon machine learning algorithms) so they can adjust their energy use accordingly.
• EnergyIQ provides ‘Energy Saving Tips’ and home comparison functionality: snippets of advice that help users be more energy efficient in their homes, reducing their power bills and their carbon footprints.
• Genesis launched a new feature in EnergyIQ – EcoTracker, which allows users to view New Zealand’s electricity generation emissions in real time. This enables customers to make decisions on when best to perform energy intensive tasks, such as running dryers and dishwashers. As of May it had 55,000 unique users.
• Genesis will announce new tools in FY21 to ensure suppliers that work with Genesis are committed to operating in sustainable ways.
Goal:To support a more sustainable New Zealand, we need to inspire the energy innovators of tomorrow
• Genesis will also encourage low-carbon public transport use as part of its new Auckland office in Wynyard (no staff car parking will be available), a building which has also been designed to the highest green/sustainability standards, including its own solar power management and battery system run by Genesis.
• Genesis has invested 40 per cent into Zilch EV car share to encourage zero emissions electric car sharing. As part of the new Auckland office (see page 10), Zilch will be made available to all businesses in the Wynyard Quarter. This encourages Genesis staff and other companies in the area to make use of zero emissions transport options and leave their fossil fuel-powered vehicles at home.
• Genesis also helps manage Emirates Team New Zealand's America’s Cup base as official energy partner, building and managing its roof-based solar panels and battery system. This is the first install of curved solar panels in New Zealand (see page 9).
• Genesis has a partnership with Air New Zealand, Contact Energy and Z Energy called Drylandcarbon, to plant forests on marginal land to help offset carbon emissions. The fund as a whole is forecast to sequester nearly 30 million tonnes of carbon by 2050. This is Genesis’ first direct investment to meet its ETS carbon obligations. The Company is continually evaluating new opportunities to engage the carbon market.
Goal:Caring for water and wildlife
• Working in partnership with iwi on projects that positively influence waterways and their ecosystems.
• Engaging with Genesis customers to raise awareness of Whio and the importance of all New Zealanders playing a role in predator control efforts. Whio breeding pairs have risen by 151 per cent since the beginning of the partnership in 2011.
• Genesis and its partners oversaw the installation of the Whakapapa Intake passive elver pass for winter 2020. So far, the 2020 tuna/eel season was the third best year since our records began, with 2,167 elvers transferred upstream (see page 26 for more detail).
• Genesis is a member of the Climate Group’s EV100 commitment to transition its car fleet to 100 per cent electric vehicles. The goal is to transition 100 per cent of passenger vehicles to EV/hybrid by the end of FY21 and 50 per cent of commercial vehicles by 2025:
» Light vehicles: Genesis had originally committed to achieving this by the end of 2020 but this target will not be reached due to the lack of EV/hybrid ute options in New Zealand. The Company currently has 42 EV/hybrids in its light fleet (18 Full EV and 24 Hybrid), yet still needs to transition eight light passenger vehicles and aims to do this by the end of calendar year 2020.
» Heavy vehicles: Genesis currently has four hybrid LPG trucks and a further three available shortly. Genesis will begin testing full EV trucks in 2021.
Goal:Transition the Company vehicle fleet to electric vehicles
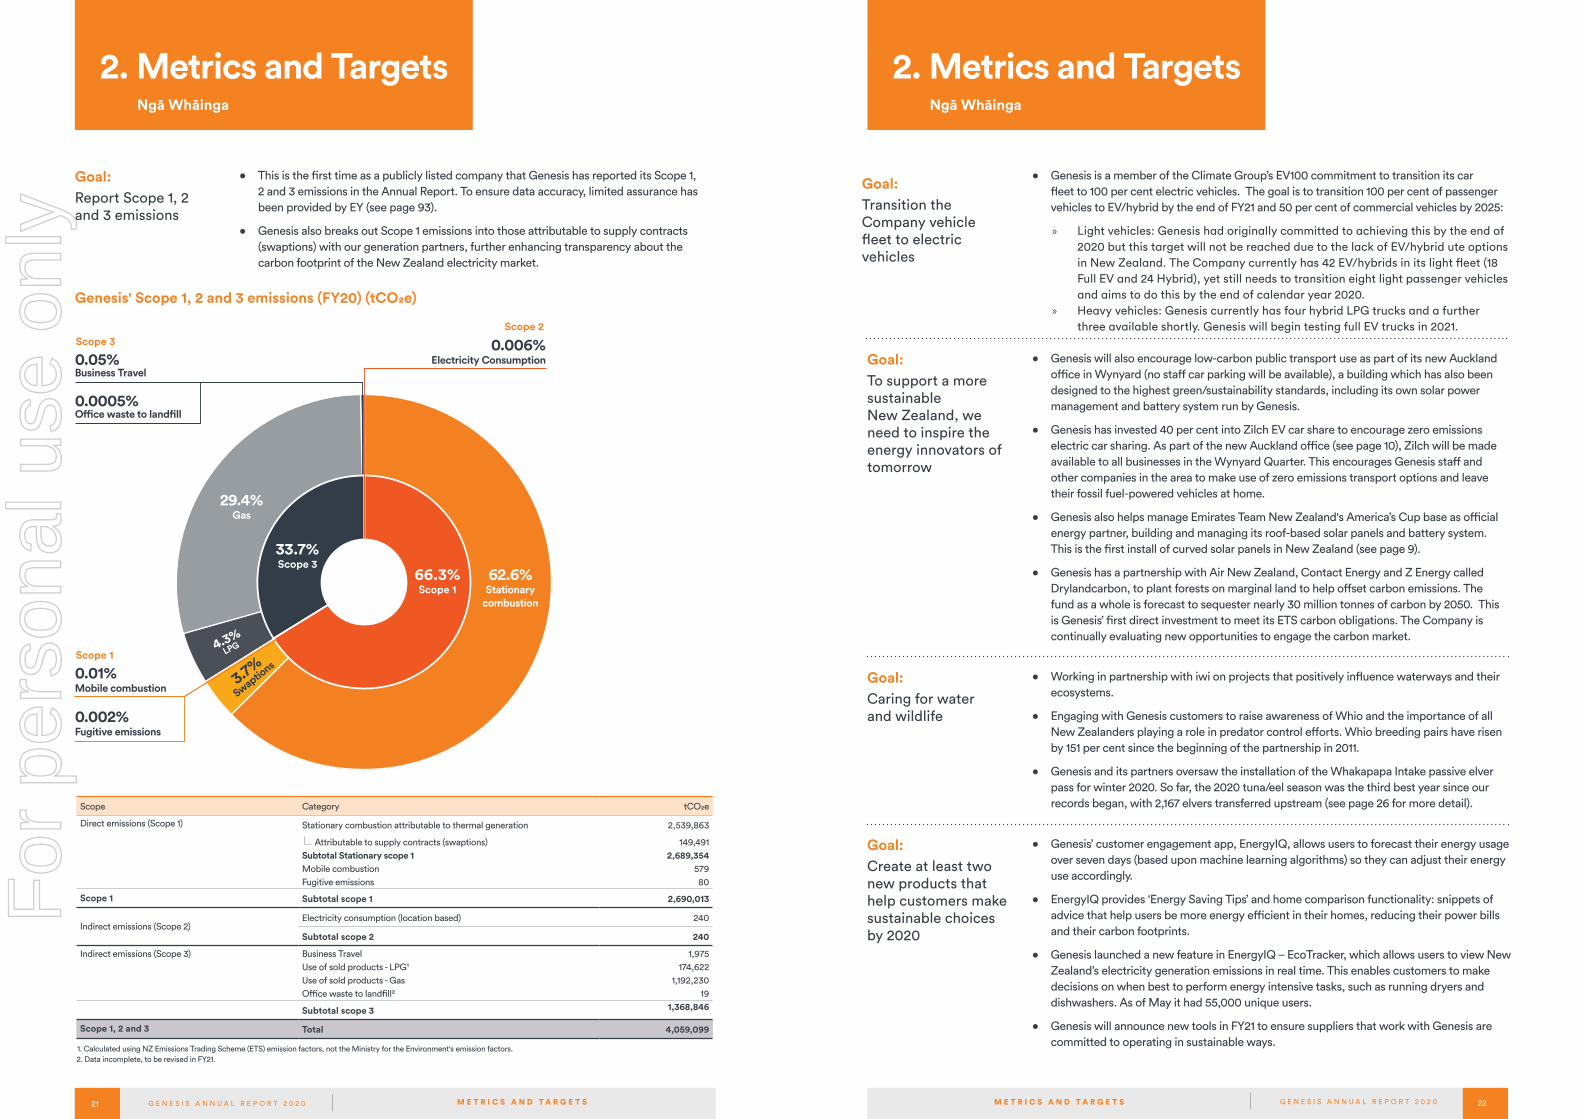
Goal:Report Scope 1, 2 and 3 emissions
• This is the first time as a publicly listed company that Genesis has reported its Scope 1, 2 and 3 emissions in the Annual Report. To ensure data accuracy, limited assurance has been provided by EY (see page 93).
• Genesis also breaks out Scope 1 emissions into those attributable to supply contracts (swaptions) with our generation partners, further enhancing transparency about the carbon footprint of the New Zealand electricity market.
2. Metrics and TargetsNgā Whāinga
Scope Category tCO2e
Direct emissions (Scope 1) Stationary combustion attributable to thermal generation 2,539,863
Attributable to supply contracts (swaptions) Subtotal Stationary scope 1 Mobile combustion Fugitive emissions
149,491 2,689,354
57980
Scope 1 Subtotal scope 1 2,690,013
Indirect emissions (Scope 2)Electricity consumption (location based) 240
Subtotal scope 2 240
Indirect emissions (Scope 3) Business Travel Use of sold products - LPG¹ Use of sold products - Gas Office waste to landfill²
1,975174,622
1,192,230 19
Subtotal scope 3 1,368,846
Scope 1, 2 and 3 Total 4,059,099
66.3%Scope 1
Scope 2
33.7% Scope 3
62.6% Stationary
combustion
3.7%
Swaptions
4.3%
LPG
29.4% Gas
0.01% Mobile combustion
0.002% Fugitive emissions
Scope 1
0.006% Electricity Consumption0.05%
Business Travel
0.0005% Office waste to landfill
Scope 3
Genesis' Scope 1, 2 and 3 emissions (FY20) (tCO2e)
M E T R I C S A N D T A R G E T S
2. Data incomplete, to be revised in FY21.1. Calculated using NZ Emissions Trading Scheme (ETS) emission factors, not the Ministry for the Environment's emission factors.
M E T R I C S A N D T A R G E T S
For
per
sona
l use
onl
y
24G E N E S I S A N N U A L R E P O R T 2 0 2 023 G E N E S I S A N N U A L R E P O R T 2 0 2 0
He mana whakahaere
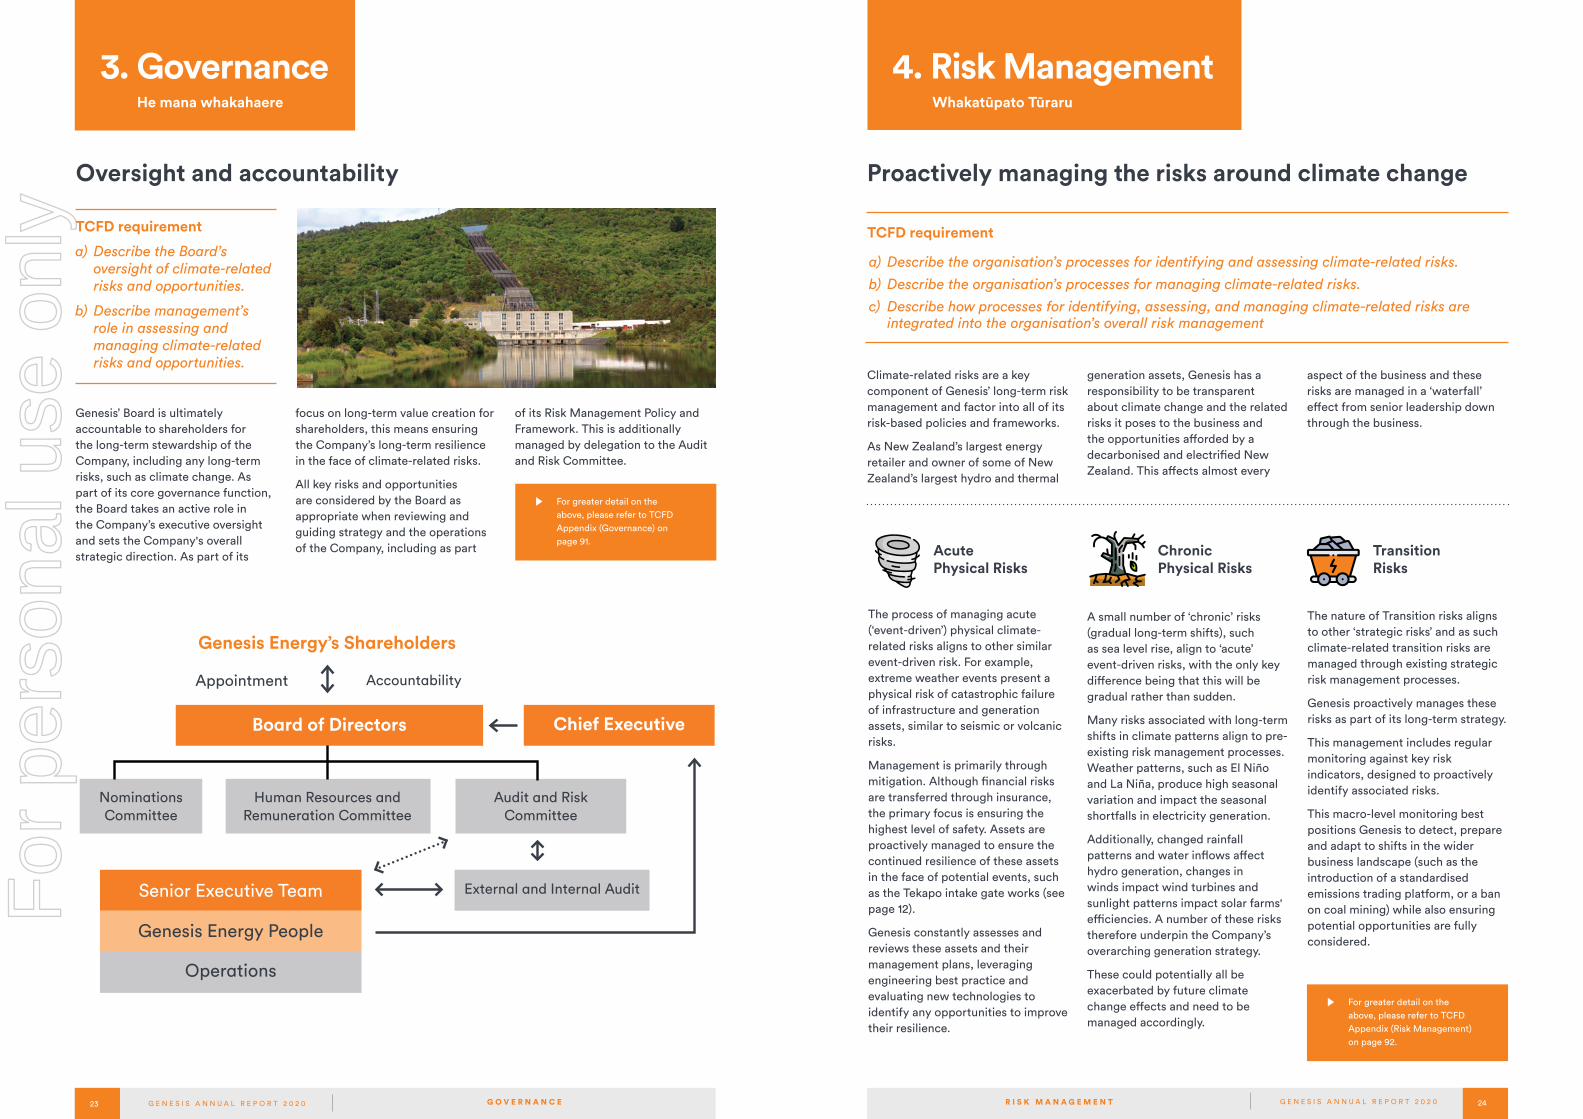
a) Describe the Board’s oversight of climate-related risks and opportunities.
b) Describe management’s role in assessing and managing climate-related risks and opportunities.
Genesis’ Board is ultimately accountable to shareholders for the long-term stewardship of the Company, including any long-term risks, such as climate change. As part of its core governance function, the Board takes an active role in the Company’s executive oversight and sets the Company's overall strategic direction. As part of its
Genesis Energy’s Shareholders
Appointment Accountability
Board of Directors
NominationsCommittee
Audit and RiskCommittee
Human Resources and Remuneration Committee
External and Internal AuditSenior Executive Team
Genesis Energy People
Operations
Chief Executive
focus on long-term value creation for shareholders, this means ensuring the Company’s long-term resilience in the face of climate-related risks.
All key risks and opportunities are considered by the Board as appropriate when reviewing and guiding strategy and the operations of the Company, including as part
of its Risk Management Policy and Framework. This is additionally managed by delegation to the Audit and Risk Committee.
TCFD requirement
Proactively managing the risks around climate change
a) Describe the organisation’s processes for identifying and assessing climate-related risks.
b) Describe the organisation’s processes for managing climate-related risks.
c) Describe how processes for identifying, assessing, and managing climate-related risks are integrated into the organisation’s overall risk management
Climate-related risks are a key component of Genesis’ long-term risk management and factor into all of its risk-based policies and frameworks.
As New Zealand’s largest energy retailer and owner of some of New Zealand’s largest hydro and thermal
Acute Physical Risks
The process of managing acute (‘event-driven’) physical climate-related risks aligns to other similar event-driven risk. For example, extreme weather events present a physical risk of catastrophic failure of infrastructure and generation assets, similar to seismic or volcanic risks.
Management is primarily through mitigation. Although financial risks are transferred through insurance, the primary focus is ensuring the highest level of safety. Assets are proactively managed to ensure the continued resilience of these assets in the face of potential events, such as the Tekapo intake gate works (see page 12).
Genesis constantly assesses and reviews these assets and their management plans, leveraging engineering best practice and evaluating new technologies to identify any opportunities to improve their resilience.
Chronic Physical Risks
A small number of ‘chronic’ risks (gradual long-term shifts), such as sea level rise, align to ‘acute’ event-driven risks, with the only key difference being that this will be gradual rather than sudden.
Many risks associated with long-term shifts in climate patterns align to pre-existing risk management processes. Weather patterns, such as El Niño and La Niña, produce high seasonal variation and impact the seasonal shortfalls in electricity generation.
Additionally, changed rainfall patterns and water inflows affect hydro generation, changes in winds impact wind turbines and sunlight patterns impact solar farms' efficiencies. A number of these risks therefore underpin the Company’s overarching generation strategy.
These could potentially all be exacerbated by future climate change effects and need to be managed accordingly.
Transition Risks
The nature of Transition risks aligns to other ‘strategic risks’ and as such climate-related transition risks are managed through existing strategic risk management processes.
Genesis proactively manages these risks as part of its long-term strategy.
This management includes regular monitoring against key risk indicators, designed to proactively identify associated risks.
This macro-level monitoring best positions Genesis to detect, prepare and adapt to shifts in the wider business landscape (such as the introduction of a standardised emissions trading platform, or a ban on coal mining) while also ensuring potential opportunities are fully considered.
TCFD requirement
generation assets, Genesis has a responsibility to be transparent about climate change and the related risks it poses to the business and the opportunities afforded by a decarbonised and electrified New Zealand. This affects almost every
3. Governance
Oversight and accountability
aspect of the business and these risks are managed in a ‘waterfall’ effect from senior leadership down through the business.
For greater detail on the above, please refer to TCFD Appendix (Risk Management) on page 92.
For greater detail on the above, please refer to TCFD Appendix (Governance) on page 91.
4. Risk Management Whakatūpato Tūraru
G O V E R N A N C E R I S K M A N A G E M E N T
For
per
sona
l use
onl
y

26G E N E S I S A N N U A L R E P O R T 2 0 2 025 G E N E S I S A N N U A L R E P O R T 2 0 2 0
Ko te iwi, te hapori me ngā hunga hourua
Genesis people make the greatest developmental strides through actively identifying role moves that would provide their desired career development. Genesis has now achieved and exceeded its goal of 40 per cent of roles filled through internal mobility.
Genesis facilitates internships each year, with a number of interns progressing into permanent work at the end of their internship. As a principal partner of TupuToa, it hosts five to six Māori and Pasifika interns each year.
Genesis wins HRD Employer of Choice Award 2020Genesis has been named a recipient of the HRD Employer of Choice Award 2020, which ranks employers in terms of overall employee experience.
HRD invited submissions from companies across New Zealand,
People, Community and Partnerships
Genesis has passed a number of significant milestones in 2020, reinforcing our goal to be the most desirable place to work in New Zealand.
and Genesis was recognised as one of the best places to work in New Zealand.
Genesis Inclusion CouncilIn 2020 Genesis launched the Inclusion Council, with 15 volunteers leading our events and cultural competencies. This group is empowered to take ideas from across the business and provide opportunities to celebrate milestones that represent our diversity and help us navigate closer towards our inclusive workplace goals.
We believe that our diversity makes us stronger, more capable and more innovative and by striving for an inclusive culture, we can ensure everyone feels valued and supported, with a sense of belonging and contribution.
Genesis Genies awardsIn 2019 Genesis launched ‘The Genies’, a recognition channel and awards night for recognising individuals and teams who live Company values and behaviours. More than 500 nominations were received in the inaugural year, with 100 award-winning finalists celebrated at an awards night.
P E O P L E , C O M M U N I T Y A N D P A R T N E R S H I P S
Tuna elvers at WhakapapaWe value our iwi relationships and acknowledge the important role mana whenua have as kaitiaki of the natural resource we use to generate electricity. Despite some COVID-19 setbacks, we continue to proudly partner with iwi and hapū to collectively seek to mitigate and manage any impacts of our activities and enhance ecological integrity.
Over the last 12 months the partnership with Ngāti Hikairo has seen the Whakapapa Intake passive tuna (eel) elver pass installed and ready for winter 2020.
• The 2020 elver season was the third best year on record, with 2,167 elvers transferred upstream, above intake structures.
• 37 tuna heke (all long fin) were transferred from Wairehu Drum Screen to Whanganui River headwaters, with sizes ranging from 0.67kg to 6.81kg. This is a better than average season, based on eight years of data.
Tekapo Contestable Fund Genesis has been supporting the local Tekapo community since purchasing the Tekapo Power Scheme in 2011. In 2020 the Genesis Tekapo Contestable Fund allocated nearly $50,000 to the following local groups:
• Aoraki Mackenzie International Dark Sky Reserve
• High Country Medical Trust
• Lake Tekapo Community Development Project
• Lake Tekapo School
• Tekapo Trails Society
• Lake Tekapo Bright Stars Early Childhood Learning Centre
The same fund will be available in early 2021.
Environmental and iwi partnershipsEnhancing the communities we live in.
Moawhango willow control projectOver the past 15 years Genesis has worked with the community to clear 20kms of willow from the Moawhango River and some tributaries, one of the nation’s most successful willow clearance programmes.
Aoraki BoundGenesis has been a supporter of Aoraki Bound for nine years, and it is a key sponsorship for the team at Tekapo Power Scheme. The course is a 20-day cultural and personal journey, developed and delivered by Outward Bound and Ngāi Tahu. It includes the traditional physical focus of Outward Bound, as well as the cultural components of Te Ao
Māori and Ngāi Tahu tikanga. As part of this sponsorship Genesis sends one participant on the course each year. This year's participant was Scott Westbury, Genesis' General Manager, Power Schemes.
Tasman River protection wins Cawthron Institute AwardGenesis has partnered with the Department of Conservation, local landowners and others on Project River Recovery, with the goal of turning the Tasman River into a predator-free zone. The project has been in existence for more than 15 years and led to the resurgence in native bird species such as the kāki/black stilt. It won the award for best river story at the Cawthron Institute's New Zealand River Awards.
P E O P L E , C O M M U N I T Y A N D P A R T N E R S H I P S
Whio Forever programmeGenesis and the Department of Conservation have been working together since 2011 to secure the future of one of our most endangered native birds, the whio (New Zealand blue duck).
In 2019/20 national breeding pairs reached 748, a growth of 23 pairs in the past year. This is an increase of 151 per cent since 2011, when the partnership began.
For
per
sona
l use
onl
y

28G E N E S I S A N N U A L R E P O R T 2 0 2 027 G E N E S I S A N N U A L R E P O R T 2 0 2 0
Genesis accredited as Living Wage EmployerGenesis has been accredited as a Living Wage Employer, the first electricity generator in New Zealand to do so.
What is the criteria for achieving Accredited Living Wage Employer status? • All directly employed workers are on the current
Living Wage prior to accreditation.
• All indirectly paid workers employed by contractors, delivering a service to the business/organisation on a regular and ongoing basis, are either on the current Living Wage or on milestones agreed as part of the license.
• Employers have provided workers with access to a union.
• Employees’ terms and conditions have not been reduced in order to meet the current Living Wage rate. An example of this may be the reduction of hours or other benefits in order to pay for the cost of delivering the Living Wage.
“Genesis Energy was our first major customer to initiate a move to the Living Wage. We were subsequently awarded a significant new contract with an international firm who saw value in this move by Matrix Security with Genesis Energy, and who then also incorporated the Living Wage standard across their service agreement.” Scott Carter, CEO, Matrix Security
The Living Wage is calculated independently each year by the New Zealand Family Centre. It is the hourly rate a worker needs to pay for life’s necessities and actively participate in the community. It reflects the basic expenses of workers and their families, such as food, transportation, housing and childcare.
Achieving Living Wage accreditation has been an important goal for Genesis, aimed at contributing to stronger communities and enhancing the wellbeing of our people. Genesis already pays its full-time employees well above the current Living Wage, which is set at $21.15 per hour. Through the Living Wage accreditation programme Genesis is working with several of its contractors to ensure those that provide regular and ongoing services to us will also pay their employees no less than the Living Wage.
As part of the Pou Limited agreement, all staff and Pou Limited contractors receive at least the Living Wage working at Huntly Power Station.
Another of Genesis' key contractors, Matrix Security, now also pays their staff the Living Wage, which has
P E O P L E , C O M M U N I T Y A N D P A R T N E R S H I P S
In recognition of the enduring partnership between Waahi Paa, Te Kauri, Kaitumutumu, Te Ohaaki, Taupiri, Matahuru Marae, Waahi Whaanui Trust, the Matawhaanui Board (as a representative of the collective marae) and Genesis, discussions were entered into and led to the establishment of POU Limited, a company focused on providing quality facilities management services through the employment of the local people. This activates social benefit in a meaningful way in support of the community of Raahui Pookeka (Huntly).
The kupu (word) POU literally means ‘a stake’. Its meaning draws from the name Raahui Pookeka (Huntly) and ngaa taonga (the carvings) surrounding the Huntly Power Station site (Te Whare Hiko).
Raahui Pookeka as the original name of Huntly (1869) was bestowed during times of famine and inter-tribal disputes. Waikato chief, Te Putu, intervened and placed a 'raahui' (restriction) on the eel food source, with a 'pookeka' (stake) used as an indicator of when the 'raahui' would be lifted.
Ngaa taonga surrounding Te Whare Hiko (Huntly Power Station), unveiled in 1990 and 1998 respectively, symbolises unity with the community and story of the people of Raahui Pookeka and Waikato-Tainui.
The POU name was given by Huirama Matatahi, a board member of Matawhaanui and Chair of Waahi Whaanui Trust and Waahi Marae. His gift draws on the legacy of Queen Te Ataiirangikaahu and her vision of unity with Te Whare Hiko (the Huntly Power Station).
This work includes grounds maintenance, cleaning and general labour supply, with a clear mandate to partner together on additional employment opportunities and workstreams as the relationship grows and matures.
POU Limited: A new way of partnering with iwiIn November 2019 Genesis announced the establishment of, and partnership with, a marae-owned entity called POU Limited, to undertake contracted facilities maintenance activities at Huntly Power Station.
Key aspirations were defined as:
• Acknowledging the history of Raahui Pookeka (Huntly), the legacy of its people and respect of the leadership across the township and the wider community.
• Developing a model that displayed a long-term commitment to leadership, partnership, that is sustainable over time while ensuring ongoing collaboration across the community.
• Developing meaningful career pathways for the people of Raahui Pookeka (Huntly) and employing locally as a priority.
• Supporting the building of resilience in the local community.
• POU to develop and grow to serve other companies and organisations.
P E O P L E , C O M M U N I T Y A N D P A R T N E R S H I P S
• Partnering and operating as 'one entity' onsite at Huntly Power Station, based on principles of unity of purpose, shared aspirations and respect.
Genesis was formally accredited as a Living Wage supplier on 1 April 2020. All staff were being paid the Living Wage from November 2019.
Genesis and POU Limited have also worked together to develop a programme of cultural induction for all on-site staff in recognition of the cultural significance of the area in which we operate and out of respect for the land and its peoples.
For Genesis, we seek that our workforce and the way in which we think and act as a business is deeply respectful of, and in better alignment with, tangata whenua.
enabled them to win other contracts.
Paying the Living Wage is the right thing to do for our people and our communities, and Genesis is committed to making a positive difference in the lives of the people who work for and with us.
For
per
sona
l use
onl
y

30G E N E S I S A N N U A L R E P O R T 2 0 2 029 G E N E S I S A N N U A L R E P O R T 2 0 2 0
School-gen
For 14 years School-gen has been helping kids engage with science, technology, engineering and maths (STEM) while also teaching them about sustainability by installing solar panels on school roofs. It now engages with 56 per cent of schools, or 1,417 schools nationwide.
School-gen ran its first Super Teacher competition to find New Zealand's best STEM teacher. 213 teachers were nominated, and winners Penny Chatfield of Te Mata Primary and Bernadette Judeel of Liston College won a trip to the Space Exploration Education Conference in Houston, Texas.
P E O P L E , C O M M U N I T Y A N D P A R T N E R S H I P S
School-gen + Mind Lab Kids join forces to beat the lockdown
Mind Lab Kids is an award-winning science, technology, engineering and math (STEM) online platform where kids can do challenges ranging from creating stop motion videos to building a drawbridge or making a solar pizza oven.
The partnership saw primary school kids from all over New Zealand gain free access to fun experiments, challenges and lightbulb moments to get them creating and learning from home.
Developed by and for educators, kids have access to a safe online space to create, innovate and share their creations.
The School-gen partnership offered families at home some support during lockdown, while also encouraging kiwi kids' interest in STEM through a series of fun activities and challenges.
Over 8,000 Kiwi families took up the opportunity to register and use the resources over the time children were out of school in April and May, with many posting pictures and videos of their experiments on the Mind Lab Kids website.
Genesis School-gen partnered with Mind Lab Kids to help put kiwi kids’ energy to good use during COVID-19 lockdown and the 2020 winter
“I’m incredibly excited to be partnering with Genesis to bring Mind Lab Kids to the homes of all Kiwi kids. Being able to help young students develop their creative and tech capability from their dining room table makes me immensely proud. Thanks to Genesis and their commitment to education, we can bring learning to homes across the country, combining education and fun together in one platform.”
Frances Valintine, Founder, Mind Lab Kids
customers saying the Mind Lab Kids partnership makes me feel good about being with Genesis.¹
%
1. Purpose Business Campaign Tracking May 2020
School-gen TrustGenesis School-gen Trust is an independent charitable organisation that allocates STEM funding and resources to schools. The Trust has provided $180k of equipment to 15 schools, supporting around 6,000 students.
In response to the COVID-19 lockdown, the Trust released $80k of funding for the purchase and donation of 200 Chromebooks to students who were at risk of falling behind if they could not access classes or digital course materials online.
Supporting communities in needGenesis supported a number of curtain banks nationwide to help keep vulnerable kiwis homes warm during winter. In FY20, this included the Sustainability Trust (supporting 493 Wellington families) and Christchurch's Community Energy Action Trust (600 households). Genesis also supports Duffy Books in Homes, providing books to Huntly Primary School (616) and Huntly West School (393).
In late 2019 Genesis introduced new care packages to support vulnerable customers and those suffering hardship. These were put to the test early under COVID-19. Within 24 hours of Level 4 being declared, Genesis had its contact centres teams up and running at full capacity from home, fielding calls from customers facing financial uncertainty and supporting them wherever possible.
Genesis created a dedicated service channel for vulnerable customers to offer tailored payment plans so customers' debt doesn’t get out of control. Genesis also pledged a $250,000 care package, working with partners to raise awareness of the support available through government and budgeting advisory services. This helps keep customers' lights on, and their homes warm.
The vulnerable care programme has been a big success and the lessons learned will strengthen the programme for the future, as Genesis expects the ‘long-tail’ of COVID-19’s effects to resonate through FY21.
care package
New vulnerable care package supports kiwis through tough times
For
per
sona
l use
onl
y
32G E N E S I S A N N U A L R E P O R T 2 0 2 031 G E N E S I S A N N U A L R E P O R T 2 0 2 0
Pay Equity Gap
Median Pay Gap for equal value of work (total pay)
%%Median Pay Gap for equal value of work (base salary only)
Leadership Progression Gap
43% females
57% males
Senior leadership roles Total workforce
Total Gender GapWhen comparing median total hourly wages, women earn $0.63 for every $1 that men earn. Women's median total hourly wage is 37.2% lower than mens'.
50% females
50% males
As at June 2020Pay Equity GapThe Pay Equity Gap measures whether males and females at Genesis are paid the same for performing 'equal value' work. The Company uses the Hay Job Evaluation methodology to standardise its approach to job sizing and reward. It then audits pay every six months to look for any gaps by grouping the data and analysing it. It’s important this is done regularly as people join the organisation all year round.
In 2020 Genesis now measures equal value of work using total pay so we can include potential earnings between males and females. The first measure of this median gap is 1.9 per cent, which is analysed thoroughly to ensure there are no unexplainable reasons for the difference when including total pay elements, such as bonuses or car allowances.
Leadership Progression Gap supporting females to advanceThe Leadership Progression Gap measures the progress being made in advancing females into senior leadership roles by calculating leadership balances. We count the number of males and females in the most senior positions; 50 per cent of people in these most senior positions are female.
Supporting females to progress and advance at Genesis is an important focus. Recent talent programmes have accelerated senior females into new and larger roles for their continued careers. Enhanced parental leave rights, exercised by both genders, flexible work and leave policies and wellbeing programmes have all been put in place to help women flourish into leadership positions. Since the introduction of such policies Genesis has more than
What makes up the Gender Gap reporting for Genesis?
doubled the return-to-work rates and the efforts to help women flourish has had knock-on effects for men too.
Total Gender Gap The Total Gender Gap is a measure of the median pay between males and females regardless of the nature of work across the Company. For Genesis the Total Gender Gap,
as measured by the difference in median pay between all males and females, is 37.2 per cent.
This Total Gender Gap is not due to any inequity in pay. It is driven by a greater proportion of men in roles such as engineering, technology and LPG delivery and a larger number of women who work in customer service and administration roles.
"Understanding what really drives the Gender Gap is the first step towards developing actions to address it, which will ultimately create more equitable opportunities for women and men."
Marc England Genesis CEO, Champion for Change
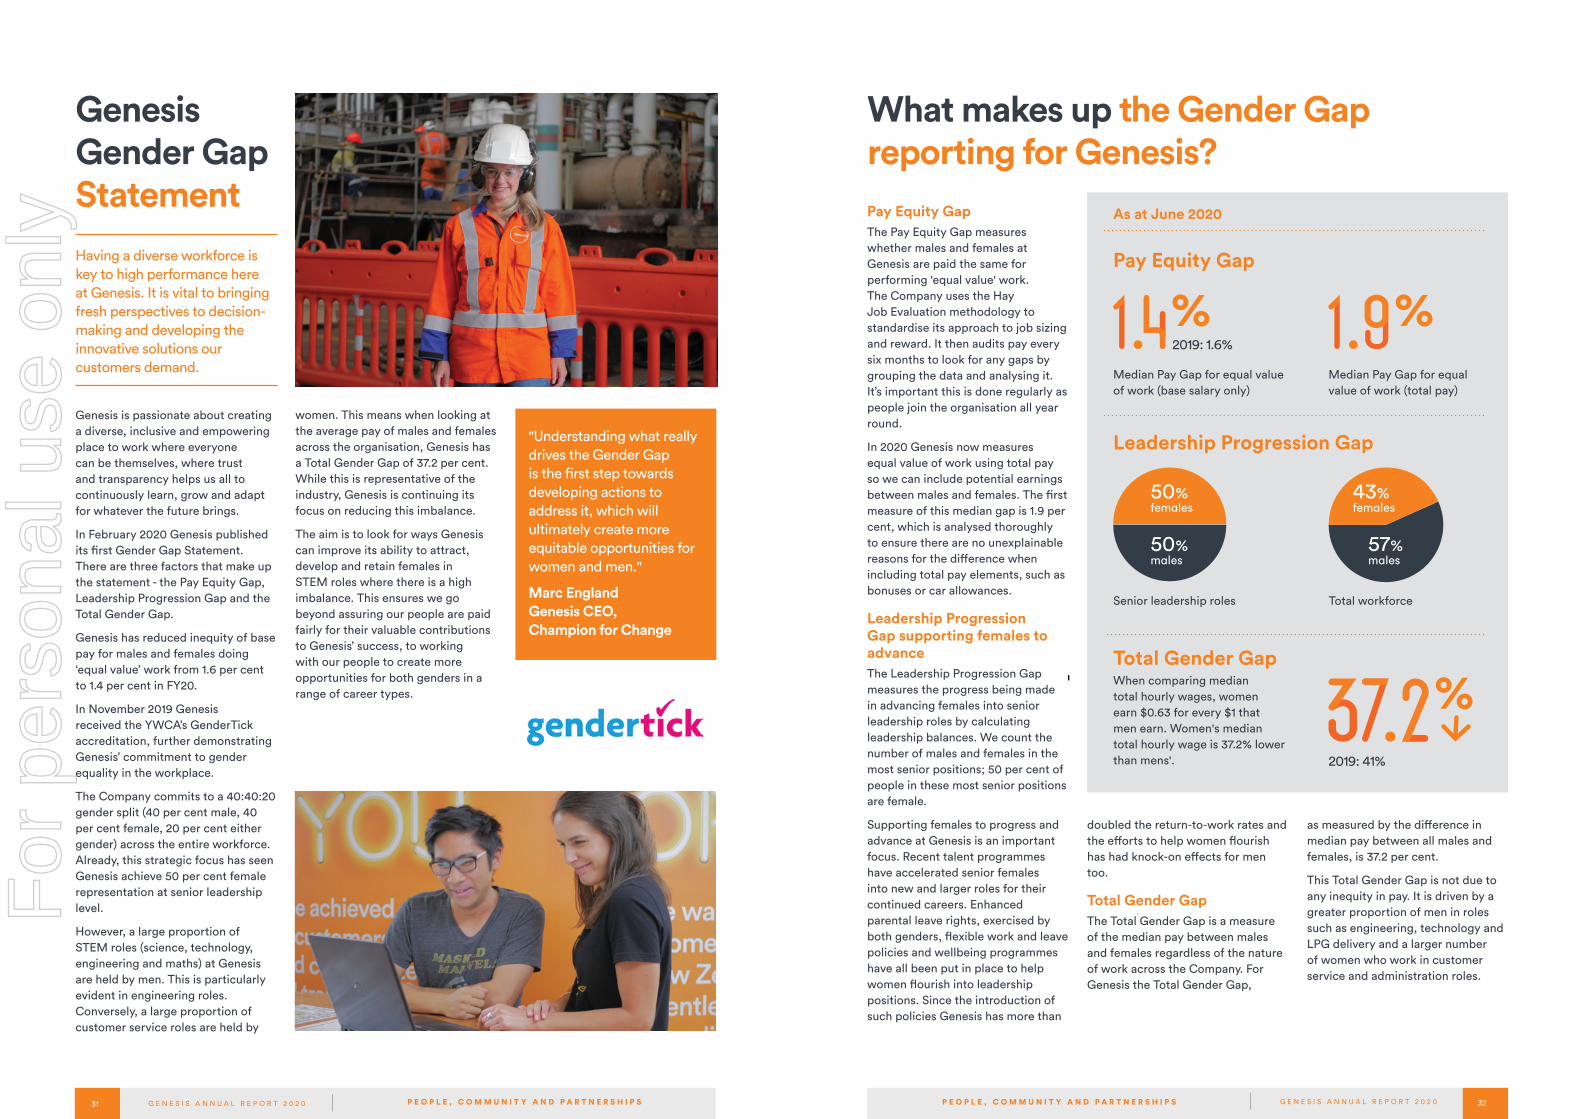
women. This means when looking at the average pay of males and females across the organisation, Genesis has a Total Gender Gap of 37.2 per cent. While this is representative of the industry, Genesis is continuing its focus on reducing this imbalance.
The aim is to look for ways Genesis can improve its ability to attract, develop and retain females in STEM roles where there is a high imbalance. This ensures we go beyond assuring our people are paid fairly for their valuable contributions to Genesis’ success, to working with our people to create more opportunities for both genders in a range of career types.
Having a diverse workforce is key to high performance here at Genesis. It is vital to bringing fresh perspectives to decision-making and developing the innovative solutions our customers demand.
Genesis is passionate about creating a diverse, inclusive and empowering place to work where everyone can be themselves, where trust and transparency helps us all to continuously learn, grow and adapt for whatever the future brings.
In February 2020 Genesis published its first Gender Gap Statement. There are three factors that make up the statement - the Pay Equity Gap, Leadership Progression Gap and the Total Gender Gap.
Genesis has reduced inequity of base pay for males and females doing ‘equal value’ work from 1.6 per cent to 1.4 per cent in FY20.
In November 2019 Genesis received the YWCA’s GenderTick accreditation, further demonstrating Genesis’ commitment to gender equality in the workplace.
The Company commits to a 40:40:20 gender split (40 per cent male, 40 per cent female, 20 per cent either gender) across the entire workforce. Already, this strategic focus has seen Genesis achieve 50 per cent female representation at senior leadership level.
However, a large proportion of STEM roles (science, technology, engineering and maths) at Genesis are held by men. This is particularly evident in engineering roles. Conversely, a large proportion of customer service roles are held by
Genesis Gender Gap Statement
P E O P L E , C O M M U N I T Y A N D P A R T N E R S H I P SP E O P L E , C O M M U N I T Y A N D P A R T N E R S H I P S
%2019: 41%
2019: 1.6%
For
per
sona
l use
onl
y

34G E N E S I S A N N U A L R E P O R T 2 0 2 033 G E N E S I S A N N U A L R E P O R T 2 0 2 0
Closing the Total Gender Gap will take time and require a concerted effort across a number of sectors. Genesis is doing a range of things to better attract, develop and retain females as part of its Diversity and Inclusion plans which will, over time, reduce the Total Gender Gap.
What Genesis is doing to close the Gender Gap
Pay Equity Gap Genesis measures and closely monitors gender pay information and focuses on inclusion in its recruiting practices.
• Since 2017 Genesis has reported its gender pay information as part of its diversity, inclusion and talent updates to Genesis’ Human Resources and Remuneration Committee throughout the year.
• In 2018 Genesis changed its recruitment practices, eliminating questions that ask for previous salary information, and began to review all advertisements to ensure inclusive language was followed.
• The Genesis recruitment team are skilled at challenging and coaching hiring managers when they notice unconscious bias may be influencing recruitment decisions.
Leadership Progression Gap
Genesis is building an inclusive environment for everyone to succeed and for females to advance.
• Genesis drives development of senior female leaders by providing access to external learning programmes and internal mobility options.
• In July 2018 Genesis updated its parental leave policy to better support new parents regardless of gender. Genesis tops up paid parental leave for primary caregivers for 12 weeks, has a four-week ease-back-to-work period of full pay/reduced hours and provides two weeks paid partner leave.
• Genesis' flexible working and flexible leave policies were updated in 2018 to ensure everyone had access to the support and options they need to balance work with their non-work commitments.
• Managers who hire senior leaders have to work with gender-balanced shortlists.
Total Gender Gap
Genesis is inspiring more girls to take up STEM (science, technology, engineering and maths) subjects at school and looking at ways to be more female-friendly in its operational areas.
• The Genesis School-gen programme is aimed at encouraging the uptake of STEM subjects in schools and getting STEM equipment into the hands of young New Zealanders.
• The Women in Operations network enables more than 50 females in Genesis' operational areas to come together and expand their personal development by providing access to cross-functional mentoring, role models and practical learning.
Executive commitmentsHaving a diverse workforce is key to high performance here at Genesis. The Genesis Executive team will continue to report its Gender Pay Gap information in both the Interim and Annual Reports. It strives to identify pathways for women to transition into STEM careers and support women at Genesis in their development.
Each leader will seek opportunities to promote and support women in their business units, ensuring they are applying an inclusive lens to activities under way. Genesis will also identify and take opportunities to talk in schools and universities about STEM careers.
P E O P L E , C O M M U N I T Y A N D P A R T N E R S H I P S
attra
ct develop
retain
Genesis is a proud sponsor of Emirates Team New Zealand
For
per
sona
l use
onl
y

36G E N E S I S A N N U A L R E P O R T 2 0 2 035 G E N E S I S A N N U A L R E P O R T 2 0 2 0
Your Board of Directors
C O N TAC T T H E B OA R D
If you have a comment or question, please email the Board on: [email protected]
Barbara Chapman joined the Genesis Board in May 2018 and assumed the role of Chairman in October 2018.
Barbara is also the Chair of NZME and a director of Fletcher Building, and is the deputy-Chair of The New Zealand Initiative. Barbara is the Chair of the APEC CEO Summit Committee and co-Chair of the APEC Business Leadership Group.
Barbara served as Chief Executive and Managing Director of ASB Bank for seven years and has worked in a variety of financial services executive roles in New Zealand and Australia. She is a former Chair of Oxfam New Zealand, a former director of IAG New Zealand, has served on the Board of Supervisors for Oxfam International, and was a previous Chair of the New Zealand Equal Opportunities Trust.
Barbara was named New Zealand Herald’s Business Leader of the Year in 2017 and was named the inaugural INFINZ Diversity and Inclusion Leader in 2018.
Barbara was awarded a Companion of the New Zealand Order of Merit (CNZM) for services to business in the 2019 New Year Honours List.
Catherine Drayton BCom, LLB, FCA
Doug McKay ONZM, BA, AMP (Harvard)
C H A I R M A N
Barbara Chapman CNZM, BCom, CMInstD
Ko tō tātou poari
Y O U R B O A R D O F D I R E C T O R S
Tim Miles BA
James Moulder BA, BCA
Maury Leyland Penno BE (Hons), FEng, CMInstD
Paul Zealand MBA, BSc Mech. Eng (Hons)
Y O U R B O A R D O F D I R E C T O R S
Catherine Drayton joined the Genesis Board in March 2019. She is Chairman of the Company’s Audit and Risk Committee.
Catherine brings extensive governance experience to Genesis. She is currently the Chair of Christchurch International Airport Limited, as well as being a Director of Beca Group Limited, Southern Cross Hospitals Limited, Southern Cross Benefits Limited, and Director and Trustee of Southern Cross Medical Care Society and is a board member of The Guardians of New Zealand Superannuation.
Her former directorships include Ngai Tahu Holdings Corporation Limited, Powerbyproxi Limited and Meridian Energy Limited.
Catherine’s executive career includes working as a Senior Partner in PricewaterhouseCoopers, specialising in mergers and acquisitions, and culminated in leading Assurance and Advisory practices for Central and Eastern Europe (excluding Russia). Catherine is a Fellow of Chartered Accountants New Zealand and Australia.
Tim Miles joined the Genesis Board in November 2016 and is a member of the Company's Human Resources and Remuneration Committee and the Nominations Committee.
Tim began his career with IBM and later joined Data General Corporation, rising to Director of Marketing – Asia Pacific. He then joined Unisys Corporation in various senior executive roles before taking up roles as the Chief Executive Officer of Vodafone New Zealand, the Chief Executive Officer of Vodafone UK and the Vodafone Group Chief Technology Officer.
Upon returning to New Zealand, Tim was Managing Director of listed agricultural group PGG Wrightson before taking up a role as Chief Executive Officer of Spark Digital, playing a key role in Spark's transition to becoming New Zealand's leading digital services provider.
Tim is a Director of UDC Finance, Nyriad Limited, Chairman of Gut Cancer Foundation and ASX listed company oOh!media Limited. Tim has also served as a Director of Goodman Property and Chair on the Advisory Boards of Revera Ltd and the CCL Group.
James Moulder joined the Genesis Board in October 2018 and is a member of the Company's Audit and Risk Committee.
James has strong governance experience having held a number of non-executive Board and Advisory Board positions.
He was Chairman of the Electricity Authority’s Market Development Wholesale Advisory Group, and previously chaired the NZ Electricity Commission: Market Development Advisory Group.
James’ previous directorships include CO2 New Zealand Limited, Rodney Properties Limited and Bosco Connect. He has held executive leadership positions with Mighty River Power including leading its Mercury Energy business.
More recently James has been involved in the commercialisation of large data sets in New Zealand, Europe and the US, coupled with the development of a carbon asset management business in Australia.
Maury Leyland Penno joined the Genesis Board in 2016. She is a member of the Company's Audit and Risk Committee, and the Human Resources and Remuneration Committee.
Maury is Chair of The Education Hub, a non-profit organization and Trust Codes. She is a director and shareholder of a number of privately held companies across the food industry. She has been a Director of Spark New Zealand and Transpower New Zealand. She is a Fellow of Engineering New Zealand and a Chartered Member of the Institute of Directors. Maury worked at Fonterra from 2005 until 2016, most recently as a member of the executive team in the role of Managing Director for People, Culture and Strategy. Earlier in her career, Maury worked as a consultant with the Boston Consulting Group and as an engineer for Team New Zealand.
Paul Zealand joined the Genesis Board in October 2016 and is a member of the Company's Human Resources and Remuneration Committee and the Nominations Committee.
Paul is a professional director, currently sitting on the Boards of New Zealand Refining Company Limited and Lochard Energy.
Paul has over 40 years' international experience in the oil and gas sector.
His executive roles have included Country Chairman of Shell New Zealand and Chief Executive Officer of the upstream oil and gas business of Origin Energy in Australia.
Through these roles Paul developed skills in strategic business management, health, safety of environmental management, operational risk, and the commercial management of complex assets.
Doug McKay joined the Genesis Board in 2014 and is Chairman of the Company’s Human Resources and Remuneration Committee. He is also a member of the Company’s Nominations Committee.
Doug is Chairman of the Bank of New Zealand and the Eden Park Trust Board and has directorships with National Australia Bank (NAB), IAG New Zealand Limited and Fletcher Building Limited.
Doug began his career with Procter & Gamble, working in a number of roles both in New Zealand and overseas. He subsequently worked as Managing Director and Chief Executive roles for Lion Nathan, Carter Holt Harvey, Goodman Fielder, Sealord and Independent Liquor, where he was also Chairman.
Doug was the inaugural Chief Executive of the amalgamated Auckland Council until the end of 2013.
For
per
sona
l use
onl
y

38G E N E S I S A N N U A L R E P O R T 2 0 2 037 G E N E S I S A N N U A L R E P O R T 2 0 2 0
Chris Jewell Chief Financial Officer BE (Hons), MEM, CIMA
C H I E F E X E C U T I V E
Marc England M B A , M E n g
Marc England joined Genesis in May 2016. He is responsible for the leadership, strategic direction and management of all its business interests.
Prior to joining Genesis, Marc was Executive General Manager New Energy at AGL Energy in Australia and also previously held the role of Group Head of Strategy.
Marc has 13 years’ experience in the energy sector across three markets, having also worked at British Gas, a subsidiary of Centrica Plc, in the UK from 2007.
Earlier in his career Marc held a number of corporate finance roles at Ford Motor Company and prior to that was a Petroleum Engineer for Halliburton Energy Services in the Middle East and United States. Marc has an Master of Engineering in Mechanical Engineering and European Studies and an MBA.
James Magill Chief Digital Officer BSc (Hons), Dip Corp Finance, MBA (Melbourne/Madrid)
Matthew Osborne Chief Corporate Affairs Officer BCom, LLB
Your Executive teamKo tō tātou tira ārahi
Shaun Goldsbury Chief Trading Officer BSc
Nigel Clark Chief Operations Officer BBus (Acc), Dip Treasury Mgmt., FCPA, FAICD, CFTP (Snr)
Tracey Hickman Chief Customer Officer MA (Hons)
Nicola Richardson Chief People Officer BA (Hons)
Y O U R E X E C U T I V E T E A M Y O U R E X E C U T I V E T E A M
Chris Jewell joined the Genesis Executive in 2013 as General Manager Portfolio Management and was appointed Chief Financial Officer in 2016. In 2019 his role was expanded to Executive General Manager of Strategy. Chris is responsible for leading the Company’s strategy formulation and overseeing all finance functions, treasury, tax, risk, corporate finance, mergers and acquisitions, and investor relations. Chris brings significant senior leadership experience in the energy sector across the disciplines of markets, infrastructure investment and asset operations. Chris sat on the Electricity Authority governance board and has previously worked in the telecommunications and infrastructure sectors in the United Kingdom.
James Magill joined Genesis in October 2016 as Executive General Manager, Customer and Innovation. In 2019, his role expanded to Executive General Manager, Retail Markets. On 1 September, 2020, James takes up the role of Chief Digital Officer. James is accountable for technology and data transformation across the business. In addition, he leads the Energy Online brand and Genesis' Commercial and Industrial customers, as well as the development of energy management products and services. James brings broad experience in strategy, corporate finance, product development and originating new business opportunities to his role at Genesis. He has international energy sector experience, having worked in the United Kingdom, North America and Australia prior to joining Genesis.
Matthew Osborne joined Genesis in May 2018 as General Counsel and Company Secretary and was appointed Executive General Manager of Corporate Affairs in October that year. On 1 September, 2020, Matthew takes up the role of Chief Corporate Affairs Officer. Matthew is responsible for legal, regulatory, government relations, sustainability, community investment, communications and company secretarial functions. Having worked in a number of international markets, he brings significant experience in executing business strategy and in providing specialist risk management, commercial, legal and regulatory advice. Prior to joining Genesis, Matthew held senior legal and governance roles with the Vodafone Group in the Middle East and Ireland.
Nicola Richardson joined Genesis in 2014 as Group Manager Talent and Development. She was appointed to the Executive team to lead the Company’s People and Culture function in 2016. On 1 September, 2020, Nicola takes up the role of Chief People Officer. Nicola is responsible for the people and culture focus of Genesis, including recruitment, talent development, cultural change, Agile, property and procurement. Prior to joining Genesis Nicola held senior leadership roles in the financial services, real estate and human resource consulting sectors in the United Kingdom, Asia and New Zealand.
Nigel Clark joined Genesis in October 2016 as Executive General Manager Customer and Service Operations. In 2019, Nigel took on a new portfolio as Executive General Manager Wholesale Operations and Kupe Joint Venture. On 1 September, 2020, Nigel takes up the role of Chief Operations Officer. In this role Nigel is responsible for driving value creation from our electricity generation assets, environmental management, community relations, our Kupe Joint Venture investment and leading safety and wellness across Genesis. Nigel brings deep executive-level energy sector experience to Genesis. He has held Managing Director and Chief Financial Officer roles within Australia’s energy sector, and is motivated by the challenge of transformational change to achieve growth and sustained increases in profitability. He served on the Snowy Hydro Board as a Director from 2015 to 2019.
Shaun joined Genesis in 2013 as an analyst and has held a number of senior roles, including that of General Manager Wholesale. In 2019, Shaun was appointed to the Genesis executive team as Executive General Manager, Wholesale Markets. On 1 September, 2020, Shaun takes up the role of Chief Trading Officer. Shaun is responsible for Genesis’ electricity, gas, coal and carbon portfolio management, derivatives and spot trading, plus delivery of the Future-gen strategy. Prior to joining Genesis Shaun held roles at Trustpower and Sport Bay of Plenty. His iwi affiliations are Ngati Porou and Te Aitanga-a-Hauiti. Additionally, Shaun is a current Board member of Volleyball New Zealand.
Tracey Hickman joined the Genesis Executive Team in 2012 as General Manager Generation. In 2019, she took on a new portfolio as Executive General Manager Retail Operations. Prior to her current role, Tracey led Genesis’ Generation, Wholesale and Fuels portfolio businesses as Executive General Manager. On 1 September, 2020, Tracey takes up the role of Chief Customer Officer. Tracey is accountable for the Genesis Retail brand, LPG operations and a range of retail support functions for the whole business. She brings over 25 years of energy sector experience to the Executive team, having begun her career with the Electricity Corporation of New Zealand, managing large scale environmental reconsenting projects.
For
per
sona
l use
onl
y

Consolidated comprehensive income statementFor the year ended 30 June 2020
Note2020
$ million
Restated* 2019
$ million
Revenue A2, A3 2,591.5 2,700.7
Expenses A2 (2,235.9) (2,331.3)
Earnings before net finance expense, income tax, depreciation, depletion, amortisation, impairment, fair value changes and other gains and losses (EBITDAF)
355.6 369.4
Depreciation, depletion and amortisation A5 (209.8) (201.7)
Impairment of non-current assets B1, B3 (3.0) (4.2)
Revaluation of generation assets B1 - 4.6
Change in fair value of financial instruments F5 (0.6) (15.2)
Share of associates (1.2) (0.2)
Other gains (losses) A4 (8.8) 7.3
Profit before net finance expense and income tax 132.2 160.0
Finance revenue 0.2 0.6
Finance expense E6 (70.8) (77.7)
Profit before income tax 61.6 82.9
Income tax expense A6 (15.6) (23.8)
Net profit for the year 46.0 59.1
Other comprehensive income
Change in cash flow hedge reserve F5 24.1 (22.9)
Income tax (expense) credit relating to items above A6 (6.7) 6.4
Total items that may be reclassified to profit or loss 17.4 (16.5)
Change in asset revaluation reserve B1 - 394.6
Income tax expense relating to items above A6 - (110.5)
Total items that will not be reclassified to profit or loss - 284.1
Total other comprehensive income for the year 17.4 267.6
Total comprehensive income for the year 63.4 326.7
Earnings per share (EPS) from operations attributable to shareholders Cents Cents
Basic and diluted EPS E3 4.47 5.83
* The comparative information has been restated to reflect the adoption of a new accounting standard. Refer to the 'General information and significant matters' section in the notes for a reconciliation to the previously reported information.
The above statement should be read in conjunction with the accompanying notes.
Consolidated financial statements
For the year ended 30 June 2020
Consolidated financial statementsConsolidated comprehensive income statement
40
Consolidated statement of changes in equity
41
Consolidated balance sheet 42
Consolidated cash flow statement 43
Notes to the consolidated financial statements
General information and significant matters 44
A. Financial performanceA1. Underlying EBITDAF and underlying earnings 46
A2. Segment reporting 47
A3. Revenue 50
A4. Other gains (losses) 50
A5. Depreciation, depletion and amortisation 50
A6. Income tax 51
B. Operating assetsB1. Property, plant and equipment 52
B2. Oil and gas assets 54
B3. Intangible assets 55
C. Working capital and provisionsC1. Receivables and prepayments 58
C2. Inventories 58
C3. Payables and accruals 58
C4. Provisions 59
D. Group structureD1. Subsidiaries and controlled entities 60
D2. Joint operations 60
D3. Share in associates 60
E. FundingE1. Capital management 61
E2. Share capital 61
E3. Earnings per share 61
E4. Dividends 61
E5. Borrowings 62
E6. Finance expense 63
F. Risk managementF1. Derivatives 66
F2. Price risk 67
F3. Interest rate risk 67
F4. Foreign exchange risk 68
F5. Impact of derivatives on the income statement and equity 68
F6. Sensitivity analysis for each type of market risk 69
F7. Liquidity risk 69
F8. Fair value measurement 70
G. OtherG1. Share-based payments 72
G2. Related party transactions 72
G3. Auditor's remuneration 73
G4. Capital commitments 73
G5. Contingent assets and liabilities 73
G6. Subsequent events 73
Ngā Tauākī Pūtea Tōpū
40G E N E S I S A N N U A L R E P O R T 2 0 1 8G E N E S I S A N N U A L R E P O R T 2 0 2 0 G E N E S I S A N N U A L R E P O R T 2 0 2 0 4039 C O N S O L I D A T E D F I N A N C I A L S T A T E M E N T SC O N S O L I D A T E D F I N A N C I A L S T A T E M E N T S
For
per
sona
l use
onl
y
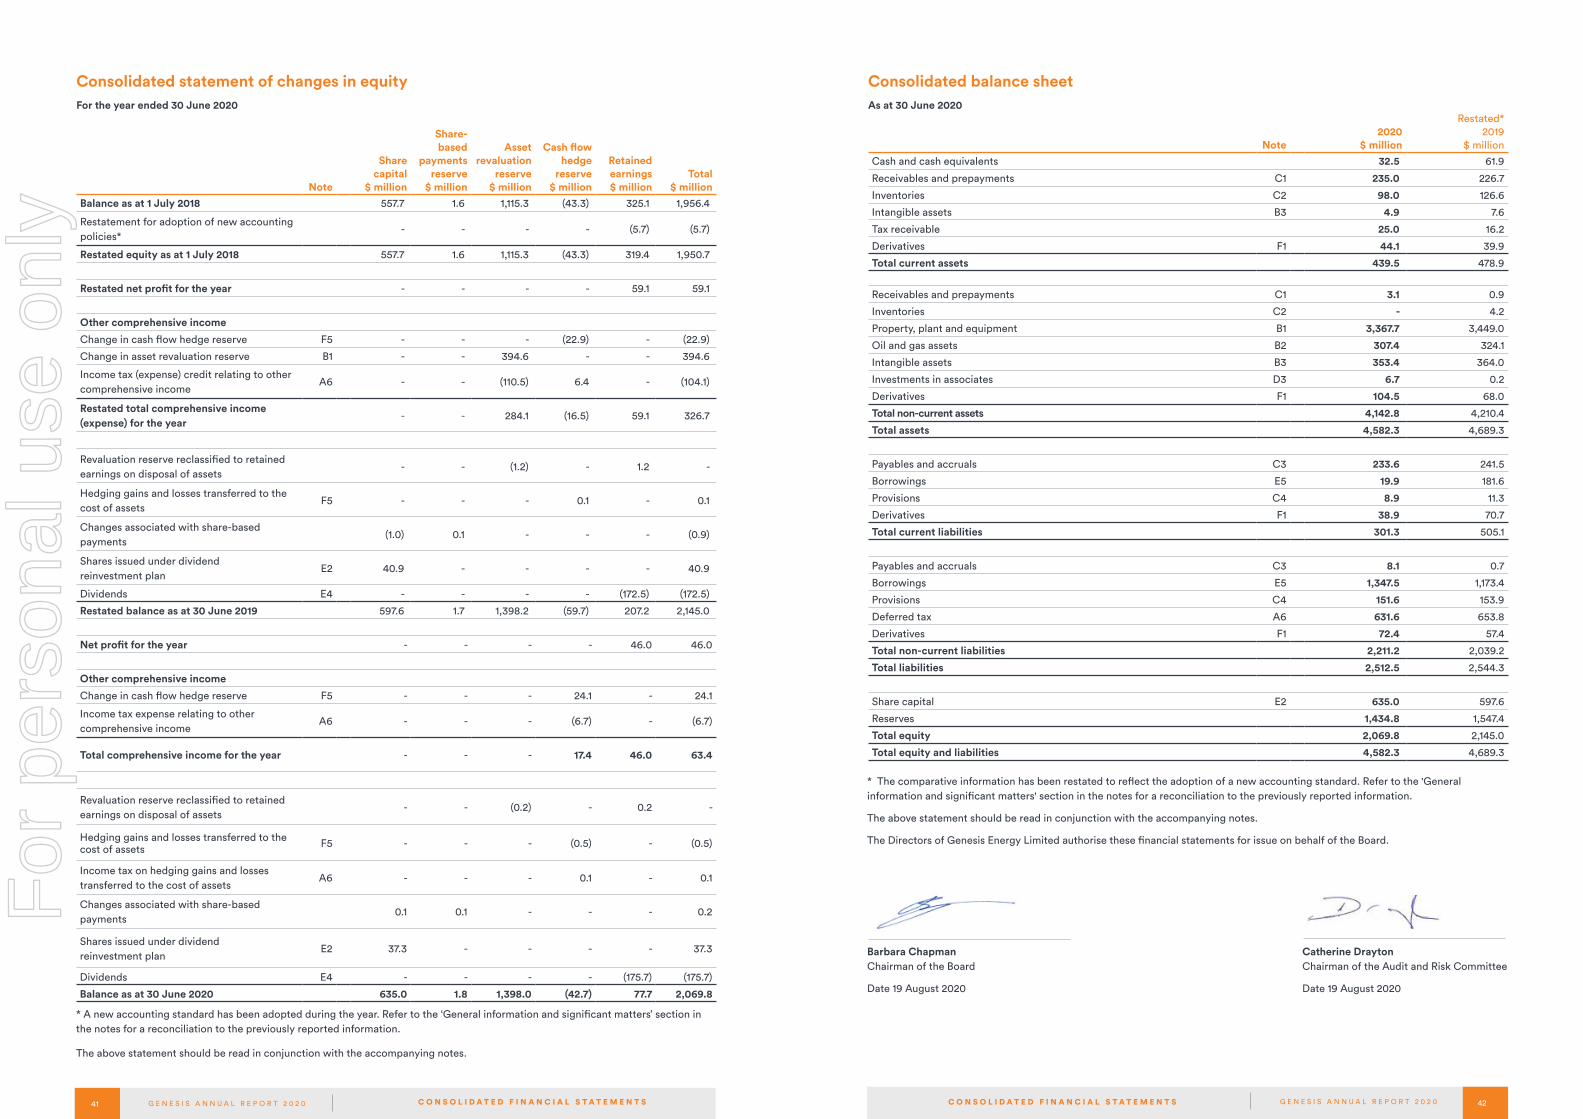
Consolidated balance sheetAs at 30 June 2020
Note2020
$ million
Restated*2019
$ million
Cash and cash equivalents 32.5 61.9
Receivables and prepayments C1 235.0 226.7
Inventories C2 98.0 126.6
Intangible assets B3 4.9 7.6
Tax receivable 25.0 16.2
Derivatives F1 44.1 39.9
Total current assets 439.5 478.9
Receivables and prepayments C1 3.1 0.9
Inventories C2 - 4.2
Property, plant and equipment B1 3,367.7 3,449.0
Oil and gas assets B2 307.4 324.1
Intangible assets B3 353.4 364.0
Investments in associates D3 6.7 0.2
Derivatives F1 104.5 68.0
Total non-current assets 4,142.8 4,210.4
Total assets 4,582.3 4,689.3
Payables and accruals C3 233.6 241.5
Borrowings E5 19.9 181.6
Provisions C4 8.9 11.3
Derivatives F1 38.9 70.7
Total current liabilities 301.3 505.1
Payables and accruals C3 8.1 0.7
Borrowings E5 1,347.5 1,173.4
Provisions C4 151.6 153.9
Deferred tax A6 631.6 653.8
Derivatives F1 72.4 57.4
Total non-current liabilities 2,211.2 2,039.2
Total liabilities 2,512.5 2,544.3
Share capital E2 635.0 597.6
Reserves 1,434.8 1,547.4
Total equity 2,069.8 2,145.0
Total equity and liabilities 4,582.3 4,689.3
* The comparative information has been restated to reflect the adoption of a new accounting standard. Refer to the 'General information and significant matters' section in the notes for a reconciliation to the previously reported information.
The above statement should be read in conjunction with the accompanying notes.
The Directors of Genesis Energy Limited authorise these financial statements for issue on behalf of the Board.
Barbara Chapman Chairman of the Board
Date 19 August 2020
Catherine Drayton Chairman of the Audit and Risk Committee
Date 19 August 2020
Consolidated statement of changes in equityFor the year ended 30 June 2020
Note
Share capital
$ million
Share-based
payments reserve
$ million
Asset revaluation
reserve $ million
Cash flow hedge
reserve $ million
Retained earnings $ million
Total $ million
Balance as at 1 July 2018 557.7 1.6 1,115.3 (43.3) 325.1 1,956.4
Restatement for adoption of new accounting policies*
- - - - (5.7) (5.7)
Restated equity as at 1 July 2018 557.7 1.6 1,115.3 (43.3) 319.4 1,950.7
Restated net profit for the year - - - - 59.1 59.1
Other comprehensive income
Change in cash flow hedge reserve F5 - - - (22.9) - (22.9)
Change in asset revaluation reserve B1 - - 394.6 - - 394.6
Income tax (expense) credit relating to other comprehensive income
A6 - - (110.5) 6.4 - (104.1)
Restated total comprehensive income (expense) for the year
- - 284.1 (16.5) 59.1 326.7
Revaluation reserve reclassified to retained earnings on disposal of assets
- - (1.2) - 1.2 -
Hedging gains and losses transferred to the cost of assets
F5 - - - 0.1 - 0.1
Changes associated with share-based payments
(1.0) 0.1 - - - (0.9)
Shares issued under dividend reinvestment plan
E2 40.9 - - - - 40.9
Dividends E4 - - - - (172.5) (172.5)
Restated balance as at 30 June 2019 597.6 1.7 1,398.2 (59.7) 207.2 2,145.0
Net profit for the year - - - - 46.0 46.0
Other comprehensive income
Change in cash flow hedge reserve F5 - - - 24.1 - 24.1
Income tax expense relating to other comprehensive income
A6 - - - (6.7) - (6.7)
Total comprehensive income for the year - - - 17.4 46.0 63.4
Revaluation reserve reclassified to retained earnings on disposal of assets
- - (0.2) - 0.2 -
Hedging gains and losses transferred to the cost of assets F5 - - - (0.5) - (0.5)
Income tax on hedging gains and losses transferred to the cost of assets
A6 - - - 0.1 - 0.1
Changes associated with share-based payments
0.1 0.1 - - - 0.2
Shares issued under dividend reinvestment plan
E2 37.3 - - - - 37.3
Dividends E4 - - - - (175.7) (175.7)
Balance as at 30 June 2020 635.0 1.8 1,398.0 (42.7) 77.7 2,069.8
* A new accounting standard has been adopted during the year. Refer to the ‘General information and significant matters’ section in the notes for a reconciliation to the previously reported information.
The above statement should be read in conjunction with the accompanying notes.
42G E N E S I S A N N U A L R E P O R T 2 0 1 8G E N E S I S A N N U A L R E P O R T 2 0 2 0 G E N E S I S A N N U A L R E P O R T 2 0 2 0 4241 C O N S O L I D A T E D F I N A N C I A L S T A T E M E N T SC O N S O L I D A T E D F I N A N C I A L S T A T E M E N T S
For
per
sona
l use
onl
y

44G E N E S I S A N N U A L R E P O R T 2 0 2 0N O T E S T O T H E C O N S O L I D A T E D F I N A N C I A L S T A T E M E N T S
Notes to the consolidated financial statements For the year ended 30 June 2020
General information These consolidated financial statements comprise Genesis Energy Limited ('Genesis'), its subsidiaries, controlled entities and the Group's interests in associates and joint operations (together, the 'Group'). Refer to section D for more information on the Group structure.
Genesis is registered under the Companies Act 1993. It is a mixed ownership model company, majority owned by the 'Crown', bound by the requirements of the Public Finance Act 1989. Genesis is listed on the New Zealand Stock Exchange (NZX) and the Australian Securities Exchange (ASX) and has bonds listed on the NZX debt market. Genesis is an FMC reporting entity under the Financial Markets Conduct Act 2013.
The core business of the Group and activities carried out by each segment is disclosed in note A2.
Basis of preparationThese financial statements have been prepared:
• In accordance with New Zealand generally accepted accounting practice ('GAAP') and comply with International Financial Reporting Standards ('IFRS') and New Zealand equivalents ('NZ IFRS'), as appropriate for profit-oriented entities;
• In accordance with the Financial Markets Conduct Act 2013, the Financial Reporting Act 2013 and the Companies Act 1993;
• Using the historical-cost convention, modified by the revaluation of derivatives, emission units held for trading and generation assets;
• In New Zealand dollars rounded to the nearest 100,000;
• On a Goods and Services Tax (‘GST’) exclusive basis with the exception of receivables and payables, which include GST where GST has been invoiced;
• Using the accounting policies set out in the notes to the financial statements. The impact of adopting new and revised accounting standards, interpretations and amendments is disclosed below.
Estimates and judgementsIn the process of preparing the financial statements Management makes a number of estimates and judgements based on historical experience and various other factors that are reasonable under the circumstances. The table below lists the key estimates and judgements:
Key estimates and judgements Note Page
Determining whether or not a subsequent event is an adjusting event - refer right
Fair value of generation assets B1 53
Depletion of oil and gas producing assets B2 55
Valuation of rehabilitation and restoration provisions
C4 59
Valuation of electricity derivatives F8 71
Estimates are also used in determining other items such as the expected credit loss provision (note C1), the useful lives of property, plant and equipment and software (note B2 and B3), and whether assets with indefinite useful lives are impaired (note B3). Judgements are further used in determining whether an event gives rise to a provision or a contingent liability (note G4). New Zealand Aluminium Smelters' announcement to close Tiwai Point Smelter On 9 July 2020 New Zealand Aluminium Smelters (NZAS) announced its intention to close the Tiwai Point smelter by August 2021. As a result it has given notice to Meridian to terminate its electricity supply agreement. Tiwai Point’s electricity usage represents 13 per cent of total electricity demand in New Zealand and is likely to impact electricity prices and generation volumes. The impact of the closure on the Group's assets and liabilities is dependent on a number of interrelated factors including:
• The timing of Tiwai Point's exit and how the operations will be wound down;
• Approval and timing of transmission upgrades required to move the surplus electricity north and how the cost of these upgrades will be recovered;
• Level of demand from new and existing industrial plant and electrification projects;
• Potential retirement of any existing generation assets;
• Postponement of the development of proposed generation assets – what proposals are unlikely to go ahead and what proposals will be delayed and for how long;
• Management of seasonal variations in hydrology, wind and demand in the upper North Island and what combination of generation assets will provide this service in the future;
• Demand and pricing of electricity hedging contracts; and
• Demand for and pricing of gas.
Changes in these interrelated factors will impact the wholesale electricity price path and generation volumes, which are key estimates used to calculate the fair value of generation assets and electricity derivatives (refer to note B1 and F8). Greater clarity and more information on these factors is required before Genesis can estimate the financial effect these factors will have on the carrying value of generation assets and electricity derivatives. The sensitivity information disclosed in note B1 and F8 provides the estimated impact of a 10 per cent increase/decrease in the wholesale price path and generation volumes.
The announcement on 9 July 2020 is considered to be a non-adjusting subsequent event on the basis that the formal announcement to close Tiwai Point was a condition that arose after 30 June 2020, Genesis did not have any direct communications with NZAS or Rio Tinto in relation to this matter and Genesis was not aware of NZAS' decision to close Tiwai Point prior to the announcement. While NZAS had announced prior to 30 June 2020 that it was undertaking a strategic review of operations, closure was only one of many options available. The formal announcement on 9 July 2020 of NZAS' intention to close Tiwai Point is considered the key condition in relation to this matter and therefore is not considered to clarify a condition that existed at 30 June 2020. This is considered a key judgement in the preparation of these financial statements.
General information and significant matters
Consolidated cash flow statementFor the year ended 30 June 2020 Note
2020 $ million
Restated* 2019
$ million
Receipts from customers 2,555.9 2,683.9
Interest received 0.2 0.6
Payments to suppliers and related parties (2,092.6) (2,222.9)
Payments to employees (103.2) (97.1)
Tax paid (52.8) (53.1)
Operating cash flows 307.5 311.4
Proceeds from disposal of property, plant and equipment 0.1 0.2
Payments to associates (7.7) (0.4)
Purchase of property, plant and equipment (54.3) (65.9)
Purchase of oil and gas assets (22.0) (6.9)
Purchase of intangibles (excluding emission units and deferred customer acquisition costs)
(19.3) (19.7)
Investing cash flows (103.2) (92.7)
Proceeds from borrowings E5 97.6 240.0
Repayment of borrowings E5 (126.2) (238.8)
Interest paid and other finance charges (66.6) (74.4)
Dividends E4 (138.4) (131.6)
Acquisition of treasury shares E2 (0.1) (1.3)
Financing cash flows (233.7) (206.1)
Net increase (decrease) in cash and cash equivalents (29.4) 12.6
Cash and cash equivalents at 1 July 61.9 49.3
Cash and cash equivalents at 30 June 32.5 61.9
Reconciliation of net profit to operating cash flows Note2020
$ million
Restated*2019
$ million
Net profit for the year 46.0 59.1
Net loss on disposal of property, plant and equipment 2.1 0.1
Net loss on disposal of intangible assets 0.3 -
Finance expense excluding time value of money adjustments on provisions 65.8 71.6
Change in rehabilitation and contractual arrangement provisions 8.2 3.3
Items classified as investing/financing activities 76.4 75.0
Depreciation, depletion and amortisation expense A5 209.8 201.7
Revaluation of generation assets B1 - (4.6)
Impairment of non-current assets B1, B3 3.0 4.2
Change in fair value of financial instruments F5 0.6 15.2
Deferred tax expense A6 (28.8) (17.6)
Change in capital expenditure accruals (14.9) (1.1)
Share of associates 1.2 0.2
Other non-cash items 2.6 2.0
Total non-cash items 173.5 200.0
Change in receivables and prepayments (10.5) (0.7)
Change in inventories 32.8 (55.2)
Change in emission units on hand 2.7 7.1
Change in deferred customer acquisition costs 0.6 (0.2)
Change in payables and accruals (0.5) 35.7
Change in tax receivable/payable (8.8) (11.8)
Change in provisions (4.7) 2.4
Movements in working capital 11.6 (22.7)
Net cash inflow from operating activities 307.5 311.4
*The comparative information has been restated to reflect the adoption of a new accounting standard. Refer to the 'General information and significant matters' section in the notes for a reconciliation to the previously reported information. The above statement should be read in conjunction with the accompanying notes.
G E N E S I S A N N U A L R E P O R T 2 0 2 043 C O N S O L I D A T E D F I N A N C I A L S T A T E M E N T S
For
per
sona
l use
onl
y

46G E N E S I S A N N U A L R E P O R T 2 0 2 045 G E N E S I S A N N U A L R E P O R T 2 0 2 0 N O T E S T O T H E C O N S O L I D A T E D F I N A N C I A L S T A T E M E N T S N O T E S T O T H E C O N S O L I D A T E D F I N A N C I A L S T A T E M E N T S
A1. Underlying EBITDAF and underlying earningsUnderlying EBITDAF and underlying earnings are performance measures used internally to provide insight into the operating performance of the Group by adjusting for items that are outside Management's control or items that relate to strategic rather than operational decisions. Items are excluded from underlying EBITDAF and underlying earnings when they meet the criteria outlined in the Group's non-GAAP financial information policy (refer to www.genesisenergy.co.nz/investors/governance/documents for a copy of the policy). These measures are not
A. Financial performance
Reconciliation of reported net profit to underlying earnings Note
2020$ million
Restated2019
$ million
Net profit for the year 46.0 59.1
Change in fair value of financial instruments F5 0.6 15.2
Revaluation of generation assets B1 - (4.6)
Impairment of non-current assets B1, B3 3.0 4.2
Unrealised (gain) loss on revaluation of carbon units held for trading A4 6.0 (7.4)
Adjustments before tax expense 9.6 7.4
Tax expense on adjustments (2.7) (2.1)
Adjustments after tax expense 6.9 5.3
Underlying earnings 52.9 64.4
Cents Cents
Underlying EPS 5.14 6.35
There were no differences between reported EBITDAF and underlying EBITDAF.
defined in NZ IFRS and therefore are considered to be non-GAAP performance measures. They should not be viewed in isolation nor considered a substitute for measures reported in accordance with NZ IFRS. Underlying EBITDAF and underlying earnings are used by many companies, however, because these measures are not defined by NZ IFRS they may not be uniformly defined or calculated by all companies. Accordingly, these measures may not be comparable.
Comprehensive income statement For the year ended 30 June 2019
As originally presented $ million
NZ IFRS 16 $ million
Restated $ million
EBITDAF 363.4 6.0 369.4
Depreciation, depletion and amortisation (196.5) (5.2) (201.7)
(Impairment) / impairment reversal of non-current assets (7.0) 2.8 (4.2)
Finance expense (73.9) (3.8) (77.7)
Profit before income tax 83.1 (0.2) 82.9
Income tax expense (23.9) 0.1 (23.8)
Net profit after tax 59.2 (0.1) 59.1
Total comprehensive income for the year 326.8 (0.1) 326.7 Earnings per share reduced from 5.84 cents per share to 5.83 cents per share as a result of adopting NZ IFRS 16.
The wholesale electricity price path used to value generation assets and electricity derivatives at 30 June 2020 assumed the ongoing operation of Tiwai Point. This assumption is consistent with the assumption used in the price paths published by independent third parties and market data available at 30 June 2020. While there was a possibility of closure, the external and internal analysis at 30 June 2020 indicated that the broadly held view was that Tiwai Point would remain open.
COVID-19 As the energy sector provides an essential service it has been relatively unaffected by COVID-19 compared to other sectors of New Zealand's economy. During the nationwide level 4 lockdown and level 3 restrictions, which commenced on 25 March 2020, there was a decrease in electricity and gas demand and the wholesale electricity price path, which impacted both electricity revenue and purchases. Since this time demand and the price path have returned to broadly similar levels to those experienced prior to the level 4 lockdown and level 3 restrictions. This is a trend which is expected to continue. Given Genesis is both a generator and a retailer, the change in the price path did not have a material impact on the reported result. As the price path and generation volumes at 30 June 2020 has broadly returned to pre lockdown levels it has not had a material impact on the valuation of generation assets and electricity swaps and options and electricity power purchase agreements ('PPA') (refer note B1 and F8). On 12 August 2020 the alert level for the Auckland region was raised to level 3, while the rest of the country was raised to level 2. To date, no material business impact has been noted as a result of the current lockdown. The expected credit loss provision on trade receivables and accrued revenue has also been updated to reflect the impact of COVID-19 and any potential recession that may follow. This resulted in a small increase in the expected credit loss provision (refer note C1). A small adjustment was also made to deferred tax / tax expense as a result of the Government reintroducing tax depreciation on commercial and industrial buildings as part of the relief package for COVID-19 (refer note A6).
Impairment of assets Assets that have indefinite useful lives are tested annually for impairment. Assets that are subject to depletion, depreciation or amortisation are reviewed for impairment annually or whenever events or changes in circumstances indicate that the carrying amount may not be recoverable. If an asset’s carrying value exceeds its recoverable amount, the difference is recognised as an impairment loss in the income statement, except where the asset is carried at a revalued amount then it is treated as a revaluation decrease up to the amount previously recognised in
the revaluation reserve.
Adoption of new and revised accounting standards, interpretations and amendments
Consolidated balance sheetAs at 1 July 2018
As originally presented $ million
NZ IFRS 16 $ million
Restated $ million
Property, plant and equipment 3,051.6 58.9 3,110.5
Inventories 75.6 - 75.6
Borrowings (1,255.4) (70.0) (1,325.4)
Provisions (166.1) 3.3 (162.8)
Deferred tax (569.4) 2.1 (567.3)
Retained earnings (325.1) 5.7 (319.4)
During the year the Group adopted NZ IFRS 16 Leases ('NZ IFRS 16'). The impact of adopting this standard, using the full retrospective method, is disclosed below.
NZ IFRS 16 Leases The Group leases office buildings, land for its generation sites and LPG depots. The adoption of NZ IFRS 16 has resulted in changes to how leases are recognised, measured and disclosed. The standard provides a single lessee accounting model, requiring lessees to recognise right-of-use assets (leased assets) and lease liabilities for all lease arrangements that meet the definition of a lease, except for short-term leases where the lease term is 12 months or less and leases of low-value assets. For these leases the Group recognises the lease payments as operating expenses on a straight-line basis over the term of the lease.
The lease liability on initial recognition comprises the present value of the lease payments that are not paid at the commencement date. This includes fixed payments less any lease incentives receivable and variable lease payments that are based on an index or rate. The lease payments are discounted using the incremental borrowing rate, being the rate that the Group would have to pay to borrow the funds necessary to obtain an asset of similar value in a similar economic environment with similar terms and conditions.
The lease liability is subsequently measured by increasing the carrying amount to reflect interest on the lease liability (using the effective interest method) and reducing the carrying amount to reflect the lease payments made. The Group remeasures the lease liability (and makes a corresponding adjustment to the related lease asset) whenever the lease term changes, the lease payments change due to changes in an index or rate or a lease contract is modified and the lease modification is not accounted for as a separate lease.
The lease assets comprises the amount of the corresponding initial lease liability, lease payments made at or before the commencement date, initial direct costs and restoration costs. The lease asset is subsequently measured at cost less accumulated depreciation and impairment losses. The lease asset is depreciated over the lease term, on a straight-line basis. The lease term ranges from 4 to 38 years.
NZ IFRS 16 was adopted using the retrospective method and as a result the comparative information has been restated. Retained earnings as at 1 July 2018 was adjusted by $5.7 million as a result of retrospectively adopting the standard. The Group elected not to reassess whether a contract contains a lease at the date of initial application. For contracts entered into before the transition date, the Group relied on the assessment made applying the previous standard, NZ IAS 17 Leases and IFRIC 4 Determining whether an arrangement contains a lease. The impact of adopting the standard is disclosed below.
Consolidated cash flow statementFor the year ended 30 June 2019
As originally presented $ million
NZ IFRS 16 $ million
Restated $ million
Payments to suppliers and related parties (2,232.9) 10.0 (2,222.9)
Repayment of borrowings (232.6) (6.2) (238.8)
Interest paid and other finance charges (70.6) (3.8) (74.4)
Accounting standards, interpretations and amendments in issue not yet effective There are no standards, interpretations and amendments approved but not yet effective in the current year that are likely to have a material impact to the Group.
Consolidated balance sheetAs at 30 June 2019
As originally presented $ million
NZ IFRS 16 $ million
Restated $ million
Property, plant and equipment* 3,392.8 56.2 3,449.0
Inventories 130.2 0.6 130.8
Borrowings (1,289.8) (65.2) (1,355.0)
Provisions (165.6) 0.4 (165.2)
Deferred tax (656.0) 2.2 (653.8)
Retained earnings (213.0) 5.8 (207.2)
* Leased assets disclosed in note B1 as at 30 June 2019 were $57.3 million, $56.2 million was recognised on transition to NZ IFRS 16 and $1.1 million previously recognised in buildings and improvements is now recognised as part of leased assets.
Determining the number of renewal periods to include in the lease term can have a material impact on the value of the leased asset included in property, plant and equipment and the lease liability included in borrowings.
For
per
sona
l use
onl
y

48G E N E S I S A N N U A L R E P O R T 2 0 2 047 G E N E S I S A N N U A L R E P O R T 2 0 2 0 N O T E S T O T H E C O N S O L I D A T E D F I N A N C I A L S T A T E M E N T S N O T E S T O T H E C O N S O L I D A T E D F I N A N C I A L S T A T E M E N T S
Year ended 30 June 2020 Retail $ million
Wholesale $ million
Kupe $ million
Corporate $ million
Total $ million
Electricity 1,326.4 805.2 - - 2,131.6
Gas 154.2 105.5 - - 259.7
LPG 77.4 3.3 7.8 - 88.5
Oil - - 27.8 - 27.8
Emissions on fuel sales and electricity contracts 0.2 17.1 0.9 - 18.2
Emission unit revenue from trading - 62.3 - - 62.3
Other revenue 2.1 0.4 0.3 0.6 3.4
Total external revenue 1,560.3 993.8 36.8 0.6 2,591.5
Electricity - intersegment - 567.6 - - 567.6
Gas - intersegment - 60.7 87.8 - 148.5
LPG - intersegment - 24.1 20.5 - 44.6
Emissions on fuel sales - intersegment - - 2.4 - 2.4
Total segment revenue 1,560.3 1,646.2 147.5 0.6 3,354.6
Electricity purchases - (739.1) - - (739.1)
Electricity network, transmission, levies and meters (566.7) (17.1) - - (583.8)
Fuel consumed in electricity generation - (238.7) - - (238.7)
Gas purchases (0.2) (189.5) - - (189.7)
Gas network, transmission, levies and meters (65.3) (19.8) - - (85.1)
LPG purchases, inventory changes and transportation costs (16.2) (5.7) - - (21.9)
Oil inventory changes, storage and transportation costs - - (0.9) - (0.9)
Emissions associated with electricity generation - (22.9) - - (22.9)
Emissions associated with fuel sales - (21.8) (17.4) - (39.2)
Emission unit expenses from trading - (51.7) - - (51.7)
Other costs (0.1) - (12.5) - (12.6)
Total external costs (648.5) (1,306.3) (30.8) - (1,985.6)
Electricity purchases - intersegment (567.6) - - - (567.6)
Fuel consumed in electricity generation - intersegment - (87.8) - - (87.8)
Gas purchases - intersegment (60.7) - - - (60.7)
LPG purchases, inventory changes and transportation costs - intersegment
(24.1) (20.5) - - (44.6)
Emission costs - intersegment - (2.4) - - (2.4)
Total segment costs (1,300.9) (1,417.0) (30.8) - (2,748.7)
Gross margin 259.4 229.2 116.7 0.6 605.9
Employee benefits (49.7) (29.8) - (25.3) (104.8)
Other operating expenses (75.7) (34.5) (22.9) (12.4) (145.5)
Earnings before net finance expense, income tax, depreciation, depletion, amortisation, impairment, fair value changes and other gains and losses (EBITDAF)
134.0 164.9 93.8 (37.1) 355.6
Depreciation, depletion and amortisation (26.5) (135.3) (39.3) (8.7) (209.8)
Impairment of non-current assets (2.9) (0.1) - - (3.0)
Change in fair value of financial instruments - (1.3) 0.1 0.6 (0.6)
Share of associates (0.6) (0.6) - - (1.2)
Other gains (losses) (0.6) (7.8) 0.1 (0.5) (8.8)
Profit (loss) before net finance expense and income tax 103.4 19.8 54.7 (45.7) 132.2
Finance revenue 0.1 - - 0.1 0.2
Finance expense (0.7) (3.5) (3.1) (63.5) (70.8)
Profit (loss) before income tax 102.8 16.3 51.6 (109.1) 61.6
Other segment information
Capital expenditure 24.2 57.6 21.9 2.1 105.8
A2. Segment reporting (continued)
Reconciliation of expenses in the consolidated comprehensive income statement to the segment note
Expenses in the consolidated comprehensive income statement includes the following line items in the segment note: external costs, employee benefits and other operating expenses.
Intersegment revenue
Sales between segments is based on transfer prices developed in the context of long-term contracts. The electricity transfer price per MWh charged between Wholesale and Retail was $85.97 (2019: $83.01).
Restatement of comparative segment note
The structure of the segment note has been updated to reflect enhanced internal business reporting and as a result the comparative segment note has been restated to provide comparability with the current period. Key changes to the comparable segment note include:
• Intersegment revenues and expenses of $709.3 million are shown separately by segment (previously disclosed in total by product);
• Petroleum revenue of $122.2 million previously reported has been split into LPG ($83.4 million) and oil ($38.8 million);
• Petroleum production, marketing and distribution expense of $62.5 million previously reported has been split into LPG ($31.6 million), oil ($1.0 million), other costs ($13.5 million) and other operating expenses ($16.4 million);
• Emissions revenue and expense was not reported separately previously. The $19.7 million revenue and $45.2 million expense (made up of $18.4 million emissions associated with electricity generation and $26.8 million emissions associated with fuel sales) was previously reported with the product it related to (electricity ($7.8 million revenue), gas ($10.2 million revenue and $15.2 million expense), fuels consumed in electricity generation ($18.4 million expense), LPG ($1.5 million revenue and $11.1 million expense) and other ($0.2 million revenue and $0.5 million operating expenses));
• Other revenue of $12.5 million has been allocated to products ($13.6 million to electricity and -$1.1 million to gas);
• Electricity purchase, transmission and distribution of $1,439.6 million previously reported has been split into electricity purchases ($904.3 million) and electricity network, transmission, levies and meters ($535.3 million);
• Gas purchase, transmission and distribution of $274.7 million previously reported has been split into gas purchases ($197.1 million), gas network, transmission, levies and meters ($79.5 million) and fuels consumed in electricity generation (-$1.9 million);
• $59.8 million of expenses previously reported in other operating expenses has been reclassified to electricity network, transmission, levies and meters ($57.9 million), gas network, transmission, levies and meters ($1.0 million) and other costs ($0.9 million);
• All lines below EBITDAF remain unchanged.
In addition to changes in the structure of the segment note, the comparative numbers have been restated to reflect:
• The change in the reporting line for Technology and Digital from Corporate to Retail. Lines impacted by the change are employee benefits, other operating expenses, depreciation, depletion and amortisation and impairment of non-current assets, which have decreased by $7.1 million, $22.1 million, $5.9 million and $0.2 million respectively for Corporate with a corresponding increase for Retail;
• Removal of corporate cost allocations, which has resulted in a $7.5 million increase in employee benefits and a $19.6 million increase in other operating expenses for Corporate, a $4.0 million and $11.8 million decrease respectively for Retail, a $3.4 million and $7.7 million decrease respectively for Wholesale and a $0.1 million and $0.1 million decrease respectively for Kupe;
• Adoption of the new lease standard NZ IFRS 16, which has resulted in a $0.3 million increase in fuels consumed in electricity generation for Wholesale, $0.9 million decrease in other operating expenses for Retail, a $0.8 million decrease for Wholesale and a $4.6 million decrease for Corporate. An increase in depreciation, depletion and amortisation of $0.8 million for Retail, $0.6 million for Wholesale and $3.8 million for Corporate. Impairment of non-current assets decreased by $2.8 million for Wholesale and finance expense increased by $0.3 million for Retail, $1.5 million for Wholesale and $2.0 million for Corporate.
A2. Segment reporting The Group reports activities under four operating segments as follows:
Segment Activity
Retail Supply of energy (electricity, gas and LPG) and related services to end users.
Wholesale Supply of electricity to the wholesale electricity market, supply of gas and LPG to wholesale customers and the Retail segment and the sale and purchase of derivatives to fix the price of electricity.
KupeExploration, development and production of gas, oil and LPG. Supply of gas and LPG to the Wholesale segment and supply of light oil.
CorporateHead-office functions, including human resources, finance, corporate relations, property management, legal, corporate governance and strategy.
The segments are based on the different products and services offered by the Group. All segments operate in New Zealand. No operating segments have been aggregated. The Group has no individual customers that account for 10.0 per cent or more of the Group's external revenue (2019: none). Included in the Retail segment result is $40.5 million of costs (2019: $35.3 million) relating to the Technology and Digital team who provide services to all of the segments.
For
per
sona
l use
onl
y

50G E N E S I S A N N U A L R E P O R T 2 0 2 049 G E N E S I S A N N U A L R E P O R T 2 0 2 0 N O T E S T O T H E C O N S O L I D A T E D F I N A N C I A L S T A T E M E N T S N O T E S T O T H E C O N S O L I D A T E D F I N A N C I A L S T A T E M E N T S
A5. Depreciation, depletion and amortisation Note
2020$ million
Restated 2019
$ million
Property, plant and equipment B1 147.4 116.7
Oil and gas assets B2 36.2 58.5
Intangibles (excluding amortisation of deferred customer acquisition costs) B3 26.2 26.5
209.8 201.7
Judgement used in determining revenueWhere customer meters are unbilled at balance date the Group uses judgement to determine the volume of the unbilled revenue. The Group estimates the unbilled volume using historical consumption information. Unbilled revenue is disclosed in note C1. Where a discount is offered for prompt payment, revenue is initially recognised net of the estimated discount. The estimated discount is based on historical trends in customer payments.
A4. Other gains (losses) In the prior year other gains (losses) included a $7.4 million unrealised gain in relation to the change in fair value of carbon units held for trading as a result of units being acquired at below current market prices. The current year includes a $6.0 million unrealised loss mainly due to the reversal of the unrealised gain recorded in the previous year as a result of the sale of the units. When the units are sold the cost of the units is recorded in operating expenses.
A3. Revenue
Revenue streamContractterm
Nature of goods or services and revenue recognition Payment terms
Electricity (retail), gas and LPG (including emissions)
0-36 months
Daily supply of electricity, gas or metered LPG over the contract period. Revenue is recognised over time at the end of each day when the consumption is known. The amount of revenue recognised is based on the amount the Group has the right to invoice.
Customers are invoiced monthly and payment is due between two weeks to one month after invoice.
Individual supply of bottled LPG. Revenue is recognised when the bottle is delivered to the customer.
Electricity (wholesale) No termHalf hourly supply of electricity. Revenue is recognised over time when each trading period is concluded and the electricity generation is known.
The clearing manager calculates and invoices the revenue. Payment is received on the 20th of the following month.
Emission unit revenue from trading
No termSale of emission units. Revenue is recognised at the point in time that the emission unit is confirmed as being transferred into the acquirer's emission unit account.
Payment is due within five business days of the units being transferred.
Oil 12 monthsIndividual oil shipments. Revenue is recognised on the bill of lading date.
Payment is due no later than 30 days from the bill of lading date.
The accounting policies applied to material revenue streams are disclosed below and the quantum of each revenue stream is disclosed in note A2. Emissions on fuel sales and electricity contracts is not a separate performance obligation under the revenue standard. It has been reported separately as it provides useful information to the financial statement users.
A2. Segment reporting (continued)
Year ended 30 June 2019 Restated
Retail $ million
Restated Wholesale
$ million
Restated Kupe
$ million
Restated Corporate
$ million
Restated total
$ million
Electricity 1,272.2 967.6 - - 2,239.8
Gas 154.3 98.4 - - 252.7
LPG 68.2 3.4 10.3 - 81.9
Oil - - 38.8 - 38.8
Emissions on fuel sales and electricity contracts - 18.6 1.1 - 19.7
Emission unit revenue from trading - 62.4 - - 62.4
Other revenue 0.8 3.3 0.7 0.6 5.4
Total external revenue 1,495.5 1,153.7 50.9 0.6 2,700.7
Electricity - intersegment - 530.8 - - 530.8
Gas - intersegment - 55.6 88.5 - 144.1
LPG - intersegment - 18.6 16.3 - 34.9
Emissions on fuel sales - intersegment - - (0.5) - (0.5)
Total segment revenue 1,495.5 1,758.7 155.2 0.6 3,410.0
Electricity purchases - (904.3) - - (904.3)
Electricity network, transmission, levies and meters (574.2) (19.0) - - (593.2)
Fuel consumed in electricity generation - (182.9) - - (182.9)
Gas purchases (0.1) (181.8) - - (181.9)
Gas network, transmission, levies and meters (67.1) (12.1) - - (79.2)
LPG purchases, inventory changes and transportation costs (14.0) (6.5) - - (20.5)
Oil inventory changes, storage and transportation costs - - (1.0) - (1.0)
Emissions associated with electricity generation - (18.4) - - (18.4)
Emissions associated with fuel sales - (15.7) (11.1) - (26.8)
Emission unit expenses from trading - (57.3) - - (57.3)
Other costs (0.3) (0.6) (13.5) - (14.4)
Total external costs (655.7) (1,398.6) (25.6) - (2,079.9)
Electricity purchases - intersegment (530.8) - - - (530.8)
Fuel consumed in electricity generation - intersegment - (88.5) - - (88.5)
Gas purchases - intersegment (55.6) - - - (55.6)
LPG purchases, inventory changes and transportation costs - intersegment
(18.6) (16.3) - - (34.9)
Emission costs - intersegment - 0.5 - - 0.5
Total segment costs (1,260.7) (1,502.9) (25.6) - (2,789.2)
Gross margin 234.8 255.8 129.6 0.6 620.8
Employee benefits (47.5) (25.9) - (25.5) (98.9)
Other operating expenses (77.3) (41.3) (20.6) (13.3) (152.5)
Earnings before net finance expense, income tax, depreciation, depletion, amortisation, impairment, fair value changes and other gains and losses (EBITDAF)
110.0 188.6 109.0 (38.2) 369.4
Depreciation, depletion and amortisation (25.3) (105.2) (63.2) (8.0) (201.7)
(Impairment) / impairment reversal of non-current assets (1.1) 2.5 (5.6) - (4.2)
Revaluation of generation assets - 4.6 - - 4.6
Change in fair value of financial instruments - (16.7) 0.5 1.0 (15.2)
Share of associates - (0.2) - - (0.2)
Other gains (losses) 0.1 7.4 - (0.2) 7.3
Profit (loss) before net finance expense and income tax 83.7 81.0 40.7 (45.4) 160.0
Finance revenue - - 0.1 0.5 0.6
Finance expense (0.5) (3.6) (3.6) (70.0) (77.7)
Profit (loss) before income tax 83.2 77.4 37.2 (114.9) 82.9
Other segment information
Capital expenditure 30.4 48.1 9.0 3.2 90.7
Depreciation on property, plant and equipment has increased by $30.7 million mainly due to the revaluation of generation assets in the prior year and review of useful lives. Depreciation and depletion of oil and gas assets has decreased by $22.3 million due to lower production as a result of a major inspection being undertaken during the year and an increase in the estimated remaining reserves of the Kupe field.
For
per
sona
l use
onl
y
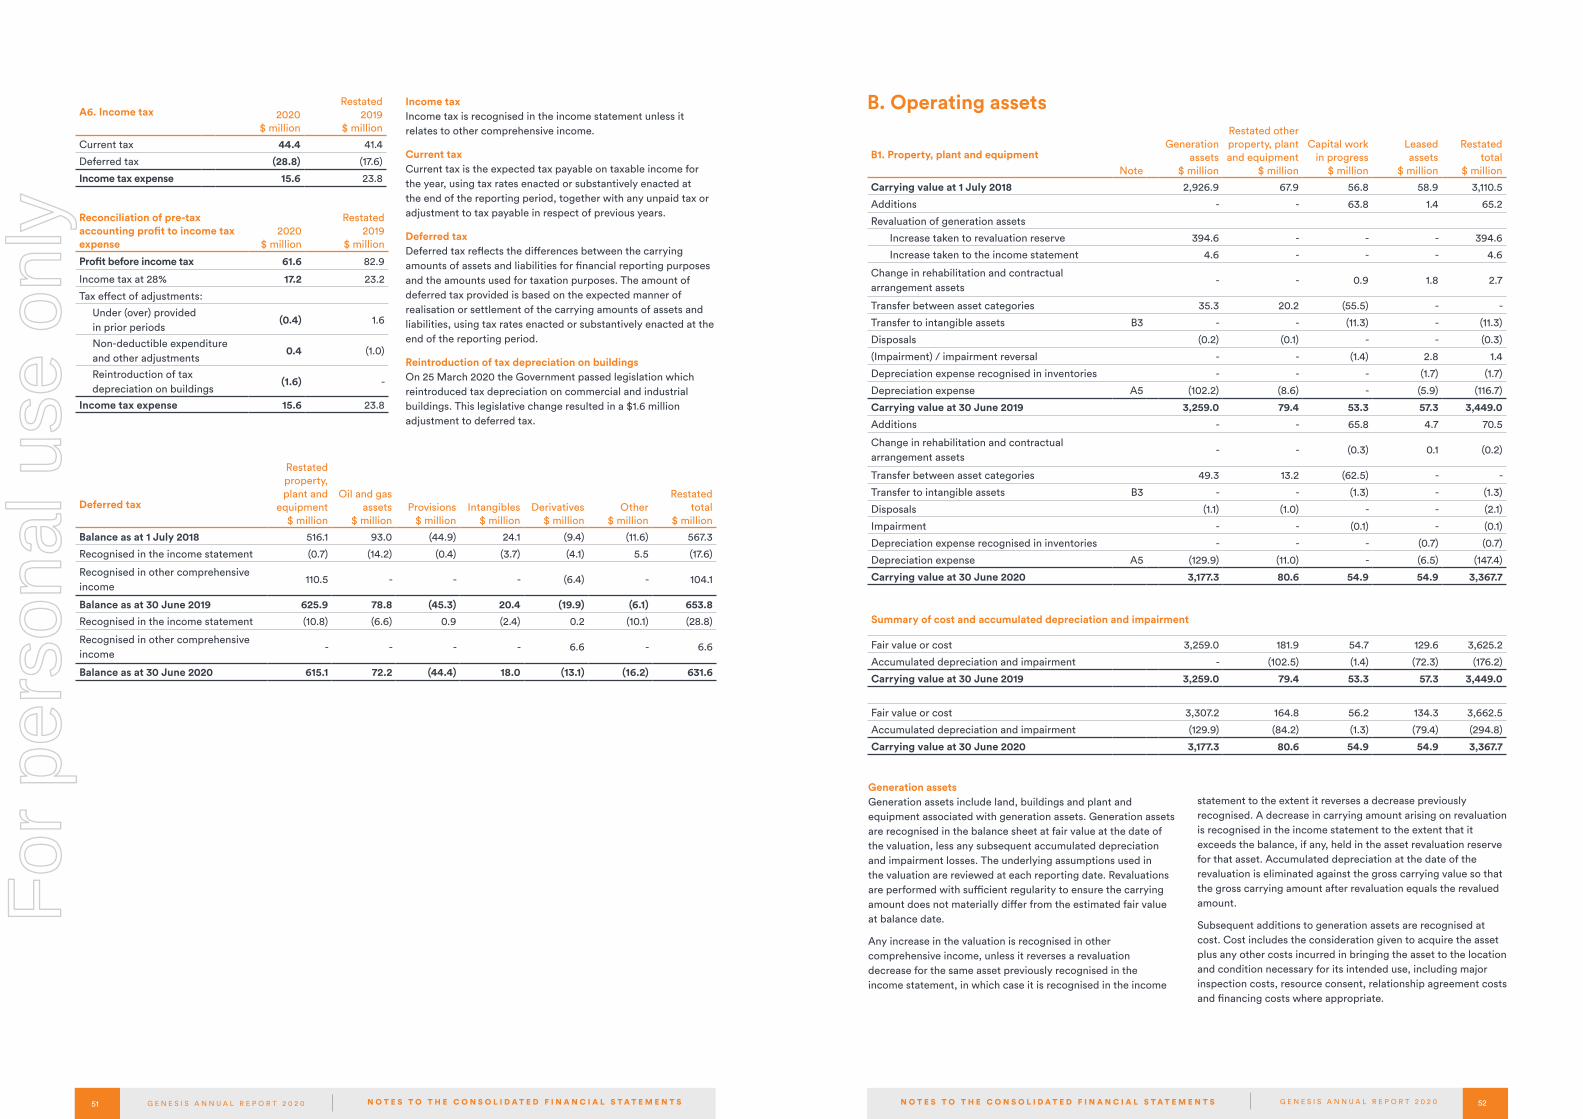
52G E N E S I S A N N U A L R E P O R T 2 0 2 051 G E N E S I S A N N U A L R E P O R T 2 0 2 0 N O T E S T O T H E C O N S O L I D A T E D F I N A N C I A L S T A T E M E N T S N O T E S T O T H E C O N S O L I D A T E D F I N A N C I A L S T A T E M E N T S
B. Operating assets
B1. Property, plant and equipmentNote
Generation assets
$ million
Restated other property, plant and equipment
$ million
Capital work in progress
$ million
Leased assets
$ million
Restated total
$ million
Carrying value at 1 July 2018 2,926.9 67.9 56.8 58.9 3,110.5
Additions - - 63.8 1.4 65.2
Revaluation of generation assets
Increase taken to revaluation reserve 394.6 - - - 394.6
Increase taken to the income statement 4.6 - - - 4.6
Change in rehabilitation and contractual arrangement assets
- - 0.9 1.8 2.7
Transfer between asset categories 35.3 20.2 (55.5) - -
Transfer to intangible assets B3 - - (11.3) - (11.3)
Disposals (0.2) (0.1) - - (0.3)
(Impairment) / impairment reversal - - (1.4) 2.8 1.4
Depreciation expense recognised in inventories - - - (1.7) (1.7)
Depreciation expense A5 (102.2) (8.6) - (5.9) (116.7)
Carrying value at 30 June 2019 3,259.0 79.4 53.3 57.3 3,449.0
Additions - - 65.8 4.7 70.5
Change in rehabilitation and contractual arrangement assets
- - (0.3) 0.1 (0.2)
Transfer between asset categories 49.3 13.2 (62.5) - -
Transfer to intangible assets B3 - - (1.3) - (1.3)
Disposals (1.1) (1.0) - - (2.1)
Impairment - - (0.1) - (0.1)
Depreciation expense recognised in inventories - - - (0.7) (0.7)
Depreciation expense A5 (129.9) (11.0) - (6.5) (147.4)
Carrying value at 30 June 2020 3,177.3 80.6 54.9 54.9 3,367.7
Summary of cost and accumulated depreciation and impairment
Fair value or cost 3,259.0 181.9 54.7 129.6 3,625.2
Accumulated depreciation and impairment - (102.5) (1.4) (72.3) (176.2)
Carrying value at 30 June 2019 3,259.0 79.4 53.3 57.3 3,449.0
Fair value or cost 3,307.2 164.8 56.2 134.3 3,662.5
Accumulated depreciation and impairment (129.9) (84.2) (1.3) (79.4) (294.8)
Carrying value at 30 June 2020 3,177.3 80.6 54.9 54.9 3,367.7
Generation assets Generation assets include land, buildings and plant and equipment associated with generation assets. Generation assets are recognised in the balance sheet at fair value at the date of the valuation, less any subsequent accumulated depreciation and impairment losses. The underlying assumptions used in the valuation are reviewed at each reporting date. Revaluations are performed with sufficient regularity to ensure the carrying amount does not materially differ from the estimated fair value at balance date.
Any increase in the valuation is recognised in other comprehensive income, unless it reverses a revaluation decrease for the same asset previously recognised in the income statement, in which case it is recognised in the income
statement to the extent it reverses a decrease previously recognised. A decrease in carrying amount arising on revaluation is recognised in the income statement to the extent that it exceeds the balance, if any, held in the asset revaluation reserve for that asset. Accumulated depreciation at the date of the revaluation is eliminated against the gross carrying value so that the gross carrying amount after revaluation equals the revalued amount.
Subsequent additions to generation assets are recognised at cost. Cost includes the consideration given to acquire the asset plus any other costs incurred in bringing the asset to the location and condition necessary for its intended use, including major inspection costs, resource consent, relationship agreement costs and financing costs where appropriate.
A6. Income tax 2020$ million
Restated 2019
$ million
Current tax 44.4 41.4
Deferred tax (28.8) (17.6)
Income tax expense 15.6 23.8
Deferred tax
Restated property, plant and
equipment$ million
Oil and gas assets
$ millionProvisions
$ millionIntangibles
$ millionDerivatives
$ millionOther
$ million
Restatedtotal
$ million
Balance as at 1 July 2018 516.1 93.0 (44.9) 24.1 (9.4) (11.6) 567.3
Recognised in the income statement (0.7) (14.2) (0.4) (3.7) (4.1) 5.5 (17.6)
Recognised in other comprehensive income
110.5 - - - (6.4) - 104.1
Balance as at 30 June 2019 625.9 78.8 (45.3) 20.4 (19.9) (6.1) 653.8
Recognised in the income statement (10.8) (6.6) 0.9 (2.4) 0.2 (10.1) (28.8)
Recognised in other comprehensive income
- - - - 6.6 - 6.6
Balance as at 30 June 2020 615.1 72.2 (44.4) 18.0 (13.1) (16.2) 631.6
Income tax Income tax is recognised in the income statement unless it relates to other comprehensive income.
Current tax Current tax is the expected tax payable on taxable income for the year, using tax rates enacted or substantively enacted at the end of the reporting period, together with any unpaid tax or adjustment to tax payable in respect of previous years.
Deferred tax Deferred tax reflects the differences between the carrying amounts of assets and liabilities for financial reporting purposes and the amounts used for taxation purposes. The amount of deferred tax provided is based on the expected manner of realisation or settlement of the carrying amounts of assets and liabilities, using tax rates enacted or substantively enacted at the end of the reporting period.
Reintroduction of tax depreciation on buildings On 25 March 2020 the Government passed legislation which reintroduced tax depreciation on commercial and industrial buildings. This legislative change resulted in a $1.6 million adjustment to deferred tax.
Reconciliation of pre-tax accounting profit to income tax expense
2020$ million
Restated 2019
$ million
Profit before income tax 61.6 82.9
Income tax at 28% 17.2 23.2
Tax effect of adjustments:
Under (over) provided in prior periods
(0.4) 1.6
Non-deductible expenditure and other adjustments
0.4 (1.0)
Reintroduction of tax depreciation on buildings
(1.6) -
Income tax expense 15.6 23.8
For
per
sona
l use
onl
y

54G E N E S I S A N N U A L R E P O R T 2 0 2 053 G E N E S I S A N N U A L R E P O R T 2 0 2 0 N O T E S T O T H E C O N S O L I D A T E D F I N A N C I A L S T A T E M E N T S N O T E S T O T H E C O N S O L I D A T E D F I N A N C I A L S T A T E M E N T S
B2. Oil and gas assets Note
Exploration, evaluation and
development expenditure
$ million
Oil and gas producing
assets $ million
Other oil and gas
assets $ million
Capital work
in progress$ million
Total$ million
Carrying value at 1 July 2018 12.4 342.0 17.9 6.1 378.4
Additions 2.0 1.2 - 5.8 9.0
Transfer between asset categories - 6.3 - (6.3) -
Change in rehabilitation asset - (4.8) - - (4.8)
Depreciation and depletion expense A5 - (57.4) (1.1) - (58.5)
Carrying value at 30 June 2019 14.4 287.3 16.8 5.6 324.1
Additions 11.9 0.8 - 9.2 21.9
Transfer between asset categories - 9.9 0.4 (10.3) -
Change in rehabilitation asset - (2.4) - - (2.4)
Depreciation and depletion expense A5 - (35.0) (1.2) - (36.2)
Carrying value at 30 June 2020 26.3 260.6 16.0 4.5 307.4
Summary of cost and accumulated depreciation, depletion and impairment
Cost 32.9 759.4 25.1 5.6 823.0
Accumulated depreciation, depletion and impairment (18.5) (472.1) (8.3) - (498.9)
Carrying value at 30 June 2019 14.4 287.3 16.8 5.6 324.1
Cost 44.8 767.7 25.5 4.5 842.5
Accumulated depreciation, depletion and impairment (18.5) (507.1) (9.5) - (535.1)
Carrying value at 30 June 2020 26.3 260.6 16.0 4.5 307.4
Asset category Estimated useful lives
Buildings 50 years
Storage facilities 25 years
Sales pipeline 25 years
Motor vehicles 5 years
Other oil and gas assetsOther oil and gas assets include land, buildings, storage facilities, sales pipeline and motor vehicles. The cost of other oil and gas assets, less any estimated residual value, is depreciated on a straight-line basis.
Significant unobservable inputs Method used to determine input
Sensitivity range
Increase/(decrease) in fair value of generation assets
Inter-relationships between unobservable inputs
Wholesale electricity
price path
Average of the internally generated price path and
price paths published by independent third parties. The
average annual wholesale electricity price paths used to
value generation assets range from $88 per MWh to $114
per MWh referenced to the Otahuhu 220KV locational
node from July 2020 to June 2040.
+10%
- 10%
$550 million
($550) million
Hydrological inflows
affect generation volumes,
as well as wholesale
electricity prices.
Generation volumes In-house modelling of the wholesale electricity market.
The generation volumes used in the valuation range
between 2,827 GWh and 6,689 GWh per annum. The
low end of the range relates to periods where there is no
thermal generation.
+10%
- 10%
$408 million
($408) million
Wholesale electricity
prices affect the amount
of generation.
Discount rate Pre-tax equivalent discount rate of 9.4%. +1%
- 1%
($329) million
$419 million
Discount rate is
independent of wholesale
electricity prices and
generation volumes.
Key estimates and judgements
The wholesale electricity price path is the key driver of changes in the valuation. The price path is an average of the internally generated price path and price paths published by independent third parties. Changes in electricity demand, hydrology and new generation build affect the price path. These factors are reviewed for reasonableness by senior management personnel who are responsible for the price path used by the business.
The internally generated price path assumes national demand growth based on the latest available industry analysis and Genesis' view of economic growth. Forecast hydrology is based on 83 years of historical hydrological inflow data, and new
Leased assets Refer to the 'General information and significant matters' section for the accounting policy for leased assets.
All other categories of property, plant and equipment All other categories of property, plant and equipment, with the exception of land and capital work in progress, are recognised at cost less accumulated depreciation and any accumulated impairment losses. Land and capital work in progress are not depreciated.
Impairment Impairment of capital work in progress relates to expenditure on Huntly unit 6. Huntly unit 6 capital work in progress is impaired as incurred, as the fair value of this unit is nil. Refer to note A2 for disclosure of impairment by segment.
Asset category Estimated useful lives
Generation assets up to 85 years
Other property, plant and equipment 3 to 50 years
Leased assets 4 to 38 years
generation build assumptions are based on public information and an assessment of the wholesale electricity prices required to support new generation build. The internally generated price path assumed the ongoing operation of NZAS at Tiwai Point. This assumption is consistent with the assumption used in the price paths published by independent third parties and market data available at 30 June 2020. On 9 July 2020, NZAS announced its intention to close the Tiwai Point smelter. Greater clarity and more information is required before Genesis can estimate the financial effect this will have on the fair value of generation assets. Refer to the 'General information and significant matters' for more information. Significant unobservable inputs in the valuation model were:
Depreciation Depreciation is calculated on a straight-line basis. The estimated useful lives are reviewed annually. An asset’s carrying amount is written down immediately to its recoverable amount if the carrying amount is greater than its estimated recoverable amount.
B1. Property, plant and equipment (continued) The last revaluation of generation assets was performed on 30 June 2019. A valuation of generation assets has been undertaken. The results indicate the carrying value approximates the fair value and, as a result, the Group has not undertaken a full revaluation of generation assets at 30 June 2020.
The valuation is based on a discounted cash flow model prepared by Management, calculated by generating scheme except for the Huntly site where it is calculated by type of unit (units 1 to 4, unit 5 and unit 6). As the key inputs into the valuation are based
on unobservable market data, the valuation is classified as level 3 in the fair value hierarchy. It requires significant judgement and therefore there is a range of reasonably possible assumptions that could be used in estimating the fair value. Refer to note F8 for an overview of the fair value hierarchy.
If generation assets were carried at historical cost less accumulated depreciation and accumulated impairment, the carrying amount would be approximately $1,534.6 million (2019: $1,558.4 million).
Exploration, evaluation and development expenditureAll exploration and evaluation costs, including directly attributable overheads and general permit activity are expensed as incurred except for the costs of drilling exploration wells and the costs of acquiring new interests. The costs of drilling exploration wells are initially capitalised pending the determination of the success of the wells. Costs are expensed immediately where the work does not result in a successful discovery. Costs incurred before the Group has obtained the legal rights to explore an area are expensed as incurred.
Exploration, evaluation and development expenditure assets are not amortised; instead, they are assessed annually for indicators of impairment. Any impairment is recognised in the income statement. Once development of a project has been completed, the accumulated expenditure in relation to the project is transferred to oil and gas producing assets.
Oil and gas producing assets Oil and gas producing assets include costs associated with the production station, platform and pipeline transferred from exploration, evaluation and development expenditure, mining licences and major inspection costs. Depletion of oil and gas producing assets, excluding major inspection costs, is calculated on a unit-of-production basis using proved remaining reserves ('1P') estimated to be obtained from, or processed by, the specific asset. Major inspection costs are depreciated on a straight-line basis over the period up to the next major inspection. Major inspections occur every two to 10 years depending on the nature of the work undertaken.
For
per
sona
l use
onl
y

56G E N E S I S A N N U A L R E P O R T 2 0 2 055 G E N E S I S A N N U A L R E P O R T 2 0 2 0 N O T E S T O T H E C O N S O L I D A T E D F I N A N C I A L S T A T E M E N T S N O T E S T O T H E C O N S O L I D A T E D F I N A N C I A L S T A T E M E N T S
Goodwill Goodwill represents the excess of the cost of a business acquisition over the fair value of the Group's share of the net identifiable assets, liabilities and contingent liabilities at the date of acquisition. Goodwill is assessed as having an indefinite useful life and is not amortised but is subject to impairment testing at each reporting date or whenever there are indications of impairment. For the purpose of impairment testing, goodwill has been allocated to the following cash-generating units ('CGU'):
Goodwill by CGU 2020$ million
2019$ million
Retail – electricity and gas 102.6 102.6
Retail – LPG 112.6 112.6
Kupe 13.2 13.2
Total goodwill 228.4 228.4
Retail – electricity and gasThe goodwill associated with the electricity and gas business mainly relates to the acquisition of NGC electricity and gas business in 2002 and 2003. The impairment test is based on an estimated discounted cash flow analysis (value in use). Estimated future cash flow projections are based on the Group's five-year business plan for the CGU. Cash flows beyond the five-year business plan are extrapolated using a 1.0 per cent year-on-year growth rate (2019: 1.0 per cent). The estimated future cash flow projections are discounted using a pre-tax equivalent discount rate of 9.4 per cent (2019: 9.9 per cent). Any reasonably possible change in key assumptions on which the recoverable amount is based is not expected to cause the carrying value of the goodwill to exceed its recoverable amount.
Retail – LPG The goodwill associated with LPG relates to the acquisition of the LPG business from Nova Energy on 1 June 2017. The impairment test is based on an estimated discounted cash flow analysis (fair value less disposal costs) using ten years of forecast information. Cash flows beyond the forecast period are based on an EBITDAF multiple of 7.5x (2019: 7.5x). The estimated future cash flow projections are discounted using a pre-tax equivalent discount rate of 9.4 per cent (2019: 9.9 per cent). The forecast takes into consideration both the acquired and existing LPG business, as the assets of the acquired business are used to service the pre-acquisition LPG customers. Any reasonably possible change in key assumptions on which the recoverable amount is based is not expected to cause the carrying value of the goodwill to exceed its recoverable amount. As the valuation is based on inputs that are not based on observable market data the valuation is classified as level three in the fair value hierarchy.Refer to note F8 for an overview of the fair value hierarchy.
Key assumptions in the impairment tests for electricity and gas and LPG were:
Assumptions Method of determination
Customer numbers and customer churn
Review of actual customer numbers and historical data regarding movements in customer numbers (the historical analysis is considered against expected market trends and competition for customers).
Gross margin (electricity and gas)
Review of actual gross margins and consideration of expected market movements and impacts.
EBITDAF (LPG) Review of actual EBITDAF and consideration of expected market movements and impacts.
Cost to serve Review of actual costs to serve and consideration of expected future costs.
KupeThe goodwill associated with Kupe relates to the acquisition of the Kupe subsidiaries from New Zealand Oil and Gas Limited ('NZOG') on 1 January 2017. The impairment test is based on an estimated discounted cash flow analysis (value in use). The estimated future cash flow projections are based on proved and probable reserves ('2P'), as disclosed in note B2. The pre-tax equivalent discount rate was 9.4 per cent (2019: 9.9 per cent). Any reasonably possible change in key assumptions on which the recoverable amount is based is not expected to cause the carrying value of the goodwill to exceed its recoverable amount.
B3. Intangible assets (continued)
Key estimates and judgementsProved reserves ('1P') are the estimated quantities of oil and gas that geological and engineering data demonstrates with reasonable certainty to be recoverable in future years from known reservoirs, under existing economic and operating conditions. Proved reserves ('1P') are defined as those that have a 90 per cent likelihood of being delivered. Because the geology of the Kupe oil and gas field subsurface cannot be examined directly, an indirect technique, known as volumetrics, has been used to estimate the size and recoverability of the reserve. There are high levels of uncertainty in terms of accessibility of reserves through sealing faults and pressure support. The Joint Venture
Operator performed a review of Kupe's reserves during the year. Genesis engaged Gaffney Cline, an independent expert, to review and verify the Operator's reserve estimate, which resulted in an increase in remaining reserves for both proved reserves ('1P') and proved and probable reserves ('2P'). The increase in reserves resulted in a $17.4 million reduction in depletion expense for the year. A reduction of 10 per cent in these reserves would increase depletion charges going forward by approximately $3.5 million per annum at current production rates. The table below presents the remaining Kupe oil and gas field reserves in Peta joule equivalents ('PJe') of which the Group has a 46.0 per cent interest (2019: 46.0 per cent).
B2. Oil and gas assets (continued)
2020PJe
2019PJe
2020PJe
2019PJe
Opening remaining field reserves at 1 July 188.1 209.8 319.0 351.1
Change in reserve estimate 94.5 15.0 54.1 4.6
Production (32.6) (36.7) (32.6) (36.7)
Closing remaining field reserves at 30 June 250.0 188.1 340.5 319.0
Developed 83.5 93.3 140.2 126.5
Undeveloped 166.5 94.8 200.3 192.5
Closing remaining field reserves at 30 June 250.0 188.1 340.5 319.0
Further investment will be required to access the undeveloped field reserves disclosed above.
Proved and probable reserves (‘2P’)Proved reserves (‘1P’)
B3. Intangible assets Note
Goodwill $ million
Software$ million
Emission units held
for own use$ million
Contractual arrangements
$ million
Deferred customer
acquisition costs
$ millionTotal
$ million
Carrying value at 1 July 2018 228.4 44.4 14.7 85.9 5.6 379.0
Additions - 17.9 27.9 2.4 4.8 53.0
Transfer from property, plant and equipment B1 - 11.3 - - - 11.3
Disposal or surrender * - - (35.0) - - (35.0)
Impairment - - - (5.6) - (5.6)
Amortisation expense A5 - (16.4) - (10.1) - (26.5)
Amortisation expense included in other operating expenditure
- - - - (4.6) (4.6)
Carrying value at 30 June 2019 228.4 57.2 7.6 72.6 5.8 371.6
Additions - 18.1 64.2 0.1 3.6 86.0
Transfer from property, plant and equipment B1 - 1.3 - - - 1.3
Disposal or surrender - (0.4) (66.9) - - (67.3)
Impairment - (2.9) - - - (2.9)
Amortisation expense A5 - (17.6) - (8.6) - (26.2)
Amortisation expense included in other operating expenditure
- - - - (4.2) (4.2)
Carrying value at 30 June 2020 228.4 55.7 4.9 64.1 5.2 358.3
* The disposal or surrender of emission units held for own use includes a $12.8 million transfer to the 'held for trading' account.
Summary of cost and accumulated amortisation and impairment
Cost 228.4 225.8 7.6 102.5 18.5 582.8
Accumulated amortisation and impairment - (168.6) - (29.9) (12.7) (211.2)
Carrying value at 30 June 2019 228.4 57.2 7.6 72.6 5.8 371.6
Cost 228.4 201.0 4.9 91.0 22.1 547.4
Accumulated amortisation and impairment - (145.3) - (26.9) (16.9) (189.1)
Carrying value at 30 June 2020 228.4 55.7 4.9 64.1 5.2 358.3
The current portion of intangible assets disclosed in the balance sheet relates to emission units held for own use. All other intangible assets are non-current.
For
per
sona
l use
onl
y

58G E N E S I S A N N U A L R E P O R T 2 0 2 057 G E N E S I S A N N U A L R E P O R T 2 0 2 0 N O T E S T O T H E C O N S O L I D A T E D F I N A N C I A L S T A T E M E N T S N O T E S T O T H E C O N S O L I D A T E D F I N A N C I A L S T A T E M E N T S
C1. Receivables and prepayments 2020$ million
2019$ million
Trade receivables 113.3 99.6
Accrued revenue 103.8 97.8
Expected credit loss provision (8.0) (7.4)
Deferred customer account credits 3.6 5.5
Total 212.7 195.5
Emission units receivable 5.9 9.9
Other receivables 8.9 8.0
Prepayments 10.6 14.2
Total 238.1 227.6
Current 235.0 226.7
Non-current 3.1 0.9
Total 238.1 227.6
Trade receivables and accrualsTrade receivables and accruals are initially recognised at fair value and are subsequently measured at amortised cost. Trade receivables and accrued revenue that are known to be uncollectable are written off. Total bad debts written off during the year was $6.2 million (2019: $6.4 million).
Expected credit loss provision The expected credit loss provision is calculated using the simplified approach, which takes into account the lifetime expected credit loss on trade receivables and accrued revenue. The allowance for expected credit losses is calculated using a provision matrix, which is based on historic write offs. Where possible the percentages are adjusted for foreseeable future economic conditions which may impact the collectability of trade receivables and accrued revenue. It is possible New Zealand may enter into a recession as a result of COVID-19, which may impact the collectability of trade receivables and accrued revenue. As a result an additional amount has been provided for based on the increase in write offs experienced during the last economic down turn (Global Financial Crisis). In the prior year the provision for trade receivables and accrued revenue was based on 0.76 per cent of revenue and the provision for customers at collection agencies and unoccupied households was 85 per cent and 100 per cent respectively of the debtor balance.
Deferred customer account creditsAccount credits given to customers are included in the measurement of revenue. The account credit is spread over the term of the customer contract.
C2. Inventories 2020$ million
Restated 2019
$ million
Fuel 59.4 77.3
Petroleum products 2.5 1.6
Consumables and spare parts 29.1 27.5
Emission units held for trading 7.0 24.4
Total 98.0 130.8
Current 98.0 126.6
Non-current - 4.2
Total 98.0 130.8
Fuel, petroleum, consumables and spare parts Fuel, petroleum, consumables and spare parts are recognised at the lower of cost and net realisable value. Cost is determined using the weighted average cost basis, which includes expenditure incurred in bringing the inventories to their present location and condition, including shipping and handling. Net realisable value is the estimated selling price in the ordinary course of business less the estimated costs necessary to make the sale.
Fuel inventories mainly consist of coal used in electricity production. Fuel inventories (excluding natural gas) expensed during the year amounted to $103.1 million (2019: $101.3 million).
Petroleum products consist of LPG and light crude oil held for resale produced from the Kupe production facility. Petroleum products expensed during the year amounted to $25.8 million (2019: $26.9 million).
Consumables and spare parts are held to service or repair generating assets. Consumables and spare parts relating to Huntly unit 6 are impaired when incurred, as the fair value of this unit is nil.
Emission units held for tradingEmission units held for trading are measured at fair value. Changes in the fair value are recognised in the income statement within other gains (losses). The fair value is determined using the OM Financial forward curve. As the fair value is calculated using inputs that are not quoted prices, the units are classified as level two in the fair value hierarchy. Refer to note F8 for an overview of the fair value hierarchy.
C3. Payables and accruals 2020$ million
Restated^ 2019
$ million
Trade payables and accruals 200.7 196.9
Employee benefits 13.4 12.1
Emission obligations 27.6 33.2
Total 241.7 242.2
Current 233.6 241.5
Non-current 8.1 0.7
Total 241.7 242.2
C. Working capital and provisionsSoftware Software are assets with finite lives. These assets are recognised at cost less accumulated amortisation and impairment losses. Amortisation is recognised in the income statement on a straight-line basis over the estimated useful life of the asset from the date it is available for use. The estimated useful life is between one and ten years.
Impairment in the current year relates to internally developed software projects which have been discontinued.
Emission units held for own use Emission units held for own use are used to settle the Group's emission obligation. The units are initially recognised at fair value and are not revalued. As the units do not have an expiry date they have an indefinite useful life. The units are not amortised but are subject to impairment testing.
Contractual arrangements Contractual arrangements include customer contracts and relationships acquired through business acquisitions, and sponsorship contracts.
Customer contracts and relationships Customer contracts and relationships are assets with finite lives. These assets are recognised at cost less accumulated amortisation and impairment losses.
Amortisation of customer contracts and relationships related to Kupe are recognised in the income statement on a units-of-use basis, using proved remaining reserves ('1P') expected to be obtained over the contract period. Remaining reserves used in the calculations range from 160.7 to 250.0 PJe (2019: 164.7 to 188.1 PJe). Refer to note B2 for further information on the reserves estimate.
B3. Intangible assets (continued)
Amortisation of customer contracts and relationships related to the LPG business are recognised in the income statement on a diminishing-value basis over the estimated life of the contract or relationship to reflect the likely churn of customers. The majority of the assets have 50-year lives with one contract having a five-year life.
Impairment in the prior year relates to a change in the term of a contract.
Sponsorship contracts Sponsorship contracts are assets with finite lives. These assets are recognised at cost less accumulated amortisation and impairment losses. Amortisation is recognised in the income statement on a straight-line basis over the estimated useful life of the asset from the date it is available for use. The useful life is based on the contract period, which ranges between one and 15 years.
Deferred customer acquisition costsCustomer acquisition costs that are directly attributable to securing a particular customer contract are capitalised and amortised over the length of the average customer tenure (30 months). Amortisation of these costs is included within operating expenditure.
Emission obligationsEmission obligations are recognised as a liability when the Group incurs the emission obligation. Emission units payable to third parties are recognised at the average cost of emission units on hand, up to the amount of units on hand at the recognition date. Where the emission obligation exceeds the level of units on hand, the excess obligation is measured at the contract price where forward contracts exist or the market price for any obligation not covered by units on hand or forward contracts.
Trade payables and accruals Trade payables and accruals are recognised when the Group becomes obligated to make future payments, resulting from the purchase of goods or services, and are subsequently carried at amortised cost.
Employee benefits A liability for employee benefits (wages and salaries, annual and long-service leave and employee incentives) is recognised when it is probable that settlement will be required and the amount is capable of being measured reliably. Provisions made in respect of employee benefits are measured using the remuneration rate expected to apply at the time of settlement.
Expected credit loss Residential Business
0-30 days overdue 0.79% 0.12%
30-60 days overdue 2.92% 1.20%
60-90 days overdue 5.77% 2.75%
90+ days overdue 3.09% 0.47%
Debt at collection agency 82% 55%
Unoccupier debt 100% 100%
^$3.2 million has been reclassified from trade payables and accruals to employee benefits for comparability purposes.
For
per
sona
l use
onl
y

60G E N E S I S A N N U A L R E P O R T 2 0 2 059 G E N E S I S A N N U A L R E P O R T 2 0 2 0 N O T E S T O T H E C O N S O L I D A T E D F I N A N C I A L S T A T E M E N T S N O T E S T O T H E C O N S O L I D A T E D F I N A N C I A L S T A T E M E N T S
Name of entity Principal activityPlace of incorporation
2020%
2019%
Kupe Venture Limited Joint venture holding company New Zealand 100 100
Genesis Energy Insurance Pte Limited Captive insurance company Singapore 100 100
Genesis Energy Talent Retention Plan Trust Trust New Zealand - -
Genesis Energy Limited Executive Long-term Incentive Plan Trust Trust New Zealand - -
All entities have 30 June balance dates.
Interest held
D. Group structureD1. Subsidiaries and controlled entitiesThe consolidated financial statements include Genesis, its subsidiaries and controlled entities listed below. The two Trusts have been consolidated into the Group on the basis that Genesis determined how the Trusts were designed and how they operate, Genesis controls the financing and investing activities of the Trusts and the Trusts are dependent on funding from Genesis.
C4. ProvisionsNote
Contractual arrangements
$ million
Rehabilitation and restoration
$ million
Restated other
provisions$ million
Restated total
$ million
Balance at 1 July 2018 50.1 111.8 0.9 162.8
Created 4.0 1.8 0.3 6.1
Released - (5.8) - (5.8)
Used (3.9) (0.1) - (4.0)
Time value of money adjustment E6 1.6 4.5 - 6.1
Balance at 30 June 2019 51.8 112.2 1.2 165.2
Created 0.4 1.6 - 2.0
Released (0.6) (2.4) - (3.0)
Used (6.7) (1.7) (0.3) (8.7)
Time value of money adjustment E6 1.4 3.6 - 5.0
Balance at 30 June 2020 46.3 113.3 0.9 160.5
Current 8.2 2.5 0.6 11.3
Non-current 43.6 109.7 0.6 153.9
As at 30 June 2019 51.8 112.2 1.2 165.2
Current 5.6 3.3 - 8.9
Non-current 40.7 110.0 0.9 151.6
As at 30 June 2020 46.3 113.3 0.9 160.5
Rehabilitation and restoration The majority of this provision relates to the remediation of the Huntly ash ponds and the Kupe production facility. The provision represents the present value of the Group's best estimate of future expenditure to be incurred to remediate the sites at balance date. Key assumptions include: an estimate of when the rehabilitation and restoration is likely to take place, the possible remediation alternatives available, the expected expenditures attached to each alternative and the foreign currency exchange rate.
There is no provision for the remediation of the Huntly generation site because the Group has the right to lease the site in perpetuity, there is no fixed or planned termination date for the Huntly lease and the site remains a key electricity generation site for the Group. The lease of the site is independent of decisions around the retirement of Huntly units 1 to 4, which are planned to be available to the electricity market until such time they are uneconomic to run. There may be costs and recoveries associated with retiring Huntly units 1 to 4 but these cannot be reliably estimated at this time.
Contractual arrangementsContractual arrangements provisions relate to sponsorship and relationship agreements with various parties. The provisions represent the present value of the best estimate of cash flows required to settle the Group's obligations under the agreements. The timing of the outflows is expected to occur over the next 19 years.
Key estimates and judgementsThe key assumptions that could have a material impact on the Kupe production facility rehabilitation estimate relate to foreign exchange rates, mobilisation and demobilisation costs for rig and offshore supply vessel and regulatory requirements in relation to the removal of the subsea pipeline. The majority of costs are based in United States dollars and, therefore, are sensitive to fluctuations in foreign exchange rates. If the foreign exchange rate were to decrease by 10 per cent the provision would increase by $10.7 million. Given the equipment required to complete the rehabilitation comes from overseas, the mobilisation and demobilisation costs can fluctuate significantly depending on the volume of work the contractor has nearby at the time the rehabilitation is required to be completed. The full cost of mobilisation and demobilisation has been provided for, given the uncertainty around the ability to share these costs with other entities. If the costs could be shared with other entities the provision would decrease by between $10.0 million and $20.0 million. The provision is based on the removal of the shore section of the subsea pipeline. The remaining pipeline will be flushed and left in situ. If all of the pipeline needed to be removed, the cost would increase the provision by $16.6 million. The rehabilitation is estimated to be completed in approximately 16 years.
D2. Joint operationsThe Group has a 46.0 per cent interest in the Kupe production facility and Petroleum Mining Permit 38146 held by the Kupe Joint Venture (2019: 46.0 per cent). The principal activity of the Kupe Joint Venture is petroleum production and sales. The Joint Venture is unincorporated and operates in New Zealand. The Group is considered to share joint control based on the contractual arrangements between the Group and other joint operators that state unanimous decision-making is required for relevant activities that most significantly impact the returns of the joint operation.
The Joint Venture is classified as a joint operation under NZ IFRS 11 Joint Arrangements. The Group's share of revenue, expenditure, assets and liabilities is included in the Group financial statements on a proportionate line-by-line basis. The operating results of the Kupe Joint Venture are included in
Name of entity Principal activityPlace of incorporation
2020%
2019%
2020$ million
2019$ million
DrylandCarbon One Limited Partnership Investment in forestry New Zealand 25.2 25.2 5.3 0.2
Sustainable Mobility Limited* EV car sharing New Zealand 40.0 - 1.4 -
Total 6.7 0.2
Interest held
the Kupe segment in note A2 and the Group's share of capital expenditure commitments relating to joint operations is disclosed in note G4.
Kupe Venture Limited is a party to a Deed of Cross Charge ('Deed'). The Deed was entered into pursuant to the Kupe Joint Venture Operating Agreement ('JVOA') for the purpose of securing the joint venture parties payment obligations under the JVOA. Each joint venture party has granted a security interest in its participating interest in the joint venture (together with certain related assets e.g. its petroleum derived from operations under the JVOA), in favour of the other joint venture parties. If a joint venture party defaults in the performance of an obligation to pay an amount due and payable under the JVOA, the appointed agent may enforce on behalf of the non-defaulting joint venture parties, the security interests created by the Deed.
During the year Genesis purchased a 40 per cent interest in Sustainable Mobility Limited (formerly Yoogo Share Limited). The investment enables Genesis to support businesses and individuals to reduce their carbon emissions. The Group's share in Sustainable Mobility Limited and DrylandCarbon One Limited Partnership profit/loss is disclosed in the income statement.
D3. Share in associatesThe Group has interests in the following arrangements, which are accounted for as associates using the equity method.
*Trading as Zilch
For
per
sona
l use
onl
y

62G E N E S I S A N N U A L R E P O R T 2 0 2 061 G E N E S I S A N N U A L R E P O R T 2 0 2 0 N O T E S T O T H E C O N S O L I D A T E D F I N A N C I A L S T A T E M E N T S N O T E S T O T H E C O N S O L I D A T E D F I N A N C I A L S T A T E M E N T S
E5. Borrowings
Weightedaverage
effectiveinterest rate %
2020$ million
Restated 2019
$ million
Revolving credit and money market
Floating 252.3 154.5
Term loan facility 4.6% 30.0 30.0
Wholesale term notes 5.4% 172.4 292.8
Retail term notes 4.3% 100.8 100.7
Capital bonds 5.5% 481.7 474.5
United States Private Placement ('USPP')
1.8% 266.5 237.3
Lease liability 5.5% 63.7 65.2
Total 1,367.4 1,355.0
Current 19.9 181.6
Non-current 1,347.5 1,173.4
Total 1,367.4 1,355.0
Borrowings Borrowings are initially recognised at fair value, net of transaction costs incurred and are subsequently measured at amortised cost using the effective interest rate method. Borrowings designated in a fair value hedge relationship are carried at amortised cost adjusted for the change in the fair value of the hedged risk.
Borrowings are classified as current liabilities unless the Group has an unconditional right to defer settlement of the liability for at least 12 months after the balance date.
Reconciliation of change in liabilities arising from financing activities
2020$ million
Restated 2019
$ million
Opening balance 1,355.0 1,325.4
Proceeds from borrowings 97.6 240.0
Repayment of borrowings (excluding leases)
(120.0) (232.6)
Repayment of lease liability (6.2) (6.2)
Non-cash changes
Lease liability additions and adjustments 4.7 1.4
Change in foreign exchange on USPP 9.2 1.6
Change in fair value interest rate risk adjustment
25.5 27.7
Amortisation of capitalised issue costs 1.8 (1.4)
Change in accrued interest (0.2) (0.9)
Closing balance 1,367.4 1,355.0
Bonds issued during the prior yearOn 16 July 2018 the Group exercised its right to redeem $200.0 million of fixed rate subordinated capital bonds with an original maturity date of 15 July 2041. The redeemed capital bonds were replaced by $240.0 million capital bonds with a maturity date of 16 July 2048. This issue pays a quarterly coupon of 4.65 per cent per annum. On the first reset date and every five years thereafter, the interest rate will reset to be the sum of the five-year swap rate on the relevant reset date plus the margin of 2.01 per cent per annum plus the step-up margin of 0.25 per cent per annum. Issue costs are amortised over five years to the first reset date. An interest rate swap has been used to manage the fair value risk of the bonds.
Analysis of borrowings 2020$ million
2019$ million
Money market 2.0 44.4
Revolving credit drawn down 250.0 110.0
Accrued interest 0.3 0.1
Total revolving credit and money market 252.3 154.5
Expiring FY21 30.0 80.0
Expiring FY22 120.0 70.0
Expiring FY23 225.0 150.0
Expiring FY24 50.0 50.0
Total available revolving credit facilities 425.0 350.0
Revolving credit drawn down (excluding accrued interest)
250.0 110.0
Total undrawn revolving credit facilities 175.0 240.0
Expiring FY24 30.0 30.0
Total term loan facility 30.0 30.0
Expiring FY20 - 120.0
Expiring FY23 70.0 70.0
Expiring FY25 100.0 100.0
Accrued interest 2.6 3.1
Capitalised issue costs (0.2) (0.3)
Total wholesale term notes 172.4 292.8
Expiring FY22 100.0 100.0
Accrued interest 1.1 1.2
Capitalised issue costs (0.3) (0.5)
Total retail term notes 100.8 100.7
Expiring FY47 225.0 225.0
Expiring FY49 240.0 240.0
Fair value interest rate risk adjustment 17.3 11.5
Accrued interest 3.1 3.1
Capitalised issue costs (3.7) (5.1)
Total capital bonds 481.7 474.5
Expiring FY26 77.5 74.4
Expiring FY27 155.0 148.9
Fair value interest rate risk adjustment 31.3 11.6
Accrued interest 3.2 3.0
Capitalised issue costs (0.5) (0.6)
Total USPP 266.5 237.3
E. FundingE1. Capital managementThe Group manages its capital to ensure that each entity in the Group will be able to continue as a going concern while maximising the return to shareholders through the appropriate balance of debt and equity. This is achieved by ensuring that the level and timing of its capital investment programmes, equity raisings and dividend distributions are consistent with the Group's capital structure strategy. This strategy remains unchanged from previous years. The capital structure of the Group consists of debt, which includes the borrowings disclosed in note E5, cash and cash equivalents and equity attributable to the shareholders of Genesis, comprising issued capital, reserves and retained earnings, as disclosed in the balance sheet.
E2. Share capitalNote
2020No. of sharesmillion
2020$ million
2019No. of sharesmillion
2019$ million
Balance as at 1 July 1,022.4 597.6 1,007.6 557.7
Shares acquired for LTI and TRP plans - (0.1) (0.5) (1.3)
Shares issued to LTI and TRP participants 0.2 0.2 0.2 0.3
Shares issued under dividend reinvestment plan E4 13.8 37.3 15.1 40.9
Balance as at 30 June 1,036.4 635.0 1,022.4 597.6
Issued capital 1,037.4 637.5 1,023.6 600.6
Treasury shares (1.0) (2.5) (1.2) (3.0)
Total share capital 1,036.4 635.0 1,022.4 597.6
E3. Earnings per share 2020
Restated2019
Net profit for the year attributable to shareholders ($ million) 46.0 59.1
Weighted average number of ordinary shares (million units) 1,029.5 1,015.3
Less weighted average number of Treasury shares (million units) (1.0) (1.1)
Weighted average number of shares used in EPS calculation (million units) 1,028.5 1,014.2
Cents Cents
Basic and diluted EPS 4.47 5.83
E4. Dividends Note
2020 Imputation
2020 Cents
per share2020
$ million2019
Imputation
2019 Cents
per share2019
$ million
Dividends declared and paid during the year
Prior year final dividend 80% 8.60 88.0 80% 8.60 86.7
Current year interim dividend 80% 8.525 87.7 80% 8.45 85.8
17.125 175.7 17.05 172.5
Less shares issued under the dividend reinvestment plan
E2 (37.3) (40.9)
Cash dividend paid 138.4 131.6
Dividends declared subsequent to balance date
Final dividend 80% 8.675 90.0 80% 8.60 88.0
Imputation creditsThere were no imputation credits as at 30 June 2020 (2019: nil). Future tax payments will cover the imputation of dividends.
All shares are ordinary authorised, issued and fully paid shares. They all have equal voting rights and share equally in dividends and any surplus on winding up. Treasury shares relate to shares
Under the Group's debt funding facilities, the Group has given undertakings that the ratio of debt to equity will not exceed a prescribed level and the interest cover will not be below a prescribed level. For the purpose of these undertakings the capital bonds and related interest costs are treated as 50 per cent equity. The covenants are monitored on a regular basis to ensure they are complied with. There were no breaches in covenants during the year (2019: nil).
held in trust for the Long-Term Incentive Plan ('LTI') and the employee Talent Retention Plan ('TRP') (refer to note G1 and G2).
For
per
sona
l use
onl
y

64G E N E S I S A N N U A L R E P O R T 2 0 2 063 G E N E S I S A N N U A L R E P O R T 2 0 2 0 N O T E S T O T H E C O N S O L I D A T E D F I N A N C I A L S T A T E M E N T S N O T E S T O T H E C O N S O L I D A T E D F I N A N C I A L S T A T E M E N T S
F. Risk managementThe Group's activities expose it to a variety of financial risks, including market risk (price risk, interest rate risk and foreign exchange risk), credit risk and liquidity risk. The Board has established policies that provide an overall risk management framework, as well as policies covering specific areas, such as electricity and oil price risk, interest rate risk, foreign exchange risk, credit risk, liquidity risk and the use of derivatives. Compliance with policies is monitored by the risk assurance function.
Market risk
Nature and exposure to the Group Note How the risk is managed
Price riskThe Group is exposed to movements in the spot price of electricity arising through the sale and purchase of electricity to and from the market, movements in the spot price of light crude oil arising from oil sales and movements in the spot price of emission units.
F2
The Group aims to hedge price risk on electricity sales and purchases, oil sales and emission costs by entering into electricity swaps and options and PPAs, oil price swaps and forward purchase agreements for emission units, in line with policy limits.
The Electricity hedging policy focuses on the Group's net exposure to electricity prices over a three-year period, with greater focus on the near-term period. The Treasury policy requires that 50-90 per cent of oil sales are fixed for a period of up to one year. The range decreases to a maximum of 50 per cent for sales forecasted in two to three years' time. The Carbon hedging policy focuses on managing price risk using units on hand and forward purchase agreements to cover price risk in the short to medium term.
Interest rate riskThe Group is exposed to interest rate risk because Genesis borrows funds at both fixed and floating interest rates. Changes in market interest rates expose the Group to changes in:
• Future interest payments on borrowings subject to floating interest rates (cash flow risk); and
• The fair value of borrowings subject to fixed interest rates (fair value risk).
F3
The Group uses interest rate swaps to manage interest rate risk in line with the Group's Treasury policy. The Treasury policy requires that 50-100 per cent of projected debt is fixed for a period of up to one year. The range decreases as the age profile increases to a maximum of 20 per cent for debt due in 10-15 years.
Foreign exchange riskThe Group is exposed to foreign currency risk as a result of capital and operational transactions and borrowings denominated in a currency other than the Group's functional currency.
F4
Capital and operating transactionsThe Group uses foreign exchange contracts to manage foreign exchange risk on capital and operational transactions (including maintenance of capital equipment and oil sales) in accordance with the Group's Treasury policy. The Treasury policy requires that 50-90 per cent of projected oil sales are fixed for a period of up to one year. The range decreases as the age profile increases to a maximum of 50 per cent for projected oil sales in two to three years' time. All foreign currency exposures on capital commitments are hedged, as well as operating commitments over $0.5 million.
Overseas borrowings The Group uses CCIRS to manage foreign exchange risk on overseas borrowings. All interest and principal repayments are hedged. The combination of the foreign-denominated debt and CCIRS results in a net exposure to New Zealand dollar floating interest rates and a fixed New Zealand dollar-denominated principal repayment. The New Zealand dollar floating interest rate risk is managed using the process described in the interest rate risk section above.
The Group uses the following derivatives to hedge its financial risk exposures:
• Electricity swaps and options and electricity power purchase agreements ('PPA');
• Oil price swaps;
• Forward purchase agreements for emission units;
• Foreign exchange contracts;
• CCIRS; and
• Interest rate swaps.
A summary of the financial risks that impact the Group, how they arise and how they are managed is presented below:
USPPDuring the 2015 financial year the Group issued $150.0 million United States dollar-denominated unsecured notes to United States-based institutional investors. Cross currency interest rate swaps ('CCIRS') have been used to manage foreign exchange and interest rate risks on the notes (refer to note F4 for further information on CCIRS).
While the New Zealand dollar amount required to repay the USPP is fixed as a result of the CCIRS, the USPP is required to be translated to New Zealand dollars at the spot rate at the reporting date. Any revaluation of the USPP as a result of this translation is offset by the change in the fair value of the CCIRS.
Capital bondsThe interest rate on the capital bonds resets every five years. The next interest rate reset is June 2022 for the FY47 bonds and July 2023 for the FY49 bonds.
Fair value of borrowings held at amortised cost
2020 Carrying
value$ million
2020Fair
value$ million
2019
Carrying value
$ million
2019 Fair
value$ million
Level one
Retail term notes
100.8 106.3 100.7 105.7
Capital bonds 481.7 498.6 474.5 498.6
Level two
Term loan facility 30.0 32.5 30.0 32.1
Wholesale term notes
172.4 195.0 292.8 316.0
USPP 266.5 271.1 237.3 241.6
E6. Finance expense Note
2020$ million
Restated 2019
$ million
Interest on borrowings (excluding capital bonds and lease liability)
37.5 42.8
Interest on capital bonds 25.4 25.3
Interest on lease liability 3.6 3.8
Total interest on borrowings 66.5 71.9
Other interest and finance charges
0.8 0.4
Time value of money adjustments on provisions
C4 5.0 6.1
Capitalised finance expenses (1.5) (0.7)
Total 70.8 77.7
Weighted average capitalisation rate 5.5% 5.9%
Interest on borrowings, bank and facility fees and transaction costs are recognised in the income statement over the period of the borrowings, using the effective interest rate method, unless such costs relate to funding capital work in progress. Time value of money adjustments on provisions are recognised in the income statement up to the point the provision is used or released.
Finance expense on capital work in progress (qualifying assets) is capitalised during the construction period. The capitalisation rate used to determine the amount of finance expense to be capitalised is based on the weighted average finance expenses incurred by the Group.
The valuation of the term loan facility and the wholesale term notes is based on estimated discounted cash flow analyses, using applicable market yield curves adjusted for the Group's credit rating. The credit-adjusted market yield curves at balance date used in the valuation ranged from 1.5 per cent to 1.8 per cent (2019: 1.9 per cent to 3.0 per cent).
The valuation of USPP is based on estimated discounted cash flow analyses, using applicable United States market yield curves adjusted for the Group's credit rating. The credit-adjusted market yield at balance date used in the valuation was 1.1 per cent (2019: 2.6 per cent).
The carrying value of all other borrowings approximate their fair values.
SecurityAll of the Group's borrowings are unsecured. The Group borrows under a negative pledge arrangement, which does not permit the Group to grant any security interest over its assets, unless it is an exception permitted within the negative pledge.
E5. Borrowings (continued)
For
per
sona
l use
onl
y
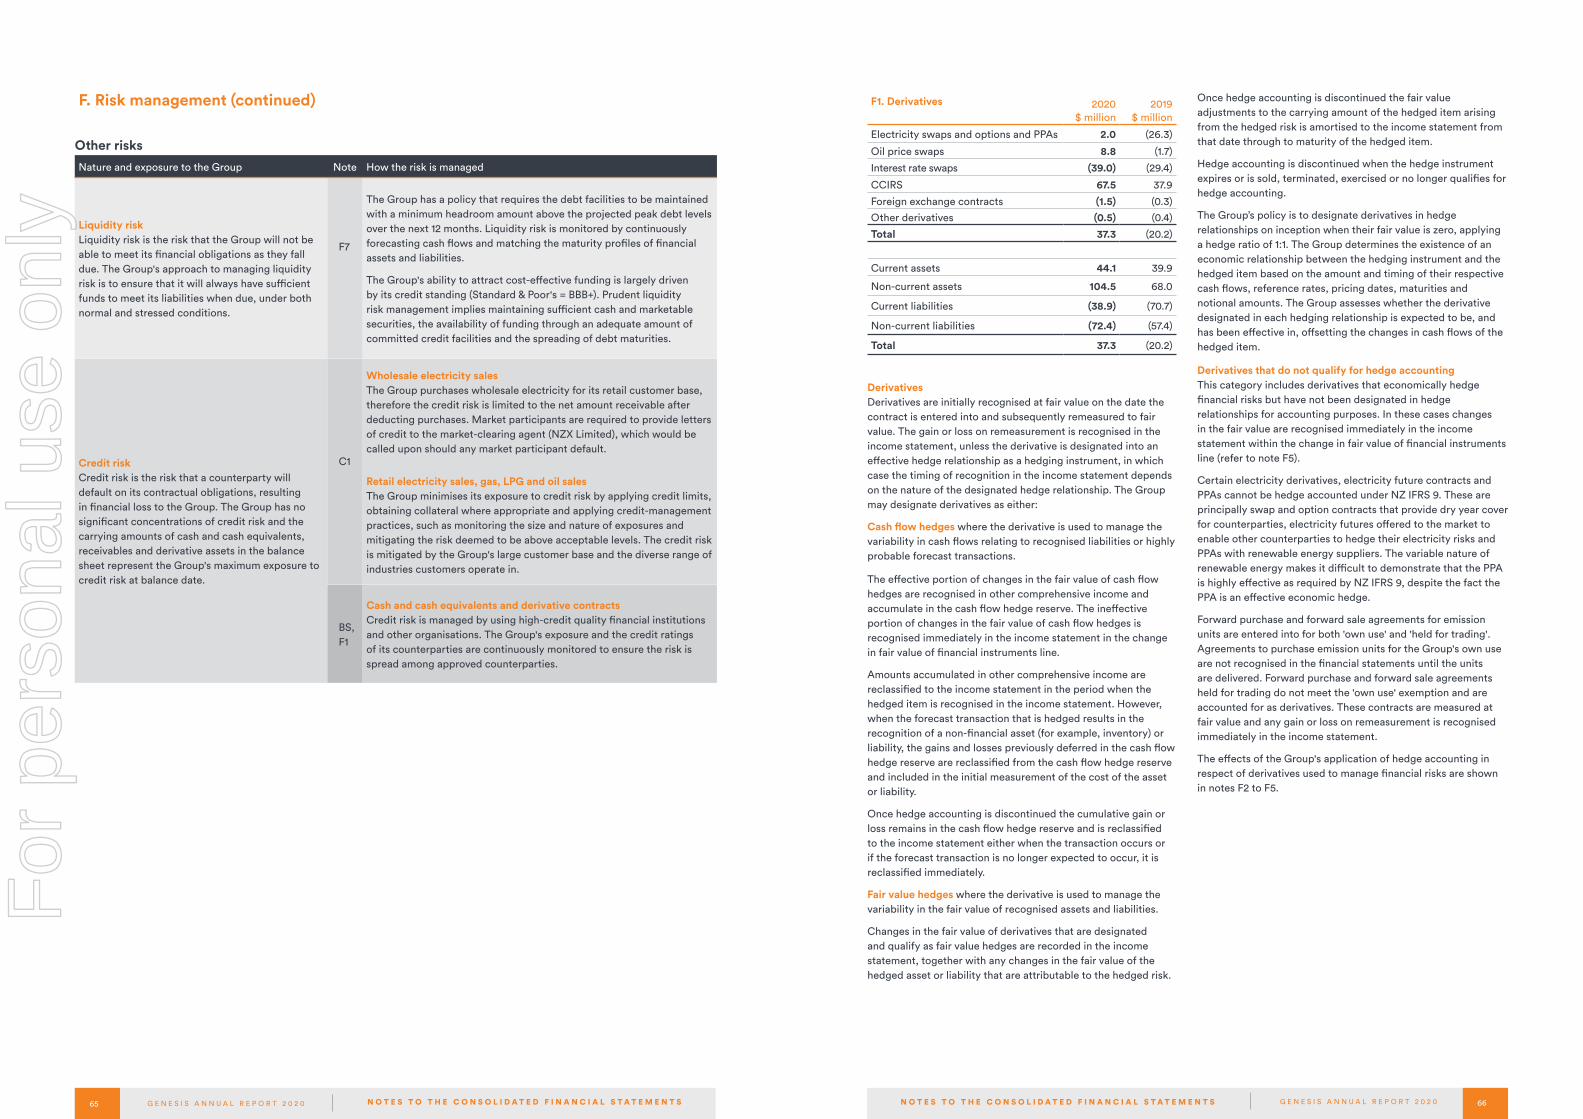
66G E N E S I S A N N U A L R E P O R T 2 0 2 065 G E N E S I S A N N U A L R E P O R T 2 0 2 0 N O T E S T O T H E C O N S O L I D A T E D F I N A N C I A L S T A T E M E N T S N O T E S T O T H E C O N S O L I D A T E D F I N A N C I A L S T A T E M E N T S
F1. Derivatives 2020$ million
2019$ million
Electricity swaps and options and PPAs 2.0 (26.3)
Oil price swaps 8.8 (1.7)
Interest rate swaps (39.0) (29.4)
CCIRS 67.5 37.9
Foreign exchange contracts (1.5) (0.3)
Other derivatives (0.5) (0.4)
Total 37.3 (20.2)
Current assets 44.1 39.9
Non-current assets 104.5 68.0
Current liabilities (38.9) (70.7)
Non-current liabilities (72.4) (57.4)
Total 37.3 (20.2)
DerivativesDerivatives are initially recognised at fair value on the date the contract is entered into and subsequently remeasured to fair value. The gain or loss on remeasurement is recognised in the income statement, unless the derivative is designated into an effective hedge relationship as a hedging instrument, in which case the timing of recognition in the income statement depends on the nature of the designated hedge relationship. The Group may designate derivatives as either:
Cash flow hedges where the derivative is used to manage the variability in cash flows relating to recognised liabilities or highly probable forecast transactions.
The effective portion of changes in the fair value of cash flow hedges are recognised in other comprehensive income and accumulate in the cash flow hedge reserve. The ineffective portion of changes in the fair value of cash flow hedges is recognised immediately in the income statement in the change in fair value of financial instruments line.
Amounts accumulated in other comprehensive income are reclassified to the income statement in the period when the hedged item is recognised in the income statement. However, when the forecast transaction that is hedged results in the recognition of a non-financial asset (for example, inventory) or liability, the gains and losses previously deferred in the cash flow hedge reserve are reclassified from the cash flow hedge reserve and included in the initial measurement of the cost of the asset or liability.
Once hedge accounting is discontinued the cumulative gain or loss remains in the cash flow hedge reserve and is reclassified to the income statement either when the transaction occurs or if the forecast transaction is no longer expected to occur, it is reclassified immediately.
Fair value hedges where the derivative is used to manage the variability in the fair value of recognised assets and liabilities.
Changes in the fair value of derivatives that are designated and qualify as fair value hedges are recorded in the income statement, together with any changes in the fair value of the hedged asset or liability that are attributable to the hedged risk.
Once hedge accounting is discontinued the fair value adjustments to the carrying amount of the hedged item arising from the hedged risk is amortised to the income statement from that date through to maturity of the hedged item.
Hedge accounting is discontinued when the hedge instrument expires or is sold, terminated, exercised or no longer qualifies for hedge accounting.
The Group’s policy is to designate derivatives in hedge relationships on inception when their fair value is zero, applying a hedge ratio of 1:1. The Group determines the existence of an economic relationship between the hedging instrument and the hedged item based on the amount and timing of their respective cash flows, reference rates, pricing dates, maturities and notional amounts. The Group assesses whether the derivative designated in each hedging relationship is expected to be, and has been effective in, offsetting the changes in cash flows of the hedged item.
Derivatives that do not qualify for hedge accountingThis category includes derivatives that economically hedge financial risks but have not been designated in hedge relationships for accounting purposes. In these cases changes in the fair value are recognised immediately in the income statement within the change in fair value of financial instruments line (refer to note F5).
Certain electricity derivatives, electricity future contracts and PPAs cannot be hedge accounted under NZ IFRS 9. These are principally swap and option contracts that provide dry year cover for counterparties, electricity futures offered to the market to enable other counterparties to hedge their electricity risks and PPAs with renewable energy suppliers. The variable nature of renewable energy makes it difficult to demonstrate that the PPA is highly effective as required by NZ IFRS 9, despite the fact the PPA is an effective economic hedge.
Forward purchase and forward sale agreements for emission units are entered into for both 'own use' and 'held for trading'. Agreements to purchase emission units for the Group's own use are not recognised in the financial statements until the units are delivered. Forward purchase and forward sale agreements held for trading do not meet the 'own use' exemption and are accounted for as derivatives. These contracts are measured at fair value and any gain or loss on remeasurement is recognised immediately in the income statement.
The effects of the Group's application of hedge accounting in respect of derivatives used to manage financial risks are shown in notes F2 to F5.
F. Risk management (continued)
Other risks
Nature and exposure to the Group Note How the risk is managed
Liquidity riskLiquidity risk is the risk that the Group will not be able to meet its financial obligations as they fall due. The Group's approach to managing liquidity risk is to ensure that it will always have sufficient funds to meet its liabilities when due, under both normal and stressed conditions.
F7
The Group has a policy that requires the debt facilities to be maintained with a minimum headroom amount above the projected peak debt levels over the next 12 months. Liquidity risk is monitored by continuously forecasting cash flows and matching the maturity profiles of financial assets and liabilities.
The Group's ability to attract cost-effective funding is largely driven by its credit standing (Standard & Poor's = BBB+). Prudent liquidity risk management implies maintaining sufficient cash and marketable securities, the availability of funding through an adequate amount of committed credit facilities and the spreading of debt maturities.
Credit riskCredit risk is the risk that a counterparty will default on its contractual obligations, resulting in financial loss to the Group. The Group has no significant concentrations of credit risk and the carrying amounts of cash and cash equivalents, receivables and derivative assets in the balance sheet represent the Group's maximum exposure to credit risk at balance date.
C1
Wholesale electricity salesThe Group purchases wholesale electricity for its retail customer base, therefore the credit risk is limited to the net amount receivable after deducting purchases. Market participants are required to provide letters of credit to the market-clearing agent (NZX Limited), which would be called upon should any market participant default.
Retail electricity sales, gas, LPG and oil salesThe Group minimises its exposure to credit risk by applying credit limits, obtaining collateral where appropriate and applying credit-management practices, such as monitoring the size and nature of exposures and mitigating the risk deemed to be above acceptable levels. The credit risk is mitigated by the Group's large customer base and the diverse range of industries customers operate in.
BS, F1
Cash and cash equivalents and derivative contractsCredit risk is managed by using high-credit quality financial institutions and other organisations. The Group's exposure and the credit ratings of its counterparties are continuously monitored to ensure the risk is spread among approved counterparties.
For
per
sona
l use
onl
y

68G E N E S I S A N N U A L R E P O R T 2 0 2 067 G E N E S I S A N N U A L R E P O R T 2 0 2 0 N O T E S T O T H E C O N S O L I D A T E D F I N A N C I A L S T A T E M E N T S N O T E S T O T H E C O N S O L I D A T E D F I N A N C I A L S T A T E M E N T S
CCIRS (cash flow and fair value hedge)
Foreign exchange contracts (cash flow hedge)
F5. Impact of derivatives on the income statement and equity The tables below provide a break down of the change in fair value of financial instruments recognised in the income statement and a reconciliation of movements in the cash flow hedge reserve.
Change in fair value of financial instruments Note
2020$ million
2019$ million
CCIRS 19.5 16.8
Interest rate swaps 5.8 10.6
Fair value interest rate risk adjustment on borrowings (25.5) (27.7)
Fair value hedges – gain (loss) (0.2) (0.3)
Cash flow hedges – hedge ineffectiveness – gain (loss) F2 3.3 (1.8)
Electricity swaps and options and PPAs (4.6) (13.1)
Other derivatives 0.9 -
Derivatives not designated as hedges – gain (loss) (3.7) (13.1)
Total change in fair value of financial instruments (0.6) (15.2)
Reconciliation of movements in the cash flow hedge reserve 2020$ million
2019$ million
Opening balance (59.7) (43.3)
Total reclassified from the cash flow hedge reserve to the income statement 3.8 25.2
Effective gain (loss) on cash flow hedges recognised directly in the cash flow hedge reserve 20.3 (48.1)
Total recognised in other comprehensive income 24.1 (22.9)
Total reclassified from the cash flow hedge reserve to the cost of assets (0.5) 0.1
Income tax on change in cash flow hedge reserve (6.6) 6.4
Closing balance (42.7) (59.7)
The amount accumulated in the cost of hedging reserve at 30 June 2020 was $1.5 million (2019: $1.4 million).
F4. Foreign exchange risk 2020$ million
2019$ million
2020$ million
2019$ million
Nominal amount at balance date 193.2 193.2 (26.3) (36.6)
Carrying value of asset at balance date 67.5 37.9 0.2 0.4
Carrying value of liability at balance date - - (1.7) (0.7)
Recognised in other comprehensive income during the year 7.0 (0.4) (3.0) 0.2
Reclassified to the cost of assets - - (0.5) 0.1
Reclassified to the income statement during the year (6.0) (0.4) 2.1 (0.1)
The Group enters into foreign exchange contracts to hedge highly probable forecast transactions denominated in foreign currencies. Cash flow hedge accounting is applied. The amount and maturity of the derivative and forecast transactions are aligned to ensure the hedge relationship remains effective.
The Group uses CCIRS to manage foreign exchange risk on the USPP. All interest and principal repayments are hedged. The combination of the foreign-denominated debt and CCIRS results in a net exposure to New Zealand dollar floating interest rates and a fixed New Zealand dollar-denominated principal repayment.
The principal, basis and margin components of the CCIRS are designated as a cash flow hedge and the benchmark component of the CCIRS is designated as a fair value hedge of the USPP notes. The change in fair value relating to the foreign currency basis spread component of the CCIRS is excluded from the hedge relationship. The change is recognised in other comprehensive income in a separate Cost of Hedging Reserve (CoHR).
Gains and losses on foreign exchange contracts reclassified to the income statement are recognised in operating expenses and oil revenue. Gains and losses reclassified to the income statement on CCIRS are recognised in finance expenses.
F2. Price risk 2020$ million
2019$ million
2020$ million
2019$ million
Nominal amount at balance date 862.2 1,575.4 USD 19.1 USD 24.5
Carrying value of asset at balance date 15.7 22.0 8.8 1.0
Carrying value of liability at balance date (23.2) (62.4) - (2.7)
Recognised in other comprehensive income during the year 20.5 (60.4) 5.8 19.1
Reclassified to the income statement during the year 9.5 39.2 4.7 (5.7)
Hedge ineffectiveness (gain (loss)) during the year 3.2 (3.2) 0.1 1.4
Electricity swaps Oil price swaps
Electricity swaps are entered into to manage the variability of cash flows from electricity purchases and sales. Oil price swaps are entered into to manage the variability of cash flows from oil sales. Cash flow hedge accounting is applied.
Gains and losses on electricity swaps are recognised in electricity revenue and gains and losses on oil price swaps are recognised in oil revenue. Electricity revenue includes $25.6 million (2019: $22.6 million) of option fees on electricity swaps and options.
The main source of ineffectiveness for electricity swaps relates to the difference between the market price and the strike price at inception of the contracts. For oil price swaps ineffectiveness
F3. Interest rate risk 2020$ million
2019$ million
2020$ million
2019$ million
Nominal amount at balance date 595.0 420.0 240.0 240.0
Carrying value of asset at balance date - - 17.2 11.4
Carrying value of liability at balance date (56.4) (40.2) - -
Recognised in other comprehensive income during the year (10.0) (6.6) N/A N/A
Reclassified to the income statement during the year (6.5) (7.8) N/A N/A
Maturity 0-11 years 0-9 years 3 years 4 years
Weighted average rate 3.3% 4.4% 2.6% 2.6%
Cash flow hedge (receive float, pay fixed)
Fair value hedge (receive fixed, pay float)
arises due to price premiums and discounts on oil sales (the hedged item) that are not present in the hedging instrument.
At balance date the carrying value of non-hedge accounted electricity swaps and options and PPAs was a $13.0 million asset and electricity future options was a $3.5 million liability (2019: $19.1 million asset, $5.0 million liability). The nominal value at balance date of non-hedge accounted electricity swaps and options and PPAs was $930.6 million (2019: $202.3 million). At balance date there were no non-hedge accounted oil price swaps (2019: none).
Interest rate swaps are entered into to manage interest rate risk on borrowings.
Gains and losses on interest rate swaps designated as cash flow hedges reclassified to the income statement are recognised in finance expenses.
The fair value hedge adjustment is recognised in finance expenses in the income statement.
At balance date the carrying value of non-hedge accounted interest rate swaps was $0.2 million asset and the nominal value was $45.0 million (2019: $0.6 million liability and $65.0 million nominal value).
For
per
sona
l use
onl
y
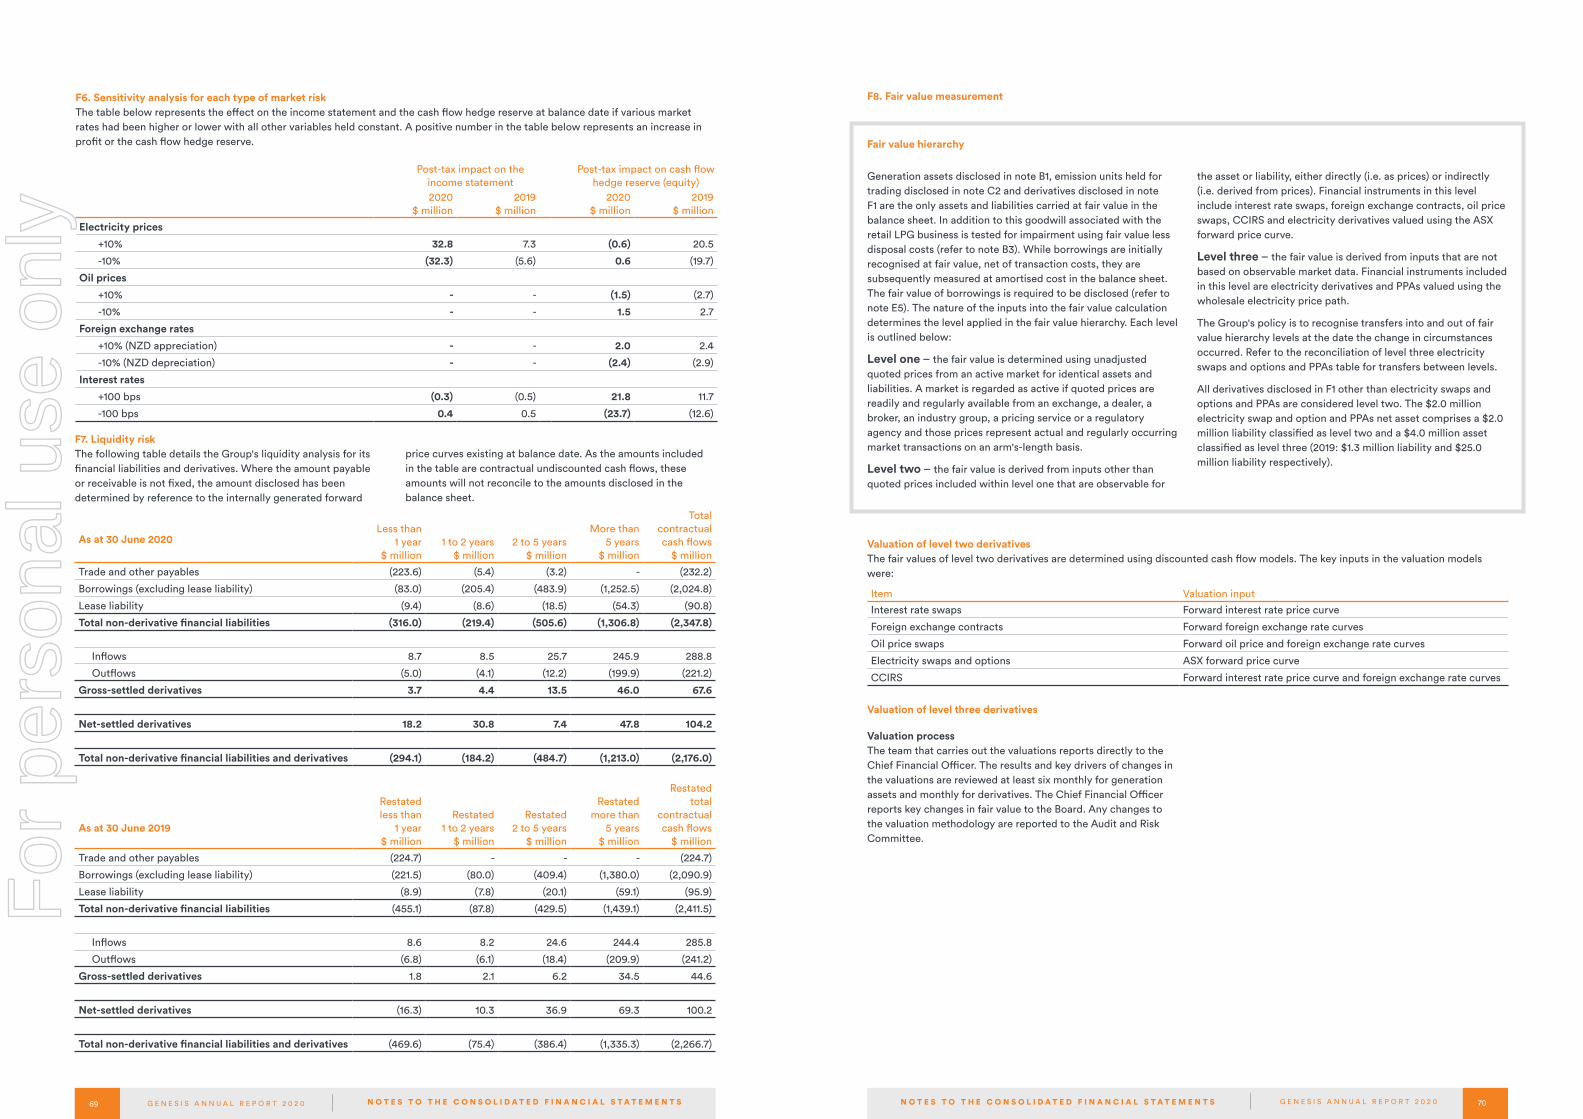
70G E N E S I S A N N U A L R E P O R T 2 0 2 069 G E N E S I S A N N U A L R E P O R T 2 0 2 0 N O T E S T O T H E C O N S O L I D A T E D F I N A N C I A L S T A T E M E N T S N O T E S T O T H E C O N S O L I D A T E D F I N A N C I A L S T A T E M E N T S
F6. Sensitivity analysis for each type of market riskThe table below represents the effect on the income statement and the cash flow hedge reserve at balance date if various market rates had been higher or lower with all other variables held constant. A positive number in the table below represents an increase in profit or the cash flow hedge reserve.
2020$ million
2019$ million
2020$ million
2019$ million
Electricity prices
+10% 32.8 7.3 (0.6) 20.5
-10% (32.3) (5.6) 0.6 (19.7)
Oil prices
+10% - - (1.5) (2.7)
-10% - - 1.5 2.7
Foreign exchange rates
+10% (NZD appreciation) - - 2.0 2.4
-10% (NZD depreciation) - - (2.4) (2.9)
Interest rates
+100 bps (0.3) (0.5) 21.8 11.7
-100 bps 0.4 0.5 (23.7) (12.6)
Post-tax impact on the income statement
Post-tax impact on cash flow hedge reserve (equity)
As at 30 June 2020 Less than
1 year$ million
1 to 2 years$ million
2 to 5 years$ million
More than 5 years
$ million
Total contractual cash flows
$ million
Trade and other payables (223.6) (5.4) (3.2) - (232.2)
Borrowings (excluding lease liability) (83.0) (205.4) (483.9) (1,252.5) (2,024.8)
Lease liability (9.4) (8.6) (18.5) (54.3) (90.8)
Total non-derivative financial liabilities (316.0) (219.4) (505.6) (1,306.8) (2,347.8)
Inflows 8.7 8.5 25.7 245.9 288.8
Outflows (5.0) (4.1) (12.2) (199.9) (221.2)
Gross-settled derivatives 3.7 4.4 13.5 46.0 67.6
Net-settled derivatives 18.2 30.8 7.4 47.8 104.2
Total non-derivative financial liabilities and derivatives (294.1) (184.2) (484.7) (1,213.0) (2,176.0)
As at 30 June 2019
Restated less than
1 year$ million
Restated 1 to 2 years
$ million
Restated 2 to 5 years
$ million
Restated
more than 5 years
$ million
Restated total
contractual cash flows
$ million
Trade and other payables (224.7) - - - (224.7)
Borrowings (excluding lease liability) (221.5) (80.0) (409.4) (1,380.0) (2,090.9)
Lease liability (8.9) (7.8) (20.1) (59.1) (95.9)
Total non-derivative financial liabilities (455.1) (87.8) (429.5) (1,439.1) (2,411.5)
Inflows 8.6 8.2 24.6 244.4 285.8
Outflows (6.8) (6.1) (18.4) (209.9) (241.2)
Gross-settled derivatives 1.8 2.1 6.2 34.5 44.6
Net-settled derivatives (16.3) 10.3 36.9 69.3 100.2
Total non-derivative financial liabilities and derivatives (469.6) (75.4) (386.4) (1,335.3) (2,266.7)
F7. Liquidity riskThe following table details the Group's liquidity analysis for its financial liabilities and derivatives. Where the amount payable or receivable is not fixed, the amount disclosed has been determined by reference to the internally generated forward
price curves existing at balance date. As the amounts included in the table are contractual undiscounted cash flows, these amounts will not reconcile to the amounts disclosed in the balance sheet.
F8. Fair value measurement
Fair value hierarchy
Generation assets disclosed in note B1, emission units held for trading disclosed in note C2 and derivatives disclosed in note F1 are the only assets and liabilities carried at fair value in the balance sheet. In addition to this goodwill associated with the retail LPG business is tested for impairment using fair value less disposal costs (refer to note B3). While borrowings are initially recognised at fair value, net of transaction costs, they are subsequently measured at amortised cost in the balance sheet. The fair value of borrowings is required to be disclosed (refer to note E5). The nature of the inputs into the fair value calculation determines the level applied in the fair value hierarchy. Each level is outlined below:
Level one – the fair value is determined using unadjusted quoted prices from an active market for identical assets and liabilities. A market is regarded as active if quoted prices are readily and regularly available from an exchange, a dealer, a broker, an industry group, a pricing service or a regulatory agency and those prices represent actual and regularly occurring market transactions on an arm's-length basis.
Level two – the fair value is derived from inputs other than quoted prices included within level one that are observable for
the asset or liability, either directly (i.e. as prices) or indirectly (i.e. derived from prices). Financial instruments in this level include interest rate swaps, foreign exchange contracts, oil price swaps, CCIRS and electricity derivatives valued using the ASX forward price curve.
Level three – the fair value is derived from inputs that are not based on observable market data. Financial instruments included in this level are electricity derivatives and PPAs valued using the wholesale electricity price path.
The Group's policy is to recognise transfers into and out of fair value hierarchy levels at the date the change in circumstances occurred. Refer to the reconciliation of level three electricity swaps and options and PPAs table for transfers between levels.
All derivatives disclosed in F1 other than electricity swaps and options and PPAs are considered level two. The $2.0 million electricity swap and option and PPAs net asset comprises a $2.0 million liability classified as level two and a $4.0 million asset classified as level three (2019: $1.3 million liability and $25.0 million liability respectively).
Valuation of level two derivatives The fair values of level two derivatives are determined using discounted cash flow models. The key inputs in the valuation models were:
Item Valuation input
Interest rate swaps Forward interest rate price curve
Foreign exchange contracts Forward foreign exchange rate curves
Oil price swaps Forward oil price and foreign exchange rate curves
Electricity swaps and options ASX forward price curve
CCIRS Forward interest rate price curve and foreign exchange rate curves
Valuation of level three derivatives
Valuation processThe team that carries out the valuations reports directly to the Chief Financial Officer. The results and key drivers of changes in the valuations are reviewed at least six monthly for generation assets and monthly for derivatives. The Chief Financial Officer reports key changes in fair value to the Board. Any changes to the valuation methodology are reported to the Audit and Risk Committee.
For
per
sona
l use
onl
y
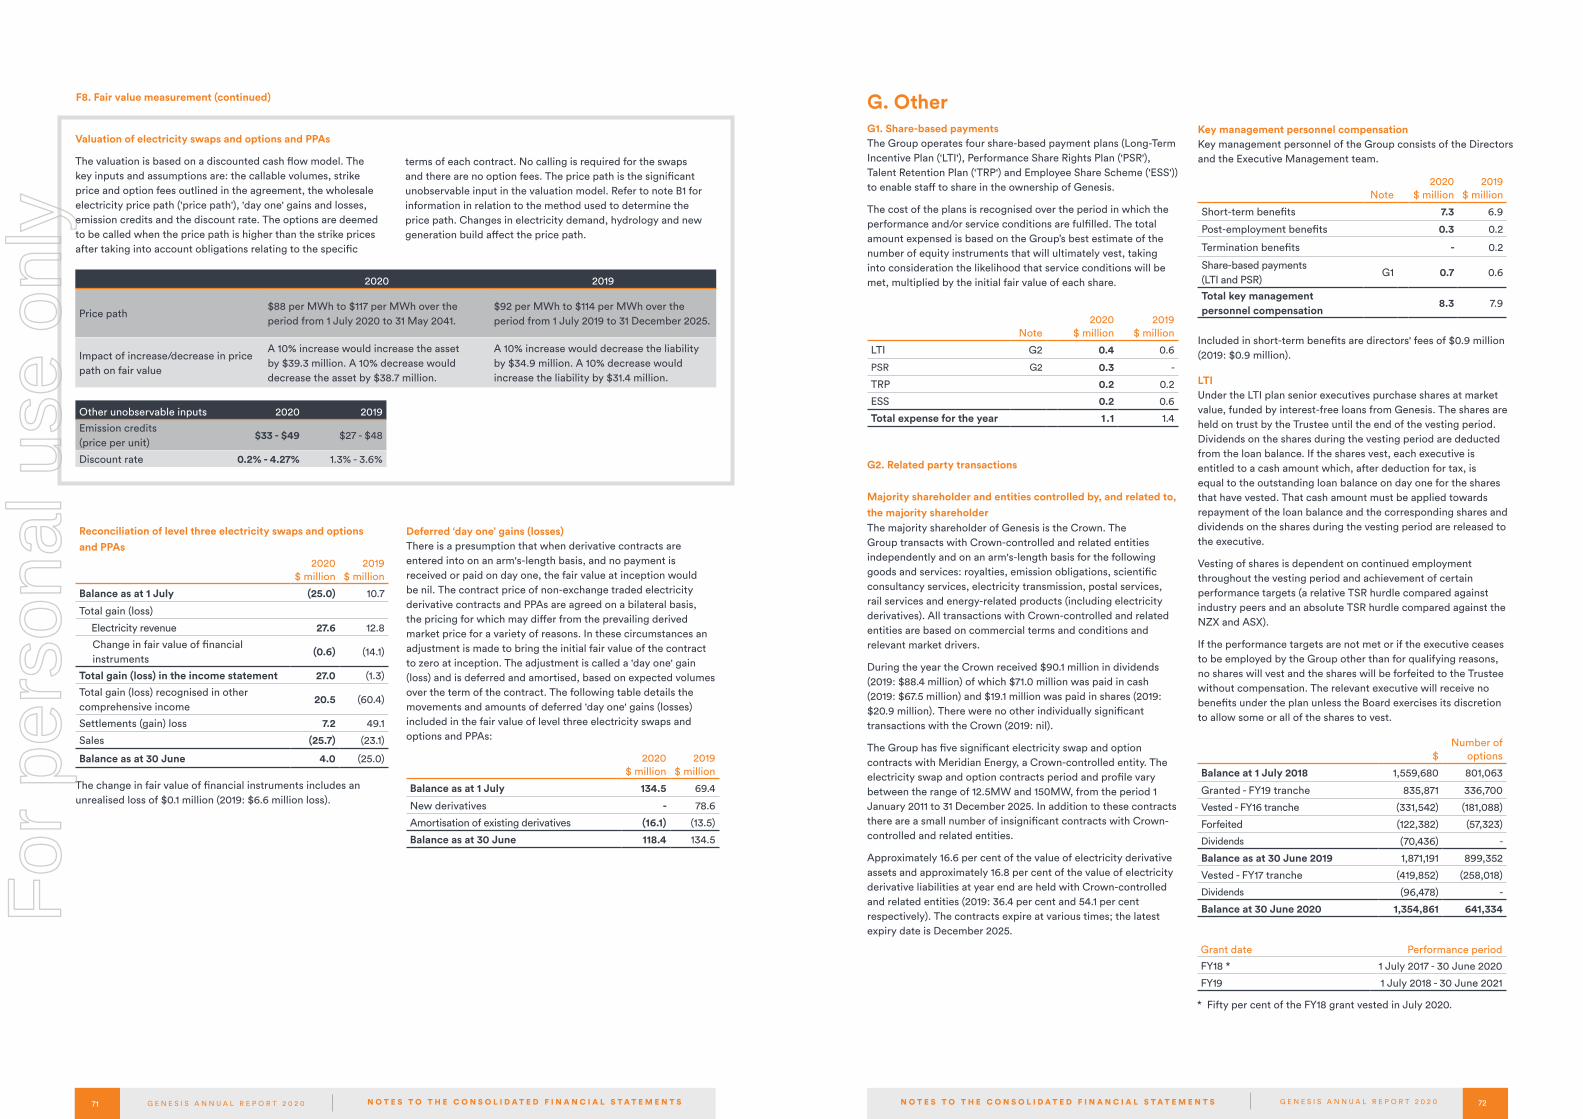
72G E N E S I S A N N U A L R E P O R T 2 0 2 071 G E N E S I S A N N U A L R E P O R T 2 0 2 0 N O T E S T O T H E C O N S O L I D A T E D F I N A N C I A L S T A T E M E N T S N O T E S T O T H E C O N S O L I D A T E D F I N A N C I A L S T A T E M E N T S
G. OtherG1. Share-based paymentsThe Group operates four share-based payment plans (Long-Term Incentive Plan ('LTI'), Performance Share Rights Plan ('PSR'), Talent Retention Plan ('TRP') and Employee Share Scheme ('ESS')) to enable staff to share in the ownership of Genesis.
The cost of the plans is recognised over the period in which the performance and/or service conditions are fulfilled. The total amount expensed is based on the Group’s best estimate of the number of equity instruments that will ultimately vest, taking into consideration the likelihood that service conditions will be met, multiplied by the initial fair value of each share.
Note 2020
$ million2019
$ million
LTI G2 0.4 0.6
PSR G2 0.3 -
TRP 0.2 0.2
ESS 0.2 0.6
Total expense for the year 1.1 1.4
G2. Related party transactions
Majority shareholder and entities controlled by, and related to, the majority shareholder The majority shareholder of Genesis is the Crown. The Group transacts with Crown-controlled and related entities independently and on an arm's-length basis for the following goods and services: royalties, emission obligations, scientific consultancy services, electricity transmission, postal services, rail services and energy-related products (including electricity derivatives). All transactions with Crown-controlled and related entities are based on commercial terms and conditions and relevant market drivers.
During the year the Crown received $90.1 million in dividends (2019: $88.4 million) of which $71.0 million was paid in cash (2019: $67.5 million) and $19.1 million was paid in shares (2019: $20.9 million). There were no other individually significant transactions with the Crown (2019: nil).
The Group has five significant electricity swap and option contracts with Meridian Energy, a Crown-controlled entity. The electricity swap and option contracts period and profile vary between the range of 12.5MW and 150MW, from the period 1 January 2011 to 31 December 2025. In addition to these contracts there are a small number of insignificant contracts with Crown-controlled and related entities.
Approximately 16.6 per cent of the value of electricity derivative assets and approximately 16.8 per cent of the value of electricity derivative liabilities at year end are held with Crown-controlled and related entities (2019: 36.4 per cent and 54.1 per cent respectively). The contracts expire at various times; the latest expiry date is December 2025.
Note 2020
$ million2019
$ million
Short-term benefits 7.3 6.9
Post-employment benefits 0.3 0.2
Termination benefits - 0.2
Share-based payments (LTI and PSR)
G1 0.7 0.6
Total key management personnel compensation
8.3 7.9
Included in short-term benefits are directors' fees of $0.9 million (2019: $0.9 million).
LTIUnder the LTI plan senior executives purchase shares at market value, funded by interest-free loans from Genesis. The shares are held on trust by the Trustee until the end of the vesting period. Dividends on the shares during the vesting period are deducted from the loan balance. If the shares vest, each executive is entitled to a cash amount which, after deduction for tax, is equal to the outstanding loan balance on day one for the shares that have vested. That cash amount must be applied towards repayment of the loan balance and the corresponding shares and dividends on the shares during the vesting period are released to the executive.
Vesting of shares is dependent on continued employment throughout the vesting period and achievement of certain performance targets (a relative TSR hurdle compared against industry peers and an absolute TSR hurdle compared against the NZX and ASX).
If the performance targets are not met or if the executive ceases to be employed by the Group other than for qualifying reasons, no shares will vest and the shares will be forfeited to the Trustee without compensation. The relevant executive will receive no benefits under the plan unless the Board exercises its discretion to allow some or all of the shares to vest.
$Number of
options
Balance at 1 July 2018 1,559,680 801,063
Granted - FY19 tranche 835,871 336,700
Vested - FY16 tranche (331,542) (181,088)
Forfeited (122,382) (57,323)
Dividends (70,436) -
Balance as at 30 June 2019 1,871,191 899,352
Vested - FY17 tranche (419,852) (258,018)
Dividends (96,478) -
Balance at 30 June 2020 1,354,861 641,334
Grant date Performance period
FY18 * 1 July 2017 - 30 June 2020
FY19 1 July 2018 - 30 June 2021
* Fifty per cent of the FY18 grant vested in July 2020.
Key management personnel compensationKey management personnel of the Group consists of the Directors and the Executive Management team.
Other unobservable inputs 2020 2019
Emission credits (price per unit)
$33 - $49 $27 - $48
Discount rate 0.2% - 4.27% 1.3% - 3.6%
2020 2019
Price path$88 per MWh to $117 per MWh over the period from 1 July 2020 to 31 May 2041.
$92 per MWh to $114 per MWh over the period from 1 July 2019 to 31 December 2025.
Impact of increase/decrease in price path on fair value
A 10% increase would increase the asset by $39.3 million. A 10% decrease would decrease the asset by $38.7 million.
A 10% increase would decrease the liability by $34.9 million. A 10% decrease would increase the liability by $31.4 million.
Valuation of electricity swaps and options and PPAs
The valuation is based on a discounted cash flow model. The key inputs and assumptions are: the callable volumes, strike price and option fees outlined in the agreement, the wholesale electricity price path ('price path'), 'day one' gains and losses, emission credits and the discount rate. The options are deemed to be called when the price path is higher than the strike prices after taking into account obligations relating to the specific
terms of each contract. No calling is required for the swaps and there are no option fees. The price path is the significant unobservable input in the valuation model. Refer to note B1 for information in relation to the method used to determine the price path. Changes in electricity demand, hydrology and new generation build affect the price path.
Reconciliation of level three electricity swaps and options and PPAs
2020$ million
2019$ million
Balance as at 1 July (25.0) 10.7
Total gain (loss)
Electricity revenue 27.6 12.8
Change in fair value of financial instruments
(0.6) (14.1)
Total gain (loss) in the income statement 27.0 (1.3)
Total gain (loss) recognised in other comprehensive income
20.5 (60.4)
Settlements (gain) loss 7.2 49.1
Sales (25.7) (23.1)
Balance as at 30 June 4.0 (25.0)
The change in fair value of financial instruments includes an unrealised loss of $0.1 million (2019: $6.6 million loss).
Deferred ‘day one’ gains (losses)There is a presumption that when derivative contracts are entered into on an arm's-length basis, and no payment is received or paid on day one, the fair value at inception would be nil. The contract price of non-exchange traded electricity derivative contracts and PPAs are agreed on a bilateral basis, the pricing for which may differ from the prevailing derived market price for a variety of reasons. In these circumstances an adjustment is made to bring the initial fair value of the contract to zero at inception. The adjustment is called a 'day one' gain (loss) and is deferred and amortised, based on expected volumes over the term of the contract. The following table details the movements and amounts of deferred 'day one' gains (losses) included in the fair value of level three electricity swaps and options and PPAs:
2020$ million
2019$ million
Balance as at 1 July 134.5 69.4
New derivatives - 78.6
Amortisation of existing derivatives (16.1) (13.5)
Balance as at 30 June 118.4 134.5
F8. Fair value measurement (continued)
For
per
sona
l use
onl
y

74G E N E S I S A N N U A L R E P O R T 2 0 2 073 G E N E S I S A N N U A L R E P O R T 2 0 2 0 N O T E S T O T H E C O N S O L I D A T E D F I N A N C I A L S T A T E M E N T S
G2. Related party transactions (continued)
PSRDuring the year the Group implemented the PSR plan. Under the PSR senior executives are granted performance share rights. Vesting of the rights is dependent on continued employment throughout the vesting period and achievement of certain performance targets (a relative TSR hurdle compared against industry peers and an absolute TSR hurdle compared against the cost of equity). Each performance share right that vests entitles the participant to one ordinary share in Genesis for no consideration and 'dividend equivalents' that would have been earned on the share over the vesting period. No share rights will vest if the performance targets are not met or if the participant ceases to be employed by the Group other than for qualifying reasons, unless the Board exercises its discretion to allow some or all of the shares to vest. The performance period is from 1 July 2019 to 30 June 2022.
Other transactions with key management personnel or entities related to them Key management personnel and their families may purchase gas, electricity and LPG from the Group on an arm's-length basis and may purchase shares in Genesis. Key management personnel also participate in the LTI plan and PSR plan discussed on the previous page and above. The total number of shares held by key management personnel (excluding LTI shares) as at 30 June 2020 was 439,252 (2019: 314,713). During the year dividends paid to key management personnel and their families was $238,663 (2019: $69,150). No other transactions took place between key management personnel and the Group (2019: nil). As at 30 June 2020 the balance payable to key management personnel was nil (2019: nil).
G3. Auditor's remunerationAudit fees comprise $0.1 million for the review of the interim financial statements and $0.5 million for the audit of the annual financial statements (2019: $0.1 million and $0.5 million respectively). In addition to the audit Deloitte provided the following services during the year: provision of secretarial services for the Corporate Taxpayer Group (of which Genesis is a member), trustee reporting and whistleblower hotline service (2019: provision of secretarial services for the Corporate Taxpayer Group (of which Genesis is a member), trustee reporting, leadership development initiatives for senior employees, customer management software support and whistleblower hotline service). Total fees relating to other services was $0.038 million (2019: $0.139 million).
G4. Capital commitments
2020$ million
2019$ million
Less than one year 20.7 28.8
One to five years 13.6 13.2
Total 34.3 42.0
Kupe Joint Venture has capital commitments of $2.5 million as at 30 June 2020 (2019: $1.2 million) and DrylandCarbon One Limited Partnership has capital commitments of $1.1 million as at 30 June 2020 (2019: $1.2 million).
In addition to the commitments disclosed above, on 23 October 2019 the Group committed to a 12-year property lease, which will be available for use in October 2020. If the lease had commenced on the date the contract was signed, the Group would have recognised an additional $23.9 million lease asset and $31.3 million lease liability. These amounts are indicative values only, given the incremental borrowing rate will not be known until the commencement of the lease in October 2020.
G5. Contingent assets and liabilitiesThe Group had contingent assets and liabilities at 30 June 2020 in respect of:
Land claims, law suits and other claims Genesis acquired interests in land and leases from Electricity Corporation of New Zealand Limited ('ECNZ') on 1 April 1999. These interests in land and leases may be subject to claims to the Waitangi Tribunal and may be resumed by the Crown.
Genesis would expect to negotiate with the new Māori owners for occupancy and usage rights of any sites resumed by the Crown. Certain claims have been brought to, or are pending against, ECNZ and the Crown under the Treaty of Waitangi Act 1975. Some of these claims may affect land and leases purchased from ECNZ. In the event that land is resumed by the Crown, the resumption would be effected by the Crown under the Public Works Act 1981 and compensation would be payable. The Board cannot reasonably estimate the adverse effect (if any) of the claims and cannot provide any assurance that should a claim be raised it would not have a material adverse effect on the Group's business, financial condition or results of operations.
Gas supply agreement Genesis is currently engaged in a contractual dispute relating to the carbon terms of one of its long-term gas supply agreements. Following an escalation process, the matter has been referred to arbitration in accordance with the terms of the agreement. Details of the dispute remain confidential and have not been disclosed to avoid any prejudice to the ongoing arbitration process. Genesis is confident of a favourable outcome. However, should there be an adverse outcome from the proceedings, potentially up to 1,227,000 carbon units may need to be transferred. As the cost of any unit transfer will depend on when the units are required to be transferred and the make up of units held at that time, it is not possible to provide a reliable estimate of the financial effect of any transfer.
There are no other known material contingent assets or liabilities (2019: nil).
G6. Subsequent eventsThe following events occurred subsequent to balance date: • $90.0 million of dividends were declared on 19 August 2020
(refer to note E4);• A $50.0 million additional revolving credit facility was
entered into which expires in July 2022;• $50.0 million additional wholesale term notes were issued at
a fixed rate of 1.32 per cent which expire in July 2022;• On 9 July 2020 NZAS announced its intention to close the
Tiwai Point smelter. Refer to the 'General information and significant matters' section for more information.
Independent auditor's report
I N D E P E N D E N T A U D I T O R ' S R E P O R T
TO THE SHAREHOLDERS OF GENESIS ENERGY LIMITED
TE PŪRONGO A TE KAITĀTARI KAUTE MOTUHAKE
Auditor-General The Auditor-General is the auditor of Genesis Energy Limited and its subsidiaries (‘the Group’). The Auditor-General has appointed me, Bryce Henderson, using the staff and resources of Deloitte Limited, to carry out the audit of the consolidated
financial statements of the Group on his behalf.
Opinion We have audited the consolidated financial statements of the Group on pages 40 to 73, that comprise the consolidated balance sheet as at 30 June 2020, the consolidated comprehensive income statement, consolidated statement of changes in equity and consolidated cash flow statement for the year ended on that date, and the notes to the consolidated financial statements that include accounting policies and other explanatory information.
In our opinion, the consolidated financial statements present fairly, in all material respects, the consolidated financial position of the Group as at 30 June 2020, and its consolidated financial performance and its consolidated cash flows for the year then ended in accordance with New Zealand Equivalents to International Financial Reporting Standards and International Financial Reporting Standards.
Basis for opinion We conducted our audit in accordance with the Auditor-General’s Auditing Standards, which incorporate the Professional and Ethical Standards and the International Standards on Auditing (New Zealand) issued by the New Zealand Auditing and Assurance Standards Board. Our responsibilities under those standards are further described in the Auditor’s responsibilities for the audit of the consolidated financial statements section of our report. We are independent of the Group in accordance with the Auditor-General’s Auditing Standards, which incorporate Professional and Ethical Standard 1: International Code of Ethics for Assurance Practitioners (including International Independence Standards) (New Zealand) issued by the New Zealand Auditing and Assurance Standards Board, and we have fulfilled our other ethical responsibilities in accordance with these requirements.
We believe that the audit evidence we have obtained is sufficient and appropriate to provide a basis for our opinion.
In addition to the audit we have carried out assignments in the areas of trustee reporting, scrutineer’s notice, secretarial services for the corporate tax payer group, whistleblower hotline service, and review of the interim report which are compatible with those independence requirements. These services have not impaired our independence as auditor of the Group.
In addition to these assignments, principals and employees of our firm deal with the Group on normal terms within the ordinary course of trading activities of the Group. Other than the audit and these assignments and trading activities, we have no relationship with, or interests in the Group.
Audit Materiality We consider materiality primarily in terms of the magnitude of misstatement in the consolidated financial statements of the Group, that in our judgement would make it probable that the economic decisions of a reasonably knowledgeable person would be changed or influenced (the ‘quantitative’ materiality). In addition, we also assess whether other matters that come to our attention during the audit would in our judgement change or influence the decisions of such a person (the ‘qualitative’ materiality). We use materiality both in planning the scope of our audit work and in evaluating the results of our work.
We determined the quantitative materiality for the consolidated financial statements as a whole to be $10 million.
Key Audit MattersKey audit matters are those matters that, in our professional judgement, were of most significance in our audit of the consolidated financial statements of the current period. These matters were addressed in the context of our audit of the consolidated financial statements as a whole, and in forming our opinion thereon, and we do not provide a separate opinion on these matters.
For
per
sona
l use
onl
y

76G E N E S I S A N N U A L R E P O R T 2 0 2 075 G E N E S I S A N N U A L R E P O R T 2 0 2 0 I N D E P E N D E N T A U D I T O R ' S R E P O R T I N D E P E N D E N T A U D I T O R ' S R E P O R T
Bryce Henderson Deloitte Limited On behalf of the Auditor-General Auckland, New Zealand 19 August 2020
Key audit matters How our audit addressed the key audit matters and results
Valuation of Generation Assets Generation assets are measured at fair value as set out in note B1 of the consolidated financial statements. The carrying amount at 30 June 2020 is $3,177 million.
The fair value of generation assets is estimated using an internally generated discounted cash flow model. A valuation was undertaken at 30 June 2020 which showed the net book value approximated its fair value and as such, there has been no revaluation increase or decrease recorded in the current year.
The significant inputs used to assess the fair value of the generation assets are the wholesale electricity price path, generation volumes, and the discount rate. The significant inputs inherently factor in the impacts of COVID-19. The wholesale electricity price path is estimated by Genesis Energy as described in note B1 of the consolidated financial statements and assumed the ongoing operation of New Zealand Aluminium Smelters (NZAS) at Tiwai Point, which was consistent with market data available at 30 June 2020.
As disclosed under note B1 and ‘General information and significant matters’, NZAS announced on 9 July 2020 the closure of Tiwai Point Smelter. This is considered a non-adjusting subsequent event and is therefore not reflected in the wholesale electricity price path at 30 June 2020.
The estimate of the wholesale electricity price path is the most significant input in estimating the fair values determined for the generation assets and affects the estimated generation volumes which are also used in the fair value calculation. Changes to the forecast of the wholesale electricity price path could significantly change the estimated fair value of the generation assets.
We included the valuation of generation assets as a key audit matter due to the level of judgement required in forecasting the wholesale electricity price path.
Our audit procedures included assessing the key inputs to the model used to estimate the fair value of the generation assets. Our procedures, which included the use of our internal valuation experts, were primarily focused on evaluating the process undertaken by Genesis Energy in forecasting the wholesale electricity price path and assessing whether the forecast was consistent with internal and external data.
We assessed the professional competence of the Genesis Energy valuers involved in the forecasting of the electricity price path and valuation of the generation assets.
We also compared budgeted performance information from prior periods to actual data to assess the accuracy of the forecasting process.
We assessed the forecast wholesale electricity price path which included internal and externally derived data.
We also evaluated the assumptions used in forecasting the electricity price path to determine whether they were consistent with assumptions used across the business, including management budgets and valuations of other assets including certain electricity derivatives.
This also included assessing the determination that the key assumptions in the model were not significantly impacted by COVID-19, as disclosed under ‘General information and significant matters’ in the consolidated financial statements.
We assessed the treatment of the announcement of the intention to close the Tiwai Point smelter by August 2021 as a non adjusting subsequent event.
We performed sensitivity analysis on the key assumptions applied in determining the fair value of the generation assets and considered the adequacy of the Group’s disclosures.
We have found the assumptions and resulting valuation to be reasonable.
Valuation of Electricity Derivatives The Group’s activities expose it to a number of market risks, including electricity, gas and oil price risk, currency risk and interest rate risk, which are managed using derivative financial instruments.
At 30 June 2020 derivative assets were $148.6 million and derivative liabilities were $111.3 million as set out in note F1 of the consolidated financial statements.
Many of the Group’s derivatives are valued using standard valuation techniques based primarily on observable inputs. However, some electricity swaps, options and Power Purchase Agreements are valued using inputs that are not based on observable market data, such as the wholesale electricity price path forecast which is prepared by Genesis Energy valuers.
As explained in the ‘Valuation of Generation Assets’ section above, the wholesale electricity price path forecast requires significant judgement.
Valuations which reflect significant unobservable inputs are considered to be ‘level 3’ valuations as described in note F8 of the consolidated financial statements. At 30 June 2020, the Group had $4 million of electricity derivatives considered to be within level 3.
We included the valuation of level 3 electricity derivatives as a key audit matter due to the judgement involved in evaluating the inputs to the valuation models.
We tested the design and operating effectiveness of key controls related to the recording and valuation of the level 3 electricity derivative transactions.
We challenged key assumptions applied by management and agreed underlying data to the contract terms on a sample basis. We have independently recalculated the fair value of a sample of electricity derivatives.
Our internal valuation experts have evaluated the appropriateness of the methodology applied in valuation models for the level 3 electricity derivatives.
We also performed audit work on the wholesale electricity price path as explained above under the section entitled ‘Valuation of Generation Assets’.
We have found the assumptions and resulting valuations to be reasonable.
Other Information The Directors are responsible on behalf of the Group for the other information. The other information comprises the information included in the Annual Report, but does not include the consolidated financial statements and our auditor’s report thereon.
Our opinion on the consolidated financial statements does not cover the other information and we do not express any form of audit opinion or assurance conclusion thereon.
In connection with our audit of the consolidated financial statements, our responsibility is to read the other information and, in doing so, consider whether the other information is materially inconsistent with the consolidated financial statements or our knowledge obtained in the audit or otherwise appears to be materially misstated. If, based on the work we have performed, we conclude that there is a material misstatement of this other information, we are required to report
that fact. We have nothing to report in this regard.
Directors’ responsibilities for the consolidated financial statements The Directors are responsible on behalf of the Group for the preparation and fair presentation of the consolidated financial statements in accordance with New Zealand equivalents to International Financial Reporting Standards and International Financial Reporting Standards, and for such internal control as the Directors determine is necessary to enable the preparation of consolidated financial statements that are free from material misstatement, whether due to fraud or error.
In preparing the consolidated financial statements, the Directors are responsible on behalf of the Group for assessing the Group’s ability to continue as a going concern, disclosing, as applicable, matters related to going concern and using the going concern basis of accounting unless the Directors either intend to liquidate the Group or to cease operations, or have no realistic alternative but to do so.
The Directors’ responsibilities arise from the Financial Markets Conduct Act 2013.
Auditor’s responsibilities for the audit of the consolidated financial statements Our objectives are to obtain reasonable assurance about whether the consolidated financial statements as a whole are free from material misstatement, whether due to fraud or error, and to issue an auditor’s report that includes our opinion.
Reasonable assurance is a high level of assurance, but is not a guarantee that an audit conducted in accordance with the Auditor-General’s Auditing Standards will always detect a material misstatement when it exists. Misstatements can arise from fraud or error and are considered material if, individually or in the aggregate, they could reasonably be expected to influence the economic decisions of shareholders taken on the basis of these consolidated financial statements.
As part of an audit in accordance with the Auditor-General’s Auditing Standards, we exercise professional judgement and maintain professional scepticism throughout the audit. We also:
• Identify and assess the risks of material misstatement of the consolidated financial statements, whether due to fraud or error, design and perform audit procedures responsive to those risks, and obtain audit evidence that is sufficient and appropriate to provide a basis for our opinion. The risk of not detecting a material misstatement resulting from fraud is higher than for one resulting from error, as fraud may involve collusion, forgery, intentional omissions, misrepresentations, or the override of internal control.
• Obtain an understanding of internal control relevant to the audit in order to design audit procedures that are appropriate in the circumstances, but not for the purpose of expressing an opinion on the effectiveness of the Group’s internal control.
• Evaluate the appropriateness of accounting policies used and the reasonableness of accounting estimates and related disclosures made by management.
• Conclude on the appropriateness of the use of the going concern basis of accounting by the directors and, based on the audit evidence obtained, whether a material uncertainty exists related to events or conditions that may cast significant doubt on the Group’s ability to continue as a going concern. If we conclude that a material uncertainty exists, we are required to draw attention in our auditor’s report to the related disclosures in the consolidated financial statements or, if such disclosures are inadequate, to modify our opinion. Our conclusions are based on the audit evidence obtained up to the date of our auditor’s report. However, future events or conditions may cause the Group to cease to continue as a going concern.
• Evaluate the overall presentation, structure and content of the consolidated financial statements, including the disclosures, and whether the consolidated financial statements represent the underlying transactions and events in a manner that achieves fair presentation.
• Obtain sufficient appropriate audit evidence regarding the financial information of the entities or business activities within the Group to express an opinion on the consolidated financial statements. We are responsible for the direction, supervision and performance of the group audit. We remain solely responsible for our audit opinion.
We communicate with the Directors regarding, among other matters, the planned scope and timing of the audit and significant audit findings, including any significant deficiencies in internal control that we identify during our audit.
We also provide the Directors with a statement that we have complied with relevant ethical requirements regarding independence, and to communicate with them all relationships and other matters that may reasonably be thought to bear on our independence, and where applicable, related safeguards.
From the matters communicated with the Directors, we determine those matters that were of most significance in the audit of the consolidated financial statements of the current period and are therefore the key audit matters. We describe these matters in our auditor’s report unless law or regulation precludes public disclosure about the matter or when, in extremely rare circumstances, we determine that a matter should not be communicated in our report because the adverse consequences of doing so would reasonably be expected to outweigh the public interest benefits of such communication.
Our responsibilities arise from the Public Audit Act 2001.
For
per
sona
l use
onl
y

78G E N E S I S A N N U A L R E P O R T 2 0 2 077 G E N E S I S A N N U A L R E P O R T 2 0 2 0 C O R P O R A T E G O V E R N A N C E A N D D I S C L O S U R E S C O R P O R A T E G O V E R N A N C E A N D D I S C L O S U R E S
Corporate governance
2 The term ‘Officer’ is defined in the NZX Listing Rules as a person, however designated, who is concerned or takes part in the management of the public issuer’s business and reports to the Board or to a person who reports to the Board. At Genesis our Officers are the Chief Executive and the Chief Executive’s direct reports.
1 During the year the Company has not complied with Recommendation 3.6 (takeover protocols) of the Code due to the Crown's share ownership in the Company making it practically impossible for a takeover offer to be made. See the Corporate Governance Statement for more detail.
Te Mana Arataki Rangatōpū
SKILL / CAPABILITY
BARBARA CHAPMAN
CATHERINE DRAYTON
DOUG MCKAY
TIM MILES
JAMES MOULDER
MAURY LEYLAND
PENNO
PAUL ZEALAND
Business strategy and leadership experience (a proven record of developing and executing business strategy)
Listed company governance experience (experience in listed company governance and driving and assessing the effectiveness of the executive)
Regulated industry knowledge and experience (electricity sector experience or experience in a similarly regulated industry)
Government and stakeholder relationship experience (a proven record of successfully engaging and managing key external stakeholder relationships)
Finance / Accounting / Audit Committee experience (senior executive or Director level experience in financial accounting, reporting and internal financial controls)
Corporate finance / capital markets / transactional experience (executive or Director level experience in corporate finance related transactions – such as capital raising and/or mergers and acquisitions)
Large industry operational (capital) project management experience (executive level experience within the electricity sector or similar large scale industrial business)
Health and safety, risk experience (deep understanding of excellence in Health & Safety in strategic and operational context and applicable legislative framework)
Customer insight, data, marketing and brand experience (executive level experience in consumer retail and execution of marketing and brand strategies to deliver growth)
Technology / innovation and digitalisation experience (detailed understanding of the role of technology and innovation in delivering a superior customer experience)
People / culture / reputation management (deep understanding of the strategic importance of people, values, behaviours and management style as drivers of organisational culture and reputation)
DIRECTOR¹ APPOINTEDBOARD
MEETINGS²
COVID-19 SPECIFIC
MEETINGS
AUDIT AND RISK
COMMITTEE
HUMAN RESOURCESAND REMUNERATION
COMMITTEENOMINATIONS
COMMITTEE³
Total Meetings held 11 3 4 4 1
Barbara Chapman (Chairman) 1 May 2018 11 3 - - 1
Catherine Drayton 14 Mar 2019 9 3 4 - -
Doug McKay 24 June 2014 11 3 - 4 1
Tim Miles 21 Nov 2016 11 3 - 4 1
James Moulder 10 Oct 2018 11 2 4 - -
Maury Leyland Penno 1 August 2016 10 2 4 4 -
Paul Zealand 19 Oct 2016 10 3 - 4 1
Joanna Perry⁴ 1 May 2007 3 - 1 - -
Board and committee meetings and attendances
1. All Directors listed are independent Directors. 2. In addition, Directors participated in a number of stakeholder and investor meetings throughout FY20. 3. The above numbers do not include attendances at Committee meetings by non-member Directors. The Chairman is an ex-officio member of the Audit and Risk Committee and Human Resources and Remuneration Committee and attends all meetings. 4. Joanna Perry ceased to be a Director on 16 October 2019.
Corporate governance information
This section of the Annual Report provides information on Directors' independence, committees, fees and diversity and inclusion policies and other activities.
Genesis' governance framework is guided by the principles and recommendations described in the NZX Corporate Governance Code. Genesis considers it has followed these recommendations in all material respects during FY20 and as at 30 June 2020¹. Genesis has reported in detail against the NZX Corporate Governance Code in its separately published Corporate Governance Statement, which, together with other detailed information on Genesis’ Board of Directors, Executive team and corporate governance policies, practices and processes, can be viewed on the Genesis Governance section on the Genesis website (www.genesisenergy.co.nz/investors/governance).
> Genesis’ Constitution
> Board Charter
> Audit and Risk Committee Charter
> Human Resources and Remuneration Committee Charter
> Nominations Committee Charter
> Corporate Governance Statement
> Code of Conduct and Ethics
> Diversity and Inclusion Policy
> Trading in Company Securities Policy
> Market Disclosure Policy
> Audit Independence Policy
> Investor Communication Policy
> Risk Management Statement
> Disclosure of Non GAAP Performance Measures Policy
> Information about Genesis' Ordinary Shares
> Information about bonds issued by Genesis
Corporate governance documentation
Director independence
The names of the current Directors, together with a short biography of each, are set out on pages 35 and 36. All of the Directors are currently considered to be independent Directors as none of them are executives of the Company or have any direct or indirect interests or relationships that could reasonably influence, or could reasonably be perceived to influence, in a material way, their decisions in relation to the Company. See the Corporate Governance Statement for more detail on Director independence.
Diversity and Inclusion Policy and gender composition
Genesis’ Diversity and Inclusion Policy records the Company’s commitment to an inclusive workplace that embraces and promotes diversity through a number of initiatives, including a focus on equal opportunity. Genesis has sought to establish measurable objectives for achieving diversity, including gender diversity, as part of its annual assessment of its diversity objectives for FY20. The Company’s progress towards achieving these objectives are described in detail on
page 31.
The Board is comfortable with the Company's FY20 performance with respect to its Diversity Policy and objectives but notes that further work is being done to meet those objectives.
In accordance with NZX Listing Rule 3.8.1 (c), as at 30 June 2020:
> Three out of seven Genesis Energy Directors were women (FY19: four out of eight).
> Two out of eight officers² were women (FY19: two out of eight).F
or p
erso
nal u
se o
nly

80G E N E S I S A N N U A L R E P O R T 2 0 2 079 G E N E S I S A N N U A L R E P O R T 2 0 2 0 C O R P O R A T E G O V E R N A N C E A N D D I S C L O S U R E S C O R P O R A T E G O V E R N A N C E A N D D I S C L O S U R E S
Director and Executive remuneration
This report outlines our Remuneration Report for the year ending 30 June 2020. It sets out remuneration information for the Chief Executive, the Executive Team and Directors. Director and employee remuneration is also discussed in the Company’s Corporate Governance Statement which can be viewed at www.genesisenergy.co.nz/investors/governance/documents.
Genesis Energy follows the New Zealand Shareholder Association’s guide to assist all investors to understand how remuneration is aligned with value creation for its shareholders. Genesis’ remuneration policy for the Executive Team including the Chief Executive is designed to have them remunerated with competitive salaries, a wide range of benefits and use of performance incentives to achieve outstanding performance and alignment with our shareholders' interests. The Human Resources and Remuneration Committee regularly reviews the remuneration policy. For the Executive Team the policy provides the opportunity to achieve, where performance has been outstanding, a total remuneration package in the upper quartile for equivalent market matched roles. Each year the Committee reviews the performance and remuneration appraisals of the Executive, with the Board approving the Chief Executive’s remuneration.
Total remuneration for the Executive Team is made up of three elements: fixed remuneration, short-term incentives and long-term incentives.
Fixed remuneration consists of base salary and benefits and is targeted to be in the third quartile of the market. External benchmarking is commissioned by the Human Resources and Remuneration Committee to be carried out independently by PricewaterhouseCoopers.
Short Term incentives (STIs) are ‘a pay for performance’ component designed to motivate and reward performance in a single financial year. The target value of an STI is set annually as a percentage of the Executive’s fixed remuneration. For FY20 the target for the Chief Executive was 50 per cent and for other Executives was between 20 per cent and 50 per cent. The performance measures to achieve the STI are then set across Company KPIs for EBITDAF, Customer, Health and Safety and individual KPIs. Within each measure, there are three performance levels, ‘threshold’, ‘on target’ and ‘outstanding’. On appraisal at the end of each year an Executive will be awarded an STI payment based on their performance between a range of zero per cent for below threshold performance, to 150 per cent for outstanding performance.
The Long Term incentives (LTI) are also ‘a pay for performance’ component designed to align rewards for the Executive with shareholder value over a three year period. Only the Executive are eligible to participant in the LTI. Genesis Energy’s LTI scheme was reviewed and a new performance share rights plan established in FY20
to ensure it continues to attract, retain and motivate high calibre executive members to drive outstanding outcomes for our customers and our shareholders.
Under the new LTI plan, executives are granted a number of share rights determined by dividing the gross value of the grant by the value of one Genesis share at the date of the grant. At vesting, subject to meeting the performance hurdles set at the time of grant, each share right is converted to one ordinary share. LTI payments, if achieved, are made in Genesis shares rather than cash. The executive may also receive additional shares representing the value of dividends paid over the vesting period. The executive is liable for tax on the shares received at this point. Under the new plan, grants will continue to be made annually with performance measured over a three-year period. The Board retains discretion over the final outcome.
In FY20 LTI grants were made to the Executive Team and the value of the grants were set at a percentage of fixed remuneration between a range of 25 per cent to 60 per cent.
Ngā utu ā-tau o ngā Kaihautū
FIXED REMUNERATION PAY FOR PERFORMANCETOTAL REMUNERATION
Period BASE SALARY BENEFITS SUBTOTAL STI LTI SUBTOTAL
FY20 1,226,464 79,678 1,306,142 495,793 269,678 765,471 2,071,613
FY19 1,164,730 90,447 1,255,177 719,291 377,163 1,096,454 2,351,631
The total remuneration earned by the Chief Executive, Mr Marc England for FY19 & FY20 is as follows:
The Base Salary is inclusive of holiday pay paid as per New Zealand legislation. Benefits include employer contributions towards KiwiSaver on the base salary, short term incentives (STI) and long term incentives (LTI). The FY18 LTI grant, which matured in FY20, met the absolute Total Shareholder Return (TSR) metric measured against the NZX and ASX performance, but did not meet the relative TSR metric measured against the Peer group ending 30 June 2020 and achieved a 50 per cent vesting outcome.
The FY20 LTI value above represents the gross LTI bonus earned on vesting of the FY18 LTI grant. The net LTI bonus was applied to repay Marc England’s LTI loan balance. The accumulated cash dividends net of withholding tax of $33,526 was paid to Marc England in July 2020. The dividends are earned subsequent to the initial grant and are excluded from the LTI amount above. Following repayment of his LTI loan balance, 75,017 ordinary Genesis shares with a market value of $3.03 were transferred to Marc England on 17 July 2020.
The following new interests granted in FY20 for vesting in FY22
GRANT YEAR LTI GROSS VALUE PERFORMANCE PERIOD PERFORMANCE MEASURE
FY20 $699,943 in the form of performance share rights
July 2019 - June 2022 50% weighting relative TSR performance against generator peer group50% weighting absolute TSR performance against Genesis' Cost of Equity.
In FY20 Marc England's annual LTI was granted as performance share rights under the Genesis Performance Share Rights Plan. Under the Plan the CE was granted rights that when vested at the expiry of a three-year performance period will entitle him to acquire fully paid Genesis ordinary shares. The number of rights granted equals the gross LTI value divided by the volume weighted average price of Genesis shares for the 10 trading days prior to the share price purchase date. Subject to satisfaction of performance hurdles related to the above Performance Measures and continued employment, at vesting each right converts to one fully paid Genesis ordinary share. If a performance hurdle is not met (or the CE leaves Genesis prior to the vesting date) then the rights associated with the performance hurdle lapse.
Breakdown of Chief Executive's pay for performance FY20
DESCRIPTION PERFORMANCE MEASURESMAXIMUM PERCENTAGE POSSIBLE
PERCENTAGE ACHIEVED %
STI Set at 50% of fixed remuneration
60% based on Company shared KPIs, of EBITDAF, Customer and Enhancing our Right to Operate to include Safety and Wellness performance
150% 85%
40% based on Individual KPIs
LTIConditional awards of shares under a Long Term Incentive Plan set at 60% of fixed remuneration
50 weighting relative TSR performance against generator peer group, 50% weighting absolute TSR against NZX performance
100% 50%
Five year summary - Chief Executive remuneration
CHIEF EXECUTIVETOTAL REMUNERATION
PERCENTAGE STI ACHIEVED AGAINST MAXIMUM %
PERCENTAGE VESTED LTI AGAINST MAXIMUM
LTI PERFORMANCE PERIOD
Marc England FY20 $2,071,613 57% 50% July 2017 – June 2020
FY19 $2,351,631 85% 100% July 2016 – June 2019
FY18 $2,061,265 79% 100% July 2015 – June 2018
FY17 $1,429,928 68% N/A N/A
FY16 $308,070 43% N/A N/A
Albert Brantley FY16 $2,114,862 43% N/A N/A
Total remuneration including Salary, Benefits, and STI and LTI earned in the year but paid in the following year.
Five year summary - TSR Performance
Jun 2015
50%
100%
150%
0%
200%
250%
300%
Jun 2016 Jun 2017 Jun 2018 Jun 2019 Jun 2020
GNE NZX50 Peer Index
The above STI and LTI payments for FY20 were paid in FY21
For
per
sona
l use
onl
y

82G E N E S I S A N N U A L R E P O R T 2 0 2 081 G E N E S I S A N N U A L R E P O R T 2 0 2 0 C O R P O R A T E G O V E R N A N C E A N D D I S C L O S U R E S C O R P O R A T E G O V E R N A N C E A N D D I S C L O S U R E S
Remuneration of employees earning over $100,000 in the year ending 30 June 2020 There were 386 Genesis and subsidiary employees (or former employees) who received remuneration and benefits in excess of $100,000 (not including Directors) in their capacity as employees during the year ended 30 June 2020, as set out below. Remuneration of employeesREMUNERATION EMPLOYEES REMUNERATION EMPLOYEES REMUNERATION EMPLOYEES
$2,410,000 - $2,420,000* 1 $330,000 - $340,000 1 $200,000 - $210,000 2
$1,100,000-$1,110,000 1 $310,000 - $320,000 3 $190,000 - $200,000 3
$900,000 - $910,000 1 $300,000 - $310,000 3 $180,000 - $190,000 10
$870,000 - $880,000 1 $290,000 - $300,000 1 $170,000 - $180,000 20
$810,000 - $820,000 1 $280,000 - $290,000 1 $160,000 - $170,000 26
$610,000 - $620,000 1 $270,000 - $280,000 1 $150,000 - $160,000 36
$530,000 - $540,000 1 $260,000 - $270,000 5 $140,000 - $150,000 31
$430,000 - $440,000 1 $250,000 - $260,000 2 $130,000 - $140,000 54
$400,000 - $410,000 1 $240,000 - $250,000 1 $120,000 - $130,000 52
$390,000 - $400,000 1 $230,000 - $240,000 4 $110,000 - $120,000 54
$370,000 - $380,000 1 $220,000 - $230,000 4 $100,000 - $110,000 57
$340,000 - $350,000 2 $210,000 - $220,000 2
Total employees earning $100,000+ 386
Employees who are included but who are no longer at Genesis Energy as at 30 June 2020 26
This includes base salary, employer KiwiSaver contributions, vested shares from employee share schemes, short-term performance payments, settlement payments and redundancy payments for all permanent employees received during FY20. Short-term performance payments and the LTI bonus are paid in arrears; therefore the table above includes the STI and LTI earned in FY19.
*The remuneration paid during the year is higher than the remuneration earned on page 79 as it includes the payment of the FY19 STI and LTI. The FY20 STI and LTI will be paid in FY21.
Director and Executive remuneration (continued)
Directors’ fees
Directors’ remuneration is in the form of Directors’ fees for non-executive Directors, approved by shareholders.
The Chairman receives a higher level of fees to reflect the additional time and responsibilities that this position involves but does not receive any fees for committee membership or attendances.
Shareholders have approved remuneration for membership of the various Board committees.
Table 1 sets out the shareholder-approved Directors’ fees for the year to 30 June 2020. These fees were last approved by shareholders at the Company’s 2016 Annual Shareholder Meeting.
No Director is entitled to any remuneration from the Company other than by way of Directors’ fees and the reimbursement of reasonable travelling, accommodation and other expenses incurred in performing their duties as Directors.
Table 2 sets out the remuneration paid to Directors during the year to 30 June 2020.
Details of Directors of subsidiary entities forming part of the Genesis Energy Group are set out in the Statutory Disclosures on page 84.
Directors received no remuneration or other benefits during the period in relation to their duties as Directors of a subsidiary.
All Directors received the benefit of an indemnity from Genesis and the benefit of Directors and Officers liability insurance cover.
The cover extends to liabilities to persons (other than the Company and its subsidiaries or related bodies corporate) that arise out of the performance of their duties as Directors, unless the liability is
Table 2 – Directors’ fees paid during FY20
DIRECTORBOARD
FEESAUDIT & RISK COMMITTEE
HR & REM COMMITTEE
NOMINATIONS COMMITTEE TOTAL
Barbara Chapman 180,000 - - - 180,000
Catherine Drayton 90,000 20,516 - - 110,516
Doug McKay 90,000 - 15,000 5,000 110,000
Tim Miles 90,000 - 7,500 5,000 102,500
James Moulder 90,000 12,000 - - 102,000
Maury Leyland Penno
90,000 12,000 7,500 - 109,500
Paul Zealand 90,000 - 7,500 5,000 102,500
Joanna Perry¹ 26,403 7,000 - - 33,403
Pool for additional work or attendances
- - - - -
GRAND TOTAL $850,419
1. Joanna Perry retired from the Board on 16 October 2019.
Directors’ fees exclude GST and reimbursed costs directly associated with carrying out their duties.
prohibited from being insured against by law or relates to fraudulent conduct. Remuneration of Company employees, including those acting as Directors of subsidiary companies, is disclosed in the relevant banding on page 81.
Table 1 – Approved Directors’ feesPOSITION FEES PER ANNUM TOTAL
Board of DirectorsChairman 180,000 180,000
Member (x7) 90,000 630,000
Audit and Risk Committee Chairman 24,000 24,000
Member (x3) 12,000 36,000
Human Resources and Remuneration Committee
Chairman 15,000 15,000
Member (x3) 7,500 22,500
Nominations CommitteeChairman² - -
Member (x3) 5,000 15,000
Pool for additional work or attendances1
17,500 17,500
Total approved pool $940,000
1. In 2016 shareholders approved a $25,000 pool of fees for additional work or attendances. In the FY19 year, $7,500 of the pool was reallocated to permit the appointment of a fourth member to the Human Resources and Remuneration Committee.
2. The Chairman of the Board is the chairman of the Committee and does not receive any fees for Committee membership.
Maximum
500,000
1,000,000
1,500,000
0
2,000,000
2,500,000
3,000,000
Chief Executive remuneration performance pay for FY21
Fixed On Plan
Fixed STI LTI
Pay For Performance Scenarios FY21
For
per
sona
l use
onl
y
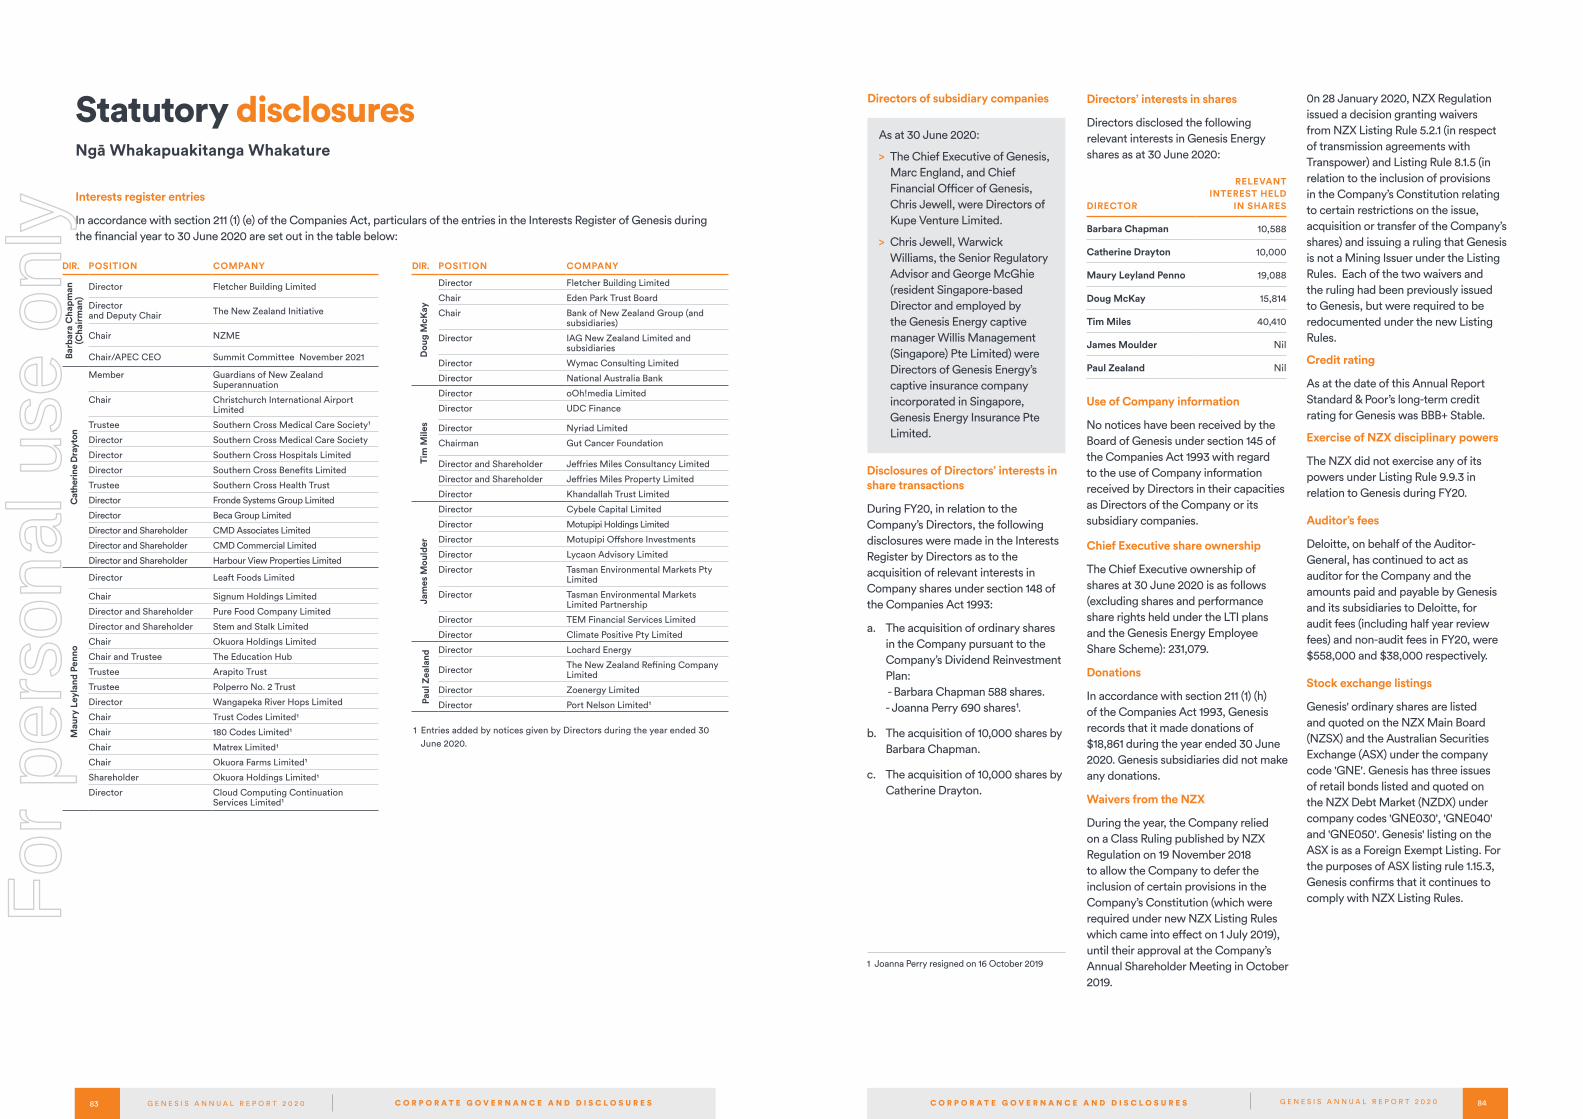
84G E N E S I S A N N U A L R E P O R T 2 0 2 083 G E N E S I S A N N U A L R E P O R T 2 0 2 0 C O R P O R A T E G O V E R N A N C E A N D D I S C L O S U R E S C O R P O R A T E G O V E R N A N C E A N D D I S C L O S U R E S
DIR. POSITION COMPANY
Dou
g M
cKay
Director Fletcher Building Limited
Chair Eden Park Trust Board
Chair Bank of New Zealand Group (and subsidiaries)
Director IAG New Zealand Limited and subsidiaries
Director Wymac Consulting Limited
Director National Australia Bank
Tim
Mile
s
Director oOh!media Limited
Director UDC Finance
Director Nyriad Limited
Chairman Gut Cancer Foundation
Director and Shareholder Jeffries Miles Consultancy Limited
Director and Shareholder Jeffries Miles Property Limited
Director Khandallah Trust Limited
Jam
es M
ould
er
Director Cybele Capital Limited
Director Motupipi Holdings Limited
Director Motupipi Offshore Investments
Director Lycaon Advisory Limited
Director Tasman Environmental Markets Pty Limited
Director Tasman Environmental Markets Limited Partnership
Director TEM Financial Services Limited
Director Climate Positive Pty Limited
Paul
Zea
land
Director Lochard Energy
Director The New Zealand Refining CompanyLimited
Director Zoenergy Limited
Director Port Nelson Limited¹
Interests register entries
In accordance with section 211 (1) (e) of the Companies Act, particulars of the entries in the Interests Register of Genesis during the financial year to 30 June 2020 are set out in the table below:
1 Entries added by notices given by Directors during the year ended 30 June 2020.
Statutory disclosuresNgā Whakapuakitanga Whakature
DIR. POSITION COMPANY
Barb
ara
Cha
pman
(C
hair
man
)
Director Fletcher Building Limited
Director and Deputy Chair The New Zealand Initiative
Chair NZME
Chair/APEC CEO Summit Committee November 2021
Cat
herin
e D
rayt
on
Member Guardians of New Zealand Superannuation
Chair Christchurch International Airport Limited
Trustee Southern Cross Medical Care Society¹
Director Southern Cross Medical Care Society
Director Southern Cross Hospitals Limited
Director Southern Cross Benefits Limited
Trustee Southern Cross Health Trust
Director Fronde Systems Group Limited
Director Beca Group Limited
Director and Shareholder CMD Associates Limited
Director and Shareholder CMD Commercial Limited
Director and Shareholder Harbour View Properties Limited
Mau
ry L
eyla
nd P
enno
Director Leaft Foods Limited
Chair Signum Holdings Limited
Director and Shareholder Pure Food Company Limited
Director and Shareholder Stem and Stalk Limited
Chair Okuora Holdings Limited
Chair and Trustee The Education Hub
Trustee Arapito Trust
Trustee Polperro No. 2 Trust
Director Wangapeka River Hops Limited
Chair Trust Codes Limited1
Chair 180 Codes Limited¹
Chair Matrex Limited1
Chair Okuora Farms Limited¹
Shareholder Okuora Holdings Limited1
Director Cloud Computing Continuation Services Limited¹
As at 30 June 2020:
> The Chief Executive of Genesis, Marc England, and Chief Financial Officer of Genesis, Chris Jewell, were Directors of Kupe Venture Limited.
> Chris Jewell, Warwick Williams, the Senior Regulatory Advisor and George McGhie (resident Singapore-based Director and employed by the Genesis Energy captive manager Willis Management (Singapore) Pte Limited) were Directors of Genesis Energy’s captive insurance company incorporated in Singapore, Genesis Energy Insurance Pte Limited.
Directors of subsidiary companies
Use of Company information
No notices have been received by the Board of Genesis under section 145 of the Companies Act 1993 with regard to the use of Company information received by Directors in their capacities as Directors of the Company or its subsidiary companies.
Directors’ interests in shares
Directors disclosed the following relevant interests in Genesis Energy shares as at 30 June 2020:
DIRECTOR
RELEVANT INTEREST HELD
IN SHARES
Barbara Chapman 10,588
Catherine Drayton 10,000
Maury Leyland Penno 19,088
Doug McKay 15,814
Tim Miles 40,410
James Moulder Nil
Paul Zealand Nil
Chief Executive share ownership
The Chief Executive ownership of shares at 30 June 2020 is as follows (excluding shares and performance share rights held under the LTI plans and the Genesis Energy Employee Share Scheme): 231,079.
Donations
In accordance with section 211 (1) (h) of the Companies Act 1993, Genesis records that it made donations of $18,861 during the year ended 30 June 2020. Genesis subsidiaries did not make any donations.
Waivers from the NZX
During the year, the Company relied on a Class Ruling published by NZX Regulation on 19 November 2018 to allow the Company to defer the inclusion of certain provisions in the Company’s Constitution (which were required under new NZX Listing Rules which came into effect on 1 July 2019), until their approval at the Company’s Annual Shareholder Meeting in October 2019.
0n 28 January 2020, NZX Regulation issued a decision granting waivers from NZX Listing Rule 5.2.1 (in respect of transmission agreements with Transpower) and Listing Rule 8.1.5 (in relation to the inclusion of provisions in the Company’s Constitution relating to certain restrictions on the issue, acquisition or transfer of the Company’s shares) and issuing a ruling that Genesis is not a Mining Issuer under the Listing Rules. Each of the two waivers and the ruling had been previously issued to Genesis, but were required to be redocumented under the new Listing Rules.
Credit rating
As at the date of this Annual Report Standard & Poor’s long-term credit rating for Genesis was BBB+ Stable.
Exercise of NZX disciplinary powers
The NZX did not exercise any of its powers under Listing Rule 9.9.3 in relation to Genesis during FY20.
Auditor’s fees
Deloitte, on behalf of the Auditor- General, has continued to act as auditor for the Company and the amounts paid and payable by Genesis and its subsidiaries to Deloitte, for audit fees (including half year review fees) and non-audit fees in FY20, were $558,000 and $38,000 respectively.
Stock exchange listings
Genesis' ordinary shares are listed and quoted on the NZX Main Board (NZSX) and the Australian Securities Exchange (ASX) under the company code 'GNE'. Genesis has three issues of retail bonds listed and quoted on the NZX Debt Market (NZDX) under company codes 'GNE030', 'GNE040' and 'GNE050'. Genesis' listing on the ASX is as a Foreign Exempt Listing. For the purposes of ASX listing rule 1.15.3, Genesis confirms that it continues to comply with NZX Listing Rules.
Disclosures of Directors’ interests in share transactions
During FY20, in relation to the Company’s Directors, the following disclosures were made in the Interests Register by Directors as to the acquisition of relevant interests in Company shares under section 148 of the Companies Act 1993:
a. The acquisition of ordinary shares in the Company pursuant to the Company’s Dividend Reinvestment Plan: - Barbara Chapman 588 shares. - Joanna Perry 690 shares¹.
b. The acquisition of 10,000 shares by Barbara Chapman.
c. The acquisition of 10,000 shares by Catherine Drayton.
1 Joanna Perry resigned on 16 October 2019
For
per
sona
l use
onl
y

86G E N E S I S A N N U A L R E P O R T 2 0 2 085 G E N E S I S A N N U A L R E P O R T 2 0 2 0 C O R P O R A T E G O V E R N A N C E A N D D I S C L O S U R E S C O R P O R A T E G O V E R N A N C E A N D D I S C L O S U R E S
Twenty largest registered shareholders as at 30 June 20*NAME UNITS AT 30 JUNE 2020 % OF UNITS
Her Majesty The Queen In Right Of New Zealand Acting By And Through Her Minister Of Finance And Minister For State Owned Enterprises (SOE)
531,472,627 51.23
Citibank Nominees (New Zealand) Limited 30,853,435 2.97
HSBC Custody Nominees (Australia) Limited 25,320,490 2.44
HSBC Nominees (New Zealand) Limited 23,675,763 2.28
HSBC Nominees (New Zealand) Limited 22,980,312 2.22
Forsyth Barr Custodians Limited 21,875,189 2.11
Accident Compensation Corporation 21,464,779 2.07
JP Morgan Chase Bank Na NZ Branch 15,182,647 1.46
JBWere (NZ) Nominees Limited 12,281,104 1.18
FNZ Custodians Limited 9,499,195 0.92
ANZ Wholesale Australasian Share Fund 9,004,210 0.87
Custodial Services Limited 7,895,163 0.76
New Zealand Depository Nominee Limited 7,882,632 0.76
Citicorp Nominees Pty Limited 7,836,483 0.76
Custodial Services Limited 7,729,244 0.75
BNP Paribas Nominees (NZ) Limited 5,595,516 0.54
Clyde Parker Holland & Rena Holland 5,250,000 0.51
ANZ Custodial Services New Zealand Limited 4,592,808 0.44
BNP Paribas Nominees (NZ) Limited 4,535,304 0.44
Custodial Services Limited 4,123,732 0.40
Totals: Top 20 holders of Ordinary Shares 779,050,633 75.10
* In the above table the shareholding of New Zealand Central Securities Depository Limited (NZSCD) has been allocated to the applicable members of NZSCD.
Substantial security holders
The following information is given pursuant to section 293 of the Financial Markets Conduct Act 2013 (FMCA). According to notice given to the Company pursuant to section 280 (1) (b) of the FMCA, the substantial security holder in the Company and its relevant interests as at the date of the notice are noted below. The total number of voting shares on issue as at 30 June 2020 was 1,037,385,994.
DATE OF SUBSTANTIAL SECURITY NOTICE
RELEVANT INTEREST IN THE NUMBER OF SHARES
% OF SHARES HELD AT DATE OF NOTICE
Her Majesty The Queen In Right Of New Zealand 6 July 2015 519,723,781 51.97
Genesis Energy Limited (GNE030) 4.14% Bonds 18/03/2022 (Total)Top Holders As Of 30/06/2020 Composition: G001
RANK NAME UNITS % UNITS
1 FNZ Custodians Limited 10,734,000 10.73
2 JP Morgan Chase Bank Na NZ Branch 10,525,000 10.53
3 Custodial Services Limited 6,306,000 6.31
4 BNP Paribas Nominees (NZ) Limited 5,200,000 5.20
5 Investment Custodial Services Limited 5,139,000 5.14
6 Citibank Nominees (New Zealand) Limited 5,131,000 5.13
7 Custodial Services Limited 4,933,000 4.93
8 Forsyth Barr Custodians Limited 4,922,000 4.92
9 Custodial Services Limited 4,474,000 4.47
10 Custodial Services Limited 4,192,000 4.19
11 Custodial Services Limited 2,417,000 2.42
12 Generate Kiwisaver Public Trust Nominees Limited 2,079,000 2.08
13 ANZ Custodial Services New Zealand Limited 1,340,000 1.34
14 FNZ Custodians Limited 1,213,000 1.21
15 JBWere (NZ) Nominees Limited 1,100,000 1.10
15 Tea Custodians Limited Client Property Trust Account 1,100,000 1.10
17 Custodial Services Limited 763,000 0.76
18 FNZ Custodians Limited 708,000 0.71
19 Tappenden Holdings Limited 700,000 0.70
20 Custodial Services Limited 610,000 0.61
Totals: Top 20 holders of 4.14% BONDS 18/03/2022 (Total) 73,586,000 73.59
Total Remaining Holders Balance 26,414,000 26.41
Genesis Energy Limited (GNE040) 5.70% Bonds 09/06/2047 (Total)Top Holders As Of 30/06/2020 Composition: G004
RANK NAME UNITS % UNITS
1 Forsyth Barr Custodians Limited 43,104,000 19.16
2 JBWere (NZ) Nominees Limited 25,483,000 11.33
3 FNZ Custodians Limited 15,026,000 6.68
4 Custodial Services Limited 14,413,000 6.41
5 Custodial Services Limited 9,902,000 4.40
6 Custodial Services Limited 7,509,000 3.34
7 Investment Custodial Services Limited 6,543,000 2.91
8 Custodial Services Limited 4,248,000 1.89
9 Citibank Nominees (New Zealand) Limited 4,191,000 1.86
10 Custodial Services Limited 3,424,000 1.52
11 National Nominees Limited 3,388,000 1.51
12 Ponz Capital Limited 3,146,000 1.40
13 Public Trust Class 10 Nominees Limited 2,455,000 1.09
14 Tea Custodians Limited Client Property Trust Account 2,291,000 1.02
15 Custodial Services Limited 2,195,000 0.98
16 Forsyth Barr Custodians Limited 1,844,000 0.82
17 Fletcher Building Educational Fund Limited 1,600,000 0.71
18 Arden Capital Limited 1,450,000 0.64
19 Forsyth Barr Custodians Limited 1,430,000 0.64
20 Vincent Ka Soon Chia & Vui Yung Chia 1,300,000 0.58
Totals: Top 20 holders of 5.70% BONDS 09/06/2047 (Total) 154,942,000 68.86
Total Remaining Holders Balance 70,058,000 31.14
Genesis Energy Limited (GNE050) 4.65% Bonds 16/07/2048 (Total)Top Holders As Of 30/06/2020 Composition: G005
RANK NAME UNITS % UNITS
1 Forsyth Barr Custodians Limited 64,527,000 26.89
2 JBWere (NZ) Nominees Limited 31,213,000 13.01
3 Custodial Services Limited 14,657,000 6.11
4 Custodial Services Limited 14,006,000 5.84
5 Custodial Services Limited 10,491,000 4.37
6 Investment Custodial Services Limited 9,604,000 4.00
7 FNZ Custodians Limited 8,628,000 3.60
8 Custodial Services Limited 5,150,000 2.15
9 Forsyth Barr Custodians Limited 4,665,000 1.94
10 Custodial Services Limited 4,561,000 1.90
11 Custodial Services Limited 2,417,000 1.01
12 KPS Society Limited 835,000 0.35
13 JBWere (NZ) Nominees Limited 750,000 0.31
14 Forsyth Barr Custodians Limited 649,000 0.27
15 Best Farm Limited 600,000 0.25
16 BNP Paribas Nominees (NZ) Limited 515,000 0.21
17 JML Capital Limited 500,000 0.21
17 Renzhong Gong 500,000 0.21
17 Somsmith Nominees Limited 500,000 0.21
20 Custodial Services Limited 462,000 0.19
20 Fava's Sports Car World Limited 462,000 0.19
Totals: Top 21 holders of 4.65% BONDS 16/07/2048 (Total) 175,692,000 73.21
Total Remaining Holders Balance 64,308,000 26.79
For
per
sona
l use
onl
y
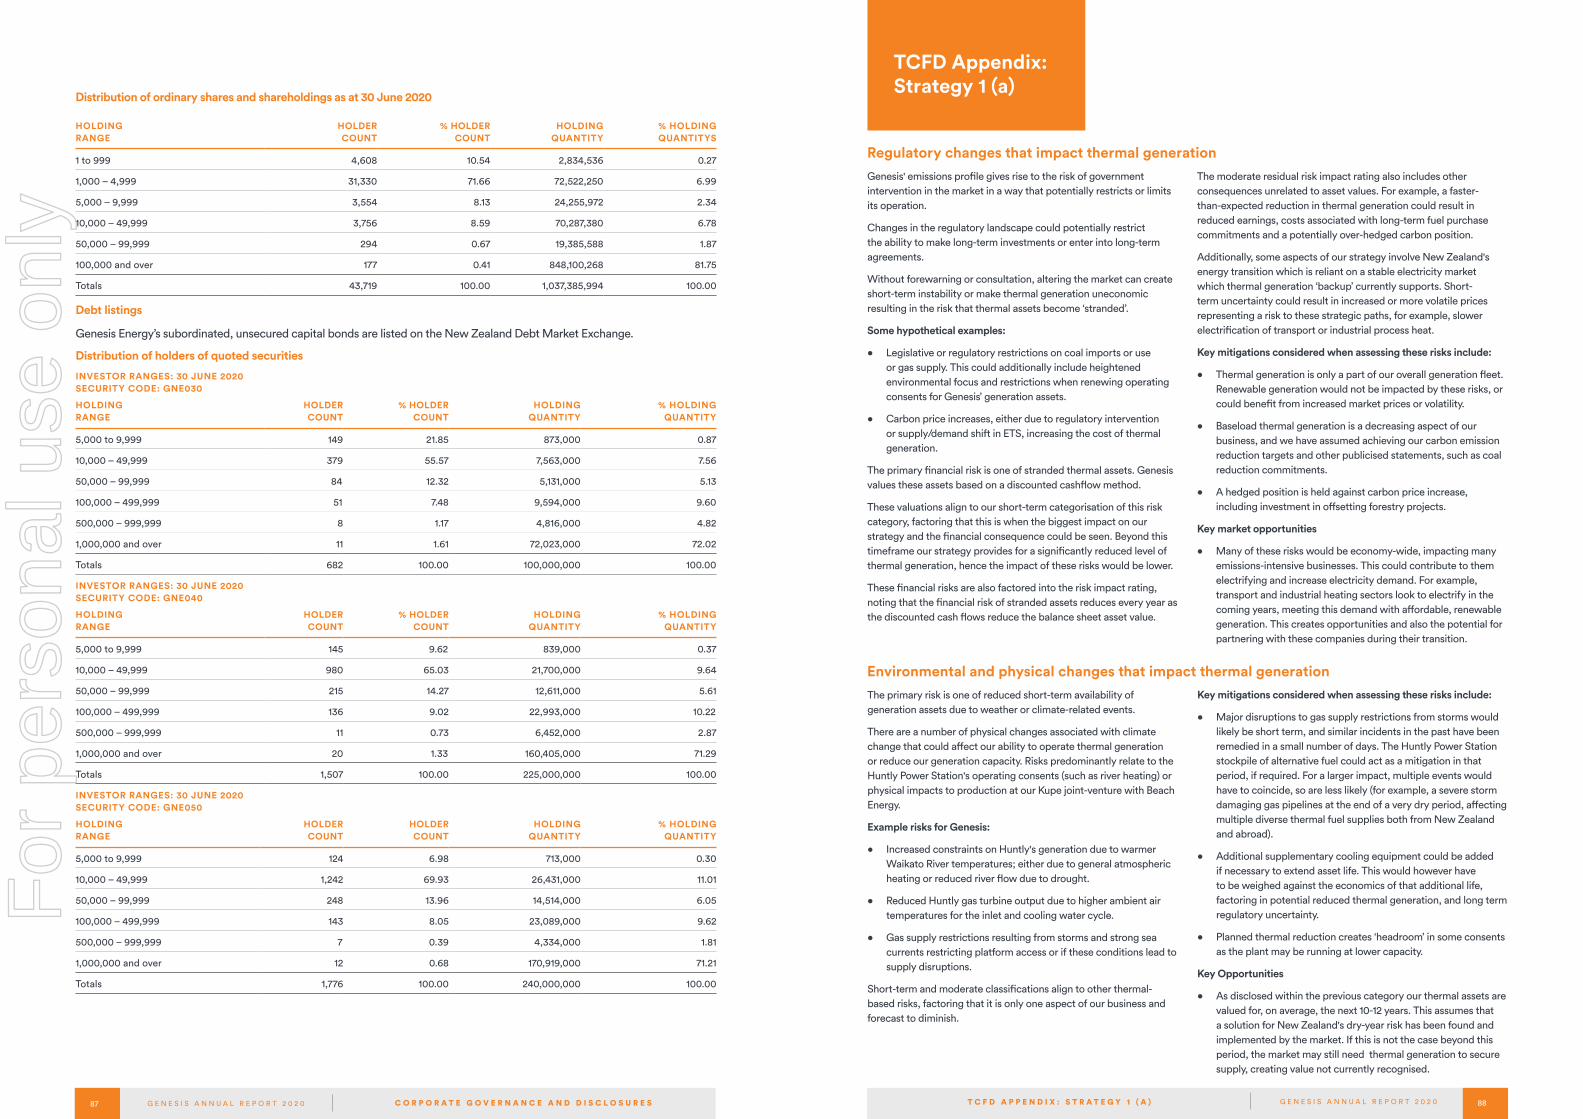
88G E N E S I S A N N U A L R E P O R T 2 0 2 087 G E N E S I S A N N U A L R E P O R T 2 0 2 0 C O R P O R A T E G O V E R N A N C E A N D D I S C L O S U R E S
Distribution of ordinary shares and shareholdings as at 30 June 2020
HOLDING RANGE
HOLDER COUNT
% HOLDER COUNT
HOLDING QUANTITY
% HOLDING QUANTITYS
1 to 999 4,608 10.54 2,834,536 0.27
1,000 – 4,999 31,330 71.66 72,522,250 6.99
5,000 – 9,999 3,554 8.13 24,255,972 2.34
10,000 – 49,999 3,756 8.59 70,287,380 6.78
50,000 – 99,999 294 0.67 19,385,588 1.87
100,000 and over 177 0.41 848,100,268 81.75
Totals 43,719 100.00 1,037,385,994 100.00
Debt listings
Genesis Energy’s subordinated, unsecured capital bonds are listed on the New Zealand Debt Market Exchange.
Distribution of holders of quoted securities
INVESTOR RANGES: 30 JUNE 2020 SECURITY CODE: GNE030
HOLDING RANGE
HOLDER COUNT
% HOLDER COUNT
HOLDING QUANTITY
% HOLDING QUANTITY
5,000 to 9,999 149 21.85 873,000 0.87
10,000 – 49,999 379 55.57 7,563,000 7.56
50,000 – 99,999 84 12.32 5,131,000 5.13
100,000 – 499,999 51 7.48 9,594,000 9.60
500,000 – 999,999 8 1.17 4,816,000 4.82
1,000,000 and over 11 1.61 72,023,000 72.02
Totals 682 100.00 100,000,000 100.00
INVESTOR RANGES: 30 JUNE 2020 SECURITY CODE: GNE040
HOLDING RANGE
HOLDER COUNT
% HOLDER COUNT
HOLDING QUANTITY
% HOLDING QUANTITY
5,000 to 9,999 145 9.62 839,000 0.37
10,000 – 49,999 980 65.03 21,700,000 9.64
50,000 – 99,999 215 14.27 12,611,000 5.61
100,000 – 499,999 136 9.02 22,993,000 10.22
500,000 – 999,999 11 0.73 6,452,000 2.87
1,000,000 and over 20 1.33 160,405,000 71.29
Totals 1,507 100.00 225,000,000 100.00
INVESTOR RANGES: 30 JUNE 2020SECURITY CODE: GNE050
HOLDING RANGE
HOLDER COUNT
HOLDER COUNT
HOLDING QUANTITY
% HOLDING QUANTITY
5,000 to 9,999 124 6.98 713,000 0.30
10,000 – 49,999 1,242 69.93 26,431,000 11.01
50,000 – 99,999 248 13.96 14,514,000 6.05
100,000 – 499,999 143 8.05 23,089,000 9.62
500,000 – 999,999 7 0.39 4,334,000 1.81
1,000,000 and over 12 0.68 170,919,000 71.21
Totals 1,776 100.00 240,000,000 100.00
Genesis' emissions profile gives rise to the risk of government intervention in the market in a way that potentially restricts or limits its operation.
Changes in the regulatory landscape could potentially restrict the ability to make long-term investments or enter into long-term agreements.
Without forewarning or consultation, altering the market can create short-term instability or make thermal generation uneconomic resulting in the risk that thermal assets become ‘stranded’.
Some hypothetical examples:
• Legislative or regulatory restrictions on coal imports or use or gas supply. This could additionally include heightened environmental focus and restrictions when renewing operating consents for Genesis’ generation assets.
• Carbon price increases, either due to regulatory intervention or supply/demand shift in ETS, increasing the cost of thermal generation.
The primary financial risk is one of stranded thermal assets. Genesis values these assets based on a discounted cashflow method.
These valuations align to our short-term categorisation of this risk category, factoring that this is when the biggest impact on our strategy and the financial consequence could be seen. Beyond this timeframe our strategy provides for a significantly reduced level of thermal generation, hence the impact of these risks would be lower.
These financial risks are also factored into the risk impact rating, noting that the financial risk of stranded assets reduces every year as the discounted cash flows reduce the balance sheet asset value.
The moderate residual risk impact rating also includes other consequences unrelated to asset values. For example, a faster-than-expected reduction in thermal generation could result in reduced earnings, costs associated with long-term fuel purchase commitments and a potentially over-hedged carbon position.
Additionally, some aspects of our strategy involve New Zealand's energy transition which is reliant on a stable electricity market which thermal generation ‘backup’ currently supports. Short-term uncertainty could result in increased or more volatile prices representing a risk to these strategic paths, for example, slower electrification of transport or industrial process heat.
Key mitigations considered when assessing these risks include:
• Thermal generation is only a part of our overall generation fleet. Renewable generation would not be impacted by these risks, or could benefit from increased market prices or volatility.
• Baseload thermal generation is a decreasing aspect of our business, and we have assumed achieving our carbon emission reduction targets and other publicised statements, such as coal reduction commitments.
• A hedged position is held against carbon price increase, including investment in offsetting forestry projects.
Key market opportunities
• Many of these risks would be economy-wide, impacting many emissions-intensive businesses. This could contribute to them electrifying and increase electricity demand. For example, transport and industrial heating sectors look to electrify in the coming years, meeting this demand with affordable, renewable generation. This creates opportunities and also the potential for partnering with these companies during their transition.
T C F D A P P E N D I X : S T R A T E G Y 1 ( A )
TCFD Appendix: Strategy 1 (a)
The primary risk is one of reduced short-term availability of generation assets due to weather or climate-related events.
There are a number of physical changes associated with climate change that could affect our ability to operate thermal generation or reduce our generation capacity. Risks predominantly relate to the Huntly Power Station's operating consents (such as river heating) or physical impacts to production at our Kupe joint-venture with Beach Energy.
Example risks for Genesis:
• Increased constraints on Huntly's generation due to warmer Waikato River temperatures; either due to general atmospheric heating or reduced river flow due to drought.
• Reduced Huntly gas turbine output due to higher ambient air temperatures for the inlet and cooling water cycle.
• Gas supply restrictions resulting from storms and strong sea currents restricting platform access or if these conditions lead to supply disruptions.
Short-term and moderate classifications align to other thermal-based risks, factoring that it is only one aspect of our business and forecast to diminish.
Key mitigations considered when assessing these risks include:
• Major disruptions to gas supply restrictions from storms would likely be short term, and similar incidents in the past have been remedied in a small number of days. The Huntly Power Station stockpile of alternative fuel could act as a mitigation in that period, if required. For a larger impact, multiple events would have to coincide, so are less likely (for example, a severe storm damaging gas pipelines at the end of a very dry period, affecting multiple diverse thermal fuel supplies both from New Zealand and abroad).
• Additional supplementary cooling equipment could be added if necessary to extend asset life. This would however have to be weighed against the economics of that additional life, factoring in potential reduced thermal generation, and long term regulatory uncertainty.
• Planned thermal reduction creates ‘headroom’ in some consents as the plant may be running at lower capacity.
Key Opportunities
• As disclosed within the previous category our thermal assets are valued for, on average, the next 10-12 years. This assumes that a solution for New Zealand's dry-year risk has been found and implemented by the market. If this is not the case beyond this period, the market may still need thermal generation to secure supply, creating value not currently recognised.
Regulatory changes that impact thermal generation
Environmental and physical changes that impact thermal generation
For
per
sona
l use
onl
y
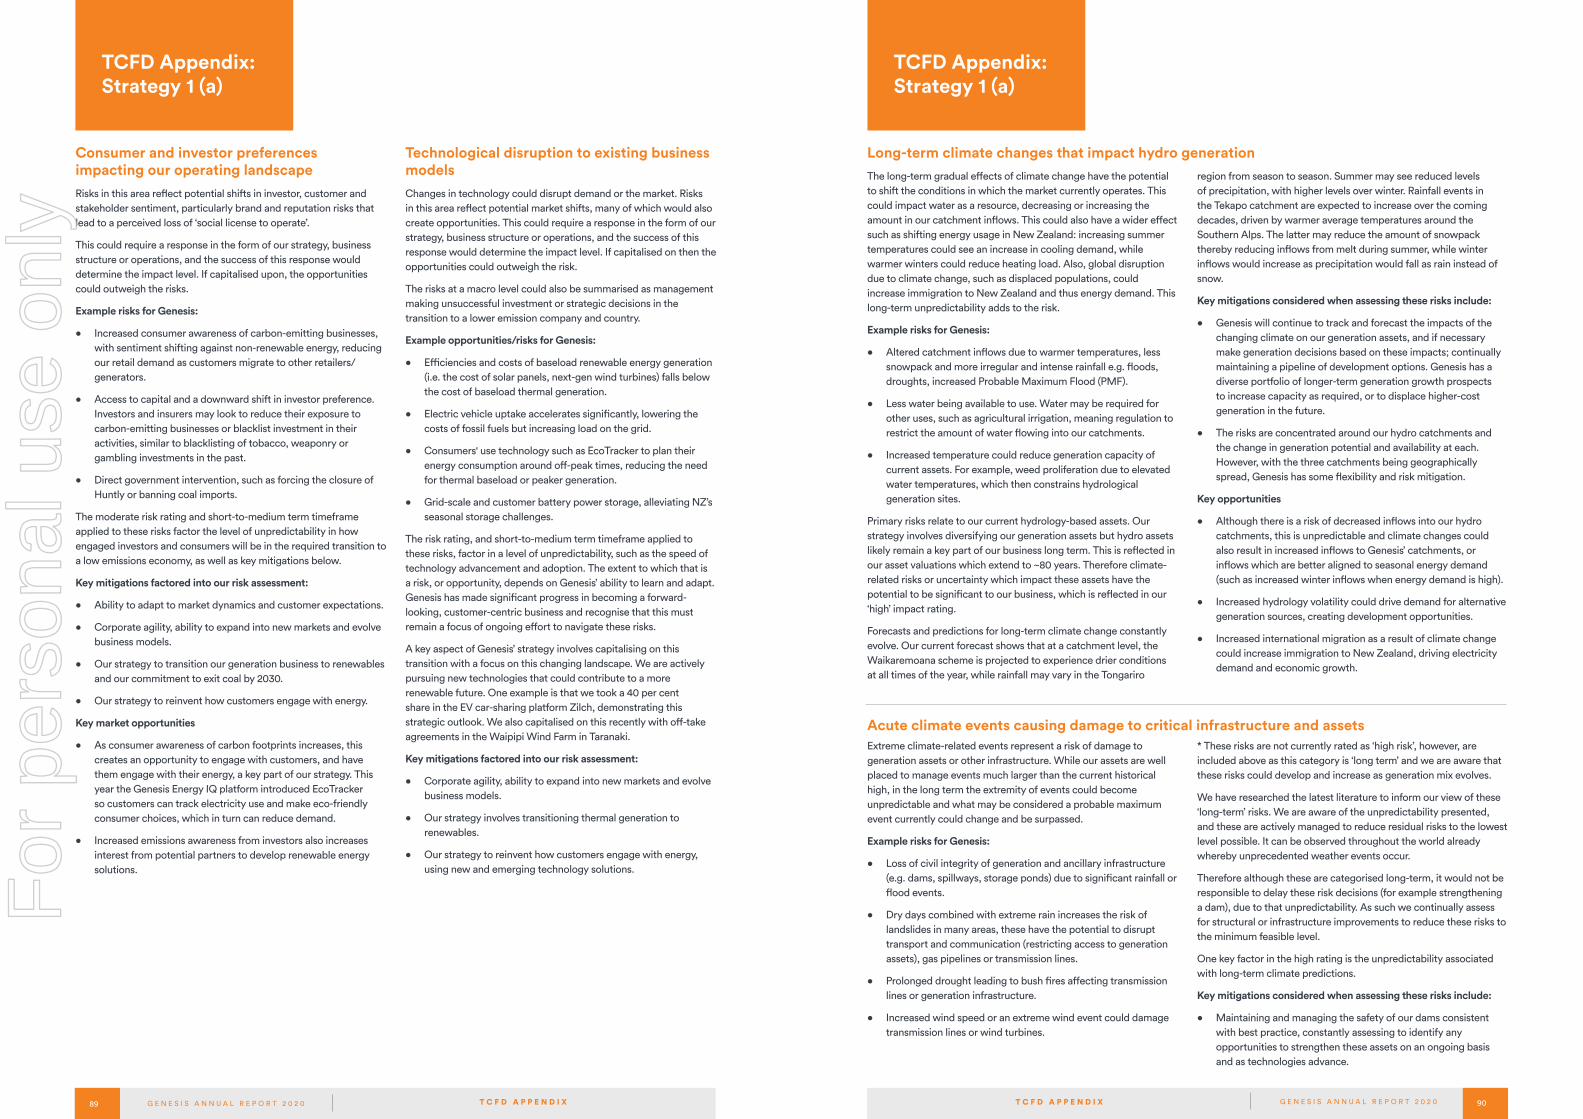
90G E N E S I S A N N U A L R E P O R T 2 0 2 089 G E N E S I S A N N U A L R E P O R T 2 0 2 0 T C F D A P P E N D I X
The long-term gradual effects of climate change have the potential to shift the conditions in which the market currently operates. This could impact water as a resource, decreasing or increasing the amount in our catchment inflows. This could also have a wider effect such as shifting energy usage in New Zealand: increasing summer temperatures could see an increase in cooling demand, while warmer winters could reduce heating load. Also, global disruption due to climate change, such as displaced populations, could increase immigration to New Zealand and thus energy demand. This long-term unpredictability adds to the risk.
Example risks for Genesis:
• Altered catchment inflows due to warmer temperatures, less snowpack and more irregular and intense rainfall e.g. floods, droughts, increased Probable Maximum Flood (PMF).
• Less water being available to use. Water may be required for other uses, such as agricultural irrigation, meaning regulation to restrict the amount of water flowing into our catchments.
• Increased temperature could reduce generation capacity of current assets. For example, weed proliferation due to elevated water temperatures, which then constrains hydrological generation sites.
Primary risks relate to our current hydrology-based assets. Our strategy involves diversifying our generation assets but hydro assets likely remain a key part of our business long term. This is reflected in our asset valuations which extend to ~80 years. Therefore climate-related risks or uncertainty which impact these assets have the potential to be significant to our business, which is reflected in our ‘high’ impact rating.
Forecasts and predictions for long-term climate change constantly evolve. Our current forecast shows that at a catchment level, the Waikaremoana scheme is projected to experience drier conditions at all times of the year, while rainfall may vary in the Tongariro
region from season to season. Summer may see reduced levels of precipitation, with higher levels over winter. Rainfall events in the Tekapo catchment are expected to increase over the coming decades, driven by warmer average temperatures around the Southern Alps. The latter may reduce the amount of snowpack thereby reducing inflows from melt during summer, while winter inflows would increase as precipitation would fall as rain instead of snow.
Key mitigations considered when assessing these risks include:
• Genesis will continue to track and forecast the impacts of the changing climate on our generation assets, and if necessary make generation decisions based on these impacts; continually maintaining a pipeline of development options. Genesis has a diverse portfolio of longer-term generation growth prospects to increase capacity as required, or to displace higher-cost generation in the future.
• The risks are concentrated around our hydro catchments and the change in generation potential and availability at each. However, with the three catchments being geographically spread, Genesis has some flexibility and risk mitigation.
Key opportunities
• Although there is a risk of decreased inflows into our hydro catchments, this is unpredictable and climate changes could also result in increased inflows to Genesis’ catchments, or inflows which are better aligned to seasonal energy demand (such as increased winter inflows when energy demand is high).
• Increased hydrology volatility could drive demand for alternative generation sources, creating development opportunities.
• Increased international migration as a result of climate change could increase immigration to New Zealand, driving electricity demand and economic growth.
T C F D A P P E N D I X
TCFD Appendix: Strategy 1 (a)
TCFD Appendix: Strategy 1 (a)
Extreme climate-related events represent a risk of damage to generation assets or other infrastructure. While our assets are well placed to manage events much larger than the current historical high, in the long term the extremity of events could become unpredictable and what may be considered a probable maximum event currently could change and be surpassed.
Example risks for Genesis:
• Loss of civil integrity of generation and ancillary infrastructure (e.g. dams, spillways, storage ponds) due to significant rainfall or flood events.
• Dry days combined with extreme rain increases the risk of landslides in many areas, these have the potential to disrupt transport and communication (restricting access to generation assets), gas pipelines or transmission lines.
• Prolonged drought leading to bush fires affecting transmission lines or generation infrastructure.
• Increased wind speed or an extreme wind event could damage transmission lines or wind turbines.
* These risks are not currently rated as ‘high risk’, however, are included above as this category is ‘long term’ and we are aware that these risks could develop and increase as generation mix evolves.
We have researched the latest literature to inform our view of these ‘long-term’ risks. We are aware of the unpredictability presented, and these are actively managed to reduce residual risks to the lowest level possible. It can be observed throughout the world already whereby unprecedented weather events occur.
Therefore although these are categorised long-term, it would not be responsible to delay these risk decisions (for example strengthening a dam), due to that unpredictability. As such we continually assess for structural or infrastructure improvements to reduce these risks to the minimum feasible level.
One key factor in the high rating is the unpredictability associated with long-term climate predictions.
Key mitigations considered when assessing these risks include:
• Maintaining and managing the safety of our dams consistent with best practice, constantly assessing to identify any opportunities to strengthen these assets on an ongoing basis and as technologies advance.
Long-term climate changes that impact hydro generation
Acute climate events causing damage to critical infrastructure and assets
Consumer and investor preferences impacting our operating landscape Risks in this area reflect potential shifts in investor, customer and stakeholder sentiment, particularly brand and reputation risks that lead to a perceived loss of ‘social license to operate’.
This could require a response in the form of our strategy, business structure or operations, and the success of this response would determine the impact level. If capitalised upon, the opportunities could outweigh the risks.
Example risks for Genesis:
• Increased consumer awareness of carbon-emitting businesses, with sentiment shifting against non-renewable energy, reducing our retail demand as customers migrate to other retailers/generators.
• Access to capital and a downward shift in investor preference. Investors and insurers may look to reduce their exposure to carbon-emitting businesses or blacklist investment in their activities, similar to blacklisting of tobacco, weaponry or gambling investments in the past.
• Direct government intervention, such as forcing the closure of Huntly or banning coal imports.
The moderate risk rating and short-to-medium term timeframe applied to these risks factor the level of unpredictability in how engaged investors and consumers will be in the required transition to a low emissions economy, as well as key mitigations below.
Key mitigations factored into our risk assessment:
• Ability to adapt to market dynamics and customer expectations.
• Corporate agility, ability to expand into new markets and evolve business models.
• Our strategy to transition our generation business to renewables and our commitment to exit coal by 2030.
• Our strategy to reinvent how customers engage with energy.
Key market opportunities
• As consumer awareness of carbon footprints increases, this creates an opportunity to engage with customers, and have them engage with their energy, a key part of our strategy. This year the Genesis Energy IQ platform introduced EcoTracker so customers can track electricity use and make eco-friendly consumer choices, which in turn can reduce demand.
• Increased emissions awareness from investors also increases interest from potential partners to develop renewable energy solutions.
Technological disruption to existing business models Changes in technology could disrupt demand or the market. Risks in this area reflect potential market shifts, many of which would also create opportunities. This could require a response in the form of our strategy, business structure or operations, and the success of this response would determine the impact level. If capitalised on then the opportunities could outweigh the risk.
The risks at a macro level could also be summarised as management making unsuccessful investment or strategic decisions in the transition to a lower emission company and country.
Example opportunities/risks for Genesis:
• Efficiencies and costs of baseload renewable energy generation (i.e. the cost of solar panels, next-gen wind turbines) falls below the cost of baseload thermal generation.
• Electric vehicle uptake accelerates significantly, lowering the costs of fossil fuels but increasing load on the grid.
• Consumers' use technology such as EcoTracker to plan their energy consumption around off-peak times, reducing the need for thermal baseload or peaker generation.
• Grid-scale and customer battery power storage, alleviating NZ’s seasonal storage challenges.
The risk rating, and short-to-medium term timeframe applied to these risks, factor in a level of unpredictability, such as the speed of technology advancement and adoption. The extent to which that is a risk, or opportunity, depends on Genesis’ ability to learn and adapt. Genesis has made significant progress in becoming a forward-looking, customer-centric business and recognise that this must remain a focus of ongoing effort to navigate these risks.
A key aspect of Genesis’ strategy involves capitalising on this transition with a focus on this changing landscape. We are actively pursuing new technologies that could contribute to a more renewable future. One example is that we took a 40 per cent share in the EV car-sharing platform Zilch, demonstrating this strategic outlook. We also capitalised on this recently with off-take agreements in the Waipipi Wind Farm in Taranaki.
Key mitigations factored into our risk assessment:
• Corporate agility, ability to expand into new markets and evolve business models.
• Our strategy involves transitioning thermal generation to renewables.
• Our strategy to reinvent how customers engage with energy, using new and emerging technology solutions.
For
per
sona
l use
onl
y

92G E N E S I S A N N U A L R E P O R T 2 0 2 091 G E N E S I S A N N U A L R E P O R T 2 0 2 0
Audit and Risk CommitteeA sub-committee of the Board forms the Audit and Risk Committee (ARC), overseen by the ARC Chair. The principal purpose of the ARC is to support the Board in its oversight of the Company’s risk framework, including the Risk Management Policy and to monitor compliance within that framework. ARC’s core functions include:
• Periodically provides a formal review of Genesis’ risk management framework and policies. ARC ensures these policies remain fit for purpose, with appropriate and effective risk management strategies in place. Within the framework is Genesis’ Risk Appetite Statement which has a specific carbon emissions section. This Risk Appetite Statement underpins the overall Risk Management Framework.
• Receiving quarterly risk reports from Executive Management. This covers a range of risk topics, grouped as: key risks, emerging risks, strategic risks and conduct risks. Climate-related risks are defined as ‘key risks’ but also straddle multiple risk categories on occasion.
• Reporting to the Board on the outcomes of ARC meetings, including discussions concerning risks.
• Additionally, the Board receives six-monthly updates on key sustainability trends and issues. As an example, the ARC formally endorses both the scenarios used for Genesis’ climate related risk assessments and any potential output of those assessments.
Executive risk managementThe core functions of the Executive with regards to managing climate-related risk:
• The Executive are ultimately held accountable by the Board to provide a robust risk overview.
• The Executive implements the risk mitigation strategies as approved by ARC and, where applicable, the Board. Quarterly risk reports are delivered to ARC, which includes actions taken to mitigate risks previously disclosed.
• At an operational level the day-to-day management of climate-related risks, including monitoring performance against targets and delivering on commitments, is dispersed throughout Genesis. Everyone has their part to play, which is emphasised by a strong ‘tone at the top’ which flows down throughout the wider business’ operations.
• Emerging and developing risks, including those that are climate-related, are monitored periodically. This is primarily performed by Genesis’ strategy team, the management of which is closely aligned to the Risk team through the Group Manager Strategy and Risk role.
• Additionally, the Executive review quarterly sustainability updates on the Company’s progress against its Sustainability goals.
T C F D A P P E N D I X
Risk IdentificationGenesis is cognisant of the ongoing and developing effects of climate change, along with the potential environmental impacts, and associated operational, regulatory and financial risks to the business. Climate-related risks are a subset of the Genesis’ overall risk management process.
• Risks are identified, assessed and managed by the Risk Management and Strategy teams, under the supervision of the Group Manager Strategy and Risk. The Group Manager Strategy and Risk reports to the Chief Financial Officer.
• Risk specialists are tasked with constant research and market analysis to monitor the Company’s risk landscape to identify new, emerging or developing risks. This includes staying up-to-date with all emerging risks including the latest climate-related research. Each business unit also has a nominated risk champion.
• The Risk Team provide day-to-day guidance to business units on how best to identify or manage risks.
• The Risk Team monitor emerging risks, both within the industry, the wider economy, and across international markets, including reporting on such to the Executive and Board. One aspect of this includes contrasting identified key business risks, strategic risks and climate risks against industry publications such as the World Economic Forum’s Global Risk report.
• In addition to the overarching risk management framework, additional procedures are tailored towards specific risk categories. For climate-related risk we apply the recommendations of the TCFD and undertake climate scenario modelling and analysis, described further on Page 18.
T C F D A P P E N D I X
TCFD Appendix: 4. Risk Management
TCFD Appendix: 3. Governance
Risk Assessment Given the Company’s exposure to climate-related risk, this has long been factored and deeply incorporated into every aspect of our risk assessments. Our climate-risk processes, including assessment, recognise that climate-related risks are both fundamentally different to the other risks the Company faces, while also being integrated with the wider risk management operation.
• All risks, including climate-related risk, are assessed using the same framework, whilst also recognising key differences in the underlying characteristics of specific risk categories.
• Genesis assesses the significance of each identified climate-related risk using a risk management matrix. Aligning with the assessment of all risks, the matrix encapsulates a likelihood and consequence aspect, which allows the Company to determine the appropriate level of response for each key risk.
• Like many companies, key risks and risk management are historically weighted toward the near term to establish prioritisation. This simply does not work for risks such as climate change which can occur across decades. One key difference between climate-related risk and other key risks is the ‘likelihood’ aspect. By its very nature this is difficult to accurately quantify especially over these long-term periods and including large numbers of variables.
• This differentiation is recognised in the way we assess climate-related risks specifically. A greater level of weighting is placed on the ‘consequence’ aspect of the matrix, than the likelihood. This ensures the correct level of emphasis is placed on mitigating the risks ahead of time.
• This consequence aspect therefore has a large factor when determining the materiality of the risks we face. Due to the magnitude of climate-related risks and their possible effects on every aspect of the business, this elevates risks to ensure they receive the appropriate attention even if extremely long-term, or of low probabilty. Applied to this, we develop appropriate mitigations such as carbon offsetting and carbon displacement as part of the Company’s overall emissions reduction strategies.
Process of risk managementThe processes for managing climate-related risks are incorporated into Genesis’ Risk Framework, which applies to all risks. Developing the systems and policies to manage climate-related risk is a highly adaptive, ongoing process.
Datasets are leveraged from both historical precedent and flexible forecasting to develop plausible scenario mapping. These scenarios factor in the environmental impacts and associated operational, regulatory and financial risks to the business. Genesis continues to track and forecast the impacts of the changing climate on our generation assets, and make well-informed decisions based upon that data.
Depending on the characteristics of the specific climate risk identified an appropriate management response will be applied, aligning to other risks of a similar nature. Depending on that nature the approach, that will be to mitigate, monitor, transfer or avoid.
The climate risks we face are integrated within our Risk Management Framework, aligning to other risks of similar characteristics. We regularly monitor whether climate science requires us to reassess these approaches.
Genesis’ Chief Executive and Executive Leadership team are accountable for Genesis’ actions and commitments to embed climate change into risk management, business strategy and planning, budgeting processes and frameworks.
This includes identifying, considering and monitoring climate-related risks and opportunities and reporting to the Audit and Risk Committee and the Board.
For
per
sona
l use
onl
y

93 G E N E S I S A N N U A L R E P O R T 2 0 2 0
Head/Registered OfficeGenesis Energy Building660 Great South Road,Greenlane, Auckland 1051P: 64 9 580 2094F: 64 9 580 4894E: [email protected]@[email protected]: genesisenergy.co.nzenergyonline.co.nz
Hamilton94 Bryce Street, Hamilton
Huntly Power StationCnr Te Ohaki andHetherington Roads, Huntly
Tokaanu Power StationState Highway 47, Tokaanu
Waikaremoana Power StationMain Road, Tuai RD5,Wairoa 4195
Tekapo Power Station167 Tekapo Power House Road, Tekapo 7999
O F F I C E L O C A T I O N S
Bryce Hendersonfor Deloitte Limitedhas been appointed toperform the audit on behalfof the Auditor-General.
B A N K E R S Westpac D E S I G N E D B YJade Shen
P R I N T E D R E P O R T P A P E R S T O C KOur Annual Report is printed on Tauro Offsetpaper stock, which is made from material fromwell-managed, FSC® -certified forests and other controlled sources. The fibre used to produceTauro Offset is elemental chlorine free (ECF).
A U D I T O R
E Y A S S U R A N C E - S C O P E E M I S S I O N S
Independent Limited Assurance Statement to the Management and Directors of Genesis Energy
What our assurance covered We reviewed Genesis’ total GHG inventory (including scope 1, scope 2 and certain scope 3 emissions from business travel, office waste and use of sold products) for the year ended 30 June 2020, disclosed on page 21 of Genesis’ 2020 Annual Report.
Criteria applied by Genesis In preparing the GHG inventory, Genesis applied the Greenhouse Gas Protocol: A Corporate Accounting and Reporting Standard (‘The GHG Protocol’). Emissions factor sources include the following (together the ‘Criteria’):
New Zealand Ministry for the Environment, Measuring Emissions: A Guide for Organisations (2019) (“the Criteria”).
Key responsibilities EY’s responsibility and independence Our responsibility was to express a conclusion on Genesis’ voluntary GHG inventory disclosure for the year ended 30 June 2020 based on our review. We have complied with the relevant ethical requirements relating to assurance engagements, which include independence and other requirements founded on fundamental principles of integrity, objectivity, professional competence and due care, confidentiality and professional behaviour. In accordance with the Professional and Ethical Standard 3 (Amended), Ernst & Young Limited maintains a comprehensive system of quality control including documented policies and procedures regarding compliance with ethical requirements, professional standards and applicable legal and regulatory requirements.
Genesis’ responsibility Genesis management (“management”) was responsible for selecting the Criteria, and preparing and fairly presenting the GHG inventory for the year ended 30 June 2020 in accordance with that Criteria. This responsibility includes establishing and maintaining internal controls, adequate records and making estimates that are reasonable in the circumstances.
Our approach to conducting the engagement We conducted this review in accordance with the International Standard on Assurance Engagements ISAE (NZ) 3000: Assurance Engagements Other than Audits or Reviews of Historical Financial Information, ISAE (NZ) 3410 Assurance Engagements on Greenhouse Gas Statements and the terms of reference for this engagement as agreed with Genesis on 12 June 2020.
Summary of assurance procedures performed A limited assurance engagement consists of making enquiries and applying analytical, appropriate testing, and other evidence-gathering procedures. Our procedures included, but were not limited to:
Conducting interviews with personnel to understand the business and reporting process
Checking that the flow of information from site metering or monitoring through to calculation spreadsheets is accurate and any calculations are appropriate
Identifying and testing assumptions supporting the calculations
Tests of calculation, aggregation and controls Comparing year-on-year activities-based greenhouse gas
and energy data, where possible Checking organisational and operational boundaries to test
completeness of greenhouse gas emissions sources Checking that emissions factors and methodologies have
been correctly applied as per the criteria Reviewing the appropriateness of the presentation of
disclosures.
We believe that the evidence obtained is sufficient and appropriate to provide a basis for our limited assurance conclusions.
Limited Assurance Procedures performed in a limited assurance engagement vary in nature and timing from, and are less in extent than for, a reasonable assurance engagement. Consequently the level of assurance obtained in a limited assurance engagement is substantially lower than the assurance that would have been obtained had a reasonable assurance engagement been performed. While we considered the effectiveness of management’s internal controls when determining the nature and extent of our procedures, our assurance engagement was not designed to provide assurance on internal controls. Our procedures did not include testing controls or performing procedures relating to checking aggregation or calculation of data within IT systems.
Use of our Assurance Statement We disclaim any assumption of responsibility for any reliance on this assurance report to any persons other than management and the Directors of Genesis or for any purpose other than that for which it was prepared.
Ernst & Young Limited
Graeme Bennett Partner - Assurance Auckland 19 August 2020
Our Conclusion: Ernst & Young (‘EY’, ‘we’) was engaged by Genesis Energy Limited (“Genesis”) to undertake limited assurance as defined by the International Standards on Assurance engagements (New Zealand) 3000, over Genesis’ voluntary greenhouse gas (“GHG”) emissions inventory (“GHG inventory”) disclosures (including scope 1, scope 2 and certain scope 3 emissions from business travel, office waste and use of sold products) for the year ended 30 June 2020. Based on our limited assurance procedures, nothing came to our attention that caused us to believe that Genesis’ GHG inventory for the year ended 30 June 2020 disclosed on page 21 of the Genesis 2020 Annual Report, has not been prepared and presented fairly, in all material respects, in accordance with the Criteria defined below.
A member firm of Ernst & Young Global Limited
For
per
sona
l use
onl
y

95 G E N E S I S A N N U A L R E P O R T 2 0 2 0
For
per
sona
l use
onl
y