for personal use only · 2018. 9. 27. · 1st sale completed to st. vincent’s hospital melbourne....
TRANSCRIPT

Annual Report
Advancing. Expanding. Commercialising.
For the year ended 30 June 2018
For
per
sona
l use
onl
y

LBT Innovations ABN 95 107 670 673
Principal Place of Business & Registered Office
Level 8, 44 Waymouth Street Adelaide SA 5000
Phone: +61 8 8227 1555
Website: lbtinnovations.com
Directors
Catherine Mary Costello (Commenced chair position 1 August 2017) Chairman (Formerly non-executive director)
Robert Andrew Finder (Retired 31 July 2017) Chairman
Brenton Barnes Chief Executive Officer and Managing Director
Stephen Paul Mathwin Non-Executive Director
Caroline Popper Non-Executive Director
Dr Glenn Haifer (Commenced 1 September 2017) Non-Executive Director
Matthew Michalewicz (Commenced 1 September 2017) Non-Executive Director
Company Secretary
Daniel Hill Company Secretary (Formerly Company Secretary and Chief Financial Officer) Retired as Chief Financial Officer on 24 August 2017
Chief Financial Officer
Raymond Ridge (Commenced 25 August 2017)
Lawyers
Thomson Geer Lawyers 19 Gouger Street Adelaide SA 5000
Auditors HLB Mann Judd Audit (SA) Pty Ltd 167-169 Fullarton Rd Dulwich SA 5065
Share Register
Computershare Investor Services Pty Limited GPO Box 1903 Adelaide SA 5001 Listed Securities LBT: Ordinary Shares
For
per
sona
l use
onl
y

Chairman’s Letter to Shareholders .....................................5
Directors’ Report ................................................................ 6-23
Auditors’ Independence Declaration............................... 24
Statement of Comprehensive Income ............................ 25
Statement of Financial Position ......................................... 26
Statement of Changes in Equity .........................................27
Statement of Cash Flows ..................................................... 28
Notes to the Financial Statements ............................. 29-53
Directors’ Declaration .......................................................... 54
Independent Auditor’s Report .................................... 55-58
Shareholder Information..............................................59-60
Contents
For
per
sona
l use
onl
y

Fast Accurate Cost effective
Accelerated results
APAS® IndependenceThe first automated culture plate reader.
The APAS Independence is an innovative in vitro diagnostic instrument for automated imaging, analysis and interpretation of agar culture plates.
3x fasterthan manual reading providing cost and efficiency gains.
1st salecompleted to St. Vincent’s Hospital Melbourne.
10,000patient clinical study grants clearance from FDA.
For
per
sona
l use
onl
y

Commercial launch
Establishing early presenceFirst placement in Labor Wisplinghoff (largest lab in Germany).
EU centre of excellence and on the ground technical support.
Establishing early presenceUS soft launch early 2019.
Launch marketLocal and leading technology and
microbiology knowledge.
Establish training and sales tools which are modelled, tested and ready for
expansion into larger markets.
laboratories
Total global market
Proprietary patented technology
Upfront and annual fees providing an attractive revenue model
Expanding leadership team and board
Targetingmedium to large
13,000 laboratoriesopportunity estimated at
For
per
sona
l use
onl
y

2017–2018 highlights and commercial achievements
August 2018
First APAS Independence commercial sale; additional evaluations ongoing
November 2017
St Vincent’s Melbourne completes clinical validation
August 2017
Board rejuvenation
December 2017
Sale of MicroStreak IP to AutoBio and $2m placement
February 2018
South Australian Government $4m low interest funding
April 2018
$7.9m Placement and Share Purchase Plan
May 2018
Strategic investor Planet Innovation invests in
placement
March 2018
AU sales commence sales executive appointed
April 2018
Data presented at ECCMID largest global meeting
May 2018
APAS Independence placed in first EU site – Labor Dr Wisplinghoff
For
per
sona
l use
onl
y

Chairman’s Letter to Shareholders
Chairman’s Letter
On behalf of the LBT Innovations board, I’m pleased to present the company’s 2017-2018 annual report after a year in which we made great strides in advancing and commercialising our technology. This culminated in the August 2018 sale of our first APAS Independence instrument to Melbourne’s St Vincent’s Hospital.
Since the beginnings of LBT, the company has focused on inventing innovative technology that addresses unmet needs for clinical microbiologists. We are very proud of our competencies in navigating complex engineering development and regulatory processes, thus delivering instrumentation that enhances efficiencies in busy pathology laboratories globally.
Our core passions are finding efficiencies and developing medical technology and we continue to be proactive in establishing new ideas for our current ventures and future endeavours.
Globally, qualified clinical microbiologists are in short supply. Recently published data indicates the US vacancy rate at any one time is 9%, while the average age of an Australian microbiologist is 51.
With an estimated 28,000 clinical microbiology laboratories globally processing millions of agar plates per day, there is a clear need for automation of this process.
Over the past decade, artificial intelligence (AI) has been placed into workplaces in almost every industry worldwide. Our APAS technology is the only AI technology for clinical microbiology cleared by the US Food & Drug Administration.
In November 2017, we successfully completed an independent evaluation of our APAS Independence instrument at St Vincent’s Hospital in Melbourne.
This appraisal was the first installation of the instrument globally and resulted in the first sale in August 2018. We also have a number of ongoing initiatives and collaboration efforts in place with laboratories, universities and the South Australian Government to supplement the work of our highly skilled workforce.
These partnerships provide the necessary platform for LBT to be able to collaborate and organically grow.
I am excited about the year ahead and I am confident about the ability of our management team to achieve the operational and strategic objectives set by the board.
On behalf of the board, I would like to thank the team at LBT Innovations and our joint venture partner Hettich Holding Beteiligungs- und Verwaltungs-GmbH for their unrelenting contributions over the past year. I would also like to thank my fellow board members and our CEO, Brent Barnes.
I would also like to extend my appreciation to all of our shareholders for their continued support of LBT. We were especially pleased with the support of the existing shareholders - plus new investors - when we raised $7.9 million early this year. This funding runway allows us to plan and execute on our sales strategies for APAS Independence.
We are confident APAS Independence will dramatically improve the way clinical microbiology laboratories process specimens.
As the company looks to establish a global footprint, we are realistic enough to understand that new technology takes time. Still, I look forward to seeing more laboratories being positively impacted by our instrument as we continue our early global commercialisation efforts.
Sincerely,
Catherine CostelloChairman
5
For
per
sona
l use
onl
y

DirectorsThe names of the directors in office at any time during or since the end of the year are:
Catherine Mary Costello (Commenced chair position 1 August 2017) Chairman (Formerly non-executive director)
Robert Andrew Finder (Retired 31 July 2017) Chairman
Brenton BarnesChief Executive Officer and Managing Director
Stephen Paul MathwinNon-Executive Director
Caroline PopperNon-Executive Director
Dr Glenn Haifer (Commenced 1 September 2017) Non-Executive Director
Matthew Michalewicz (Commenced 1 September 2017) Non-Executive Director
Directors have been in office since the start of the financial year to the date of this report, unless otherwise stated.
Company Secretary(Retired as Chief Financial Officer on 24 August 2017, remains Company Secretary)
The following person held the position of Company Secretary at the end of the financial year:
Daniel HillQualificationsBachelor of Accountancy, Chartered Accountant, MBA, Master of Applied Finance, Certificate in Governance Practice.
ExperienceDaniel is an experienced chartered accountant of more than 20 years and has worked in various roles including public practice, finance and private equity. He is a non-executive director and/or company secretary of various private companies and is the company secretary of Southern Gold Ltd, an ASX listed company.
Principal ActivitiesThe principal activities of the Company during the financial year were those of researching and further developing innovative technologies for the healthcare and laboratory supply markets.
There were no significant changes in the nature of the Company’s principal activities during the financial year.
Operating ResultsLBT recorded an after-tax and comprehensive income loss for the year of $2,682,969 (2017: $5,213,400 loss).
Dividends Paid or RecommendedNo dividends were paid, nor recommended to be paid for the year ended 30 June 2018.
Annual Report 2018
6
Director’s ReportYour directors present their report on the Company for the year ended 30 June 2018.
For
per
sona
l use
onl
y

Review of OperationsWhile transformative for LBT Innovations in many respects, the 2017-2018 year boiled down to one key achievement for the company: commercialising our automated agar plate reading instrument APAS Independence after two years of engineering development.
With the first commercial sale achieved last month, our technology is now a validated medical device with a clear path to market and delivering revenues.
“With the first commercial sale achieved last month, our technology is now a validated medical device with a clear path to market and delivering revenues.”
Now LBT’s focus shifts from product development to expanding our ‘centre of excellence’ reference sites, establishing a global footprint and creating distribution channels to continue commercial sales in larger markets.
For LBT’s patient shareholders, the company will return to being a revenue generating business as its global commercialisation plans unfold over the next 15 to 18 months.
St Vincent's Melbourne on Channel 7 News.
Director’s Report
7
For
per
sona
l use
onl
y

Review of OperationsAPAS Independence also results in faster diagnosis of a number of infectious diseases.
In November 2017 LBT successfully completed an independent evaluation of APAS Independence at St Vincent’s Hospital in Melbourne – the first installation globally for the instrument.
The six-week St Vincent’s placement marked the first time LBT was able to measure the instrument’s performance within a diagnostic pathology laboratory.
The results from the trial were overwhelmingly positive and were presented at the European Congress of Clinical Microbiology & Infectious Diseases conference (ECCMID) in April 2018. This presentation was an important milestone for the team and resulted in significant interest from other laboratories globally.
St Vincent’s bought an APAS Independence instrument in August 2018, marking our first commercial sale. This achievement was the culmination of extensive work with the customer, as well as building our sales and technical support capabilities.
LBT continues to place instruments at other sites in Australia and abroad for assessment and evaluation. Placements are important for LBT as they increase awareness and their results provide evidence of customer validation and integration into the laboratory workflow. These placements are the key to us building our sales pipeline and scaling the business as promised.
“In October 2016 the US Food & Drug Administration approved APAS Compact, the manual loading instrument used to conduct a 10,000 patient clinic trial.”
Since then our focus has been on developing APAS Independence, which uses advanced artificial intelligence (AI) to handle, read and interpret up to 200 plates per hour.
Transforming LBT into a commercial ready businessLBT Innovations has been developing its core technology, Automated Plate Assessment System (APAS) for a number of years. In October 2016 the US Food & Drug Administration approved APAS Compact, the manual loading instrument used to conduct a 10,000 patient clinic trial.
The team at ECCMID Madrid 2018.
Annual Report 2018
8
For
per
sona
l use
onl
y

Expanding our geographical reachIn April 2018 the company announced joint venture company Clever Culture Systems AG (CCS) had shipped an APAS Independence instrument to Labor Dr Wisplinghoff in Cologne, Germany. The largest clinical laboratory in Germany and one of the biggest laboratories in Europe, Labour Dr Wisplinghoff forms LBT’s first European centre of excellence and is a development partner.
LBT also presented at key conferences in the US during the year, which was highly beneficial in maintaining relationships with distributors and potential customers. In the US, the APAS technology is the first and only instrument cleared by the Food & Drug Administration to use artificial technology in clinical microbiology.
Given this advantage, LBT has set expansion into the US market as a key objective for the 2018-2019 year.
Greater focus with technologyOver the past year, LBT has channelled its energy and financial resources into developing and delivering APAS Independence, while also commencing early sales activities.
Through the use of its current infrastructure, LBT is progressing development to extend the clinical application of the instrument. Specifically, the company is looking to add analysis modules that can be used to assess agar plates with MRSA (an antibiotic resistant bacterium), infection control, sputum and faeces. These are all extensions of LBT’s urine analysis module cleared by the FDA.
By adding more functions, the APAS Independence technology becomes more versatile. As a result, it will become economically feasible for more users and we will increase our addressable market. This effort will continue to be a key technology focus for LBT over coming years.
MicroStreak® and WoundVue®
In October 2017 we signed an agreement with China-based Autobio Diagnostic Co to place $2m of LBT shares in exchange for the MicroStreak intellectual property.
LBT’s foundation technology, MicroStreak was invented in 2004 and was successfully commercialised over subsequent years. We are pleased with the sale of MicroStreak to Autobio as it creates a new strategic partner for the Company.
As part of a strategic review completed in June 2018 the company decided to put the development of WoundVue on hold, to enable a sharper focus on commercialising APAS Independence.
As a result, we did not proceed with the available Cooperative Research Centre Projects funding that was available to us. We plan to evaluate partners to take our WoundVue asset forward.
This collaboration aims to extend the current menu of microbiology applications to which APAS can be applied and to investigate innovative ways to streamline workflows through the use of APAS technology.
The European expansion was important for the company as it was the first time the instrument had been used operationally in the northern hemisphere. Partnerships such as our tie-up with Labor Dr Wisplinghoff are key to broadening the distribution reach of CCS and APAS Independence.
Brent Barnes presenting at Australia Biotech Invest 2017 in Melbourne.
Director’s Report
9
For
per
sona
l use
onl
y

Review of OperationsLeadership teamIn July 2017, Bob Finder stepped down from his long-standing position of chairman after a decade of leadership. In line with our succession planning, Catherine (Kate) Costello, an existing board member since 2005 was subsequently appointed chairman.
Further to our Board rejuvenation process, in September 2017 Dr. Glenn Haifer and Mathew Michalewicz were also appointed to the board as non-executive directors. Together they bring strong commercial and AI expertise - key skills for us as we progress our technology.
In August 2017, Ray Ridge was appointed as LBT’s new CFO. Ray has held senior management positions in finance, compliance and commerce across a range of industries and had been a consultant to LBT since December 2016.
Prudent capital management for long‑term success
As of June 30 2018, LBT’s cash balance stood at $7.6m.
During the year, LBT completed a $7.9m private placement to support the development of APAS
Independence.
In February 2018, we secured $4m of funding from the South Australian Government. This funding can be drawn down through a low interest loan facility, with interest only accruing after the first drawdown. This loan recognises the innovative work being undertaken by LBT and our commitment to building the state’s internal technology and commercial capabilities.
In short, the 2017-18 year has been a seminal one for LBT. Through engagement with clinicians at key evaluation sites like St Vincent’s and Labor Dr Wisplinghoff, we have confidence the APAS Independence instrument is now a validated marketable product.
Strategically the company has added eight new roles in areas including AI, software engineering and science. Now that the company has proven AI technology with a clear development pipeline of new analysis modules, it will be able to develop these functions more cheaply by using internal resources rather than external consultants.
“In short, the 2017‑18 year has been a seminal one for LBT. Through engagement with clinicians at key evaluation sites like St Vincent’s and Labor Dr Wisplinghoff, we have confidence the APAS Independence instrument is now a validated marketable product.”
Peter Bradley and Brent Barnes accept silver award at the prestigious Medical Design Excellence Awards.
Annual Report 2018
10
For
per
sona
l use
onl
y

Financial OverviewThe loss of the Company after tax and comprehensive income was ($2.68) million comprising a loss before tax of ($4.30) million less a tax benefit of $1.62 million.
The loss before tax of ($4.30) million is comprised of:
• ($1.03) million for LBT’s 50% share of the loss of its joint venture company, Clever Culture Systems AG (CCS).
• ($0.93) million being expenses of ($5.68) million incurred in finalising the engineering design and development of the APAS instrument. $4.75 million of these expenses were reimbursed by CCS. The reimbursement is accounted for as revenue.
• ($1.49) million for employee benefit expenses and consulting costs of ($2.44) million, partly offset by $0.95 million consulting income paid by CCS to LBT for services provided by LBT employees to CCS. The reimbursement is accounted for as revenue.
• ($1.10) million other expenses including general administration, marketing and legal expenses.
• $0.25 million other income, largely interest income.
LBT received an R&D tax concession refund of $4.33 million following completion of the 2017 tax return. The Company expects to lodge a claim for the 2018 financial year of approximately $1.66 million.
Financial PositionNet assets of the Company increased by $7.7 million from $21.4 million at 30 June 2017 to $29.1 million at 30 June 2018.
Cash on hand and at the bank increased to $7.57 million at 30 June 2018 ($3.50 million at 30 June 2017).
Significant Changes in State of Affairs There have been no significant changes in the state of affairs of the Company during the year.
After Balance Date EventsThe first commercial sale of the APAS Independence to St Vincent’s Hospital in Melbourne announced on 22 August 2018.
The execution of the $4 million loan facility provided by the South Australian Government announced on 28 August 2018.
About LBT InnovationsLBT Innovations (LBT) improves patient outcomes by making healthcare more efficient. Based in Adelaide, South Australia, the Company has a history of developing world leading products in microbiology automation. Its first product, MicroStreak, was a global first in the automation of the culture plate streaking process. The Company’s second product, the Automated Plate Assessment System (APAS) is being commercialised through LBT’s 50% owned joint venture company Clever Culture Systems AG (CCS) with Hettich Holding Beteiligungs- und Verwaltungs-GmbH. The APAS instrument is based upon LBT’s intelligent imaging and machine learning software, and remains the only US FDA-cleared artificial intelligence technology for automated imaging, analysis and interpretation of culture plates following incubation.
Environmental IssuesThe Company’s operations are not subject to significant environmental regulation under the laws of the Commonwealth and State.
Director’s Report
11
For
per
sona
l use
onl
y

Information on Directors
Interest in Shares 1,290,272 Ordinary shares
Interest in Options 161,290 Options expiring 9 December 2018
Third Party Holdings
- Costello Consulting Pty Ltd as director 1,393,004 Ordinary Shares
- HSBC Custody Nominees (Australia) Limited 666,667 Ordinary Shares
Directorships held in other listed entities Nil
Interest in Contracts Nil
The information provided above is current as at 18 September 2018.
Catherine Mary Costello
Qualifications Law Degree (University of Melbourne).
ExperienceKate Costello is qualified in law and an expert in corporate governance, board performance and strategy.
Kate is a professional, non-executive director having sold her consultancy, Governance Matters, in 2017.
Kate’s board experience includes directorships in Integrated Research Ltd, Saab Systems, the South Australian TAB, Australian Central Credit Union Ltd and Festival City Broadcasters Ltd. She chaired Saab Intelligent Transport Systems and Bassett Consulting Engineers.
Kate was also a committee member for the independent review of the governance of soccer in Australia as well as a member of the University of Adelaide’s Independent Selection Committee. She is currently a fellow of the Institute of Company Directors.
Annual Report 2018
12
For
per
sona
l use
onl
y

Robert Andrew Finder
Interest in Shares 807,692 Ordinary shares
Interest in Options 161,290 Options expiring 9 December 2018
Third Party Holdings
- Sheryl Jean Finder 416,603 Ordinary shares
- The Sherrob9 Fund 5,401,665 Ordinary shares
Directorships held in other listed entities Nil
Interest in Contracts Nil
The information provided above is current as at the time of resignation on 31 July 2017.
QualificationsBachelor of Science Chemical Engineering (University of Detroit).
ExperienceBob has more than 35 years’ experience in the international pharmaceutical and chemical industries and has retired as Chief Executive Officer of Novozymes GroPep Limited, the Australian subsidiary of Novozymes, a global biotechnology company. Bob was Managing Director and Chief Executive Officer of GroPep from 2002-06 (before the Novozymes acquisition).
Prior to joining GroPep in 2002, Bob was President and Chief Operating Officer of Mayne Pharma – Americas and Asia Pacific.
In this role, Bob was responsible for the commercial activities for the Americas and Asia Pacific region as well as for global research and development for Mayne Pharma. Mayne Pharma evolved from Mayne’s acquisition of F H Faulding, where Bob was President and Chief Operating Officer of Faulding Pharmaceuticals – Asia Pacific.
Prior to Faulding, Bob’s roles included Vice President Manufacturing for Ecogen Inc, in Pennsylvania, Director Manufacturing for Rhone-Poulenc (USA), and Managing Director of Monsanto Chemicals in Thailand. He is a Member of the Australian Institute of Company Directors and the American Institute of Chemical Engineers.
Bob was a former member on the board of directors of National Pharmacies (retired April 2017), a former Chairman of Reproductive Health Science Pty Ltd and retired as LBT Innovations Ltd’s Chairman on 31 July 2018.
Director’s Report
13
For
per
sona
l use
onl
y

Information on Directors
Interest in Shares Nil
Interest in Options 1,500,000 ESOP options expiring 7 August 2026
Third Party Holdings
- Barnes’ Love Work Live 713,606 Ordinary shares
- Barnes’ Love Work Live 161,290 Options expiring 9 December 2018
Directorships held in other listed entities Nil
Interest in Contracts Nil
The information provided above is current as at 18 September 2018.
QualificationsMaster of Project Management (University of Adelaide), Diploma of Commerce (Sydney Institute of Business and Technology), Graduate, Australian Institute of Company Directors (Australian Institute of Company Directors).
ExperienceAfter beginning his career with global defence contractor Thales, Brent spent 11 years as a Senior Executive in a variety of roles with the global leader in implantable hearing devices Cochlear Limited (ASX:COH). Having lead an important transformation project from within Cochlear’s Global Quality & Regulatory Group, Brent relocated to the United States working for Cochlear Americas where he held senior operations and sales roles based in Colorado and Texas.
During this time he established a US Manufacturing subsidiary from ground up, where product was manufactured and business audited by the FDA with no observations. After four years in the US, Brent returned to Australasia as Director, Asia Growth Markets and Operations for Asia Pacific, based out of the Singapore office. Holding this role for five years before joining LBT, Brent grew the Implantable hearing market across 12 countries in Asia.
Brent is also a non-executive Director of Connek Pty Ltd, a telecommunications company that subcontracts specialist services to leading blue chip telecommunication companies working on the national rollout of Australia’s National Broadband Network.
In his spare time, Brent enjoys all sports and tries to keep fit. He’s a keen Aussie Rules follower, and a Life Member of Sydney’s North Shore Bombers AFC and during his US posting, he played Australian Rules football for the Denver Bulldogs.
Brenton BarnesChief Executive Officer and Managing Director
Annual Report 2018
14
For
per
sona
l use
onl
y

Stephen Paul Mathwin
Interest in Shares 519,230 Ordinary Shares
Interest in Options 64,516 Options expiring 9 December 2018
Third Party Holdings
- Ruin Pty Ltd as trustee for the Steve Mathwin Superannuation Fund 2,848,262 Ordinary Shares
Directorships held in other listed entities Nil
Interest in Contracts Nil
The information provided above is current as at 18 September 2018.
QualificationsLaw Degree (University of Adelaide).
ExperienceStephen has more than 30 years’ experience as a legal practitioner including being a partner with the Adelaide law firm, Kelly & Co, from 1988 to 2001. During that time he headed the firm’s Employment, Industrial Law and Superannuation Section. He was also responsible for managing much of Kelly & Co’s internal risk management functions. Stephen remains a Consultant to its successor firm HWL Ebsworth.
Stephen is Chairman of Australian Timbers Ltd, Cavitus Pty Ltd, Poly Products Co Pty Ltd and former chairman of Viking Rentals Pty Ltd.
He is a director of the McArthur Management Group of Companies. Stephen is a former Deputy Chairman and Chairman of the Investment Committee of Non-Government Schools (NGS) Superannuation Fund, an industry fund with funds under management exceeding $6 billion.
During his time at NGS, the fund grew from $1.6 billion to more than $5 billion. Stephen is also a former Chairman of the School Council of Westminster School Incorporated and is Chairman of the Investment Committee for the Westminster School Foundation.
Director’s Report
15
For
per
sona
l use
onl
y

Information on Directors
Caroline Popper
Interest in Shares 300,000
Interest in Options Nil
Directorships held in other listed entities Nil
Past directorships held in other listed entities Tyrian Diagnostics Ltd (ASX:TDX) 2009 to February 2016
Interest in Contracts Nil
The information provided above is current as at 18 September 2018.
QualificationsBachelor of Medicine (University of the Witwatersrand, Johannesburg), Master of Public Health – Health Policy and Health Economics ( Johns Hopkins University, Baltimore).
ExperienceCaroline is a USA-based pathologist and business consultant, with more than 25 years’ operational experience in the international diagnostics, medical devices and digital health fields.
A qualified health economist, Caroline has served in senior managerial and advisory positions at a number of global diagnostics and medical research companies, including Becton Dickinson, bioMérieux and MDS Proteomics.
Caroline established her own consultancy, Popper and Company, in 2003 to provide strategic corporate and advisory services to businesses across the life sciences spectrum. Popper and Company is a strategy and M&A advisory firm focused on diagnostics, medical devices, life science tools and digital health applications. The firm has deep expertise in evaluating the value created in healthcare by innovative products and services. This economic analysis is the basis of partnership and pricing strategies. Caroline’s other directorships include BioAgilytix and Diversigen.
Annual Report 2018
16
For
per
sona
l use
onl
y

Matthew Michalewicz Non-Executive Director
QualificationsBachelor of Science, Business Administration and Corporate Finance (University of North Carolina).
ExperienceMatthew Michalewicz has more than 20 years’ experience in starting and running high-growth tech companies, particularly in the areas of predictive analytics and optimisation software. He is currently the CEO of Complexica Pty Ltd, a provider of artificial intelligence software applications that help large organisations increase revenue, margin and customer engagement through automated analytics.
Matt has extensive experience as an international business executive specialising in start-ups, raising capital, technology commercialisation, sales and marketing strategy and execution, international expansion, corporate governance and mergers and acquisitions.
Prior to co-founding Complexica, he was the CEO of SolveIT Software Pty Ltd, a provider of artificial intelligence software for optimising complex supply chains.
He grew that company from zero to 180 employees during 2005-12 while building revenue in excess of A$20 million per annum. The company was also named the third fastest growing in Australia by Deloitte in 2012.
He is a director on three boards: ComOps Ltd (ASX:COM), Prophecy International Ltd (ASX:PRO) and Complexica, and has served on numerous other boards throughout his career.
Matt was also named 2002 Alumnus of the Year for outstanding business achievements by the University of North Carolina. He completed a Company Director’s Course (CDC) at the Australian Institute of Company Directors.
He has also been awarded numerous prestigious awards throughout his career including Pearcey Foundation Entrepreneur of the Year, Ernst & Young Entrepreneur of the Year finalist, Forty under 40 by the Charlotte Business Journal and Entrepreneur of the Year by the Charlotte Chamber of Commerce.
Interest in Shares 333,334
Interest in Options 500,000 Options expiring 30 November 2027
Directorships held in other listed entities ComOps Ltd (ASX:COM) March 2016 to Present Prophecy International Ltd (ASX:PRO) May 2014 to Present
Interest in Contracts Nil
The information provided above is current as at 18 September 2018.
Director’s Report
17
For
per
sona
l use
onl
y

Information on Directors
Glenn Haifer Non-Executive Director
QualificationsMaster of Business Administration—Australian Graduate School of Management (University of NSW). Bachelor of Medicine and Bachelor of Surgery (University of Witwatersrand, Johannesburg).
ExperienceGlenn Haifer has over 30 years’ experience in the healthcare sector. He has successfully established four different businesses operating in primary medical services, histopathology and cosmetic medical services, which he has exited through sales to private equity firms and to an ASX listed company.
Glenn is an experienced company director. His current directorships include Sun Doctors, a health care organisation that employs 250 staff and contracting doctors and offers special interest medical services, and access to one of the largest private histopathology laboratories in Australia.
He is a non-executive Director of Aurora Expeditions, an expedition company and travel agency that operates in remote areas of the world including the polar regions. He was also previously a Non-Executive Director of BDS Vircon, a multinational engineering services business employing over 300 staff, which was sold to a US listed public company in October 2016.
In addition to his 20 years’ experience in general management of health care service delivery Glenn is a Medical Consultant to Apotex Pharmaceuticals and was formally the Australasian Medical Consultant to P&O/Princess Cruises.
Glenn is a registered Australian Specialist Medical Practitioner, and a fellow of the College of Rural and Remote Medicine. He is a member of the Australian Institute of Company Directors, and was previously a member of the American Stock Exchange in New York.
Interest in Shares Nil
Interest in Options Nil
Third Party Holdings
- Jed Asset Co Pty Ltd <Jed Asset A/c> 1,666,667 Ordinary shares
- Allegra Ventures Pty Ltd <Gee Super Fund A/c> 500,000 Options expiring 30 November 2027
Directorships held in other listed entities Nil
Interest in Contracts Nil
The information provided above is current as at 18 September 2018.
Annual Report 2018
18
For
per
sona
l use
onl
y

Remuneration Report This report details the nature and amount of remuneration of each key management person of LBT Innovations and for the executives receiving the highest remuneration.
Remuneration PolicyThe Remuneration Policy of LBT Innovations has been designed to align key management personnel objectives with shareholder and business objectives by providing a fixed remuneration component and offering specific long-term incentives based on key performance areas affecting the Company’s financial results.
The key objectives of the Nominations and Remuneration Committee are to appropriately and effectively attract and retain the best executives and directors to run and manage the Company, as well as to create goals congruent between directors, executives and shareholders.
The Remuneration Policy, setting the terms and conditions for non-executive and executive directors and other senior executives, was developed by the Nominations and Remuneration Committee and approved by the Board.
2018 2017 2016 2015 2014
Revenue $5.96m $5.92m $7.73m $2.37m $3.99m
Net Profit/(Loss) ($2.69m) ($5.13m) $3.58m $0.32m $0.29m
Basic Earnings per share (cents per share) (1.70) (4.02) 3.08 0.28 0.29
Diluted Earnings per share (cents per share) (1.70) (4.02) 3.08 0.28 0.29
Full year ordinary dividends per share (cents) Nil Nil Nil Nil Nil
Year-end share price $0.115 $0.25 $0.145 $0.06 $0.14
The LBT Innovations Board policy for determining the nature and amount of remuneration for board members and senior Company executives follows.
The Remuneration Policy has been tailored to increase goal congruence between shareholders and directors and executives with:
• performance bonuses based on key performance indicators (KPIs), and
• issue of options to the directors and executives to encourage the alignment of personal and shareholder interests.
The fixed remuneration component is determined with regard to market conditions, so that the Company can recruit and retain the best available talent. The Board’s policy regarding incentives includes granting options with an exercise price at a premium to the underlying market value of shares at the time of grant, and vesting subject to the achievement of KPIs. This policy aligns the interests of option holders with those of shareholders and creates a direct relationship between individual remuneration outcomes and Company performance. Option holders will only benefit in circumstances where relevant KPI milestones are met and there is a material increase in the underlying share price from the time of grant of the options.
The relationship between the Board’s policy and the Company’s performance in terms of earnings and shareholder wealth is illustrated by the following table that shows the gross revenue, profits/(losses), earnings per share and closing share prices on 30 June for the past five years. During the financial year, the Company’s share price traded between a low of $0.092 and a high of $0.37.
Director’s Report
19
For
per
sona
l use
onl
y

Remuneration ReportExecutive Terms & ConditionsAll executives receive a base salary, based upon performance, professional qualifications and experience, and superannuation, fringe benefits, options and performance incentives.
The Nominations and Remuneration Committee reviews executive packages annually with reference to the Company’s performance, executive performance, and comparable information from industry sectors and other listed companies in similar industries.
Performance MeasurementThe performance of executives is measured against criteria agreed annually with each executive and is based upon the achievement of the strategic objectives to secure the Company’s future profits and shareholder value.
All bonuses and incentives must be linked to predetermined performance criteria. The Board may, however, exercise its discretion in relation to approving incentives, bonuses and options, and can decide changes to the Nominations and Remuneration Committee’s recommendations.
Any change must be justified by reference to measurable performance criteria. The policy is designed to attract the highest calibre of executives and reward them for performance that results in long-term growth in shareholder wealth.
Executives are also entitled to participate in the employee share and option arrangements.
As part of executives’ remuneration packages there is a performance-based component consisting of key performance indicators. The intention of this program is to facilitate goal congruence between executives of the business and shareholders.
Key Performance Indicators (KPIs):• are set annually by the Board on
recommendation from the Nominations and Remuneration Committee. The measures are specifically tailored to the responsibility areas in which the executive is directly involved;
• target areas the Board believes hold greater potential for business expansion and profit;
• cover financial and non-financial as well as short and long-term goals;
• the level set for each KPI is based on budgeted figures for the Company and respective industry standards.
Performance in relation to KPIs is assessed annually, with minor quarterly reviews and bonuses being awarded depending on the number and difficulty of the KPIs achieved.
Following this assessment, KPIs are reviewed by the Nominations and Remuneration Committee in light of their desired and actual outcomes. The efficacy of the KPIs is assessed in relation to the Company’s goals and shareholder wealth, before the KPIs are set for the following year. Where advisable, independent reports are obtained from external organisations. KPIs for the CEO are set in Key Result Areas of Finance, Corporate Strategy, Investor Relations and Human Resources, with an emphasis on achieving the Company’s financial goals. Any bonus payment is negotiated in line with achievement of KPIs and is weighted towards financial outcomes.
SuperannuationExecutive directors and executives receive a superannuation guarantee contribution required by the government, which was 9.5% in the 2017/18 financial year, they do not receive any other retirement benefits. Individuals may choose to sacrifice part of their salary to increase payments towards superannuation.
Non‑Executive DirectorsThe Board’s policy is to remunerate non-executive directors at market rates for comparable companies for time, commitment and responsibilities. The Nominations and Remuneration Committee determines payments to non-executive directors and reviews their remuneration annually, based on market practice, duties and accountability. Independent external advice is sought when required.
The maximum aggregate amount of fees that can be paid to non-executive directors is subject to approval by shareholders at the Annual General Meeting.
Fees for non-executive directors are not linked to the performance of the Company. To align directors’ interests with shareholder interests, the directors are encouraged to hold shares in the Company and are able to participate in the Employee Share Option Plan.
Shares & OptionsShares provided to directors and executives are valued at their fair value on the date granted based on market prices. Options granted to directors and executives are valued at their fair value using the Binomial option-pricing model.
Annual Report 2018
20
For
per
sona
l use
onl
y

Key Management Personnel Remuneration
2018Cash Salary,
Fees & Commissions
Long Service
Leave
Cash Bonus
Superannuation Contributions
Non-Cash Benefits Shares Options Total
$000 $000 $000 $000 $000 $000 $000 $000
Mr B Barnes(1) 281 0 131 25 0 0 337 774
Mrs C M Costello 58 0 0 23 0 0 0 81
Mr S P Mathwin 34 0 0 22 0 0 0 56
Dr C Popper 45 0 0 0 0 0 0 45
Mr G Haifer(2) 37 0 0 4 0 0 37 78
Mr M Michalewicz(3) 35 0 0 3 0 0 37 75
Mr R A Finder(4) 6 0 0 1 0 0 0 7
Mr P M Bradley 209 0 0 19 0 0 0 228
Mr D Hill 26 0 0 0 0 0 0 26
Mr R Ridge(5) 133 0 0 0 0 0 0 133
864 0 131 97 0 0 411 1,503
2017Cash Salary,
Fees & Commissions
Long Service
Leave
Cash Bonus
Superannuation Contributions
Non-Cash Benefits Shares Options Total
$000 $000 $000 $000 $000 $000 $000 $000
Mr B Barnes(1) 237 0 0 22 11 0 301 571
Mrs L H Guthrie 57 68 61 35 0 0 0 221
Mrs C M Costello 52 0 0 5 0 0 0 57
Mr S P Mathwin 23 0 0 32 0 0 0 55
Dr C Popper 46 0 0 0 0 0 0 46
Mr R A Finder 77 0 0 7 0 0 0 84
Mr P M Bradley 204 0 0 20 0 0 0 224
Mr D Hill 66 0 0 0 0 0 0 66
789 68 61 94 11 0 301 1,324
(1) Mr Barnes bonus for 2016-17 year was approved by the Board after completion of the 2017 Annual Report and was recognised as an expense in the 2017-2018 year. While the bonus 2017-18 year was approved by the Board prior to completion of the 2018 Annual Report and was accrued as an expense in the 2017-18 year. Therefore, the 2017-18 year includes the bonuses relating to two years. Mr Barnes received 1,500,000 options on 18 November 2016, following shareholder approval. The terms of the options were finalised with Mr Barnes on 5 May 2016 upon his acceptance of the letter of offer of employment as CEO and Managing Director. The option exercise price of $0.157 was based upon the volume weighted average share price for the five trading days prior to the 5 May 2017. However, in accordance with AASB2 “Share Based Payments”, the fair value of the options was calculated on the date shareholders approved the grant of the options (16 November 2016). In that intervening period between when the option pricing was agreed in May and the date of shareholder approval in September, LBT’s share price had increased to $0.485 which significantly inflated the option valuation. The option value is being expensed over the two year vesting period from commencement of employment on 8 August 2016.
(2) Mr Haifer received 500,000 options on 1 December 2017, following shareholder approval. The option exercise price of $0.30 was based upon the volume weighted average share price for the five trading days prior to the 1 September 2017. The option value is being expensed over the two year vesting period from commencement of employment on 1 September 2017. Mr Haifer commenced as a non-executive director on 1 September 2017.
(3) Mr Michalewicz received 500,000 options on 1 December 2017, following shareholder approval. The option exercise price of $0.30 was based upon the volume weighted average share price for the five trading days prior to the 1 September 2017. The option value is being expensed over the two year vesting period from commencement of employment on 1 September 2017. Mr Michalewicz commenced as a non-executive director on 1 September 2017.
(4) Mr R Finder retired on 31 July 2018.
(5) Mr Ridge commenced as CFO on 25 August 2017.
Director’s Report
21
For
per
sona
l use
onl
y

Meetings of DirectorsDuring the financial year to 30 June 2018, eleven meetings of directors were held. Attendances by each director during the reporting period were:
Number Eligible to Attend Number Attended
Mr B Barnes 11 11
Mrs C M Costello 11 10
Mr S P Mathwin 11 9
Dr C Popper 11 10
Mr G Haifer (1) 9 9
Mr M Michalewicz (2) 9 8
Mr R A Finder(3) 1 1
During the financial year to 30 June 2018, three meetings of the Audit Committee were held. Attendances by each member during the reporting period were:
Number Eligible to Attend Number Attended
Mr S P Mathwin 3 3
Mr G Haifer 2 2
Mr M Michalewicz 2 2
Mrs C M Costello 1 1
During the financial year to 30 June 2018, two meetings of the Nominations and Remuneration Committee was held. Attendances by each member during the reporting period were:
Number Eligible to Attend Number Attended
Mrs C M Costello 2 2
Mr R A Finder 1 1
Dr C Popper 2 2
Mr S P Mathwin 1 1
Indemnifying Officers or AuditorThe Company has paid a premium to insure each of the following directors against liabilities for costs and expenses incurred by them in defending any legal proceedings arising out of their conduct, while acting in the capacity of director of the Company, other than conduct involving a wilful breach of duty in relation to the Company. The amount of premium has not been disclosed as it is confidential under the terms of the insurance policy.
• Mr B Barnes
• Mrs C M Costello
• Mr S P Mathwin
• Dr C Popper
• Mr G Haifer(1)
• Mr M Michalewicz(2)
• Mr R A Finder(3)
(1) Mr Haifer commenced on 1 September 2017.
(2) Mr Michalewicz commenced on 1 September 2017.
(3) Mr Finder retired on 31 July 2017.
Annual Report 2018
22
For
per
sona
l use
onl
y

Option DetailsAt the date of this report, the unissued ordinary shares of LBT Innovations under option are as follows:
Class Date of Expiry Exercise Price Number of Options No of Shares due on Conversion
n/a 30/11/2018 $0.440 3,225,806 3,225,806
n/a 09/12/2018 $0.4425 11,292,505 11,292,505
n/a 24/8/2020 $0.065 200,000 200,000
n/a 11/12/2023 $0.045 100,000 100,000
n/a 11/04/2026 $0.141 500,000 500,000
n/a 07/08/2026 $0.157 1,500,000 1,500,000
n/a 22/12/2026 $0.320 100,000 100,000
n/a 28/02/2027 $0.400 200,000 200,000
n/a 30/11/2027 $0.300 1,000,000 1,000,000
18,118,311 18,118,311
No person entitled to exercise an option had or has any right by virtue of the option to participate in any share issue of any other body corporate.
Proceedings on behalf of the CompanyNo person has applied for leave of Court to bring proceedings on behalf of the Company or intervene in any proceeding to which the Company is a party for the purpose of taking responsibility on behalf of the Company for all or any part of those proceedings.
The Company was not a party to any proceedings during the reporting period.
Non‑audit ServicesThe Board of directors are satisfied that the provision of non-audit services during the year is compatible with the general standard of independence for auditors imposed by the Corporations Act 2001. The directors are satisfied that the services disclosed below did not compromise the external auditor’s independence for the following reasons:
• all non-audit services are reviewed and approved by the Board prior to commencement to ensure they do not adversely affect the integrity and objectivity of the auditor; and
• the nature of the services provided does not compromise the general principles relating to auditor independence as set out in the Institute of Chartered Accountants in Australia and CPA Australia’s Professional Statement APES 110: Professional Independence.
The following fees for non-audit services were paid/payable to the external auditors during the year ended 30 June 2018: Nil.
Auditor Independence DeclarationThe auditor’s independence declaration for the year ended 30 June 2018 has been received and can be found on page 24.
Rounding of AmountsThe Company is an entity to which ASIC Class Order 98/100 applies and, accordingly, amounts in the financial statements have been rounded to the nearest thousand dollars.
Signed in accordance with a resolution of the Board of directors.
Catherine Costello Brent BarnesChairman Chief Executive Officer
Dated at Adelaide this 27th day of September 2018.
Director’s Report
23
For
per
sona
l use
onl
y

Auditors’ Independence Declaration
AUDITOR’S INDEPENDENCE DECLARATION
As lead auditor for the audit of the financial report of LBT Innovations Limited for the year ended 30 June 2018, I declare that, to the best of my knowledge and belief, there have been no contraventions of: (a) the auditor independence requirements as set out in the Corporations Act 2001 in relation to
the audit; and (b) any applicable code of professional conduct in relation to the audit. HLB Mann Judd Audit (SA) Pty Ltd Jon Colquhoun Chartered Accountants Director Adelaide, South Australia 27 September 2018
Annual Report 2018
24
For
per
sona
l use
onl
y

Note 2018 2017 $000 $000
Revenue 2, 3d 5,958 5,923
Share of profit/(loss) of associates & joint ventures accounted for using the equity method (1,027) (143)
Consulting fees 3a (389) (246)
Employee benefits expense 3b (2,051) (1,290)
Depreciation and amortisation expense (53) (759)
Net Impairment expense 1c (0) (6,239)
General administration expenses (395) (209)
Legal (138) (13)
Marketing (32) (87)
Other expenses 3c (6,174) (6,689)
Profit/(Loss) before income tax (4,301) (9,752)
Income tax (expense)/benefit 4a 1,616 4,619
Net profit/(loss) for the year (2,685) (5,133)
Other comprehensive income/(loss) 2 (80)
Other comprehensive income/(loss) net of tax 2 (80)
Total comprehensive loss for the year (2,683) (5,213)
Basic earnings per share (cents per share) 15 (1.70) (4.02)
Diluted earnings per share (cents per share) 15 (1.70) (4.02)
The accompanying notes form part of the financial statements.
Statement of Comprehensive IncomeFor the Year Ended 30 June 2018
Director’s Report
25
For
per
sona
l use
onl
y

Note 2018 2017 $000 $000
Assets
Current Assets
Cash and cash equivalents 5 7,572 3,498
Trade and other receivables 6 251 2,365
Current tax asset 4 1,661 4,357
Total Current Assets 9,484 10,220
Non‑Current Assets
Plant and equipment 7 90 65
Investments accounted for using the equity method 8 151 1,176
Financial assets 9 7,745 2,920
Deferred tax assets 16 517 225
Intangible assets 10 18,122 15,864
Total Non‑Current Assets 26,625 20,250
Total Assets 36,109 30,470
Current Liabilities
Trade and other payables 11a 1,864 4,194
Total Current Liabilities 1,864 4,194
Non-Current Liabilities
Deferred tax liabilities 16 5,053 4,844
Provisions 11b 83 39
Total Non‑Current Liabilities 5,136 4,883
Total Liabilities 7,000 9,077
Net Assets 29,109 21,393
Equity
Issued capital 12 30,855 20,881
Reserve 13 1,038 611
Retained earnings (2,784) (99)
Total Equity 29,109 21,393
The accompanying notes form part of the financial statements.
Statement of Financial PositionAs at 30 June 2018
Annual Report 2018
26
For
per
sona
l use
onl
y

Option Reserve
$000
Foreign Currency
Translation Reserve
$000
Share Capital
$000
Accumulated (Losses)
/Retained Earnings
$000
Total
$000
Balance at 30 June 2016 812 192 13,152 5,034 19,190
Share placement 0 0 7,001 0 7,001
Options exercised (620) 0 1,066 0 446
Options granted as remuneration 307 0 0 0 307
Capital raising costs 0 0 (507) 0 (507)
Tax effect attributable to items in equity 0 0 169 0 169
Comprehensive income 0 (80) 0 0 (80)
Loss attributable to members 0 0 0 (5,133) (5,133)
Balance at 30 June 2017 499 112 20,881 (99) 21,393
Share placement 0 0 10,322 0 10,322
Share issue as compensation 0 0 115 0 115
Options granted as remuneration 425 0 0 0 425
Capital raising costs 0 0 (558) 0 (558)
Tax effect attributable to items in equity 0 0 95 0 95
Comprehensive income 0 2 0 0 2
Loss attributable to members 0 0 0 (2,685) (2,685)
Balance at 30 June 2018 924 114 30,855 (2,784) 29,109
The accompanying notes form part of the financial statements.
Statement of Changes in EquityFor the Year Ended 30 June 2018
Director’s Report
27
For
per
sona
l use
onl
y

Note 2018 2017 $000 $000
Cash Flows From Operating Activities
Reimbursement of expenses from JV Company 7,592 3,985
Government grants received 27 66
Payments to suppliers and employees (10,697) (5,968)
Research and development tax concession 4,325 1,160
Interest received 78 100
Net Cash Provided by/(Used in) Operating Activities 14 1,325 (657)
Cash Flows From Investing Activities
Research and development (intangible asset) (2,488) (4,627)
Payments for plant and equipment (68) (43)
Loan provided (4,451) (2,805)
Net Cash Used in Investing Activities (7,007) (7,475)
Cash Flows From Financing Activities
Cash proceeds from share placement 10,322 7,447
Capital raising costs (566) (498)
Net Cash Provided by Financing Activities 9,756 6,949
Net increase/(decrease) in cash and cash equivalents 4,074 (1,183)
Cash and cash equivalents at beginning of year 3,498 4,682
Exchange rate adjustments 0 (1)
Cash and Cash Equivalents at end of year 5 7,572 3,498
The accompanying notes form part of the financial statements.
Statement of Cash FlowsFor the Year Ended 30 June 2018
Annual Report 2018
28
For
per
sona
l use
onl
y

1. Statement of Significant Accounting PoliciesThe financial report is a general purpose financial report that has been prepared in accordance with Australian Accounting Standards, including Australian Accounting Interpretations, other authoritative pronouncements of the Australian Accounting Standards Board, and the Corporations Act 2001.
The financial report covers LBT Innovations Ltd, a public company incorporated and domiciled in Australia and its joint venture, a private Swiss company Clever Culture Systems AG (CCS), 50% owned by LBT Innovations Ltd.
The financial report of LBT Innovations Ltd complies with all International Financial Reporting Standards (IFRS) in their entirety.
The following is a summary of the material accounting policies adopted by the Company in the preparation of the financial report. The accounting policies have been consistently applied, unless otherwise stated.
Basis of PreparationThe accounting policies set out below have been consistently applied to all years presented.
Reporting Basis and ConventionsThe financial report has been prepared on an accruals basis and is based on historical costs modified by the revaluation of selected non-current assets, financial assets and financial liabilities for which the fair value basis of accounting has been applied.
Accounting Policies
a. Income TaxThe charge for current income tax expense is based on the profit for the year adjusted for any non-assessable or disallowed items. It is calculated using the tax rates that have been enacted or are substantially enacted by the balance sheet date.
Deferred tax is accounted for using the balance sheet liability method in respect of temporary differences arising between the tax bases of assets and liabilities and their carrying amounts in the financial statements. No deferred income tax will be recognised from the initial recognition of an asset or liability, where there is no effect on accounting or taxable profit or loss.
Deferred tax is calculated at the tax rates that are expected to apply to the period when the asset is realised or liability is settled. Deferred tax is credited in the income statement except where it relates to items that may be credited directly to equity, in which case the deferred tax is adjusted directly against equity.
Deferred income tax assets are recognised to the extent that it is probable that future tax profits will be available against which deductible temporary differences can be utilised. The amount of benefits brought to account or which may be realised in the future is based on the assumption that no adverse change will occur in income taxation legislation and the anticipation that the company will derive sufficient future assessable income to enable the benefit to be realised and comply with the conditions of deductibility imposed by the law.
Notes to the financial statementsFor the year ended 30 June 2018
Notes to the Financial Statements
29
For
per
sona
l use
onl
y

1. Statement of Significant Accounting Policies cont.
b. Plant and EquipmentPlant and equipment is measured on the cost basis less, where applicable, any accumulated depreciation and impairment losses.
The carrying amount of plant and equipment is reviewed annually by the directors to ensure it is not in excess of the recoverable amount from these assets. The recoverable amount is assessed on the basis of the expected net cash flows that will be received from the asset’s employment and subsequent disposal. The expected net cash flows have been discounted to their present values in determining recoverable amounts.
All repairs and maintenance are charged to the statement of comprehensive income during the financial period in which they are incurred.
DepreciationThe depreciable amount of all plant and equipment is depreciated on a straight-line basis over its useful life to the Company, commencing from the time the asset is held ready for use.
The depreciation rates used for each class of depreciable assets are:
Class of Fixed Asset Depreciation Rate Plant and Equipment 5–33%
The assets’ residual values and useful lives are reviewed, and adjusted if appropriate, at each balance sheet date.
Any asset’s carrying amount is written down immediately to its recoverable amount if the asset’s carrying amount is greater than its estimated recoverable amount.
Gains and losses on disposals are determined by comparing proceeds with the carrying amount. These gains and losses are included in the statement of comprehensive income.
c. Intangibles
APAS Development CostsCapitalised APAS development costs include software development, consulting and some internal salaries incurred from December 2013.
Development costs are capitalised only when technical feasibility studies identify that the project will deliver future economic benefits and these benefits can be measured reliably.
At present there is no amortisation of capitalised APAS development costs with the exception of IT licences purchased on an annual basis. APAS will commence amortisation when the technology is ready for use, which is established by the execution of the Declaration of Conformity until which time the technology cannot be sold for clinical use. APAS commercialisation will be managed through the 50:50 JV company, CCS, established through a JV agreement signed in 2013 with Hettich Holding Beteiligungs- und Verwaltungs-GmbH. A total of $6 million in sign on fees and milestone payments have been paid by CCS to LBT pursuant to the JV agreement. This income has previously been recognised as revenue by LBT.
Licence Fees and Option FeesLicence fees and option fees are valued in the accounts at cost of acquisition and are amortised over the period in which their benefits are expected to be realised.
Research ExpenditureExpenditure during the research phase of a project is recognised as an expense when incurred.
PatentsPatents are recognised at cost of acquisition. Patents have a finite life and are carried at cost less any accumulated amortisation and any impairment losses. Patent costs are amortised over their useful life ranging from 15 to 20 years.
Annual Report 2018
30
For
per
sona
l use
onl
y

1. Statement of Significant Accounting Policies cont.
c. Intangibles cont.
MicroStreak Development CostsFollowing a review of potential options to recognise value from the sale or licence of the MicroStreak Patents, the Directors made a decision to write down the carrying amount of the MicroStreak intangible assets as at 30 June 2017, from $7.86 million to nil. The remaining unearned income, relating to the commercial ready grant, of $1.62 million as at 30 June 2017, was also reduced to nil. As the decision to fully recognise all unearned income is directly related to the decision to impair the intangible assets associated with MicroStreak, the two transactions were offset and presented in the Statement of Comprehensive Income, for the year ended 30 June 2017, as a net impairment expense of $6.24 million. The tax effect associated with the net impairment was a tax benefit of $1.72 million. The impact on the Company’s after tax net loss for the year ended 30 June 2017 was $4.52 million (refer to note 10).
Prior to the write down at 30 June 2017, the carrying amount of capitalised development costs included the concept development and preliminary design costs for MicroStreak, including systems engineering, mechanical and electronic subsystems, and software costs. These capitalised development costs for MicroStreak were being amortised on a straight line basis over the then assessed remaining life of the patent. The amortisation expense relating to capitalised MicroStreak development costs was approximately $670,000 per annum.
Consistent with this approach and in accordance with AASB 120 Accounting for Government grants and Disclosure of Government Assistance, revenue from the company’s commercial ready grant was being recognised over the periods in which the entity recognises as expense the related costs for which the grants are intended to compensate. As the grant received by the company in prior years related to the capitalised costs referred to above, it was also being recognised as revenue on a straight line basis over the remaining term of the patent, resulting in revenue recognised of approximately $141,000 per annum.
LBT transferred its proprietary MicroStreak intellectual property to China based Autobio Diagnostics Co. Ltd for nil consideration. Autobio Diagnostics Co. Ltd Invested $2 million In LBT through a placement of 6,451,613 ordinary shares at $0.31 per share, with 3,225,806 attaching options exercisable at $0.44, expiring 9 December 2018.
d. LeasesLease payments for operating leases, where substantially all the risks and benefits remain with the lessor, are charged as expenses in the periods in which they are incurred.
e. Financial InstrumentsFinancial instruments are initially measured at cost on trade date, which includes transaction costs, when the related contractual rights or obligations exist. Subsequent to initial recognition these instruments are measured as set out below.
ImpairmentAt each reporting date, the Company assesses whether there is objective evidence that a financial instrument has been impaired. Impairment losses are recognised on the income statement.
Financial assetsFinancial assets are recognised at cost less principal repayments.
Financial LiabilitiesFinancial liabilities are recognised at amortised cost less principal payments and amortisation.
f. Investment Accounted for Using the Equity Method
Investment in Joint VentureLBT established a joint venture company, Clever Culture Systems AG ( JV Company), with Hettich Holding Beteiligungs- und Verwaltungs-GmbH. LBT has a 50% interest in the JV Company into which it has contributed CHF25,000 share capital and granted a licence to use its APAS technology. Hettich Holding Beteiligungs- und Verwaltungs-GmbH (Hettich) also holds a 50% interest in the JV Company into which it has contributed CHF25,000 share capital and shareholder loans. Subsequent funding is being provided by LBT and Hettich equally as shareholder loans.
The investment in the JV Company with Hettich Holding Beteiligungs- und Verwaltungs-GmbH is accounted for using the equity method in accordance with AASB 128. Under the equity method, the investment in the JV Company is initially recognised in the balance sheet of LBT at cost, and adjusted for post-acquisition changes in LBT’s share of net assets in the JV Company. The initial cost of the investment into the JV Company was assessed as the CHF25,000 share capital contribution together with the fair value of the licence granted to the JV Company to use its APAS technology, being $1.51 million.
Financial statements of the equity-accounted for entity are prepared for the same reporting period as LBT.
Notes to the Financial Statements
31
For
per
sona
l use
onl
y

1. Statement of Significant Accounting Policies cont.
g. Impairment of AssetsAt each reporting date, the Company assesses whether there is any indication that an asset may be impaired. If such an indication exists, an impairment test is carried out on the asset by comparing the recoverable amount of the asset, being the higher of the asset’s fair value less costs of disposal and value in use, to the asset’s carrying amount. Any excess of the asset’s carrying amount over its recoverable amount is recognised immediately in the profit or loss.
Where it is not possible to estimate the recoverable amount of an individual asset, the Company estimates the recoverable amount of the cash-generating unit to which the asset belongs.
Impairment testing is performed annually for intangible assets with indefinite lives and intangible assets not yet available for use.When an impairment loss subsequently reverses, the carrying amount of the asset (or cash-generating unit) is increased to the revised estimate of its recoverable amount, but so that the increased carrying amount does not exceed the carrying amount that would have been determined had no impairment loss been recognised for the asset (or cash-generating unit) in prior years. A reversal of an impairment loss is recognised immediately in the profit or loss.
Critical Accounting Estimates and JudgementsThe Directors evaluate estimates and judgements incorporated into the financial statements based on historical knowledge and best available current information. Estimates assume a reasonable expectation of future events and are based on current trends and economic data, obtained both externally and within the Company.
Key Estimates – ImpairmentThe Company assesses impairment at the end of each reporting period by evaluating the conditions and events specific to the Company that may be indicative of impairment triggers. Recoverable amounts of relevant assets are assessed using value-in-use calculations which incorporate various key assumptions.
The recoverable amount for the following assets are dependent on sufficient future cash flows generated through sales of the APAS instrument and ongoing licence fees, received through LBT’s 50% owned joint venture company, CCS, together with LBT’s expected direct earnings through a share of the ongoing licence fees and distribution fees for sales in Australia & New Zealand:
• loan to CCS of $7.74 million, including accrued interest;
• investment in CCS of $0.15 million; and
• intangible assets, being the capitalised development costs for the APAS instrument, of $18.1 million.
With respect to the cash flow projections for the APAS instrument, sales projections over the next seven years are based on a unit sales price of $400,000 per instrument and $40,000 per annum ongoing licence fee over the assessed minimum useful life of seven years per instrument. The unit sales are based upon the Company’s targeted markets and prior experience in bringing a new medical device technology to the market, together with historical market knowledge for other devices in the culture plate process, involving new technology at a similar price per unit. The forecast assumes modest sales through to June 2019, increasing through the appointment of distributors in key geographies, increasing again as the distributors are trained and the product becomes accepted in the market. The seven-year forecast period is considered a reasonable duration for such a product to move through this early sales process, to appointment and training of distributors, and through to achieving the potential market penetration.
The terminal value is calculated based on a reduced ongoing sales projection of just 15% of the year seven peak sales, or 29 instruments per annum, with the installed base reducing over time to 203 units. Terminal value has been calculated using a price earnings multiple of three times earnings, being late in the product life cycle at that point.
A nominal pre-tax discount rate of 20% has been used in the discounted cash flow modelling. This is based on the average Price-Earnings ratio of ASX listed entities, adjusted for management’s view of a risk premium appropriate for LBT as a pre-revenue listed entity, at the current stage of commercialisation of the APAS Instrument. The cash generating unit is identified as comprising the Company in its entirety.
The discounted cash flow forecast provides a recoverable amount of $46.2 million, which is in excess of the carrying amount of the APAS related assets of $26 million. The recoverability of the APAS related assets are considered to be sensitive to the above assumptions. At the projected level of cashflows, a pre-tax nominal discount rate of 28.6% is required before the discounted cash flow valuation approximates the carrying value of $26 million. Alternatively, maintaining a discount rate at the assessed 20%, either the units sold would need to reduce by 30%, or the average sales price per instrument together with the ongoing licence fee would need to both reduce by 22%, before the discounted cash flows approximated the carrying value of $26 million.
h. Cash and Cash EquivalentsCash and cash equivalents include cash on hand and at call deposits with banks or financial institutions, and is net of bank overdrafts.
Annual Report 2018
32
For
per
sona
l use
onl
y

1. Statement of Significant Accounting Policies cont.
i. RevenueLicence fees are brought to account as revenue in accordance with the substance of the relevant agreement. Where the condition under the agreement has been fulfilled and the payments are non-refundable, licence fees are brought to account as revenue only when it is probable that the fee will be received.
Revenues from royalties are recognised on an accrual basis in accordance with the substance of the relevant agreement.
Revenue from the rendering of a service is recognised upon the delivery of the service to the customers.
Interest revenue is recognised on a proportional basis taking into account the interest rates applicable to the financial assets.
AASB 15 Revenue from Contracts with CustomersAASB 15 replaced AASB 118 Revenue and AASB 111 Construction Contracts, with mandatory application for the financial year ending 30 June 2019. LBT has adopted this standard early to the current reporting period ended 30 June 2018. Consistent with this standard, revenue is recognised when control of goods or services transfers to a customer. Under the initial application of this standard, transitional adjustments were required to retained earnings on the date of initial application, without restating the comparative period.
Adoption of this new standard did not result in a material impact on the Company’s financial statements nor a change in retained earnings 30 June 2017.
All revenue is stated net of the amount of goods and services tax (GST).
j. Share‑Based Payments
Equity Settled TransactionsThe Company currently has a Directors and Executive Option Plan in place to provide benefits to directors and executives in the form of share-payments whereby they render services in exchange for shares or rights over shares (equity-settled transactions).
The Company may also provide options to selected consultants in exchange for their services.
The cost of these equity-settled transactions is measured by reference to the fair value of the equity instruments at the date at which they are granted or in the case of options subject to shareholder approval, then fair value at the date of shareholder approval. The fair value is determined using the Binomial option pricing model.
The cost of equity-settled transactions is recognised, together with a corresponding increase in equity, over the period in which the performance and/or service conditions are fulfilled, ending on the date on which the relevant party becomes fully entitled to the award (the vesting period).
No expense is recognised for awards that do not ultimately vest, except for awards where vesting is only conditional upon a market condition. The dilutive effect, if any, of outstanding options is reflected as additional share dilution in the computation of earnings per share.
k. Goods and Services Tax (GST)Revenues, expenses and assets are recognised net of the amount of GST, except where the amount of GST incurred is not recoverable from the Australian Taxation Office. In these circumstances the GST is recognised as part of the cost of acquisition of the assets or as part of an item of the expense. Receivables and payables in the balance sheet are shown inclusive of GST.
Cash flows are presented in the cash flow statement on a gross basis, except for the GST component of investing and financing activities, which are disclosed as operating cash flows.
l. Foreign Currency Transactions and BalancesForeign currency transactions during the year were converted to Australian currency at the rates of exchange applicable at the dates of the transactions. Amounts receivable and payable in foreign currencies at balance date were converted at the rates of exchange ruling at that date. The Company has a hedging policy under which, in appropriate circumstances, it hedges its foreign currency exposure.
Exchange differences arising on the translation of monetary items are recognised in the statement of comprehensive income.
LBT’s joint venture’s transactions in foreign currencies are initially recorded in the functional currency by applying the exchange rate ruling at the date of the transaction. Monetary assets and liabilities denominated in foreign currencies are translated into the functional currency at the rate of exchange at the statement of financial position’s date. Any resulting exchange differences are included in the comprehensive income statement. Non-monetary assets and liabilities, other than those measured at fair value are not re-translated subsequent to initial recognition.
In the financial statements, the assets and liabilities of LBT’s non-Australian dollar functional currency joint venture are translated into Australian dollars at the rate of exchange at the statement of financial position’s date.
Notes to the Financial Statements
33
For
per
sona
l use
onl
y

1. Statement of Significant Accounting Policies cont.
m. Comparative FiguresWhere required by Accounting Standards, comparative figures have been adjusted to conform with changes in presentation for the current financial year.
n. Government GrantsGovernment grants are recognised at fair value where there is reasonable assurance that the grant will be received and all grant conditions will be met. Grants relating to expenses are recognised as income over the periods necessary to match grants to the costs they are compensating. Grants relating to assets are credited to deferred income at fair value and are credited to income over the expected useful life of the asset on a straight line basis.
o. Adoption of New and Revised Accounting Standards The Company notes the following Accounting Standards which have been issued but are not yet effective at 30 June 2018. These standards have not been adopted early by the Company. The Company‘s assessment of the impact of these new standards and interpretations is set out below:
AASB 9 Financial Instruments (December 2014)
AASB 9 Financial Instruments addresses the classification, measurement and de-recognition of financial assets and financial liabilities and introduces new rules for hedge accounting. In December 2014, the AASB made further changes to the classification and measurement rules and also introduced a new impairment model.
These latest amendments now complete the new financial instruments standard. This standard does not apply mandatorily before the year ending 30 June 2019.
The Company is yet to undertake a detailed assessment of the impact of AASB 9. However, based on the Company’s preliminary assessment, the Standard is not expected to have a material impact on the transactions and balances recognised in the financial statements when it is first adopted for the year ending 30 June 2019.
AASB 7 Financial Instruments Disclosures (December 2014)
AASB 2014-7 (issued December 2014) gives effect to the consequential amendments to Australian Accounting Standards (including Interpretations) arising from the issue of AASB 9: Financial Instruments (December 2014). More significantly, additional disclosure requirements have been added to AASB 7: Financial Instruments: Disclosures regarding credit risk exposures of the entity. This Standard also makes various editorial corrections to Australian Accounting Standards and an Interpretation. However, based on the Company’s preliminary assessment, the Standard is not expected to have a material impact on the transactions and balances recognised in the financial statements when it is first adopted for the year ending 30 June 2019.
AASB 16 Leases
AASB 16 replaces AASB 117 Leases and some lease related Interpretations. The new standard requires all leases to be accounted for as ‘on balance sheet’ by lessees, other than short term and low value asset leases.
The standard provides new guidance on the application of the definition of lease and on sale and lease back accounting. The standard also requires new and different disclosures about leases. This standard does not apply mandatorily before 1 January 2019.
The Company is yet to undertake a detailed assessment of the impact of AASB 16. However, based on the entity’s preliminary assessment, the Standard is not expected to have a material impact on the transactions and balances recognised in the financial statements when it is first adopted for the year ending 30 June 2020.
AASB 2014‑10 Amendments to Australian Accounting Standards – Sale or Contribution of Assets between an Investor and its Associate or Joint Venture
The amendments address a current inconsistency between AASB 10 Consolidated Financial Statements and AASB 128 Investments in Associates and Joint Ventures.
The amendments clarify that, on a sale or contribution of assets to a joint venture or associate or on a loss of control when joint control or significant influence is retained in a transaction involving an associate or a joint venture, any gain or loss recognised will depend on whether the assets or subsidiary constitute a business, as defined in AASB 3 Business Combinations. Full gain or loss is recognised when the assets or subsidiary constitute a business, whereas gain or loss attributable to other investors’ interests is recognised when the assets or subsidiary do not constitute a business.
This amendment effectively introduces an exception to the general requirement in AASB 10 to recognise full gain or loss on the loss of control over a subsidiary. The exception only applies to the loss of control over a subsidiary that does not contain a business, if the loss of control is the result of a transaction involving an associate or a joint venture that is accounted for using the equity method. Corresponding amendments have also been made to AASB 128.
When these amendments are first adopted for the year ending 30 June 2019, there will be no material impact on the financial statements.
There are no other standards that are not yet effective and that are expected to have a material impact on the entity in the current or future reporting periods and on foreseeable future transactions.
Annual Report 2018
34
For
per
sona
l use
onl
y

2018 2017 $000 $000
2. RevenueOperating activities 5,762 5,807
Interest 196 116
Total Revenue 5,958 5,923
3. Profit for the YearProfit before income tax from continuing operations includes the following specific expenses.
(a) Consulting fees
Consulting fees include fees paid to assist with international market research, scientific and professional consulting. 389 246
(b) Employee benefits expense
Cash based employee benefits expense includes directors’ fees and salaries and wages, including executive bonuses 1,626 984
Share based payments 425 306
Total employee benefits expense 2,051 1,290
(c) Other Expenses
Auditors’ remuneration(1) 46 28
Rent 107 37
Travel and accommodation 87 123
External research and development(2) 5,683 6,383
Others 251 118
Total Other Expenses 6,174 6,689
(d) Revenue
The following significant revenue and expense items are relevant in explaining the financial performance.
bioMérieux termination fee 0 370
Reimbursement of expenses from JV Company(2) 4,753 4,955
Royalty income 0 0
Grant income 27 141
Consulting income 951 330
Foreign exchange gain (loss) 31 11
Interest income 196 116
Total Income 5,958 5,923
(1) The auditor did not provide any non-audit services to the Company during the year.
(2) The external research and development expenses of $5.68 million (2017: $6.38 million) incurred by LBT, relate to the engineering design and development of the physical APAS instrument. These expenses are included in Other Expenses disclosed at Note 3 (c) above. The majority of these research and development expenses are reimbursed by LBT’s 50% owned JV company CCS. The reimbursement of $4.75 million (2017: $4.96 million) is included in Revenue disclosed at Note 3 (d) above.
Notes to the Financial Statements
35
For
per
sona
l use
onl
y

2018 2017 $000 $000
4. Income Tax (a) The components of tax (benefit) expense comprise:
Current tax (1,631) (4,186)
Deferred tax 15 433
Income tax expense (1,616) (4,619)
(b) The prima facie tax on profits from ordinary activities before income tax is reconciled to the income tax as follows:
Prima facie tax payable on profits from ordinary activities before income tax at 27.5% (2017 27.5%) (1,183) (2,682)
Add.
Tax effect of.
R&D concession claim (950) (1,561)
Capital raising costs (69) (39)
Non-deductible expenses 547 0
Effect on deferred tax balances due to change in income tax rate from 30% to 27.5% (effective 1 July 2016) 0 (444)
Other 39 107
Income tax attribute to the company (1,616) (4,619)
5. Cash and Cash EquivalentsCash at bank 7,572 3,498
Annual Report 2018
36
For
per
sona
l use
onl
y

2018 2017 $000 $000
6. Trade and Other ReceivablesCurrent
Trade debtors 0 1,626
Other receivables 55 220
GST refundable 196 519
Total Receivables 251 2,365
Credit RiskAll receivables are within agreed payment terms. LBT has no significant concentration of credit risk with respect to any single counterparty or group of counterparties other than those receivables specifically provided for.
The following table details the Company’s trade and other receivables exposed to credit risk (prior to collateral and other credit enhancements) with ageing analysis and impairment provided for thereon. Amounts are considered as “past due” when the debt has not been settled within the terms and conditions agreed between the Company and the customer or counterparty to the transaction. Receivables that are past due are assessed for impairment by ascertaining solvency of the debtors and are provided for where there are specific circumstances indicating that the debt may not be fully repaid to the Company.
The balances of receivables that remain within initial trade terms (as detailed in the table below) are considered to be of high credit quality.
Gross Amount
$’000
Past Due and
Impaired $’000
Past Due but Not Impaired (Days Overdue)Within Initial Trade Terms
$’000< 30
$’00031–60 $’000
61–90 $’000
> 90 $’000
2017
Trade and term receivables 1,626 0 0 0 0 0 0
Other receivables 251 0 0 0 0 0 251
Total 251 0 0 0 0 0 251
2016
Trade and term receivables 1,626 0 0 0 0 0 1,626
Other receivables 739 0 0 0 0 0 739
Total 2,365 0 0 0 0 0 2,365
The Company does not hold any financial assets whose terms have been renegotiated, but which would otherwise be past due or impaired.
Notes to the Financial Statements
37
For
per
sona
l use
onl
y

2018 2017 $000 $000
7. Plant and EquipmentPlant and equipment at cost 299 236
Less: accumulated depreciation (209) (171)
Total plant and equipment 90 65
Movements in Carrying Amount Movements in carrying amounts of plant and equipment between the beginning and the end of the financial year were as follows.
Opening balance 65 44
Additions 63 49
Disposals 0 0
Depreciation expense (38) (28)
Closing balance 90 65
8. Investments Accounted for Using the Equity Method(a) Recognition of Carrying Amounts
Investment in joint venture at cost (Note 1 (f)) 1,539 1,539
Foreign currency translation reserve 114 112
Share of profit/(loss) in joint venture (1,502) (475)
Closing carrying amount 151 1,176
LBT Innovations Ltd has a 50% interest in a joint venture with Hettich Holding Beteiligungs- und Verwaltungs-GmbH. The interest in the joint venture is held directly by LBT Innovations Limited. The purpose of the joint venture is to finalise the development of LBT’s APAS technology, and subsequent manufacture, distribution and sales.
The voting power held by LBT Innovations Ltd is 50%.
Annual Report 2018
38
For
per
sona
l use
onl
y

8. Investments Accounted for Using the Equity Method cont.
(b) Summarised Financial Information for Joint VenturesSet out below is the summarised financial information for Clever Culture Systems AG (CCS). Unless otherwise stated, the disclosed information reflects the amounts presented in the financial statements of CCS, in accordance with Australian Accounting Standards. The following summarised financial information reflects the adjustments made by LBT when applying the equity method, including adjustments for any differences in accounting policies between LBT and the joint venture.
2018 2017 $000 $000
Summarised Financial Position
Assets
Current Assets
Cash and cash equivalents 724 711
Trade and other receivables 532 688
Inventory 246 0
Total Current Assets 1,502 1,399
Non‑Current Assets
Intangible assets 19,529 12,898
Total Non‑Current Assets 19,529 12,898
Total Assets 21,031 14,297
Current Liabilities
Trade and other payables 329 2,564
Total Current Liabilities 329 2,564
Non‑Current Liabilities
Non-current financial liabilities (loans from JV shareholders) 20,400 9,382
Total Non‑Current Liabilities 20,400 9,382
Total Liabilities 20,729 11,946
Net Assets 302 2,351
Group’s share (%) 50% 50%
Group’s share of joint venture’s net assets 151 1,176
Summarised Financial Performance
Revenue 842 0
Depreciation and amortisation 0 0
Interest income 0 0
Interest expense (317) (91)
Other expenses (2,612) (138)
Profit/(Loss) after tax from continuing operations (2,087) (229)
Other comprehensive income 33 (56)
Total comprehensive income/(loss) for the year (2,054) (285)
Dividends paid 0 0
Group’s share of joint venture’s cumulative comprehensive income/(loss) (1,027) (143)
Notes to the Financial Statements
39
For
per
sona
l use
onl
y

2018 2017 $000 $000
9. Financial AssetsInterest on Loan to joint venture 141 22
Loan to joint venture 7,604 2,898
Total financial assets 7,745 2,920
The loan is LBT’s 50% contribution of the additional funding required by the joint venture company, CCS, in order to fund bringing the APAS based products to market. Future profits of CCS will be applied to repay the loans to both LBT and CCS’ other JV shareholder, Hettich Holding Beteiligungs- und Verwaltungs-GmbH. Therefore recoverability of the loan is dependent on sufficient future profitability of APAS instrument sold through CCS.
10. Intangible AssetsMicroStreak option fee at cost 0 51
Less: accumulated amortisation (Note 1 (c)) 0 (44)
Less: impairment 0 (7)
0 0
MicroStreak licence fee at cost 0 120
Less: accumulated amortisation (Note 1 (c)) 0 (100)
Less: impairment 0 (20)
0 0
Patent fees 0 247
Less: accumulated amortisation (Note 1 (c)) 0 (129)
Less: impairment 0 (118)
0 0
MicroStreak development costs (Note 1 (c)) 0 11,959
Less: accumulated amortisation 0 (4,244)
Less: impairment 0 (7,715)
0 0
APAS development costs (Note 1 (c)) 18,246 15,974
Less: accumulated amortisation (124) (110)
18,122 15,864
Total intangible assets 18,122 15,864
Annual Report 2018
40
For
per
sona
l use
onl
y

10. Intangible Assets cont.
Movements in Carrying Amount
MicroStreak Option Fee
at Cost $’000
MicroStreak Licence Fee
at Cost $’000
Patent Fees $’000
MicroStreak Development
Costs $’000
APAS Development
Costs $’000
Total Intangible
Assets $’000
Balance 1 July 2016 10 28 130 8,385 12,030 20,583
Additions 0 0 0 0 3,872 3,872
Disposals 0 0 0 0 0 0
Amortisation charge (3) (8) (12) (670) (38) (731)
Impairment (7) (20) (118) (7,715) 0 (7,860)
Balance 30 June 2017 0 0 0 0 15,864 15,864
Additions 0 0 0 0 2,272 2,272
Disposals 0 0 0 0 0 0
Amortisation charge 0 0 0 0 (14) (14)
Impairment 0 0 0 0 0 0
Balance 30 June 2018 0 0 0 0 18,122 18,122
Following a review of potential options to recognise value from a sale or licence of the MicroStreak patents, the Directors made a decision to write down the carrying amount of the MicroStreak intangible assets as at 30 June 2017, from $7.86 million to nil, and was subsequently for nil consideration to Autobio Diagnostics Co. Ltd. Refer to Note 1 (c) for further details.
2018 2017 $000 $000
11. Trade and Other Payables(a) Current
Trade creditors and other payables 1,864 4,194
Total trade and other payables 1,864 4,194
As at 30 June 2017, an amount of $2,764,109, within the trade creditors balance was secured in the form of a first ranking general security (30 June 2018: Nil).
(b) Non‑current
Provisions 83 39
Total non‑current Provisions 83 39
Notes to the Financial Statements
41
For
per
sona
l use
onl
y

2018 2017 $000 $000
12. Issued CapitalIssued and paid up capital
200,927,025 (2017: 139,973,064) ordinary shares fully paid 33,537 23,100
Less: costs associated with capital raising
Opening balance (2,219) (1,881)
Capital raising costs (558) (507)
Tax effect of capital raising costs 95 169
30,855 20,881
No. No.
Ordinary shares
At the beginning of the reporting period 139,973,064 114,988,073
Options exercised 0 2,400,000
Tranche 1 placement allotted 12 December 2016 0 11,399,990
Tranche 2 placement allotted 25 January 2017 0 11,185,001
SPP allotted 10 July 2017 1,923,057 0
Shares Issued to Autobio on 1 December 2017 6,451,613 0
Shares Issued to Medvet on 4 December 2017 432,620 0
Tranche 1 allotted 12 March 2018 25,164,711 0
SPP allotted 10 April 2018 3,246,666 0
Tranche 2 allotted 26 April 2018 17,393,705 0
Tranche 2 allotted 27 April 2018 3,674,922 0
Shares issued to Planet Innovation allotted 14 May 2018 2,666,667 0
At reporting date 200,927,025 139,973,064
Voting RightsThe voting rights attached to each class of equity security are as follows:
Ordinary sharesEach ordinary share is entitled to 1 vote when a poll is called otherwise each member present at a meeting or by proxy has a vote on a show of hands.
Option holdersEach option entitles the holders to subscribe for 1 ordinary share in the capital of the Company. Options do not have voting rights attached, however ordinary shares issued on conversion carry the same voting rights as described above.
Capital ManagementManagement controls the capital of the Company in order to ensure that the Company can fund its operations and continue as an going concern.
The Company’s debt and capital includes ordinary share capital and financial liabilities, supported by financial assets. There are no externally imposed capital requirements.
Management effectively manages the Company’s capital by assessing the Company’s financial risks and adjusting its capital structure in response to changes in these risks and in the market. These responses include the management of debt levels and share issues.
There have been no changes in the strategy adopted by management to control the capital of the Company since the prior year.
Annual Report 2018
42
For
per
sona
l use
onl
y

2018 2017 $000 $000
13. ReserveOption reserve
Option reserve of valuation of share options(1) 924 499
Foreign currency translation reserve(2) 114 112
Total Reserve Balance 1,038 611
(1) The option reserve records items recognised as expenses on valuation of issued share options
(2) Exchange rate fluctuations on transactions of foreign operations taken to equity
14. Cash Flow InformationReconciliation of Cash Flow from Operations with Profit/(Loss) after Income Tax
Profit (loss) after income tax (2,683) (5,213)
Non-cash flows in loss
Amortisation 15 731
Net impairment 0 6,239
Depreciation 38 28
Share based payments expense 425 306
Forex (gains)/losses (2) 80
Cash Flows attributed to investing activities (153) 719
Cash Flows attributed to financing activities 103 0
Shares issued in lieu of payment 115 0
Changes in Assets and Liabilities
Decrease/(Increase) in receivables 2,114 (1,840)
(Decrease)/Increase in deferred revenue 0 (510)
(Increase)/Decrease in deferred tax asset (293) 576
Decrease/(Increase) in current tax asset 2,697 (3,025)
Decrease/(Increase) in Investment accounted for using the equity method 1,026 143
(Decrease)/Increase in trade creditors (2,330) 2,227
Increase/(Decrease) in provisions 44 (97)
Increase/(Decrease) in deferred tax liability 209 (1,179)
Increase/(Decrease in deferred tax in equity 0 169
(Increase)/Decrease in net unrealised loss (gain) on foreign currency held 0 (11)
Cash flow from/(used in) operations 1,325 (657)
Notes to the Financial Statements
43
For
per
sona
l use
onl
y

2018 2017 $000 $000
15. Earnings Per ShareReconciliation of Earnings to Net Profit/(Loss)
Net Profit/(Loss) (2,685) (5,133)
Earnings used in the calculation of basic earnings per share (2,685) (5,133)
Earnings used in the calculation of diluted earnings per share (2,685) (5,133)
Weighted average number of ordinary shares outstanding at 30 June 2018 used in the calculation of basic earnings per share 158,209,168 127,763,260
Weighted average number of options outstanding 16,335,368 9,777,324
Weighted average number of ordinary shares outstanding at 30 June 2018 used in the calculation of diluted earnings per share 158,209,168 127,763,260
16. Tax (a) Assets
Deferred tax assets comprise.
Accruals 23 5
Leave entitlements 72 38
Capital raising costs 214 130
Other 208 51
517 225
(b) Liabilities
Deferred tax liabilities comprise.
Deferred income 96 562
Capitalised development expenditure 4,919 4,298
Other 38 (16)
5,053 4,844
(c) Reconciliations
i) Gross Movements
The overall movement in the deferred tax account
is as follows.
Opening balance (4,619) (5,222)
(Charge)/credit to income statement (1) 434
(Charge)/credit to equity 84 169
Closing balance (4,536) (4,619)
Annual Report 2018
44
For
per
sona
l use
onl
y

2018 2017 $000 $000
16. Tax cont.
(c) Reconciliations cont. ii) Deferred Tax Assets
The movement in deferred tax assets for each temporary difference during the year is as follows.
Non‑deductible accrued expenses
Opening balance 5 7
Credit/(charge) to the income statement 18 (2)
Closing balance 23 5
Provision for leave
Opening balance 38 73
Credit/(charge) to the income statement 34 (35)
Closing balance 72 38
Deferred income
Opening balance 0 639
Credit/(charge) to the income statement 0 (639)
Closing balance 0 0
Capital raising costs
Opening balance 130 32
Credit/(charge) to equity 84 98
Closing balance 214 130
Other
Opening balance 51 50
Credit/(charge) to equity 157 1
Closing balance 208 51
iii) Deferred tax liabilities
Capitalised development expenditure
Opening balance 4,298 6,010
(Credit)/charge to income statement 621 (1,712)
Closing balance 4,919 4,298
Deferred income
Opening balance 562 0
(Credit)/charge to income statement (466) 562
Closing balance 96 562
Other
Opening balance (16) 13
(Credit)/charge to income statement 54 (29)
Closing balance 38 (16)
Notes to the Financial Statements
45
For
per
sona
l use
onl
y

17. Related Party TransactionsTransactions between related parties are on normal commercial terms and conditions no more favourable than those available to other parties unless otherwise stated.
(a) Names and positions of key management personnel of LBT Innovations in office at any time during the financial year:
DirectorsMr B Barnes Chief Executive Officer and Managing Director
Mrs C M Costello Independent Director – Non-Executive
Mr R A Finder Independent Chairman – Non-Executive (retired 31 July 2017)
Mr S P Mathwin Independent Director – Non-Executive
Dr C Popper Independent Director – Non-Executive
Mr G Haifer Independent Director – Non-Executive (commenced 1 September 2017)
Mr M Michalewicz Independent Director – Non-Executive (commenced 1 September 2017)
Key Management PersonnelMr P Bradley VP of Global Business Development
Mr Daniel Hill Company Secretary
Mr Ray Ridge Chief Financial Officer
Key management personnel (KMP) remuneration has been included in the remuneration section of the Directors’ Report.
The totals of remuneration paid to KMP of the Company and the Group during the year are as follows:
2018 2017 $000 $000
Short term employee benefits 995(1) 861
Post-employment benefits 97 94
Other long-term benefits 0 68
Share-based payments 411 301
Total KMP compensation 1,503 1,324
Short‑term employee benefitsThese amounts include fees and benefits paid to the non-executive Chair and non-executive directors as well as all salary, paid leave benefits, fringe benefits and cash bonuses awarded to executive directors and other KMP.
(1) Mr Barnes bonus for 2016-17 year was approved by the Board after completion of the 2017 Annual Report and was recognised as an expense in the 2017-2018 year. While the bonus 2017-18 year was approved by the Board prior to completion of the 2018 Annual Report and was accrued as an expense in the 2017-18 year. Therefore, the 2017-18 year includes the bonuses relating to two years.
Post‑employment benefitsThese amounts are the current year’s superannuation contributions made during the year.
Other long‑term benefitsThese amounts represent long service leave benefits paid during the year.
Share‑based paymentsThese amounts represent the expense related to the participation of KMP in equity settled benefit schemes as measured by the fair value of the options granted on the grant date.
Further information in relation to KMP remuneration can be found in the Directors’ Report.
Annual Report 2018
46
For
per
sona
l use
onl
y

17. Related Party Transactions cont.
(b) Option Holdings
2018
Balance 01/07/17
Granted as Remuneration
Options Exercised
Other Change
Balance 30/06/18
Total Vested
30/06/18
Total Exercisable
30/06/18
Total Unexercisable
30/06/18
Directors
Mr R A Finder 161,290 0 0 0 161,290 161,290 161,290 0
Mr B Barnes 1,661,290 0 0 0 1,661,290 161,290 161,290 1,500,000
Mrs C M Costello 161,290 0 0 0 161,290 161,290 161,290 0
Mr S P Mathwin 64,516 0 0 0 64,516 64,516 64,516 0
Dr C Popper 0 0 0 0 0 0 0 0
Mr G Haifer 500,000 0 0 500,000 0 0 500,000
Mr M Michalewicz 0 500,000 0 0 500,000 0 0 500,000
Key Management Personnel
Mr P Bradley 600,000 0 0 0 600,000 600,000 600,000 0
Mr D Hill 0 0 0 0 0 0 0 0
2,648,386 1,000,000 0 0 3,648,386 1,148,386 1,148,386 2,500,000
2017
Balance 01/07/16
Granted as Remuneration
Options Exercised
Other Change(1)
Balance 30/06/17
Total Vested
30/06/17
Total Exercisable
30/06/17
Total Unexercisable
30/06/17
Directors
Mr R A Finder 750,000 0 (750,000) 161,290 161,290 161,290 161,290 0
Mr B Barnes 0 1,500,000 0 161,290 1,661,290 161,290 161,290 1,500,000
Mrs C M Costello 250,000 0 (250,000) 161,290 161,290 161,290 161,290 0
Mr S P Mathwin 500,000 0 (500,000) 64,516 64,516 64,516 64,516 0
Dr C Popper 500,000 0 (500,000) 0 0 0 0 0
Key Management Personnel
Mr P Bradley 600,000 0 0 0 600,000 100,000 100,000 500,000
Mr D Hill 0 0 0 0 0 0 0 0
2,600,000 1,500,000 (2,000,000) 548,386 2,648,386 648,386 648,386 2,000,000
(1) Eligible Directors participated in a placement at $0.31 per share, with one free option for every two shares subscribed. The placement and option terms were consistent with the terms applicable to external parties participating in the placement. Director participation was approved by shareholders on 18 January 2017.
(2) The ending balance for Mr R Finder for the 2018 year is as at the date of retirement, being 31 July 2017.
Notes to the Financial Statements
47
For
per
sona
l use
onl
y

17. Related Party Transactions cont.
(c) Shareholdings
2018
Balance 01/07/17
Received as Remuneration
Options Exercised
Net Change Other (2)
Balance 30/06/18
Directors
Mr R A Finder 6,452,884 0 0 173,076 6,625,960
Mr B Barnes 322,580 0 0 391,026 713,606
Mrs C M Costello 2,567,892 0 0 782,051 3,349,943
Mr S P Mathwin 3,129,032 0 0 238,460 3,367,492
Dr C Popper 200,000 0 0 100,000 300,000
Mr G Haifer 0 0 0 1,666,667 1,666,667
Mr M Michalewicz 0 0 0 333,334 333,334
Key Management Personnel
Mr P Bradley 94,754 0 0 0 94,754
Mr D Hill 0 0 0 0 0
Mr R Ridge 0 0 0 0 0
Total 12,767,142 0 0 3,684,614 16,451,756
2017
Balance 01/07/16
Received as Remuneration
Options Exercised
Net Change Other (1)
Balance 30/06/17
Directors
Mr R A Finder 5,605,304 0 750,000 97,580 6,452,884
Mrs L H Guthrie(3) 6,213,755 0 0 (1,750,000) 4,463,755
Mr B Barnes 0 0 0 322,580 322,580
Mrs C M Costello 2,096,028 0 250,000 221,864 2,567,892
Mr S P Mathwin 2,550,000 0 500,000 79,032 3,129,032
Dr C Popper 0 0 500,000 (300,000) 200,000
Key Management Personnel
Mr P Bradley 94,754 0 0 0 94,754
Mr D Hill 0 0 0 0 0
Total 16,559,841 0 2,000,000 (1,328,944) 17,230,897
(1) Eligible Directors participated in a placement at $0.31 per share, with one free option for every two shares subscribed. The placement and option terms were consistent with the terms applicable to external parties participating in the placement. Director participation was approved by shareholders on 18 January 2017.
(2) Eligible Directors participated in the share purchase plan announced on 23 May 2017 at $0.26 per share and the placement announced on 18 April 2018 at $0.15 per share. Director participation in the placement was approved by shareholders on 18 April 2018.
(3) Lusia Guthrie retired as CEO 8 August 2016.
(4) The ending balance for Mr R Finder for the 2018 year is as at the date of retirement, being 31 July 2017.
(d) Directors’ Related Entity Transactions with the CompanyThere were no related entity transactions throughout the year.
Annual Report 2018
48
For
per
sona
l use
onl
y

18. Financial Risk Management
(a) Financial Risk Management PoliciesThe Company’s financial instruments consist mainly of deposits with banks, and accounts receivable and payable. The Company does not invest in any derivative instruments.
i) Treasury Risk ManagementThe Board meets on a regular basis to analyse financial risk exposure and to evaluate treasury management strategies in the context of the most recent economic conditions and forecasts. The Board’s overall risk management strategy seeks to assist the Company in meeting its financial targets, while minimising potential adverse effects on financial performance.
The Board has established an investment policy that is reviewed on a regular basis.
ii) Financial Risk Exposures and ManagementThe main risks the Company is exposed to through its financial instruments are interest rate risk, foreign currency risk, liquidity risk and credit risk.
Interest rate riskInterest rate risk is managed with a mixture of fixed and floating rate deposits. At 30 June 2018 $6 million of the Company’s cash deposits were fixed.
Foreign currency riskThe Company can be exposed to fluctuations in foreign currencies arising from the receipts of milestone, licence, loan and royalty payments in currencies other than the Company measurement currency. At balance date, the Company had exposure in one of the loans to Clever Culture Systems of €346,527 ($546,228) and interest on these loans totalling €12,340 ($19,451).
Liquidity riskThe Company manages liquidity risk by monitoring forecast cash flows and ensuring that adequate cash deposits are maintained.
Credit riskThe maximum exposure to credit risk is the carrying amount, net of any provisions for impairment of those assets, as disclosed in the balance sheet and notes to the financial statements.
The Board monitors credit risk by actively assessing the rating quality and liquidity of counter parties:
• only banks and financial institutions with a credit rating of ‘A’ long term (Standard and Poors rating) are used; and
• all potential customers are rated for credit worthiness taking into account their size, market position and financial standing.
LBT has a loan of $7,603,511 to its 50% owned joint venture company, CCS. Any future profits of CCS will be first applied to repay the loans to both LBT and CCS’ other joint venture shareholder, Hettich Holding Beteiligungs- und Verwaltungs-GmbH (refer Note 9). The Board considers this amount to be recoverable. Other than CCS, LBT does not have any material credit risk exposure to any single receivable or group of receivables under financial instruments entered into by the Company.
Notes to the Financial Statements
49
For
per
sona
l use
onl
y

18. Financial Risk Management cont.
(b) Financial instrument composition and maturity analysisThe tables below reflect the undiscounted contractual settlement terms for financial instruments of a fixed period of maturity, as well as management’s expectations of the settlement period for all other financial instruments. As such, the amounts may not reconcile to the balance sheet.
Weighted Average Effective
Interest Rate %
Floating Interest Rate
$ 000
Within 1 Year
$ 000
1 to 5 Years
$ 000
Over 5 Years
$ 000
Non-interest Bearing
$ 000
Total
$ 000
2018 2017 2018 2017 2018 2017 2018 2017 2018 2017 2018 2017 2018 2017
Financial Assets
Cash and cash equivalents 1.8% 2.2% 6,020 3,493 0 0 0 0 0 0 1,552 5 7,572 3,498
Receivables 2.0% 2.0% 0 0 0 0 7,745 2,920 0 0 251 2,195 7,996 5,115
Total Financial Assets 6,020 3,493 0 0 7,745 2,920 0 0 1,803 2,200 15,568 8,613
Financial Liabilities
Trade Payables Borrowings 0 0 0 0 0 0 0 0 0 0 1,947 4,233 1,947 4,233
Total Financial Liabilities 0 0 0 0 0 0 0 0 0 0 1,947 4,233 1,947 4,233
All trade and sundry payables are expected to be paid within four months of balance date.
(c) Net Fair ValuesThe net fair values of all assets and liabilities approximate their carrying value.
(d) Sensitivity AnalysisThe Company has performed a sensitivity analysis to its exposure to interest rate risk at balance date. This sensitivity analysis demonstrates the effect on the current year results and equity, which could result from a change in these risks.
At 30 June 2018, the effect on profit and equity after tax as a result of changes in the interest rate, with all other variables remaining constant, would be as follows:
2018 2017 $000 $000
Change in profit
- increase in interest rate by 2% 69 64
- decrease in interest rate by 2% (69) (64)
Changes in equity
- increase in interest rate by 2% 69 64
- decrease in interest rate by 2% (69) (64)
Annual Report 2018
50
For
per
sona
l use
onl
y
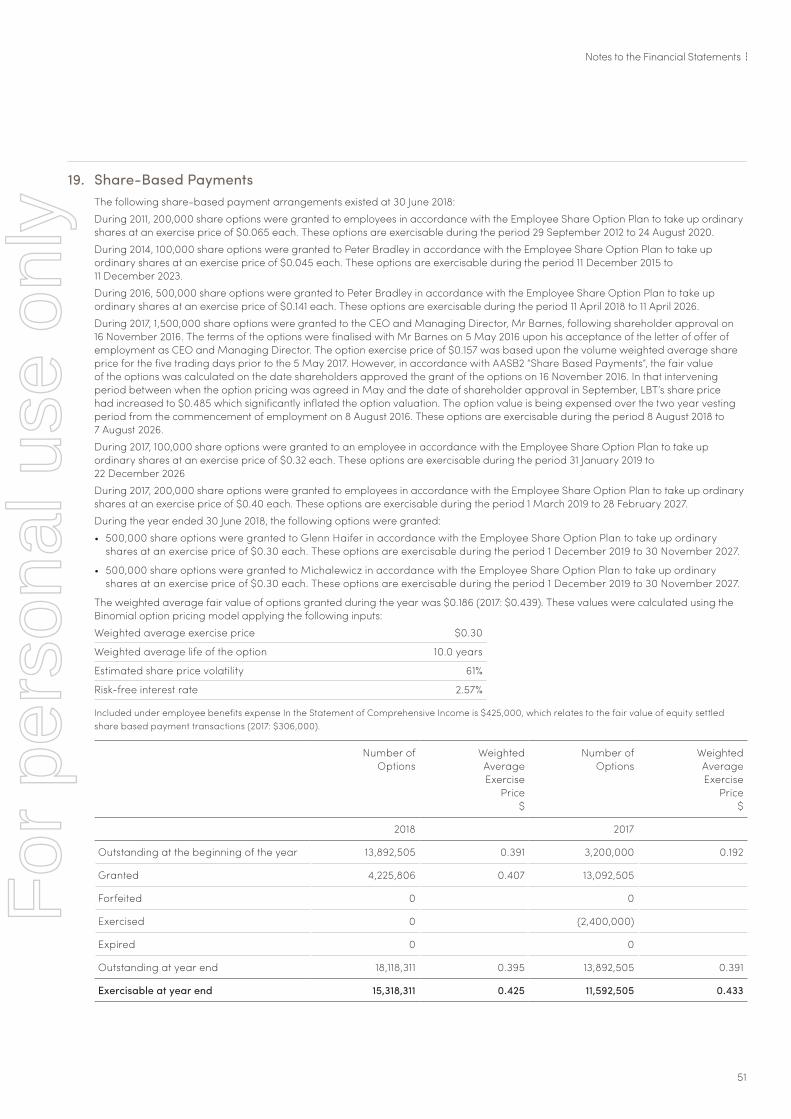
19. Share‑Based PaymentsThe following share-based payment arrangements existed at 30 June 2018:
During 2011, 200,000 share options were granted to employees in accordance with the Employee Share Option Plan to take up ordinary shares at an exercise price of $0.065 each. These options are exercisable during the period 29 September 2012 to 24 August 2020.
During 2014, 100,000 share options were granted to Peter Bradley in accordance with the Employee Share Option Plan to take up ordinary shares at an exercise price of $0.045 each. These options are exercisable during the period 11 December 2015 to 11 December 2023.
During 2016, 500,000 share options were granted to Peter Bradley in accordance with the Employee Share Option Plan to take up ordinary shares at an exercise price of $0.141 each. These options are exercisable during the period 11 April 2018 to 11 April 2026.
During 2017, 1,500,000 share options were granted to the CEO and Managing Director, Mr Barnes, following shareholder approval on 16 November 2016. The terms of the options were finalised with Mr Barnes on 5 May 2016 upon his acceptance of the letter of offer of employment as CEO and Managing Director. The option exercise price of $0.157 was based upon the volume weighted average share price for the five trading days prior to the 5 May 2017. However, in accordance with AASB2 “Share Based Payments”, the fair value of the options was calculated on the date shareholders approved the grant of the options on 16 November 2016. In that intervening period between when the option pricing was agreed in May and the date of shareholder approval in September, LBT’s share price had increased to $0.485 which significantly inflated the option valuation. The option value is being expensed over the two year vesting period from the commencement of employment on 8 August 2016. These options are exercisable during the period 8 August 2018 to 7 August 2026.
During 2017, 100,000 share options were granted to an employee in accordance with the Employee Share Option Plan to take up ordinary shares at an exercise price of $0.32 each. These options are exercisable during the period 31 January 2019 to 22 December 2026
During 2017, 200,000 share options were granted to employees in accordance with the Employee Share Option Plan to take up ordinary shares at an exercise price of $0.40 each. These options are exercisable during the period 1 March 2019 to 28 February 2027.
During the year ended 30 June 2018, the following options were granted:
• 500,000 share options were granted to Glenn Haifer in accordance with the Employee Share Option Plan to take up ordinary shares at an exercise price of $0.30 each. These options are exercisable during the period 1 December 2019 to 30 November 2027.
• 500,000 share options were granted to Michalewicz in accordance with the Employee Share Option Plan to take up ordinary shares at an exercise price of $0.30 each. These options are exercisable during the period 1 December 2019 to 30 November 2027.
The weighted average fair value of options granted during the year was $0.186 (2017: $0.439). These values were calculated using the Binomial option pricing model applying the following inputs:
Weighted average exercise price $0.30
Weighted average life of the option 10.0 years
Estimated share price volatility 61%
Risk-free interest rate 2.57%
Included under employee benefits expense In the Statement of Comprehensive Income is $425,000, which relates to the fair value of equity settled share based payment transactions (2017: $306,000).
Number of Options
Weighted Average Exercise
Price $
Number of Options
Weighted Average Exercise
Price $
2018 2017
Outstanding at the beginning of the year 13,892,505 0.391 3,200,000 0.192
Granted 4,225,806 0.407 13,092,505
Forfeited 0 0
Exercised 0 (2,400,000)
Expired 0 0
Outstanding at year end 18,118,311 0.395 13,892,505 0.391
Exercisable at year end 15,318,311 0.425 11,592,505 0.433
Notes to the Financial Statements
51
For
per
sona
l use
onl
y

19. Share‑Based Payments cont.The options outstanding per the above table include options issued as share based payments, together with the following options issued with Shares as part of a placement:
• 5,699,999 options were granted in December 2016 in connection with the Tranche 1 placement of Shares, on the basis of one free option for every two shares subscribed by places. The options have an exercise price of $0.4425 each, and are exercisable at any time through to expiry on 9 December 2018.
• 5,592,506 options were granted on 18 January 2017, following shareholder approval, in connection with the Tranche 2 placement of Shares, on the basis of one free option for every two shares subscribed by places. The options have an exercise price of $0.4425 each, and are exercisable at any time through to expiry on 9 December 2018.
• 3,225,806 share options were granted on 1 December 2017 to Autobio in connection to the share purchase announced on 27 October 2017. These options have an exercise price of $0.44 and are exercisable from 1 December 2017 to 30 November 2018.
The options outstanding at 30 June 2018 had a weighted average exercise price of $ 0.395 and a weighted average remaining contractual life of 1.97 years. Exercise prices range from $0.045 and $0.4425.
Options issued to directors and employees cannot be exercised until the second anniversary after the grant date. Any options held at the date a director ceases to be an officer automatically lapse within 90 days unless the Board approves an extension. Accordingly, it is considered that these options do not fully vest until such time as they can be exercised. In accordance with AASB 2 “Share-based Payment”, the fair value of the options has been expensed over the vesting period.
Historical volatility has been the basis for determining expected share price volatility.
20. Segment Reporting
(a) The Company operates in one business segment, conducting research and development.
2018 2017 $000 $000
(b) Revenue by geographic region
Australia 223 257
Switzerland 5,735 5,296
USA 0 370
Total revenue 5,958 5,923
(c) Assets by geographical regionThe Company holds a 50% interest in the joint venture with Hettich Holding Beteiligungs- und Verwaltungs-GmbH. At balance date, the carrying value of the Company’s interest in the joint venture was $150,843. The joint venture is based in Switzerland.
2018 2017 $000 $000
(d) Major customersLBT Innovations recognised $4,752,766 income from the reimbursement of APAS related expenses and $951,084 service fees during the financial year from its joint venture with Hettich Holding Beteiligungs- und Verwaltungs-GmbH. LBT Innovations Ltd recognised 50% of the joint venture losses of $1,026,768. Net Income (excluding JV losses) from Clever Culture Systems AG accounted for 96% of external revenue.
In 2016 bioMérieux terminated the original MicroStreak licence agreement and LBT Innovations Ltd granted them new non-exclusive licence in exchange for US$5.5 million ($7.9m). $7.5 million of this termination payment was recognised as income in 2016 less a ($0.2 million) royalty income adjustment. The remainder of the termination payment was recognised last year.
21. Credit Standby ArrangementsThe Company has a credit standby facility of $50,000. This facility was used to the extent of $23,852 at balance date.
Annual Report 2018
52
For
per
sona
l use
onl
y

2018 2017 $000 $000
22. Operating Leasing CommitmentsNon-cancellable operating leases contracted for but not recognised in the financial statements
Payable - minimum lease payments
- not later than 12 months 110 103
- between 12 months and five years 133 215
LBT has signed a property lease for its laboratory accommodation at Thebarton, SA, commencing May 2017. This is a non-cancellable lease with a 3-year term, with rent payable monthly in advance. The rent will increase on an annual basis by 3% or CPI whichever is the greatest. An option exists to renew the lease at the end of the 3-year term for an additional term of 3 years.
LBT signed a property lease for its head office in Adelaide CBD commencing on August 2017. This is a non-cancellable lease with a 3-year term, with rent payable monthly in advance. The rent will increase on an annual basis by 3% or CPI whichever is the greatest. An option exists to renew the lease at the end of the 3-year term for an additional term of 2 years.
23. Events After the Balance Sheet DateLBT Innovations Ltd had its first commercial sale of the APAS Independence to St Vincent’s Hospital in Melbourne which was announced on 22 August 2018. The purchase order for the first APAS Independence has now been placed with LBT as appointed distributor for Australia and New Zealand and a commercial ready production version of the APAS Independence instrument is already installed at St Vincent’s. LBT will generate revenue directly as the Australian distributor of the instrument, in addition to the revenue generated by CCS. CCS is the manufacturer and supplier of the instrument. The sale price is consistent with anticipated market pricing previously disclosed, with further detail of the payment terms remaining commercial in confidence.
On 29 August 2018, LBT Innovations Ltd finalised an agreement for the provision of a $4 million loan facility by the South Australian Government enabling a drawdown of the loan in instalments of $1 million, $1.5 million and $1.5 million, subject to achievement of operational milestones. All drawdowns are available through to December 2019, and will then be repaid over five years from the first drawdown date. The low interest rate for the Facility is a 2% margin above the South Australian Government cost of funds. The Company have provided the South Australian Government with a first ranking general security.
24. Company DetailsThe registered office and principal place of business of the Company is:
Level 8, 44 Waymouth Street Adelaide SA 5000
Phone: +61 8 8227 1555
Website. lbtinnovations.com
Notes to the Financial Statements
53
For
per
sona
l use
onl
y

Directors Declaration
The directors of the Company declare that:(1) the financial statements and notes, as set out on pages 25 to 53, are in accordance with the Corporations Act 2001 and:
• Comply with Accounting Standards, which as stated in accounting policy Note 1 to the financial statements constitutes explicit and unreserved compliance with International Financial Reporting Standards (IFRS) and the Corporations Regulations 2001; and
• Give a true and fair view of the financial position as at 30 June 2018 and of the performance for the year ended on that date of the Company;
(2) the Chief Executive Officer and Chief Finance Officer have each declared that:
• The financial records of the Company for the financial year have been properly maintained in accordance with section 286 of the Corporations Act 2001;
• the financial statements and notes for the financial year comply with the Accounting Standards; and
• the financial statements and notes for the financial year give a true and fair view;
(3) in the directors’ opinion, there are reasonable grounds to believe that the Company will be able to pay its debts as and when they become due and payable.
The Board has received assurance from the CEO and the Company Secretary that the declaration is founded on a sound system of risk management and internal control and that system is operating effectively in all material respects in relation to financial reporting risks.
This declaration is made in accordance with a resolution of the Board of directors.
Brenton Barnes Catherine Costello Director Chairman
Dated at Adelaide this 27th day of September 2018.
Annual Report 2018
54
For
per
sona
l use
onl
y

Independent Auditor’s Report To the members of LBT Innovations Limited
REPORT ON THE AUDIT OF THE FINANCIAL REPORT Opinion We have audited the financial report of LBT Innovations Limited (“the Company”) which comprises the statement of financial position as at 30 June 2018, the statement of comprehensive income, the statement of changes in equity and the statement of cash flows for the year then ended, and notes to the financial statements, including a summary of significant accounting policies, and the directors’ declaration. In our opinion, the accompanying financial report of the Company is in accordance with the Corporations Act 2001, including:
a) giving a true and fair view of the Company financial position as at 30 June 2018 and of its financial performance for the year then ended; and
b) complying with Australian Accounting Standards and the Corporations Regulations 2001.
Basis for Opinion We conducted our audit in accordance with Australian Auditing Standards. Our responsibilities under those standards are further described in the Auditor’s Responsibilities for the Audit of the Financial Report section of our report. We are independent of the Company in accordance with the auditor independence requirements of the Corporations Act 2001 and the ethical requirements of the Accounting Professional and Ethical Standards Board’s APES 110 Code of Ethics for Professional Accountants (“the Code”) that are relevant to our audit of the financial report in Australia. We have also fulfilled our other ethical responsibilities in accordance with the Code. We believe that the audit evidence we have obtained is sufficient and appropriate to provide a basis for our opinion. Key Audit Matters Key audit matters are those matters that, in our professional judgement, were of most significance in our audit of the financial report for the current period. These matters were addressed in the context of our audit of the financial report as a whole, and in forming our opinion thereon, and we do not provide a separate opinion on these matters.
Independent Auditor’s Report
55
Independent Auditor’s Report
For
per
sona
l use
onl
y

Key Audit Matter How our audit addressed the key audit matter
Impairment of Intangible Assets
The Company’s intangible assets totalled $18,122,000 representing the capitalised development costs in respect of APAS. Under Australian Accounting Standards, an entity shall assess throughout the reporting period whether there is any indication than an asset may be impaired. If any such indication exists, an entity shall estimate the recoverable amount of the asset. Additionally, intangible assets that are not yet available for use must be tested for impairment annually. As APAS is still in the development phase, the Company is required to test annually for impairment by comparing its recoverable amount with its carrying value. The impairment testing process is complex and highly judgemental and is based on assumptions and estimates that are affected by expected future performance and market conditions.
Our procedures included but were not limited to the following:
▪ obtaining the impairment assessment and impairment model prepared by management, and approved by the Audit Committee, and performing the following:
▪ testing the mathematical accuracy of the model;
▪ evaluating and assessing the key assumptions and estimates used in the model
▪ performing sensitivity analysis on the key assumptions and assessing the effect on the carrying value;
▪ gaining an understanding of the development and marketing activity of the APAS product and the requirements prior to the product being declared as ready for use.
▪ Considering the adequacy of the financial report disclosure regarding impairment and the carrying value of APAS.
Information Other than the Financial Report and Auditor’s Report Thereon The directors are responsible for the other information. The other information comprises the information included in the Company’s annual report for the year ended 30 June 2018, but does not include the financial report and our auditor’s report thereon. Our opinion on the financial report does not cover the other information and accordingly we do not express any form of assurance conclusion thereon. In connection with our audit of the financial report, our responsibility is to read the other information and, in doing so, consider whether the other information is materially inconsistent with the financial report or our knowledge obtained in the audit or otherwise appears to be materially misstated. If, based on the work we have performed, we conclude that there is a material misstatement of this other information, we are required to report that fact. We have nothing to report in this regard.
Annual Report 2018
56
Independent Auditor’s Report
For
per
sona
l use
onl
y

Responsibilities of the Directors for the Financial Report The directors of the Company are responsible for the preparation of the financial report that gives a true and fair view in accordance with Australian Accounting Standards and the Corporations Act 2001 and for such internal control as the directors determine is necessary to enable the preparation of the financial report that gives a true and fair view and is free from material misstatement, whether due to fraud or error. In preparing the financial report, the directors are responsible for assessing the ability of the Company to continue as a going concern, disclosing, as applicable, matters related to going concern and using the going concern basis of accounting unless the directors either intend to liquidate the Company or to cease operations, or have no realistic alternative but to do so. Auditor’s Responsibilities for the Audit of the Financial Report Our objectives are to obtain reasonable assurance about whether the financial report as a whole is free from material misstatement, whether due to fraud or error, and to issue an auditor’s report that includes our opinion. Reasonable assurance is a high level of assurance, but is not a guarantee that an audit conducted in accordance with Australian Auditing Standards will always detect a material misstatement when it exists. Misstatements can arise from fraud or error and are considered material if, individually or in the aggregate, they could reasonably be expected to influence the economic decisions of users taken on the basis of this financial report.
As part of an audit in accordance with the Australian Auditing Standards, we exercise professional judgement and maintain professional scepticism throughout the audit. We also:
• Identify and assess the risks of material misstatement of the financial report, whether due to fraud
or error, design and perform audit procedures responsive to those risks, and obtain audit evidence that is sufficient and appropriate to provide a basis for our opinion. The risk of not detecting a material misstatement resulting from fraud is higher than for one resulting from error, as fraud may involve collusion, forgery, intentional omissions, misrepresentations, or the override of internal control.
• Obtain an understanding of internal control relevant to the audit in order to design audit procedures that are appropriate in the circumstances, but not for the purpose of expressing an opinion on the effectiveness of the Company’s internal control.
• Evaluate the appropriateness of accounting policies used and the reasonableness of accounting estimates and related disclosures made by the directors.
• Conclude on the appropriateness of the directors’ use of the going concern basis of accounting and, based on the audit evidence obtained, whether a material uncertainty exists related to events or conditions that may cast significant doubt on the Company’s ability to continue as a going concern. If we conclude that a material uncertainty exists, we are required to draw attention in our auditor’s report to the related disclosures in the financial report or, if such disclosures are inadequate, to modify our opinion. Our conclusions are based on the audit evidence obtained up to the date of our auditor’s report. However, future events or conditions may cause the Company to cease to continue as a going concern.
• Evaluate the overall presentation, structure and content of the financial report, including the disclosures, and whether the financial report represents the underlying transactions and events in a manner that achieves fair presentation.
We communicate with the directors regarding, among other matters, the planned scope and timing of the audit and significant audit findings, including any significant deficiencies in internal control that we identify during our audit.
Independent Auditor’s Report
57
Independent Auditor’s Report
For
per
sona
l use
onl
y

We also provide the directors with a statement that we have complied with relevant ethical requirements regarding independence, and to communicate with them all relationships and other matters that may reasonably be thought to bear on our independence, and where applicable, related safeguards. From the matters communicated with the directors, we determine those matters that were of most significance in the audit of the financial report of the current period and are therefore the key audit matters. We describe these matters in our auditor’s report unless law or regulation precludes public disclosure about the matter or when, in extremely rare circumstances, we determine that a matter should not be communicated in our report because the adverse consequences of doing so would reasonably be expected to outweigh the public interest benefits of such communication. REPORT ON THE REMUNERATION REPORT Opinion on the Remuneration Report We have audited the Remuneration Report included in pages 19 to 21 of the directors’ report for the year ended 30 June 2018. In our opinion, the Remuneration Report of LBT Innovations Limited for the year ended 30 June 2018 complies with section 300A of the Corporations Act 2001. Responsibilities The directors of the Company are responsible for the preparation and presentation of the Remuneration Report in accordance with section 300A of the Corporations Act 2001. Our responsibility is to express an opinion on the Remuneration Report, based on our audit conducted in accordance with Australian Auditing Standards. HLB Mann Judd Audit (SA) Pty Ltd Jon Colquhoun Chartered Accountants Director Adelaide, South Australia 27 September 2018
Annual Report 2018
58
Independent Auditor’s Report
For
per
sona
l use
onl
y

Statement of Issued Securities The total number of shareholders is 1,959 and there are 200,927,025 ordinary fully paid shares on issue.
Options Expiry date Number of holders Number on issue Number of restricted securities
Release date (if applicable)
30 November 2018 1 3,225,806 0 N/A
9 December 2018 66 11,292,505 0 N/A
24 August 2020 1 200,000 0 N/A
11 December 2023 1 100,000 0 N/A
11 April 2026 1 500,000 0 N/A
7 August 2026 1 1,500,000 0 N/A
22 December 2026 1 100,000 100,000 22 December 2018
28 February 2027 2 200,000 200,000 28 February 2019
30 November 2027 2 1,000,000 1,000,000 1 December 2019
Distribution of Securities
Equity DistributionNo of
Share-holders
No of Option-holders
Exp 30/11/18
Tranche 1 & 2 Options-
holders Exp
9/12/18
No of Option-holders
Exp 24/08/20
No of Option- holders
Exp 11/12/23
No of Option- holders
Exp 11/04/26
No of Option-holders
Exp 7/08/26
No of Option-holders
Exp 22/12/26
No of Option-holders
Exp 28/02/27
No of Option-holders
Exp 30/11/27
1 – 1,000 117 0 0 0 0 0 0 0 0 0
1,001 – 5,000 349 0 0 0 0 0 0 0 0 0
5,001 – 10,000 354 0 0 0 0 0 0 0 0 0
10,001 – 100,000 838 0 42 0 1 0 0 1 0 0
100,001 and over 301 1 24 1 0 1 1 0 2 2
1,959 1 66 1 1 1 1 1 2 2
The number of shareholdings held in less than marketable parcels is 397.
Shareholder Information
59
Shareholder InformationAs at 18 September 2018
For
per
sona
l use
onl
y

Substantial ShareholdersThere were no substantial holders as at 18 September 2018.
Voting RightsRefer to Note 12.
On Market Buy BackThere is no current on market buy back.
Top 20 Shareholders
Rank Name Number of Shares % of Shares
1 BIOMERIEUX SA\C 9,772,727 4.86
2 MR BRENDAN MORAN 8,143,206 4.05
3 Z & F INTERNATIONAL TRADING LIMITED 6,451,613 3.21
4 MR ROBERT ANDREW FINDER + MRS SHERYL JEAN FINDER 5,401,665 2.69
5 <SHERROB9 S/F A/C> 5,367,724 2.67
6 HSBC CUSTODY NOMINEES (AUSTRALIA) LIMITED 4,207,108 2.09
7 MR HUGH BERKELEY GUTHRIE + MRS LUCYNA HALINA GUTHRIE 3,618,688 1.80
8 <PODLASKA SUPER A/C> 3,553,913 1.77
9 AVANTEOS INVESTMENTS LIMITED <1823201 SUPERANNUATION A/C> 3,333,334 1.66
10 AVANTEOS INVESTMENTS LIMITED <1823205 SUPERANNUATION A/C> 3,133,334 1.56
11 ILWELLA PTY LTD 2,848,262 1.42
12 MR PAUL COZZI 2,700,000 1.34
13 RUIN PTY LTD <STEVE MATHWIN SUPER A/C> 2,666,667 1.33
14 MR DAVID CATTUZZO + MRS ELIZABETH CATTUZZO 2,630,000 1.31
15 PLANET INNOVATION PTY LTD 2,470,000 1.23
16 MAZONI PTY LTD <THE UTIGER SUPER FUND A/C> 2,036,942 1.01
17 MR RICHARD ANTHONY EARP 1,970,906 0.98
18 CITICORP NOMINEES PTY LIMITED 1,700,000 0.85
19 CHAG PTY LTD 1,666,667 0.83
20 MR STEPHEN GOODWIN 1,666,667 0.83
75,339,423 37.50
Annual Report 2018
60
For
per
sona
l use
onl
y

Top 20 Option‑holders (not listed)
Rank Name Number of Options % of Options
1 Z & F INTERNATIONAL TRADING LIMITED 3,225,806 17.80
2 MERRILL LYNCH (AUSTRALIA) NOMINEES PTY LIMITED 1,899,955 10.49
3 MR BRENTON JOHN BARNES 1,500,000 8.28
4 PA & A BEALE INVESTMENTS PTY LTD <PA & A BEALE SUPER FUND A/C> 1,500,000 8.28
5 MR BRENDAN MORAN 967,700 5.34
6 MR PETER BRADLEY 600,000 3.31
7 MR RICHARD ANTHONY EARP 548,350 3.03
8 CHAG PTY LTD 528,590 2.92
9 J P MORGAN NOMINEES AUSTRALIA LIMITED 507,061 2.80
10 ALLEGRA VENTURES PTY LTD <GEE SUPER FUND A/C> 500,000 2.76
11 MATTHEW MICHALEWICZ 500,000 2.76
12 FIFTY SECOND CELEBRATION PTY LTD <MCBAIN FAMILY A/C> 353,060 1.95
13 AVANTEOS INVESTMENTS LIMITED <1823205 SUPERANNUATION A/C> 322,550 1.78
14 MR JUSTIN PETER MORAN 241,900 1.34
15 RACT SUPER PTY LTD <RAND SUPER FUND A/C> 226,575 1.25
16 HSBC CUSTODY NOMINEES (AUSTRALIA) LIMITED - A/C 2 213,905 1.18
17 SPICEME CAPITAL PTY LTD 211,837 1.17
18 MR JOHN GLASSON 200,000 1.10
19 ACCBELL NOMINEES PTY LTD 189,296 1.04
20 NORTH OF THE RIVER INVESTMENTS PTY LTD 180,409 1.00
14,416,994 79.57
Register of SecuritiesThe register of securities is located at:Computershare Investor Services Pty Limited GPO Box 1903 Adelaide, South Australia 5001, Australia
Enquiries (within Australia) 1300 729 063 Enquiries (outside Australia) +61 3 9415 4675 Facsimile +61 8 8236 2305
[email protected] www.computershare.com.au
61
Shareholder InfomationF
or p
erso
nal u
se o
nly

For
per
sona
l use
onl
y