for personal use only2017/02/23 · transfer of the head leases —a commitment by ardent to...
TRANSCRIPT

ARDENT LEISURE GROUPHalf-Year 2017
Results Presentation
For
per
sona
l use
onl
y
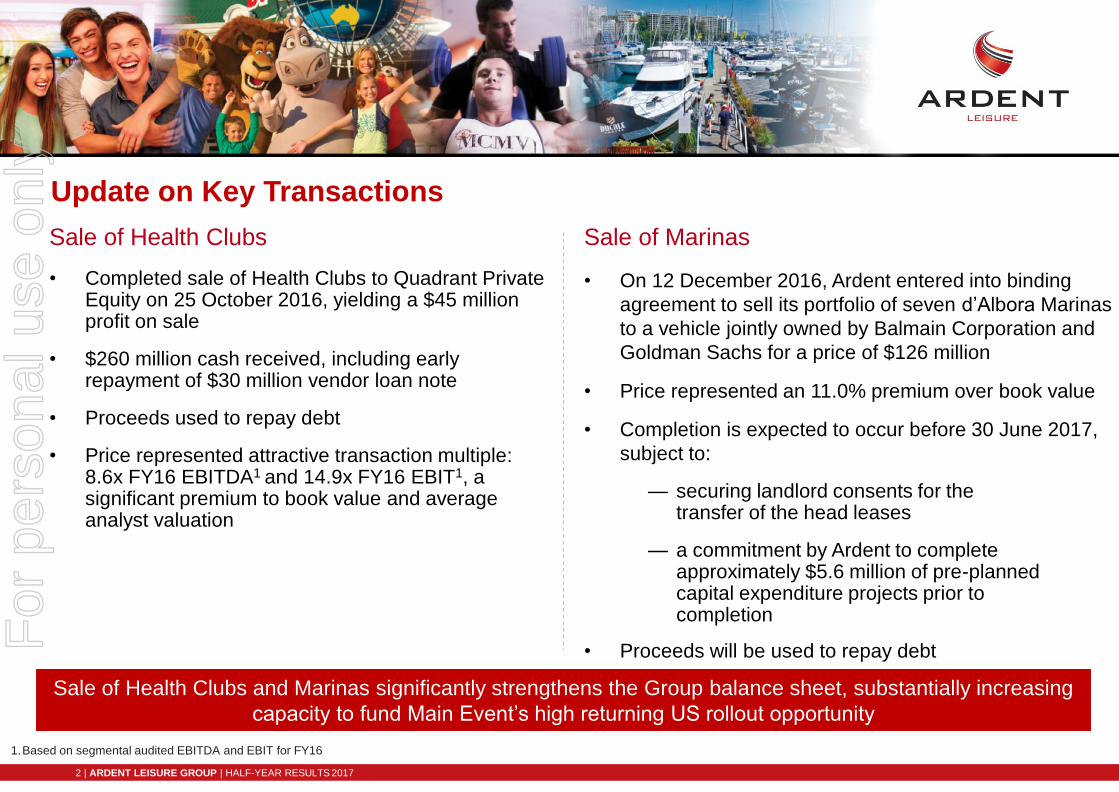
Update on Key Transactions
2 | ARDENT LEISURE GROUP | HALF-YEAR RESULTS 2017
Sale of Health Clubs
• Completed sale of Health Clubs to Quadrant Private Equity on 25 October 2016, yielding a $45 million profit on sale
• $260 million cash received, including early repayment of $30 million vendor loan note
• Proceeds used to repay debt
• Price represented attractive transaction multiple: 8.6x FY16 EBITDA1 and 14.9x FY16 EBIT1, a significant premium to book value and average analyst valuation
Sale of Marinas
• On 12 December 2016, Ardent entered into binding
agreement to sell its portfolio of seven d’Albora Marinas
to a vehicle jointly owned by Balmain Corporation and
Goldman Sachs for a price of $126 million
• Price represented an 11.0% premium over book value
• Completion is expected to occur before 30 June 2017,
subject to:
— securing landlord consents for the transfer of the head leases
— a commitment by Ardent to complete approximately $5.6 million of pre-planned capital expenditure projects prior to completion
• Proceeds will be used to repay debt
1.Based on segmental audited EBITDA and EBIT for FY16
Sale of Health Clubs and Marinas significantly strengthens the Group balance sheet, substantially increasing
capacity to fund Main Event’s high returning US rollout opportunity
For
per
sona
l use
onl
y

Group Strategy
Main Event Bowling and Games Theme Parks
Execute on full potential of US family
entertainment centre concept
Create a multi-attraction entertainment
experience
Drive customer attendance and spend by
creating unique attractions and experiences
• Accelerate growth towards long term
opportunity of approximately 200 US centres
• Continued focus on product and facility
enhancement to underpin constant centre
revenue growth, including an update /
refurbishment of nine original centres
• Disciplined investment in select new multi-
attraction centres and refurbishments
• Continued roll-out of Playtime amusement
centres in prime shopping mall locations
• Progressive divestment of underperforming,
low-potential AMF locations
• Disciplined investment in new precincts,
experiences and products
• Utilise technology to improve customer
experience
• Capitalise on positive domestic and
international Gold Coast tourist trends
Synergy across portfolio
Optimal / disciplined capital investment
“A focused portfolio of market-leading entertainment experiences”
3 | ARDENT LEISURE GROUP | HALF-YEAR RESULTS 2017
For
per
sona
l use
onl
y

Health Club and Marina Sales Reposition Ardent as a Pure Entertainment Company Anchored by High Growth US Business
1.Pro-forma adjustments to reflect the divestment of Health Clubs and Marinas, as if completed prior to HY17
EBITDA Contribution
HY17 HY17PF1
EBITDA Contribution
4 | ARDENT LEISURE GROUP | HALF-YEAR RESULTS2017
Main Event, 46%
Marinas, 9%
Theme Parks, 11%
Health Clubs, 18%
Bowling and Games, 16%
Main Event, 63%
Theme Parks, 15%
Bowling and Games, 22%
For
per
sona
l use
onl
y

HY17 Result Impacted by Number of Significant One-off Events
5 | ARDENT LEISURE GROUP | HALF-YEAR RESULTS2017
• Closure of Dreamworld/ WhiteWater World for 45 days following Thunder River Rapids Ride incident and significantly reduced attendance upon re-opening
• Completion of Health Clubs sale on 25 October 2016, resulting in the loss of more than two months’ earnings from that business in HY17 compared to HY16
• Closure of Kingpin Crown, the most profitable venue in the Bowling and Games division, for five months due to refurbishment
• The EBITDA impact of these events on the HY17 core earnings result is estimated to be between $21 million and $22 million1
• In addition, Statutory Profit was impacted by $95.2 million2 of property, plant and equipment write down, goodwill impairment and incident costs relating to Dreamworld/ WhiteWater World, partially offset by a $45 million gain on the sale of Health Clubs
1.Represents the difference between an estimate of actual EBITDA achieved in the affected period in HY17 and actual EBITDA in the corresponding period of HY16
2.Refer Appendix 2 for further details
For
per
sona
l use
onl
y

HY17 Financial Summary
Movement based on prior corresponding period (pcp)1.From operational activities excluding property revaluations, gains on derivative financial instruments, interest income, business acquisition costs and gains on sale and leaseback of family entertainment
centres.2.EBITDA excluding pre-opening expenses, straight lining of fixed rent increases, IFRS depreciation, amortisation of health clubs intangible assets, impairment of property plant and equipment and
intangible assets, increase/ decrease in onerous leases provisions, property revaluations, unrealised gains/ losses on derivative financial instruments, loss on closure of bowling centres, gain on sale and leaseback of family entertainment centres, business acquisition costs refunded/ paid, selling costs associated with sale discontinued operation classified as held for sale, profit on sale of discontinued operation (net of selling costs), Dreamworld incident costs and the tax associated with these transactions.
3.Refer to Appendix 2 for further details.
6 | ARDENT LEISURE GROUP | HALF-YEAR RESULTS2017
HY17 HY16
Revenue1 $317.2m $333.8m
Core EBITDA2 $45.2m $63.8m
Core earnings2 $12.8m $30.5m
Statutory (loss)/profit ($49.4)m $22.7m
Impact of Dreamworld incident3 ($95.2)m -
Statutory profit excluding impact of
Dreamworld incident3 $45.8m $22.7m
Core EPS2 2.74c 6.84c
DPS 2.00c 7.00cFor
per
sona
l use
onl
y

HY17 Key Messages
Delivered shareholder value by selling Health Clubs and Marinas for substantial
premiums to book value and prices that exceeded market expectations
Theme Parks recovering with gradual return in visitation to Dreamworld driven by thrill ride re-
openings and successful launch of Australia’s largest LEGO® Retail Store
New centre openings continue to drive Main Event growth, with US$ EBITDA up 20.6%
on the prior half year
Bowling & Games delivered its sixth consecutive quarter of constant centre revenue growth,
validating the strategy to transition that business to multi-attraction entertainment
Main Event’s national US rollout opportunity supported by new centres continuing to deliver
average first year EBITDA ROI’s exceeding 30%
Stronger berthing occupancy and yield per berth delivered 10.2% EBITDA growth in the Marinas division over the prior half year
Balance sheet significantly strengthened as a result of the Health Club and Marina sales, providing substantially increased capacity to fund Main Event’s growth
7 | ARDENT LEISURE GROUP | HALF-YEAR RESULTS2017
For
per
sona
l use
onl
y

Main Event EntertainmentFor
per
sona
l use
onl
y

9 | ARDENT LEISURE GROUP | HALF-YEAR RESULTS2017
Main Event Entertainment
US$’000 HY17 HY16 % Change
Total revenue 102,061 75,503 35.2%
EBRITDA (ex pre-opening) 31,284 24,703 26.6%
Operating margin 30.7% 32.7%
Property costs (ex straight line rent) (13,122) (9,643) 36.1%
EBITDA 18,162 15,060 20.6%
EBITDA margin 17.8% 19.9%
Constant centre revenue 67,978 70,014 (2.9%)
For
per
sona
l use
onl
y

Significant Revenue and Earnings Growth
12 1214 15 15
6
1216
0
5
10
15
20
25
30
35
FY13 FY14 FY15 FY16 HY17
Nu
mb
er
of C
en
tre
s
Significant Expansion of Portfolio Size and US Footprint Outside of Texas
Texas Outside Texas
31
1213
20
27
1
1.Hoffman Estates, IL, Olathe, KS, Orlando, FL, Suwanee, GA opened during H1
• Revenue up 35.2%, EBITDA up 20.6% driven by 11 new openings since November 2015
• Rollout of 11 centres in FY17 remains on track with four openings in the first half 1, and seven scheduled for the second half, including Jacksonville, FL which opened on 7 February 2017
• Continued geographic diversification outside of Texas, with Main Event now operating 32 centres across 12 states
• HY17 margins impacted by:
• Decline in constant centre revenue
• Revenue decreases in new centres that experienced
strong honeymoon periods in HY16
• Higher initial operating costs in new centres
• Slower revenue ramp up in new markets
• Expanded marketing budget to support national rollout
• Margin compression was partly offset by efficiencies in food cost
of sales through the implementation of a back office system
10 | ARDENT LEISURE GROUP | HALF-YEAR RESULTS 2017
For
per
sona
l use
onl
y

New Centres Continue to Exceed Target Returns, Supporting National Rollout1
• New centres opened between FY12 and FY16 have exceeded average first year EBITDA ROI target of 30%
4 7 7Centres opened
Target ROI: 30%
11 | ARDENT LEISURE GROUP | HALF-YEAR RESULTS 2017
40.0% 38.6%
FY12 - FY14 FY15 FY16E
On track to return >30%
average first year
EBITDA ROI
1.Calculated as aggregate first Full Year EBITDA/ net investment of new centres opened by financial year, on a leasehold development basis
2.The average first year EBITDA ROI for FY16 is an estimate because five of the seven new centres during that year were opened between February and June 2016 and therefore have not been open for 12 months at the HY17 result
2
For
per
sona
l use
onl
y

Debut of New-Look Design
12 | ARDENT LEISURE GROUP | HALF-YEAR RESULTS 2017
The first half included the debut of a prototype design package
For
per
sona
l use
onl
y

US$’000HY17
Revenue
HY16
Revenue
%
Change
HY17
EBRITDA
HY16
EBRITDA
%
Change
Constant centres 67,978 70,014 (2.9%) 27,560 29,144 (5.4%)
New centres1 34,083 5,489 520.9% 12,675 2,291 453.3%
Corporate & Regional
Expenses2 (8,951) (6,732) 33.0%
Total 102,061 75,503 35.2% 31,284 24,703 26.6%
1.New centres Tulsa, OK (opened April 2015), Independence, MO (opened November 2015), Memphis, TN (opened December 2015), Avondale, AZ (opened February 2016), Fort Worth North, TX (opened February 2016), Louisville, KY (opened March 2016), West Chester, OH (opened May 2016), Albuquerque, NM (opened June 2016), Hoffman Estates, IL (opened August 2016), Olathe, KS (opened October 2016), Orlando, FL (opened November 2016), Suwanee, GA (opened December 2016)
2.Cost uplift due to increase in support centre and regional headcount to support Main Event’s growth
13 | ARDENT LEISURE GROUP | HALF-YEAR RESULTS 2017
Main Event Entertainment
For
per
sona
l use
onl
y

14 | ARDENT LEISURE GROUP | HALF-YEAR RESULTS 2017
Constant Centre Revenue Performance
• Constant centre revenue was down 2.9% for the half year, affected by:
— Weak consumer discretionary environment, reflected by slowing restaurant sales trends1
— Competitive intrusion in mature Main Event markets
— The opening of new centres in existing core markets to dominate the territory – cluster markets2
— Cautious corporate spend, particularly in oil industry Oklahoma and Houston markets
• Post election trading saw constant centres comparing positively in December 2016, assisted by a shift in the timing of school holidays3
• December 2016 and January 2017 combined were down 4.1% on the prior corresponding period
10.6%
9.0%
4.5% 4.5%
8.3%
(1.7%) (2.9%)(2.0%)
-
2.0%
4.0%
6.0%
8.0%
10.0%
12.0%
FY11 FY12 FY13 FY14 FY15 FY16 HY17
Constant Centre Revenue Trends
1. Data from Miller Pulse shows that same store restaurant sales trends in the US have slowed during the course of calendar 2016, impacted by a combination of uncertainty around the US presidential election, lower grocery prices and increased supply of units in the restaurant industry
2. Four new Main Event centres opened in constant centre trade areas over the past 11 months: Avondale, AZ and Forth Worth North, TX (February 2016), Hoffman Estates, IL (August 2016) and Suwanee, GA (December 2016)
3. Christmas school holidays were from 19 December 2016 to 1 January 2017 compared to 23 December 2015 to 6 January 2016 in the last financial year
2.0%
-2.4%
-1.5%
(2.5%)
(1.5%)
(0.5%)
0.5%
1.5%
2.5%
De
c-1
5
Jan-1
6
Feb
-16
Ma
r-16
Apr-1
6
Ma
y-1
6
Jun-1
6
Jul-1
6
Aug-1
6
Sep-1
6
Oct-1
6
No
v-1
6
De
c-1
6
Jan-1
7
US Restaurant Same Store Sales1
For
per
sona
l use
onl
y
15 | ARDENT LEISURE GROUP | HALF-YEAR RESULTS 2017
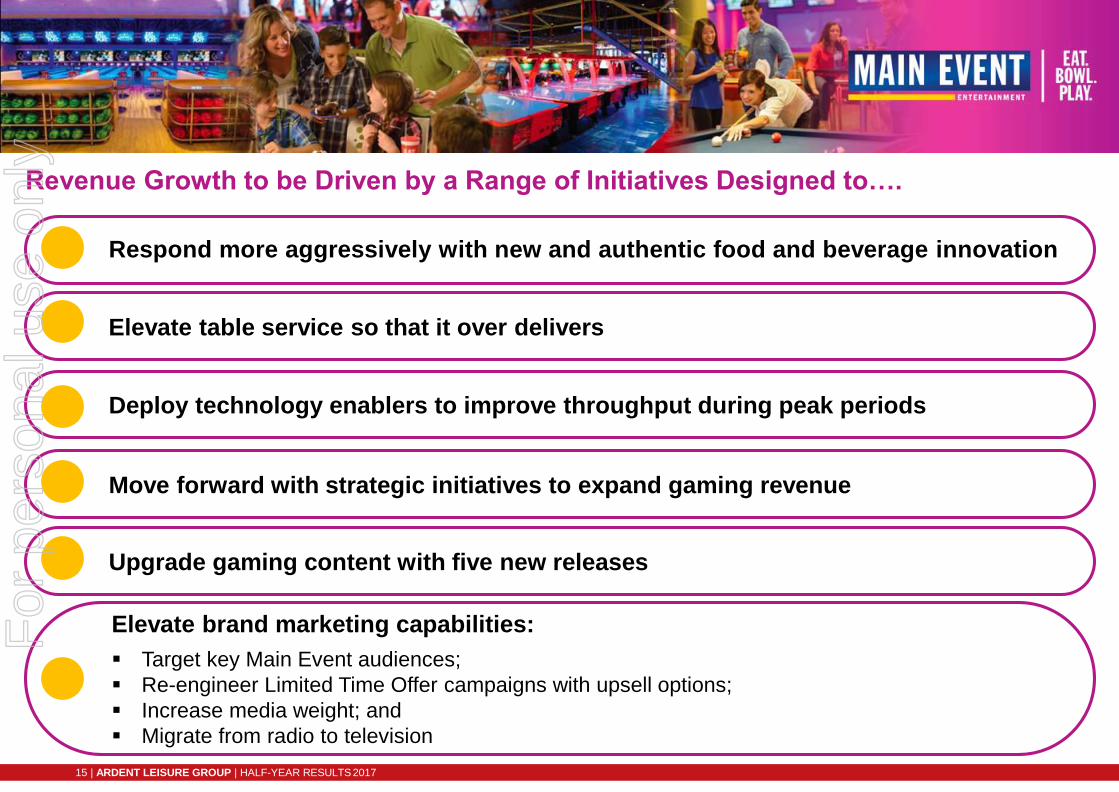
Deploy technology enablers to improve throughput during peak periods
Respond more aggressively with new and authentic food and beverage innovation
Move forward with strategic initiatives to expand gaming revenue
Elevate table service so that it over delivers
Upgrade gaming content with five new releases
Elevate brand marketing capabilities:
Target key Main Event audiences;
Re-engineer Limited Time Offer campaigns with upsell options;
Increase media weight; and
Migrate from radio to television
Revenue Growth to be Driven by a Range of Initiatives Designed to….
For
per
sona
l use
onl
y

Sales and Marketing
• Original fleet of nine centres to be completed
• Remodelled centres include:
— New exteriors and new branding
— Expanded dining areas with contemporary décor and improved lighting
— Redesigned sports watching bar
— Refurbished meeting and birthday party rooms to drive events revenue
• VIP private bowling area for premium events
• Remodelling of Plano, TX completed in January 2017. At least two more scheduled for the second half of FY17
• Three to four remodels scheduled for FY18
16 | ARDENT LEISURE GROUP | HALF-YEAR RESULTS 2017
Remodelling Program of 9 Original
Centres Initiated in Q2Exteriors Before Remodel and After Remodel
Remodeled Sports Bars
For
per
sona
l use
onl
y

Outlook: Ongoing Development to Drive Meaningful Growth• Momentum to continue in second half, with Jacksonville,
FL opened in February and a further six new openings scheduled for Q4
• Six of the second half new centres will be outside Texas, creating further geographic diversification. Includes entryinto two new states - Indiana and Pennsylvania
• Targeting at least 11 new centres for FY18, including first US mall location
• Disciplined growth plan targeting major US markets with cluster development
• Several key senior appointments made to support the business moving forward
• Macro environment for restaurants likely to remain challenging
• Headwinds include increased labour costs with the increased minimum wage and insurance costs
• Offsetting these are a potential reduction in the corporate and personal tax rates under Trump tax reform proposals
27 27
38
11
0
5
10
15
20
25
30
35
40
45
50
FY16 FY17 Planned FY18 Planned
Nu
mb
er
of C
en
tre
s
Targeted Portfolio Growth of Portfolio
Existing New
≥ 11
1
1.11 centres were planned to open throughout FY17. As of February 2017, five centres have been opened.
17 | ARDENT LEISURE GROUP | HALF-YEAR RESULTS 2017
For
per
sona
l use
onl
y

Main Event Portfolio and Development Sites
23 13
27
24 1 9
4 2 3
5
71211
19
20
6
16 10
15
8
21
17
25
26
14
18
29
28
30
31
22
18 | ARDENT LEISURE GROUP | HALF-YEAR RESULTS 2017
Existing Sites
1. Lewisville, TX 8. Lubbock, TX 15. Pharr, TX 22. Memphis, TN 29. Olathe, KS
2. Grapevine, TX 9. Frisco, TX 16. San Antonio (W), TX 23. Avondale, AZ 30. Suwanee, GA
3. Plano, TX 10. San Antonio (N), TX 17. Warrenville, IL 24. Ft Worth (North), TX 31. Orlando, FL
4. Ft Worth (South), TX 11. Katy, TX 18. Atlanta, GA 25. Louisville, KY 32. Jacksonville, FL
5. Shenandoah, TX 12. Stafford, TX 19. Oklahoma City, OK 26. West Chester, OH (opened Feb 17)
6. Austin (North), TX 13. Tempe, AZ 20. Tulsa, OK 27. Albuquerque, NM
7. Webster, TX 14. Alpharetta, GA 21. Independence, MO 28. Hoffman Estates, IL
New Centres Under Construction
33. Indianapolis, IN 36. Humble, TX
34. Pittsburgh, PA 37. Gilbert, AZ
35. Kansas City, MO 38. Knoxville, TN
32
33
34
35
36
37
38
For
per
sona
l use
onl
y

Theme Parks
For
per
sona
l use
onl
y

Theme Parks
20 | ARDENT LEISURE GROUP | HALF-YEAR RESULTS 2016
$’000 HY17 HY16 % Change
Total revenue 41,775 58,388 (28.5%)
EBRITDA 6,380 21,832 (70.8%)
Operating margin 15.3% 37.4%
Property costs (506) (626) (19.2%)
EBITDA 5,874 21,206 (72.3%)
EBITDA margin 14.1% 36.3%
Attendance 906,378 1,243,832 (27.1%)
• Result impacted by tragic incident on Thunder River Rapids Ride at Dreamworld on 25 October 2016
resulting in the loss of four lives
• Theme Park and Water Park closed on the day of incident and re-opened on 10 December 2016
• Maintained staff payments and contractual business commitments during closure
For
per
sona
l use
onl
y

Pre-Tragedy and Park Closure
21 | ARDENT LEISURE GROUP | HALF-YEAR RESULTS 2016
• Dreamworld tracking 4.4% positive to prior year in revenue
• Re-opening of $7 million refurbished Tiger Island facility in September 2016
• First Australian theme park to launch Virtual Reality (VR) experience on Mick DoohanMotocoaster ride
• First indigenous VR experience launched at Dreamworld CorroboreeF
or p
erso
nal u
se o
nly
Safety Review, Customer and Partner Support
22 | ARDENT LEISURE GROUP | HALF-YEAR RESULTS 2016
• Dreamworld has permanently de-commissioned the Thunder River Rapids Ride
• Dreamworld commissioned a multi-tiered operational and safety review on all rides and slides, using national and international accredited engineering experts
• All Big Nine Thrill rides have been reviewed and are operational
• Refunds offered to passholders post incident, taken up by less than 10% of passholderbase
• Season passes extended by six months to compensate passholders for park and ride closures and protect customer loyalty base
• Continued support from business partners, including DreamWorks, ABC Kids, Mattel and LEGO, throughout closure and re-opening
For
per
sona
l use
onl
y

Re-opening, Recovery and Consumer Confidence
23 | ARDENT LEISURE GROUP | HALF-YEAR RESULTS 2016
• Park opened with a Charity Weekend on 10 December - all monies raised donated to Red Cross and Givit appeal
• Thrill rides progressively re-introduced on completion of multi-tiered operational and safety review
• Focus on guest experience and entertainment with additional shows added to the park schedule
• New Tiger Island including refreshed retail and food precinct proved hugely popular with guests and events and increased patron dwell times
• Extended summer holiday trading hours from 9am to 9pm were received favourably by park guests and supported by a full entertainment programme including:
• The Fire Machine - a sound, laser and pyrotechnics show (created by the ‘Vivid’ Sydney team)
• Kevil Hill - a zombie themed walk through maze, very popular with our teen and family market
For
per
sona
l use
onl
y
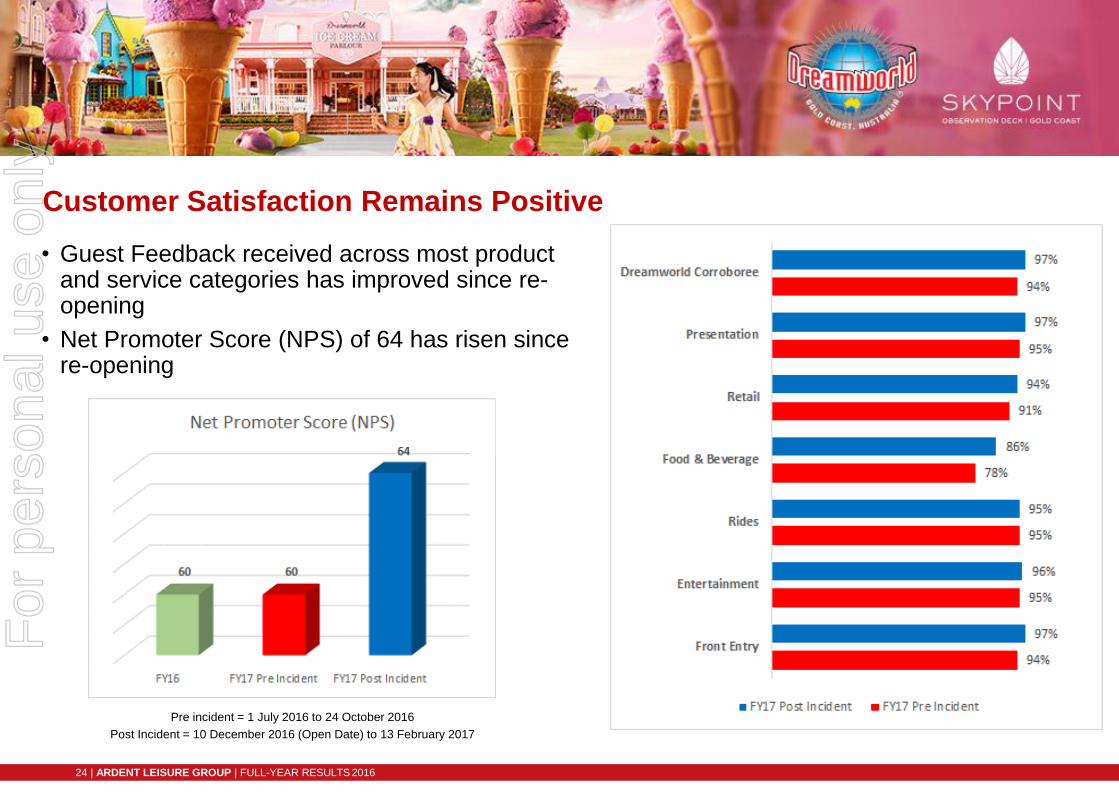
Customer Satisfaction Remains Positive
24 | ARDENT LEISURE GROUP | FULL-YEAR RESULTS 2016
• Guest Feedback received across most product and service categories has improved since re-opening
• Net Promoter Score (NPS) of 64 has risen since re-opening
Pre incident = 1 July 2016 to 24 October 2016
Post Incident = 10 December 2016 (Open Date) to 13 February 2017
For
per
sona
l use
onl
y
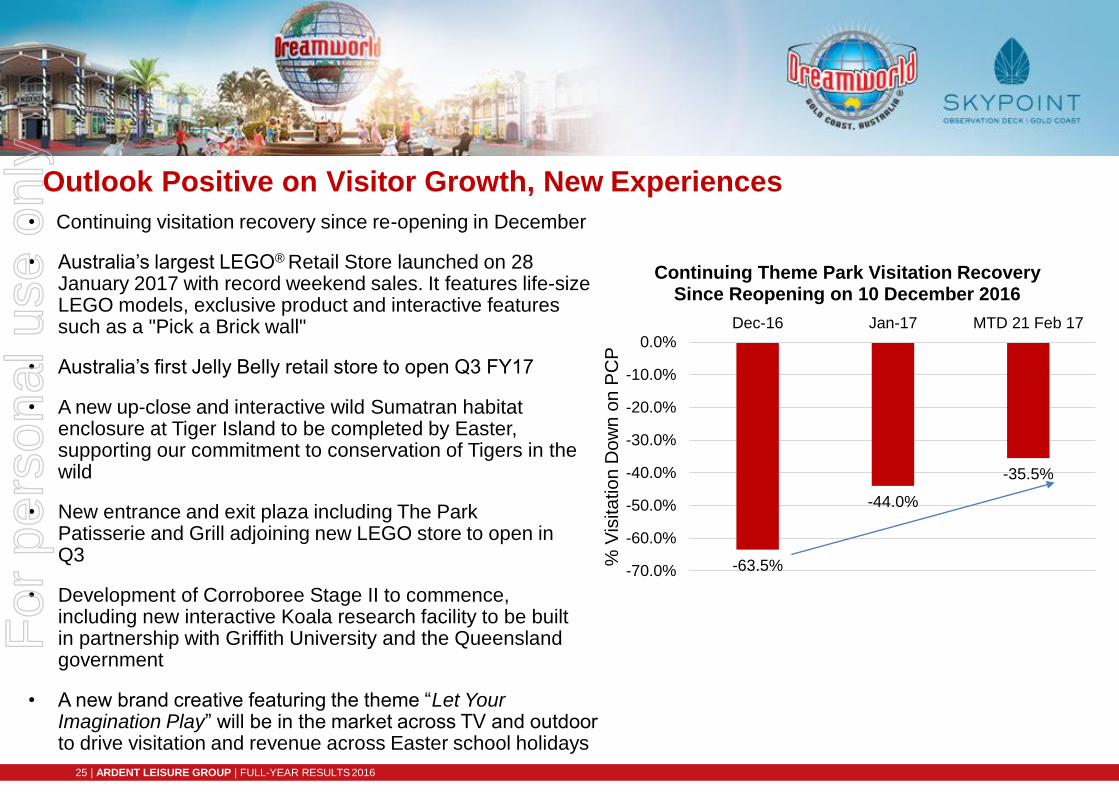
Outlook Positive on Visitor Growth, New Experiences
25 | ARDENT LEISURE GROUP | FULL-YEAR RESULTS 2016
• Continuing visitation recovery since re-opening in December
• Australia’s largest LEGO® Retail Store launched on 28 January 2017 with record weekend sales. It features life-sizeLEGO models, exclusive product and interactive features such as a "Pick a Brick wall"
• Australia’s first Jelly Belly retail store to open Q3 FY17
• A new up-close and interactive wild Sumatran habitat enclosure at Tiger Island to be completed by Easter, supporting our commitment to conservation of Tigers in the wild
• New entrance and exit plaza including The Park Patisserie and Grill adjoining new LEGO store to open in Q3
• Development of Corroboree Stage II to commence, including new interactive Koala research facility to be built in partnership with Griffith University and the Queensland government
• A new brand creative featuring the theme “Let Your Imagination Play” will be in the market across TV and outdoor to drive visitation and revenue across Easter school holidays
-63.5%
-44.0%
-35.5%
-70.0%
-60.0%
-50.0%
-40.0%
-30.0%
-20.0%
-10.0%
0.0%
Dec-16 Jan-17 MTD 21 Feb 17
% V
isita
tio
n D
ow
n o
n P
CP
Continuing Theme Park Visitation Recovery Since Reopening on 10 December 2016
For
per
sona
l use
onl
y

26 | ARDENT LEISURE GROUP | HALF-YEAR RESULTS 2016
For
per
sona
l use
onl
y

27 | ARDENT LEISURE GROUP | HALF-YEAR RESULTS 2016
For
per
sona
l use
onl
y

Bowling & Games
For
per
sona
l use
onl
y
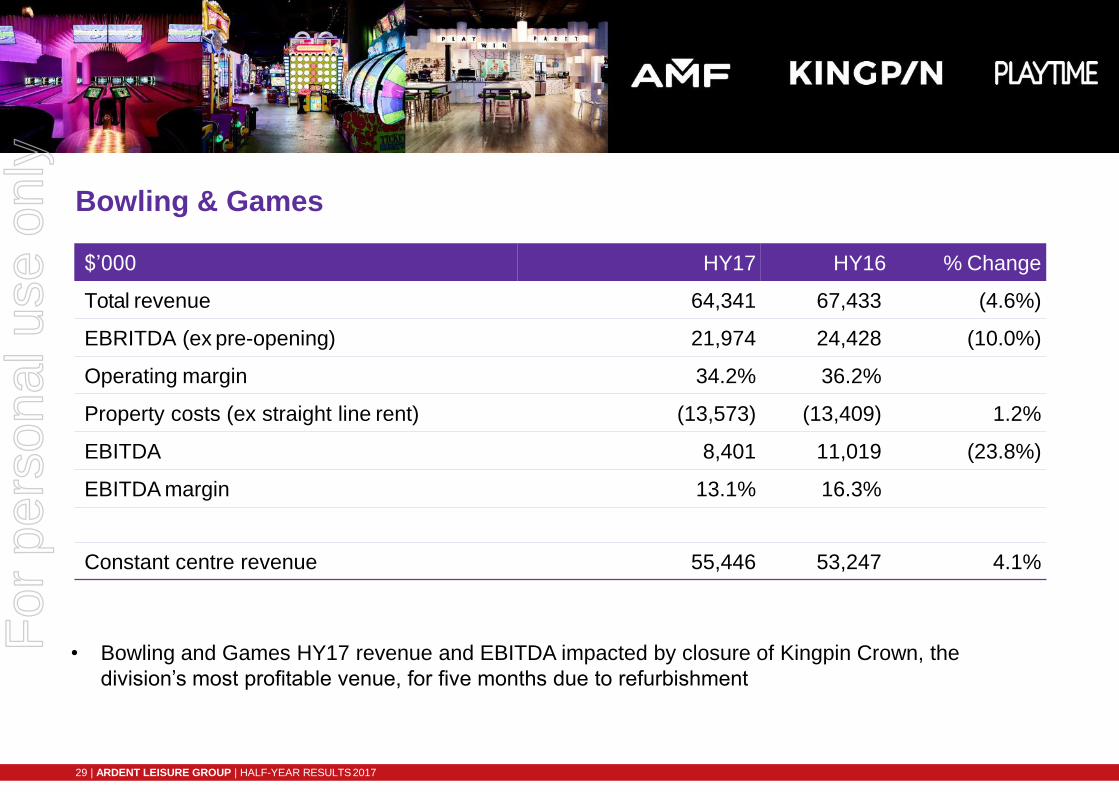
Bowling & Games
$’000 HY17 HY16 % Change
Total revenue 64,341 67,433 (4.6%)
EBRITDA (ex pre-opening) 21,974 24,428 (10.0%)
Operating margin 34.2% 36.2%
Property costs (ex straight line rent) (13,573) (13,409) 1.2%
EBITDA 8,401 11,019 (23.8%)
EBITDA margin 13.1% 16.3%
Constant centre revenue 55,446 53,247 4.1%
29 | ARDENT LEISURE GROUP | HALF-YEAR RESULTS 2017
• Bowling and Games HY17 revenue and EBITDA impacted by closure of Kingpin Crown, the
division’s most profitable venue, for five months due to refurbishment
For
per
sona
l use
onl
y

Bowling & Games
$’000HY17
Revenue
HY16
Revenue
%
Change
HY17
EBRITDA
HY16
EBRITDA
%
Change
Constant centres 55,446 53,247 4.1% 27,307 26,223 4.1%
Centres closed 855 1,921 (55.5%) 216 674 (68.0%)
New & renovation centres1 8,040 12,261 (34.4%) 3,939 6,563 (40.0%)
Corporate and regional
office expenses/sales
and marketing2
- 4 (100.0%) (9,488) (9,032) 5.0%
Total 64,341 67,433 (4.6%) 21,974 24,428 (10.0%)
30 | ARDENT LEISURE GROUP | HALF-YEAR RESULTS 2017
1.New centres include Playtime Highpoint acquired November 2014, AMF Revesby opened April 2015, Kingpin Darwin opened August 2015, Playtime Penrith acquired October 2015 and Playtime Miranda opened February 2016. Renovation Centre Kingpin Crown closed mid-July and re-opened December 2016.
2.Corporate costs increased due to expansion of national call centre, increases in marketing and IT spend.
For
per
sona
l use
onl
y
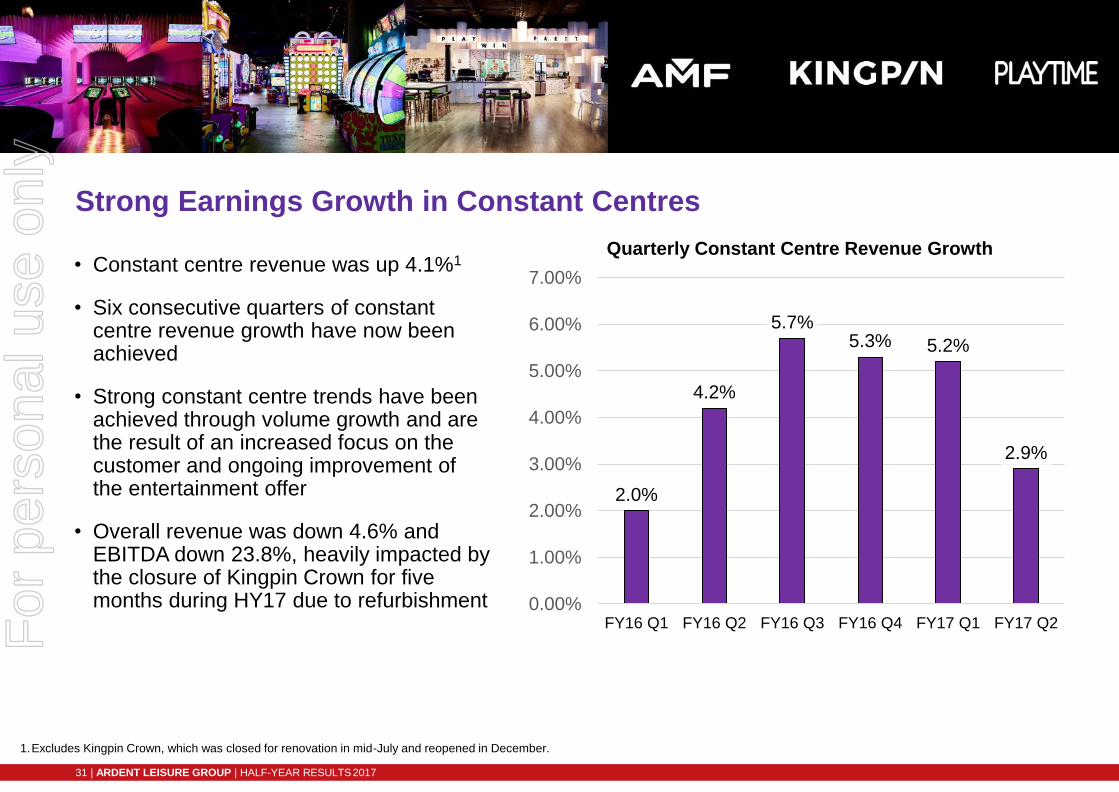
Strong Earnings Growth in Constant Centres
• Constant centre revenue was up 4.1%1
• Six consecutive quarters of constant centre revenue growth have now been achieved
• Strong constant centre trends have been achieved through volume growth and are the result of an increased focus on the customer and ongoing improvement of the entertainment offer
• Overall revenue was down 4.6% and EBITDA down 23.8%, heavily impacted by the closure of Kingpin Crown for five months during HY17 due to refurbishment
2.0%
4.2%
5.7%5.3% 5.2%
2.9%
0.00%
1.00%
2.00%
3.00%
4.00%
5.00%
6.00%
7.00%
FY16 Q1 FY16 Q2 FY16 Q3 FY16 Q4 FY17 Q1 FY17 Q2
Quarterly Constant Centre Revenue Growth
31 | ARDENT LEISURE GROUP | HALF-YEAR RESULTS 2017
1.Excludes Kingpin Crown, which was closed for renovation in mid-July and reopened in December.
For
per
sona
l use
onl
y
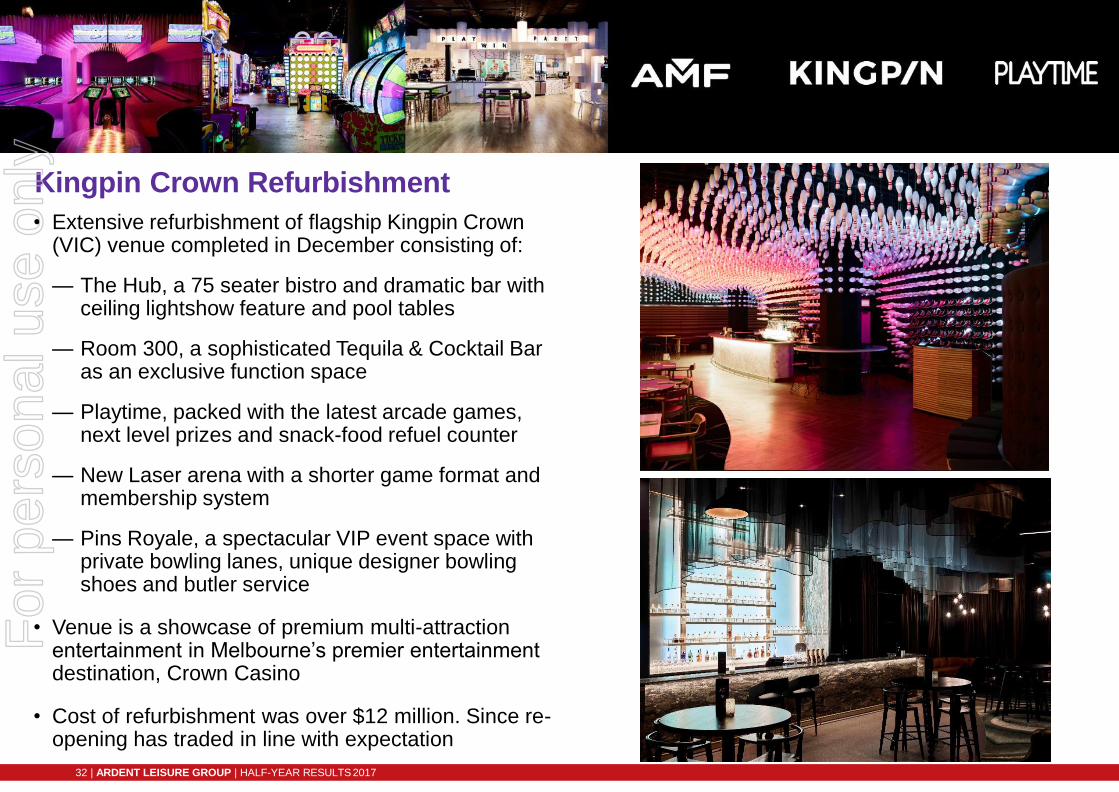
Kingpin Crown Refurbishment
• Extensive refurbishment of flagship Kingpin Crown (VIC) venue completed in December consisting of:
— The Hub, a 75 seater bistro and dramatic bar with ceiling lightshow feature and pool tables
— Room 300, a sophisticated Tequila & Cocktail Bar as an exclusive function space
— Playtime, packed with the latest arcade games, next level prizes and snack-food refuel counter
— New Laser arena with a shorter game format and membership system
— Pins Royale, a spectacular VIP event space with private bowling lanes, unique designer bowling shoes and butler service
• Venue is a showcase of premium multi-attraction entertainment in Melbourne’s premier entertainment destination, Crown Casino
• Cost of refurbishment was over $12 million. Since re-opening has traded in line with expectation
32 | ARDENT LEISURE GROUP | HALF-YEAR RESULTS 2017
For
per
sona
l use
onl
y

Transitioning of Portfolio to
Multi-Attraction Offering Continued
• Improved and expanded amusement game offering
continued:
— Invested in additional new games, improvedpresentation of redemption stores and more aspirational prizes
— Rebranded Amusement Arcades in top centres to Playtime @ AMF/ Kingpin to strengthen the brand and deliver a more cohesive offering
• Improved quality and variety of food - new menus rolled out in all centres with updated Group and Corporate Packages
• Updated branding for Kingpin, AMF and Playtime across all customer touchpoints to be further aligned with each of the target markets
• Growth supported by integrated marketing and digital transformation including a new CRM package and Kingpin website
33 | ARDENT LEISURE GROUP | HALF-YEAR RESULTS 2017
For
per
sona
l use
onl
y
Outlook: Transition from Bowling to Multi-Attraction Offer to Continue
• Key initiatives to continue the transition of the portfolio to multi-attraction entertainment include:
— Progressive divestment of underperforming, non-core AMF centres. Expect to divest four centresin FY17, with one in Dandenong, VIC completed in the first half
— A new Playtime amusement centre in Westfield Chatswood planned for opening in Q4 FY17
— Refurbish and convert AMF North Strathfield, which is in a high quality catchment area, into a Kingpin-branded multi-attraction bowling and entertainment centre opening in Q4 FY17
— Identified and finalised negotiations on a multi-attraction Kingpin bowling and entertainment centre in Westfield Chermside QLD, with a planned opening in Q1 FY18
— Further improve entertainment product by introducing new attractions (e.g. virtual reality, karaoke, escape rooms and VIP rooms and bowling lanes for events and premium spend)
— Disciplined investment in established, well-placed centres, to refresh offering and drive revenue growth
34 | ARDENT LEISURE GROUP | HALF-YEAR RESULTS 2017
For
per
sona
l use
onl
y

MarinasFor
per
sona
l use
onl
y

Marinas
$’000 HY17 HY16 % Change
Total revenue 11,608 10,959 5.9%
EBRITDA 6,435 5,973 7.7%
Operating margin 55.4% 54.5%
Property costs (1,334) (1,343) (0.7%)
EBITDA 5,101 4,630 10.2%
EBITDAmargin 43.9% 42.2%
36 | ARDENT LEISURE GROUP | HALF-YEAR RESULTS 2017
For
per
sona
l use
onl
y

Marinas Revenue Breakdown
$’000 HY17 HY16 % Change
Berthing 6,771 6,249 8.4%
Land 2,666 2,575 3.5%
Fuel and other 2,171 2,135 1.7%
Total 11,608 10,959 5.9%
37 | ARDENT LEISURE GROUP | HALF-YEAR RESULTS 2017
For
per
sona
l use
onl
y

Strong Berthing Occupancy and Yield Drive Growth
• EBITDA 10.2% up on HY16 driven mostly by strong berthing occupancy and yield per berth at a number of sites
• The Spit Marina was the strongest influencer, with new berths at capacity through summer achieving higher yields
• Land Revenue up on prior year mostly attributed to newly created and leased space at Pier35
• Margins improved on the back of improved performance of the Nelson Bay Function Centre and fewer one-off expenses compared to the prior half year due to the Spit Redevelopment
• Targeting completion of sale before 30 June 2017
38 | ARDENT LEISURE GROUP | HALF-YEAR RESULTS 2017
For
per
sona
l use
onl
y

Health ClubsFor
per
sona
l use
onl
y
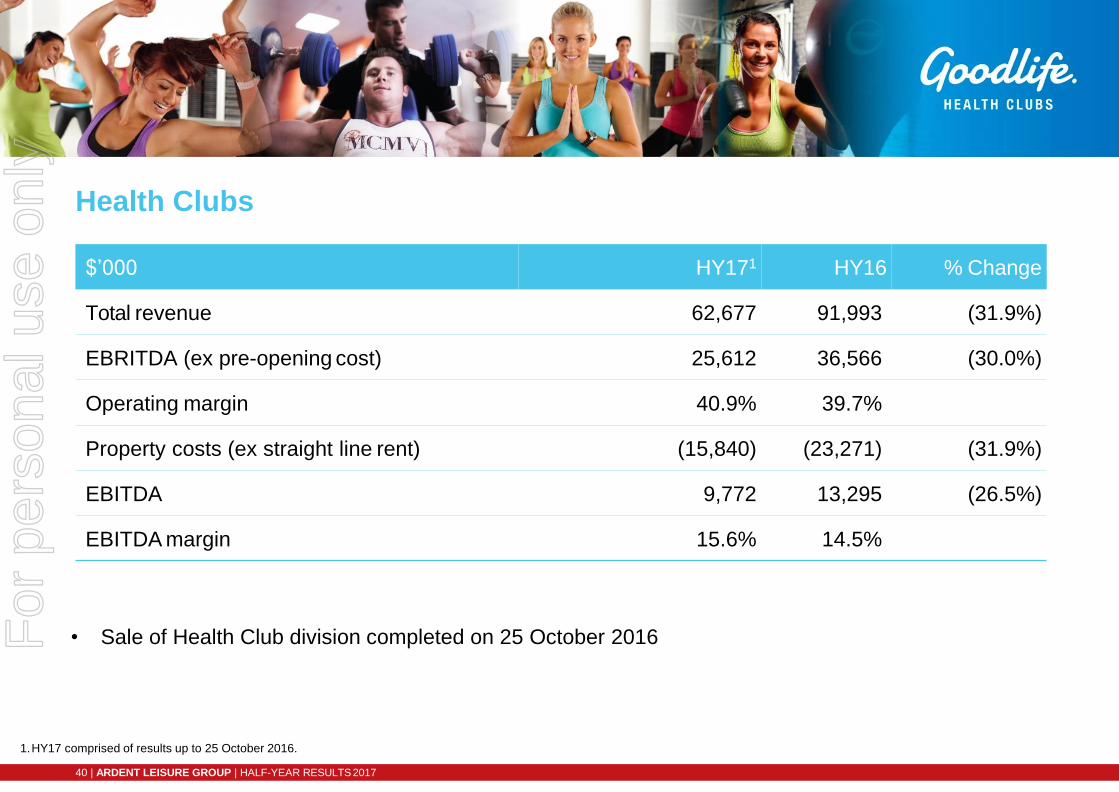
Health Clubs
$’000 HY171 HY16 % Change
Total revenue 62,677 91,993 (31.9%)
EBRITDA (ex pre-opening cost) 25,612 36,566 (30.0%)
Operating margin 40.9% 39.7%
Property costs (ex straight line rent) (15,840) (23,271) (31.9%)
EBITDA 9,772 13,295 (26.5%)
EBITDA margin 15.6% 14.5%
1.HY17 comprised of results up to 25 October 2016.
40 | ARDENT LEISURE GROUP | HALF-YEAR RESULTS 2017
• Sale of Health Club division completed on 25 October 2016For
per
sona
l use
onl
y

Health ClubsGroup Financial Reviewfor the Half Year Ended 31 December 2016
For
per
sona
l use
onl
y

Main
HY17
Theme Health Group
HY1
6
Group
1.Excludes pre-opening expenses2.Excludes straight line rent and movement in onerous lease provisions3.Excludes IFRS depreciation, amortisation of heath clubs brands and customer relationships intangibles, impairment of property, plant and equipment and intangible assets4.Normalised to exclude adjustments to core earnings – see Appendix1.
$ million Marinas
Main
Event Bowling
Theme
Parks
Health
Clubs Other
Group
Total
Group
Total
%
Change
Operating revenue 11.6 136.8 64.3 41.8 62.7 - 317.2 333.8 (5.0%)
Division EBRITDA1
6.4 42.1 22.0 6.4 25.6 - 102.5 123.1 (16.7%)
Property costs2
(1.3) (17.6) (13.6) (0.5) (15.8) - (48.8) (52.1) (6.3%)
Division EBITDA1,2
5.1 24.5 8.4 5.9 9.8 - 53.7 71.0 (24.4%)
Depreciation and amortisation3
- (11.1) (4.8) (2.7) (3.7) (0.6) (22.9) (22.3) 2.7%
Division EBIT1,2,3
5.1 13.4 3.6 3.2 6.1 (0.6) 30.8 48.7 (36.8%)
Corporate costs4
(7.2) (6.9) 4.3%
Loss on disposal of assets4
(1.3) (0.2) 550.0%
- (0.1) (100.0%)
Interest income 0.1 - -
Interest expense (6.2) (7.5) (17.3%)
Tax4
(3.4) (3.5) (2.9%)
Core earnings 12.8 30.5 (58.0%)
HY17 HY16
Other expenses (including derivative gains and losses)4
42 | ARDENT LEISURE GROUP | HALF-YEAR RESULTS 2017
For
per
sona
l use
onl
y

Capital Expenditure
1. Includes capex spent on developments completed in HY17, developments scheduled to open in the remainder of FY17 and the remodeling of the Plano centre
HY17 HY17
routine capex development capex
$m $m
Theme Parks 8.5 1.9
Marinas 1.6 0.8
Bowling 4.3 13.8
Main Event 5.5 74.7
Health Clubs 1.6 1.5
Corporate 0.5 -
Total 22.0 92.7
Depreciation (excl IFRS) 22.9 -
43 | ARDENT LEISURE GROUP | HALF-YEAR RESULTS 2017
1
For
per
sona
l use
onl
y

1.Represents gross assets of the business divisions. Excludes business division specific liabilities that are included on a consolidated Group basis.
Consolidated group ($ million) 31 December 2016 30 June 2016
Assets(1)
Theme Parks 195.2 280.2
Excess land 3.6 3.6
Marinas 116.4 113.1
Bowling 151.4 138.0
Main Event 438.7 357.8
Health Clubs - 251.1
Other 15.6 13.8
Total Assets 920.9 1,157.6
Liabilities
Bank debt 164.6 312.9
Other 191.7 224.7
Total Liabilities 356.3 537.6
Net Assets 564.6 620.0
44 | ARDENT LEISURE GROUP | HALF-YEAR RESULTS 2017
For
per
sona
l use
onl
y

Capital Management
• Sales of the Health Clubs and Marina divisions will significantly strengthen the Group’s balance sheet
• Proceeds initially used to repay debt, substantially increasing capacity to fund Main Event’s 5 year US rollout target
Net debt / EBITDA1
FCCR1
3.50x
1.75x
1.Proforma (PF) shows Net debt / EBITDA and FCCR as if Health Clubs and Marinas were not included in HY17
45 | ARDENT LEISURE GROUP | HALF-YEAR RESULTS 2017
2.34
1.36
0.67
FY 16 HY17 HY17PF
Covenant
2.09
1.91
2.02
FY 16 HY17 HY17PF
Covenant
For
per
sona
l use
onl
y
Capital Management
• In addition to the sale of Health Clubs and Marinas, funding will also come from:
— Debt facilities;
— Increased earnings retention
— DRP when required; and
— Sale and leaseback and/ or “progressive funding” of Main Event new centres by institutional real estate investors
• Review of stapled structure on-going, but significantly simplified by sale of Marinas and Health Clubs businesses
46 | ARDENT LEISURE GROUP | HALF-YEAR RESULTS 2017
For
per
sona
l use
onl
y
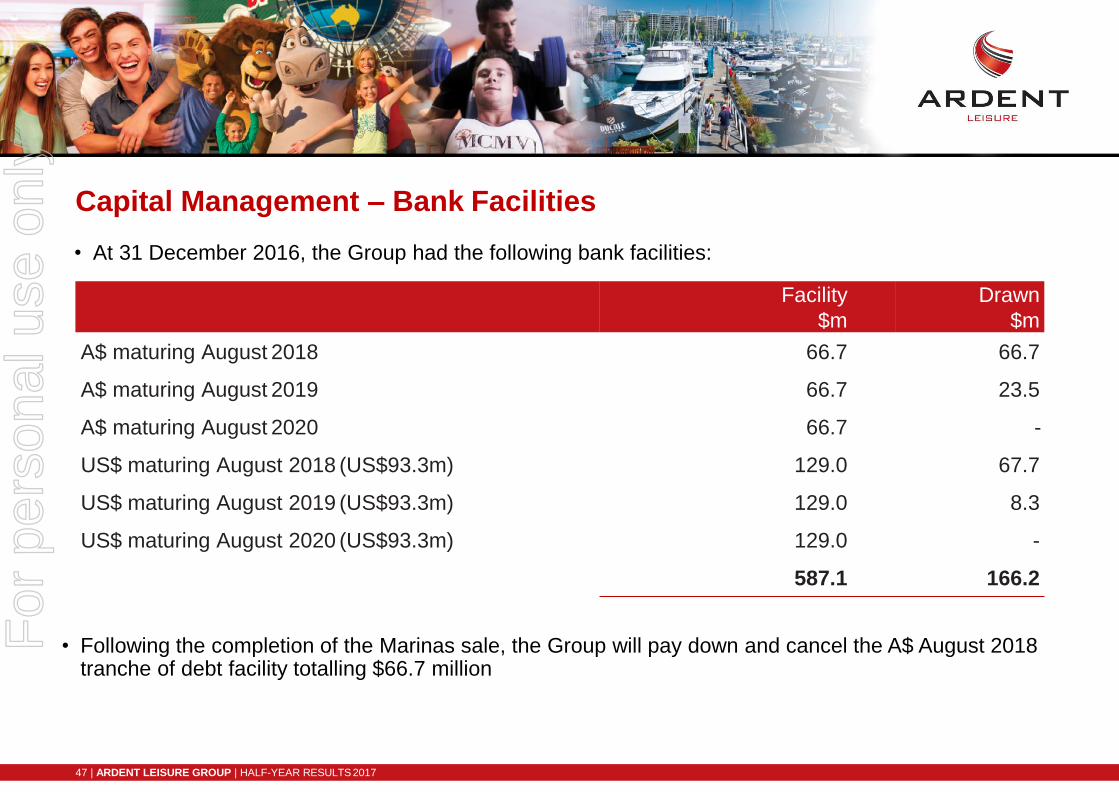
Facility
$m
Drawn
$m
A$ maturing August 2018 66.7 66.7
A$ maturing August 2019 66.7 23.5
A$ maturing August 2020 66.7 -
US$ maturing August 2018 (US$93.3m) 129.0 67.7
US$ maturing August 2019 (US$93.3m) 129.0 8.3
US$ maturing August 2020 (US$93.3m) 129.0 -
587.1 166.2
Capital Management – Bank Facilities
• At 31 December 2016, the Group had the following bank facilities:
47 | ARDENT LEISURE GROUP | HALF-YEAR RESULTS 2017
• Following the completion of the Marinas sale, the Group will pay down and cancel the A$ August 2018 tranche of debt facility totalling $66.7 million
For
per
sona
l use
onl
y
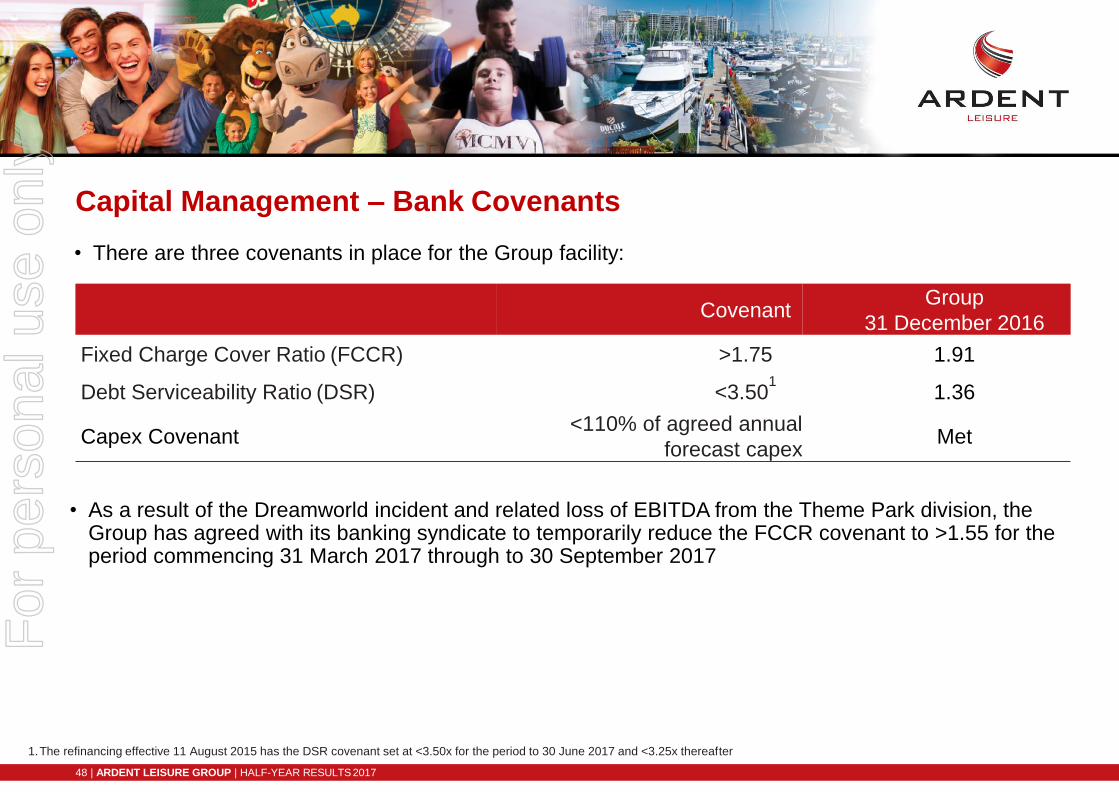
CovenantGroup
31 December 2016
Fixed Charge Cover Ratio (FCCR) >1.75 1.91
Debt Serviceability Ratio (DSR) <3.501
1.36
Capex Covenant<110% of agreed annual
forecast capexMet
Capital Management – Bank Covenants
• There are three covenants in place for the Group facility:
• As a result of the Dreamworld incident and related loss of EBITDA from the Theme Park division, the Group has agreed with its banking syndicate to temporarily reduce the FCCR covenant to >1.55 for the period commencing 31 March 2017 through to 30 September 2017
1.The refinancing effective 11 August 2015 has the DSR covenant set at <3.50x for the period to 30 June 2017 and <3.25x thereafter
48 | ARDENT LEISURE GROUP | HALF-YEAR RESULTS 2017
For
per
sona
l use
onl
y

Capital Management – Interest & Foreign Exchange
• At 31 December 2016, the Group had 92.2% of interest on debt facilities fixed through interest rate
swaps
• At 31 December 2016, the weighted average rate, including margin, was 4.63% for AUD debt and 2.66% for USD debt
• US earnings are 100% unhedged
49 | ARDENT LEISURE GROUP | HALF-YEAR RESULTS 2017
For
per
sona
l use
onl
y

Health ClubsGroup OutlookFor
per
sona
l use
onl
y

Group Outlook
• Main Event US rollout opportunity remains on track supported by new centres continuing to exceed
30% average first year EBITDA returns on investment
• Main Event constant centres targeting low single digit revenue growth long term
• Dreamworld expected to recover over the course of time, assisted by investment in unique and exciting
attractions, branded retail concepts and a new brand/ marketing strategy
• Theme Park businesses expected to benefit from increased domestic and international tourism to the
Gold Coast off the back of the 2018 Commonwealth Games and development of land adjoining the
property in Coomera
• Growth in Bowling and Games division expected to continue, driven by constant centre revenue growth,
the new Kingpin Crown redevelopment, investment in new entertainment centres and amusement
arcades and the exit of underperforming legacy centres
51 | ARDENT LEISURE GROUP | HALF-YEAR RESULTS 2017
For
per
sona
l use
onl
y

Health Clubs
AppendicesF
or p
erso
nal u
se o
nly
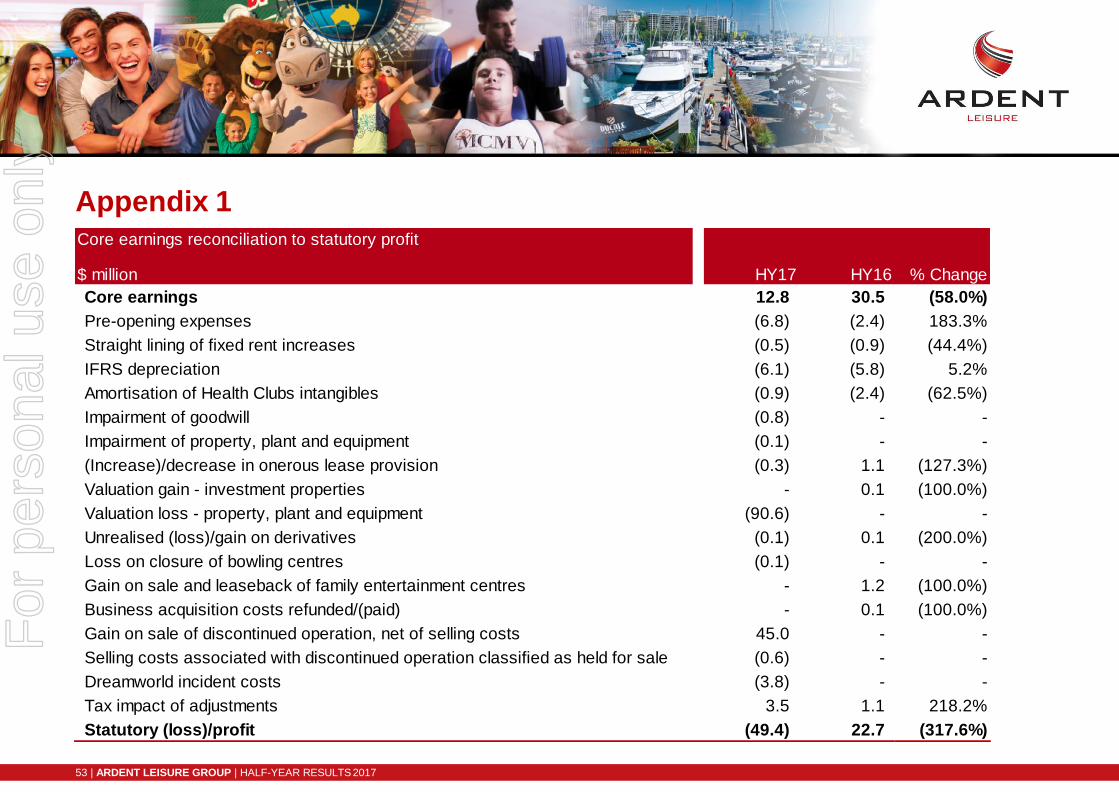
Appendix 1
53 | ARDENT LEISURE GROUP | HALF-YEAR RESULTS 2017
Core earnings reconciliation to statutory profit
$ million HY17 HY16 % Change
Core earnings 12.8 30.5 (58.0%)
Pre-opening expenses (6.8) (2.4) 183.3%
Straight lining of fixed rent increases (0.5) (0.9) (44.4%)
IFRS depreciation (6.1) (5.8) 5.2%
Amortisation of Health Clubs intangibles (0.9) (2.4) (62.5%)
Impairment of goodwill (0.8) - -
Impairment of property, plant and equipment (0.1) - -
(Increase)/decrease in onerous lease provision (0.3) 1.1 (127.3%)
Valuation gain - investment properties - 0.1 (100.0%)
Valuation loss - property, plant and equipment (90.6) - -
Unrealised (loss)/gain on derivatives (0.1) 0.1 (200.0%)
Loss on closure of bowling centres (0.1) - -
Gain on sale and leaseback of family entertainment centres - 1.2 (100.0%)
Business acquisition costs refunded/(paid) - 0.1 (100.0%)
Gain on sale of discontinued operation, net of selling costs 45.0 - -
Selling costs associated with discontinued operation classified as held for sale (0.6) - -
Dreamworld incident costs (3.8) - -
Tax impact of adjustments 3.5 1.1 218.2%
Statutory (loss)/profit (49.4) 22.7 (317.6%)
For
per
sona
l use
onl
y
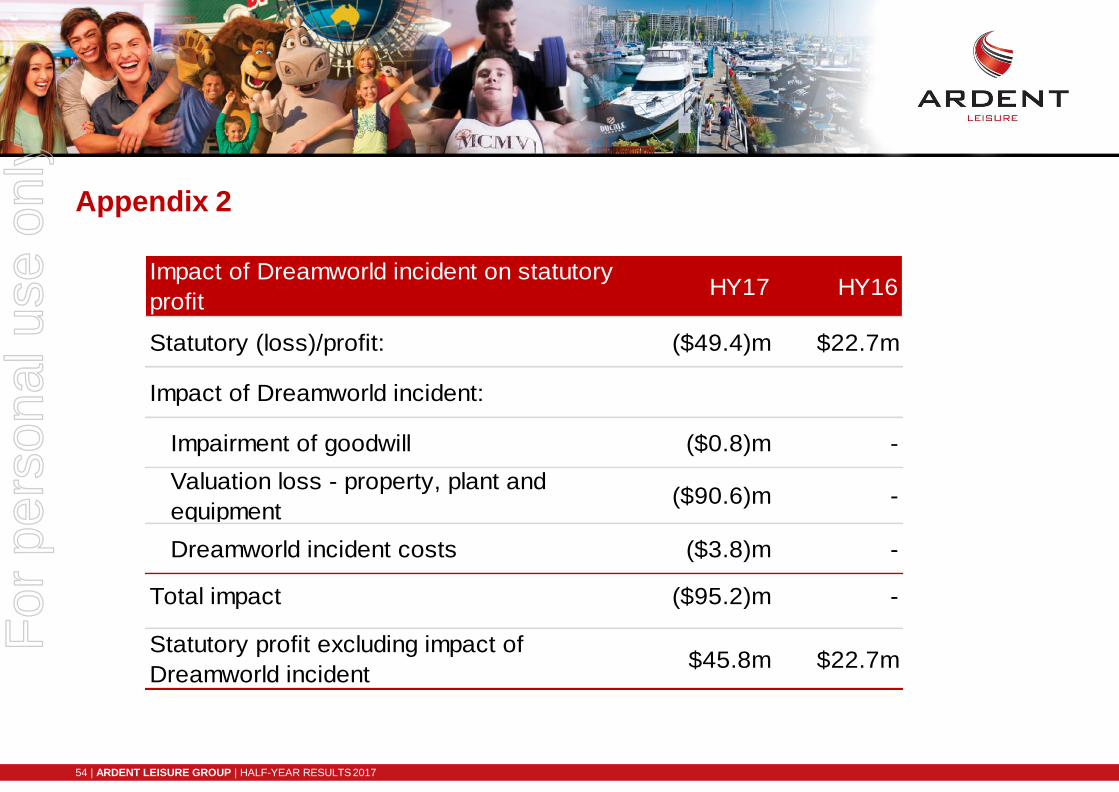
Appendix 2
54 | ARDENT LEISURE GROUP | HALF-YEAR RESULTS 2017
Impact of Dreamworld incident on statutory
profitHY17 HY16
Statutory (loss)/profit: ($49.4)m $22.7m
Impact of Dreamworld incident:
Impairment of goodwill ($0.8)m -
Valuation loss - property, plant and
equipment($90.6)m -
Dreamworld incident costs ($3.8)m -
Total impact ($95.2)m -
Statutory profit excluding impact of
Dreamworld incident$45.8m $22.7m
For
per
sona
l use
onl
y
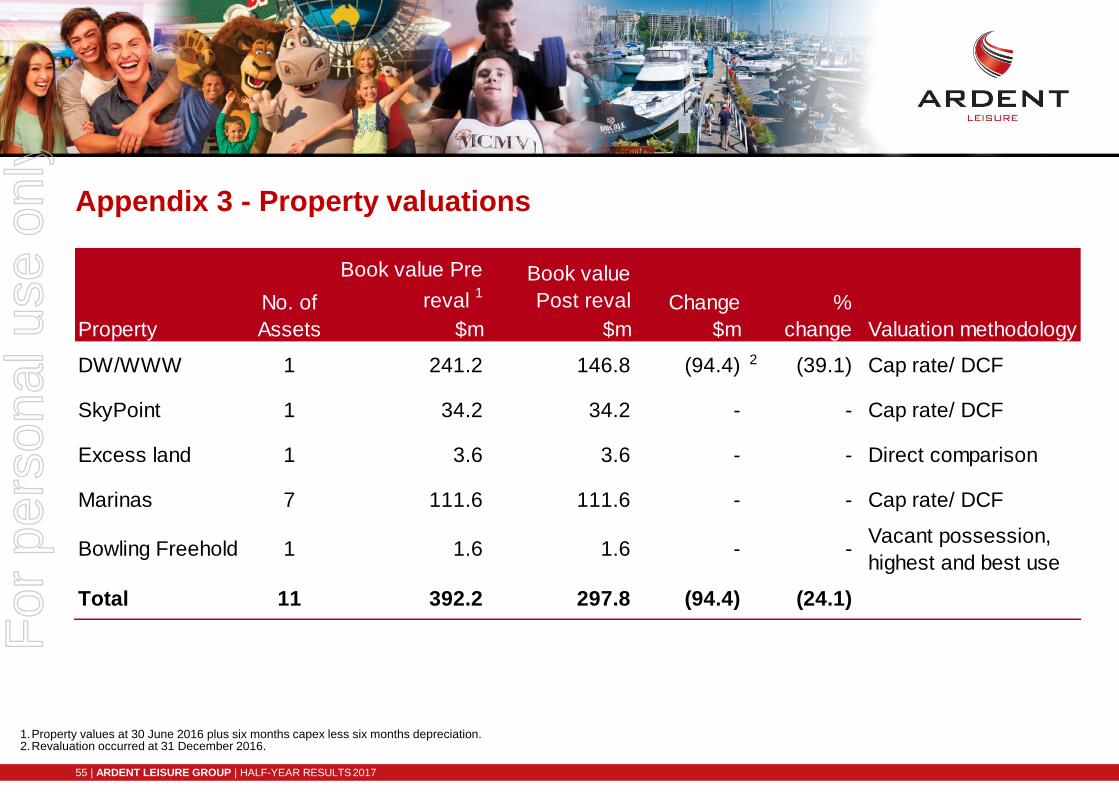
Appendix 3 - Property valuations
1.Property values at 30 June 2016 plus six months capex less six months depreciation.2.Revaluation occurred at 31 December 2016.
1
55 | ARDENT LEISURE GROUP | HALF-YEAR RESULTS 2017
Book value Pre
reval 1
Book value
Post reval
$m $m
DW/WWW 1 241.2 146.8 (94.4) 2 (39.1) Cap rate/ DCF
SkyPoint 1 34.2 34.2 - - Cap rate/ DCF
Excess land 1 3.6 3.6 - - Direct comparison
Marinas 7 111.6 111.6 - - Cap rate/ DCF
Bowling Freehold 1 1.6 1.6 - -Vacant possession,
highest and best use
Total 11 392.2 297.8 (94.4) (24.1)
Valuation methodologyProperty
No. of
Assets
Change
$m
%
change
For
per
sona
l use
onl
y

Disclaimer
This information has been prepared for general information purposes only,
is not general financial product advice and has been prepared by Ardent
Leisure Management Limited ABN 36 079 630 676 (ALML), without taking
into account any potential investors’ personal objectives, financialsituation
or needs. Past performance information provided in this presentation may
not be a reliable indication of future performance. Due care and attention
has been exercised in the preparation of forecast information, however,
forecasts, by their very nature, are subject to uncertainty and contingencies
many of which are outside the control of ALML and Ardent Leisure Limited
(ALL). Actual results may vary from forecasts and any variation may
be materially positive or negative. ALML provides a limited $5 million
guarantee to the Australian Securities and Investments Commission in
respect of ALML’s Corporations Act obligations as a responsible entity of
managed investment schemes. Neither ALML nor any other Ardent Leisure
Group entity otherwise provides assurances in respect of the obligations of
any entity within Ardent Leisure Group. The information contained herein is
current as at the date of this presentation unless specified otherwise.
ARDENT LEISURE GROUPHalf-Year 2017
Results Presentation
Shrek and Madagascar © 2017 DreamWorks Animation L.L.C Bananas in Pyjamas and Giggle and Hoot ©Australian Broadcasting Corporation 2017 LEGO and the LEGO logo are trademarks of the LEGO Group. ©2017 The LEGO Group.
56 | ARDENT LEISURE GROUP | HALF-YEAR RESULTS 2017
For
per
sona
l use
onl
y