for personal use only · 2017. 9. 21. · computershare investor services pty ltd level 5, 115...
TRANSCRIPT

A N N U A L R E P O R T 2 0 1 7
DISTRIBUTION & MARKETING SERVICES
PRINT AUSTRALIA
PMP NEW ZEALAND
For
per
sona
l use
onl
y

C O N T E N T S
O V E R V I E W
6Chairman’s Review
12CEO’s Review
F I N A N C I A L R E P O R T
36Directors’ Report
49Remuneration Report
59Independent Auditor’s Declaration
60CFO Review
F I N A N C I A L S TAT E M E N T S
62Consolidated Statement of Profit or Loss
and Other Comprehensive Income
63Consolidated Statement
of Financial Position
64Consolidated Statement
of Cash Flows
65Consolidated Statement
of Changes in Equity
67Notes to and forming part
of the Financial Statements
117Independent Auditor’s Report
122Five Year Summary
123Share Register Information
124Shareholder Information
PMP LimitedABN 39 050 148 644
Registered Office: Level 12, 67 Albert Avenue, Chatswood NSW 2067 Tel: 02 9412 6000 pmplimited.com.au
Annual General MeetingThe Annual General Meeting will be held at 1 1am on Wednesday 22 November 2017 at:
Deloitte Touche Tohmatsu Level 9, Grosvenor Place, 225 George Street, Sydney
Details of the business of the meeting are contained in the Notice of Meeting.
Investor InformationShareholders requiring information should contact the share registry or Chief Financial Officer Geoff Stephenson:
Tel: 02 9412 6000 [email protected]
ASX Code PMP
Share RegistryComputershare Investor Services Pty Ltd Level 5, 115 Grenfell Street Adelaide SA 5000 GPO Box 1903, Adelaide SA 5001
Enquiries: Within Australia: 1300 556 161 International: +61 3 9415 4000 www.computershare.com
Board of DirectorsCHAIRMAN Matthew Bickford-Smith
MANAGING DIRECTOR/CEO Peter George
NON-EXECUTIVE DIRECTORS Stephen Anstice Anthony Cheong Michael Hannan Dhun Karai
For
per
sona
l use
onl
y

PMP NEW ZEALAND
PRINT AUSTRALIA
Company ProfilePMP Limited has become Australasia’s pre-eminent print media and marketing services company.
PMP’s merger with IPMG in March 2017 has brought together two long-standing print companies to create a new merged entity with industry-leading national scale and an unrivalled breadth of services. PMP provides services integrated across print, digital, catalogue and magazine distribution.
PMP has the strongest position in both the Australian and New Zealand heatset print markets and is the leading magazine distributor in Australia. The company is the only integrated printer and distributor of catalogues and magazines to households and retailers.
The new PMP operates through three divisions:
PMP Print is the largest and most awarded national operator in the Australian market with significantly more capacity than any other player. The company is unrivalled in its breadth of services and ability to deliver on-time and in full. Its press fleet is superior in terms of its size, age, location and capacity, giving customers unbeatable time to market and scheduling flexibility.
PMP has plants throughout Australia and New Zealand producing catalogues and magazines, community newspapers, direct mail, fliers, promotional materials, point of sale and even packaging.
PMP Distribution & Marketing Services – The division consists of Gordon & Gotch and PMP Distribution; and Marketing Services, which includes Griffin Press. PMP is the only integrated services provider that also delivers catalogues direct to homes and magazines to newsagents and other businesses, and creates award-winning digital marketing solutions.
The group’s letterbox distribution business delivers around two billion catalogues to Australian households each year through a network of more than 12,000 walkers. Gordon & Gotch is the leader in magazine distribution, this year delivering more than 200 million copies to newsagents, supermarkets, convenience stores and airports around the country.
PMP’s marketing services include: creative design, brand strategy, business consulting services, marketing automation, photography, videography, point of sale, public relations, content and social media through offices in Sydney, Melbourne and Brisbane.
The group is also working with global leaders to create and deliver the next generation of print media and marketing technology.
PMP New Zealand is the country’s largest print and distribution business, with production facilities in Auckland and Christchurch and a letterbox delivery network extending across the North and South Islands. Gordon & Gotch New Zealand provides publishers with an independent distribution channel to the country’s retail outlets.
With the merger of PMP and IPMG, the company is building a business for the long-term, right-sizing to align with the market by driving greater efficiencies, innovation for clients, rationalising old equipment and positioning ourselves for the future.
DISTRIBUTION AND MARKETING
SERVICES
1
For
per
sona
l use
onl
y

PMP IPMG
PMP NEW ZEALAND
PRINT AUSTRALIA
PMP PrintHannanprint
Offset Alpine PrintingInprint
Bolton PrintInpack
Griffin PressPMP Digital
SBMPEP Central
Traction DigitalHoller
Spectrum Group
Gordon & Gotch PMP Distribution
PMP PrintPMP Maxum
PMP DistributionGordon & Gotch
MARKETING SERVICES DISTRIBUTION
The merged companyThe March 2017 merger with IPMG has made PMP Limited a company that is building a business for the long-term, right-sizing to align with the market by driving greater efficiencies, providing innovation for clients, and rationalising old equipment.
As at 30 June 2017, PMP delivered on post-merger synergies, with $40 million in annualised savings actioned within four months of completion. Annualised full year EBITDA is expected to be $90-$100 million from FY19.
Investing in print marketingPrint is one of the country’s biggest manufacturing industries. Today’s sector has adapted to the digital economy, encompassing a full range of marketing solutions from creative services to digital, distribution and marketing automation.
Despite the massive increase in the number of channels in which people communicate, print remains the market’s stand-out vehicle, especially in the retail, lifestyle, entertainment, travel and tourism, education and financial services sectors.
Catalogues, in particular, remain the number one go-to media source for groceries, fashion, electronics, toys, alcohol and cosmetics.
The Australasian industry leader Optimisation and consolidation has occurred in the print industry internationally. PMP is the Australasian industry leader and is now leading the development of a sustainable industry in Australia.
DISTRIBUTION AND MARKETING
SERVICES
2
For
per
sona
l use
onl
y

Customer Focus – unrivalled capabilityThe only integrated printer and distributor of catalogues
and magazines to households and/or retail outlets.
PERTHADELAIDE
DARWIN
SYDNEY
CAIRNS
CANBERRA
MELBOURNE
BRISBANE
MAILHOUSEWEBPRESSES
SHEETFEDPRESSES
BINDERYDIGITALPRESSES
DISTRIBUTION
4 5WARWICK FARM
3LIDCOMBE
2 2CAIRNS
BIBRA LAKE
2 1
4 2 2GEEBUNG
8 7MOOREBANK
7 4CLAYTON
HOBART
GRIFFIN PRESS
2 234
4 26
AUCKLAND
2
CHRISTCHURCH
1 2 3
PMP is uniquely positioned as the only company in Australia with:⊲ access for both unaddressed and addressed
printed products direct to households through a nationwide letterbox delivery platform;
⊲ the largest print post mail house in Australia;
⊲ a national distribution network to thousands of retail newsagents and all major supermarkets through Gordon & Gotch.
PMP is focused on meeting its clients’ needs, regardless of the communication channel required. Customers can bundle the distribution of magazines, catalogues, fliers and other promotional materials with their print job and take advantage of PMP’s digital services including creative design, brand strategy, business consulting services, marketing automation, photography, videography, point of sale, public relations, content and social media.
PMP is creating dedicated sites for magazine and catalogue print and distribution, where all aspects of print production and distribution will be housed under one roof, allowing customers even greater speed to market and freight savings.
3
For
per
sona
l use
onl
y

⊲ PMP delivers on-time and in full with a superior press fleet in size, age, footprint and capability – matched to customer requirements
⊲ We boast 16, 24, 32, 48, 64, 80pp and Australasia’s only 96pp presses plus high speed finishing and binding equipment – in multiple sites, providing essential flexibility to our customers
⊲ Capability extends from heatset web offset to sheetfed, digital and ink jet printing – matching our process to customer needs
⊲ Our capacity is significantly more than that of others in the sector – PMP can cope with peak seasonal demand
⊲ The best equipment has been retained – we can offer retailers and publishers the formats they require
PMP Print capability
⊲ Vertically integrated: pre-media, print and distribution
⊲ No.1 market position in Australia with 55%-60% market share^ and expected $430M printing sales
⊲ PMP focuses on medium to long run heatset printing and also has short run capability (web & sheetfed)
⊲ Oldest & least efficient equipment retired
^Based on internal market estimates
⊲ After cost out, new national footprint : • Warwick Farm, Moorebank
and Lidcombe in NSW • Clayton in VIC• Geebung and Cairns in QLD• Bibra Lake in WA
⊲ Capacity post merger delivers broadest range of print formats to satisfy customer needs
PMP Print strengths
PMP’s plant at Warwick Farm in Sydney
4
For
per
sona
l use
onl
y

PMP’s Geebung site in Queensland, incorporating Inprint, Inpack and PEP Central
PMP’s plant at Clayton in Melbourne
⊲ Over 100 sales and customer service professionals on the ground, ensuring our clients have exceptional 24/7 support
⊲ Time to market is critical. We deliver direct to customers from locations across Australia/New Zealand plus they can combine print and distribution to achieve further efficiency
⊲ PMP is a trusted partner, not a competitor, to print managers and brokers
⊲ PMP’s breadth of services is unrivalled
⊲ The new combined capabilities give both customers and PMP greater flexibility for scheduling
⊲ PMP can run work on presses optimised to suit the job
⊲ Allows us to meet peak seasonal demand
Increased customer focus
5
For
per
sona
l use
onl
y

Dear ShareholdersHaving merged with IPMG in March 2017, PMP has now created a company that is the industry leader with scale and capability second to none. It has achieved its long-term goal of creating a sustainable business model that will provide unsurpassed flexibility and print opportunities for both the company and its customers and in doing so has addressed the issue of excess capacity.
For more than a decade, Australia’s print industry has battled with excess capacity in the market and the need to adapt to a combination of rapid technological change, consumer preferences for online newspapers and magazines, and a slow-down in economic growth.
Over the last decade, many larger players replaced obsolete plant with new modern presses – increasing industry capacity as overall demand was starting to fall. When the new capacity was installed, the industry was still printing phone books and magazine volumes were double today’s volumes. As demand fell, underutilised volume placed increasing pressure on margins.
The Board has long been aware that, in an industry with high fixed costs, there is only one answer to this level of over capacity. For several years now, PMP has signalled its desire for industry consolidation and explored options to make this happen.
Going into FY17, the Board was of the view that we had reached a point where the current structure of the industry was no longer sustainable and that consolidation was a necessary and essential strategic response to ensure PMP’s profitability into the future.
This is why, in the early part of the year, PMP took decisive action and negotiated a merger with IPMG – a print and digital services provider, privately owned by members of the Hannan family. We considered that IPMG was the best fit for PMP: a business with similar, customer-focused values and a highly experienced management team, that would provide the greatest amount of synergies.
The Board and its advisors judged the transaction would be materially earnings per share (EPS) accretive, with significant synergy benefits in the form of cost savings that would generate value for PMP shareholders. By merging our operations, we saw clear potential to create a more efficient organisation – one that would be capable of competing in the consolidated industry where of the remaining three competitors two were acquired by the only other printing company listed on the ASX, leaving two listed competitors in the market.
Most importantly, looking ahead, the merged Group would also be in a far better position to both influence and respond to
MAILHOUSEWEBPRESSES
SHEETFEDPRESSES
BINDERYDIGITALPRESSES
LETTERBOXDISTRIBUTION
MAGAZINEDISTRIBUTION
PMP – the industry leader in scale and capability
Chairman’s Review
PMP is now the pre-eminent print media and marketing services company in Australasia with services across print, digital, catalogue and magazine distribution.
Matthew Bickford-SmithChairman
6
For
per
sona
l use
onl
y

2017 SummaryFY17 results in line with revised guidance• Sales up 28.9% to $1.05 billion• Net Debt at $18.5M is well ahead of guidance,
vs Net Cash of $0.7M at 30 June 2016• EBITDA (before significant items)
at $32.2M, down 37% pcp**• Net Loss (after tax and significant items)
of $126.4M compared to $0.2M Profit pcp**• Free cash flow* at $37.2M vs $37.5M pcp**
Integration well advanced• Press fleet rationalisation completed in
four months – improved scale, capability and utilisation
• Out of a target of $55M annualised savings, $40M has been actioned by June 30, together with an improved payback
• $142.6M significant items (Cash $61.6M, Non-cash $61.0M, Onerous leases $20M)
FY18 and FY19 guidance reaffirmed• FY18 EBITDA*** $70M - $75M• FY19 EBITDA*** $90M - $100M• Net debt free (in FY19).• Capital management planned
to resume in 2HFY18
**Prior comparable period. ***Pre significant items.
$M FY17 FY16 %
Sales Revenue – Statutory† 1,051.5 816.0 28.9
EBITDA(before Significant Items)
32.2 51.2 (37.0)
EBIT(before Significant Items)
3.7 23.3 (84.2)
Net (Loss)/Profit(before Significant Items)
(1.9) 11.8 –
Net (Loss)/Profit(after Significant Items)
(126.4) 0.2 –
Free Cash Flow* 37.2 37.5 (0.9)
Net Cash (Net Debt) (18.5) 0.7 –
Significant Items(post tax)
(124.5) (11.6) –
* Free cash flow is defined as EBITDA (before significant items) less interest paid, income tax, capex and movement in working capital
† Print Australia $263M‡; Distribution Australia $76M; Marketing Services Australia $49M‡; Gordon & Gotch Australia $470M; New Zealand $193M.
‡ Only includes 4 months of IPMG.
FY17 Key Financials
Customer Focus: PMP is committed to providing the products, quality and service our clients appreciate.
7
For
per
sona
l use
onl
y

Chairman’s Review
Since 2012 PMP has had a relentless focus on removing complexity, reducing costs, generating strong free cash flow to eliminate net debt and reward shareholders, while consolidating our industry structures.
Stabilised by 2015:⊲ clearer focus and debt reduction⊲ refinancied corporate bond in 2015: extended tenor, lower cost, better capital
management flexibility⊲ recommenced capital management distributions 2015
In 2016:⊲ magazine distribution industry consolidation Gordon & Gotch⊲ net debt free June 2016
In 2017:⊲ IPMG merger completed. Heatset print market consolidated
from 5 to 2 – more efficient industry structure:• strong and sustainable business model for print and distribution• print integration well advanced, synergies on track, payback upgraded
Fiscal 2018-19:⊲ reaffirm synergy and EBITDA targets, net debt elimination, recommence capital
management with large franking credit balance⊲ continue to focus on maintaining excellent customer service⊲ complete synergy program and continue to align the business to market
Delivering on targets
8
For
per
sona
l use
onl
y

ongoing industry trends and to continue to provide our customers with innovative print based communications within a range of integrated solutions.
Merger with IPMG completeOn 28 October 2016, PMP announced an all scrip merger with IPMG. The transaction was approved by 98% of PMP’s shareholders at an Extraordinary General Meeting on 16 December 2016.
After an extended review of the impact the proposed merger would have on competition, the Australian Competition and Consumer Commission (ACCC) agreed that there was excess capacity in the market and it would not oppose the transaction.
On 1 March 2017, the merger was completed. PMP acquired 100% of the shares in IPMG Holdco Pty Ltd and the shareholders of that company were issued new shares in PMP as consideration for PMP acquiring those shares. This resulted in the Hannan Family together holding 37% of PMP’s share capital. Existing PMP shareholders retained the remaining share capital of approximately 63%.
Having already done much of the operational thinking, the new executive team moved swiftly to execute the integration program required to merge the two companies. By year end, $40M of annualised pre-tax cost savings had been actioned, with the remaining synergies affirmed and PMP on track to deliver the annualised run rate of $55M savings by FY19. The savings derive from: better optimisation and consolidation of the joint press fleet and associated savings on labour costs; savings on property costs from optimising the Group’s operational footprint; and operational efficiencies from centralising procurement, reducing paper waste and rationalising a range of PMP’s other manufacturing and operational expenses.
Your new merged companyThe merged PMP is now the pre-eminent print media and marketing services company in Australasia with services across print, digital, catalogue and magazine distribution. For catalogues and magazines, we are the only vertically integrated supplier of pre-media, print and distribution services capable of reaching both households and retail outlets.
PMP Print Australia’s heatset printing and Gordon & Gotch’s distribution are leaders in their markets; letterbox distribution is second. In New Zealand, where PMP heatset printing is market leader, PMP also provides sheetfed printing, as well as letterbox and retail distribution services.
As measured by revenue and market share, PMP is the leading heatset printer in both Australia and New Zealand. PMP is expected to have $430M print sales in Australia and $63M in New Zealand. Through combining and optimising the two fleets of presses, the merged Group has lifted the overall efficiency and capability of its Australian print operations, giving it an unrivalled breadth of print services to meet customer needs. In an industry where time to market is critical, PMP can deliver direct to customers from locations across Australasia. Our customers can save on freight by producing their work in their own state and by co-locating print and distribution to achieve further efficiencies.
Gordon & Gotch is the market leader in both Australia and New Zealand.
In Australia, Distribution holds 35% of market share in the letterbox distribution industry. Its national network of distributors and walkers delivers more than 2.1B catalogues and newspapers every year.
The merger allows PMP to offer IPMG’s customers bundled print and distribution. It has also given the Group an award-winning portfolio of digital
9
For
per
sona
l use
onl
y

Chairman’s Review
⊲ (Net Debt)/Net Cash ($M)⊲ EBITDA** before significant items ($M)
⊲ Free Cash Flow* ($M)
• Down $19.0M as reduced EBITDA across PMP Group more than offsets 4 months IPMG profits
• Normalised 12 months basis equals $48M** Earnings before Finance Costs, Income tax, Depreciation and Amortisation
• Net Debt ($18.5M) v. Net Cash $0.7M pcp - ahead of guidance/improved working capital
• Better working capital outcomes, lower interest expense and reduced capital expenditure offset lower EBITDA** (before significant items)
* Free Cash Flow is defined as EBITDA** before Significant Items, less interest paid, income tax and capital expenditure, and movement in working capital
35.537.5
45.3
businesses, with value-adding services that include: creative design, marketing automation, photography, videography, point-of-sale, digital content and social media. With the increased scale of its marketing services platform, PMP can now deliver an enhanced integrated suite of print and print-related services to its customer base.
Board changesFollowing completion of the merger with IPMG, Mr Michael Hannan former Executive Chairman of IPMG, and Mr Stephen Anstice former CEO of IPMG and current Chairman of CSG Ltd, joined the Board. Both are standing for election at PMP’s AGM this year. Both are highly experienced within the print industry and with whom we already had a productive and collaborative working relationship. As expected, we are benefiting from their experience and insight as together we build and grow the merged company.
Also, Mr Peter Margin retired as a director of PMP on 25 August 2016 following his appointment
as Executive Chairman of the major beverage company, Asahi Holdings. We thank Peter for his valuable contribution since joining the Board in January 2012 and for his leadership as Chairman of the Audit and Risk Management Committee. Peter’s experience and expertise was integral in achieving the success of PMP’s transformation programs over the last four years. We wish him every success in his future endeavours.
In light of Peter Margin’s retirement, another independent director, Ms Dhun Karai, joined PMP on 1 June 2016 and was appointed Chairman of the Audit and Risk Management Committee in August 2016. Dhun has a strong background in financial services, risk management and audit, as well as executive experience of leading large scale business transformations.
Ms Naseema Sparks resigned at the end of June 2017 to focus on other commitments. Ms Sparks joined the Board in August 2010 and served on the Appointments and Compensation Committee
since that time, becoming Chairman of that Committee in April 2016. We thank her for her valuable contribution and guidance. Her insights into organisational culture and performance helped PMP to come strongly through the challenges of industry consolidation.
Board independenceWith these recent changes to the composition of the Board, the Board currently does not have a majority of directors who can be regarded as independent. The Board has commenced the process of recruiting independent directors in order that the majority of directors on the Board are independent.
The Board’s non-independent directors have already declared areas where there are conflicts of interest, or where the perception of a conflict of interest could arise. They will excuse themselves from participating and voting on such matters.
In terms of committee memberships, following Ms Sparks’ resignation, I assumed
375 2002016355 2002015
372 2002017
35.537.537.2
512 2002016581 2002015
322 2002017
58.151.2
32.2
163 2002015(16.3)
7 2002016 0.7
185 2002017(18.5)
⊲ Sales Revenue
• Sales Revenue higher 28.9% up $235.5M:- Print Australia up $63.3M- Gordon & Gotch AU/NZ up $185M – new contract
on statutory basis, ($19M on underlying basis)
544 2002016542 2002015
701 2002017
811.7816.0
1051.5
10
For
per
sona
l use
onl
y

830.0
⊲ Gearing Level (Net Debt/EBITDA** before Significant Items)
⊲ Capital Management
• Interest cover was 6.3x vs 8.5x in the prior period• During the year the company put a new $65 million
ANZ Facility in place to assist with the funding of the post merger expenditure
⊲ program suspended in October 2016 post merger announcement
⊲ it is the intention to recommence in the second half of 2018
⊲ franking credit balance $62M 2017
⊲ Significant Items
• $61.0M impairments - Goodwill/PPE• $53.6M restructuring, relocations and other• $8.0M acquisition costs• $20.0M onerous leases
18 2002015(6.0)
45 2002016(14.6)
429 2002017(142.6)
the role of Chairman of the Appointments and Compensation Committee in an interim capacity and Mr Michael Hannan also joined the Committee. Mr Stephen Anstice has joined the Audit and Risk Management Committee. In the coming year, the Board intends to restructure the Appointments and Compensation Committee to provide the majority of committee members are independent.
Capital managementTo fund net working capital and the implementation costs associated with the merger, during the year PMP put in place new debt and funding facilities of up to $65 million from ANZ. This debt funding is only for the short-term requirements of integration. The Board intends to maintain a conservative balance sheet. To this end, PMP is currently on track to be net debt free in FY19.
Given the cash demands of delivering synergies, PMP suspended both dividends and share buy-backs during the implementation period. Capital management is intended to recommence in the second half
of FY18. The Board expects that negligible cash tax will be paid in Australia for the next four to five years as a consequence of the losses carried forward. Shareholders will also benefit in the $62M of franking credits available following the merger.
Thank youI acknowledge the critical contributions of PMP’s incoming and outgoing Board members in getting the merger across the line. On behalf of the Board, I would like to thank Peter George and the new senior management team for their exemplary efforts in making the integration program work once we reached completion. To PMP’s recently merged workforce: thank you for your patience and understanding in a difficult year of significant change. The Board looks forward to help you grow our new company in the year ahead.
Strongly positioned for the futureThe Board strongly believes that the merger has given PMP a robust and profitable future where shareholders are fairly rewarded.
PMP goes into the next financial year as the leading force in the Australasian printing and distribution markets. The merged company has now optimised its press fleet to meet the on-going demand for integrated, end-to-end print and distribution solutions. The result will be more efficient, sustainable and agile organisation, far better positioned to adapt to industry change in the future.
60 2002017 0.6 2002016 0.030 2002015 0.3
⊲ Net (loss)/profit after significant items ($M)
• Total significant items were $142.6 million pre tax; $112.8 million increase in significant items post tax, much of which related to undertaking a major restructure of the combined Print business with three sites closing.
26 2002015 8.0
4 2002016 0.2
4520 2002017(126.4)
11
For
per
sona
l use
onl
y

CEO’s Review
FY17 achievementsThe first half of the year was adversely impacted by extremely unusual print market conditions, with every major heatset print operation pursuing industry consolidation. Understandably, prospective print customers were wary of signing contracts where the future competitive market was not clear. Other than the Coles contract, not one major piece of work changed hands in either print or distribution as the market waited to see what would happen with IVE and whether the PMP/IPMG merger would go ahead.
As a result, PMP Print could not replace lost volumes from customers that went out of business in the previous financial year. Had PMP been continuing on a standalone basis, the Print division would have met these lower activity levels with an immediate cost-out response,
OverviewFY17 was a highly unusual year for PMP, as the Australian heatset printing industry consolidated from five to two players, amidst months of uncertainty. The tumultuous industry conditions this created in the first half, and the radically different shape in which our merged company ended the year, makes it hard to extrapolate future performance from this set of financial results.
The most important take away for shareholders is that the year ended with the merger with IPMG complete, $40M of annualised savings already actioned and PMP’s remaining integration and cost savings program well underway. The full annualised savings of $55M is on track to be delivered in a slightly shorter than expected timeframe, with lower than anticipated one-off cash costs.
which would have mitigated these lost volumes. However, anticipation of the IPMG merger meant no such response was possible, substantially affecting profitability in the first half.
Merger completeOriginally, we had hoped to complete the merger on or around 3 January 2017 to minimise disruption to customers and employees. However, after the Australian Competition and Consumer Commission (ACCC) required additional time to review the merger, we extended the proposed completion date. On 17 February, the ACCC announced it would not oppose the transaction, leaving the path clear for completion two months later than hoped, on 1 March 2017.
The full annualised savings of $55M is on track to be delivered in a slightly shorter than expected timeframe, with lower than anticipated one-off cash costs.
Sales Revenue $M 2017 2016 Var %
Print 263.0 199.7 31.7
Distribution and Marketing Services‡ 595.0 480.7 23.8
New Zealand 193.5 135.6 42.7
TOTAL GROUP 1,051.5 816.0 28.9
EBITDA* $M 2017 2016 Var %
Print 16.7 26.4 (36.8)
Distribution and Marketing Services‡ 6.5 13.5 (51.5)
Corporate (3.5) (3.7) 7.3
New Zealand 12.4 15.0 (17.2)
TOTAL GROUP 32.2 51.2 (37.0)
* Before significant items. ‡ Includes Gordon & Gotch (Australia), PMP Distribution, Griffin Press and Marketing Services.
2017 full year results meet revised guidance with print integration well advanced
⊲ FY17 has been a challenging year: • stalled first half waiting for
ACCC merger approval• print markets remained challenging
as retailers control costs• post merger second half – integration
plan implementation
⊲ Met revised EBITDA guidance• transformation plan has run smoothly:
- press fleet rationalisation completed- new optimised national manufacturing
footprint in place- $40M annualised savings actioned –
most flow through in FY18
⊲ Continued commitment to cash flow
Peter GeorgeChief Executive Officer
12
For
per
sona
l use
onl
y

Catalogues provide both large and small retailers a unique ability to reach consumers
13
For
per
sona
l use
onl
y

John NicholsChief Operating Officer – PMP Limited
As Chief Operating Officer for PMP Limited, John Nichols is heading the group’s transformation program following the March 2017 merger with IPMG. He has held the position of COO since January 2013 after 30 years with the company, predominately responsible for print operations and group engineering. With extensive knowledge in print machinery and lean manufacturing, John is recognised as an industry leader in both print technology and process.
Due to extensive pre-merger operational planning, the new PMP-IPMG merged manufacturing footprint was in place by the start of May.
Transformation well underwayWith the merger finally complete, the second half was largely taken up with the major changes required to integrate the best of PMP and IPMG to form Australia’s largest print media marketing services company. Thanks to detailed pre-planning, the transformation program ran smoothly under the direction of PMP’s Chief Operating Officer, John Nichols.
Part of the transformation program involved restructuring reporting lines in the Australian business, splitting it into two divisions.
Print Australia – now run by Adrian O’Connor, former Executive General Manager IPMG Print.
Distribution and Marketing Services – now run by Kevin Slaven, former IPMG Group CEO, who is responsible for Letterbox Distribution, Gordon & Gotch, Digital, and Griffin Press.
New manufacturing footprintTo optimise the two press fleets and take out capacity, transformation also required three site closures. With these closures, and the loss of some head office staff, saw the merged company cutting headcount by approximately 350 people. Working with the AMWU, we made all attempts to ensure that those leaving the business did so with the best possible level of support and assistance.
In March and April 2017 PMP closed the former IPMG print facility at Noble Park, Melbourne. The closure resulted in 100 redundancies, with the remaining staff redeployed to the Clayton site in Melbourne. The PMP Print facility at Wacol in Brisbane was also closed. This, along with other non-Wacol initiatives, resulted in a further 76 redundancies.
We also rationalised the print facility at Lidcombe in Sydney, making part of the Offset Alpine site the dedicated facility for sheetfed requirements across the
entire PMP Group in Australia. This led to 120 redundancies from web printing and bindery as print volumes were streamlined into other PMP sites.
As a result, at the start of May 2017, Print’s new optimised, national manufacturing footprint was in place at Warwick Farm, Moorebank and Lidcombe in New South Wales; Clayton in Victoria; Geebung in Queensland; and Bibra Lake in Western Australia. The combined press fleet has 25% less capacity and an optimised capability, having retired the oldest and least efficient equipment during this rationalisation process. We are still left with significantly more capacity than any other competitor, the broadest range of print formats and the ability to cope with peak seasonal demand – giving us the strongest position in the Australian heatset print market.
Payback upgradedIn February 2017, we announced to the market synergy plans that estimated a spend of $80M to deliver annualised savings of $55M. At year end, within four months of the merger, we had actioned $40M of these annualised cost savings from press fleet rationalisation and cuts in direct wages from
headcount reductions. Further reductions in indirect costs, including procurement, paper, ink, freight and plates, are already well underway to deliver the synergies forecast. Pleasingly, we now estimate the spend to achieve these savings has fallen to $75M which is $5M lower than originally estimated.
Having gone into the year with substantial over-capacity in the Australian market, we ended FY17 with a far more efficient and sustainable print industry structure. Within this structure, we now have significant scale and capability for capacity management and improved fleet utilisation, increasing our cost competitiveness.
FY17 resultsFollowing delays in ACCC approval, union consultations and retail sector weakness, FY17 EBITDA ended up at $32.2M within the guidance issued on 2 June 2017. This was $19.0M or 37% lower than $51.2M in the previous year, as lower profits across the PMP Group more than offset four months of profits from the IPMG merged entities.
Sales at $1,051.5M were up by $235.5M or 28.9% on the previous year. Gordon & Gotch sales were up $185M in Australia/New Zealand as the full year
CEO’s Review
14
For
per
sona
l use
onl
y

PMP prints both mass and special interest titles for large and small publishers, reaching millions
of readers every month
15
For
per
sona
l use
onl
y

Clinton WillisNational Sales Director – PMP Print
With almost 20 years’ experience in senior roles at PMP Limited, Clinton was appointed General Manager of Sales for PMP Print in 2015 before transferring to the role of National Sales Director following the company’s merger with IPMG.
Prior to this, he was based in Perth in the position of General Manager Western Australia. In this role, Clinton led a major transformation of PMP’s business in W.A., driving new processes and efficiencies. He is now proud to lead the biggest print industry sales force in Australia.
run rate came through on new contracts while Print Australia sales rose by $63.3M or 31.7% on four months of IPMG trading, partially offset by lower print sales at PMP.
Free cash flow was $37.2M, down $0.3M on the previous year, as better working capital movements, lower interest expense and capex broadly offset lower EBITDA. Working capital was a favourable $12M vs ($3M) in the previous year, representing an $15M improvement. This came from Gordon & Gotch Australia, mostly due to changes in trading terms along with better than expected debtor collections across the Group.
At year end, PMP’s Net Debt position is $18.5M, $26.5M better than guidance due mainly to changes in trading terms and better than expected debtor collections, cautious cash forecasting, as well as lower capital expenditure and significant items spend.
Once integration is complete, we intend to pay down debt quickly. PMP is currently on track to be net debt free in FY19.
FY18 outlookFor the first time in a long time, we are optimistic about the year ahead. In FY18, we will complete our synergy program, continue to align the business to market and focus on maintaining our excellent customer service. As the market settles into its new shape, we are confident in our ability to capitalise on our new competitive position and to bring value to our customers. We are also looking forward to operating with low capital expenditure and strong free cash flow.
FY19 will be our first year with full run rate synergy numbers. Looking at our new merged metrics, we expect FY18 EBITDA (before significant items) of $70M-$75M. Given the borrowings required while our transformation is underway, net debt will peak around December 2017 at circa $60M-$65M. It will then reduce rapidly as our annualised cost savings start to come through, with PMP becoming net debt free again in FY19. FY19 target EBITDA (before significant items) remains at $90M-$100M. At that point, we expect Return on Funds Employed will reach a healthy 20%-25%.
Looking even further ahead, our merged company is much better placed to adapt to the realities of the Australian print industry in the coming decade.
AcknowledgementsI acknowledge the hard work of the original PMP executive team and our senior colleagues at IPMG who have made possible the synergies we have already delivered to the market in a very short time frame. I also thank the AMWU for providing constructive input during the restructuring process.
The last year has been tough on the employees of PMP and IPMG, who lived through months of uncertainty as the merger completion dragged on before been thrown into yet more change. I thank them all for their patience, tenacity and professionalism and look forward to a more stable year ahead.
We now have a strong and sustainable business model in print and distribution in Australia and New Zealand. The executive team and I look forward to working with our new merged workforce to create value for our customers and our shareholders.
CEO’s Review
16
For
per
sona
l use
onl
y

Craig DunsfordStrategic Account Director – PMP Print
Craig has joined PMP from IPMG where he served as CEO (Print) since 2013. He spent more than 30 years within IPMG printing businesses with responsibility for areas including technical, operations, customer service, sales and general management. Craig takes an active role in research and development, driving innovation and the adoption of new technologies. He also has a key focus on ensuring PMP customers receive outstanding service and are delivered the highest quality work. Craig is currently Deputy Chairman of Two Sides Australia and Value of Paper and Print. He also serves on the board of the Australasian Catalogue Association.
PMP prints a large number of newspapers and newspaper inserted publications
17
For
per
sona
l use
onl
y

CEO’s Review
Adrian O’Connor CEO Print Australia
Adrian O’Connor leads PMP Print Australia, which represents PMP’s Australian heatset, sheetfed, bindery and mailhouse operations in Australia spanning seven production plants. He joined PMP
following the merger with IPMG in March 2017 and immediately prior to this was Executive General Manager for IPMG Print with responsibility for all print sites nationally.
Adrian began his career with KPMG working in Assurance and Transaction Services divisions after completing a Bachelor of Commerce, majoring in Accounting and Commercial Law
at the University of Sydney. He is a member of the Australian Institute of Chartered Accountants. He joined IPMG in 2005 as Head of Group Internal Audit, later working
as Commercial Manager for FPC Magazines and NDD Distribution before joining Hannanprint in 2010 as CFO and becoming General Manager.
Adrian was heavily involved in the proposal to merge PMP and IPMG, understanding the compelling rationale for the transaction from both a Print Executive and
Shareholder standpoint. He has overseen significant change since joining PMP, working closely with COO John Nichols to consolidate and integrate the
two Print businesses, rationalise the printing fleet and workforce which was completed well ahead of schedule in the four months’ post-merger.
Print Australia$M FY17 FY16 Var %
Sales Revenue 263.0 199.7 31.7
EBITDA* 16.7 26.4 (36.8)* before significant items
During the year, print market conditions and consumer sentiment continued to remain very tough with many retailers controlling costs via reduced frequency and format and pagination changes and magazine publisher print runs also coming under pressure.
In the first half of the year, as PMP’s print customers awaited a decision on the proposed consolidation of PMP and IPMG, the inability to replace lost print contract volumes and a general sell price decline reduced print volumes and revenues.
The second half of the year was largely focused on integrating and optimising the PMP and IPMG press fleets and workforces. In the four months following the merger, the newly formed print division won several new print contracts and also renewed contracts for more than $130M of annual sales with key existing print customers.
Revenues were 31.7% or $63.3M higher pcp. The main factors behind this were the inclusion of four months of IPMG print revenues partially offset by lower PMP print revenues.
EBITDA (before significant items) at $16.7M was down $9.7M, as the impact of higher profits from IPMG print and synergy savings were offset by lower PMP heatset print volumes and sell prices. The combined print sales volumes were up 26.6% pcp as higher tonnes from IPMG outweighed lower PMP activity.
PRINT AUSTRALIA
18
For
per
sona
l use
onl
y

PRINT AUSTRALIA
19
For
per
sona
l use
onl
y

CEO’s Review
PMP brings together the widest range of press capability with outstanding customer-centric service. More than 100 sales and customer service professionals provide clients with 24/7 support.
Following the merger with IPMG, PMP now has the strongest tier one customer base in the industry. The merger has enabled us to upgrade our press fleet without capital expenditure. PMP now has the widest web presses in the industry with an unrivalled national footprint, giving our customers greater flexibility in formats and paginations, greater speed to market and reduced freight costs through multi-site printing and the country’s strongest contingency planning resources.
The focus for FY18 operationally will be to improve the utilisation of our plants and our people by balancing the allocation of production across plants and managing crewing requirements accordingly. This will ensure that work is performed on the best available equipment, while minimising the cost of incremental overtime and casual labour and, in turn, being able to maintain high productivity levels across the business.
Print intends to pursue long-term growth with a focus on continued tight cost control, investment in technology and diversification initiatives. We will continue to review our clients’ needs and global trends in print production to identify suitable press and bindery equipment purchases that will give our clients additional efficiency and format flexibility benefits.
In the coming year, we will also build upon our value-added services including:
Mail processing services for clients who want to leverage their customer database with direct mail communication. We will soon become the largest Print Post mailing operation in Australia by insourcing the PMP volumes that are currently lodged via third party mail houses. We already have mail operations in Sydney and Brisbane and anticipate launching into the Melbourne market in due course.
This allows speed to market by printing and distributing to customers from the same production site.
Packaging, which is currently provided using sheetfed presses in both Sydney and Brisbane and packaging equipment in Brisbane. We plan to enhance our production capabilities in Sydney.
Point of Sale printing for customers who want to consolidate their catalogue and instore requirements through the same supply chain with one provider.
Personalisation of customer communications via email/SMS marketing platforms with Traction Digital, personalised covers through Griffin Press and digital creative through Holler.
20
For
per
sona
l use
onl
y

Market includes: ⊲ Retail catalogues
⊲ Mass market and special interest magazines
⊲ Newspapers and newspaper insert publications
⊲ Government and corporate documents
⊲ Advertising material
⊲ Corporate publications
⊲ The merger has enabled PMP to upgrade its press fleet. PMP now boasts the widest web presses in the industry providing clients efficiency of production and flexibility in formats and paginations.
⊲ PMP now has the only national footprint in Australia with locations in Sydney, Melbourne, Brisbane, Perth and Cairns allowing clients greater speed to market and reduced freight costs by multisite printing.
⊲ The Group has retained a modern fleet of equipment including 25 heatset web offset presses nationally, the 3 newest high speed perfect binders in Australia, and 8 high speed Ferag stitchers.
⊲ The breadth of our capacity is the most comprehensive in Australia comprising 16pp, 24pp, 32pp, 48pp, 64pp, 80pp and 96pp presses.
⊲ The variety of PMP presses positions the Group to service increasing market demand for a greater diversity of printed products. There is virtually no product in the heatset web or sheetfed market that PMP cannot print.
⊲ Print Australia revenue at $263.0M is up by $63.3M or 31.7%:• Post merger, PMP has retained key customers ($130M sales pa)
and won $15M new work• Print integration and cost savings programs have been actioned,
cost synergies affirmed – with upgraded payback
21
For
per
sona
l use
onl
y

CEO’s Review
Connecting deeply with customers is the holy
grail for new and ongoing sales, and now top brands
are focussing on how to create a meaningful
relationship through personalised offers.
The brands that stand out genuinely understand customer needs and how
to excite people with marketing campaigns that
become collectibles.
Here are the top seven print marketing trends making a difference to
customers’ ad campaigns.
1 Print personalisation goes mainstream
Australia Post is making the Print Post category less restrictive. This opens the way for more versioning and personalisation for subscription magazines and mail order catalogues.
“I see this as a significant opportunity for brands to use the magazine and catalogue channels more effectively for their customers and advertisers,” says Adrian O’Connor, CEO, PMP Print Australia.
“We have seen premium brands like Myer lead the way with catalogue personalisation for their most valued customers. Marie Claire has done similar with subscriber names featured on their covers,” says Adrian.
The Australia Post changes allow smaller players to also connect more deeply with their customers. As an easy starting point, a personalised or versioned letter or flysheet can be inserted or onserted during the wrapping and mail lodgement process.
2 Print personalisation to drive social buzz
At the leading edge of print personalisation are catalogues based on customer preferences, website search and in-store purchase history.
Retailers are using rich customer data when setting up their accounts. Demographic information is being combined with prior purchases and connected to searches performed on a retailer’s website. Within weeks the customer then receives a personalised catalogue including their name, local store and recommended items that best align with their individual wants or desires.
The sophistication will know no end. For example, retailers overseas are experimenting with marketing the remainders of your wedding registry items by offering them at an exclusive price. If none of your wedding guests bought you that fondue set but you really want to make chocolate covered cheese, the store could offer it to you at a discount as part of a loyalty program. It’s an innovative exercise for retailers that is yielding high returns.
Seven big print marketing trends to connect with customers
Print personalisation for magazines, catalogues and direct mail.
22
For
per
sona
l use
onl
y

3 Unique codes replace generic for better ROI
Unique codes placed on printed catalogues or magazine inserts are a key ingredient in merging print and digital strategies.
Coupon codes are not new, but their strategic use is moving away from just spurring sales. The focus is on leveraging these codes to track customers and sharing data with partners such as advertisers to add more value to relationships.
Unique codes help brands avoid added costs associated with generic ones when they are posted online and go viral; a situation that often costs suppliers more than the benefits of greater sales as more people access the offer, damaging margins.
Unique codes improve return on investment and allow brands to better control budgets related to providing discounts.
4 Visual & touch triggers define and differentiate
Special finishes that are scented or have a high tactile sensation are gaining ever greater cut through for brands aggressively competing to be noticed.
Increasingly, gate folds, wraps and other embellishments are being used to enhance the personalised possibilities of a printed product. Foils, special inks, different cover coatings and fold formats also offer a point of difference for brands.
The brands that use these triggers create a “collectible” mentality within their customers, extending brand loyalty and remarketing opportunities.
5 Custom publishing for deep brand loyalty
Many retailers are investing heavily in branded content. Custom magazines like Outback by R.M. Williams are enjoying steady growth as businesses use the power of this channel to communicate directly with their customers.
Consumers are more likely to buy from a company where they were previously a customer. Custom magazines using client databases provide valuable content that reinforces brand messages, drives deeper brand loyalty and customer retention.
According to a report from the Retail Advertising and Marketing Association, 47% of consumers are also more likely to start an online search after viewing a magazine advertisement. This is a critical path to purchase that brands are using in their decision-making process when embarking on new print campaigns.
6 Print to boost digital engagement
As advertisers and marketers test the wide range of channels open to them, emerging data is showing digital campaigns are far more effective when combined with print.
The Australasian Catalogue Association has found 75% of Australians spend up to 20 minutes per week reading unaddressed catalogues, flyers and brochures that they receive.
Meanwhile, the Direct Mail Association says its channel has a higher conversion rate than any other for lead-generating and one-step ‘buy now’ offers.
The Association says 65% of consumers of all ages have made a purchase because of direct mail.
Major brands such as Fairfax are already effectively using their print properties to drive digital engagement. Domain Chief Editorial and Marketing Officer Melina Cruickshank says, “not only is print an effective branding tool, it drives Domain tangible digital growth.”
“App downloads and social/online usage consistently spike when we use tactical messages in print,” she says.
7 Innovative packaging to start conversations
Packaging is continuing its trend of more frequent creative changes. We are seeing more versions to suit broadening product ranges and innovative folding carton solutions that grab the attention of customers. Great packaging helps brands stand out on crowded shelves, sparking interest and sales.
Weight Watchers is just one example of an enduring brand implementing new-look packaging to stand out from competitors.
More brands are considering how packaging can sell the benefits of their products using a strong creative narrative.
The most successful efforts have a wholly integrated marketing campaign using data specialists and drawing on design and print expertise in support of their business goals.
Custom magazines using client databases provide valuable content that reinforces brand messages, drives deeper brand loyalty and customer retention.
Great packaging helps brands stand out on crowded shelves.
23
For
per
sona
l use
onl
y

CEO’s Review DISTRIBUTION & MARKETING SERVICES
PMP’s Distribution & Marketing Services business provides clients with a comprehensive range of options to reach consumers
Kevin Slaven CEO Distribution & Marketing Services
Kevin leads Distribution & Marketing Services after joining PMP in March 2017, following the merger with IPMG. He was Group CEO for the Hannan family owned company, closely
working with the Executive Chairman, Board of Directors and shareholders in facilitating the joining of the two companies.
A Graduate member of the Australian Institute of Company Directors and Institute of Chartered Accountants, Kevin was appointed CEO of IPMG in July 2013 after
originally joining the business in 2000 as CFO and Company Secretary. Prior to that he worked in the chartered accounting profession and then subsequently in key
commercial roles, including as Commercial Manager of CSR Timber and CFO of leading information technology distributor Tech Pacific.
Kevin is experienced in uniting and evolving diverse businesses and devotes time to researching new technologies, products and services to grow
competitive advantage. He is a Director of CompliSpace Pty Limited and is the Deputy Chair of the Australasian Catalogue Association.
Distribution & Marketing Services
$M FY17 FY16 Var %Sales
Revenue 595.0 480.7 23.8
EBITDA* 6.5 13.5 (51.5)* before significant items
The new Distribution & Marketing Services business comprises Distribution Australia, Marketing Services (PMP and IPMG), Gordon & Gotch Australia and the Griffin Press book printing business. The division’s year end results include four months of revenue from the additional IPMG businesses.
In this division, revenue at $595.0M was up by $114.3M pcp as higher revenues at Gordon & Gotch were partially offset by lower sales at both Distribution and Griffin Press.
EBITDA (before significant items) at $6.5M was $7.0M lower pcp mainly due to disappointing performance at both Distribution and Griffin Press.
A review of the new division and its links with the merged print business was completed by year end, with multiple initiatives identified to optimise the business.
FY18These initiatives will bear fruit in the coming year, with savings commencing in the first quarter of FY18. Our ability to deliver on the new print-related and external growth opportunities identified by the review will be enhanced by a central new business team, which is now running across all Distribution & Marketing Services businesses.
Marketing ServicesThe merger with IPMG brought with it an award-winning portfolio of marketing services businesses, with sales of around $40M annualised and 200 staff. Together, PMP’s marketing services companies provide an integrated offer from creative design, through point-of-sale and social media. They include:
PMP DigitalMarketing hubs supported by photography, design, digital, premedia, packaging and customer workflows.
SBMIntegrated marketing campaigns, including: digital, creative, photography, videography, advertising, campaign planning, strategy, branding, premedia, software and digital printing.
PEP CentralBrand marketing and customer engagement, including: digital print production, point-of-sale, photography, signage, radio and television commercials, apps and websites.
24
For
per
sona
l use
onl
y

DISTRIBUTION & MARKETING SERVICES
Marketing Services include: ⊲ Creative design⊲ Marketing automation ⊲ Photography ⊲ Videography ⊲ Point of sale ⊲ Public Relations⊲ Content⊲ Social
25
For
per
sona
l use
onl
y

PMP’s range of award-winning digital businesses provide an integrated offer that adds customer value all the way through from creative design to point of sale and social media, with 200 staff and international experience with offices in Singapore, India and London.
26
For
per
sona
l use
onl
y

Traction DigitalMarketing automation, digital agency and competition and promotions services. Traction is also a partner for the global leading omnichannel marketing platform, Adobe Campaign, which enhances the customer experience at every on and offline touchpoint.
HollerDigital design, data, brand marketing, loyalty and customer journey mapping and user experience. Holler’s clients include some major and well known national retail brands.
Spectrum GroupAudience-centric public relations, print, online and broadcast media content and social media activity.
FY18In the coming year, we will continue the development and implementation of a broader Group marketing
services strategy, looking for opportunities to offer bundled services across the merged client base. For example, Traction will transition to a new platform with self-service functionality and additional retail and competition modules that align with the PMP client base.
We will also further integrate the division to streamline production, standardise processes and drive efficiencies following the recent co-location of Traction, Spectrum and Holler to shared offices in Pyrmont.
Looking at growth opportunities outside the print customer base, with its agile model, Holler has opportunities to support mid-tier and challenger brands needing to adapt to digitalisation. In addition, Spectrum will build on its early successes in Asia, extending offerings to its global clients and establishing new relationships with companies in Singapore.
Griffin PressDuring the year, Griffin Press was adversely impacted by the major shift to small order demand which has put significant pressure on delivery schedules, necessitated a shift to digital printing and, along with very aggressive market conditions, resulted in lower sales and profits.
FY18The next year will focus on rebuilding sales and profitability. We have already identified interventions to improve productivity, reduce costs and grow revenue with new and existing customers.
27
For
per
sona
l use
onl
y

CEO’s Review
Gordon & Gotch delivers magazines to newsagents and retail outlets all across Australia
28
For
per
sona
l use
onl
y

Gordon & Gotch (Australia) Magazine DistributionThe largest distributor of print and digital magazines in Australia
⊲ No. 1 market position in magazine distribution.
⊲ Customers include domestic publishers, international publishers and distributors, and diverse category/product/country clients
⊲ Recent renewal of major contracts with improved terms
⊲ Declines in volumes to be offset by a number of new initiatives
David HoganGeneral Manager, Gordon & Gotch (Australia and New Zealand)
David Hogan has had 25 years with PMP Limited, joining the company from the finance and banking sector. He was appointed to head up Gordon & Gotch in 2013 after previously holding senior roles in PMP’s publishing and distribution areas. With experience in operations, circulation, client services, retail and information technology, David has a wealth of knowledge about the magazine supply chain. He is driving growth at Gordon & Gotch by expanding its retail network and diversifying into digital services offerings.
Gordon & Gotch (Australia)
$M FY17 FY16 Var %Sales
Revenue^ 470.5 345.8 36.1
EBITDA* 2.7 2.9 (7.2)* before Significant Items.
^ Included in the Distribution and Marketing Services total of $595.0
In FY17, Gordon & Gotch recorded sales of circa $470m. Volumes were up 29% pcp from new contracts. Declines in magazine volumes were offset by operational savings in (mainly freight) network costs and broadening the product offering to newsagents and other outlets.
FY18In the coming year, we will introduce a number of initiatives to reduce overheads and help offset the decline in gross profit due to reducing magazine volumes. These will include taking advantage of the existing freight platform by diversifying into the distribution of toys, general merchandise and giftware, giving unaffiliated newsagents access to products they otherwise have difficulty sourcing. We will also look to optimise transport, warehousing, pick-and-pack functions and title printing.
29
For
per
sona
l use
onl
y

CEO’s Review
PMP’s nationwide letterbox delivery service provides marketers the opportunity to reach consumers right across Australia
PMP DistributionNational network coverage
⊲ Market share circa 35% – the recent merger with IPMG provides real opportunity to leverage bundled print & distribution offer into tier 2 & 3 retailers
⊲ National network coverage for letterbox delivery – 500 distributors and 12,000 walkers
⊲ Services include:• Unaddressed catalogue delivery• Targeted catalogue delivery• Newspaper delivery• Product sample delivery• Access to PMP’s print post mailhouse –
the largest in Australia
PMP DistributionIn FY17, PMP Distribution volumes were down 12% pcp, with 6% of this due to customer withdrawals from the market and the balance due to retailers reducing their marketing budgets in response to challenging market conditions.
The result is in line with industry trends. During the year, 6.9 billion catalogues were delivered across the market, bringing the four-year compound annual growth rate to (3.3%). The year itself was down 7.3% pcp industry wide due to lower volumes from existing customers and the withdrawal from the market of two major distribution customers, which accounted for 30% of the year-on-year reduction.
In the four months post-merger, we began a review of Distribution’s structure to ensure it meets existing business requirements and is nimble enough to allow growth in non-traditional sectors, such as newspapers and home-addressed magazines.
FY18In FY18, while we expect higher volumes on the back of a recent contract win, accessing new revenue streams will remain a priority. Target markets include local area marketing, which has important potential to both generate additional revenue and ensure volumes remain sufficient to sustain the network. We will also focus on increasing quantities of newspaper deliveries and marketing packages to Tier 2 and 3 retailers to bring them back into the catalogue market.
30
For
per
sona
l use
onl
y

PMP New Zealand
Simon Ellis Managing Director, PMP New Zealand
Simon oversees the development and commercial performance of PMP’s New Zealand operations. He was previously CEO of Beacon Media Group for more than five years,
expanding the organisation during his tenure to eight businesses responsible for newspaper publishing, property, motoring and farming guides, commercial, digital
printing and web offset newspaper production.
Simon also serves as President of the New Zealand Community Newspapers Association. He was a Past President of the Printing Industries Association of
Auckland, a past board member and President of Print NZ, which made him a life member in 2008.
PMP NEW ZEALAND
PMP New Zealand is the market leader in print and distribution, and the only printer with heatset and sheetfed capacity in both the North and South Islands
⊲ Revenue A$193M
MARKET⊲ National and local retailers⊲ Magazine, Newspaper &
Directory publishers⊲ Corporate and Financial Services⊲ Government, national and local⊲ International and local
book publishers⊲ Real Estate and SME’s⊲ Marketing, advertising
& media buying agencies
DISTRIBUTION⊲ 50% unaddressed market share,
increased focus on tier 2-3 bundled offers
GORDON & GOTCH NEW ZEALAND⊲ Sole NZ magazine distributor, sales up
230% after new Bauer contract
SHEETFED & MARKETING SERVICES⊲ 15%-20% market share⊲ Focus on publishing, real estate and
corporate sectors
FY18⊲ A new allocation system for magazines
will be implemented by Gordon & Gotch⊲ The Auckland site offers a fully integrated
supply chain for magazines, from print through into the delivery network
⊲ Letterbox distribution will roll out mapping and real-time delivery reporting
31
For
per
sona
l use
onl
y

CEO’s Review
32
For
per
sona
l use
onl
y

PMP New Zealand$M FY17 FY16 Var %
Sales Revenue 193.5 135.6 (42.7)
EBITDA* 12.4 15.0 (17.2)* before significant items
In FY17, revenues were $193.5M up $57.9M or 42.7% pcp with higher Gordon & Gotch sales partly offset by lower heatset print revenues. The market continued to operate with competitive margins, with more consolidation occurring in the last 12 months for medium to small sheet-fed printers as volumes declined.
PMP New Zealand EBITDA (before significant items) of $12.4M, was down $2.6M or 17.2% pcp. Higher profits at Gordon & Gotch were offset by lower EBITDA in Print which was impacted by lower sell prices and volumes, despite tight cost controls providing a partial offset.
Gordon & Gotch volumes were 250% higher. Sheetfed revenue up 2.2%. Heatset volumes were 2.7% lower pcp, while Distribution activity was down 1%.
FY18In New Zealand, technology improvements will be a key focus in FY18, with Gordon & Gotch completing the implementation of a new allocation system for magazines, and letterbox distribution rolling out mapping and real-time delivery reporting. Upgrades in graphics, pre-press and post-press will both drive cost savings and improve customer service.
In magazines, we will benefit from our integrated supply chain, with our operation in Auckland
offering a seamless transition from print, across the factory floor and into the Gordon & Gotch retail and subscription delivery network.
In catalogues, we expect volumes to remain steady. Retail sales continue to show sustained growth in areas that correlate with catalogue volumes, such as supermarkets and furniture, floor coverings and housewares.
33
For
per
sona
l use
onl
y

CEO’s Review
PMP meets its environmental responsibilities by supporting responsible forestry and by recycling 99% of printing waste
FY17 FY16 Var %
Print AU 186.6 147.3 26.6
Print NZ 37.3 38.3 (2.7)
Print Tonnes* 223.8 185.6 20.6
Distribution AU 2,129.2 2,423.1 (12.1)
Distribution NZ 625.8 630.6 (0.8)
Distribution Units# 2,755.1 3,053.7 (9.8)
Gordon & Gotch AU 212.6 165.0 28.8
Gordon & Gotch NZ 40.5 11.6 250.2
Gordon & Gotch Copies# 253.1 176.6 43.3
*thousands #millions
201689
201783^
201594
201497
2013107
2012113
2011122
0
50
100
150
GH
G E
MIS
SIO
NS
(kt)
Greenhouse Gas (GHG) EmissionsPMP Print’s comparable year-on-year Greenhouse Gas (GHG) emissions reduced by a further 7% in FY17. PMP will continue to pursue energy efficiency measures across all businesses to further reduce our overall emissions.
^ IPMG businesses were not included for the comparison.
34
For
per
sona
l use
onl
y

SustainabilityPMP strives to be a sustainable business which meets our responsibilities to the environment through long-term objectives of reducing emissions, preventing pollution, minimising waste and conserving and renewing natural resources.
We will achieve these goals by applying the “four R’s” principle in all areas of our operations: reduce, re-use, recycle and replenish.
With growing customer, employee, government and public awareness on environmental issues, PMP acknowledges its responsibility to remain transparent on the current and emerging exposures that the company faces. PMP have identified the key risks and opportunities and have devised strategic programmes in response to these exposures.
PMP continues to support responsible forestry through its chain-of-custody program, and has achieved both PEFC and FSC certification at every print site across the group. PMP works closely with its customers to promote the use of paper sourced responsibly.
PMP recycles over 99% of the waste generated in the printing process. PMP has targets in place to reduce waste to landfill and paper waste. PMP is actively focused on reducing waste to
landfill by improving our systems and auditing the suppliers’ disposal process activities. PMP’s main recycling streams are paper, aluminium, cardboard, plastics, steel and timber.
PMP has complied with a number of state and federal reporting programs, including:• National Greenhouse and
Emissions• National Pollutants Inventory• National Environmental
Indicators Survey.
PMP has developed an environmental procurement policy which ensures that environmental criteria are embedded in the procurement process.
PMP will continue to pursue energy efficiency measures across all businesses to further reduce our overall emissions.
Occupational Health and Safety
2017 2016 2015
SIFR* 22.1 16.3 16.8
* Significant Injury Frequency Rate
The safety and security of our staff are of paramount importance to the Company. Staff and management continue to work to improve safety performance and to make a safer workplace. PMP has plans in place and continues to implement initiatives to drive improvement.
Following the merger with IPMG and the subsequent consolidation of sites, PMP’s Lost Time Frequency Injury Rate (LITFR) performance increased from 5.9 occurrences per million man hours worked to 9.03 and its Significant Injury Frequency Rate (SIFR) increased from 16.3 to 22.1.
While the LTIFR is the accepted industry measurement standard, the company has adopted Significant Injury Frequency Rate (SIFR) as its internal key safety performance indicator. This metric has the advantage of not only indicating lost time injuries but also restricted work injuries and medically treated injuries.
The company also maintained its accreditation for Advanced SafetyMAP®, a recognised safety management system for its existing sites with its new NZ sites being ACC Tertiary Accredited and the former Hannanprint sites being accredited under ISO/AS4801 for Quality, Environment and Safety.
PMP continues it efforts to improve workplace safety through a variety of approaches and will have a particular focus this year on instituting its best safety practices across all sites following the merger with IPMG.
35
For
per
sona
l use
onl
y

DIRECTORS’ REPORTfor the year ended 30 June 2017
36
Matthew Bickford-Smith
CHAIRMAN
APPOINTED 2 JUNE 2009
Mr Bickford-Smith has been an independent Non-Executive Director of PMP since 2009 and has been Chairman of the Board of Directors since 2012. He has been a member of the Audit and Risk Management Committee since 2010. He has been a member of the Appointments and Compensation Committee from 2009 and was the Chairman of that Committee until 31 March 2016 and then again from 31 May 2017.
Mr Bickford-Smith is also a Director of Eastern Agricultural Australia. Mr Bickford- Smith was previously Chief Executive Officer of Ridley Corporation Limited from 2000 to 2007. He was previously with the Man Group and was Managing Director of the Australian operations from 1996 to 2000.
Mr Bickford-Smith has extensive commercial experience within finance, manufacturing, risk management and strategy.
Peter GeorgeB Comm, LLB
MANAGING DIRECTOR AND CEO
APPOINTED 22 OCTOBER 2012
Mr George was first appointed to the Board in 2001 and has held Board or management positions since. He has been the Managing Director and Chief Executive Officer since October 2012.
Mr George was also a Non-Executive Director of Asciano Ltd from 2007 to August 2016. He was also Executive Director, Strategy and Policy Development Cable and Wireless at Optus Ltd from 1998 to 2001, and the Executive Chairman of Nylex Limited from 2006 to 2008.
Mr George is an experienced Executive and Non-Executive Director with an extensive background in telecommunications, media and corporate finance including four years on the Board of Australia’s second largest telecommunications carrier, Optus Communications.
Anthony CheongFCA (Singapore)
NON-EXECUTIVE DIRECTOR
APPOINTED 4 MARCH 2014
Mr Cheong has been a Non-Executive Director and member of the Audit and Risk Management Committee since March 2014.
Mr Cheong is an Associate of the Institute of Chartered Accountants in England and Wales and a Fellow of the Institute of Singapore Chartered Accountants.
Mr Cheong is the Company Secretary for Fraser and Neave Limited, the holding Company for the Fraser and Neave group and holds directorships on various Fraser and Neave subsidiaries, associates and joint venture entities including Fraser and Neave Berhad on the BURSA Malaysia.
Mr Cheong has more than 28 years of varied financial and corporate experience in the packaging, property, printing, publishing, retail and education sectors.
Mr Cheong has indicated that he will be retiring from the Board on 30 September 2017.
The Directors of PMP Limited (referred to as “PMP” or “Company”) submit their report and the company’s consolidated financial report for the year ending 30 June 2017 and the Auditor’s report thereon.
For
per
sona
l use
onl
y

DIRECTORS’ REPORTfor the year ended 30 June 2017
37
Dhun KaraiB Comm, MBA, MAICD
NON-EXECUTIVE DIRECTOR
APPOINTED 1 JUNE 2016
Ms Karai his been an independent non-Executive Director since 1 June 2016. Ms Karai is a member of the Audit and Risk Management Committee since 1 June 2016. She was appointed Chairman of the Audit and Risk Management Committee on 26 August 2016.
Ms Karai’s experience spans over 20 years in senior executive roles in financial services and audit and risk management, initiating major transformational projects in Australia, New Zealand and the UK. Ms Karai held the position of Chief Manager Personal Markets with the Commonwealth Bank and for over ten years as the Head of Group Financial Services at Woolworths Limited. Currently Ms Karai is a Partner at Grant Thornton Australia.
Ms Karai’s other directorships have included being a Non-Executive Director of eftpos Payments Australia Limited and Indian financial services company, GI Technology Private Limited. Her committee memberships have included the Australian Payments Council, the National Financial Literacy Program and the International Merchants Advisory Group (USA).
Michael Hannan
NON-EXECUTIVE DIRECTOR
APPOINTED 1 MARCH 2017
Mr Hannan joined the PMP Board on 1 March 2017, following the merger of IPMG Group with PMP. Mr Hannan has been a member of the Appointments and Compensation Committee since 31 May 2017.
Mr Hannan was instrumental in taking IPMG into printing in the early 1970’s and in the early 1980’s into heatset printing and throughout that time continuing to drive the development of its community newspaper group and its consumer magazine empire.
Under Mr Hannan’s chairmanship, IPMG had the largest group of privately owned print and digital marketing services businesses in the southern hemisphere. He also has responsibility for significant Hannan family interests including industrial, commercial and rural and property portfolios together with other key investments.
Stephen AnsticeBA (Economics), Grad Dip (SIA)
NON-EXECUTIVE DIRECTOR
APPOINTED 1 MARCH 2017
Mr Anstice joined the PMP Board on 1 March 2017, following the merger of IPMG Group with PMP. Mr Anstice has been a member of the Audit and Risk Management Committee since 31 May 2017.
Mr Anstice is an immediate past non-Executive Director of IPMG and previously served as CEO of IPMG until June 2013. Mr Anstice also has extensive experience in investment banking and corporate advisory. He is the Chairman of CSG Ltd and a non-Executive Director of Audent Investments Pty Ltd. Mr Anstice has a Bachelor of Arts (Economics) from Macquarie University and a graduate diploma from the Securities Institute of Australia.
1. DirectorsThe current Directors of PMP are:
CHAIRMAN Matthew Bickford-Smith
CHIEF EXECUTIVE OFFICER Peter George
NON-EXECUTIVE DIRECTORS Anthony Cheong Dhun Karai Stephen Anstice Michael Hannan
For
per
sona
l use
onl
y

DIRECTORS’ REPORTfor the year ended 30 June 2017
38
Recommendation Section Reference
Principle 1 — Lay solid foundations for management and oversight Location
1.1 A listed entity should disclose: (a) the respective roles and responsibilities of its Board and management; and (b) those matters expressly reserved to the Board and those delegated to management.
5.1 “Board Charter”
1.2 A listed entity should: (a) undertake appropriate checks before appointing a person, or putting forward to security holders a candidate for election, as a director; and (b) provide security holders with all material information in its possession relevant to a decision on whether or not to elect or re-elect a director.
5.1 “Director appointment, training and continuing
education”
1.3 A listed entity should have a written agreement with each director and senior executive setting out the terms of their appointment.
5.1 “Director appointment, training and continuing
education”
1.4 The Company secretary of a listed entity should be accountable directly to the Board, through the chair, on all matters to do with the proper functioning of the Board.
3 “Company Secretary
- Qualifications & Experience”
5.1 “Board access to information and
independent advice”
2. Directors’ and Executives’ Disclosures
The disclosures required for Director share holdings and Director and Executive remuneration are included within the Remuneration Report.
3. Company Secretary – Qualifications & Experience
Alistair Clarkson (B Com, LLB, MBA, ACIS, GradDipACG).
Mr Alistair Clarkson was appointed Company Secretary of PMP Limited on 24 April 2009 and has been Company Secretary of PMP’s subsidiaries since December 2005. He is accountable directly to the Board, through the chair, on all matters to do with the proper functioning of the Board.
Mr Clarkson holds a Bachelor of Commerce, a Bachelor of Laws, a Masters of Business Administration and a post graduate diploma of Applied Corporate Governance. He is an associate of the Institute of Chartered Secretaries and a member of the Law Society of NSW.
As Company Secretary of PMP, Mr Clarkson is responsible for managing the Company’s corporate governance framework, its continuous disclosure and listing rule compliance and managing all matters relating to the Company’s Board of Directors and Board Committees.
4. Directors’ MeetingsThe number of Directors’ meetings (including meetings of Board Committees) and the number of meetings attended by each of the Directors of PMP during the financial year were:
M. B
ickfo
rd-S
mith
P. Ge
orge
A Ch
eong
N. S
park
sD.
Kar
aiS.
Ans
tice
M. H
anna
nP.M
argi
n
Board of Directors
Attended 15 15 15 14 15 4 4 3
Maximum possible attended 15 15 15 15 15 4 4 4
Audit & Risk Management
Attended 4 <a> 4 <a> 4 1 <a> 1
Maximum possible attended 4 <a> 4 <a> 4 1 <a> 1
Appointment & Compensation
Attended 2 <a> <a> 2 <a> <a> 1 <a>
Maximum possible attended 2 <a> <a> 2 <a> <a> 1 <a>
Table 1 – Directors’ Meetings
<a> Directors may attend Committee meetings but where not Committee members, their attendance is not recorded.
5. Corporate Governance Statement PMP’s corporate governance is based on the belief that good governance practices are a critical prerequisite of a successful Company and is intrinsically linked to creation of value. The core principles of good corporate governance that PMP has based its corporate governance framework on are:
• Ethical business conduct;
• Responsible management and remuneration;
• Sound financial reporting and risk management; and
• Appropriate communication and disclosure.
PMP’s corporate governance framework is designed and implemented to accord with the best practice recommendations set by the ASX Governance Council’s Corporate Governance principles and
recommendations (“ASX Principles”) where practicable. The following table indicates where specific ASX principles are dealt with within this Statement and that PMP has followed the recommendations other than recommendations 1.5, 2.1, 2.4, 4.1, 7.2 and 8.1. The departures from the Recommendations predominantly relate to the size and structure of the Board and its Committees.
With the recent change in composition of the Board following the resignation of two independent directors and the appointment of the IPMG nominated directors, the Board and Committees does not currently comprise of a majority of independent directors. The Board is in the process of recruiting independent directors in order that the majority of directors on the Board and Committees are independent. The PMP Board comprised a majority of independent directors until the appointment of two IPMG nominated directors. This flowed through to the Board Committees. Refer Section 5.2.
Mr Clarkson has been Corporate Counsel for PMP since 2001 and General Counsel since 2009. Prior to joining PMP, Mr Clarkson was an associate at a law firm in New Zealand.
For
per
sona
l use
onl
y

DIRECTORS’ REPORTfor the year ended 30 June 2017
39
Recommendation Section Reference
1.5 A listed entity should: (a) have a diversity policy which includes requirements for the Board or a relevant committee of the Board to set measurable objectives for achieving gender diversity and to assess annually both the objectives and the entity’s progress in achieving them; (b) disclose that policy or a summary of it; and (c) disclose as at the end of each reporting period the measurable objectives for achieving gender diversity set by the Board or a relevant committee of the Board in accordance with the entity’s diversity policy and its progress towards achieving them, and either: (1) the respective proportions of men and women on the Board, in senior executive positions and across the whole organisation (including how the entity has defined “senior executive” for these purposes); or (2) if the entity is a “relevant employer” under the Workplace Gender Equality Act, the entity’s most recent “Gender Equality Indicators”, as defined in and published under that Act.
5.5 “Diversity Policy”
1.6 A listed entity should: (a) have and disclose a process for periodically evaluating the performance of the Board, its committees and individual directors; and (b) disclose, in relation to each reporting period, whether a performance evaluation was undertaken in the reporting period in accordance with that process.
5.1 “Board Performance
Evaluation”
1.7 A listed entity should: (a) have and disclose a process for periodically evaluating the performance of its senior executives; and (b) disclose, in relation to each reporting period, whether a performance evaluation was undertaken in the reporting period in accordance with that process.
7.4 “Senior Executive
Performance Evaluation”
Principle 2 — Structure the Board to add value
2.1 The Board of a listed entity should: (a) have a nomination committee which: (1) has at least three members, a majority of whom are independent directors; and (2) is chaired by an independent director, and disclose: (3) the charter of the committee; (4) the members of the committee; and (5) as at the end of each reporting period, the number of times the committee met throughout the period and the individual attendances of the members at those meetings; or (b) if it does not have a nomination committee, disclose that fact and the processes it employs to address Board succession issues and to ensure that the Board has the appropriate balance of skills, knowledge, experience, independence and diversity to enable it to discharge its duties and responsibilities effectively.
5.2 “Appointments and
Compensation Committee”
2.2 A listed entity should have and disclose a Board skills matrix setting out the mix of skills and diversity that the Board currently has or is looking to achieve in its membership.
5.1 “Board Composition and
Membership”
2.3 A listed entity should disclose: (a) the names of the directors considered by the Board to be independent directors; (b) if a director has an interest, position, association or relationship of the type described in Box 2.3 but the Board is of the opinion that it does not compromise the independence of the director, the nature of the interest, position, association or relationship in question and an explanation of why the Board is of that opinion; and (c) the length of service of each director.
1 “Directors”
5.1 “Board Independence”
2.4 A majority of the Board of a listed entity should be independent directors. 1 “Directors”
5.1 “Board Independence”
2.5 The chair of the Board of a listed entity should be an independent director and, in particular, should not be the same person as the CEO of the entity.
5.1 “Chairman”
2.6 A listed entity should have a program for inducting new directors and provide appropriate professional development opportunities for directors to develop and maintain the skills and knowledge needed to perform their role as directors effectively.
5.1 “Director appointment, training and continuing
education”
Principle 3 — Act ethically and responsibly
3.1 A listed entity should: (a) have a code of conduct for its directors, senior executives and employees; and (b) disclose that code or a summary of it.
5.5 “Code of Conduct”
Principle 4 — Safeguard integrity in corporate reporting
4.1 The Board of a listed entity should: (a) have an audit committee which: (1) has at least three members, all of whom are Non-Executive Directors and a majority of whom are independent directors; and (2) is chaired by an independent director, who is not the chair of the Board, and disclose: (3) the charter of the committee; (4) the relevant qualifications and experience of the members of the committee; and (5) in relation to each reporting period, the number of times the committee met throughout the period and the individual attendances of the members at those meetings; or (b) if it does not have an audit committee, disclose that fact and the processes it employs that independently verify and safeguard the integrity of its corporate reporting, including the processes for the appointment and removal of the external auditor and the rotation of the audit engagement partner.
5.2 “Audit and Risk
Management Committee”
For
per
sona
l use
onl
y

DIRECTORS’ REPORTfor the year ended 30 June 2017
40
Recommendation Section Reference
4.2 The Board of a listed entity should, before it approves the entity’s financial statements for a financial period, receive from its CEO and CFO a declaration that, in their opinion, the financial records of the entity have been properly maintained and that the financial statements comply with the appropriate accounting standards and give a true and fair view of the financial position and performance of the entity and that the opinion has been formed on the basis of a sound system of risk management and internal control which is operating effectively.
5.3 “Management
Representation”
4.3 A listed entity that has an AGM should ensure that its external auditor attends its AGM and is available to answer questions from security holders relevant to the audit.
5.4 “Investor Relations”
Principle 5 — Make timely and balanced disclosures
5.1 A listed entity should: (a) have a written policy for complying with its continuous disclosure obligations under the Listing Rules; and (b) disclose that policy or a summary of it.
5.5 “Disclosure and
Shareholder Communication Policy”
and on the Website
Principle 6 — Respect the rights of security holders
6.1 A listed entity should provide information about itself and its governance to investors via its website. 5.5 “Disclosure and
Shareholder Communication Policy”
and on the Website
6.2 A listed entity should design and implement an investor relations program to facilitate effective two-way communication with investors.
5.4
“Investor Relations”
6.3 A listed entity should disclose the policies and processes it has in place to facilitate and encourage participation at meetings of security holders.
5.4 “Investor Relations”
6.4 A listed entity should give security holders the option to receive communications from, and send communications to, the entity and its security registry electronically.
5.4 “Investor Relations” and
on the Website
Principle 7 — Recognise and manage risk
7.1 The Board of a listed entity should: (a) have a committee or committees to oversee risk, each of which: (1) has at least three members, a majority of whom are independent directors; and (2) is chaired by an independent director, and disclose: (3) the charter of the committee; (4) the members of the committee; and (5) as at the end of each reporting period, the number of times the committee met throughout the period and the individual attendances of the members at those meetings; or (b) if it does not have a risk committee or committees that satisfy (a) above, disclose that fact and the processes it employs for overseeing the entity’s risk management framework.
5.2 “Audit and Risk
Management Committee”
7.2 The Board or a committee of the Board should: (a) review the entity’s risk management framework at least annually to satisfy itself that it continues to be sound; and (b) disclose, in relation to each reporting period, whether such a review has taken place.
5.3 “Risk Management
Framework”
7.3 A listed entity should disclose: (a) if it has an internal audit function, how the function is structured and what role it performs; or (b) if it does not have an internal audit function, that fact and the processes it employs for evaluating and continually improving the effectiveness of its risk management and internal control processes.
5.3 “Internal Audit”
7.4 A listed entity should disclose whether it has any material exposure to economic, environmental and social sustainability risks and if it does how it manages or intends to manage those risks.
6.7 “Risks, Likely
Developments and Future Prospects”
Principle 8 — Remunerate fairly and responsibly
8.1 The Board of a listed entity should: (a) have a remuneration committee which: (1) has at least three members, a majority of whom are independent directors; and (2) is chaired by an independent director, and disclose: (3) the charter of the committee; (4) the members of the committee; and (5) as at the end of each reporting period, the number of times the committee met throughout the period and the individual attendances of the members at those meetings; or (b) if it does not have a remuneration committee, disclose that fact and the processes it employs for setting the level and composition of remuneration for directors and senior executives and ensuring that such remuneration is appropriate and not excessive.
5.2 “Appointments and
Compensation Committee”
For
per
sona
l use
onl
y

DIRECTORS’ REPORTfor the year ended 30 June 2017
41
Recommendation Section Reference
8.2 A listed entity should separately disclose its policies and practices regarding the remuneration of Non-Executive Directors and the remuneration of executive directors and other senior executives.
7.3 “Remuneration Structure”
7.6 “Chief Executive Officer
(“CEO”)”
7.8 “Non-Executive Director
Remuneration”
8.3 A listed entity which has an equity-based remuneration scheme should: (a) have a policy on whether participants are permitted to enter into transactions (whether through the use of derivatives or otherwise) which limit the economic risk of participating in the scheme; and (b) disclose that policy or a summary of it.
7.3 “Long terms Incentives
(“LTIs”)”
5.1 Board of DirectorsBOARD Directors are selected to achieve a broad range of skills, experience and expertise complimentary to the Group’s activities. Details of individual Directors are in Section 1. The Board comprises six Directors, being; the Non-Executive Chairman, the Managing Director/Chief Executive Officer and four other Non-Executive Directors.
The roles of Chairman and Managing Director are not exercised by the same individual.
PMP’s Board Charter sets out the role, responsibilities and powers of the Board of Directors and the Managing Director.
BOARD CHARTER The Company’s Board is responsible for:
• Overseeing the Company, including reviewing, ratifying and monitoring systems of risk management, internal control, code of conduct and legal compliance, that are designed to ensure compliance with regulatory and prudential requirements;
• Appointing and removing the Chief Executive Officer (“CEO”) and ratifying the appointment and, where appropriate, the removal of the Chief Financial Officer (“CFO”) and the Company Secretary;
• Providing input into and final approval of management’s development of corporate strategy and performance objectives;
• Monitoring performance against Board approved objectives, targets and strategies;
• Succession planning for the CEO and senior executives;
• Approving the progress of major capital expenditure, capital management, acquisitions and divestitures;
• Approving and monitoring financial and other reporting; and
• Approving delegated authority limits for senior executives.
The Managing Director, as CEO, is responsible for:
• Implementing Board and Management decisions;
• Conducting the Company’s operational, strategic, management and general business and affairs; and
• Bringing material and other relevant matters to the attention of the Board in an accurate and timely manner.
The Board has set through the Delegation of Authority Policy specific limits to management’s ability to incur expenditure, enter into contracts or acquire or dispose of assets or businesses without Board approval.
The Charter requires that PMP’s Board consist of a majority of independent Non-Executive Directors who have a broad range of commercial expertise and experience and/ or appropriate professional qualifications. They must also demonstrate a proven ability and capacity to monitor Company performance and participate in strategy development.
With the recent change in composition of the Board following the resignation of two independent directors and the appointment of the IPMG nominated directors, the Board and Committees does not currently comprise of a majority of independent directors. The Board is in the process of recruiting independent directors in order that the majority of directors on the Board and Committees are independent.
While it is not mandatory for directors to hold shares in PMP, directors are encouraged to own shares in PMP and where possible they do so. Their shareholdings are disclosed via the ASX and in the Remuneration Report.
BOARD COMPOSITION AND MEMBERSHIPThe Board (through the Appointments and Compensation Committee) seeks to ensure that the Board and its Committees continue to have the right balance of skills, knowledge qualifications, diversity and business experience necessary to direct the Company in accordance with high standards of corporate governance.
When considering appointments, the Board considers the skills, experience and expertise which they believe to be particularly relevant for that available position. In doing so the Board takes into account the existing collective capability of the Board, PMP’s strategy and the prevailing and expected market conditions.
In respect of diversity on the Board, Directors strongly believe that differences in gender, age, ethnicity and cultural background in Board membership encourage diversity of thought and decision making. This will, in turn, drive and improve business efficiency and results for the Company and shareholders.
For
per
sona
l use
onl
y

DIRECTORS’ REPORTfor the year ended 30 June 2017
42
BOARD SKILLS MATRIXThe table below sets out some of the key skills of the Directors and the extent to which they are represented on the Board. The directors therefore believe that the Board has collectively the appropriate mix of backgrounds, expertise, experience and qualifications to effectively advise and set the Company’s strategic direction and govern on behalf of shareholders.
Name Skills and experience Extent of representation
Stephen Anstice
Manufacturing
Investment Strategy
Information Technology
Corporate Finance
Risk Management
Board
Audit and Risk Management Committee
Matthew Bickford-Smith
Finance
Strategy
Manufacturing
Risk Management
Board
Audit and Risk Management Committee
Appointments and Compensation Committee
Anthony Cheong
Finance
Publishing
Printing
Retail
Board
Audit and Risk Management Committee
Peter George
Finance
Telecommunications
Strategy
Corporate Finance
Transformation
Board
Michael Hannan
Printing
Publishing
Manufacturing
Business Transformation and Diversification
Strategy and Business Development
Board
Appointments and Compensation Committee
Dhun Karai
Finance
Risk Management
Business Transformation
Digital and Data Analytics
Retail
Strategy
Board
Audit and Risk Management Committee
For
per
sona
l use
onl
y

DIRECTORS’ REPORTfor the year ended 30 June 2017
43
DIRECTOR RETIREMENT AND RE-ELECTIONThe Constitution requires Directors to retire at the third AGM following the election or most recent re-election. The appointment of any new Directors will be based on the principle of further strengthening the diversified composition of the Board.
When a Director stands for re-election, the Company will provide such information as is necessary to allow the shareholders to make an informed decision around the directors appointment including: biographical details and their relevant qualifications and experience and the skills they bring to the Board; details of any other material directorships currently held by the candidate; the term of office currently served by the director; if the Board considers the director to be an independent director, a statement to that effect; and a statement by the Board as to whether it supports the election or re-election of the candidate.
BOARD PERFORMANCE EVALUATION The Appointments and Compensation Committee is responsible for, amongst other things, evaluating the performance of the Board and individual Directors. The Chairman continuously reviews and discusses with the Directors his, their and their collective contribution to the Board.
BOARD INDEPENDENCE The Board’s policy is that there should be a majority of independent Non-Executive Directors on the Board and this requirement is embodied in the Board Charter, ensuring that all Board discussions and decisions have the benefit of independent judgment.
With the recent change in composition of the Board following the resignation of two independent Directors and the appointment of the IPMG nominated Directors, the Board does not currently comprise of a majority of independent Directors. The Board is in the process of recruiting independent Directors in order that the majority of Directors on the Board are independent.
The Board reviews the independence of the Directors before they are appointed, on an annual basis and at any other time where the circumstances of a Director changes such as to require reassessment. Such assessment considers the factors relevant to assessing independence consistent with the ASX Principles.
The Board assesses materiality of any contractual relationship that may affect independence on a case-by-case basis. The following directors are not considered to be independent: Mr Cheong, who is directly associated with Fraser & Neave Ltd, a substantial shareholder of the Company; Mr Hannan, who is a substantial shareholder of the Company; and Mr Anstice who is associated with substantial shareholders of the Company.
CONFLICTS OF INTERESTUpon their appointment, Directors are requested to disclose to the Company any interest or directorships which they may hold with other organisations and to update this information if it changes during the course of their directorship. Directors and senior management are also required to identify any conflicts of interest they may have in dealing with PMP’s affairs and refrain, where required, from participating in any discussion or voting on those matters.
CHAIRMANThe Chairman of the Board, Mr Matthew Bickford-Smith, is an independent Non-Executive Director. The Chairman is responsible for leadership and effective performance of the Board and the maintenance of productive relations between the Directors and the management team. The Chairman’s responsibilities are set out in more detail in the Board Charter.
DIRECTOR APPOINTMENT, TRAINING AND CONTINUING EDUCATIONBefore the appointment of any Director the Company undertakes, with the consent of the candidate, appropriate checks in relation to the potential Director’s character, experience, education, criminal
record and bankruptcy history. The Appointments and Compensation Committee will also seek from the candidate details of his or her other commitments and an indication of time involved with those commitments, and acknowledgement that he or she will have sufficient time to fulfil his or her responsibilities as a Director.
When a Director stands for election for the first time, the Company will require such information as is necessary to allow the shareholders to make an informed decision around the Directors appointment including: biographical details, including their relevant qualifications and experience and the skills they bring to the Board; details of any other material Directorships currently held by the candidate; any material adverse information revealed by the checks; details of any interest, position, association or relationship that might influence, or reasonably be perceived to influence their capacity to bring an independent judgement; and if the candidate will qualify as an independent Director.
Each Non-Executive Director has signed a letter of appointment detailing the terms of their appointment, which sets out the key terms and conditions of their appointment, including duties, rights and responsibilities and the matters recommended in the ASX’s Principles.
Induction training is provided to all new Directors. This includes amongst other things an induction manual with information on the Company and its financial position, culture and values, Company policies, rights and responsibilities of Directors and the role of the Board and management. The Board has regular discussions with the CEO and management and is invited to attend tours of PMP’s operational sites.
Directors are expected to maintain the skills required to discharge their obligations to the Company. PMP undertakes an ongoing program to keep Directors abreast of the nature of its business, current issues and corporate strategy. Directors also have access to, and are encouraged to undertake, continuing education opportunities to update and enhance their skills and knowledge and have a strong working relationship with operational management.
BOARD ACCESS TO INFORMATION AND INDEPENDENT ADVICESubject to identification of any conflict of interest, Directors have direct access to senior executives as required and to any Company information in the possession of management it considers necessary to make informed decisions and to discharge its responsibilities.
All Directors have access to the Company Secretary who is accountable to the Board, through the Chairman. The Board must approve the appointment and removal of the Company Secretary.
Any Director can seek independent professional advice in the discharge of their duties and responsibilities to PMP. PMP will reimburse reasonable expenses incurred in obtaining this advice. Unless the Chairman determines otherwise, the advice will generally be circulated to the Board.
BOARD MEETINGSThe Board and the Committees meet on a regular basis and additional meetings are called when required to address specific issues. The Chairman, in conjunction with the CEO and the Company Secretary, sets the agenda for each meeting. Any Director may request matters to be included on the agenda.
Directors receive Board papers in advance of the Board meetings and these papers provide them with sufficient information to enable them to participate in informed discussion at each meeting. The Board will also provide for time at board meetings to meet without the presence of management.
Details of Board and Committee meetings held during the 2017 financial year and attendance at those meetings are set out on page 38 of this Report.
For
per
sona
l use
onl
y

DIRECTORS’ REPORTfor the year ended 30 June 2017
44
5.2 Board CommitteesROLE, MEMBERSHIP AND CHARTERSThe Board has the ability under the Constitution to delegate its powers and responsibilities to Committees of the Board. This allows the Directors to spend additional and more focused time on specific issues.
The Board has established standing Committees to assist with the effective discharge of its duties, as follows:
• Audit and Risk Management Committee; and
• Appointments and Compensation Committee.
Membership of the Committees is based on Directors’ qualifications, skills and experience.
Non-Committee members, including the CEO, attend Committee meetings by invitation.
Each Committee operates under a specific Charter approved by the Board, detailing its role, duties and membership requirements. The Board reviews the appropriateness of the existing Committee structure, as well as the membership and Charter of each Committee.
AUDIT AND RISK MANAGEMENT COMMITTEE Members
The current members are:
• Dhun Karai* (Chairman)
• Matthew Bickford-Smith
• Anthony Cheong
• Stephen Anstice
Attendance
Committee Member Meetings attended
D Karai* (Chairman) 4 (out of a possible 4)
M Bickford-Smith 4 (out of a possible 4)
A Cheong 4 (out of a possible 4)
S Anstice# 1 (out of a possible 1)
P Margin^ 1 (out of a possible 1)
^ Retired on 25 August 2016.
* Appointed Chairman of the Audit and Risk Management Committee on 26 August 2016.
# Appointed 31 May 2017
CompositionThe charter provides that the Committee must comprise:
• At least three Non-Executive Directors, a majority of whom are required to be independent;
• Members who are financially literate;
• At least one member shall have relevant qualifications and experience;
• Some members shall have an understanding of the industry in which PMP operates; and
• The Chairman must be an independent Non-Executive Director who is not the Chairman of the Board.
Since the appointment of Mr Anstice to the Audit and Risk Management Committee on 31 May 2017, the committee has not comprised of a majority of independent directors. This Committee will have a majority of independent directors from 30 September 2017 following Mr Cheong’s retirement from the Board.
ResponsibilitiesThe Audit and Risk Management Committee provides assistance to the Board in relation to its corporate governance and oversight responsibilities by reviewing, assessing and making recommendations in relation to:
• Ethical considerations and compliance with the Code of Conduct;
• Financial reporting;
• Internal control structure;
• Risk management framework and systems;
• Policies to reduce exposure to fraud;
• Health, safety and the environment; and
• Internal and external audit functions.
PMP combines the roles and responsibilities of the Audit and the Risk committees in its Audit and Risk Management Committee.
The Audit and Risk Management Committee has direct and unlimited access to the external auditors. The external and internal auditors and the Group OHSE manager have direct and unlimited access to the Audit and Risk Management Committee.
APPOINTMENTS AND COMPENSATION COMMITTEEMembers
The current members are:
• Matthew Bickford-Smith (Chairman)
• Michael Hannan
Attendance
Committee Member Meetings attended
M Bickford-Smith (Chairman) 2 (out of a possible 2)
M Hannan 1 (out of a possible 1)
N Sparks* 1 (out of a possible 1)
* Naseema Sparks resigned 30 June 2017. Matthew Bickford-Smith resigned as Chairman on 31 March 2016 and was re-appointed as Chairman on 1 July 2017.
Michael Hannan appointed 31 May 2017.
CompositionThe Committee consisted of two independent directors until 31 May 2017. Mr Hannan joined the Committee on 31 May 2017. Upon Ms Sparks resignation on 30 June 2017 the Committee no longer had a majority of independent directors. The Board is currently in the process of recruiting additional independent directors in order that the majority of directors on the Board are independent and that following their appointment an independent director will also be appointed to this committee in order to provide for the majority of directors on the committee to be regarded as independent.
The committee’s members and their record of attendance in the last financial year are set out above and in Section 4.
ResponsibilitiesPMP combines the roles and responsibilities of the Nomination Committee and the Remuneration Committee in its Appointments and Compensation Committee.
The Appointments and Compensation Committee has ultimate authority for executive remuneration policy. The Remuneration Report provides further detail on the role of the Committee in respect of compensation.
In relation to appointments, the Committee:
• Reviews Director competence standards and Board succession plans; and
For
per
sona
l use
onl
y

DIRECTORS’ REPORTfor the year ended 30 June 2017
45
• Evaluates the Board’s performance and makes recommendations for appointing or removing Directors.
In relation to compensation, the Committee makes recommendations to the Board on:
• Executive remuneration and incentive policies;
• Senior management remuneration packages;
• Recruitment, retention and termination policies for senior management;
• Incentive schemes;
• Superannuation arrangements; and
• The remuneration framework for Directors.
The Committee is also responsible for evaluating potential candidates for executive positions, including the role of CEO, and overseeing the development of executive succession plans.
The CEO has the authority to employ and remunerate executives within the scope of the policy established by the Committee. In carrying out its duties, the Committee is committed to providing sound remuneration policies and practices that enable PMP to:
• Attract and retain high quality executives and Directors who are dedicated to the interests of PMP shareholders; and
• Fairly and responsibly reward executives, while taking into account the interests of shareholders, the Company’s performance, performance of the relevant executive and market conditions.
In executing its responsibilities, the Committee has unlimited access to senior management. It also has the Board’s authority to seek information it requires from employees and external parties and obtain outside legal or other professional advice at the expense of the Company.
5.3 Risk ManagementPMP believes that shareholder value is driven by taking considered risks, and that effective risk management is fundamental to achieving the strategic, operational and compliance objectives of PMP. PMP views risk management as a continuous process and a fundamental driver of effective corporate governance and value generation.
The Board is responsible for overseeing the implementation of an effective system of risk management and internal control. The responsibility for designing, implementing and maintaining a sound system of risk management and internal control has been delegated to management through the CEO.
The Audit and Risk Management committee assists the Board with its oversight responsibility by reviewing, assessing and making recommendations to the Board in relation to the risk management framework and internal control structures put in place by management.
The CEO meets at least quarterly with the CFO and divisional managers to oversee the implementation and effective operation of the systems of internal controls and risk management, and to review the material strategic, operational and compliance risks. Management is also responsible for completing, on a six monthly basis, the internal control questionnaire supporting the Section 295A Corporations Act compliance statements; and attending Audit and Risk Management Committee meetings as required, to assist the committee in its oversight of risk.
PMP’s policy is to apply a common framework across all businesses to identify material risks and implement appropriate mitigation processes. To this end, PMP maintains a risk management framework that provides a consistent and systematic view of the risks faced by the Company. The risk identification, analysis, treatment and monitoring procedures follow Risk Management Standard ISO: 31000 and Principle 7 of the ASX Principles.
RISK MANAGEMENT FRAMEWORKThe risk management framework incorporates input from a range of existing systems, programs and policies including:
• A comprehensive health, safety and environment program;
• A delegation of authority policy, including guidelines and approval limits for operational and capital expenditure and investments;
• A comprehensive annual insurance program;
• A Board approved finance policy to manage exposure to credit and liquidity risks;
• Annual budgeting and monthly reporting systems for all divisions to monitor performance against budget targets; and
• The identification and assessment of strategic, operational and compliance risks during the annual strategic planning cycle, and the quarterly risk management reviews, and recording all identified risks in a comprehensive Risk Register.
The risk management framework is periodically independently reviewed to provide assurance as to the adequacy and effectiveness of the framework, with the last review being undertaken in December 2016.
INHERENT OPERATIONAL RISKSThe Company believes there are a number of operational risks which are inherent in the industry in which it operates. These include:
• Fluctuations in demand volume and the effect of consumer confidence on retail marketing;
• Migration of advertising, entertainment and information media from print to digital platforms;
• Reliance on continuity of supply of utilities, raw material inputs and distribution services; and
• Fluctuations in cost of supply of utilities, raw material inputs and distribution services.
The identification of these risks is provided to assist stakeholders to understand the nature of risks faced by PMP and the industry in which it operates. It is not an exhaustive list.
Risks are considered from an economic, environmental and social sustainability perspective with management plans developed to address these risks.
MANAGEMENT REPRESENTATION Detailed and comprehensive questionnaires are completed by all business units and functional management on a six monthly basis. These questionnaires include management’s assessment of risk management, financial reporting and the internal control environment operating within each business unit. The questionnaires are reviewed by executive management as part of the half-yearly reporting to the market and to achieve compliance with Section 295A of the Corporations Act and Recommendation 4.2 of the ASX Principles.
Based on the questionnaires, the Board has received written assurance from the CEO and the CFO that, to the best of their knowledge and belief, the declaration provided to them is founded on a sound system of risk management and internal control and that the system is operating effectively in relation to financial reporting risks.F
or p
erso
nal u
se o
nly

DIRECTORS’ REPORTfor the year ended 30 June 2017
46
INTERNAL AUDITThe internal auditor function conducts a series of risk-based internal audits based on a rolling annual plan which is aligned to the risks identified in the Company’s risk register, and agreed with management.
In order to ensure the independence of the internal audit function, the Audit and Risk Management Committee review and endorse the planned internal audit activities. The internal audits were undertaken by an external firm of accountants until 23 June 2017, and by the Company’s in-house internal audit function thereafter.
5.4 Investor RelationsPMP engages its shareholders at its AGM, providing investor present-ations following the full year and half-year results, and upon request. The investor presentations are lodged with the ASX and the contents of those presentations are available from the Company’s website.
PMP facilitates participation at shareholder meetings by arranging for the meetings to be at convenient times and locations, and provides for direct voting to allow shareholders to vote ahead of the meeting without having to attend, or to appoint a proxy. The Chairman at the AGM provides reasonable time for shareholders to ask questions or make comments on the management of the Company. The Company’s external auditor attends the AGM.
PMP provides its shareholders with the option to receive and send communications electronically to the Company and its share registry.
5.5 Governance PoliciesCODE OF CONDUCT*The Code of Conduct is PMP’s cornerstone corporate governance policy. The Code of Conduct provides a consistent understanding of the expected behaviour towards each stakeholder. It stipulates that:
• PMP is to conduct its business with honesty, integrity and respect for the interests of its stakeholders;
• PMP employees will avoid any personal, financial or other real or apparent conflicts of interest that could compromise the performance of their duties;
• PMP will continually strive to be a good corporate citizen, including complying with laws and regulations of Australia and New Zealand and in each state and territory in which it operates;
• PMP employees will ensure that resources of PMP are used for their intended use;
• PMP is to respect the privacy of private information, including customer, business partner and fellow employee information;
• PMP is to continually strive to provide a safe and healthy work environment for all employees;
• PMP is to recognise and act upon its responsibility to limit negative impacts on the environment and the communities within which it operates; and
• PMP is to ensure that there is a clear communication process for material items of concern between employees and the Board via open and non-hierarchical communications including whistleblower provisions.
WHISTLEBLOWER POLICY AND FRAUD AND CORRUPTION PREVENTIONKey elements of PMP’s whistleblower policy are as follows:
• PMP encourages employees to report, in good faith, any violations of the standards, requirements and expectations described in the Code of Conduct;
• require appropriate action be taken in response to any such violations; and
• require that where an employee reports, in good faith, an actual or suspected violation of this Code of Conduct, the position of the reporting officer will be protected and remain confidential unless disclosure is required by law.
TRADING IN PMP SHARESDirector and Executive Share Purchasing Policy*
Under its share purchasing policy, PMP Directors and Executives are not permitted to buy and sell shares in the Company when they are in possession of information that is not generally available and if it were available, it would - or would be likely to – influence investors in trading PMP shares, and they also may not trade in PMP shares during specific black-out periods. The blackout periods are:
a. the period from 1 January through to the day half-year results are announced (including the day half-year results are announced);
b. the period from 1 July through to the day full year results are announced (including the day full year results are announced); and
c. the period of 30 days immediately leading up to the Annual General Meeting (including the day of the Annual General Meeting).
The Board of PMP may also declare a black out period for a specified period at other times (such as prior to the announcement to the Australian Securities Exchange of a significant event such as change in control transaction or capital raising). At all other times these officers are permitted to trade in PMP shares where such trading has received the prior approval from the CEO.
APPROPRIATE COMMUNICATION AND DISCLOSURE PMP recognises the importance of open and effective communication with all stakeholders. Therefore, PMP requires its officers and employees to act at all times with integrity and in accordance with the law, including the disclosure requirements of the ASX Listing Rules, ASX Principles and the Corporations Act. PMP has a Disclosure Committee comprising the CEO, CFO and Company Secretary/General Counsel, which meet as and when required.
DISCLOSURE AND SHAREHOLDER COMMUNICATION POLICY* PMP’s Disclosure Policy requires any price sensitive information concerning PMP that is required to be disclosed to the market, be communicated to the ASX immediately and before any other person. The policy prevents selective disclosure by:
• ensuring only authorised spokespeople comment on behalf of PMP; and
• providing a process for issuing any external statement or press release that has been previously channelled through the CEO.
It also sets out protocols for handling trading halts, responding to market speculation and avoiding inadvertent disclosure. The Policy ensures shareholders can make informed decisions about their investment in PMP by providing them with:
• the annual and half-year reports;
• disclosures made to ASX;
• notices and explanatory memoranda of General Meetings;
• the AGM, where the external auditor will be available to answer questions about the audit; and
• its website www.pmplimited.com.au.
DIVERSITY POLICY* Diversity Policy Statement
PMP strives to provide industry leadership for workforce diversity by:
• integrating diversity principles in all aspects of human resources management policies such as recruitment, selection and training;
• considering options to enable flexible working practices;
• facilitating equal employment opportunities based on merit; and
• striving to build safe working environments by taking action against inappropriate workplace and business behaviour that does not value diversity including discrimination, harassment, bullying, victimisation and vilification.
For
per
sona
l use
onl
y

DIRECTORS’ REPORTfor the year ended 30 June 2017
47
During the reporting period the Company produced its public report to the Workplace Gender Equality Agency, a copy of which can be found on PMP’s website. As a diverse business, PMP employs a broad range of occupational groups to staff its creative, print and distribution businesses. Consequently PMP seeks to attract talent from different labour markets, trades and professions. PMP’s current gender profile reflects our reliance on trades and engineers in our print business and the associated lack of gender balance in that sector. Measurable objectives have not been set pending the merger with IPMG and while the subsequent site consolidations and restructuring is being undertaken.
The proportion of females employed in the Company under the following classifications is set out as follows:
Board of Directors 17%
PMP Executive Management Team 11%
PMP Group Employees 30%
* Summaries of these documents are available in the Corporate Governance Section of PMP Limited’s web site: www.pmplimited.com.au
6. OTHER MATTERS6.1 Remuneration Policy The Group’s remuneration policies for Directors and management are detailed in the Remuneration Report included in this report. Non-Executive Directors’ fees are within the limits set by shareholders at the 2004 Annual General Meeting, and are set at levels which fairly represent the responsibilities of, and time spent by, the Non-Executive Directors on Group matters.
6.2 Principal ActivitiesThe principal activities of the PMP Group are marketing services, digital premedia, commercial printing, letterbox delivery, and magazine distribution services.
6.3 ResultsThe consolidated result after income tax of the PMP Group for the financial year ended 30 June 2017 was a $126.4 million loss (2016: $0.2 million profit).
6.4 DividendsDividends paid to members during the financial year were as follows:
2017$000
Final dividend for the year ended 30 June 2016 of 2.4 cents, unfranked paid on 7 October 2016
7,636
7,636
2016$000
Final dividend for the year ended 30 June 2015 of 1.8 cents, 50% franked paid on 6 October 2015
5,873
Interim dividend for the year ended 30 June 2016 of 1.2 cents, unfranked paid on 6 April 2016
3,842
9,715
6.5 Review of OperationsFor a full report on operations for the FY17 year, see the CEO’s Review on pages 12 to 35 of this Annual Report.
In summary, Sales at $1,051.5 million were up $235.5 million or 28.9% on higher sales at both Gordon & Gotch and Print Australia. FY17 EBITDA (before significant items) at $32.2 million fell by $19.0 million or 37% compared to $51.2 million in the prior period as lower profits across the
PMP Group more than offset four months of profits from IPMG Print and Marketing Services.
Sales at Print Australia at $263.0 million were $63.3 million or 31.7% higher as four months of IPMG Print sales offset lower volumes and sell prices at PMP Print. EBITDA (before significant items) at $16.7 million was down $9.7 million as lower sell prices and volumes at PMP Print more than offset four months of IPMG Print profits and integration savings.
Distribution and Marketing Services including Gordon & Gotch had sales of $595.0 million up $114.3 million or 23.8% with Gotch sales up $124.7 million on new contract volumes and new IPMG Marketing Services sales mostly offsetting reductions in Distribution sales down 12% while Griffin tonnes were down 18% on contract losses. EBITDA (pre significant items) was $7.0 million lower as four months of IPMG Marketing Services profits were more than offset by lower outcomes at Distribution and Griffin while Gotch profits were down $0.2 million.
PMP New Zealand sales were up $57.9 million or 42.7% after Gotch revenues rose by $60.4 million on new contract wins, while heatset sales dropped on lower volumes and sell prices. EBITDA (pre significant items) was down $2.6 million as higher outcomes at Gotch were offset by lower EBITDA in Print which was impacted by lower sell prices and volumes while tight cost controls provided a partial offset.
A net loss after tax of $126.4 million was recorded for FY17 which was $126.6 million lower than the $0.2 million profit in FY16 due to a $19.0 million fall in EBITDA (before significant items) and a $112.8 million increase in significant items post tax.
Following the merger there was a major restructure of the print businesses to migrate to a new national manufacturing footprint which involved closing three print sites with significant headcount reductions. Total significant items of $142.6 million pre tax much of which related to the print restructure included $49.9 million of employee related costs, $8.0 million of merger costs, $36.4 million of non cash writedowns of plant & equipment surplus following site closures, $3.7 million of other costs (including press relocations).
In addition, there was $24.6 million of non cash impairments of goodwill at PMPNZ (Print) and Griffin Press as the impairment testing results worsened since December 2016. A $20 million onerous lease provision was raised for the three print sites closed as part of the post merger restructure.
Free cash flow defined as EBITDA (before significant items) less interest paid, tax, capital expenditure and movement in working capital at $37.2 million was down $0.3 million compared to $37.5 million in FY16 as better working capital outcomes, lower interest payments, and reduced capital expenditure broadly offset lower EBITDA (before significant items). Cash flow from Operations at $12.5 million negative was down $44.5 million after a $41.9 million increase in significant items.
The company had $54.3 million of cash at bank and $72.8 million of borrowings at 30 June 2017 resulting in a Net Debt* position of $18.5 million. The Company’s net debt to EBITDA (before significant items) of 0.60x has increased from 0.00x in the prior year and interest cover of 6.3x down from 8.5x.
In FY17, the company arranged $65 million of working capital facilities to support the cash spend for the merger integration which was drawn $14.8 million at year end.
* Net debt $18.5M = $40.0M bond + $13.3M Euro loan +$14.8M ANZ Working Capital Loan + ANZ equipment finance loan $7.0M - $2.3M Cross Currency Swap revaluation gain - $54.3M cash (refer Note 12(e)). Excludes prepaid finance costs.
6.6 Significant Changes in the state of affairsOn 28 October 2016 PMP Limited entered into an agreement to merge with the IPMG Group. PMP acquired 100% of IPMG Holdco Pty Ltd in consideration of issuing 187,970,295 PMP shares to the IPMG shareholders, which was completed on 1 March 2017. Following completion of the merger, the company has restructured its print businesses in Australia the details of which are set out in the preceding Review of Operations.
For
per
sona
l use
onl
y

DIRECTORS’ REPORTfor the year ended 30 June 2017
48
6.7 Risks, likely developments and future prospectsPMP’s business segments are primarily in pre-media, printing and distribution of publications including catalogues, magazines, and books.
PMP’s long term profitability and cash flows are responsive to domestic economic conditions in Australia and New Zealand. For example, catalogue printing and distribution is driven by consumer confidence and retailer activity and the printing of these publications are all influenced by user migration to electronic information platforms.
As noted under Inherent Operational Risks on page 45, the Company believes there are a number of operational risks which are inherent in the industry in which it operates. These include fluctuations in demand volume, migration of media from print to digital platforms, the Company’s reliance on the continuity of supply of utilities, raw material inputs and distribution services, and fluctuations in the cost of these supplies.
Catalogue and magazine printing and distribution make up the majority of PMP’s earnings. Recent experience indicates that retailers are using an integrated advertising approach where online media and traditional media are combined for greater effect.
The Company has a higher degree of confidence in the outlook for the business following the merger with IPMG, and therefore increased confidence in its ability to generate strong sustainable free cash flows and subject to market conditions expects this strong cash flow performance to continue for the foreseeable future.
The Company continues to review its cost base to recognise the maturity of this industry. It has reduced financial risk by prioritising strong free cash flow to reduce debt in order to build a more competitive PMP.
The core print industry has been progressively shrinking for a number of years and with the rationalisation undertaken heat set prices should become more stable. The Company will continue to develop strategies as retail specialists in delivering content to the mass market.
6.8 Environmental regulation performancePMP is committed to conducting its business activities with respect for the environment, while continuing to meet its obligations to its shareholders, employees, customers and suppliers. PMP believes its operations are in compliance with all environmental regulations to the extent material to its financial position or results of its continuing operations. As of the date of this report, there were no material legal proceedings concerning environmental matters pending against PMP or against any of its properties.
PMP completed the required Australian Federal Government Environmental Indicators Survey and the National Pollution Inventory report.
6.9 Share issues On 1 March 2017, PMP issued 177,970,295 fully paid ordinary shares pursuant to the completion of the acquisition of IPMG Holdco Pty Ltd. The company also issued 1,885,815 fully paid ordinary shares to those eligible executives who had exercised the right to convert their performance rights into ordinary shares pursuant to the PMP Long Term Incentive Plan.
On 5 May 2017, PMP issued 10,000,000 fully paid ordinary shares, as the withheld consideration shares, pursuant to the completion of the acquisition of IPMG Holdco Pty Ltd.
6.10 Share rightsThe names of the persons who currently hold rights are entered in the register of rights kept by the Company pursuant to Section 168 of the Corporations Act 2001. Pursuant to an Australian Securities and Investments Commission Class Order, the Directors have taken advantage of relief available from the requirement to disclose the names of executives not being Directors (other than the key management personnel executives of the Group) to whom rights are issued, and the number of rights issued to each person.
6.11 Non-audit servicesThe Audit and Risk Management Committee reviewed the non-audit services provided by Deloitte Touche Tohmatsu. These non-audit services include taxation and related advisory services. The following non-audit services were provided during the 12 months to 30 June 2017:
Description of non-audit services <a>
Australia $
New Zealand $
- Taxation and related advisory services (including IPMG merger due diligence)
555,300 32,504
555,300 32,504<a> Unless otherwise specified all amounts have been paid or are due and
payable to a member firm of Deloitte Touche Tohmatsu or its affiliates.
In accordance with advice provided by the Audit and Risk Management Committee, the Directors are satisfied that – based on the approval procedures required for the external auditors to provide non-audit services to PMP and from a review of actual services provided – the non-audit services provided by Deloitte Touche Tohmatsu met the standards of independence.
6.12 Auditor’s independence declarationIn accordance with the Audit Independence requirements of the Corporations Act 2001, the Directors have received and are satisfied with the “Audit Independence Declaration” provided by the PMP Group external auditors, Deloitte Touche Tohmatsu. The Audit Independence Declaration has been attached to the Directors’ Report on page 59.
6.13 Directors’ and officers’ liability insurance and indemnityPMP has liability insurance policies for all Directors and Officers of the PMP Group.
The policy agreement prohibits disclosure of the policy terms and the premium paid. Directors and Officers are also indemnified by the Company against all liabilities to another person (other than PMP or a related body corporate) that may arise from their position as Directors or Officers of PMP and the PMP Group. The insurance cover and indemnity is not applicable where the liability arises out of conduct involving a lack of good faith.
6.14 Significant events after balance dateThe Directors are not aware of any matter or circumstance post balance date not otherwise dealt with in this report or the consolidated financial statements that has significantly affected or may significantly affect the operations of the PMP Group, the results of those operations or the state of affairs of the Group in subsequent years.
6.15 Proceedings on behalf of the CompanyNo proceedings have been brought on behalf of the Company, nor have any applications been made in respect of the Company under section 237 of the Corporations Act 2001.
6.16 Rounding of amountsThe company is of the kind referred to in ASIC Corporations (Rounding in Financial/Directors’ Reports) Instrument 2016/191, dated 24 March 2016, and in accordance with that Corporations Instrument amounts in the financial report are rounded off to the nearest thousand dollars, unless otherwise indicated. F
or p
erso
nal u
se o
nly

DIRECTORS’ REPORTfor the year ended 30 June 2017
49
7. REMUNERATION REPORT7.1 CoverageThis remuneration report outlines the Director and executive remuneration arrangements in accordance with the requirements of the Corporations Act 2001 and its Regulations. It covers the Directors of PMP, including the Chief Executive Officer (“CEO”), and other Key Management Personnel (refer Section 7.7) with the authority and responsibility for planning, directing and controlling the activities of PMP.
The report also contains information about the broader remuneration practices applying to management below the executive level.
7.2 Remuneration principlesPMP’s remuneration policy provides a direct link between remuneration and corporate performance by:
• Offering sufficiently competitive rewards to attract and retain high calibre executives;
• Putting a significant portion of executive remuneration at risk against pre-determined performance benchmarks;
• Setting appropriate stretch performance hurdles to variable executive remuneration;
• Linking short term incentives to both Company and personal performance; and
• Linking long term incentives (including rights) to shareholder value measures and performance hurdles.
The Board also recognises that, although remuneration is a major factor in recruiting and retaining talented and effective people, other factors play a substantial role in attracting suitable candidates, including: PMP’s business operations, corporate reputation, ethical culture and other human resources’ policies and practices.
Combined with its policies, PMP’s remuneration principles ensure that:
• Executive remuneration packages are appropriately benchmarked against the market for comparative roles in similar sized entities at the time of appointment and upon review;
• Executive remuneration packages for key middle and senior personnel include an at risk variable component that is developed in line with the PMP’s short term Incentive program; and
• Variable pay schemes align to key areas of focus for the business. Current standard performance criterion includes: Earnings Before Interest and Tax (“EBIT”); safety performance (measured by the Significant Injury Frequency Rate); and personal objectives that align personal behaviours and professional development with the overall goals of the Company.
7.3 Remuneration structureThe roles and responsibilities of the Appointments and Compensation Committee are discussed on page 44. The Board believes well designed and managed short and long term incentive plans are important elements of employee remuneration, providing tangible incentives for employees to strive to improve PMP’s short term and long term performance, and giving them a common interest with shareholders.
The three tiers of the structure are:
• Fixed remuneration made up of base salary including statutory superannuation and other incidental benefits;
• Short term performance incentives (“STI”) / other accepted variable pay schemes; and
• Longer term equity-based incentives through employee share rights plan (“LTI”), to some senior managers.
This three-tier structure results in management having more of their total remuneration and reward package at risk, linked to individual performance and business results and, in the case of longer term incentives, to the long term performance of the Company.
To ensure executives are sufficiently motivated and aligned with PMP company performance objectives, executives are expected to have at least 25% of their maximum potential remuneration at risk.
Whilst these incentives are linked to EBIT and other performance goals each financial year, the Committee additionally can impart conservative measures in restricting incentives and invoking salary freezes to support short term business goals.
BASE SALARYPMP generally sets salaries based on a classification structure which is referenced to the market median, while also allowing flexibility from this reference point where it is warranted by individual performance levels. The remuneration structure is managed by the Human Resources function leveraging tools such as: job evaluation, career level benchmarking and salary reviews. PMP’s remuneration system allows flexible packaging of benefits via salary sacrifice at no additional total employment cost (“TEC”) to the Company.
SUPERANNUATIONPMP complies with all relevant statutory superannuation obligations to its employees. The standard Company superannuation plan is primarily an accumulation plan, providing a lump sum benefit equal to the balance of a member’s account, which includes contributions made by the member and the relevant PMP group entity, together with net fund earnings.
Relevant superannuation contributions for all senior executives form part of the executive’s total remuneration package. All such amounts are included in the fixed remuneration disclosed for the CEO and members of the senior executive team in this report.
OTHER BENEFITSPMP does not provide senior executives or Directors with benefits such as life insurance, vehicle allowance, club memberships or retirement benefits other than the superannuation benefits and the CEO’s accommodation allowance as discussed in this report.
VARIABLE REMUNERATIONPMP links all variable remuneration to performance. The proportion of variable remuneration increases with job responsibility, with senior executives having a greater proportion of their remuneration at risk.
SHORT TERM INCENTIVES (“STIs”)The STI Plan applies to key middle and senior personnel roles, directly linking variable remuneration to PMP’s corporate strategy. The employee’s STI is generally between 25% to 50% of their TEC.
The STI is dependent on achieving a number of targets. For eligible personnel, the targets are generally allocated between:
• Budgeted EBIT (between 60% - 70% of STI);
• Improved safety (up to 20% of STI); and
• Personal objectives (between 10% - 20% of STI)
Budgeted EBIT is measured before significant items with the Board retaining discretion to take into account the financial impact of any acquisition, and any other significant restructuring cost or rationalisations within the Group, when calculating EBIT in order that the target is measured on a comparable basis.
At least 90% of Budgeted EBIT is required to be achieved before the Appointments and Compensation Committee may consider whether any STI payment can be made (“EBIT hurdle”).
The personal objectives align individual behaviours with Company strategy. The targets are set by the CEO in consultation with the Appointments and Compensation Committee.
Results above the target will not increase the incentive payment above the STI percentage, unless authorised by the CEO and approved by the Appointments and Compensation Committee.
For
per
sona
l use
onl
y

DIRECTORS’ REPORTfor the year ended 30 June 2017
50
STI entitlements are formalised after the end of year accounts have been finalised, and paid in September. STI payments to the CEO and other specified executives satisfying the definition of Key Management Personnel are disclosed in this report.
No STI’s under the STI Plan were paid in FY17 as the EBIT hurdle was not achieved. EBIT (pre-significant items) of $3.7 million was significantly less than the EBIT hurdle of 90% of Budgeted EBIT. The safety target for the Group (when taking into account the inclusion of IPMG from 1 March 2017) of LTIFR was 9.03 against a target of 8.74 and SIFR was 22.14 against a target of 19.73 meaning the safety hurdle was also not achieved. The personal objectives were generally achieved but in that the EBIT hurdle was not achieved no payments were made against these personal objectives.
In October 2016 the Board determined that MD and CEO P George and COO J Nichols would be eligible for an additional STI payment equivalent to one year’s salary, payable on $40 million annualised savings actioned as part of the synergy program following the merger with IPMG. The CEO’s eligibility for this additional STI was disclosed in the Notice of Extraordinary Meeting and related Investor Presentation. The payment of this STI is disclosed in this report.
Following the merger with IPMG, the existing STI structure for employees at IPMG has continued for those employees that have come across in accordance with their contractual entitlements. These employees will migrate to the PMP STI Plan in FY18. Where those existing executives are Key Management Personnel, their STIs are disclosed in this report. PMP has also paid modest bonuses to some managers in recognition of their exceptional efforts involved with the integration of the businesses following the merger with IPMG.
LONG TERM INCENTIVES (“LTIs”)
The LTI Plan aligns over a three year time frame executive incentives with the creation of shareholder wealth. LTIs apply to executive managers with the greatest authority and most strategic influence over PMP’s direction, profitability and growth.
Under the LTI Plan, participants are granted performance rights, which entitle them to receive PMP shares after a vesting period which (subject to some exceptions) is at the end of the third financial year after the performance rights are granted, if the performance conditions are satisfied.
The rights are granted annually (following the announcement of the Group’s financial results) to each eligible participant to the value of between 25% and 50% of that person’s TEC.
The number of rights granted is based on the Company’s weighted average share price for the one week period up to and including the grant date. These rights only vest if the Group achieves the long-term performance conditions detailed in Table 2.
No rights were granted in 2016 in light of the pending merger with IPMG. Following the merger the Board through the Appointments and Compensation Committee is currently reviewing the LTI Plan with the intention of better aligning executive incentives with Group strategy and with the interests of shareholders.
As part of the merger with IPMG the Company assumed the existing LTI contractual commitment for IPMG’s CEO K Slaven. This LTI provides for the payment of up to $2.5 million upon achievement of specified targets measured over a 5 year period from 1 July 2013 with any final payment due following finalisation of the FY18 financial accounts.
The initial LTI accrual of $0.8 million was increased to $1.6 million as part of the purchase price accounting to reflect pro rata the maximum obligation due at the time of the merger i.e. 1 March 2017.
LTIs – PERFORMANCE RIGHTSThe performance rights issued under the PMP LTI Plan are due to be tested at the First Exercise Date in each year, which is when the Company gives the ASX the Appendix 4E (the preliminary final report).
Rights issued in 2013
As at 25 August 2016, following the announcement of the result to 30 June 2016 to the ASX, the performance rights issued in October 2013 to the eligible executives under the PMP Long Term Incentive Plan were tested. The Company’s performance relative to the Total Shareholder Return (“TSR”) hurdle, was such that the Company outperformed the 75th percentile when measured against the peer group and accordingly 1,077,609 TSR rights vested.
The Company’s performance relative to the Earnings Before Interest, Tax, Depreciation and Amortisation (“EBITDA”) hurdle was such that the Company achieved 95% of the target EBITDA over the three years. The Target EBITDA was set at $181.2 million (pre significant items) and where the company achieved between 80 to 110% of Target EBITDA, 50 to 100% of the rights vest pro rata. This resulted in 75% (or 808,206) of these rights vesting.
Rights issued in 2014
As at 25 August 2017, following the announcement of the result to 30 June 2017 to the ASX, the performance rights issued in October 2014 to the eligible executives under the PMP Long Term Incentive Plan will be tested. Under the PMP LTI Plan those senior managers that were awarded performance rights in 2014, and continue to be eligible at the First Exercise Date (28 August 2017), may exercise such rights that vest after this date. These rights are subject to TSR and EBITDA hurdles. The Company’s performance relative to the TSR hurdle for the performance rights issued in 2014, was such that the Company outperformed the 75th percentile when measured against the peer group and accordingly all those performance rights (699,204) that are subject to the TSR hurdle will be capable of vesting.
The Company’s performance relative to the EBITDA hurdle for the performance rights issued in 2014, was such that the Company did not achieve 80% of the Target EBITDA over the three years.
Following the merger with IPMG, the Target EBITDA (pre-significant items) was increased to $186.45M to take into account the budgeted additional earnings that were forecast to be included in the PMP’s financial results for the remainder of the 2017 financial year. With the consolidation of the businesses and subsequent site closures and press moves, the Board determined that it was more appropriate to increase the target to take into account the joint earnings than it was to endeavour to calculate PMP’s EBITDA without the merger taking place.
The Company made $141.5M, which is below the 80% threshold of $149.16 million. This has resulted in no performance rights subject to the EBITDA hurdle being capable of vesting.
The Company will issue shares to settle the vested performance rights. The shares will be subject to the usual clearance procedures before any sale.
The Executive Share Purchasing Policy prohibits executives from hedging pre-vested awards under the PMP LTI plan.
LTIs - PERFORMANCE CONDITIONSTable 2 summarises executive LTIs performance conditions and achievement assessment methods.
For
per
sona
l use
onl
y

DIRECTORS’ REPORTfor the year ended 30 June 2017
51
LTI PERFORMANCE HURDLES AND ASSESSMENT METHODS
Performance rights: Issued 1 October 2013, Expiring 31 August 2018Rights Rights - $832,453*. MD/CEO, EMT and Senior Managers. Performance Hurdles The performance hurdles are: Total Shareholder Return (“TSR”) and Earnings Before Interest, Tax, Depreciation and Amortisation
(“EBITDA”). 50% of rights granted are to be subject to each hurdle.
Total Shareholder Return (“TSR”) PMP’s TSR over the three year period comprising FY14 - 16 was measured against a comparator group of ASX listed companies ranked between S&P/ASX 200 to 300 entities (excluding entities in the metals and mining and materials indexes). If a rank of less than the 51st percentile was achieved nil vest, if a rank of between the 51st and 75th percentile was achieved 50-100% of rights vest and if a rank of greater than 75th percentile was achieved 100% vest.
Earnings Before Interest, Tax, Depreciation and Amortisation (“EBITDA”) PMP’s EBITDA over the three year period comprising FY14 - 16 was measured against a target for the PMP Group. The number of rights to vest are pro rated based on a target EBTIDA range. In determining the EBITDA, the Board retains the discretion to take into account: the financial impact of any acquisition, and any other significant restructuring costs or rationalisations within the Group in order that the target is measured on a comparable basis.
Assessment Method Determined on TSR and EBITDA result for FY14, FY15 and FY16. Vesting 75% vested on 25 August 2016.
Performance rights: Issued 1 October 2014, Expiring 31 August 2019Rights Rights - $224,145*. EMT and Senior Managers.Performance Hurdles The performance hurdles are: TSR and EBITDA. 50% of rights granted are to be subject to each hurdle.
TSR PMP’s TSR over the three year period comprising FY15 - 17 is measured against a comparator group of ASX listed companies ranked between S&P/ASX 200 to 300 entities (excluding entities in the metals and mining and materials indexes). If a rank of less than the 51st percentile is achieved nil vest, if a rank of between the 51st and 75th percentile is achieved 50-100% of rights vest and if a rank of greater than 75th percentile is achieved 100% vest.
EBITDA PMP’s EBITDA over the three year period comprising FY15 - 17 is measured against a target for the PMP Group. The number of rights to vest are pro rated based on a target EBTIDA range.
In determining the EBITDA, the Board retains the discretion to take into account: the financial impact of any acquisition; and any other significant restructuring costs or rationalisations within the Group when calculating the EBITDA in order that the target is measured on a comparable basis.
Assessment Method Determined on TSR and EBITDA result for FY15, FY16 and FY17. Vesting 50%
Performance rights: Issued 1 October 2015, Expiring 31 August 2020Rights Rights - $0. MD/CEO, EMT and Senior Managers.
Performance Hurdles The performance hurdles are: TSR and EBITDA. 50% of rights granted are to be subject to each hurdle.
TSR PMP’s TSR over the three year period comprising FY16 - 18 is measured against a comparator group of ASX listed companies ranked between S&P/ASX 200 to 300 entities (excluding entities in the metals and mining and materials indexes). If a rank of less than the 51st percentile is achieved nil vest, if a rank of between the 51st and 75th percentile is achieved 50-100% of rights vest and if a rank of greater than 75th percentile is achieved 100% vest.
EBITDA PMP’s EBITDA over the three year period comprising FY16 - 18 is measured against a target for the PMP Group. The number of rights to vest are pro rated based on a target EBTIDA range.
In determining the EBITDA, the Board retains the discretion to take into account: the financial impact of any acquisition; and any other significant restructuring costs or rationalisations within the Group when calculating the EBITDA in order that the target is measured on a comparable basis.
Assessment Method Will be determined on TSR and EBITDA result for FY16, FY17 and FY18.
Vesting N/A
Table 2. LTI Performance Hurdles and Assessment Methods.
* Calculated in accordance with AASB 2.For
per
sona
l use
onl
y

DIRECTORS’ REPORTfor the year ended 30 June 2017
52
TAKE HOME PAY OF THE EXECUTIVE DIRECTOR AND CONTINUING EXECUTIVES FOR THE YEAR ENDED 30 JUNE 2017
2017 Fixed annual remuneration
<a>
Non monetary benefits
<c>
STI <d>
Total Performance related
remuneration
$ $ $ $ %P George MD and CEO 600,000 73,699 600,000 1,273,699 47J Nichols Chief Operating Officer <b> 411,667 — 475,000 886,667 54G Stephenson Chief Financial Officer 475,000 — — 475,000 0A O’Connor CEO Print Australia <e> 150,000 — 67,650 217,650 31K Slaven CEO Distribution and Marketing Services <e> 253,956 — 273,700 527,656 52S Ellis MD - PMP (NZ) Limited 321,634 — — 321,634 0
Table 3. Take home pay of the Executive Director and continuing Executives for the year ended 30 June 2017.
<a> Fixed annual remuneration based on current gross salary package, which includes base salary, annual leave and superannuation contributions.
<b> J Nichols Fixed Annual remuneration increased from $380,000 to $475,000 on 1 November 2016.
<c> P George salary includes non monetary benefits (inclusive of all applicable taxes) of $73,699 for accommodation as discussed in section 7.6.
<d> For executives covered by PMP’s STI Plan, there was no STI payable as the EBIT hurdle was not met.
For the CEO and COO, the PMP Board determined in October 2016 that they would be eligible for an additional STI payment, equivalent to one year’s salary, payable on the $40 million annualised savings being actioned as part of the synergy program following the merger with IPMG.
<e> Joined the group when IPMG was acquired on 1 March 2017. Remuneration is for the period from 1 March 2017 to 30 June 2017 and includes the STI that they were eligible for under their existing contracts.
7.4 Senior executive performance evaluationPMP rewards executives for performance. At the beginning of the financial year, the CEO sets objectives for each direct report, which are reviewed by the Appointments and Compensation Committee. This includes corporate goals such as EBIT (excluding significant items), safety, and personal objectives, including activities to drive the development of business opportunities across the Group. The CEO reviews performance against objectives during the year and at the financial year end and the outcomes are used to determine overall performance and STI payments. The CEO provides recommendations to the Appointments and Compensation Committee in relation to the STI payments and the performance of the executives in relation to these payments for the Committee to ratify.
7.5 Company performanceTable 4 shows PMP’s performance over the last three years.
PMP SHARE PRICE PERFORMANCE AGAINST ASX ALL ORDS INDEX*
Table 4. PMP Share Price Performance against ASX All Ords Index.
* Source: ASX
250
200
150
100
50
0 July 2014 July 2015 July 2016 July 2017
g PMP g ASX
Percentage change (%) PMP Share Price (cents)
100
80
60
40
20
0
For
per
sona
l use
onl
y

DIRECTORS’ REPORTfor the year ended 30 June 2017
53
7.6 Chief Executive Officer (“CEO”)The following Section details the remuneration arrangement for Mr Peter George, CEO of PMP.
EMPLOYMENT CONTRACTMr Peter George’s current employment contract commenced on 1 October 2015. Under the contract the Company may terminate Mr Peter George’s employment with the Company or Mr Peter George may cease his employment by giving not less than twelve months notice. Where there is significant and material adverse change to Mr Peter George’s duties or responsibilities or there is a change of control either Mr Peter George or the Company may terminate Mr Peter George’s employment with the Company by paying to Mr Peter George a sum equal to the remuneration plus any STI payment made or due to be made in respect of the prior financial year.
SUMMARY OF REMUNERATION STRUCTUREFixed Remuneration:
Base salary including superannuation is $600,000 per annum. In addition to the base salary the Company has provided Mr Peter George with accommodation in Sydney in order to facilitate the Company’s strategic initiatives and to minimise accommodation and travel costs.
Short Term Incentive (“STI”):
Mr Peter George has an STI of up to 100% of his fixed remuneration for FY17, dependent on achieving a number of targets including EBIT and safety:
• Budgeted EBIT (pre-significant items) (between 60% - 70% of STI);
• Improved safety (up to 20% of STI); and
• Personal objectives (between 10% - 20% of STI)
Any STI achieved will be paid 66.7% in cash and 33.3% in PMP shares. The number of shares acquired as a result of achievement of this STI is dependent upon the share price at the time of the acquisition as the STI dollar value is fixed. The PMP shares will be purchased on market and are subject to a 12 month holding lock from the start of the following financial year. No STI is payable unless at least 90% of budgeted EBIT is achieved.
No STI is payable for the 2017 financial year under the STI Plan as the EBIT hurdle was not achieved. EBIT (pre-significant items) of $3.7 million was less than 90% of budgeted EBIT. The safety target for the Group (when taking into account the inclusion of IPMG from 1 March 2017) of LTIFR was 9.03 against a target of 8.74 and SIFR was 22.14 against a target of 19.73 meaning the safety hurdle was also not achieved. The personal objectives related were achieved in these predominantly related to the achievement of the merger with IPMG.
Mr Peter George has also been provided with an incentive of an additional one years base salary where he achieves an agreed set of key performance indicators linked to the $40 million annualised synergies the company is forecasting to be achieved following the merger with IPMG, which was achieved.
Long Term Incentive (“LTI”):
The shareholders approved at the 2015 Annual General Meeting that Mr Peter George be awarded 3,000,000 performance rights under the PMP LTI Plan to acquire fully paid ordinary shares in the Company with the performance rights being tested against the performance hurdles following the performance period ending 30 June 2018.
The share rights offered to Mr Peter George are split evenly amongst two categories of performance hurdles and will vest subject to the achievement of those hurdles. The first performance hurdle compares PMP’s Total Shareholder Return (“TSR”) measured against a comparator group consisting primarily of ASX listed entities that are ranked between S&P/ ASX 200 – ASX 300 (excluding entities in the metals and mining and materials indexes). The period over which the TSR performance condition is measured is between 1 July 2015 and 30 June 2018. The number of rights that vest is based on rank. Nil rights vest if a rank of less than the 51st percentile is achieved. 50% – 100% of the rights vest
if a rank between the 51st and 75th percentile is achieved. The second performance hurdle is an internal hurdle and is based on PMP achieving target earnings before interest, tax, depreciation and amortisation (EBITDA) at the end of a three year period ending on 30 June 2018.
These performance conditions are tested on the earlier of: an early vesting event or on the First Exercise Date under the PMP LTI Plan which is when the Company gives the ASX the Appendix 4E (the preliminary final report). Mr Peter George may exercise such rights that vest after this date.
REMUNERATION SUMMARYThe remuneration paid to Mr Peter George for the year ended 30 June 2017 is set out in the table below:
Salary Component 2017
- Base Salary (including superannuation) 600,000
- Non Monetary Benefits * 73,699
- LSL 50,166
- STI: Cash <a> 600,000
- STI: Shares <a> —
- LTI <b> 215,752
Total 1,539,617
Table 5. Chief Executive Officer remuneration.
* Non monetary benefits includes accommodation of $73,699.
<a> No STI for the 2017 financial year under the PMP plans was payable as the EBIT hurdle was not achieved. The PMP Board determined in October 2016 that Mr George would be eligible for an additional STI payment, equivalent to one year’s salary, payable on the $40 million annualised savings being actioned as part of the synergy program following the merger with IPMG.
<b> This is based on the accrued accounting value in accordance with AASB 2 Share-based Payment and relates to amounts granted to Mr Peter George under the Employee LTI Plan. All rights valued in accordance with AASB 2 have been independently valued using the Binomial Option Pricing Model or Monte Carlo Model. In accordance with AASB 2 the non-market conditions associated with these rights were not taken into account when estimating the fair value at grant date. Instead, the number of rights expected to eventually vest is re-assessed at the end of each reporting period.
7.7 Key management personnel (other than Non-Executive Directors)
PMP’s Key Management Personnel (excluding Non-Executive Directors) during the financial year are:
P George Managing Director and Chief Executive Officer (Refer Section 7.6 for remuneration details.)
J Nichols Chief Operating Officer
G Stephenson Chief Financial Officer
S Ellis Managing Director - PMP (NZ) Limited
A O’Connor CEO Print Australia
K Slaven CEO Distribution and Marketing ServicesFor
per
sona
l use
onl
y

DIRECTORS’ REPORTfor the year ended 30 June 2017
54
EMPLOYMENT CONTRACTSPMP does not (subject to limited exceptions) include termination or severance payments for PMP executives in their employment contracts other than agreed notice provisions and the application of the PMP redundancy policy (where applicable).
Name Notice Period PMP Notice Period Employee Termination Payments
J Nichols
6 Months 6 Months Where there is a change of control or a significant and material adverse change in his duties or responsibilities in which case if the employment is terminated PMP is to pay the equivalent of 12 months TEC.
G Stephenson 6 Months 6 Months No specific termination payment provided for.
A O’Connor <a> 6 Months 6 Months No specific termination payment provided for.
K Slaven <b> Fixed term until 30 June 2018 Fixed term until 30 June 2018 No specific termination payment provided for.
S Ellis 6 Months 6 Months No specific termination payment provided for.
Table 6. Executive Employment Contracts.
<a> Joined when IPMG was acquired. Employment terms are same as all other Executives.
<b> Joined when IPMG was acquired. Employment terms are same as previously agreed with the acquired company, IPMG.
REMUNERATION OF KEY MANAGEMENT PERSONNELThe table below outlines the remuneration packages of Key Management Personnel (“KMP”) (excluding Non-Executive Directors). All rights are independently valued in accordance with AASB 2 using either the Binomial Option Pricing Model or the Monte Carlo Simulation Model. The amounts disclosed as part of remuneration for the financial year have been determined by allocating the grant date fair value on a straight line basis over the period from grant date to vesting date.
Key Management Personnel(excluding Non-Executive Directors)
Short term Long term Total excluding
rights
Equity rights
Grand total
Salary Non Monetary Benefits
STI Post Employment
Superannuation
LSL LTI
$ $ $ $ $ $ $ $ $
P George <a><f> 2017 580,379 73,699 600,000 19,621 50,166 — 1,323,865 215,752 1,539,617
<a> 2016 547,945 72,855 — 52,055 — — 672,855 302,871 975,726
J Nichols <f> 2017 392,051 — 475,000 19,616 12,977 — 899,644 25,543 925,187
2016 347,032 — — 32,968 5,875 — 385,875 130,728 516,603
G Stephenson 2017 455,384 — — 19,616 7,489 — 482,489 31,928 514,417
2016 455,692 — — 19,308 7,669 — 482,669 162,428 645,097
A. O’Connor <b><g> 2017 141,959 — 67,650 8,041 8,853 — 226,503 — 226,503
K. Slaven <c><g> 2017 245,356 — 273,700 8,600 4,513 300,000 832,169 — 832,169
P Trainor <d> 2016 125,557 — — — — — 125,557 (35,660) 89,897
S Ellis <e> 2017 312,531 — — 9,103 — — 321,634 — 321,634
<e> 2016 28,492 — — 855 — — 29,347 — 29,347
Total Remuneration KMP (excluding Non-Executive Directors)
2017 2,127,660 73,699 1,416,350 84,597 83,998 300,000 4,086,304 273,223 4,359,527
2016 1,504,718 72,855 — 105,186 13,544 — 1,696,303 560,367 2,256,670
Table 7. Key Management Personnel (excluding Non-Executive Directors) remuneration of the Company and the Group.
<a> P George salary includes non monetary benefits being $73,699 (2016: $72,855) for accommodation as discussed in section 7.6.
<b> Joined PMP from IPMG when it was acquired on 1 March 2017. Salary reported covers period from 1 March 2017 to 30 June 2017.
<c> Joined PMP from IPMG when it was acquired on 1 March 2017. Salary reported covers period from 1 March 2017 to 30 June 2017. Details of Mr Slaven LTI scheme in 7.3.
<d> Completion 20 November 2015 (Termination payment of A$239,321 excluded. Payment made on 27 November 2015). Where completion dates are during the period rights have been forfeited. Rights that had not vested prior to being forfeited have been credited back to the income statement.
<e> Appointed Managing Director of PMP (NZ) Limited on 30/05/16. New Zealand dollar payment converted into Australian dollars at the profit and loss exchange rate prevailing at June 16 and June 17.
<f> The Board determined in October 2016 P George and J Nichols would be eligible for an additional STI payment equivalent to one year’s salary payable on the $40 million annualised savings being actioned as part of the synergy program following the merger with IPMG.
<g> The STI relates to their contractual entitlement during their employment at IPMG and was accrued as part of the merger.
For
per
sona
l use
onl
y
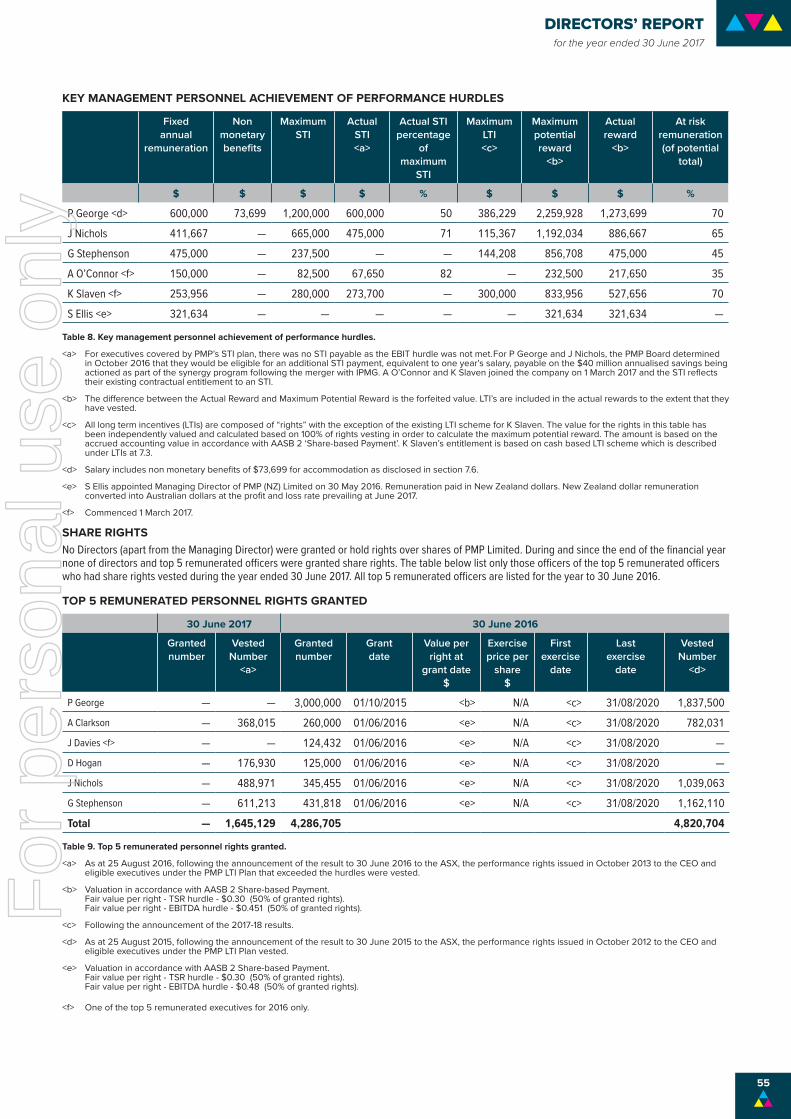
DIRECTORS’ REPORTfor the year ended 30 June 2017
55
KEY MANAGEMENT PERSONNEL ACHIEVEMENT OF PERFORMANCE HURDLES
Fixed annual
remuneration
Non monetary benefits
MaximumSTI
Actual STI <a>
Actual STI percentage
of maximum
STI
Maximum LTI <c>
Maximum potential reward
<b>
Actual reward
<b>
At risk remuneration (of potential
total)
$ $ $ $ % $ $ $ %
P George <d> 600,000 73,699 1,200,000 600,000 50 386,229 2,259,928 1,273,699 70
J Nichols 411,667 — 665,000 475,000 71 115,367 1,192,034 886,667 65
G Stephenson 475,000 — 237,500 — — 144,208 856,708 475,000 45
A O’Connor <f> 150,000 — 82,500 67,650 82 — 232,500 217,650 35
K Slaven <f> 253,956 — 280,000 273,700 — 300,000 833,956 527,656 70
S Ellis <e> 321,634 — — — — — 321,634 321,634 —
Table 8. Key management personnel achievement of performance hurdles.
<a> For executives covered by PMP’s STI plan, there was no STI payable as the EBIT hurdle was not met. For P George and J Nichols, the PMP Board determined in October 2016 that they would be eligible for an additional STI payment, equivalent to one year’s salary, payable on the $40 million annualised savings being actioned as part of the synergy program following the merger with IPMG. A O’Connor and K Slaven joined the company on 1 March 2017 and the STI reflects their existing contractual entitlement to an STI.
<b> The difference between the Actual Reward and Maximum Potential Reward is the forfeited value. LTI’s are included in the actual rewards to the extent that they have vested.
<c> All long term incentives (LTIs) are composed of “rights” with the exception of the existing LTI scheme for K Slaven. The value for the rights in this table has been independently valued and calculated based on 100% of rights vesting in order to calculate the maximum potential reward. The amount is based on the accrued accounting value in accordance with AASB 2 ‘Share-based Payment’. K Slaven’s entitlement is based on cash based LTI scheme which is described under LTIs at 7.3.
<d> Salary includes non monetary benefits of $73,699 for accommodation as disclosed in section 7.6.
<e> S Ellis appointed Managing Director of PMP (NZ) Limited on 30 May 2016. Remuneration paid in New Zealand dollars. New Zealand dollar remuneration converted into Australian dollars at the profit and loss rate prevailing at June 2017.
<f> Commenced 1 March 2017.
SHARE RIGHTSNo Directors (apart from the Managing Director) were granted or hold rights over shares of PMP Limited. During and since the end of the financial year none of directors and top 5 remunerated officers were granted share rights. The table below list only those officers of the top 5 remunerated officers who had share rights vested during the year ended 30 June 2017. All top 5 remunerated officers are listed for the year to 30 June 2016.
TOP 5 REMUNERATED PERSONNEL RIGHTS GRANTED
30 June 2017 30 June 2016
Granted number
Vested Number
<a>
Granted number
Grant date
Value per right at
grant date $
Exercise price per
share $
First exercise
date
Last exercise
date
Vested Number
<d>
P George — — 3,000,000 01/10/2015 <b> N/A <c> 31/08/2020 1,837,500 A Clarkson — 368,015 260,000 01/06/2016 <e> N/A <c> 31/08/2020 782,031 J Davies <f> — — 124,432 01/06/2016 <e> N/A <c> 31/08/2020 — D Hogan — 176,930 125,000 01/06/2016 <e> N/A <c> 31/08/2020 — J Nichols — 488,971 345,455 01/06/2016 <e> N/A <c> 31/08/2020 1,039,063 G Stephenson — 611,213 431,818 01/06/2016 <e> N/A <c> 31/08/2020 1,162,110
Total — 1,645,129 4,286,705 4,820,704
Table 9. Top 5 remunerated personnel rights granted.
<a> As at 25 August 2016, following the announcement of the result to 30 June 2016 to the ASX, the performance rights issued in October 2013 to the CEO and eligible executives under the PMP LTI Plan that exceeded the hurdles were vested.
<b> Valuation in accordance with AASB 2 Share-based Payment. Fair value per right - TSR hurdle - $0.30 (50% of granted rights). Fair value per right - EBITDA hurdle - $0.451 (50% of granted rights).
<c> Following the announcement of the 2017-18 results.
<d> As at 25 August 2015, following the announcement of the result to 30 June 2015 to the ASX, the performance rights issued in October 2012 to the CEO and eligible executives under the PMP LTI Plan vested.
<e> Valuation in accordance with AASB 2 Share-based Payment. Fair value per right - TSR hurdle - $0.30 (50% of granted rights). Fair value per right - EBITDA hurdle - $0.48 (50% of granted rights).
<f> One of the top 5 remunerated executives for 2016 only.
For
per
sona
l use
onl
y

DIRECTORS’ REPORTfor the year ended 30 June 2017
56
RIGHTS HOLDINGS KEY MANAGEMENT PERSONNEL (EXCLUDING NON-EXECUTIVE DIRECTORS)
Balance 1 July2016
Granted as Remuneration
RightsExercised
<a>
Rights Lapsed
<b>
RightsCancelled
Other Balance 30 June
2017
2017
P George 3,000,000 — — 3,000,000
J Nichols 1,300,112 — (488,971) (69,853) — — 741,288
G Stephenson 1,625,139 — (611,213) (87,316) — — 926,610
S Ellis <d> — — — — — — —
A O’Connor — — — — — — —
K Slaven — — — — — — —
Total 5,925,251 — (1,100,184) (157,169) — — 4,667,898
Balance 1 July2015
Granted as Remuneration
RightsExercised
Rights Lapsed
<e>
RightsCancelled
Other Balance 30 June
2016
2016
P George 2,100,000 3,000,000 (1,837,500) (262,500) — — 3,000,000
J Nichols 2,142,157 345,455 (1,039,063) (148,437) — — 1,300,112
G Stephenson 2,521,446 431,818 (1,162,110) (166,015) — — 1,625,139
P Trainor <c> 192,484 — — — — (192,484) —
S Ellis <d> — — — — — — —
Total 6,956,087 3,777,273 (4,038,673) (576,952) — (192,484) 5,925,251
Table 10. Rights holdings Key Management Personnel (excluding Non-Executive Directors).
<a> Performance rights issued in October 2013 were exercised on 1 March 2017.
<b> Lapse of 25% of EBITDA performance rights issued in October 2013.
<c> Resigned 20 November 2015.
<d> Appointed Managing Director of PMP (NZ) Limited on 30 May 2016.
<e> Lapse of 25% of EBITDA performance rights issued in October 2012.
For
per
sona
l use
onl
y

DIRECTORS’ REPORTfor the year ended 30 June 2017
57
SHAREHOLDINGS OF DIRECTORS AND KEY MANAGEMENT PERSONNEL
2017 Balance 1 July 2016
Allotted or Exercise of Rights
Acquired Disposed Other Balance 30 June 2017
Directors
M Bickford-Smith 200,000 — — — — 200,000
P George 2,029,006 — — (1,000,000) — 1,029,006
A Cheong — — — — — —
M Hannan — 48,110,997 <a> — (8,018,500) — 40,092,497
D Karai <c> — — 30,000 — — 30,000
N Sparks — — — — — —
S Anstice — — — — — —
P Margin 49,900 — — — (49,900) <f> —
Total 2,278,906 48,110,997 30,000 (9,018,500) (49,900) 41,351,503
Executives
J Nichols 519,532 488,971 <b> — (519,500) — 489,003
G Stephenson 631,055 611,213 <b> — (500,000) — 742,268
S Ellis <d> — — — — — —
K Slaven — — — — — —
A O’Connor — 46,597,836 <e> — — — 46,597,836
Total 1,150,587 47,698,020 — (1,019,500) — 47,829,107
Table 11. Shareholdings of Key Management Personnel.
<a> Shares issued as part of IPMG acquisition.
<b> Shares issued upon exercise of rights issued in October 2013 pursuant to PMP’s LTI Plan.
<c> Appointed a Non-Executive Director and member of the Audit and Risk management Committee on 1 June 2016.
<d> Appointed Managing Director of PMP (NZ) Limited on 30 May 2016.
<e> Shares issued as part of IPMG acquisition. Shares are held jointly with Richard O’Connor.
<f> Resigned from the Board on 25 August 2016. Shareholdings are no longer reported.
7.8 Non-Executive Director RemunerationThe remuneration of Non-Executive Directors is determined by the full Board, within a maximum amount approved by shareholders in a general meeting and with regard to the level of fees paid to Non-Executive Directors by other companies of similar size.
The maximum allowance for the aggregate amount of fees has remained unchanged since 2004 at $750,000 per annum. In the last financial year, the Board paid $496,038 of this amount for Non-Executive Directors’ remuneration - as shown in Table 12.
Non-Executive Directors are not entitled to retirement benefits other than statutory superannuation or other statutory required benefits.
*
Chairman of the Board $186,752
Non-Executive Director $82,125
Chair of Audit and Risk Management Committee $28,470
Member of Audit and Risk Management Committee $14,235
Chair of Appointments and Compensation Committee $28,470
Member of Appointments and Compensation Committee $14,235
There is no element of Non-Executive Director salaries contingent on performance.
* Inclusive of statutory superannuation of 9.5%.
7.9 Performance assessmentThe Chairman continuously evaluates Board and Director performance directly with each Director.
7.10 Retirement benefitsNon-Executive Directors receive cash remuneration plus statutory superannuation contributions only.
—
For
per
sona
l use
onl
y

DIRECTORS’ REPORTfor the year ended 30 June 2017
58
SPECIFIED DIRECTOR REMUNERATION
Specified Directors Salary & Fees
Non Monetary Benefits
PostEmployment
Superannuation
Short Term
Incentive
Long service leave
Equity Rights
<c>
GrandTotal
$ $ $ $ $ $
Total Remuneration: Non-Executive Directors
M Bickford-Smith (Board Chair) 2017 196,550 — 18,672 — — — 215,222
2016 195,800 — 18,601 — — — 214,401
A Cheong <a> 2017 88,000 — — — — — 88,000
2016 87,250 — — — — — 87,250
P Margin 2017 16,833 — 1,599 — — — 18,432
2016 96,500 — 9,168 — — — 105,668
N Sparks 2017 101,000 — 9,595 — — — 110,595
2016 87,500 — 8,313 — — — 95,813
D. Karai 2017 99,069 — 9,412 — — — 108,481
2016 7,333 — 697 — — — 8,030
S. Anstice 2017 26,083 — 2,478 — — — 28,561
2016 — — — — — — —
M. Hannan 2017 — — 28,561 — — — 28,561
2016 — — — — — — —
Total 2017 527,535 — 70,317 — — — 597,852
2016 474,383 — 36,779 — — — 511,162
Total Remuneration: Executive Directors
P George (CEO) <b> 2017 580,379 73,699 19,621 600,000 50,166 215,752 1,539,617<b> 2016 547,945 72,855 52,055 302,871 975,726
Total 2017 580,379 73,699 19,621 600,000 50,166 215,752 1,539,617
2016 547,945 72,855 52,055 — — 302,871 975,726
Total Remuneration: Directors
Total 2017 1,107,914 73,699 89,938 600,000 50,166 215,752 2,137,469
2016 1,022,328 72,855 88,834 — — 302,871 1,486,888
Table 12. Specified Director remuneration.
<a> Payments made for Directorship services provided by A Cheong are made to Fraser & Neave (Singapore) Pte Ltd.
<b> P George salary includes non monetary benefits being $73,699 (2016: $72,855) for accommodation as disclosed in section 7.6
<c> Equity rights are calculated as per Table 7.
This report has been made in accordance with a resolution of Directors.
Matthew Bickford-Smith Chairman
Peter George Managing Director and Chief Executive Officer
Sydney, 31 August 2017
For
per
sona
l use
onl
y

INDEPENDENT AUDITOR’S DECLARATIONfor the year ended 30 June 2017
59
Liability limited by a scheme approved under Professional Standards Legislation.
Member of Deloitte Touche Tohmatsu Limited
Deloitte Touche Tohmatsu A.B.N. 74 490 121 060 Grosvenor Place 225 George Street Sydney NSW 2000 PO Box N250 Grosvenor Place Sydney NSW 1220 Australia DX 10307SSE Tel: +61 (0) 2 9322 7000 Fax: +61 (0) 2 9322 7001 www.deloitte.com.au
31 August 2017 Dear Directors,
PMP Limited In accordance with section 307C of the Corporations Act 2001, I am pleased to provide the following declaration of independence to the directors of PMP Limited. As lead audit partner for the audit of the financial statements of PMP Limited for the financial year ended 30 June 2017, I declare that to the best of my knowledge and belief, there have been no contraventions of:
(i) the auditor independence requirements of the Corporations Act 2001 in relation to the audit; and
(ii) any applicable code of professional conduct in relation to the audit. Yours sincerely
DELOITTE TOUCHE TOHMATSU
JL Gorton Partner Chartered Accountants
The Board of Directors PMP Limited Level 12 67 Albert Avenue Chatswood NSW 2067
For
per
sona
l use
onl
y

60
Sales Revenue Sales revenue for FY17 was $1,051.5 million, a 28.9% or $235.5 million increase on the prior year. Sales at Gordon & Gotch at $470.5 million were up $124.7 million year-on-year as new contract revenues more than offset the reduction in volumes from existing customers. At Print Australia, sales of $263.0 million were up $63.3 million or 31.7% as four months of IPMG print sales offset lower volumes and sell prices at PMP print. Distribution Australia volumes were 12% lower year-on-year with 6% due to customer withdrawals from the market and the balance due to retailers reducing their marketing spend in challenging market conditions. Gotch sales were up 36.1% while Griffin tonnes fell 18% on contract losses. In New Zealand, Gotch sales rose by $60.4M or 228% with volumes up 250% on the full year flow through of new contracts, while heatset print sales fell $5.4M or 7.3% on lower sell prices and volumes.
Earnings Before Interest Tax and Depreciation (“EBITDA”)The full-year EBITDA (before significant items) at $32.2 million, was down 37% or $19.0 million on the prior year EBITDA (before significant items) of $51.2 million, as lower profits across the PMP Group more than offset the inclusion of four months of profits from IPMG Print and Marketing Services companies. At Print Australia, EBITDA (before significant items) at $16.7 million was down $9.7 million as lower sell prices and volumes at PMP Print more than offset four months IPMG Print profits and integration savings. Distribution & Marketing Services EBITDA (pre significant items) was $7.0 million lower as four months of IPMG Marketing Services profits were offset by lower outcomes at both Distribution and Griffin on lower volumes year-on-year. In New Zealand EBITDA (pre significant items) was down $2.6 million year-on-year as higher profits at Gotch were offset by lower print EBITDA due to lower sell prices and volumes with tight cost controls providing a partial offset.
Net Profit After Tax (“NPAT”)A net loss after tax of $126.4 million was recorded for FY17 which was $126.6 million lower than the $0.2 million profit in the previous year due to a $19.0 million fall in EBITDA (before significant items) and a $112.8 million increase in significant items post tax, much of which related to undertaking a major restructure of the combined Print business with three sites closing. Total significant items were $142.6 million pre tax which included $49.9 million of redundancy/employee related costs, $8.0 million of merger costs, $24.6 million of non cash impairments of goodwill at PMPNZ and Griffin, onerous lease provision of $20 million and $36.4 million of non cash writedown of plant and equipment surplus following closure of print sites and $3.7 million other (includes press relocations etc).
Cash FlowThe Group’s free cash flow* was $37.2 million down $0.3 million compared to $37.5 million in FY16 as better working capital outcomes, lower interest expense and reduced capital expenditure offset lower EBITDA (before significant items)**. Working capital movements were $14.8 million favourable to last year due to changes in trading terms along with better than expected debtor collections. Cash from operations at minus $12.5 million was down $44.5 million after a $41.9 million increase in significant items. Net cash flow at $10.7 million negative was $27.0 million lower year-on-year after $41.9 million higher significant items were mostly offset by $17.5 million lower investing and capital management cash flows.
Balance SheetAt year end, net assets for the group were $255.1 million, down $4.3 million from $259.4 million in the previous year with $128.8 million new shares and assets acquired as part of the IPMG merger offset by the FY17 statutory loss of $126.4 million. The merger with IPMG resulted in 188 million new shares being issued and $34.8 million of goodwill being the difference between the fair value of assets acquired and the value of PMP shares issued at prevailing share price on completion.
In addition, at merger completion an existing IPMG equipment finance loan from ANZ for $8.5M which was matched by cash acquired. At June 2017, the company had a net debt position of $18.5 million *** vs Net cash of $0.7 million in FY16.
Interest cover was 6.3x vs 8.5x in the prior period. During the year the company put a new $65 million ANZ Facility in place to assist with the funding of the post merger expenditure.
Capital ManagementIn August 2016, the company declared a final unfranked dividend of 2.4 cents per share to be paid on 7 October 2016 with a record date of 22 September 2016.
This brings total dividends to $11.5 million or 97% of FY16 NPAT (before significant items). This was higher than the policy of 75% dividends and is an exception rather than a change to the policy.
In October 2016, following announcement of the merger with IPMG, capital management distributions were suspended. As much of the cash spend relating to the merger will be completed by December 2017, the company plans to recommence capital management in the second half of fiscal 2018.
* Free cash flow is defined as EBITDA** before significant items, less interest paid, income tax, capital expenditure and movement in working capital.
** EBITDA is defined as earnings before interest, tax, depreciation and amortisation.
*** Net Debt $18.5M = $40M Bond + $13.3M Euro loan + $14.8M ANZ Working Capital Facility + ANZ equipment finance loan $7.0M - Cross Currency Swap Revaluation $2.3M gain - $54.3M cash (refer Note 13(e)). Excludes prepaid finance costs.
CFO Review
The CFO of PMP is responsible for all finance and support functions in the Company as well as leading a corporate team covering financial accounting and management reporting, treasury, taxation and investor relations.
Mr Stephenson has over 30 years of experience with a range of blue chip companies including Iplex Pipelines, Fairfax Media and Goodman Fielder. He has held a range of senior commercial and financial roles at both a divisional and head office level working in Australia and also offshore.
Geoff StephensonB.Bus CPA GAICD
CHIEF FINANCIAL OFFICER (CFO)
For
per
sona
l use
onl
y

CFO REVIEWfor the year ended 30 June 2017
61
Highlights$M 2017 2016 % Change
EBITDA (before significant items)
32.2 51.2 (37.0%)
Depreciation & Amortisation (28.5) (27.9) 2.3%
EBIT (before significant items)
3.7 23.3 (84.2%)
Financing Costs* (5.1) (5.9) (13.8%)
Income Tax expense (before significant items)
(0.5) (5.5) —
Net (Loss)/Profit (before significant items)
(1.9) 11.8 —
Significant items (142.6) (14.6) —
Income Tax benefit on significant items
18.1 2.9 —
Net (Loss)/Profit after income tax (126.4) 0.2 —
* 2017 excludes Significant Item for the year ended 30 June 2017 of Nil (2016: $2.333 million)
Segment Revenue$M 2017 2016 VARIANCE
Sales Revenue
Print Australia 263.0 199.7 31.7%
Distribution and Marketing Services 124.5 134.9 (7.7%)
Gordon and Gotch 470.5 345.8 36.1%
PMP New Zealand 193.5 135.6 42.7%
Total 1,051.5 816.0 28.9%
Segment EBITDA (before significant items)$M 2017 2016 VARIANCE
EBITDA (before significant items)
Print Australia 16.7 26.4 (36.8%)
Distribution and Marketing Services 3.9 10.6 (63.4%)
Gordon and Gotch 2.7 2.9 (7.2%)
PMP New Zealand 12.4 15.0 (17.2%)
Corporate (3.5) (3.7) (7.3%)
Total 32.2 51.2 (37.0%)
Cash Flow$M 2017 2016
EBITDA (before significant items)
32.2 51.2
Borrowing costs (4.9) (6.5)
Income tax payments (0.1) —
Net movement in working capital 11.9 (2.9)
Trading cash flow 39.1 41.7
Significant items (51.6) (9.7)
Cash flow from operating activities
(12.5) 32.0
Asset sales 0.3 2.4
Capital expenditure (2.0) (4.2)
Dividends paid (7.6) (9.7)
Share buy-back — (4.1)
Acquisition cash from controlled entity
11.1 —
Net cash flow (10.7) 16.3
Gain/(Loss) on New Zealand debt/cash
(0.1) 0.7
Take on borrowings - IPMG equipment loan
(8.5) —
Reconciliation to net debt movement
(19.2) 17.0
Free cash flow* 37.2 37.5
Balance Sheet Year ended 30 June$M 2017 2016
Current assets 285.8 238.7
Non-current assets 284.2 238.2
Total assets 570.0 476.9
Current liabilities 241.9 161.0
Non-current liabilities 73.1 56.5
Total liabilities 315.0 217.5
Net assets 255.1 259.4
* Equals EBITDA (before significant items) less interest paid, income tax, capital expenditure and movement in working capital.
For
per
sona
l use
onl
y

62
FINANCIAL STATEMENTSfor the year ended 30 June 2017
CONSOLIDATED STATEMENT OF PROFIT OR LOSS AND OTHER COMPREHENSIVE INCOME
PMP Group
2017 2016YEAR ENDED 30 JUNE 2017 NOTES $’000 $’000
Continuing operationsSales revenue 2(a), 20 1,051,483 815,979
Other revenue 2(a), 20 6,139 4,137
Raw materials and consumables used (198,627) (158,471)
Cost of finished goods sold (489,667) (323,478)
Employee expenses (283,312) (219,416)
Outside production services (12,784) (12,658)
Freight (38,840) (22,420)
Repairs and maintenance (15,659) (11,236)
Occupancy costs (43,194) (18,789)
Other expenses (85,922) (14,715)
Depreciation and amortisation 2(e), 20 (28,549) (27,914)
Finance costs 3 (5,087) (8,266)
(Loss)/profit before income tax 2(c) (144,019) 2,753
Income tax benefit/(expense):
Current tax benefit/(expense) in respect of the current period 13,353 (223)
Deferred tax benefit/(expense) in respect of the current period 4,239 (2,345)
Total tax benefit/(expense) 4 17,592 (2,568)
Net (loss)/profit after income tax (126,427) 185
Other comprehensive income/(expense)Items that will not be reclassified subsequently to profit or loss:Defined benefit plan actuarial gain/(losses) 21 278 (210)
Income tax relating to items that will not be reclassified subsequently (83) 63
195 (147)Items that may be reclassified subsequently to profit or loss:Exchange differences arising on translation of foreign operations (341) 4,873
Gain/(loss) on cash flow hedges taken to equity 1,382 (1,682)
Income tax relating to items that may be reclassified subsequently (408) 490
633 3,681
Other comprehensive income for the period (net of tax) 828 3,534
Total comprehensive (loss)/profit for the year (125,599) 3,719
Basic earnings per share (cents) 25 (33.3) 0.1
Diluted earnings per share (cents) 25 (32.9) 0.1
Weighted average number of ordinary shares outstanding during the period used in the calculation of basic earnings per share (‘000) 25(a) 379,850 322,126
The above consolidated statement of profit or loss and other comprehensive income should be read in conjunction with the accompanying notes.
For
per
sona
l use
onl
y

63
FINANCIAL STATEMENTSfor the year ended 30 June 2017
CONSOLIDATED STATEMENT OF FINANCIAL POSITION
PMP Group
2017 2016YEAR ENDED 30 JUNE 2017 NOTES $’000 $’000
Current assetsCash and cash equivalents 26(b) 54,340 54,103
Receivables 5 117,280 96,277
Inventories 6 106,830 85,602
Financial assets 14 786 248
Other 7 6,565 2,465
Total current assets 285,801 238,695
Non-current assets
Property, plant and equipment 8 175,095 155,944
Deferred tax assets 10 66,782 49,335
Goodwill and intangible assets 9 37,648 27,514
Financial assets 14 1,802 2,381
Other 7 2,914 3,072
Total non-current assets 284,241 238,246
Total assets 570,042 476,941
Current liabilities
Payables 11 173,838 139,371
Interest bearing liabilities - financial institutions 12(a) 19,842 2,518
Income tax payable 29 12
Financial liabilities 14 620 1,093
Provisions 13 47,587 18,009
Total current liabilities 241,916 161,003
Non-current liabilities
Interest bearing liabilities - financial institutions 12(b) 53,654 51,988
Financial liabilities 14 — 12
Provisions 13 19,421 4,519
Total non-current liabilities 73,075 56,519
Total liabilities 314,991 217,522
Net assets 255,051 259,419
Equity
Contributed equity 15 482,819 353,227
Reserves 17 12,022 12,063
Accumulated losses (239,790) (105,871)
Total equity 255,051 259,419
The above consolidated statement of financial position should be read in conjunction with the accompanying notes.
For
per
sona
l use
onl
y

64
FINANCIAL STATEMENTSfor the year ended 30 June 2017
CONSOLIDATED STATEMENT OF CASH FLOWS
PMP Group
2017 2016YEAR ENDED 30 JUNE 2017 NOTES $’000 $’000
Cash flows from operating activitiesReceipts from customers 1,191,633 881,959
Payments to suppliers and employees (1,199,806) (842,695)
Fee for early termination of corporate bond 2(b), 3 — (1,500)
Interest received 673 787
Interest and other costs of finance paid (4,887) (6,520)
Income tax (paid)/received (113) (8)
Net cash flow (used in)/provided by operating activities 26(a) (12,500) 32,023
Cash flows from investing activities
Payments for property, plant and equipment (1,950) (4,232)
Proceeds from sale of property, plant and equipment 265 2,398
Acquisition of controlled entity 11,134 —
Net cash flow provided by/(used in) investing activities 9,449 (1,834)
Cash flows from financing activities
Repayment of corporate bond 12 — (50,000)
Repayments of borrowings (3,848) (2,441)
Proceeds from new borrowings 12 14,826 40,000
Dividends paid to company’s shareholders 16 (7,636) (9,715)
Payment for share buy-back 15 — (4,141)
Net cash flow provided by/(used in) financing activities 3,342 (26,297)
Net increase in cash and cash equivalents 291 3,892
Cash and cash equivalents at the beginning of the financial year 54,103 49,529
Effects of exchange rate changes on cash and cash equivalents (54) 682
Cash and cash equivalents at end of the financial year 26(b) 54,340 54,103
The above consolidated statement of cash flows should be read in conjunction with the accompanying notes.
For
per
sona
l use
onl
y

65
FINANCIAL STATEMENTSfor the year ended 30 June 2017
CONSOLIDATED STATEMENT OF CHANGES IN EQUITY
PMP Group ($’000)
Contributed equity
Accumulated losses
Foreign currency
translation reserve
Share-based
payment reserve
Cash flow
hedge reserve
Total equity
YEAR ENDED 30 JUNE 2017 Attributable to equity holders of PMP Limited
At 1 July 2015 356,035 (94,090) 6,618 1,737 241 270,541
Currency translation differences — — 4,873 — — 4,873
Cash flow hedges (net of tax) — — — — (1,192) (1,192)
Defined benefit plan (net of tax) — (147) — — — (147)
Total (expense)/income recognised directly in equity — (147) 4,873 — (1,192) 3,534
Profit for the year — 185 — — — 185
Total comprehensive income/(expense) for the year — 38 4,873 — (1,192) 3,719
Dividends~ — (9,715) — — — (9,715)
Share buy-back (4,141) — — — — (4,141)
Share-based payments* 1,333 (2,104) — (214) — (985)
At 30 June 2016 353,227 (105,871) 11,491 1,523 (951) 259,419
At 1 July 2016 353,227 (105,871) 11,491 1,523 (951) 259,419
Currency translation differences — (51) (341) — — (392)
Cash flow hedges (net of tax) — — — — 974 974
Defined benefit plan (net of tax) — 195 — — — 195
Total income/(expense) recognised directly in equity — 144 (341) — 974 777
Loss for the year — (126,427) — — — (126,427)
Total comprehensive (expense)/income for the year — (126,283) (341) — 974 (125,650)
Dividends~ — (7,636) — — — (7,636)
Share buy-back 128,760 — — — — 128,760
Share-based payments* 832 — — (674) — 158
At 30 June 2017 482,819 (239,790) 11,150 849 23 255,051
The above consolidated statement of changes in equity should be read in conjunction with the accompanying notes.
~ At 30 June 2015, a dividend reserve of $50.1 million was created in the parent entity. A final ordinary dividend for the year ended 30 June 2015 was paid on 6 October 2015 and an interim ordinary dividend for the year ended 30 June 2016 was paid on 6 April 2016 from the parent entity dividend reserve. After the 2016 profit of the parent, the dividend reserve has a balance of $40.6 million. Final dividend for the year ended 30 June 2016, $7.636 million was paid on 7 October 2016 and no interim dividend was paid for the year ended 30 June 2017, leaving the balance of $33.0m on 30 June 2017.
* On 25 August 2016, the performance rights issued in October 2013 to the CEO and eligible executives were exercised. The vested rights were settled by the issue of 1,885,815 million shares for $0.832 million utilising the provision.
On 25 August 2015, the performance rights issued in October 2012 to the CEO and eligible executives were exercised. The vested rights were settled 50% by cash and 50% by the issue of 2.487 million shares for $1.333 million. The difference of ($2.104) million between the amount provided in the share-based payment reserve and settlement of the vested rights was transferred to accumulated losses, in accordance with accounting standards.
For
per
sona
l use
onl
y

66
FINANCIAL STATEMENTSNotes to and forming part of the Financial Statements for the year ended 30 June 2017
66
Financial Index
66
1 Summary of significant accounting policies
2a Revenue
2b Significant items
2c Profit before income tax
2d Auditors’ remuneration
2e Depreciation and amortisation
3 Finance costs
4 Income tax
5 Receivables
6 Inventories
7 Other assets
8 Property, plant and equipment
9 Goodwill and intangible assets
10 Deferred tax
11 Payables
12 Interest bearing liabilities
13 Provisions
14 Financial assets and financial liabilities
15 Contributed equity
16 Dividends
17 Reserves
18 Commitments
19 Controlled entities
20 Segmental information
21 Pension plans
22 Share-based payment plans
23 Related parties
24 Business combinations
25 Earnings per share
26 Cash flow statement notes
27 Financial instruments
28 Contingent liabilities
29 Subsequent events
30 Parent
Directors’ declaration
Independent Auditor’s Report
For
per
sona
l use
onl
y

67
FINANCIAL STATEMENTSNotes to and forming part of the Financial Statements for the year ended 30 June 2017
1 Summary of Significant Accounting Policies
BASIS OF PREPARATIONThe financial report is a general purpose financial report, which has been prepared in accordance with the requirements of the Corporations Act 2001, Accounting Standards and Interpretations, and complies with other mandatory professional reporting requirements.
The financial report comprises the financial statements of the consolidated entity (PMP Group) consisting of PMP Limited (parent) and its controlled entities. For the purposes of preparing the consolidated financial statements, PMP Limited is a for-profit entity.
Historical cost convention
The financial statements have been prepared in accordance with the historical cost convention, except for the revaluation of derivative financial instruments that have been measured at fair value. Historical cost is based on the fair values of the consideration given in exchange for goods and services.
STATEMENT OF COMPLIANCE Compliance with IFRS
The financial statements comply with Australian Accounting Standards, which include Australian Equivalents to International Financial Reporting Standards (“AIFRS”). Compliance with AIFRS ensures that the financial statements, comprising the financial statements and notes, thereto
comply with International Financial Reporting Standards (“IFRS”). The financial statements were authorised for issue by the Directors on 31 August 2017.
ADOPTION OF NEW AND REVISED ACCOUNTING STANDARDS In the current year, PMP Group has adopted all of the new and revised Standards and Interpretations issued by the Australian Accounting Standards Board (“AASB”) that are relevant to its operations and effective for the year ended 30 June 2017.
In preparing the consolidated financial statements for the current year, the Group has applied the changes required by the following amendments to AASBs.
• AASB 2014-4 ‘Amendments to Australian Accounting Standards - Clarification of Acceptable Methods of Depreciation and Amortisation’
• AASB 2015-1 ‘Amendments to Australian Accounting Standards - Annual Improvements to Australian Accounting Standards 2012-2014 Cycle’
• AASB 2015-2 ‘Amendments to Australian Accounting Standards - Disclosure Initiative: Amendments to AASB 101’
Standards and interpretations issued not yet adopted
At the date of publication, the Standards and Interpretations that were issued but not yet effective are listed below.
Standard/Interpretation Effective for annual reporting periods beginning on or after
Expected to be initially applied in the financial year ending
AASB 9 ‘Financial Instruments’ and the relevant amending standards 1 January 2018 30 June 2019
AASB 15 ‘Revenue from Contracts with Customers’, AASB 2014-5 ‘Amendments to Australian Accounting Standards arising from AASB 15’, AASB 2015-8 ‘Amendments to Australian Accounting Standards - Effective date of AASB 15’ and AASB 2016-3 Amendments to Australian Accounting Standards - Clarifications to AASB 15’
1 January 2018 30 June 2019
AASB 16 ‘Leases’ 1 January 2019 30 June 2020
AASB 2016-1 ‘Amendments to Australian Accounting Standards - Recognition of Deferred Tax Assets for Unrealised Losses’. Amendment to AASB 112.
1 January 2017 30 June 2018
AASB 2016-2 ‘Amendments to Australian Accounting Standards - Disclosure Initiative: Amendments to AASB 107, Statement of cash flows’.
1 January 2017 30 June 2018
AASB 2016-5 ‘Amendments to Australian Accounting Standards - Clarification and Measurement of Share-based Payment Transactions. Amendments to AASB 2.
1 January 2018 30 June 2019
AASB 9 Financial Instruments:
Introduced new requirements for the classification and measurement of financial assets including impairment requirements for financial assets and limited amendments to the classification and measurement requirements by introducing a ‘fair value through other comprehensive income’ (“FVTOCI”) measurement category for certain simple debt instruments. The types of instruments that qualify for hedging instruments and the types of risk components of non-financial items that are eligible for hedge accounting has been broadened. Also, the effectiveness test has been replaced with the principle of an ‘economic relationship’. Retrospective assessment of hedge effectiveness is no
longer required and enhanced disclosure requirements about an entity’s risk management activities have also been introduced. The standard is not applicable until 1 January 2018 but is available for early adoption. The Group has not yet assessed its impact and has not yet decided when to adopt AASB 9.
AASB 15 Revenue from contracts with customers:
Establishes a single comprehensive model for entities to use in accounting for revenue arising from contracts with customers and will supersede the current revenue recognition guidance when it becomes effective in January 2018. The core principle of AASB 15 is that an entity
For
per
sona
l use
onl
y

68
FINANCIAL STATEMENTSNotes to and forming part of the Financial Statements for the year ended 30 June 2017
should recognise revenue to depict the transfer of promised goods or services to customers in an amount that reflects the consideration to which the entity expects to be entitled in exchange for those goods or services. Specifically, the Standard introduces a 5-step approach to revenue recognition as follows:
Step 1: Identify the contract(s) with a customer
Step 2: Identify the separate performance obligations in the contract
Step 3: Determine the transaction price
Step 4: Allocate the transaction price to the separate performance obligations in the contract
Step 5: Recognise revenue when (or as) the entity satisfies each performance obligation
The Group has elected to early adopt AASB 15 from 1 July 2017. Refer to critical estimate section for impact assessment.
AASB 16 Leases:
Introduces a new accounting model for leases that requires lessees to recognise all leases on balance sheet, except for short-term leases and leases of low value assets. Under the model a lease asset and liability will be initially recognised. Amortisation of lease assets and interest on the lease liabilities will be recognised in the income statement over the lease term. The total amount of cash paid will be separated into a principal portion (financing activities) and interest (operating activities) for presentation in the cash flow statement. Lessor accounting will not change significantly. The standard includes better guidance on identifying whether a contract contains a lease and requires enhanced disclosures. AASB 16 is not applicable until 1 January 2019 but is available for early adoption but only if AASB 15 Revenue from contracts with customers is also applied. The Group has not yet assessed its impact and has not yet decided when to adopt AASB 16.
BASIS OF CONSOLIDATIONSubsidiaries
The consolidated financial statements are those of the economic entity (PMP Group) comprising PMP Limited (the head entity ‘PMP’) and its subsidiaries including newly acquired company IPMG Holdco Pty Ltd and its subsidiaries.
The consolidated financial statements include the information contained in the financial statements of PMP and each of its subsidiaries as from the date PMP obtains control until such time as control ceases. Control is achieved when PMP Limited:
• Has power over the investee;
• Is expected, or has rights to variable returns from its involvement with the investee; and
• Has the ability to use its power to affect its returns
The financial statements of controlled entities are prepared for the same reporting period as PMP using consistent accounting policies.
All intercompany balances, transactions, and unrealised profits arising on transactions between Group companies have been eliminated in full.
RECOVERABLE AMOUNT OF ASSETSAt each reporting date, the PMP Group assesses whether there is any indication that an asset may be impaired. Where an indicator of impairment exists, the PMP Group makes a formal estimate of recoverable amount. Where the carrying amount of an asset exceeds its recoverable amount the asset is considered impaired and is written down to its recoverable amount.
Recoverable amount is the greater of fair value less cost of disposal to sell and value in use. It is determined for an individual asset, unless it does not generate inflows that are largely independent of those from other assets or groups of assets, in which case, the recoverable amount is determined for the cash generating unit to which the asset belongs.
In assessing value in use, the estimated future cash flows are discounted to their present value using a pre-tax discount rate that approximates the weighted average cost of capital for that cash generating unit.
In determining fair value less cost of disposal to sell, a discounted cash flow model is used based on a methodology maximising the use of market observed inputs.
The assumptions used in the assessment of recoverable amount are discussed in Note 9.
FOREIGN CURRENCIESThe individual financial statements of each entity in the PMP group are presented in their functional currency which equates to their local currency. For the purposes of the consolidated financial statements, the results and financial position of each group entity are expressed in Australian dollars, which is the functional currency of PMP Limited and the presentation currency for the consolidated financial statements.
Transactions in foreign currencies are converted to functional currency at the rate of exchange ruling at the date of the transaction.
Monetary amounts payable to and by the entities within the PMP Group that are outstanding at the balance date and are denominated in foreign currencies have been converted to functional currency using rates of exchange at the end of the year.
Non-monetary amounts that are measured at historical cost in a foreign currency are translated using the exchange rate as at the date of the initial transaction.
The assets and liabilities of the controlled entities incorporated overseas are translated into the PMP Group presentation currency at the rates of exchange ruling at balance date. The consolidated statements of profit or loss and other comprehensive income are translated at an average rate for the year.
Exchange differences arising on translation are taken directly to the foreign currency translation reserve.
On the disposal of a foreign operation, a proportionate share of the amount recognised in the foreign currency translation reserve relating to that particular foreign operation is recognised in the Consolidated statement of profit or loss and other comprehensive income, as part of the gain or loss on sale.
CASH AND CASH EQUIVALENTSFor the purposes of the cash flow statement, cash includes cash on hand and in banks. Cash on hand and in banks is stated at nominal amount.
For
per
sona
l use
onl
y

69
FINANCIAL STATEMENTSNotes to and forming part of the Financial Statements for the year ended 30 June 2017
TRADE RECEIVABLESTrade debtors are recognised and carried at original invoice amount less a provision for any uncollectible debts. An estimate for doubtful debts is made when collection of the full amount is no longer probable. Bad debts are written-off as incurred.
Receivables from related parties are recognised and carried at the nominal amount due less provision for amounts not receivable.
INVENTORIES Inventories are valued at the lower of cost and net realisable value.
Costs incurred in bringing each product to its present location and condition are accounted for as follows:
• Raw materials: cost is determined by the average cost method.
• Finished goods and work-in-progress: cost of direct material and labour and an appropriate proportion of fixed and variable manufacturing overheads based on normal operating capacity.
PROPERTY, PLANT AND EQUIPMENTProperty, plant and equipment is stated at cost less accumulated depreciation and any impairment in value. Subsequent costs are included either in the assets carrying value or as a separate asset only when it is probable that future economic benefits will flow to the Group and the cost can be reliably measured.
Property, plant and equipment is derecognised upon disposal or when no future economic benefits are expected to arise from the continued use of the asset.
Any gain or loss arising on the disposal or retirement is the difference between the sales proceeds and the carrying amount of the asset and is recognised in profit or loss.
Depreciation
Property, plant and equipment is depreciated or amortised at rates based upon their expected useful lives using the straight line method. Major depreciation periods are consistent with the prior period and are as follows:
• Leasehold improvements to the lease term
• Printing presses 7.5 to 20 years
• Computer equipment 3 to 4 years
Useful lives are reviewed, and adjusted, if appropriate at each reporting date.
NON-CURRENT ASSETS (OR DISPOSAL GROUPS) HELD FOR SALE Non-current assets (or disposal groups) are classified as held for sale if their carrying value will be recovered principally through a sale transaction rather than through continuing use. They are measured at the lower of their carrying amount and fair value less costs to sell. An impairment loss is recognised for any initial or subsequent write-down of the asset. Non-current assets classified as held for sale are not depreciated while they are classified as held for sale.
Where subsequently the decision has been made not to sell an asset classified as held for sale, the asset is valued at the lower of its carrying amount before it was classified as held for sale, adjusted for depreciation that would have been recognised had the asset not been classified as held for sale, and its recoverable amount.
PAYABLESLiabilities for trade creditors and other amounts are carried at cost which is the fair value of the consideration to be paid in the future for goods and services received, whether or not billed to the consolidated entity.
Payables to related parties are carried at the principal amount.
LEASESFinance leases, which transfer to the Group substantially all the risks and benefits incidental to ownership of the leased item, are capitalised at the lower of present value of the minimum lease payments or the fair value of the leased property, disclosed as leased property, plant and equipment, and amortised over the shorter of the lease term and useful life of the asset.
Operating leases, which do not transfer to the Group substantially all the risks and benefits of the leased item, are not capitalised and rental payments are included in the determination of the profit and loss in equal instalments over the lease term.
The cost of improvements to leasehold property related to these operating leases is capitalised and amortised over the unexpired period of the lease or the estimated useful lives of the improvements, whichever is the shorter.
In the event that lease incentives are received to enter into operating leases, such incentives are initially recorded as a liability and are then recognised as a reduction in rental expense on a straight line basis over the lease term.
A provision for make good is recognised when property leases require the restoration of premises to its original condition at the conclusion of the lease. Refer to the Group’s accounting policy on provisions for the criteria that must be satisfied for the recognition of a provision.
INTANGIBLE ASSETSGoodwill
Goodwill represents the excess of the purchase consideration over the fair value of identifiable net assets and contingent liabilities acquired at the date of acquisition of a business.
Following initial recognition, goodwill is measured at cost less any accumulated impairment losses. Goodwill is not amortised, but is reviewed for impairment each reporting date, or more frequently if events or changes indicate that the carrying amount may be impaired.
At the date of any acquisition, goodwill acquired is allocated to the cash generating unit or groups of cash generating units expected to benefit from the acquisition.
Where the recoverable amount of the cash generating unit is less than the carrying amount of goodwill, an impairment loss is recognised.
Where goodwill forms part of a cash generating unit and part of the operation within that unit is disposed of, the goodwill associated with the operation disposed of is included within the carrying amount of the operation when determining the gain or loss on disposal of the operation as discussed in Note 9.
For
per
sona
l use
onl
y

70
FINANCIAL STATEMENTSNotes to and forming part of the Financial Statements for the year ended 30 June 2017
Development and licence costs
Costs incurred in acquiring products or systems that will generate future benefits are capitalised.
Amortisation is charged on a straight line basis, the expense is taken to the Consolidated statement of profit or loss and other comprehensive the income through ‘amortisation’ line item as follows:
• Database development costs 3 years
• Software development costs 3 - 7 years
Useful lives are examined on an annual basis and adjustments, where applicable, are made on a prospective basis.
REVENUE RECOGNITIONRevenues are recognised at the fair value of consideration received or receivable net of the amount of goods and services tax (“GST”).
Revenue is recognised to the extent that it is probable that the economic benefits will flow to the entity and the revenue can be reliably measured. Revenue is recognised net of returns, discounts and allowances.
When rendering services under contract and both the contract outcome can be reliably measured and control of the right to be compensated for the services and the stage of completion can be reliably measured, revenue is recognised on a progressive basis as the costs to complete the service contract are performed.
Rental income is recognised as income in the periods in which it is earnt.
TAXESIncome tax
The income tax expense or benefit for the year is the tax payable on the current year’s taxable income based on the notional income tax rate for each jurisdiction, adjusted by changes in deferred tax assets and liabilities attributable to temporary differences between the tax bases of assets and liabilities and their carrying amounts in the financial statements, and unused tax losses.
Deferred tax assets and liabilities are recognised for temporary differences at the rates expected to apply when the assets are recovered or liabilities are settled, based on the tax rates for each jurisdiction. The relevant tax rates are applied to the cumulative amounts of deductible and taxable temporary differences to measure the deferred tax asset or liability.
Deferred tax assets are recognised for deductible temporary differences and unused tax losses only if it is probable that future taxable amounts will be available to utilise those temporary differences and losses.
Deferred tax liabilities and assets are offset when there is a legally enforceable right to set off current tax assets against current tax liabilities and when they relate to income taxes levied by the same taxation authority and the Group intends to settle its current tax assets and liabilities on a net basis
Tax consolidation legislation
PMP Limited and its wholly-owned Australian controlled entities have implemented tax consolidation legislation.
The head entity, PMP Limited, and the controlled entities in the tax consolidated group account for their own current and deferred amounts. These are measured as if each entity continued to be a stand alone taxpayer in its own right.
In addition to its own current and deferred tax amounts, PMP Limited also recognises the current tax liabilities (or assets) and the deferred tax assets rising from unused tax losses and unused tax credits assumed from controlled entities in the tax consolidated group. Assets or liabilities arising are accounted for in accordance with the tax funding agreement, details of which are disclosed in Note 4.
PMP’s 100% owned subsidiaries operating in New Zealand also adopt the same approach, with PMP (NZ) Limited heading up the consolidated tax group in New Zealand.
Goods and services tax (“GST”)
Revenues, expenses and assets are recognised net of the amount of GST except where:
• the GST incurred on purchase of goods and services is not recoverable from the taxation authority, in which case, the GST is recognised as part of the cost of acquisition of the asset or as part of the expense item applicable; and
• receivables and payables are stated with the GST amount included.
The net amount of GST recoverable from, or payable to, the taxation authority is included as part of receivables or payables in the balance sheet.
Cash flows are included in the cash flow statement on a gross basis and the GST component of cash flows arising from investing and financing activities, which is recoverable from, or payable to, the taxation authority are classified as operating cash flows.
EMPLOYEE BENEFITSWages and salaries, annual leave, sick leave, workers’ compensation and long service leave
Provision has been made in the financial statements for benefits accruing to employees in relation to sick leave (where mandatory obligation exists), annual leave, long service leave and workers’ compensation. All on-costs, including superannuation, payroll tax, workers’ compensation premiums and fringe benefits tax are included in the determination of provisions.
Liabilities arising in respect of wages and salaries, sick leave and any other employee benefits expected to be settled within twelve months of the reporting date are measured at their nominal amounts based on remuneration rates which are expected to be paid when the liability is settled. All other employee benefit liabilities are measured at the present value of the estimated future cash outflow to be made in respect of services provided by employees up to the reporting date. In determining the present value of future cash outflows, the market yield as at the reporting date on corporate bonds, which have terms to maturity approximating the terms of the related liability, are used.
Employee benefit expenses and revenues arise in respect of the following categories:
• wages and salaries, non-monetary benefits, annual leave, long service leave, sick leave and other leave benefits; and
• other types of employee benefits are recognised against profits on a net basis in respective categories.
For
per
sona
l use
onl
y

71
FINANCIAL STATEMENTSNotes to and forming part of the Financial Statements for the year ended 30 June 2017
SUPERANNUATIONThe PMP Group has a defined benefit fund that provides defined benefits based on years of membership and final average salary and accumulation benefits (defined contribution fund). Employees contribute to the plan at various percentages of their wages and salaries.
An asset or liability in respect of the defined benefit fund is recognised in the balance sheet, and is measured as the present value of the defined benefit obligation plus unrecognised actuarial gains/losses less the fair value of the superannuation fund’s assets at that date and any unrecognised past service cost. The present value of the defined benefit fund has been determined using the projected unit credit actuarial valuation method. Various assumptions are required when determining the Group’s benefit obligation.
Contributions to the defined contribution fund are recognised as an expense as they become payable.
Share-based payment transactions
Share-based payment transactions are provided to employees via the PMP employee long term incentive plan (“LTI”) and the CEO’s short term incentive plan (“STI”). Information relating to these schemes are set out in Note 22.
The fair value of rights is recognised as an employee benefit expense with a corresponding increase in equity. The fair value is measured at grant date and recognised over the period during which the employees become unconditionally entitled to the rights. The fair value is determined by an external valuer taking into account the terms and conditions upon which the instruments were granted as discussed in Note 22.
The fair value of the rights excludes the impact of any non-market based vesting conditions. Non-market based vesting conditions are included in assumptions about the number of rights that are expected to ultimately vest. At each balance sheet date, the PMP Group revises its estimate of the number of rights that are expected to become exercisable. The employee benefit expense recognised each period takes into account the most recent estimate.
No expense is recognised for rights that do not ultimately vest, except for rights where vesting is conditional upon a market condition.
INTEREST BEARING LIABILITIESOther financial liabilities, including borrowings, are measured at fair value, net of transaction costs.
After initial recognition, loans are subsequently measured at amortised cost using the effective interest method. Amortised cost is calculated by taking into account any issue costs, and any discount or premium on settlement.
FINANCE COSTSFinance costs are expensed.
PROVISIONSProvisions are recognised when the PMP Group has a legal, equitable or constructive obligation to make a future sacrifice of economic benefits to other entities as a result of past transactions or other past events, it is probable that a future sacrifice of economic benefits will be required and a reliable estimate can be made of the amount of the obligation.
If the effect of the time value of money is material, provisions are determined by discounting the expected future cash flows at a pre-tax
rate that reflects current market assessments of the time value of money and, where appropriate, the risks specific to the liability. Where discounting is used, the increase in the provision due to the passage of time is recognised as a finance cost.
FINANCIAL INSTRUMENTSThe PMP Group uses derivative financial instruments such as forward exchange contracts, interest rate swaps and cross currency swaps to hedge its risks associated with interest rate and foreign currency fluctuations. Derivative financial instruments are initially recognised at cost on the date a derivative contract is entered into and are subsequently re-measured to their fair value.
The fair value of forward exchange contracts is calculated by reference to current forward contracts with similar maturity profiles. The fair value of interest rate swap and cross currency swap contracts are determined by reference to market values for similar instruments.
The method of recognising the resulting gain or loss depends on whether the derivative is designated as a hedging instrument, and if so, the nature of the hedge relationship. The PMP Group policy is to undertake hedging in respect of certain recognised assets or liabilities or a firm commitment (fair value hedge relationships); and for highly probable forecast sales or purchases (cash flow hedge relationships).
The PMP Group documents at the inception of the transaction the relationship between hedging instruments and hedged items, as well as its risk management objective and strategy for undertaking various hedge transactions. The PMP Group also documents its assessment, both at hedge inception and on an ongoing basis, of whether the derivatives that are used in the hedging relationship have been and will continue to be highly effective in offsetting changes in fair values and cash flows of hedged items.
(i) Cash flow hedge
The effective portion of changes in the fair value of derivatives that are designated and qualify as cash flow hedges is recognised in equity in the hedging reserve. The gain or loss relating to the ineffective portion is recognised immediately in the consolidated statement of profit or loss and other comprehensive income.
Amounts accumulated in equity are recycled in the consolidated statement of profit or loss and other comprehensive income in the periods when the hedged item will affect the profit and loss. However, when the forecast purchase or sale transaction that is hedged results in the recognition of a non-financial asset, the gains and losses previously deferred in equity are transferred from equity and included as a basis adjustment to the initial cost or carrying amount of the asset.
Hedge accounting is discontinued when the hedging instrument expires or is sold, terminated or exercised, or no longer qualifies for hedge accounting. At that point in time, any cumulative gain or loss on the hedging instrument recognised in equity is kept in equity until the forecasted transaction occurs. If a hedged transaction is no longer expected to occur, the net cumulative gain or loss recognised in equity is transferred to net profit or loss for the year.
(ii) Derivatives that do not qualify for hedge accounting
Certain derivatives do not qualify for hedge accounting. Changes in the fair value of any derivative instrument that does not qualify for hedge accounting are recognised immediately in the consolidated statement of profit or loss and other comprehensive income.
For
per
sona
l use
onl
y

72
FINANCIAL STATEMENTSNotes to and forming part of the Financial Statements for the year ended 30 June 2017
DIVIDENDS AND DIVIDEND RESERVEProvision is made for the amount of any dividend declared, being properly authorised and no longer at the discretion of the entity, on or prior to the financial year end but not distributed at balance date.
Due to the statutory loss PMP has not declared a dividend for the 2017 year (nor paid any interim dividends).
After the payment of the June 2016 final dividend of $7.636 million in October 2016, the dividend reserve has a balance of $33.0 million at 30 June 2017.
SEGMENT REPORTINGOperating segments are reported in a manner consistent with the internal reporting provided to the chief operating decision maker. The chief operating decision maker is responsible for allocating resources and assessing performance of the operating segments. Segment information is presented on the same basis as that used for internal reporting purposes.
CRITICAL ACCOUNTING ESTIMATES, ASSUMPTIONS AND JUDGEMENTSThe preparation of financial statements requires management to make judgements, estimates and assumptions that affect the application of accounting policies and the reported amounts of assets, liabilities, income and expenses. Actual results may differ from these estimates.
Estimates and underlying assumptions are reviewed on an ongoing basis. Revisions to accounting estimates are recognised in the period in which the estimate is revised and in any future periods affected.
In particular, information about significant areas of estimation uncertainty and critical judgements in applying accounting policies that have the most significant effect on the amount recognised in the financial statements are described in the following notes:
• Note 9 - Impairment testing of goodwill
• Note 10 - Deferred tax
• Note 27 - Financial instruments
(i) Purchase price accounting for acquisition of IPMG
The initial accounting for the business combination has been completed and provisional amounts agreed. The provisional amounts will be adjusted during the measurement period or additional assets or liabilities will be recognised, to reflect new information obtained about facts and circumstances that existed at the acquisition date that, if known, would have affected the amounts recognised at that date. Refer Note 24 for further details.
(ii) Goodwill, intangible assets, property, plant and equipment
The Group determines whether goodwill is impaired on a bi-annual basis and assesses impairment of all other assets at each reporting date by evaluating conditions specific to the Group and to the particular asset that may lead to impairment. These include technology, economic and political environments. If an impairment trigger exists the recoverable amount of the asset is determined.
Recoverable amount is the greater of fair value less costs of disposal and value in use. It is determined for an individual asset, unless it does not generate inflows that are largely independent of those from other assets or group of assets, in which case, the recoverable amount is determined for the cash generating unit to which the asset belongs. An estimation of recoverable amount of cash generating units is made by
using a value in use model or fair value less costs of disposal. A number of assumptions are made by the Group in this estimation of recoverable amount.
In assessing value in use, the estimated future cash flows, excluding future uncommitted restructurings and associated benefits, are discounted to their present value using a pre-tax discount rate that approximates the weighted average cost of capital for that cash generating unit.
In assessing fair value less costs of disposal, primary consideration is given to external sources of value such as comparable transactions adjusted for costs of disposal, market price in an actively traded market or the best information available to reflect the amount to be obtained from disposal. In the absence of comparable transactions, fair value has been assessed using a discounted cash flow methodology. This is supported by EBITDA multiples which serve as an external cross check. PMP believe that this provides the best indication of the recoverable amount to be obtained from disposal of the cash generating unit at arms length between knowledgeable and willing parties.
(iii) Deferred tax assets
Deferred tax assets are recognised for all unused tax losses to the extent that it is probable that future taxable profits will be available against which the losses can be utilised. Significant management judgement is required to determine the amount of deferred tax asset that can be recognised, based on the likely timing and level of future taxable profits.
Based on forecasts for the newly merged PMP and IPMG business the Directors expect that the existing recognised Australian tax losses of $34.8 million on the balance sheet will be recouped over a 4-5 year period. Therefore the 2017 Australian tax loss of $50.1 million (tax effect $15 million) will not be recognised . The current year loss is significantly higher than prior years due to the transformation costs incurred as a result of the merger.
These 2017 unrecognised losses of $50.1 million, together with the transfer of $93.4 million of IPMG tax losses to PMP on 1 March 2017 (and other adjustments), now bring the total unrecognised tax losses to $203.7 million (tax effect $61.1 million).
Despite the non-recognition of these losses on the balance sheet, the losses will remain available indefinitely for offset against future taxable profits, subject to continuing to meet the statutory tax tests of continuity of ownership or failing that, the same business test.
The New Zealand deferred tax asset value of $1.7 million, attributable to tax losses (which were partly recouped this year), are expected to be fully recouped over a period of 2 years.
(iv) Fair value measurement and valuation process
PMP has financial instruments that are carried at fair value in the Consolidated statement of financial position. The best evidence of fair value is quoted prices in an active market. If the market for a financial instrument is not active, PMP determines fair value by using various valuation models. The objective of using a valuation technique is to establish the price that would be received to sell an asset or paid to transfer a liability between market participants. The chosen valuation models make maximum use of market inputs and relies as little as possible on entity specific inputs. The fair values of all positions include assumptions made on the recoverability based on the counterparty’s and PMP’s credit risk.
Details of the inputs to the fair value of financial instruments are included in Note 27.
For
per
sona
l use
onl
y

73
FINANCIAL STATEMENTSNotes to and forming part of the Financial Statements for the year ended 30 June 2017
(v) Impact of early adoption of new revenue recognition standard AASB 15
The new revenue recognition standard AASB 15 comes into effect for the year ended 30 June 2019. After an initial review of the new standard, PMP has elected to early adopt from 1 July 2017 and the major impact will come from Gordon & Gotch sales. This will take into account only the distribution fee rather than the cover price of the magazines, which more closely reflects the performance obligations vs control aspects of the contracts.
The change does not impact EBITDA as the reduction in sales revenues is mirrored by a commensurate reduction in finished cost of goods sold.
While the Gordon & Gotch statutory sales revenue for fiscal 2017 were $557.2 million on the existing basis, the new AASB 15 equivalent would have been $69.1 million a reduction of $488.2 million in sales revenue. As such, PMP Group sales for FY17 on the new AASB 15 basis is $563.3 million. There is also a $488.2 million reduction in finished cost of goods sold, so there is no impact on EBITDA.
A final review of the impact of the new standard on other businesses will be undertaken in the coming months. No material impacts are envisaged.
For
per
sona
l use
onl
y

74
FINANCIAL STATEMENTSNotes to and forming part of the Financial Statements for the year ended 30 June 2017
PMP Group
2017 2016YEAR ENDED 30 JUNE 2017 NOTES $’000 $’000
2a Revenue Sales revenue 1,051,483 815,979
Included in (loss)/profit before income tax are the following items of other revenue:
Other income - external 5,097 2,740
Rental income 389 613
Interest income 3 653 784
Total other revenue 6,139 4,137
Total revenue 20 1,057,622 820,116
2b Significant items
Included in net (loss)/profit after income tax are the following significant items of income and expense:
Significant income and expensesNet loss on disposal of plant and equipment and non-current assets classified as held for sale
2(a) — 224
Net loss on disposal of plant and equipment 337 —
Restructure initiatives and other one off costs 53,563 8,368
Onerous leases 20,028 —
Acquisition costs - IPMG Group 24 8,015 —
Impairment of intangible assets 24,590 —
Impairment of Dick Smith trade receivable — 3,894
Impairment/(reversal) of plant and equipment due to restructure initiatives 2(c), 8(b) 36,082 (230)
Fee for early termination of corporate bond 3 — 1,500
Write off of prepaid finance costs 3 — 833
Total significant items (included in (loss)/profit before interest and tax) 142,615 14,589
Tax benefit associated with significant items 33,193 4,671
Adjustment of prior year losses not recognised to actual (35) 111
Tax losses not brought to account (15,026) (1,841)
Tax benefit included in net (loss)/profit after tax 18,132 2,941
Significant items have been included in the Consolidated statement of profit or loss and other comprehensive income within the following categories:
Sales revenue — 350
Employee expenses 47,133 5,707
Freight 449 91
Repairs and maintenance 18 —
Occupancy costs 20,241 —
Other expenses - Impairment 60,672 —
- Legal and professional fees 8,886 —
- Other expenses 5,216 6,108
Finance costs — 2,333
142,615 14,589
For
per
sona
l use
onl
y

75
FINANCIAL STATEMENTSNotes to and forming part of the Financial Statements for the year ended 30 June 2017
PMP Group
2017 2016YEAR ENDED 30 JUNE 2017 NOTES $’000 $’000
2c (Loss)/profit before income tax(Loss)/profit before income tax is arrived at after charging/(crediting) the following items:
Lease rental expenses - operating leases 27,822 21,288 Net foreign exchange loss/(gain) 166 (49)Share-based payment plans 17 158 468 Net loss on disposal of property, plant and equipment 193 256 (Reversal)/impairment of plant and equipment 2(b) 36,082 (230)Impairment of Dick Smith trade receivable 2(b) — 3,894 Bad debt provision movement 5(a) 554 (96)
2017 2016$ $
2d Auditors’ remunerationAuditor of the parent entity
Auditing the accounts 439,200 278,460 Other services
- Taxation and related advisory services including for the acquisition of IPMG 555,300 91,350 994,500 369,810
Network firm of the parent entity auditorAuditing the accounts 86,908 98,238
Other services- Taxation and related advisory services 32,503 56,445
119,411 154,683
2017 2016$’000 $’000
2e Depreciation and amortisationDepreciation
Leasehold improvements 8(a) 1,212 1,027 Plant and equipment 8(a) 26,410 26,093
Total depreciation 27,622 27,120 Amortisation
Development and licence costs 9(a) 927 794 Total amortisation 927 794 Total depreciation and amortisation 28,549 27,914
3 Finance costsInterest expense
Bank loans and overdraft 5,087 6,026 Unwind of discount on long term provisions — 29
Total interest expense 5,087 6,055 Fee for early termination of corporate bond 2(b) — 1,500 Write off of prepaid finance costs 2(b) — 833 (Gain) on interest rate swaps - realised — (122)
Total finance costs 5,087 8,266 Interest income 2(a) (653) (784)Net finance costs 4,434 7,482
For
per
sona
l use
onl
y

76
FINANCIAL STATEMENTSNotes to and forming part of the Financial Statements for the year ended 30 June 2017
PMP Group
2017 2016YEAR ENDED 30 JUNE 2017 $’000 $’000
4 Income tax(a) Reconciliation of income tax (benefit)/expense
(Loss)/profit before income tax (144,019) 2,753
Prima facie income tax expense thereon at 30% (2016: 30%) (43,206) 826
Tax effect of non temporary and other differences:
Effect of differences in overseas tax rate 300 (136)
Income tax (over) provided in previous year 80 (72)
Non deductible items for tax purposes 10,208 545
Tax deductible items not in profit — (436)
Benefit of tax losses not brought to account 15,026 1,841
Income tax (benefit)/expense attributable to profit (17,592) 2,568
Major component of income tax (benefit)/expense:Current tax (benefit)/expense (13,353) 223
Deferred tax (benefit)/expense (4,239) 2,345
Income tax (benefit)/expense attributable to profit (17,592) 2,568
(b) Deferred tax assets and deferred tax liabilitiesAt 30 June 2017 there is no recognised or unrecognised deferred tax liability for taxes that would be payable on the unremitted earnings of PMP’s wholly owned subsidiaries, as the PMP Group has no liability for additional taxation should such amounts be remitted (2016: $nil).
(c) Franking creditsThe amount of franking credits available are:
Franking account balance as at the end of the financial year at 30% (2016: 30%) 62,529 —
Upon the acquisition of the IPMG tax consolidated group franking credits of $62.466 million transferred to the PMP tax consolidated group on 1 March 2017. This balance increased by June 2017 due to $63,000 of franking credits attached to dividends received by group members since March 2017.
(d) Tax consolidation and tax effect accounting by members of the tax consolidated groupEffective 1 July 2003, for the purposes of income taxation, PMP Limited and its 100% owned Australian subsidiaries formed a tax consolidated group. Members of the group have entered into a tax sharing agreement in order to allocate income tax expense to the wholly owned subsidiaries on a pro-rata basis. The agreement also provides for the allocation of income tax liabilities between the entities should the head entity default on its obligations. At the balance date the possibility of default is remote. The head entity of the tax consolidation group is PMP Limited.Members of the Australian tax consolidated group have also entered into a tax funding agreement. The tax funding agreement provides for the allocation of current tax assets and liabilities between wholly owned group members. Each group member of the PMP tax group calculates its current year tax liability on the basis of the stand alone approach. Once each member has calculated its own current year tax liability/tax loss the head entity will then assume these current year tax liabilities/tax losses and be paid/pay compensation for this assumption by way of an intercompany receivable/payable. Allocations under the tax funding agreement are made on a yearly basis.All 100% owned PMP entities operating in New Zealand are members of the PMP (NZ) Limited tax consolidated group. Although there is no NZ tax funding agreement, PMP (NZ) Limited and its group members have also calculated their current year tax liabilities/tax losses, and PMP (NZ) Limited is paid/pays compensation for this assumption by way of an intercompany receivable/payable on a yearly basis, in the same manner as the Australian tax funding agreement operates.
$000Gross
Current Year Tax effected
(e) Tax losses not brought to accountRevenue losses 203,694 61,108
Capital losses 287,293 86,188
The benefit of these revenue losses has not been brought to account as realisation is not probable within 4-5years, refer to Note 10 for details. Revenue losses recognised have increased substantially as $93.4 million of gross losses have been transferred from the IPMG tax consolidated group to the PMP tax consolidated group as at 1 March 2017. In addition the current year tax loss of $50.0 million has also not been recognised. Capital losses are only able to be used against capital gains and so are not recognised until used in any tax year.
For
per
sona
l use
onl
y

77
FINANCIAL STATEMENTSNotes to and forming part of the Financial Statements for the year ended 30 June 2017
PMP Group
2017 2016YEAR ENDED 30 JUNE 2017 NOTES $’000 $’000
5 ReceivablesTrade debtors* 114,615 95,237
Provision for doubtful debts 5(a) (1,324) (482)
Net trade debtors 113,291 94,755
Other debtors 5(c) 3,989 1,522
Total current receivables 117,280 96,277 * Trade debtors are non-interest bearing and are on commercial terms.
There were no material unhedged foreign currency receivables.
(a) Impaired trade receivables
PMP Group:At 30 June 2017 a provision for doubtful debts of $1,324,000 (2016: $482,000) has been recognised. This relates to a variety of customers who are in unexpectedly difficult economic situations and includes provision acquired from IPMG of $275,000.
Movements in the provision for doubtful debts are as follows:Balance as at 1 July 482 1,458
Provision acquired 275 —
Provision for doubtful debts recognised 2(c) 1,009 1,498
Amounts written off (450) (880)
Amounts recovered 463 —
Unused amount reversed 2(c) (453) (1,609)
Net foreign currency translation difference 2(c) (2) 15
Balance at 30 June 1,324 482
In determining the recoverability of trade receivables the Group will consider any change in the credit quality of the receivable from the date credit was originally granted up to the reporting date. The creation and release of the provision for impaired receivables has been included in “other expenses” in the Consolidated statement of profit or loss and other comprehensive income. Amounts due are generally written off when there is no expectation of recovering additional cash.
(b) Past due but not impairedAt 30 June 2017 there were $11,430,000 (2016: $23,046,000) of trade receivables in the PMP Group past due but not impaired.
The aging analysis of these trade receivables is as follows:Past due 1 - 30 days 7,963 20,091
Past due 31 - 60 days 1,331 1,858
Past due 61 - 90 days 1,366 482
Past due greater than 90 days 770 615
11,430 23,046
There are no receivables that have had renegotiated terms that would otherwise, without that renegotiation, have been past due or impaired.
(c) Other debtorsOther debtors generally arise from transactions outside of usual operating activities of the Group. Other debtors do not contain impaired assets and are not past due. Collateral is not usually obtained.
For
per
sona
l use
onl
y

78
FINANCIAL STATEMENTSNotes to and forming part of the Financial Statements for the year ended 30 June 2017
PMP Group
2017 2016YEAR ENDED 30 JUNE 2017 NOTES $’000 $’000
6 InventoriesRaw materials, spare parts and stores at cost 50,085 39,846
Less: provision for diminution (709) (774)
Net raw materials, spare parts and stores 49,376 39,072
Finished goods at cost 51,825 44,213
Work in progress at cost 5,629 2,317
Total current inventories 106,830 85,602
7 Other assets
Current other assets
Prepayments 6,565 2,465
Total current other assets 6,565 2,465
Non-current other assets
Shares in other entities - unlisted at cost 280 280
Write-down of shares in other entities to realisable value (40) (40)
Defined benefit plan asset 21 1,945 1,687
Other assets 729 1,145
Total non-current other assets 2,914 3,072
8 Property, plant and equipmentLeasehold improvements
At cost 14,546 12,411
Accumulated depreciation (7,608) (6,467)
Accumulated impairment (2,026) (422)
Net leasehold improvements 8(a) 4,912 5,522
Plant and equipment
At cost 656,245 608,468
Accumulated depreciation (437,325) (437,625)
Accumulated impairment (48,737) (20,421)
Net plant and equipment 8(a) 170,183 150,422
Leased plant and equipment
At cost 364 364
Accumulated depreciation (364) (364)
Net leased plant and equipment — —
Total net property, plant and equipment 8(a) 175,095 155,944
For
per
sona
l use
onl
y

79
FINANCIAL STATEMENTSNotes to and forming part of the Financial Statements for the year ended 30 June 2017
PMP Group
2017 2016YEAR ENDED 30 JUNE 2017 NOTES $’000 $’000
8 Property, plant and equipment (continued)(a) Reconciliations
Reconciliations of the carrying amounts for each class of property, plant and equipment are set out below:
Leasehold improvements
Carrying amount at beginning of year 5,522 5,993
Acquisitions 1,733 —
Disposals (13) —
Transfer from other fixed asset category 518 283
Depreciation 2(e) (1,212) (1,027)
Impairment (1,603) —
Net foreign currency translation difference (33) 273
Carrying amount at end of year 4,912 5,522
Plant and equipment
Carrying amount at beginning of year 150,422 172,864
Acquisitions 70,914 —Additions 1,966 4,275 Disposals (457) (2,654)Impairment (charge)/reversal 2(b), 2(c), 8(b) (32,340) 230 Transfer from/(to) other fixed asset category 6,363 (283)Depreciation 2(e) (26,410) (26,093)(Expensed)/credited to the profit and loss (40) 159 Net foreign currency translation difference (235) 1,924
Carrying amount at end of year 170,183 150,422
Total net property, plant and equipment 175,095 155,944
(b) ImpairmentImpairment/(reversal) of plant and equipment 2(b), 2(c) 33,943 (230)
33,943 (230)
The $0.2 million impairment reversal in 2016, relates to equipment in New Zealand which will be utilised for its remaining useful life.
For
per
sona
l use
onl
y

80
FINANCIAL STATEMENTSNotes to and forming part of the Financial Statements for the year ended 30 June 2017
PMP Group
2017 2016YEAR ENDED 30 JUNE 2017 NOTES $’000 $’000
9 Goodwill and intangible assetsDevelopment and licence costs
At cost 5,744 4,819
Accumulated amortisation (4,971) (3,854)
Closing net book amount 9(a) 773 965
Goodwill
At cost 98,760 98,760
Goodwill on acquisition 24 34,797 —
Accumulated impairment (99,623) (75,224)
Net foreign currency translation difference 2,941 3,013
Closing net book amount 9(a) 36,875 26,549
Total net intangibles 9(a) 37,648 27,514
(a) Reconciliations
Development and licence costs
Carrying amount at beginning of year 965 1,759
Acquisition 495 —
Additions 430 —
Impairment (190) —
Amortisation 2(e) (927) (794)
Carrying amount at end of year 773 965
Goodwill
Carrying amount at beginning of year 26,549 25,083
Goodwill on acquisition 24 34,797 —
Impairment* (24,399) —
Net foreign currency translation difference (72) 1,466
Carrying amount at end of year 9(b) 36,875 26,549
Total net intangibles 37,648 27,514
(b) Impairment testing of goodwill
Carrying amount of goodwill allocated to each cash generating unit:
Griffin Press printing - Australia* — 5,015
Maxum and heat-set web printing - New Zealand* — 19,439
Distribution - New Zealand 2,079 2,095
Print Group Australia 33,056 —
Marketing Services 1,740 —
Total goodwill 9(a) 36,875 26,549
* The goodwill associated with Griffin Press in Australia, and Maxum and heatset printing in New Zealand was fully impaired at 30 June 2017.
In accordance with PMP policy, impairment testing has been undertaken at 30 June 2017 for all cash generating units (‘CGUs’) with goodwill or where there is an indication of impairment. The testing has been conducted using the higher of a value in use model and a fair value less costs of disposal model.
Fair value less costs of disposalThe recoverable amount of the cash generating units, Print Group Australia, Griffin Press, Distribution - Australia, Marketing Services, and Gordon & Gotch - Australia, is determined based on a fair value less costs of disposal calculation. In the absence of comparable transactions, fair value has been assessed using a discounted cash flow methodology with cross checks performed to external indicators, such as EBITDA multiples. This represents a level 3 model in line with the fair value hierarchy in accordance with AASB 13. PMP believe that this methodology provides the best indication of the price that would be received to sell the business in an orderly transaction between market participants at balance sheet date.
For
per
sona
l use
onl
y

81
FINANCIAL STATEMENTSNotes to and forming part of the Financial Statements for the year ended 30 June 2017
YEAR ENDED 30 JUNE 2017
9 Goodwill and intangible assets (continued)
(b) Impairment testing of goodwill (continued)
Fair value less costs of disposal (continued)In assessing fair value less costs of disposal, the estimated post tax future cash flows, including future uncommitted restructurings and associated benefits, are discounted using a post tax rate. The key assumptions used in the calculation are disclosed in the table below.
The Directors estimate that if EBITDA reflected in the model were to decrease up to 10% for the respective CGUs, it is unlikely that there will be an impairment.
Value in useThe recoverable amount of the cash generating units, Maxum and heat-set web printing – New Zealand, Gordon & Gotch - New Zealand and Distribution – New Zealand is determined based on a value in use calculation. In assessing value in use, the estimated future cash flows, excluding future uncommitted restructurings and associated benefits, are discounted to their present value using a pre-tax discount rate. The key assumptions used are disclosed in the table below.
The Directors believe that sensitivity analyses performed indicate that if a change in EBITDA reflected in the models were to decrease by up to 10% for the respective CGUs, it is unlikely that there will be an impairment.
Key assumptions:Management judgement is required in assessing whether the carrying value of assets can be supported by the net present value of future cash flows. The following are the key estimates and assumptions used in determining the net present value of future cash flows using a value in use calculation and fair value less costs of disposal calculation:
Area of judgement Assumption used in value in use calculation - Maxum & heat-set web printing (New Zealand)- Distribution (New Zealand) - Gordon & Gotch (New Zealand)
Budgeted EBITDA The Group prepares three year plans which are internally approved by senior management. These plans form the basis of the discounted cash flow models used for impairment testing, and are based upon past experience and future outlook.
Budgeted EBITDA is calculated as operating profit before depreciation and amortisation, based upon past experience and future outlook. Adjustments are made to budgeted EBITDA as follows: - removal of benefits from future uncommitted restructuring - inclusion of working capital movements
Long term growth rate Management’s plan is used for the first three years of the Group’s value in use calculations.
An annual growth rate of 0% for years four, five and perpetuity (where applicable) has been applied. The rate applied is based on management’s assessment of the specific circumstances of that business.
Budgeted capital expenditure
The cash flow forecasts for capital expenditure are based on past experience and include the ongoing capital expenditure required to maintain current fixed asset levels after taking into account budgeted repairs and maintenance.
Pre-tax discount rate The pre-tax discount rate applied to the cash flows of each of the Group’s cash generating units in Australia and New Zealand is 13.8% (2016: 14.2% ).
The pre tax discount rate is approximated by applying a gross up formula to the calculated post tax rate. The discount rate is based on the risk free rate for ten year government bonds adjusted for a risk premium to reflect the increased risk of investing in equities (“equity market risk premium”) and the systematic risk adjustment (“beta”) to reflect the risk of the Company relative to the market as a whole.
Area of judgement Assumption used in fair value less costs of disposal calculation - Print Group Australia - Distribution (Australia)- Griffin Press - Marketing Services- Gordon & Gotch (Australia)
Budgeted EBITDA The Group prepares three year plans which are internally approved by senior management. These plans form the basis of the discounted cash flow models used for impairment testing, and are based upon past experience and future outlook.
Post tax cash flows used. Notional tax of 30% in Australia and 28% in New Zealand applied. Cash flows include working capital movements as well as future uncommitted restructurings and benefits associated with those future restructurings. Includes costs to sell cash outflow of 1.5%. An annual growth rate of 0% has been applied.
Post-tax discount rate The post-tax discount rate applied to the cash flows was 10.0% (2016: 11%).
For
per
sona
l use
onl
y

82
FINANCIAL STATEMENTSNotes to and forming part of the Financial Statements for the year ended 30 June 2017
PMP Group
2017 2016YEAR ENDED 30 JUNE 2017 NOTES $’000 $’000
10 Deferred tax Deferred tax assets
Temporary differences:- Provisions/accruals 26,158 10,575
- Property, plant and equipment 5,081 1,227
- Cash flow hedges (13) 396
- Other assets (949) (1,069)
Tax losses 36,505 38,206
Total deferred tax assets 10(a) 66,782 49,335
Provisions/Accruals
Other Assets
Property, Plant and Equipment
Cash flowhedges
Tax losses Total
YEAR ENDED 30 JUNE 2017 $000 $000 $000 $000 $000 $000
(a) Movements in deferred tax assetsAt 1 July 2015 12,008 — 458 — 40,327 52,793
(Charged)/credited
- to profit or loss (1,537) 619 303 — — (615)
- to other comprehensive income — 63 — 497 — 560
- foreign currency translation reserve 104 — (58) (7) 402 441
Adjustment for reallocation of opening balance — (1,751) — (94) — (1,845)
Adjustment of prior year losses — — 524 — (524) —
Utilisation of tax losses — — — — (1,999) (1,999)
At 30 June 2016 10,575 (1,069) 1,227 396 38,206 49,335
(Charged)/credited
- to profit or loss 5,064 3,265 10,971 — — 19,300
- to other comprehensive income — (83) — (408) — (491)
- foreign currency translation reserve (10) — — (1) (24) (35)
- to goodwill 10,529 (3,062) (7,117) — — 350
Utilisation of tax losses — — — — (1,677) (1,677)
At 30 June 2017 26,158 (949) 5,081 (13) 36,505 66,782
For
per
sona
l use
onl
y
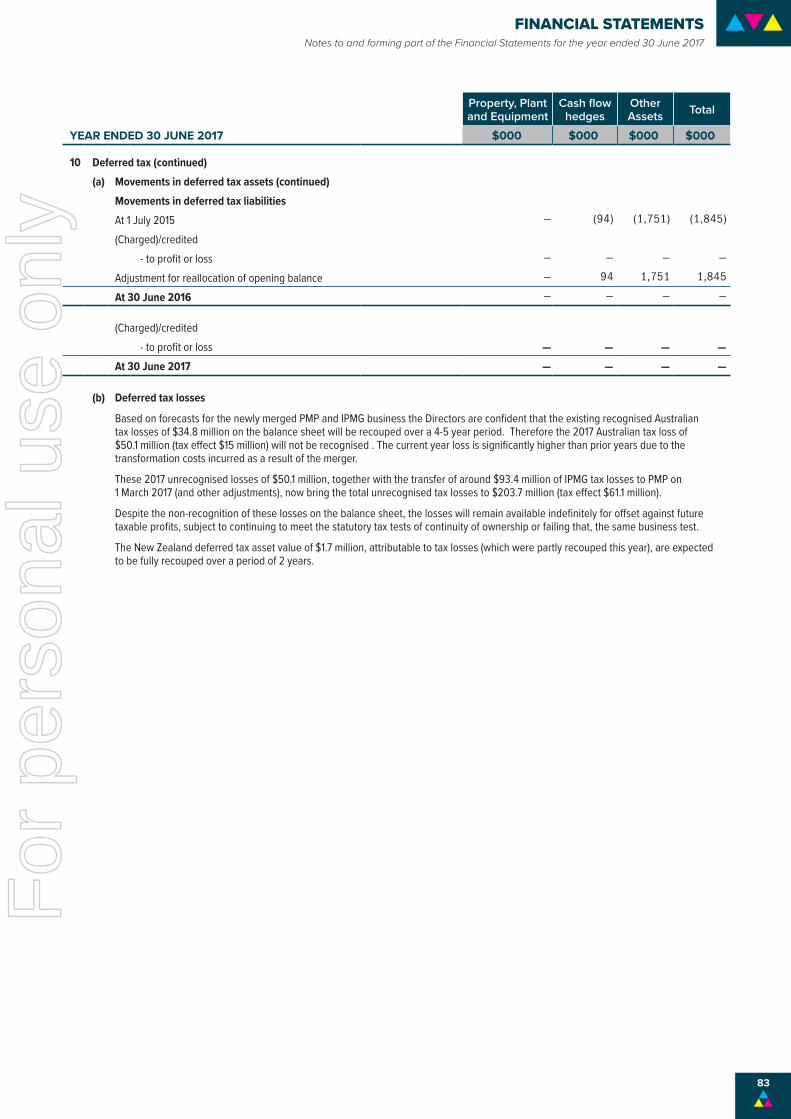
83
FINANCIAL STATEMENTSNotes to and forming part of the Financial Statements for the year ended 30 June 2017
Property, Plant and Equipment
Cash flowhedges
Other Assets Total
YEAR ENDED 30 JUNE 2017 $000 $000 $000 $000
10 Deferred tax (continued)(a) Movements in deferred tax assets (continued)
Movements in deferred tax liabilitiesAt 1 July 2015 — (94) (1,751) (1,845)
(Charged)/credited - to profit or loss — — — —
Adjustment for reallocation of opening balance — 94 1,751 1,845
At 30 June 2016 — — — —
(Charged)/credited - to profit or loss — — — —
At 30 June 2017 — — — —
(b) Deferred tax losses
Based on forecasts for the newly merged PMP and IPMG business the Directors are confident that the existing recognised Australian tax losses of $34.8 million on the balance sheet will be recouped over a 4-5 year period. Therefore the 2017 Australian tax loss of $50.1 million (tax effect $15 million) will not be recognised . The current year loss is significantly higher than prior years due to the transformation costs incurred as a result of the merger.
These 2017 unrecognised losses of $50.1 million, together with the transfer of around $93.4 million of IPMG tax losses to PMP on 1 March 2017 (and other adjustments), now bring the total unrecognised tax losses to $203.7 million (tax effect $61.1 million).
Despite the non-recognition of these losses on the balance sheet, the losses will remain available indefinitely for offset against future taxable profits, subject to continuing to meet the statutory tax tests of continuity of ownership or failing that, the same business test.
The New Zealand deferred tax asset value of $1.7 million, attributable to tax losses (which were partly recouped this year), are expected to be fully recouped over a period of 2 years.
For
per
sona
l use
onl
y

84
FINANCIAL STATEMENTSNotes to and forming part of the Financial Statements for the year ended 30 June 2017
PMP Group
2017 2016YEAR ENDED 30 JUNE 2017 $’000 $’000
11 PayablesCurrent payables
Creditors - unsecuredTrade creditors and accruals * 172,807 138,363
Interest payable 1,031 1,008
Total current payables 173,838 139,371 * Trade creditors are non-interest bearing, and are on normal commercial terms.
12 Interest bearing liabilities
(a) Current interest bearing liabilities - financial institutions
Secured
Bank loans - repayable in: Euros * 2,955 2,968
Equipment financing 2,819 —
Receivables financing 14,826 —
Other
Prepaid finance costs (758) (450)
Total current interest bearing liabilities - financial institutions 19,842 2,518
(b) Non-current interest bearing liabilities - financial institutions
Secured
Bank loans - repayable in: Euros * 10,344 13,353
Equipment financing 4,228 —
Unsecured
Corporate bond 40,000 40,000
Other
Prepaid finance costs (918) (1,365)
Total non-current interest bearing liabilities - financial institutions 53,654 51,988 * Represents Euro denominated loan of 9.0 million (2016: 10.9 million) measured at the exchange rate
prevailing at balance date.
For
per
sona
l use
onl
y

85
FINANCIAL STATEMENTSNotes to and forming part of the Financial Statements for the year ended 30 June 2017
Facility Drawn AvailableYEAR ENDED 30 JUNE 2017 $’000s $’000s $’000s
12 Interest bearing liabilities (continued)(c) Interest bearing liabilities - facility details
Facility details:2017
SecuredOverdraft facility 9,758 — 9,758
Export finance facility * 13,300 13,300 —
Equipment financing facility 7,047 7,047 —
Receivables financing facility 35,000 14,826 20,174
Working capital facility 30,000 — 30,000
Unsecured
Corporate Bond 40,000 40,000 —
Total facilities 135,105 75,173 59,932
2016
Secured
Overdraft facility 9,793 — 9,793
Export finance facility * 16,321 16,321 —
Unsecured
Corporate Bond 40,000 40,000 —
Total facilities 66,114 56,321 9,793
* Represents the loan measured at the exchange rate prevailing at balance date.
(d) Terms and conditionsPMP entered into a fully secured $5 million Australian Dollar and $5 million New Zealand Dollar Overdraft Facility in February 2016 replacing the previous Overdraft and a Revolving facility. A bank guarantee facility is also provided in conjunction with the overdraft facilities. These facilities are subject to annual reviews with next review due by 4 February 2018. ANZ Banking Group is the lender. Security pledged involves a first ranking fixed and floating charge over the assets of PMP, including the subsidiaries in Australia and New Zealand. The facilities are subject to a number of financial covenants, including the PMP Group being measured against a maximum Debt/EBITDA ratio and a minimum Fixed Charge Ratio. The facilities are also subject to the warranties and conditions of the agreement during the term of it including a change of control clause.
PMP entered into a Euro 17 million export financing loan agreement in February 2013, secured against an offset rotary press. As at 30 June 2017, this loan was fully drawn and after amortisation payments had a balance of Euro 9.0 million. This facility has a maturity date of 30 September 2021 with semi-annual amortisations. The lender is Commerzbank AG.
As a result of the IPMG acquisition, PMP took on a fully secured amortising $8.5 million equipment financing facility. As at 30 June 2017, this loan was fully drawn at $7.0 million. This facility has a maturity date of 23 November 2019 with semi-annual amortisations. The lender is ANZ Banking Group Ltd. The facility is also subject to the warranties and conditions of the agreement during the term of it.
PMP issued an unsecured $40 million corporate bond on 17 September 2015 replacing the previous $50 million corporate bond which has been repaid. This new bond has a fixed coupon of 6.43% per annum and a four year term. It is subject to a number of financial covenants, including the PMP Group being measured against a maximum Secured Debt/EBITDA ratio, a maximum Net Debt/EBITDA ratio and a minimum EBITDA/Interest ratio. Capital Management restrictions also apply which limits payouts to 100% of NPAT pre-significant items.
PMP entered into a fully secured $30 million Australia Dollar Working Capital Facility in March 2017. As at 30 June 2017, this loan was undrawn. This facility has a maturity date of 28 February 2018. ANZ Banking Group is the lender. Security pledged involves a first ranking fixed and floating charge over the assets of PMP, including the subsidiaries in Australia and New Zealand. The facilities are subject to a number of financial covenants, including the PMP Group being measured against a maximum Debt/EBITDA ratio and a minimum Fixed Charge Ratio. The facility is also subject to the warranties and conditions of the agreement during the term of it including a change of control clause.
PMP entered into a $35 million Australia Dollar Receivables Financing Facility in March 2017. As at 30 June 2017, this loan was drawn to $14.8 million. This facility has a maturity date of 28 February 2018. ANZ Banking Group is the lender. Security pledged involves a charge over certain receivables of PMP Print Pty Ltd, PMP Digital Pty Ltd and PMP Limited. The facility is also subject to the warranties and conditions of the agreement during the term of the facility.
For
per
sona
l use
onl
y

86
FINANCIAL STATEMENTSNotes to and forming part of the Financial Statements for the year ended 30 June 2017
YEAR ENDED 30 JUNE 2017
12 Interest bearing liabilities (continued)(e) Net debt
PMP has taken out a cross currency swap to exchange the Euro 9.0 million (2016: Euro 10.9 million) export financing loan’s principal and floating Euro interest payments for an equally valued AUD loan and AUD interest payments.
This Euro loan has formed part of the overall PMP Group debt that is hedged to fixed rates. For the purposes of calculating PMP’s net debt, the hedged fixed rate Australian obligation of the Euro loan is a net $11.0 million as the Euro bank loan ($13.3 million) is offset by the Cross Currency Swap revaluation ($2.3 million). (2016: $13.4 million which was $16.3 million Euro loan less $2.9 million Cross Currency Swap revaluation).
PMP Group
2017 2016YEAR ENDED 30 JUNE 2017 NOTES $’000 $’000
Cash (54,340) (54,103)
Corporate Bond repayable in Australian dollars 40,000 40,000
Bank loans repayable in Euros - measured at the exchange rate prevailing at balance date
13,300 16,321
Cross currency swap revaluation adjusted to measure the Euro denominated loan at the hedged fixed rate of the Australian obligation
(2,314) (2,894)
Equipment Financing 7,047 — Receivables Financing 14,826 —
Net debt/(cash) 18,519 (676)
13 Provisions
(a) Current provisions
Employee entitlements 29,900 17,272 Other 13(b) 17,687 737
Total current provisions 47,587 18,009
Non-current provisions Employee entitlements 2,217 1,549 Other 13(b) 17,204 2,970
Total non-current provisions 19,421 4,519 Total provisions 67,008 22,528
For
per
sona
l use
onl
y

87
FINANCIAL STATEMENTSNotes to and forming part of the Financial Statements for the year ended 30 June 2017
PMP Group
2017 2016YEAR ENDED 30 JUNE 2017 NOTES $’000 $’000
14 Financial assets and financial liabilitiesCurrent financial assets
Forward currency contracts 27(d)(iv) 524 49 Cross currency swaps 27(b)(ii) 262 199
Total current financial assets 786 248
Non-current financial assetsForward currency contracts — — Cross currency swaps 27(b)(ii) 1,802 2,381
Total non-current financial assets 1,802 2,381 Total financial assets 2,588 2,629
Current financial liabilitiesForward currency contracts 27(d)(iv) 620 1,093 Cross currency swaps 27(b)(ii) — —
Total current financial liabilities 620 1,093
Non-current financial liabilitiesForward currency contracts 27(d)(iv) — 12
Total non-current financial liabilities — 12 Total financial liabilities 620 1,105 All derivatives designated as effective hedging instruments are carried at fair value apart from interest rate swaps which are carried at fair value through profit or loss.
YEAR ENDED 30 JUNE 2017
13 Provisions (continued)(b) Movements in provisions
Movements in each class of provision during the financial year, other than employee benefits, are set out below:
Restructure Make good
Onerous leases & contracts
Lease Incentive Other Total
$000 $000 $000 $000 $000 $000
CurrentCarrying amount at start of year — 46 16 566 109 737 Charged/(credited) to profit or loss
- additional provisions recognised 3,962 1,005 6,626 926 1,474 13,993 - IPMG acquisition — 3,076 — 46 899 4,021 - unused amounts reversed — (37) — (49) (173) (259)
Amounts used during the period — (11) (14) (307) (471) (803)Net foreign currency translation difference — — — (2) — (2)
Carrying amount at end of year 3,962 4,079 6,628 1,180 1,838 17,687
Non-CurrentCarrying amount at start of year 1,367 — 1,603 — 2,970 Charged/(credited) to profit or loss
- additional provisions recognised 335 11,173 (274) — 11,234 - IPMG acquisition 3,131 — 112 — 3,243 - unused amounts reversed — — (9) — (9)
Amounts used during the period (6) — — — (6)Net foreign currency translation difference — — (228) — (228)
Carrying amount at end of year 4,827 11,173 1,204 — 17,204
For
per
sona
l use
onl
y

88
FINANCIAL STATEMENTSNotes to and forming part of the Financial Statements for the year ended 30 June 2017
Number PMP Group
2017 2016 2017 2016YEAR ENDED 30 JUNE 2017 ’000 ’000 NOTES $’000 $’000
15 Contributed equityIssued and paid up capital
Movements in ordinary share capital:Balance as at 1 July - ordinary shares 318,172 323,781 353,227 356,035 Share movements in respect of:
- Share-based payments 1,886 2,487 832 1,333 - Acquisition 187,970 — 128,760 — - Share buy-back — (8,096) — (4,141)
Balance at 30 June - ordinary shares 508,028 318,172 482,819 353,227
On 1 March 2017, PMP issued 179,856,110 fully paid ordinary shares in relation to acquisition of IPMG Holdco Pty Ltd (177,970,295) and pursuant to Long Term Incentive Plan following the vesting of performance rights to the eligible executives of PMP (1,885,815). A further 10,000,000 fully paid ordinary shares were issued on 5 May 2017 as part of the settlement of IPMG acquisition.
On 17 September 2015, PMP announced its intention to undertake an on-market buy-back from 23 November 2015 to 30 June 2016. The maximum number of shares that could be bought back would equate to $8.1 million. During this period 8,095,974 shares were bought back which equated to $4.1 million. All shares bought back were cancelled.
Ordinary shares have no par value. Fully paid ordinary shares carry one vote per share and carry the right to dividends.
16 DividendsFinal dividend
Final dividend for the year ended 30 June 2016 of 2.4 cents, unfranked paid on 7 October 2016 (2016: 1.8 cents, 50% franked paid on 6 October 2015)
7,636 5,873
Interim dividend
Interim dividend for the year ended 30 June 2017 was nil (2016: 1.2 cents, unfranked) — 3,842
Total dividends declared 7,636 9,715
17 Reserves Foreign currency translation reserve
Opening balance 11,491 6,618 Movement in reserve relating to:
- Exchange fluctuation on translation of overseas controlled entities (341) 4,873 Total foreign currency translation reserve 11,150 11,491
Share-based payment reserveOpening balance 1,523 1,737 Movement in reserve relating to:
- Share-based payment expense 2(c) 158 468 - Issue of shares on exercise (832) (1,333)- Cash paid on exercise — (1,333)- Transfer to accumulated losses — 2,104 - Purchase of shares — (120)Total share-based payment reserve 849 1,523
Cash flow hedge reserveOpening balance (951) 241 Movement in reserve relating to:
- Cash flow hedge 1,382 (1,682)- Tax effect of cash flow hedge net (gain)/loss (408) 490 Total cash flow hedge reserve 23 (951)
Total reserves 12,022 12,063
For
per
sona
l use
onl
y

89
FINANCIAL STATEMENTSNotes to and forming part of the Financial Statements for the year ended 30 June 2017
PMP Group
2017 2016YEAR ENDED 30 JUNE 2017 $’000 $’000
18 CommitmentsThe following commitments are not reflected in the balance sheet and are payable as follows:
(a) Capital expenditure (i)(v):- not later than one year 991 64
- later than one year but not later than five years — —
Total capital expenditure 991 64
(b) Operating lease rentals - Group as lessee (ii)(v):
- not later than one year 34,936 21,013
- later than one year but not later than five years 128,405 77,521
- later than five years 50,959 39,995
Total operating lease rentals 214,300 138,529
(c) Operating lease rentals - Group as lessor (iii)(v):
- not later than one year (651) (312)
- later than one year but not later than five years (872) —
Total operating lease rentals (1,523) (312)
Total net commitments for expenditure 213,768 138,281
(i) At 30 June 2017 the Group capital expenditure commitments relate to the acquisition of new plant and equipment.
(ii) Operating leases are entered into in the normal course for land and buildings, motor vehicles, computer equipment and plant and machinery. Rental payments are generally fixed, however some agreements contain inflation escalation clauses. No operating leases contain restrictions on financing or other leasing activities.
(iii) Operating leases are entered into to sub-lease surplus office space. Rentals include fixed and inflation escalation clauses.
(iv) The company has a number of bank guarantees in place that support various property leases in the name of either PMP Limited or its subsidiaries. As at 30 June 2017 the value of bank guarantees was $18.6 million (2016: $17.2 million). The company has not issued any guarantees for properties where it is not the lessee.
(v) At 30 June 2017, net commitments include $82,877,000 for IPMG companies acquired during the year. This is made up of:
$’000
- Capital Expenditure 991 - Operating lease rentals as lessee 83,314 - Operating lease rentals as lessor (1,428)
82,877
For
per
sona
l use
onl
y

90
FINANCIAL STATEMENTSNotes to and forming part of the Financial Statements for the year ended 30 June 2017
Interest held
Country of 2017 2016YEAR ENDED 30 JUNE 2017 Incorporation NOTES % %
19 Controlled entities (d)
Pacific Publications Holdings Pty Limited Australia (a) 100 100 Attic Futura Pty Limited Australia (a) 100 100 Pacific O’Brien Publications Pty Limited Australia (a) 100 100 Total Sampling Pty Limited Australia (a) 100 100 PMP Publishing Pty Limited Australia (a) 100 100
PMP Print Pty Limited Australia (a) 100 100 PMP Property Pty Limited Australia (a) 100 100 PT Pac-Rim Kwartanusa Printing Indonesia 95 95 PMP Advertising Solutions Pty Limited Australia (a) 100 100 PMP Home Media Pty Limited Australia (a) 100 100 Shomega Pty Limited Australia (a) 100 100
Show-Ads Pty Limited Australia (a) 100 100 Linq Plus Pty Limited Australia (a) 100 100 PMP Wholesale Pty Limited Australia (a) 100 100 PMP Digital Pty Limited Australia (a) 100 100 Pacific Intermedia Pty Limited Australia (a) 100 100
The Argus & Australasian Pty Limited Australia (a) 100 100 Gordon and Gotch Australia Pty Limited Australia (a) 100 100
A.C.N. 128 266 268 Pty Limited (formerly Brumby Books & Music Pty Limited) Australia (b) 100 100 Scribo Holdings Pty Limited Australia (b) 100 100
The Scribo Group Pty Limited Australia (b) 100 100 Tower Books Pty Limited Australia (b) 100 100 Gary Allen Pty Limited Australia (b) 100 100
ilovemagazines.com.au Pty Limited (formerly Treeet.com.au Pty Limited) Australia (a) 100 100 PMP Directories Pty Limited Australia (a) 100 100
Argyle Print Pty Limited Australia (b) 100 100 Red PPR Holdings Pty Limited Australia (a) 100 100 PMP Finance Pty Limited Australia (a) 100 100 PMP Share Plans Pty Limited Australia 100 100 Manningtree Investments Pty Limited Australia (a) 100 100
Canberra Press Pty Limited Australia (a) 100 100 PMP (NZ) Limited New Zealand 100 100
PMP Print Limited New Zealand 100 100 PMP Maxum Limited New Zealand 100 100 PMP Distribution Limited New Zealand 100 100 Gordon and Gotch (NZ) Limited New Zealand 100 100
PMP Digital Limited New Zealand 100 100
Footnotes refer to all of Note 19.
(a) These companies entered into a deed of cross guarantee dated 27 June 2008 with PMP Limited which replaced the previous deed dated 10 June 1992. The deed provides that all parties to the deed will guarantee to each creditor payment in full of any debt of each company participating in the deed on winding up of that company. As a result of a Class Order issued by the Australian Securities and Investments Commission, these companies are relieved from the requirement to prepare financial statements.
(b) On 11 June 2009 these companies were joined as parties to the Deed of Cross Guarantee referred above.
(c) These companies were acquired by PMP on 1 March 2017 and were joined on 6 June 2017 as parties to the Deed of Cross Guarantee referred above.
(d) Notes on the closed group: - PMP Limited is the ultimate parent company of the PMP Group. - All companies have ordinary share capital.
For
per
sona
l use
onl
y

91
FINANCIAL STATEMENTSNotes to and forming part of the Financial Statements for the year ended 30 June 2017
Interest held
Country of 2017 2016YEAR ENDED 30 JUNE 2017 Incorporation NOTES % %
19 Controlled entities (continued)
The following companies merged with PMP Group on 1 March 2017. Note 24 provide details of businesses acquired during the year.
IPMG Holdco Pty Limited Australia (c) 100 —IPMG Subco Pty Limited Australia (c) 100 —
Propsea Pty Limited Australia (c) 100 —MJV Pty Limited Australia (c) 100 —
Tigerstone Pty Limited Australia (c) 100 —KTAR Pty Limited Australia (c) 100 —
PMP Subco No.6 Pty Limited (formerly Glencree Pty Limited) Australia (c) 100 —D. Livingstone Pty Limited Australia (c) 100 —PMP Subco No.2 Pty Limited (formerly Josproud Pty Limited) Australia (c) 100 —PMP Subco No.3 Pty Limited (formerly Lafim Pty Limited) Australia (c) 100 —PMP Subco No.4 Pty Limited (formerly Peter Parker Pty Limited) Australia (c) 100 —
IPMG Pty Limited Australia (c) 100 —Hannan Finance Corporation Pty Limited Australia (c) 100 —IPMG Administration Pty Limited Australia (c) 100 —
NDD Distribution Pty Limited Australia (c) 100 —Southern Independent Publishers Pty Limited Australia (c) 100 —The Federal Publishing Co Pty Limited Australia (c) 100 —PMP Subco No 1 (F. Hannan Pty Limited) Australia (c) 100 —
IPMG Management (No.2) Pty Limited Australia (c) 100 —IPMG Digital Pty Limited Australia (c) 100 —
Forty Two International Pty Limited Australia (c) 100 —Holler Australia Pty Limited Australia (c) 100 —
Holler Administration Pty Limited Australia (c) 100 —IPMG Consulting Pty Limited Australia (c) 100 —MassMedia Studios Pty Ltd (formerly JSA Digital PL) Australia (c) 100 —Max Australia Pty Limited Australia (c) 100 —Sinnott Bros Pty Limited Australia (c) 100 —Spectrum Communications Pty Limited Australia (c) 100 —
IPMG Singapore Pte Limited Singapore 100 —Spin Comm Syd Pty Australia (c) 100 —The Gang of 4 Pty Limited Australia (c) 100 —Traction Digital Pty Limited (formerly MassMedia Studios PL) Australia (c) 100 —
Traction Digital Limited United Kingdom 100 —Traction Digital Private Limited India 100 —
The Independent Print Media Group Pty Limited Australia (c) 100 —PMP Subco No.5 Pty Limited (formerly Arklow Pty Limited) Australia (c) 100 —
Offset Alpine Printing Group Pty Limited Australia (c) 100 —Kierle Investments Pty Limited Australia (c) 100 —Offset Alpine Printing Pty Limited Australia (c) 100 —
Craft Printing Pty Limited Australia (c) 100 —Hannanprint NSW Pty Limited Australia (c) 100 —Hannanprint Victoria Pty Limited Australia (c) 100 —SYNC Communications Management Pty Limited Australia (c) 100 —Warwick Farm Business Park Pty Limited Australia (c) 100 —Woodox Pty Limited Australia (c) 100 —
Inprint Pty Limited Australia (c) 100 —Bolton Print Pty Limited Australia (c) 100 —Inpack Pty Limited Australia (c) 100 —PEP Central Pty Limited Australia (c) 100 —
For
per
sona
l use
onl
y

92
FINANCIAL STATEMENTSNotes to and forming part of the Financial Statements for the year ended 30 June 2017
2017 2016YEAR ENDED 30 JUNE 2017 $’000 $’000
19 Controlled entities (continued)The aggregate assets, liabilities and net result after income tax of the companies which are parties to the Deed of Cross Guarantees are as follows:
Statements of profit or loss and other comprehensive income of the closed groupSales revenue 857,118 680,071
Other revenue 16,632 16,986
Revenue 873,750 697,057
Raw materials and consumables used (148,741) (107,043)
Cost of finished goods sold (415,425) (302,147)
Employee expenses (237,512) (179,033)
Outside production services (11,416) (11,553)
Freight (36,101) (22,133)
Repairs and maintenance (14,815) (8,737)
Occupancy costs (38,725) (14,903)
Other expenses (60,880) (16,963)
(Loss)/profit before depreciation, amortisation, finance costs and income tax (89,865) 34,545
Depreciation and amortisation (50,578) (21,487)
(Loss)/profit before finance costs and income tax (140,443) 13,058
Finance costs (5,042) (7,983)
(Loss)/profit before income tax (145,485) 5,075
Income tax benefit/(expense) 18,860 (546)
Net (loss)/gain attributable to members of the closed group (126,625) 4,529
For
per
sona
l use
onl
y

93
FINANCIAL STATEMENTSNotes to and forming part of the Financial Statements for the year ended 30 June 2017
2017 2016YEAR ENDED 30 JUNE 2017 $’000 $’000
19 Controlled entities (continued)
Statement of financial position of the closed group
Current assetsCash and cash equivalents 46,388 47,346
Receivables 100,376 80,217
Inventories 91,521 72,155
Financial assets 750 248
Other 6,040 1,928
Total current assets 245,075 201,894
Non-current assets
Property, plant and equipment 149,362 125,085
Deferred tax assets 63,513 44,713
Goodwill and intangible assets 36,015 5,980
Financial assets 1,802 2,381
Other 41,064 69,096
Total non-current assets 291,756 247,255
Total assets 536,831 449,149
Current liabilities
Payables 145,495 116,719
Interest bearing liabilities - financial institutions 19,842 2,518
Income tax payable — 3
Financial liabilities 464 651
Provisions 45,492 15,298
Total current liabilities 211,293 135,189
Non-current liabilities
Interest bearing liabilities - financial institutions 53,654 51,988
Financial liabilities — 12
Provisions 16,854 2,541
Total non-current liabilities 70,508 54,541
Total liabilities 281,801 189,730
Net assets 255,030 259,419
Equity
Contributed equity 482,819 353,227
Reserves 941 856
Accumulated losses (228,730) (94,664)
Total equity 255,030 259,419 For
per
sona
l use
onl
y

94
FINANCIAL STATEMENTSNotes to and forming part of the Financial Statements for the year ended 30 June 2017
YEA
R EN
DED
30
JUN
E 20
17
20Se
gmen
tal in
form
atio
n
Desc
riptio
n of
segm
ents
Man
agem
ent h
as d
eter
min
ed th
e op
erat
ing
segm
ents
base
d on
the
man
ner i
n wh
ich th
e Gr
oup
is str
uctu
red
and
man
aged
by t
he E
xecu
tive
Man
agem
ent T
eam
(EM
T). A
ll rep
orts
regu
larly
revie
wed
by th
e Ch
ief E
xecu
tive
Office
r and
the
EMT a
re p
rese
nted
on
this
basis
whi
ch g
roup
sim
ilar o
pera
tions
or g
eogr
aphi
c loc
atio
ns.
Prin
t Gro
up A
ustra
lia in
clude
s the
PM
P an
d IP
MG
heat
set p
rintin
g bu
sines
ses.
Distr
ibut
ion
and
Mar
ketin
g Se
rvice
s inc
lude
s Dist
ribut
ion
Austr
alia,
Griffi
n Pr
ess,
PMP
Digi
tal a
nd th
e IP
MG
digi
tal b
usin
esse
s. Go
rdon
and
Gotc
h Au
strali
a inc
lude
s mag
azin
es d
istrib
utio
n bu
sines
ses i
n Au
strali
a. N
ew Z
ealan
d in
clude
s all b
usin
esse
s in
Austr
alia.
The
resu
lts fo
r the
per
iod
from
1 M
arch
201
7 to
30 Ju
ne 2
017 f
or IP
MG
Grou
p th
at w
as ac
quire
d on
1 M
arch
201
7 are
inclu
ded
in e
ach
of th
e se
gmen
ts of
mer
ged
PMP
Grou
p in
the
tabl
e be
low.
Tran
sact
ions
bet
ween
segm
ents
are
carri
ed o
ut at
arm
’s le
ngth
and
are
elim
inat
ed o
n co
nsol
idat
ion.
Segm
ent r
even
ue a
nd re
sults
The
follo
wing
is an
analy
sis o
f the
Gro
up’s
reve
nue
and
resu
lts b
y rep
orta
ble
segm
ent f
or th
e pe
riods
pre
sent
ed:
Prin
t Gro
up
Aust
ralia
D
istri
butio
n &
Mar
ketin
g Se
rvic
esG
ordo
n an
d G
otch
Au
stra
liaN
ew Z
eala
ndC
orpo
rate
Con
solid
ated
(a)
Oper
atin
g Se
gmen
ts20
1720
1620
1720
1620
1720
1620
1720
1620
1720
1620
1720
16$’
000
$’00
0$’
000
$’00
0$’
000
$’00
0$’
000
$’00
0$’
000
$’00
0$’
000
$’00
0Re
venu
eSa
les r
even
ue26
3,01
9 20
0,06
9 12
4,53
2 13
4,92
0 47
0,45
4 34
5,76
3 19
3,47
8 13
5,57
7 —
—
1,
051,
483
816,
329
Sale
s rev
enue
sign
ifican
t ite
m —
(3
50)
—
—
—
—
—
—
—
—
—
(350
)
Othe
r rev
enue
9 —
2
—
4,57
3 2,
547
1,00
2 99
3 55
3 59
7 6,
139
4,13
7
Othe
r rev
enue
sign
ifican
t ite
ms
—
—
—
—
—
—
—
—
—
—
—
—
Tota
l rev
enue
263,
028
199,
719
124,
534
134,
920
475,
027
348,
310
194,
480
136,
570
553
597
1,05
7,62
282
0,11
6
EBITD
A* b
efor
e sig
nific
ant i
tem
s16
,721
26
,441
3,
888
10,6
17
2,65
5 2,
861
12,4
20
14,9
95
(3,4
52)
(3,7
25)
32,2
32
51,1
89
Depr
eciat
ion
and
amor
tisat
ion
(18,
916)
(17,
699)
(2,7
68)
(2,9
03)
(681
)(5
12)
(5,8
33)
(6,4
26)
(351
)(3
74)
(28,
549)
(27,
914)
EBIT~
bef
ore
signi
fican
t ite
ms
(2,1
95)
8,74
2 1,
120
7,71
4 1,
974
2,34
9 6,
587
8,56
9 (3
,803
)(4
,099
)3,
683
23,2
75
Sign
ifican
t ite
ms b
efor
e in
com
e ta
x(9
1,69
3)(7
,985
)(1
6,73
8)(1
,654
)(3
8)(8
13)
(21,
614)
(1,4
64)
(12,
532)
(340
)(1
42,6
15)
(12,
256)
Segm
ent E
BIT
afte
r sig
nific
ant i
tem
s(9
3,88
8)75
7 (1
5,61
8)6,
060
1,93
6 1,
536
(15,
027)
7,10
5 (1
6,33
5)(4
,439
)(1
38,9
32)
11,0
19
Sign
ifican
t ite
ms -
Fina
nce
costs
—
(2,3
33)
Finan
ce co
sts(5
,087
)(5
,933
)
Cons
olid
ated
ent
ity p
rofit
bef
ore
inco
me
tax
(144
,019
)2,
753
Inco
me
tax b
enefi
t/(ex
pens
e)17
,592
(2
,568
)
Net (
loss
)/pro
fit a
fter i
ncom
e ta
x(1
26,4
27)
185
* EBI
TDA
- Pro
fit/(l
oss)
bef
ore
depr
ecia
tion,
am
ortis
atio
n, fi
nanc
e co
sts
and
inco
me
tax.
~ EB
IT -
Profi
t/(lo
ss) b
efor
e fin
ance
cos
ts a
nd in
com
e ta
x.
For
per
sona
l use
onl
y

95
FINANCIAL STATEMENTSNotes to and forming part of the Financial Statements for the year ended 30 June 2017
YEA
R EN
DED
30
JUN
E 20
17
20Se
gmen
tal in
form
atio
n (c
ontin
ued)
Prin
t Gro
up
Aust
ralia
D
istri
butio
n &
Mar
ketin
g Se
rvic
esG
ordo
n an
d G
otch
Au
stra
liaN
ew Z
eala
ndC
orpo
rate
Con
solid
ated
(b)
Sign
ifica
nt it
ems b
y ope
ratin
g se
gmen
ts20
1720
1620
1720
1620
1720
1620
1720
1620
1720
1620
1720
16$’
000
$’00
0$’
000
$’00
0$’
000
$’00
0$’
000
$’00
0$’
000
$’00
0$’
000
$’00
0
Sign
ifica
nt it
ems o
f rev
enue
Sale
s rev
enue
—
(350
) —
—
—
—
—
—
—
—
(3
50)
Tota
l seg
men
t sig
nific
ant i
tem
s of r
even
ue —
(3
50)
—
—
—
—
—
—
—
—
—
(350
)
Sign
ifica
nt it
ems o
f exp
ense
Gain
on
disp
osal
of p
lant a
nd e
quip
men
t, an
d
non-
curre
nt as
sets
class
ified
as h
eld
for s
ale(1
56)
(224
)(7
) —
—
—
(1
46)
—
(28)
—
(337
)(2
24)
Restr
uctu
re in
itiat
ives a
nd o
ther
one
off
costs
(43,
341)
(4,1
60)
(5,2
05)
(1,6
54)
(38)
(813
)(3
48)
(1,0
51)
(4,6
31)
(340
)(5
3,56
3)(8
,018
)
Oner
ous l
ease
s(1
9,37
6) —
(3
4) —
—
—
(4
21)
—
(197
) —
(2
0,02
8) —
Acqu
isitio
n co
sts IP
MG
(339
) —
—
—
—
—
—
—
(7,6
76)
—
(8,0
15)
—
Impa
irmen
t of i
ntan
gibl
e as
sets
—
—
(5,2
06)
—
—
—
(19,
384)
—
—
—
(24,
590)
—
(Impa
irmen
t)/re
vers
al of
plan
t and
equ
ipm
ent
due
to re
struc
ture
initi
ative
s(2
8,48
1) —
(6
,286
) —
—
—
(1
,315
)23
0 —
—
(3
6,08
2)23
0
Impa
irmen
t of D
ick S
mith
trad
e re
ceiva
ble
—
(3,2
51)
— —
—
—
—
(6
43)
—
—
—
(3,8
94)
Tota
l seg
men
t sig
nific
ant i
tem
s of e
xpen
se(9
1,69
3)(7
,635
)(1
6,73
8)(1
,654
)(3
8)(8
13)
(21,
614)
(1,4
64)
(12,
532)
(340
)(1
42,6
15)
(11,
906)
Tota
l seg
men
t sig
nific
ant i
tem
s bef
ore
inco
me
tax
(91,
693)
(7,9
85)
(16,
738)
(1,6
54)
(38)
(813
)(2
1,61
4)(1
,464
)(1
2,53
2)(3
40)
(142
,615
)(1
2,25
6)
Sign
ifica
nt it
ems -
fina
nce
cost
s
Finan
ce co
sts —
—
—
—
—
—
—
—
—
(2,3
33)
—
(2,3
33)
Tota
l sig
nific
ant i
tem
s - fi
nanc
e co
sts
—
—
—
—
—
—
—
—
—
(2,3
33)
—
(2,3
33)
YEA
R EN
DED
30
JUN
E 20
17
20Se
gmen
tal in
form
atio
n
Desc
riptio
n of
segm
ents
Man
agem
ent h
as d
eter
min
ed th
e op
erat
ing
segm
ents
base
d on
the
man
ner i
n wh
ich th
e Gr
oup
is str
uctu
red
and
man
aged
by t
he E
xecu
tive
Man
agem
ent T
eam
(EM
T). A
ll rep
orts
regu
larly
revie
wed
by th
e Ch
ief E
xecu
tive
Office
r and
the
EMT a
re p
rese
nted
on
this
basis
whi
ch g
roup
sim
ilar o
pera
tions
or g
eogr
aphi
c loc
atio
ns.
Prin
t Gro
up A
ustra
lia in
clude
s the
PM
P an
d IP
MG
heat
set p
rintin
g bu
sines
ses.
Distr
ibut
ion
and
Mar
ketin
g Se
rvice
s inc
lude
s Dist
ribut
ion
Austr
alia,
Griffi
n Pr
ess,
PMP
Digi
tal a
nd th
e IP
MG
digi
tal b
usin
esse
s. Go
rdon
and
Gotc
h Au
strali
a inc
lude
s mag
azin
es d
istrib
utio
n bu
sines
ses i
n Au
strali
a. N
ew Z
ealan
d in
clude
s all b
usin
esse
s in
Austr
alia.
The
resu
lts fo
r the
per
iod
from
1 M
arch
201
7 to
30 Ju
ne 2
017 f
or IP
MG
Grou
p th
at w
as ac
quire
d on
1 M
arch
201
7 are
inclu
ded
in e
ach
of th
e se
gmen
ts of
mer
ged
PMP
Grou
p in
the
tabl
e be
low.
Tran
sact
ions
bet
ween
segm
ents
are
carri
ed o
ut at
arm
’s le
ngth
and
are
elim
inat
ed o
n co
nsol
idat
ion.
Segm
ent r
even
ue a
nd re
sults
The
follo
wing
is an
analy
sis o
f the
Gro
up’s
reve
nue
and
resu
lts b
y rep
orta
ble
segm
ent f
or th
e pe
riods
pre
sent
ed:
Prin
t Gro
up
Aust
ralia
D
istri
butio
n &
Mar
ketin
g Se
rvic
esG
ordo
n an
d G
otch
Au
stra
liaN
ew Z
eala
ndC
orpo
rate
Con
solid
ated
(a)
Oper
atin
g Se
gmen
ts20
1720
1620
1720
1620
1720
1620
1720
1620
1720
1620
1720
16$’
000
$’00
0$’
000
$’00
0$’
000
$’00
0$’
000
$’00
0$’
000
$’00
0$’
000
$’00
0Re
venu
eSa
les r
even
ue26
3,01
9 20
0,06
9 12
4,53
2 13
4,92
0 47
0,45
4 34
5,76
3 19
3,47
8 13
5,57
7 —
—
1,
051,
483
816,
329
Sale
s rev
enue
sign
ifican
t ite
m —
(3
50)
—
—
—
—
—
—
—
—
—
(350
)
Othe
r rev
enue
9 —
2
—
4,57
3 2,
547
1,00
2 99
3 55
3 59
7 6,
139
4,13
7
Othe
r rev
enue
sign
ifican
t ite
ms
—
—
—
—
—
—
—
—
—
—
—
—
Tota
l rev
enue
263,
028
199,
719
124,
534
134,
920
475,
027
348,
310
194,
480
136,
570
553
597
1,05
7,62
282
0,11
6
EBITD
A* b
efor
e sig
nific
ant i
tem
s16
,721
26
,441
3,
888
10,6
17
2,65
5 2,
861
12,4
20
14,9
95
(3,4
52)
(3,7
25)
32,2
32
51,1
89
Depr
eciat
ion
and
amor
tisat
ion
(18,
916)
(17,
699)
(2,7
68)
(2,9
03)
(681
)(5
12)
(5,8
33)
(6,4
26)
(351
)(3
74)
(28,
549)
(27,
914)
EBIT~
bef
ore
signi
fican
t ite
ms
(2,1
95)
8,74
2 1,
120
7,71
4 1,
974
2,34
9 6,
587
8,56
9 (3
,803
)(4
,099
)3,
683
23,2
75
Sign
ifican
t ite
ms b
efor
e in
com
e ta
x(9
1,69
3)(7
,985
)(1
6,73
8)(1
,654
)(3
8)(8
13)
(21,
614)
(1,4
64)
(12,
532)
(340
)(1
42,6
15)
(12,
256)
Segm
ent E
BIT
afte
r sig
nific
ant i
tem
s(9
3,88
8)75
7 (1
5,61
8)6,
060
1,93
6 1,
536
(15,
027)
7,10
5 (1
6,33
5)(4
,439
)(1
38,9
32)
11,0
19
Sign
ifican
t ite
ms -
Fina
nce
costs
—
(2,3
33)
Finan
ce co
sts(5
,087
)(5
,933
)
Cons
olid
ated
ent
ity p
rofit
bef
ore
inco
me
tax
(144
,019
)2,
753
Inco
me
tax b
enefi
t/(ex
pens
e)17
,592
(2
,568
)
Net (
loss
)/pro
fit a
fter i
ncom
e ta
x(1
26,4
27)
185
* EBI
TDA
- Pro
fit/(l
oss)
bef
ore
depr
ecia
tion,
am
ortis
atio
n, fi
nanc
e co
sts
and
inco
me
tax.
~ EB
IT -
Profi
t/(lo
ss) b
efor
e fin
ance
cos
ts a
nd in
com
e ta
x.
For
per
sona
l use
onl
y

96
FINANCIAL STATEMENTSNotes to and forming part of the Financial Statements for the year ended 30 June 2017
YEA
R EN
DED
30
JUN
E 20
17
20Se
gmen
tal in
form
atio
n (c
ontin
ued)
Aust
ralia
New
Zea
land
Con
solid
ated
(c)
Othe
r seg
men
t inf
orm
atio
n20
1720
1620
1720
1620
1720
16$’
000
$’00
0$’
000
$’00
0$’
000
$’00
0
i) Ge
ogra
phic
Segm
ents
Sale
s rev
enue
858,
005
680,
752
193,
478
135,
577
1,05
1,48
3 81
6,32
9
Sale
s rev
enue
sign
ifican
t ite
m —
(3
50)
—
—
—
(350
)
Othe
r rev
enue
5,13
7 3,
144
1,00
2 99
3 6,
139
4,13
7
Othe
r rev
enue
sign
ifican
t ite
ms
—
—
—
—
—
—
Tota
l rev
enue
863,
142
683,
546
194,
480
136,
570
1,05
7,62
2 82
0,11
6
Non-
curre
nt a
sset
s (ex
cludi
ng d
efer
red
tax a
sset
s and
defi
ned
bene
fit p
lan as
set)
187,
755
134,
866
27,7
59
52,3
58
215,
514
187,
224
ii)
Maj
or p
rodu
ct a
nd se
rvice
offe
rings
The
Grou
p’s e
xter
nal r
even
ue fr
om e
ach
grou
p of
sim
ilar p
rodu
cts a
nd se
rvice
s wer
e as
follo
ws:
Prin
tD
istri
butio
nG
ordo
n an
d G
otch
PMP
Dig
ital
Con
solid
ated
2017
2016
2017
2016
2017
2016
2017
2016
2017
2016
$’00
0$’
000
$’00
0$’
000
$’00
0$’
000
$’00
0$’
000
$’00
0$’
000
Reve
nue
Sale
s rev
enue
385,
936
333,
050
91,4
98
103,
501
557,
250
372,
186
16,7
99
7,59
2 1,
051,
483
816,
329
Sale
s rev
enue
sign
ifican
t ite
m—
(350
) —
—
—
—
—
—
—
(3
50)
Tota
l sal
es re
venu
e38
5,93
6 33
2,70
0 91
,498
10
3,50
1 55
7,25
0 37
2,18
6 16
,799
7,
592
1,05
1,48
3 81
5,97
9
iii)
Maj
or cu
stom
ers
Inclu
ded
in th
e Pr
int G
roup
Aus
tralia
, Gor
don
& Go
tch
Austr
alia a
nd N
ew Z
ealan
d se
gmen
ts ar
e sa
les r
even
ue o
f app
roxim
atel
y $12
1.8 m
illion
(12%
of G
roup
sale
s) wh
ich ar
ose
from
sale
s to
the
Grou
p’s
large
st cu
stom
er (2
016:
The
sale
s rev
enue
from
the
majo
r cus
tom
er w
as $
101.3
m, 1
1% o
f the
Gro
up’s
tota
l rev
enue
).
For
per
sona
l use
onl
y

97
FINANCIAL STATEMENTSNotes to and forming part of the Financial Statements for the year ended 30 June 2017
YEAR ENDED 30 JUNE 2017
21 Pension plans
The PMP Group contributes to a defined benefit fund and accumulation plans as a consequence of legislation or Trust Deeds. Legal enforceability is dependent upon the terms of the legislation and the Trust Deeds.
Accumulation and defined benefit member accounts are held within the PEP Superannuation Plan which is a sub-plan of the AMP SuperSignature Plan.
PMP manages superannuation commitments through a Superannuation Policy Committee in conjunction with the trustees of the AMP Superannuation Savings Trust, within which is the AMP SuperSignature Plan. This master trust provides defined benefits based on years of membership and final average salary and accumulation benefits. Employees contribute to the plan at various percentages of their wages and salaries.
Employer contributions to superannuation plans in the year ended 30 June 2017 totalled $9,841,245 (2016: $7,940,003) includes $2,669,482 in relation to IPMG Group staff for the period from 1 March 2017 to 30 June 2017.
Accumulation funds
Contribution obligations in respect of each accumulation fund for the year to 30 June 2017 was 9.5% (2016: 9.5%) of members’ wages or as defined by the Trust Deed.
Defined benefit funds
i. Nature of the benefits provided
Defined benefit members receive lump sum benefits on retirement, death, disablement and withdrawal. The defined benefit section of the plan is closed to new members. All new members receive accumulation only benefits.
ii. Regulatory framework
The Superannuation Industry (Supervision) (SIS) legislation governs the superannuation industry and provides the framework within which superannuation plans operate. The SIS Regulations require an actuarial valuation to be performed for each defined benefit superannuation plan every three years, or every year if the plan pays defined benefit pensions.
iii. Governance of the plan
The Plan’s Trustee is responsible for the governance of the Plan. The Trustee has a legal obligation to act solely in the best interests of Plan beneficiaries. The trustee has the following roles:
- administration of the Plan and payment to the beneficiaries from Plan assets when required in accordance with the Plan rules;- management and investment of the Plan assets; and- compliance with superannuation laws and other applicable regulations.The prudential regulator, the Australian Prudential Regulation Authority (APRA), licences and supervises regulated superannuation plans.
iv. Risks
There are a number of risk to which the Plan exposes the Company. The more significant risks relating to the defined benefits are:
Investment risk the risk that investment returns will be lower than assumed and the Company will need to increase contributions to offset this shortfall.
Salary growth risk the risk that wages or salaries (on which future benefit amounts will be based) will rise more rapidly than assumed, increasing defined benefit amounts and thereby requiring additional employer contributions.
Legislative risk the risk is that legislation changes could be made which increase the cost of providing the defined benefits.
The defined benefit assets are invested in the Future Directions Balanced investment option. The assets are diversified within this investment option and therefore the plan has no significant concentration of investment risk.
v. Description of significant events
There were no plan amendments affecting the defined benefits payable, curtailments or settlements during the year.
For
per
sona
l use
onl
y

98
FINANCIAL STATEMENTSNotes to and forming part of the Financial Statements for the year ended 30 June 2017
PMP Group
2017 2016YEAR ENDED 30 JUNE 2017 NOTES $’000 $’000
21 Pension plans (continued)
(a) Statement of financial position impactDefined benefit obligation (10,330) (10,939)
Less: fair value of plan assets 12,275 12,626
Net defined benefit plan asset 7 1,945 1,687
(b) Movement in net defined benefit plan asset
Net defined benefit plan asset at start of year 1,687 1,811
Defined benefit plan cost (178) (200)
Remeasurements recognised in other comprehensive income 278 (210)
Employer contributions 158 286
Net defined benefit plan asset 7 1,945 1,687
(c) Reconciliation of the net defined benefit plan asset
Net defined benefit plan asset at start of year 1,687 1,811
Current service cost (227) (269)
Net interest 49 69
Actual return on plan assets less interest income 989 (597)
Actuarial gains arising from changes in financial assumptions 118 112
Actuarial (losses)/gains arising from liability experience (829) 275
Employer contributions 158 286
Net defined benefit plan asset at end of year 7 1,945 1,687
If a surplus exists in the plan, PMP Limited expect to be able to take advantage of it in the form of a reduction in the required contribution rate, depending on the advice of the plan’s actuary.
PMP Limited may at any time by notice to the Trustee terminate its contributions. PMP Limited has a liability to pay the contributions due prior to the effective date of the notice, but there is no requirement for it to pay any further contributions, irrespective of the financial condition of the plan.
22 Share-based payment plans
(a) Employee long term incentive planOrdinary shares up to 5.0% (2016: 5.0%) of the total number of ordinary shares on issue may be allotted under the PMP long term incentive plan.
Total number of employee options/performance rights issued since commencement: 77,548,579
Total number of employee performance rights issued as at balance date: 6,213,640
Rights on issue (as a percentage of total shares on issue) as at 30 June 2017: 1.22%
Total number of employee performance rights issued during the year: —
Total number of employee performance rights issued post balance date: — For
per
sona
l use
onl
y

99
FINANCIAL STATEMENTSNotes to and forming part of the Financial Statements for the year ended 30 June 2017
YEAR ENDED 30 JUNE 2017
22 Share-based payment plans (continued)
(a) Employee long term incentive plan (continued)
(i) Performance rights
Allotment Date1/10/2013
(i)1/10/2014
(ii)1/10/2015
(iii)1/6/2016
(iv)Total
Number
On issue at beginning of year 2,155,217 1,398,408 3,000,000 1,815,232 8,368,857
Issued during the year — — — — —
Exercised during the year (1,885,815) — — — (1,885,815)
Lapsed during the year (269,402) — — — (269,402)
On issue at end of year — 1,398,408 3,000,000 1,815,232 6,213,640
Lapsed subsequent to balance date* — (699,204) — — (699,204)
Outstanding at date of Directors’ report
— 699,204 3,000,000 1,815,232 5,514,436
Number of participants (at balance date)
6 5 1 8
Vesting date (Following the announcement of the)
FY16 results FY17 results FY18 results FY18 results
Fair value per right - TSR hurdle (vi) $0.42 $0.34 $0.30 $0.30
Fair value per right - EBITDA hurdle (vi) $0.47 $0.47 $0.451 $0.48
* 699,206 performance rights lapsed due to EBITDA performance hurdle not being met over the performance period.
(i) In October 2013, granted rights to the value of between 15% - 50% of each participant’s total employment cost. The number of rights granted was determined based on the weighted average share price for the one week period up to grant date ($0.34).
Performance rights entitle participants to receive PMP shares for nil cost after vesting. Rights will only vest if relevant performance hurdles are achieved across the following three years FY14, FY15 and FY 16 as follows:
- PMP’s Total Shareholder Return (TSR) over the three year performance period comprising FY14, FY15 and FY16 is measured against a comparator group of ASX listed companies ranked between S&P/ASX 200 to 300 entities. 50% of rights granted are subject to the TSR hurdle. If a rank of less than the 51st percentile is achieved nil vest, if a rank of between the 51st and 75th percentile is achieved 50-100% of rights vest and if a rank of greater than 75th percentile is achieved 100% vest.
- PMP’s Earnings Before Interest, Tax, Depreciation and Amortisation (EBITDA) over the three year period comprising FY14, FY15 and FY16 is measured against a target for the PMP Group. 50% of rights granted are subject to an EBITDA hurdle. The number of rights to vest are pro rated based on a target EBTIDA range.
As at 29 August 2016, following the announcement of the results to 30 June 2016 to the ASX, relevant performance hurdles for the 3 year period to 30 June 2016 were met resulting in 1,885,815 rights vesting, being 1,077,609 TSR rights and 808,206 EBITDA rights.
(ii) In October 2014, rights to the value of between 15% - 50% of each executive participant’s total employment cost were granted to executives. The number of rights granted was determined based on the weighted average share price for the one week period up to grant date ($0.48).
Performance rights entitle participants to receive PMP shares for nil costing after vesting. Rights will only vest if relevant performance hurdles described in (i) are achieved across the following three years FY15, FY16 and FY17.
Following the announcement of the results to 30 June 2017 to the ASX on 28 August 2017, relevant performance hurdles for the 3 year period to 30 June 2017 were met resulting in 699,202, rights vesting, being 699,202 TSR rights with no EBITDA rights vesting.
(iii) In October 2015, 3,000,000 rights were granted conditionally to PMP Managing Director and Chief Executive Officer, Mr Peter George. This grant was approved by shareholders at the 2015 Annual General Meeting.
Performance rights entitle the PMP Managing Director and Chief Executive Officer to receive PMP shares for nil costing after vesting. Rights will only vest if relevant performance hurdles described in (i) are achieved across the following three years FY16, FY17 and FY18.
For
per
sona
l use
onl
y

100
FINANCIAL STATEMENTSNotes to and forming part of the Financial Statements for the year ended 30 June 2017
YEAR ENDED 30 JUNE 2017
22 Share-based payment plans (continued)
(a) Employee long term incentive plan (continued)
(iv) In June 2016, rights to the value of between 15% - 50% of each executive participant’s total employment cost were granted to executives. The number of rights granted was determined based on the weighted average share price for the one week period up to grant date ($0.55).
Performance rights entitle participants to receive PMP shares for nil costing after vesting. Rights will only vest if relevant performance hurdles described in (i) are achieved across the following three years FY16, FY17 and FY18.
(v) Rights subject to the TSR hurdle have been independently valued using a Monte Carlo simulation and the Black Scholes model has been used to value the rights with a EBITDA performance condition.
The following table lists the inputs to the models used to value the rights granted:
1/10/2013 1/10/2014 1/10/2015 - CEO
1/6/2016 - Executives
Dividend yield 0.00% 0.00% 6.00% 6.00%
Expected volatility 60% 50% 45% 40%
Risk-free interest rate 3.11% 2.54% 2.20% 1.60%
Correlation Historical share prices used to calculate the correlation of
returns of PMP and the constituents of
the peer group.
Historical share prices used to calculate the correlation of
returns of PMP and the constituents of
the peer group.
Historical share prices used to calculate the correlation of
returns of PMP and the constituents of
the peer group.
Historical share prices used to calculate the correlation of
returns of PMP and the constituents of
the peer group.
Share price at grant date $0.47 $0.47 $0.53 $0.54
The fair value does not contain any discount for forfeiture due to employees leaving before vesting.
(b) Chief Executive Officer (“CEO”) Short-Term Incentives (“STIs”)
(i) Mr Peter George, PMP Managing Director and CEO has a STI of up to 100% of his base remuneration of which 33.3% will be paid in PMP shares, subject to the achievement of the following targets:
- Budgeted EBIT (between 60% - 70%)
- Improved safety (up to 20%)
- Personal objectives (between 10% - 20%)
No STI payment was made for the 2017 financial year in relation to the above STI (2016: Nil). The Managing Director and CEO was eligible for and received a STI following the $40 million annualised savings being actioned as part of the synergy program following the merger with IPMG, which did not require a portion to be held in PMP shares.
For
per
sona
l use
onl
y

101
FINANCIAL STATEMENTSNotes to and forming part of the Financial Statements for the year ended 30 June 2017
YEAR ENDED 30 JUNE 2017
23 Related parties
(a) Key Management PersonnelDetails of Key Management Personnel, including remuneration, are included in the section titled “Remuneration Report” included in the Directors’ Report.
No Key Management Personnel received or is entitled to receive a benefit, other than a benefit included in the aggregate amount of emoluments. Any transactions with Key Management Personnel are made on normal commercial terms and conditions.
(b) Compensation of Key Management PersonnelThe aggregate compensation made to Directors and other members of Key Management Personnel of the company and the Group is set out below:
PMP Group2017 2016
$ $Short-term employee benefits 4,145,244 2,051,956Other long-term employee benefits 383,998 13,544Post employment benefits 154,914 141,965Termination payments (1) — 239,321 Share-based payment (2) 273,223 560,367 Total compensation 4,957,379 3,007,153
(1) P Trainor completed his services as Managing Director of PMP (NZ) Limited on 20/11/15. New Zealand dollar termination payment converted into Australian dollars at the average profit and loss exchange rate prevailing to November 2015.
(2) This is based on the accrued accounting value in accordance with AASB 2 Share-based Payments. All rights valued in accordance with AASB 2 have been independently valued. In accordance with AASB 2 the non-market conditions associated with these rights were not taken into account when estimating the fair value at grant date. Instead, the number of rights expected to eventually vest is re-assessed at the end of each reporting period.
(c) Key Management Personnel shareholdingsThis information is disclosed within the “Remuneration Report” included in the Directors’ Report.
(d) Transactions with Key Management Personnel and their related partiesA number of Key Management Personnel, or their related parties, hold positions in other companies that result in them having control or significant influence over these companies.
The aggregate value of transactions and outstanding balances related to Key Management Personnel and entities over which they have control or significant influence were as follows.
Transaction value for the year ended 30 June
Balance outstanding as at 30 June
2017 2016 2017 2016Director/Executive Transaction $’000 $’000 $’000 $’000N Sparks Catalogue printing and distribution (i) — 914 — 23 M Hannan Property leases (ii) 3,343 — 128 — A O’Connor Property leases (ii) 3,343 — 128 —
(i) The group printed and distributed catalogues for Deals Direct part of the Grays e-Commerce Group Ltd, a company for which N Sparks (Non Executive Director) was a Director until 10 October 2016. Amounts were billed based on normal market rates for such services and payable under normal payment terms.
(ii) M Hannan (Non Executive Director) and A O’Connor (CEO Print Australia) are beneficiaries of Rathdrum Property Trust (RPT). Subsidiary companies of PMP Limited have lease agreements with RPT for leasing of properties owned by the Trust. All leases expire on 30 June 2024. PMP assumed responsibility for these leases when it acquired IPMG on 1 March 2017. During the period 1 March 2017 to 30 June 2017, the following subsidiary companies of PMP Limited incurred lease expenses in relation to RPT lease commitments.
$ 000Offset Alpine Printing Pty Limited 1,026 Hannanprint NSW Pty Limited 1,171 Hannanprint Victoria Pty Limited 365 Inprint Pty Limited 759 PEP Central Pty Limited 22
3,343
The maturity profile of total lease commitments of $78,623,000 to RPT for 7 years ending 30 June 2024 is as follows,$ 000
not later than one year 10,261 later than one year but not later than five years 44,215 later than five years 24,147
78,623
For
per
sona
l use
onl
y

102
FINANCIAL STATEMENTSNotes to and forming part of the Financial Statements for the year ended 30 June 2017
YEAR ENDED 30 JUNE 2017
23 Related parties (continued)(e) Transactions with related parties in the wholly owned group
Details of controlled entities are set out in Note 19. The entities and PMP conduct business transactions between themselves. Such transactions include the purchase and sale of goods, services, plant and equipment and the receipt and payment of management fees, dividends and interest. All such transactions are conducted on the basis of normal commercial terms and conditions, have been eliminated on consolidation and are not disclosed in this note.
(f) Transactions with other related partiesThere were no transactions with any other related parties of the PMP Group.
24 Business combinationSummary of acquisition
As announced to the market on 28 October 2016, on 1 March 2017 the Group acquired 100% of IPMG Holdco Pty Ltd and its subsidiaries, a print and digital services group operating in Australia. IPMG operates through various businesses including Hannanprint, Inprint and Offset Alpine. IPMG Group entities acquired by PMP Limited and included in the current consolidated financial statements are listed in controlled entities Note 19.
The acquisition was funded by way of 187,970,295 new fully paid ordinary shares in PMP Limited and cash. IPMG shareholders were issued with 177,970,295 PMP Limited fully paid ordinary shares on 1 March 2017 and a further 10,000,000 PMP Limited fully paid ordinary shares on 5 May 2017.
YEAR ENDED 30 JUNE 2017 $’000
(i) Purchase consideration and provisional goodwill on acquisitionShares in PMP Limited 128,760 Cash 6,321
135,081
Net assets acquired * 100,284Goodwill on acquisition 34,797
135,081 * Include cash and cash equivalents $11,134,010.
(ii) Acquisition costs have been recognised as follows(a) Amounts recognised in current year profit and loss statement under significant items 8,015(b) Share issue cost recognised in contributed equity — (c) Debt issue costs capitalised into borrowings —
8,015
For
per
sona
l use
onl
y

103
FINANCIAL STATEMENTSNotes to and forming part of the Financial Statements for the year ended 30 June 2017
YEAR ENDED 30 JUNE 2017 $’000
24 Business combination (continued)
(iii) Assets acquired and liabilities assumed at the date of acquisition :
Current assetsCash and cash equivalents 11,134Receivables 51,797Inventories 30,160Other 1,176
Total current assets 94,267
Non-current assetsProperty, plant and equipment 72,647Deferred tax assets 357Goodwill and intangible assets 495
Total non-current assets 73,499Total assets 167,766
Current liabilitiesPayables 34,726Interest bearing liabilities - financial institutions 2,819Income tax payable 158Financial liabilities 434Provisions 19,081
Total current liabilities 57,218
Non-current liabilities Interest bearing liabilities - financial institutions 5,637 Deferred tax liabilities 1,382 Provisions 3,245
Total non-current liabilities 10,264Total liabilities 67,482Net assets 100,284
The initial accounting for the acquisition of IPMG Holdco Pty Limited and its subsidiaries has been provisionally determined at the end of the reporting period. For tax purposes, the tax values of IPMG’s assets are required to be reset based on market values of the assets. At the date of finalisation of these consolidated financial statements, the necessary market valuations and other calculations had not been finalised and they have therefore only been provisionally determined based on the directors’ best estimate of the likely tax values.
(iv) Revenue and profit contribution for 4 months to 30 June 2017:The revenue generated by the acquired businesses over the four months from 1 March 2017 to 30 June 2017 has been broadly in line with expectations at $105.2 million. If the acquisition occurred on 1 July 2016, the revenue generated by the acquired businesses for the 2017 financial year would have been $339.1 million.
A stand alone Statement of Profit or Loss for the acquired entities for the four month period has not been provided due to the integration into PMP’s businesses which commenced immediately following completion on 1 March 2017. This involved three sites closing, production transferring between the various businesses and considerable asset impairments all of which makes it very difficult to provide an underlying performance and therefore a stand alone Statement of Profit or Loss.
For
per
sona
l use
onl
y

104
FINANCIAL STATEMENTSNotes to and forming part of the Financial Statements for the year ended 30 June 2017
2017 2016Number Number
YEAR ENDED 30 JUNE 2017 ‘000 ‘000
25 Earnings per share
(a) Weighted average number of ordinary sharesWeighted average number of ordinary shares on issue used in the calculation of basic earnings per share 379,850 322,126
Effect of dilutive securities:Share rights * 4,372 5,960
Weighted average number of shares used in the calculation of diluted earnings per share 384,222 328,086
* The weighted average number of exercised/lapsed share rights included is nil (2016: nil).
1,841,820 rights outstanding as at 30 June 2017 are considered anti-dilutive and excluded from the calculation of diluted earnings per share at 30 June 2017 (2016: 2,409,108). These rights could potentially dilute basic earnings per share in the future.
2017 2016YEAR ENDED 30 JUNE 2017 $’000 $’000
(b) Earnings Net (loss)/profit after income tax (126,427) 185
(Loss)/profit used in calculating basic and diluted earnings per share (126,427) 185
For
per
sona
l use
onl
y

105
FINANCIAL STATEMENTSNotes to and forming part of the Financial Statements for the year ended 30 June 2017
PMP Group
2017 2016YEAR ENDED 30 JUNE 2017 NOTES $’000 $’000
26 Cash flow statement notes
(a) Reconciliation of cash flow from operating activities to operating profit after income tax
Operating (loss)/profit after income tax (126,427) 185
Adjustments for non-cash items:Depreciation 2(e) 27,622 27,120 Amortisation 2(e) 927 794
Impairment/(reversal) of plant and equipment 2(b), 2(c) 36,082 (230)Provision/(credit) for doubtful debts/bad debts written off 5(a) 842 (976)Movement in provision for tax — (1)Net loss on disposal of property, plant and equipment 2(c) 193 256 Share-based payment plans 2(c), 17 158 468 Non-cash superannuation expense 21(b) 178 200 Other non-cash items 33,440 181
Change in assets and liabilities:Accounts receivable (Increase) (21,845) (16,468)Inventories (Increase) (21,228) (15,833)Liabilities Increase 65,651 30,106 Non-current assets (Increase)/Decrease (17,031) 4,355 Provision for employee benefits Increase/(Decrease) 13,038 (170)Prepayments and other assets (Increase)/Decrease (4,100) 2,036
Net cash (used in)/provided by operating activities (12,500) 32,023
(b) Reconciliation of cash and cash equivalentsCash and cash equivalents 54,340 54,103
Total cash and cash equivalents 54,340 54,103
For
per
sona
l use
onl
y

106
FINANCIAL STATEMENTSNotes to and forming part of the Financial Statements for the year ended 30 June 2017
PMP Group
2017 2016YEAR ENDED 30 JUNE 2017 NOTES $’000 $’000
27 Financial instruments
The Group’s activities expose it to a variety of financial risks: market risk (including currency and interest rate risk), credit risk and liquidity risk. The Group’s overall risk management programme focuses on the unpredictability of financial markets and seeks to minimise potential adverse effects on the financial performance of the group.
Categories of financial instrument:The Group holds the following categories of financial instruments:
Financial assetsCash and cash equivalents 26(b) 54,340 54,103
Trade and other receivables 5 117,280 96,277
Derivative financial instruments 14 2,588 2,629
Other 7 240 240
174,448 153,249
Financial liabilities
Trade and other payables 11 173,838 139,371
Interest bearing liabilities 12(a), 12(b) 73,496 54,506
Derivative financial instruments 14 620 1,105
247,954 194,982
Details of the accounting policies and methods adopted, including the criteria for recognition, the basis of measurement and the basis on which income and expenses are recognised, in respect of each class of financial asset and financial liability are disclosed in Note 1.
(a) Hedging policy - overviewThe economic entity trades internationally, giving rise to exposure to market risks from changes in foreign currency exchange rates and interest rates. Derivative financial instruments are utilised to reduce those risks, principally interest rate swaps, cross currency swaps and contracts for forward currency. The economic entity has adopted certain principles in relation to derivative financial instruments:
a) It does not trade in derivatives that are not used in hedging the underlying business exposure of the economic entity; and
b) All hedging is undertaken through the Group’s central treasury operation and is in accordance with Board approved policies.
(b) Interest Rate ManagementThe Group enters into fixed rate instruments to manage the cash flow risks associated with the interest rates on borrowings that are floating. Interest rate instruments allow the Group to swap floating rate borrowings into fixed rate borrowings in accordance with the PMP Group policy. These activities are regularly evaluated to ensure that the Group is not exposed to interest rate movements that could adversely impact its ability to meet financial obligations and to ensure compliance with borrowing covenants.
For
per
sona
l use
onl
y

107
FINANCIAL STATEMENTSNotes to and forming part of the Financial Statements for the year ended 30 June 2017
YEAR ENDED 30 JUNE 2017
27 Financial instruments (continued)
(b) Interest Rate Management (continued)(i) Interest rate risk exposure
The following table sets out the amount of cash, variable rate borrowings, fixed rate borrowings and interest rate contracts outstanding.
30 June 2017 30 June 2016Weighted average
interest rate
Balance Weighted average
interest rate
Balance
% $’000 % $’000
Bank loans - AUD floating rate 4.0% (21,873) — —
Bank loans - EUR floating rate 2.0% (13,300) 2.0% (16,321)
Corporate Bond 6.4% (40,000) 6.4% (40,000)
Cross Currency Interest Rate Swaps
- receive EUR floating rate 1.8% 13,300 1.9% 16,321
- pay AUD floating rate 6.0% (10,986) 6.5% (13,427)
Year end borrowing cost (excl. cash, fees & charges) 5.3% (72,859) 6.4% (53,427)
Cash and cash equivalents 1.5% 54,340 1.7% 54,103
As at balance date, the Group maintained floating rate borrowings of $32.9 million (2016: $13.4 million), that were not hedged by interest rate swaps. The associated interest rate risk is partially mitigated by expected free cash flow and intra-period movements in cash requirements. In 2017, the average borrowing rate excluding capitalised fees and charges was 6.2% (2016: 7.1%).
PMP Limited’s receivables and payables are non-interest bearing. Cash and overdraft amounts are at the floating interest rate applicable to the PMP Group.
PMP Group
2017 2016NOTES $’000 $’000
(ii) Fair value of cross currency swapsAustralian Dollar / Euro cross currency interest rate swaps 2,064 2,580
Total fair value of cross currency swaps 14 2,064 2,580
The cross currency swaps convert the Euro denominated floating debt to Australian dollar floating debt, and has been designated as cash flow hedges.
At 30 June 2017, a $3,580 gain has been recorded in the Consolidated statement of profit or loss and other comprehensive income (2016: $307 loss).
For
per
sona
l use
onl
y

108
FINANCIAL STATEMENTSNotes to and forming part of the Financial Statements for the year ended 30 June 2017
YEAR ENDED 30 JUNE 2017
27 Financial instruments (continued)
(c) Liquidity risk managementLiquidity risk is the risk that funds may be insufficient to settle a transaction on the due date, and the Group may be forced to sell financial assets at a value which is below what they are worth.
PMP manages liquidity risk by maintaining adequate reserves, banking facilities and borrowing facilities by continually monitoring actual and forecast cash flows and matching the maturity profiles of financial assets and liabilities.
The table below shows the Group’s financial liabilities and derivative instruments in relevant maturity groupings based on the remaining period at the reporting date to the contractual maturity date. The amounts shown in the table are the contractual, undiscounted cash flows and include both principal and interest.
PMP Group30 June 2017 Carrying
amountContractual cash flows
$’000
Less than 1 year
1 to 2 years
2 to 5 years
> 5 years
Interest bearing liabilities $’000 $’000 $’000 $’000 $’000
Corporate Bond - Australia 40,000 46,430 2,572 2,572 41,286 — Bank Loans - Euro 13,300 14,007 3,210 3,150 7,647 — Cross Currency Swaps - AUD/EURO (1) (2,064) (1,271)
- inflows (3,180) (3,141) (7,647) — - outflows 3,060 2,929 6,708 —
Forward FX Contracts
- inflows (49) (682) (2) (682) — — — - outflows 1,102 51,130 (2) 46,342 4,788 — —
Prepaid finance costs (1,676)Payables 173,838 173,838 173,838 — — —
Total 224,451 283,452 225,160 10,298 47,994 —
PMP Group30 June 2016 Carrying
amountContractual cash flows
$’000
Less than 1 year
1 to 2 years
2 to 5 years
> 5 years
Interest bearing liabilities $’000 $’000 $’000 $’000 $’000
Corporate Bond - Australia 40,000 49,002 2,572 2,572 43,858 — Bank Loans - Euro 16,321 17,319 3,283 3,223 9,312 1,501 Cross Currency Swaps - AUD/EURO (1) (2,580) (1,365)
- inflows (3,257) (3,193) (9,285) (1,501)- outflows 3,244 3,056 8,312 1,259
Forward FX Contracts
- inflows (49) (682) (2) (682) — — — - outflows 1,105 51,234 (2) 46,446 4,788 — —
Prepaid finance costs (1,815)Payables 139,371 139,371 139,371 — — —
Total 192,353 254,879 190,977 10,446 52,197 1,259
(1) This represents the Australian Dollar equivalents of the interest and principal payments due on the cross currency swap. For the carrying amount, it represents the fair value amount as shown in Note 27(b)(ii).
(2) This represents the Australian Dollar equivalents of the foreign currency payment/receipt leg of the forward foreign exchange contracts.
For
per
sona
l use
onl
y

109
FINANCIAL STATEMENTSNotes to and forming part of the Financial Statements for the year ended 30 June 2017
YEAR ENDED 30 JUNE 2017
27 Financial instruments (continued)
(d) Foreign exchange managementForeign currency risk refers to the risk that the value of a financial commitment, recognised asset or liability will fluctuate due to changes in foreign currency rates. The Group’s foreign currency exchange risk arises primarily from where the Group has firm commitments or highly probable forecast transactions for receipts and payments that are to be settled in foreign currencies, or where the price is dependant on foreign currencies and also the risk that arises on translation of net investments in foreign operations.The Group is exposed to foreign exchange risk from various currency exposures, primarily with respect to the New Zealand Dollar, the US Dollar, the Euro, the Great British Pound and the Japanese Yen.Foreign exchange risk that arises from firm commitments or highly probable transactions are managed primarily through the use of forward foreign currency derivatives. A portion of these transactions are hedged (such as the purchase of paper and ink from various foreign suppliers) in each currency in accordance with the Group’s risk management policy.Foreign exchange risk arises from foreign denominated borrowings. These borrowings are hedged back into the local currency via the use of hedging instruments. This is to ensure that the risk from movements in exchange rates and foreign interest rates are eliminated.Foreign currency risk also arises on translation of the net assets of PMP’s non-Australian controlled entities which have a different functional currency. The foreign currency gains or losses arising from this risk are recorded through the foreign currency translation reserve on translation to Australian Dollars on consolidation.Where a subsidiary hedges foreign exchange transactions it designates hedging instruments as cash flow hedges as appropriate.
(i) Foreign currency borrowings
Liabilities Assets
2017 2016 2017 2016$’000 $’000 $’000 $’000
Euro borrowings 13,300 16,321 — —
Cross Currency Swap (13,300) (16,321) — —
— — — —
(ii) Australian entity contracts to exchange foreign currency - relating to receipts and payments
Average exchange rate PMP Group
2017 2016 2017 2016$ $ $’000 $’000
United States Dollars - less than one year 0.738 0.717 10,589 16,767 United States Dollars - one to two years — 0.731 — 4,788 UK Pounds receivables - less than one year 0.578 0.517 (1,083) (682)Euro - less than one year 0.684 0.660 20,343 15,458
29,849 36,331
(iii) New Zealand entity contracts to exchange foreign currency - relating to receipts and payments
NZ DollarsAUD $
EquivalentAverage exchange
rate Average fixed rate PMP Group
2017 2016 2017 2016 2017 2016
$ $ NZD $’000
NZD $’000 $’000 $’000
United States Dollars - less than one year 0.712 0.692 5,355 6,416 5,096 6,151
Euro - less than one year 0.638 0.592 4,386 5,742 4,174 5,504
Japanese Yen - less than one year — 75.660 — 2,676 — 2,566
9,741 14,834 9,270 14,221
For
per
sona
l use
onl
y

110
FINANCIAL STATEMENTSNotes to and forming part of the Financial Statements for the year ended 30 June 2017
YEAR ENDED 30 JUNE 2017
27 Financial instruments (continued)
(d) Foreign currency management (continued)
(iv) Fair value of forward exchange contractsPMP Group
2017 2016NOTES $’000 $’000
Australian entity - foreign exchange contracts relating to receipts 22 49
Australian entity - foreign exchange contracts relating to payments 2 (662)
New Zealand entity - foreign exchange contracts relating to receipts and payments (120) (443)
Total fair value of forward exchange contracts (96) (1,056)
Comprised of:
Financial assets - current 14 524 49
Financial liabilities - current 14 (620) (1,093)
Financial liabilities - non-current 14 — (12)
Total fair value of forward exchange contracts (96) (1,056)
At 30 June 2017, a $0.2 million debit (2016: $0.7 million debit) has been recognised within the Consolidated statement of profit or loss and other comprehensive income and a $0.8 million debit, excluding tax effect (2016: $1.0 million debit) is included within the cash flow hedge reserve in equity. $0.1 million credit was transferred to inventory during the financial year ended 30 June 2017 (2016: $0.1 million debit).
For
per
sona
l use
onl
y

111
FINANCIAL STATEMENTSNotes to and forming part of the Financial Statements for the year ended 30 June 2017
YEAR ENDED 30 JUNE 2017
27 Financial instruments (continued)
(d) Foreign currency management (continued)
(v) Foreign currency sensitivity riskThe following table shows the effect on equity excluding tax effect as at 30 June from a 10 percent adverse / favourable movement in exchange rates at that date on a total portfolio basis with all other variables held constant, taking into account all underlying exposures and related hedges.
Adverse versus favourable movements are determined relative to the underlying exposure. An adverse movement in exchange rates implies an increase in the Group’s foreign currency risk exposure and a worsening in financial position. A favourable movement in exchange rates implies a reduction in foreign currency risk exposure and an improvement in financial position.
A sensitivity of 10 percent has been selected as this is considered reasonable given the current level of exchange rates and the volatility observed both on a historical basis and market expectations for future movement. Comparing the Australian dollar exchange rate against the United States dollar and the Euro and the New Zealand dollar against the United States dollar year end rates would give the following adverse and favourable rates:
Year end rate
10% rateincrease
10% ratedecrease
Australia dollar to:United States dollar 0.770 0.847 0.693Euro 0.673 0.741 0.606
New Zealand dollar to:United States dollar 0.7133 0.806 0.660Euro 0.6431 0.705 0.577Japanese Yen 81.900 90.100 73.718
The net gain/(loss) in the cash flow hedge reserve reflects the result of exchange rate movements on the derivatives held in cash flow hedges which will be released to the Consolidated statement of profit or loss and other comprehensive income in the future as the underlying hedged item affects profit.
PMP GROUP(cash flow hedge reserve)
Equity at 30 June
2017 2016$000 $000
If there was a 10% increase in exchange rates with all other variables held constant - (decrease) (2,149) (4,716)
If there was a 10% decrease in exchange rates with all other variables held constant - increase 2,331 3,697
The impact on the parent, PMP Limited, would be $nil as the entity does not hold forward exchange contracts.
For the PMP Group, foreign currency translation risk associated with PMP’s foreign investments results in some volatility to the foreign currency translation reserve. The impact on the foreign currency translation reserve relates to the translation of the net assets of foreign currency controlled entities on consolidation.
(e) Credit RiskCredit risk is the risk that a counterparty will default on their financial obligations resulting in financial loss to the Group. Credit risk exists from cash and cash equivalents, trade and other receivables and derivative financial instruments. The Group’s exposure to credit risk arises from the potential default of the counter party, with a maximum exposure equal to the carrying value of these assets net of any provision for doubtful debts (refer to Note 5).
The credit risk on cash and cash equivalents and financial instruments is limited as the counterparties are financial institutions with credit ratings of A- or higher. Also, PMP has policies that limit the amount of credit exposure to any one financial institution.
PMP has an approved Credit Policy Manual which provides guidelines for the management of credit risk. This provides guidance for the way in which the credit risk of customers is assessed, and the use of credit risk rating and other information in order to set appropriate trading limits with customers.
In some instances security may be required to be supplied to PMP from customers to minimise risk. The security is either in the form of Director guarantees for their business which is secured over a residential property or may be an upfront payment of between 75% - 50% of the trade before executing the sale.
For
per
sona
l use
onl
y

112
FINANCIAL STATEMENTSNotes to and forming part of the Financial Statements for the year ended 30 June 2017
YEAR ENDED 30 JUNE 2017
27 Financial instruments (continued)
(f) Capital managementPMP Limited’s capital management plan over the medium term is to achieve a target capital structure and to optimise financial returns to investors based on the following considerations:- The capability to service debt and meet financial covenant constraints;- Delivering a capital structure which meets the Group’s cash flow requirements;- Listed comparables and market expectations; and- Retaining flexibility for PMP to pursue attractive investment opportunities including organic growth, acquisitions and shareholder
returns.The group has target gearing levels in the range of: - Net debt to EBITDA below 2 times, and at 30 June 2017 was at 0.6 times- EBITDA (before significant items) to borrowing costs of greater than 4.0 times, and at 30 June 2017 was at 6.3 times.The company currently seeks to retain flexibility through maintaining a gearing ratio that is either within the lower end or below the range taking into account the earnings of the business over the next 12-24 months. Due to the level of EBITDA and the industry PMP operate in, we believe that the investors expect PMP to maintain a lower level of gearing.
(g) Fair valuesThe fair value of all financial assets and liabilities equates to the carrying value.
(h) Fair value measurementsThe fair value of financial assets and financial liabilities must be estimated for recognition and measurement or for disclosure purposes.The fair value measurement hierarchy:(a) quoted prices (unadjusted) in active markets for identical assets or liabilities (level 1);(b) inputs other than quoted prices included within level 1 that are observable for the asset or liability, either directly
(as prices) or indirectly (derived from prices) (level 2); and(c) inputs for the asset or liability that are not based on observable market data (unobservable inputs) (level 3).
The following tables present the Group’s assets and liabilities measured and recognised at fair value.
Level 1 Level 2 Level 3 TotalPMP Group - 30 June 2017 $’000 $’000 $’000 $’000
Financial derivatives being hedge accountedForward Foreign Exchange Contracts — (96) — (96)Cross Currency Swaps — 2,064 — 2,064
Total financial derivatives — 1,968 — 1,968
Level 1 Level 2 Level 3 TotalPMP Group - 30 June 2016 $’000 $’000 $’000 $’000
Financial derivatives being hedge accountedForward Foreign Exchange Contracts — (1,056) — (1,056)
Cross Currency Swaps — 2,580 — 2,580
Total financial derivatives — 1,524 — 1,524
The fair value of financial instruments that are not traded in an active market (for example, derivatives used for hedging) is determined using valuation techniques. Interest rate swaps, cross currency swaps and forward foreign exchange contracts are valued using a discounted cash flow approach. Future cash flows are estimated based on market forward interest rates (and foreign exchange rates for cross currency swaps and forward foreign exchange contracts) as at the end of the reporting period and the contract rates, discounted at a rate that reflects the credit risk of the various respective counterparties. These instruments are included in Level 2.F
or p
erso
nal u
se o
nly

113
FINANCIAL STATEMENTSNotes to and forming part of the Financial Statements for the year ended 30 June 2017
YEAR ENDED 30 JUNE 2017
28 Contingent liabilities
Contingent liabilities classified in accordance with the party for whom the liability could arise are:
The Company:
- PMP has guaranteed the debts of certain wholly owned Australian controlled entities in accordance with a Deed of Guarantee and Class Order number 98/1418 issued by the Australian Securities and Investments Commission, which provides relief from the requirements to prepare, audit and lodge financial statements (refer to Note 19).
Related bodies corporate:
- PMP has guaranteed the borrowings of PMP Finance Pty Limited, PMP (NZ) Limited and Hannanprint NSW Pty Limited to facilitate banking arrangements.
- Wholly owned entities in the PMP Group have provided guarantees to banks, in respect of debt and foreign currency management.
- Entities in the PMP Group contribute to a number of defined benefit superannuation funds and have undertaken to contribute annually such amounts as the actuaries consider necessary to secure the rights of members.
29 Subsequent events
Other than the matter raised above, the Directors are not aware of any matters or circumstance arising since balance date not otherwise dealt with in this report or the consolidated financial statements, that has significantly affected or may significantly affect the operations of the PMP Group, the results of those operations or the state of affairs of the PMP Group in subsequent years.
For
per
sona
l use
onl
y

114
FINANCIAL STATEMENTSNotes to and forming part of the Financial Statements for the year ended 30 June 2017
PMP Limited
2017 2016YEAR ENDED 30 JUNE 2017 $’000 $’000
30 ParentAs at, and throughout the 2017 financial year, the parent company of PMP Group was PMP Limited.
Financial performance of the parent(Loss)/profit after tax (124,867) 208
Other comprehensive income/(expense) 195 (147)
Total comprehensive (loss)/income (124,672) 61
Financial position of the parent at year end
Current assets 56,424 73,013
Non-current assets 264,753 247,797
Total assets 321,177 320,810
Current liabilities 124,651 120,990
Non-current liabilities 815 719
Total liabilities 125,466 121,709
Net assets 195,711 199,101
Total equity of the parent comprising of:
Contributed equity 482,819 353,227
Accumulated losses (320,945) (196,273)
Share-based payment reserve 849 1,523
Dividend reserve* 32,988 40,624
Total equity 195,711 199,101 * During the 2015 financial year, the Directors resolved to create a separate dividend reserve account.
For
per
sona
l use
onl
y

115
FINANCIAL STATEMENTSNotes to and forming part of the Financial Statements for the year ended 30 June 2017
PMP Limited
2017 2016YEAR ENDED 30 JUNE 2017 $’000 $’000
30 Parent (continued)
Parent capital commitments for acquisition of property, plant and equipment
Capital expenditure:
- not later than one year — —
Total capital expenditure — —
Parent operating commitments for lease rental
Operating lease rentals - parent as lessee:
- not later than one year 1,596 1,986
- later than one year but not later than five years 3,767 5,796
- later than five years — —
Total operating lease rentals (lessee) 5,363 7,782
Operating lease rentals - parent as lessor:
- not later than one year — —
- later than one year but not later than five years — —
Total operating lease rentals (lessor) — —
Investment in controlled entitiesPMP Limited has impaired its investment in controlled entities during the year ended 30 June 2017 by $118.5 million (2016: $4.2 million).
Parent capital guarantees in respect of debts of certain subsidiariesThe parent has entered into a Deed of Guarantee with subsidiaries whereby in the event of windup of a subsidiary, the parent guarantees debts of that subsidiary. Further details of the Deed of Cross Guarantee and the subsidiaries subject to the deed are disclosed in Note 19.
Parent contingent liabilitiesThere were no contingent liabilities for the year ended 30 June 2017 (2016: $nil).
For
per
sona
l use
onl
y

116
DIRECTORS’ DECLARATIONfor the year ended 30 June 2017
In accordance with a resolution of the Directors of PMP Limited, we state that:
(a) in the Directors’ opinion, there are reasonable grounds to believe that the company will be able to pay its debts as and when they become due and payable;
(b) in the Directors’ opinion, the attached financial statements are in compliance with the Financial Reporting Standards, as stated in Note 1 to the financial statements;
(c) in the Directors’ opinion, the attached financial statements and notes thereto are in accordance with the Corporations Act 2001, including compliance with accounting standards and giving a true and fair view of the financial position and performance of the consolidated entity; and
(d) the Directors have been given the declarations required by section 295A of the Corporations Act 2001
At the date of this declaration, the company is within the class of companies affected by ASIC Class Order 98/1418. The nature of the deed of cross guarantee is such that each company which is party to the deed guarantees to each creditor payment in full of any debt in accordance with the deed of cross guarantee.
In the Directors’ opinion there are reasonable grounds to believe that the company and the companies to which the ASIC Class Order applies, as detailed in Note 19 to the financial statements will, as a group, be able to meet any obligations or liabilities to which they are, or may become liable, subject by virtue of the deed of cross guarantee.
Signed in accordance with a resolution of the Directors made pursuant to section 295(5) of the Corporations Act 2001.
On behalf of the Directors
Matthew Bickford-Smith Chairman
Peter George Managing Director and Chief Executive Officer
Sydney, 31 August 2017
For
per
sona
l use
onl
y

117
INDEPENDENT AUDITOR’S REPORTfor the year ended 30 June 2017
Liability limited by a scheme approved under Professional Standards Legislation. Member of Deloitte Touche Tohmatsu Limited
Independent Auditor’s Report to the
Members of PMP Limited Report on the Audit of the Financial Report
Opinion We have audited the financial report of PMP Limited (the Company) and its subsidiaries (the Group), which comprises the consolidated statement of financial position as at 30 June 2017, the consolidated statement of profit or loss and other comprehensive income, the consolidated statement of changes in equity and the consolidated statement of cash flows for the year then ended, and notes to the financial statements, including a summary of significant accounting policies, and the directors’ declaration. In our opinion, the accompanying financial report of the Group is in accordance with the Corporations Act 2001, including: (i) giving a true and fair view of the Group’s financial position as at 30 June 2017
and of its financial performance for the year then ended; and
(ii) complying with Australian Accounting Standards and the Corporations Regulations 2001.
Basis for Opinion We conducted our audit in accordance with Australian Auditing Standards. Our responsibilities under those standards are further described in the Auditor’s Responsibilities for the Audit of the Financial Report section of our report. We are independent of the Group in accordance with the auditor independence requirements of the Corporations Act 2001 and the ethical requirements of the Accounting Professional and Ethical Standards Board’s APES 110 Code of Ethics for Professional Accountants (the Code) that are relevant to our audit of the financial report in Australia. We have also fulfilled our other ethical responsibilities in accordance with the Code. We confirm that the independence declaration required by the Corporations Act 2001, which has been given to the directors of the Company, would be in the same terms if given to the directors as at the time of this auditor’s report.
We believe that the audit evidence we have obtained is sufficient and appropriate to provide a basis for our opinion.
Deloitte Touche Tohmatsu A.B.N. 74 490 121 060 Grosvenor Place 225 George Street Sydney NSW 2000 PO Box N250 Grosvenor Place Sydney NSW 1220 Australia DX 10307SSE Tel: +61 (0) 2 9322 7000 Fax: +61 (0) 2 9322 7001 www.deloitte.com.au
For
per
sona
l use
onl
y

118
INDEPENDENT AUDITOR’S REPORTfor the year ended 30 June 2017
Key Audit Matters Key audit matters are those matters that, in our professional judgement, were of most significance in our audit of the financial report for the current period. These matters were addressed in the context of our audit of the financial report as a whole, and in forming our opinion thereon, and we do not provide a separate opinion on these matters. Key Audit Matter How the scope of our audit responded to the
Key Audit Matter Acquisition of IPMG As disclosed in Note 24, PMP acquired 100% of the shares in IPMG Group, for a consideration of $135.1 million in the form of shares issued in PMP Limited. As part of the transaction goodwill of $34.8 million has been recognised. Accounting for this transaction is a judgmental exercise requiring management to estimate the fair value of the assets and liabilities acquired.
Our procedures included but were not limited to:
reading the sale and purchase agreement to understand key terms and conditions;
evaluating the Purchase Price Allocation (‘PPA’) calculation prepared by management which allocates the fair value of consideration to the assets and liabilities of the acquired IPMG business;
challenging the assumptions and methods used by management in determining the fair value of the assets and liabilities acquired. For assets, consideration of the fair value was made in reference to carrying value of similar assets already owned by PMP Limited;
assessing the completeness of the assets and liabilities acquired; and
assessing the adequacy of PMP’s disclosure in Note 24.
Carrying value of property, plant and equipment and intangible assets including goodwill (Refer Notes 8 and 9) As disclosed in Notes 8 and 9, at 30 June 2017 the consolidated statement of financial position includes property, plant and equipment of $175.1 million and goodwill and other intangible assets of $37.7 million, after recording an impairment loss of $30.7 million. The evaluation of the recoverable amount of these assets requires significant judgement in respect of the key assumptions such as the 5 year cash flow forecasts, long term growth rate and discount rate.
Our procedures included but were not limited to:
evaluating the appropriateness of management’s process over the evaluation of the carrying value of property, plant and equipment and intangible assets including goodwill to determine any asset impairments;
assessing the identification of cash generating units, including the allocation of goodwill;
agreeing relevant data to board approved budgets and latest forecasts;
challenging the forecasts by reference to the historical forecasting accuracy of management;
in conjunction with our valuation specialists we assessed and challenged:
o the key assumptions for long term growth in the forecast cash flows by comparing them to historical results and industry forecasts;
For
per
sona
l use
onl
y

119
INDEPENDENT AUDITOR’S REPORTfor the year ended 30 June 2017
o the discount rate applied by comparing to an independently determined discount rate;
performing sensitivity analysis in relation to key assumptions including cash flow forecasts and discount rate;
testing, on a sample basis, the mathematical accuracy of the cash flow models; and
assessing the appropriateness of the disclosures included in Notes 8 and 9.
Recoverability of Deferred Tax Assets relating to carry forward losses As disclosed in Note 10, at 30 June 2017 the Group has recorded a deferred tax asset of $36.5 million in relation to carry forward tax losses incurred by the Group. We focussed on this matter due to the significant judgement required to assess whether there will be sufficient future taxable profits to utilise the recognised deferred tax assets.
Our procedures included but were not limited to:
assessing and challenging management’s judgements relating to the recoupment of Australian tax losses and the forecasts of future taxable profit and evaluating the reasonableness of the assumptions underlying the preparation of the taxable income forecasts;
confirming that the forecasts used are consistent, to the extent relevant, with those used in the impairment models;
evaluating whether all losses will remain available indefinitely for offset, subject to continuing to meet the statutory tax tests of continuity of ownership or, failing that, the same business test; and
assessing the appropriateness of the disclosures in Note 10 in respect of current and deferred tax balances.
Other Information
(a) The directors are responsible for the other information. The other information comprises the information included in the annual report for the year ended 30 June 2017, but does not include the financial report and our auditor’s report thereon.
Our opinion on the financial report does not cover the other information and we do not express any form of assurance conclusion thereon.
In connection with our audit of the financial report, our responsibility is to read the other information and, in doing so, consider whether the other information is materially inconsistent with the financial report or our knowledge obtained in the audit or otherwise appears to be materially misstated. If, based on the work we have performed, we conclude that there is a material misstatement of this other information, we are required to report that fact. We have nothing to report in this regard.
For
per
sona
l use
onl
y

120
INDEPENDENT AUDITOR’S REPORTfor the year ended 30 June 2017
Directors’ Responsibilities for the Financial Report The directors of the Company are responsible for the preparation of the financial report that gives a true and fair view in accordance with Australian Accounting Standards and the Corporations Act 2001 and for such internal control as the directors determine is necessary to enable the preparation of the financial report that gives a true and fair view and is free from material misstatement, whether due to fraud or error. In preparing the financial report, the directors are responsible for assessing the ability of the group to continue as a going concern, disclosing, as applicable, matters related to going concern and using the going concern basis of accounting unless the directors either intend to liquidate the Group or to cease operations, or has no realistic alternative but to do so. Auditor’s Responsibilities for the Audit of the Financial Report Our objectives are to obtain reasonable assurance about whether the financial report as a whole is free from material misstatement, whether due to fraud or error, and to issue an auditor’s report that includes our opinion. Reasonable assurance is a high level of assurance, but is not a guarantee that an audit conducted in accordance with the Australian Auditing Standards will always detect a material misstatement when it exists. Misstatements can arise from fraud or error and are considered material if, individually or in the aggregate, they could reasonably be expected to influence the economic decisions of users taken on the basis of this financial report. As part of an audit in accordance with the Australian Auditing Standards, we exercise professional judgement and maintain professional scepticism throughout the audit. We also:
Identify and assess the risks of material misstatement of the financial report, whether due to fraud or error, design and perform audit procedures responsive to those risks, and obtain audit evidence that is sufficient and appropriate to provide a basis for our opinion. The risk of not detecting a material misstatement resulting from fraud is higher than for one resulting from error, as fraud may involve collusion, forgery, intentional omissions, misrepresentations, or the override of internal control.
Obtain an understanding of internal control relevant to the audit in order to design audit procedures that are appropriate in the circumstances, but not for the purpose of expressing an opinion on the effectiveness of the Group’s internal control.
Evaluate the appropriateness of accounting policies used and the reasonableness of accounting estimates and related disclosures made by the directors.
Conclude on the appropriateness of the directors’ use of the going concern basis of accounting and, based on the audit evidence obtained, whether a material uncertainty exists related to events or conditions that may cast significant doubt on the Group’s ability to continue as a going concern. If we conclude that a material uncertainty exists, we are required to draw attention in our auditor’s report to the related disclosures in the financial report or, if such disclosures are inadequate, to modify our opinion. Our conclusions are based on the audit evidence obtained up to the date of our auditor’s report. However, future events or conditions may cause the Group to cease to continue as a going concern.
For
per
sona
l use
onl
y

121
INDEPENDENT AUDITOR’S REPORTfor the year ended 30 June 2017
Evaluate the overall presentation, structure and content of the financial report, including the disclosures, and whether the financial report represents the underlying transactions and events in a manner that achieves fair presentation.
Obtain sufficient appropriate audit evidence regarding the financial information of the entities or business activities within the Group to express an opinion on the financial report. We are responsible for the direction, supervision and performance of the Group audit. We remain solely responsible for our audit opinion.
We communicate with the directors regarding, among other matters, the planned scope and timing of the audit and significant audit findings, including any significant deficiencies in internal control that we identify during our audit. We also provide the directors with a statement that we have complied with relevant ethical requirements regarding independence, and to communicate with them all relationships and other matters that may reasonably be thought to bear on our independence, and where applicable, related safeguards. From the matters communicated with the directors, we determine those matters that were of most significance in the audit of the financial report of the current period and are therefore the key audit matters. We describe these matters in our auditor’s report unless law or regulation precludes public disclosure about the matter or when, in extremely rare circumstances, we determine that a matter should not be communicated in our report because the adverse consequences of doing so would reasonably be expected to outweigh the public interest benefits of such communication.
Report on the Remuneration Report
Opinion on the Remuneration Report
We have audited the Remuneration Report included in pages 49 to 58 of the directors’ report for the year ended 30 June 2017. In our opinion, the Remuneration Report of PMP Limited, for the year ended 30 June 2017, complies with section 300A of the Corporations Act 2001. Responsibilities The directors of the Company are responsible for the preparation and presentation of the Remuneration Report in accordance with section 300A of the Corporations Act 2001. Our responsibility is to express an opinion on the Remuneration Report, based on our audit conducted in accordance with Australian Auditing Standards.
DELOITTE TOUCHE TOHMATSU
JL Gorton Partner Chartered Accountants Sydney, 31 August 2017
For
per
sona
l use
onl
y

122
FIVE YEAR SUMMARYfor the year ended 30 June 2017
2013 <a> 2014 2015 <b> 2016 2017 <e> % change(Restated)
SALES REVENUE PMP Australia A$ mill 493.6 439.9 392.3 — — —
Print Group Australia (<f>) A$ mill — — — 199.7 263.0 31.7
Distribution and Marketing Services <f> A$ mill — — — 134.9 124.5 (7.7)
Gordon & Gotch Australia A$ mill 323.4 298.4 268.5 345.8 470.5 36.1
PMP New Zealand A$ mill 158.8 160.9 150.9 135.6 193.5 42.7
Total Sales Revenue A$ mill 975.8 899.2 811.7 816.0 1,051.5 28.9
PROFITABILITY
PMP Australia A$ mill 60.0 46.79 41.3 — — —
Print Group Australia (<f>) A$ mill — — — 26.4 16.7 (36.8)
Distribution and Marketing Services <f> A$ mill — — — 10.6 3.9 (63.4)
Gordon & Gotch Australia A$ mill 1.4 3.68 3.5 2.9 2.7 (7.2)
PMP New Zealand A$ mill 16.9 17.61 18.6 15.0 12.4 (17.2)
Corporate A$ mill (6.6) (4.67) (5.3) (3.7) (3.5) (7.3)
Total EBITDA (before significant items) A$ mill 71.6 63.4 58.1 51.2 32.2 (37.0)
Total EBIT (before significant items) A$ mill 33.8 28.8 26.4 23.3 3.7 (84.2)
NPAT post significant items A$ mill (70.2) 3.4 8.0 0.2 (126.4) —
PMP Australia EBITDA*/sales A$ mill 12.1 10.6 10.5 — — —
Print Group Australia EBITDA*/sales A$ mill — — — 13.2 6.4 (52.0)
Distribution and Marketing Services EBITDA*/sales A$ mill — — — 7.9 3.1 (60.3)
Gordon & Gotch Australia EBITDA*/sales A$ mill 0.4 1.2 1.3 0.8 0.6 (31.8)
PMP New Zealand EBITDA*/sales A$ mill 10.6 10.9 12.3 11.1 6.4 (42.0)
Total EBITDA*/sales A$ mill 7.3 7.1 7.2 6.3 3.1 (51.1)
OTHER
Net cash (used in)/provided by operating activities A$ mill 7.6 35.5 33.2 32.0 (12.5) (139.0)
Earnings per ordinary share (basic) cents (21.7) 1.1 2.5 0.1 (33.3) —
Earnings per ordinary share (diluted) cents (21.7) 1.1 2.5 0.1 (32.9) —
Dividend per share (paid) cents — — — <c> 3.0 <g> 2.4
Total assets A$ mill 549.2 502.7 469.5 476.9 570.0 19.5
Total net debt/(net cash) A$ mill 89.1 51.7 16.3 (0.7) 18.5 —
Total shareholders equity A$ mill 258.6 264.8 <b> 270.5 259.4 255.1 (1.7)
Net debt/Equity Ratio % 34.4 19.5 6.0 — (0.3) —
Interest Cover <d> times 4.7 5.1 6.5 8.5 6.3 (25.1)
Depreciation A$ mill 37.0 34.0 31.0 27.1 27.6 1.8
Amortisation A$ mill 0.8 0.6 0.8 0.8 0.9 17.7
Capital Expenditure A$ mill 23.8 5.2 5.5 4.2 2.0 (53.9)
Employees Full Time No. 1,587 1,360 1,260 1,248 1,980 58.7
Note:
EBITDA - Earnings before depreciation, amortisation, finance costs and income tax.
EBIT - Earnings before finance costs and income tax.
NPAT - Net profit after tax.
* Before significant items.
<a> During 2013, PMP changed its segment reporting structures due to a change in its functional organisational structure. Comparatives have been restated for 2012. On 1 July 2013, PMP Limited adopted AASB 119 Employee Benefits (revised), resulting in a change in accounting policy and a restatement of balances for the year ended 30 June 2013.
<b> GST asset $1.5 million from prior period no longer recoverable. This has been taken as an adjustment to accumulated losses and payables. Comparatives have been restated for 2015.
<c> Final dividend for the year ended 30 June 2015 of 1.8 cents (50% franked) and interim dividend for the year ended 30 June 2016 of 1.2 cents (unfranked).
<d> EBITDA before significant items / Interest.
<e> Includes IPMG result for 4 months to 30 June 2017.
<f> PMP Australia business segment separated into Print Group Australia and Distribution and Marketing Services businesses in 2017 with comparables shown for 2016.
<g> Final dividend for the year ended 30 June 2016 of 2.4 cents (0% franked).
For
per
sona
l use
onl
y
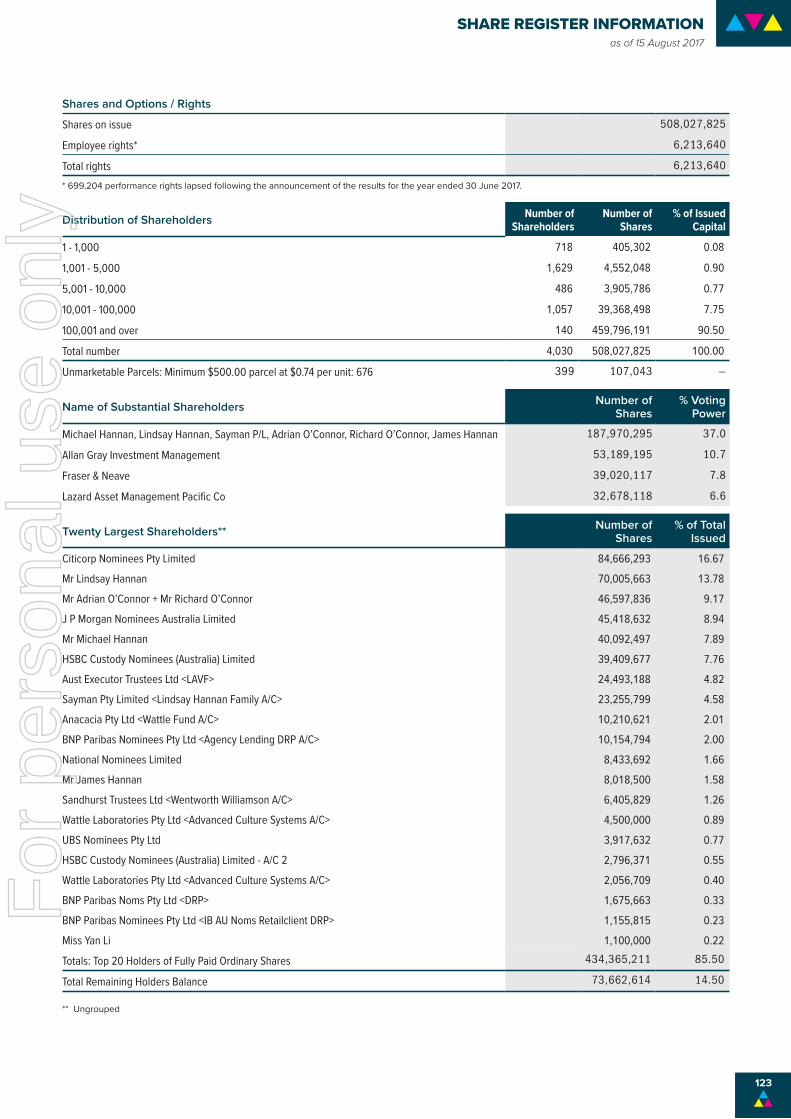
123
SHARE REGISTER INFORMATIONas of 15 August 2017
123
Shares and Options / Rights
Shares on issue 508,027,825
Employee rights* 6,213,640
Total rights 6,213,640
* 699,204 performance rights lapsed following the announcement of the results for the year ended 30 June 2017.
Distribution of Shareholders Number of Shareholders
Number of Shares
% of Issued Capital
1 - 1,000 718 405,302 0.08
1,001 - 5,000 1,629 4,552,048 0.90
5,001 - 10,000 486 3,905,786 0.77
10,001 - 100,000 1,057 39,368,498 7.75
100,001 and over 140 459,796,191 90.50
Total number 4,030 508,027,825 100.00
Unmarketable Parcels: Minimum $500.00 parcel at $0.74 per unit: 676 399 107,043 —
Name of Substantial Shareholders Number of Shares
% Voting Power
Michael Hannan, Lindsay Hannan, Sayman P/L, Adrian O’Connor, Richard O’Connor, James Hannan 187,970,295 37.0
Allan Gray Investment Management 53,189,195 10.7
Fraser & Neave 39,020,117 7.8
Lazard Asset Management Pacific Co 32,678,118 6.6
Twenty Largest Shareholders** Number of Shares
% of Total Issued
Citicorp Nominees Pty Limited 84,666,293 16.67
Mr Lindsay Hannan 70,005,663 13.78
Mr Adrian O’Connor + Mr Richard O’Connor 46,597,836 9.17
J P Morgan Nominees Australia Limited 45,418,632 8.94
Mr Michael Hannan 40,092,497 7.89
HSBC Custody Nominees (Australia) Limited 39,409,677 7.76
Aust Executor Trustees Ltd <LAVF> 24,493,188 4.82
Sayman Pty Limited <Lindsay Hannan Family A/C> 23,255,799 4.58
Anacacia Pty Ltd <Wattle Fund A/C> 10,210,621 2.01
BNP Paribas Nominees Pty Ltd <Agency Lending DRP A/C> 10,154,794 2.00
National Nominees Limited 8,433,692 1.66
Mr James Hannan 8,018,500 1.58
Sandhurst Trustees Ltd <Wentworth Williamson A/C> 6,405,829 1.26
Wattle Laboratories Pty Ltd <Advanced Culture Systems A/C> 4,500,000 0.89
UBS Nominees Pty Ltd 3,917,632 0.77
HSBC Custody Nominees (Australia) Limited - A/C 2 2,796,371 0.55
Wattle Laboratories Pty Ltd <Advanced Culture Systems A/C> 2,056,709 0.40
BNP Paribas Noms Pty Ltd <DRP> 1,675,663 0.33
BNP Paribas Nominees Pty Ltd <IB AU Noms Retailclient DRP> 1,155,815 0.23
Miss Yan Li 1,100,000 0.22
Totals: Top 20 Holders of Fully Paid Ordinary Shares 434,365,211 85.50
Total Remaining Holders Balance 73,662,614 14.50
** Ungrouped
For
per
sona
l use
onl
y

124
ASX Code: PMPInvestor Information Shareholders requiring information should contact the share registry, or:
Geoff Stephenson Chief Financial Officer
Telephone: 02 9412 6000 Email: [email protected]
Shareholder Details PMP shareholders who:
• have changed their name or address
• wish to consolidate two or more separate holdings
• wish to lodge their tax file numbers
• do not wish to receive an Annual Report
should advise PMP’s share registry by completing the relevant forms available from www.computershare.com or by telephoning 1300 556 161 to request the appropriate forms.
Alternatively, shareholders can visit computershare.com.au/easy update/pmp to update their payment details, shareholder communication elections or Tax File Number or exemption details. Shareholders will need to key in their Holder Identification Number (HIN) if their securities are broker-sponsored and held in CHESS, while shareholders with securities held in an issuer-sponsored sub-register will need to key in their Security Reference Number (SRN).
Tax File Numbers It is important that Australian resident shareholders have their tax file number or exemption details noted by the share registry. While it is not compulsory to provide a tax file number or exemption details, PMP is required by law to deduct tax at the top marginal rate from the unfranked part of any dividend paid to Australian resident shareholders who have not supplied these details.
Share Registry Computershare Investor Services Pty Limited
Level 5, 115 Grenfell Street Adelaide SA 5000
GPO Box 1903 Adelaide SA 5001
Enquiries within Australia: 1300 556 161
Enquiries outside Australia: +61 3 9415 4000
Website: www.computershare.com
Receive Information by Email Shareholders can receive notifications about Notice of Meeting and Proxy, Statements, and company announcements, annual and periodic reports and other company information by email.
By registering for this service, shareholders can be kept up to date with significant company announcements as they happen.
To Register Electronically:Visit computershare.com.au/easy update/pmp and follow these easy steps:
Click on Register Your Email Address for shareholder information
Then enter your personal security information:
• Holder Identification Number (HIN) or Security Reference Number (SRN)
• Postcode
• Read and agree with the Terms and Conditions
Click on “Next” and follow the prompts
Chief Entity Auditors Deloitte Touche Tohmatsu
Principal Bankers ANZ Banking Group Limited Commerzbank AG
Shareholder Information
The PMP Limited Annual General Meeting
will be held at 11am on Wednesday 22 November 2017 at:
Deloitte Touche Tohmatsu Level 9 Grosvenor Place, 225 George Street Sydney 2000
Details of the business of the meeting are contained in the separate Notice of Meeting sent to shareholders.
Alistair ClarksonB Com LLB MBA ACIS GradDipACG
COMPANY SECRETARY
For
per
sona
l use
onl
y

Paper sourcing
PMP’s Paper Procurement Policy requires that all paper used by the company is sourced in a sustainable and responsible manner consistent with recognised international standards. This policy enables our customers to have a high level of confidence in the sustainability of their printed communications. When producing this annual report, PMP applied the following additional criteria:-
● Support paper suppliers who are striving to achieve the highest sustainability targets;
● Insist on FSC® Certified paper;
● Offset the life cycle greenhouse gas emissions from the annual report.
The paper used in this report is produced from responsible sources, is manufactured under an ISO14001 compliant environmental management system and uses elemental chlorine free, FSC® certified pulp.
The life cycle greenhouse gas emissions of this annual report were calculated in line with PAS 2050 and offset with Verified Carbon Standard credits.
The 2017 Annual Report was printed by PMP Limited
FSC® C009448
For
per
sona
l use
onl
y

Level 12, 67 Albert Avenue, Chatswood NSW 2067TELEPHONE +61 2 9412 6000 | WEBSITE pmplimited.com.au
ABN 39 050 148 644
For
per
sona
l use
onl
y