for organic compounds electronic supplementary information ... · l-1 for aniline and nitrobenzene,...
TRANSCRIPT
ESI-1
Electronic Supplementary Information (ESI)
Development and Application of Polymeric Electrospun Nanofiber Mats as Equilibrium-Passive Sampler Media for Organic Compounds
Jiajie Qian1, Brandon Jennings2, David M. Cwiertny1,2, and Andres Martinez2,*
1Department of Chemical & Biochemical Engineering.2Department of Civil & Environmental Engineering, IIHR-Hydroscience & Engineering.The University of Iowa, Iowa City, IA, USA.
Corresponding author* Phone (319) 335-5647; FAX: (319) 335-566; e-mail: [email protected]
October 13, 2017
30 pages: 13 figures and 5 tables.
Electronic Supplementary Material (ESI) for Environmental Science: Processes & Impacts.This journal is © The Royal Society of Chemistry 2017

ESI-2
Table of Contents
Material and Methods .........................................................................................................ESI-4
Dissociation Constant (D) calculations...............................................................................ESI-7
Reference ..........................................................................................................................ESI-29
Table of Figures
Figure S1 Set-up of the lab electrospinning apparatus. .....................................................ESI-8
Figure S2 Histograms of four batches of PS fabricated.....................................................ESI-9
Figure S3 Photographs illustrating the handling, manipulation and mechanical strength of a representative PS...............................................................................................................ESI-10
Figure S4 Linear regressions (black=aniline, red=nitrobenzene) between equilibrium partition coefficients and (a) water contact angle and (b) specific surface area. Data are shown for PAN (▲), PMMA (▼), PS (●), and PET (♦). ...........................................................................ESI-11
Figure S5 Comparison of measured equilibrium partition coefficients for (a) aniline and (b) nitrobenzene for all of the ENMs synthetized, and commercially available materials (PS beads, PDMS fiber and LDPE film). ...........................................................................................ESI-12
Figure S6 Uptake curves for selected PCB congeners and dioxin (TCCD) on ENMs. The error bars represent the standard deviation from two replicate uptake experiments. ................ESI-14
Figure S7 Linear regressions (black=PCB1, red=PCB11, green=PCB29, blue=PCB47, pink=PCB121, cyan=PCB136, grey=Dioxin) between equilibrium partition coefficients and (a) water contact angle and (b) surface area of ENMs. ....................................................ESI-15
Figure S8 LogKOW versus logKENM-W for selected PCB congeners (PCBs 1, 11, 29, 47, 121 and 136) and dioxin in PAN, PS, PMMA and PET. The p-value in parenthesis corresponds to the linear regression. ...............................................................................................................ESI-16
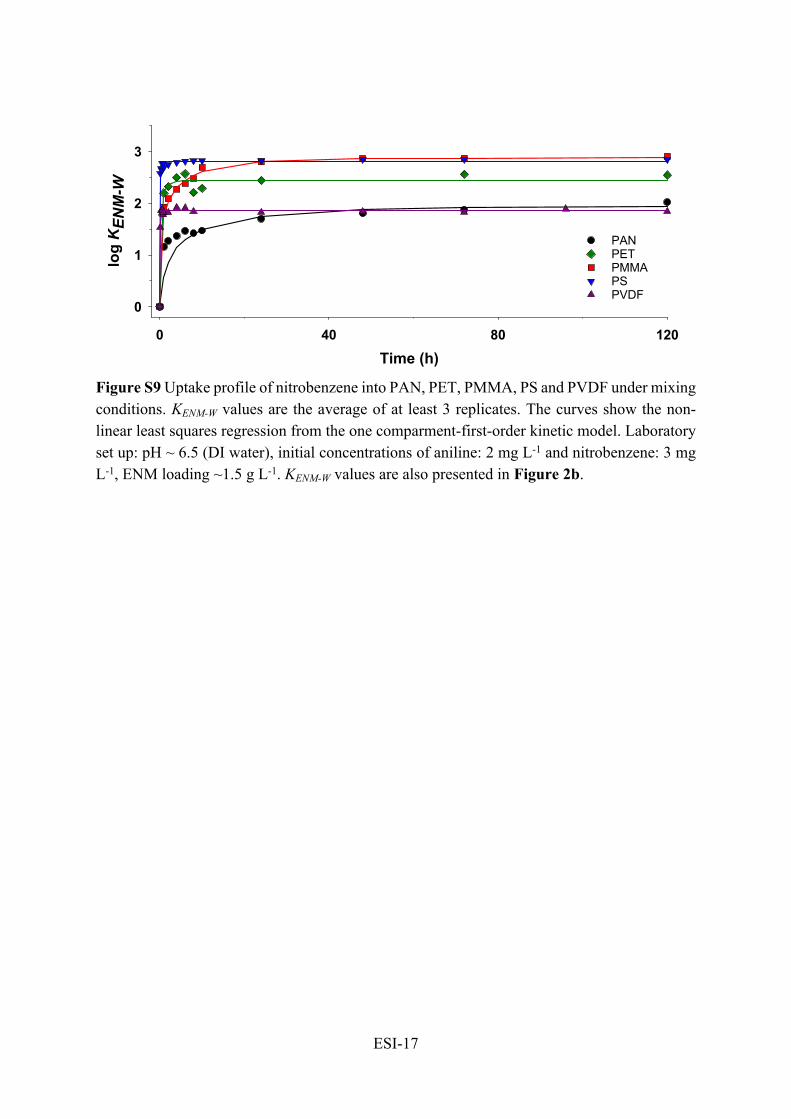
Figure S9 Uptake profile of nitrobenzene into PAN, PET, PMMA, PS and PVDF under mixing conditions. KENM-W values are the average of at least 3 replicates. ...................................ESI-17
Figure S10 ENM-water equilibrium partition coefficients (L kg-1) for aniline (AN) and nitrobenzene (NB) measured as a function of solution pH for PMMA and PS................ESI-18
Figure S11 Sorption isotherms using PAN, PMMA and PS for (a) aniline and (b) nitrobenzene...........................................................................................................................................ESI-19

ESI-3
Figure S12 Photograph sequence of cleaning for PS (top) and PMMA (bottom) after being exposed to model soils for 5 days. ....................................................................................ESI-20
Figure S13 PS and PAN uptake curves for our ten hydrophilic and moderately hydrophobic compounds. .......................................................................................................................ESI-22
Table of Tables
Table S1 Reagents, physical and chemical properties, and electrospinning synthesis parameters for ENMs investigated herein. ..........................................................................................ESI-23
Table S2 Molecular structures and chemical properties of our organic target analyte suite.ESI-24
Table S3 Summary of average measured and predicted ENM-water equilibrium partition coefficients for aniline and nitrobenzene (log units, L kg-1) under mixing and static conditions, as well as predicted t90% for both mixing and static conditions. .......................................ESI-27
Table S4 Summary of average measured ENM-water equilibrium partition coefficients for our hydrophobic model compounds (log units, L kg-1) under mixing conditions. Values represent average from 0.5 to 1 days collection samples. ................................................................ESI-28
Table S5 Comparison of measured and predicted ENM-water equilibrium partition coefficients for nitrobenzene (log units, L kg-1) for different diameter size of PS under no mixing conditions...........................................................................................................................................ESI-28

ESI-4
Material and Methods
Polymers. We fabricated ENMs from the following seven polymers: ethylene-vinyl acetate (EVA); polyacrylonitrile (PAN); polyethylene terephthalate (PET); polymethyl methacrylate (PMMA); polystyrene (PS); polyvinyl acetate (PVAc); and polyvinylidene fluoride (PVDF). All polymeric precursor materials were acquired from Sigma-Aldrich and used as received (Table S1).
Electrospinning. ENMs were fabricated using a custom-built electrospinning apparatus that has been described in detail elsewhere (Figure S1).1 ENM synthesis recipes were adapted from previously published methods.2, 3 All reagents and ENM fabrication parameters are summarized in Table S1. Briefly, polymers were dissolved in an appropriate organic solvent and thermally mixed at 60 °C for 4 h to obtain a homogenous sol-gel as an electrospinning precursor solution. The sol-gel was cooled to room temperature, and transferred into a 12 mL syringe, which was then mounted on a syringe pump. A needle was used to expel the sol-gel, with the needle tip connected to a high-voltage power supply. During synthesis, the flow rate of the sol-gel from the syringe was controlled, as well as the needle-tip voltage. A grounded, rotating metal drum collector (covered with Al foil) was used to collect deposited ENMs, located a fixed distance from the needle tip. All electrospinning was conducted under a controlled environment within a custom environmental chamber, where temperature and humidity were fixed at a desired value between 20 °C to 28 °C and 16% to 20%, respectively. Chemical properties of each fabricated ENM, including the molecular weight and repeating structural units of each polymer, are listed in Table S1.
ENM Characterization. Nanofiber diameters were measured from scanning electron microscopy (SEM) and analysis of resulting SEM images using ImageJ software. Typically, 100 nanofiber diameters were measured per ENM sample, allowing size distributions with mean and standard deviation (i.e., histograms of nanofiber diameters) to be quantified. Specific surface area of ENMs was measured using a Micromeritics ASAP 2020 surface area and pore size analyzer (N2-BET). The water contact angle, which uses wettability to assess ENM hydrophobicity/hydrophilicity, was obtained using a Rame-Hart model 100 contact angle goniometer equipped with a Thor Laboratories 6-60× magnification microscope lens and high-resolution CMOS camera. For this analysis, 10 µL of DI water was used as the wetting liquid, dispensed and collected by an Eppendorf EDOS 5222 Electronic Dispensing System at 1 µL s−1. If the angle between the material and the water drop is lower than 90º, the material is considered hydrophilic, and if the angle is more than 90º, the material is considered hydrophobic. Stability of ENMs during analytical processing (e.g., solvent extraction) was also examined across a range of pH values (2 to 12) and in various organic solvents (e.g., methanol, acetonitrile).
Target Compounds. The suite of hydrophilic and moderately hydrophobic (i.e., log KOW ranging from -0.07 to 4.5) target chemicals consisted of aniline, anisole, atrazine, caffeine,

ESI-5
benzylamine, diuron, β-Estradiol, nitrobenzene, phenol, p-nitrophenol, trinitrotoluene (TNT) and 1, 3, 5-Trinitroperhydro-1, 3, 5-triazine (RDX), all of which were purchased from Sigma-Aldrich (with purity ≥ 98%). Stock solutions (from 1.1-6,800 µg L-1) for each compound were prepared in deionized (DI) water. The hydrophobic chemical suite consisted of PCB1, PCB11, PCB29, PCB47, PCB121, PCB136, PCB187, PCB206, PCB209 and 2,3,7,8-tetrachlorodibenzodioxin (dioxin), all purchased from AccuStandard, Inc. A mixed stock solution (100 - 2,000 mg L-1) for PCBs was prepared in hexane, as well as for dioxin (200 mg L-1). Solvents were purchased from Sigma-Aldrich and Fisher chemical (purity ≥ 99% in all cases). Table S2 summarizes key chemical properties for the target chemicals.
Sorption Experiments. Experiments used an initial aqueous concentration of ~ 2.8 mg L-1 for aniline and nitrobenzene, and 0.1 to 100 ng L-1 for PCBs and dioxin. Amber glass vials were filled completely with solution (i.e., ~40 mL so that there was no headspace) and ~0.05 g of ENM was added (~ 20 cm2). Vials were then sealed with Teflon-lined screw caps and placed on a rotator on which they were tumbled slowly end-over-end (~ 8 rpm). Samples were periodically collected for measurement of both the aqueous and sorbed phase concentrations after 3, 7, and 11 h, and 1, 2, 3 and 5 d for aniline and nitrobenzene. A shorter sampling interval of 3, 5, and 8 h and 1 day was used for PCBs and dioxin.
For select ENMs with optimal performance, additional uptake studies were conducted. To complement actively mixed experiments, studies considered uptake rates in static systems (i.e., without mixing) for aniline and nitrobenzene were carried out. These were conducted over 8 days to measure partitioning under conditions most representative of passive sampling applications. We also explored the influence of ENM surface area-to-volume ratio (S/V) by exploring nitrobenzene uptake as a function of the nanofiber diameter (which was tuned by varying polymer concentration in the sol-gel and humidity during synthesis).
Aniline and nitrobenzene sorption was also measured across a range of pH values (from 5.5 to 9), where solutions buffered at pH 5.5 and 6 used 10 mM of 2-(N-morpholino) ethanesulfonic acid buffer, at pH 7 and 8 used 10 mM of 2- [4-(2-hydroxyethyl) piperazin-1-yl] ethanesulfonic acid, and at pH 9 used 5 mM of sodium borate buffer. To determine ENM capacity, sorption isotherm experiments were also conducted with aniline and nitrobenzene. These experiments followed the aforementioned protocol for rate experiments, but the initial aqueous concentration of each compound was varied from 1 to 29 mg L-1 at a fixed ENM loading (0.05 g).
Optimal ENMs were also used to measure uptake of our entire suite of hydrophilic and moderately hydrophobic compound targets. These compounds were tested with an initial concentration between 2.3 and 6.8 mg L-1 at pH ~ 6.5 (in DI water). The testing period varied from 3 to 8 days depending on the equilibrium time for each chemical.
Uptake Experiments in Soil and Sediment Systems. To evaluate optimal ENM performance under environmentally relevant conditions, uptake experiments were conducted in systems containing a model soil amended with nitrobenzene. Experiments used a sandy loam commercially acquired through AGVISE laboratories (Northwood, ND and Benson, MN)

ESI-6
marketed as “LBLS”, which contained an organic carbon fraction of 3%.4 The soil was first mixed with DI water (50% v/v), and then sterilized with 30 mM of sodium azide (NaN3) while mixing for 2 weeks. After this time period, the soil was spiked with nitrobenzene to achieve an initial concentration of ~ 10 mg L-1. The suspension was once again tumbled for two additional weeks to achieve solid-water equilibrium partitioning for nitrobenzene. Using these equilibrated systems, 30 g of wet soil was then combined with ~0.05 g of ENM in a clean amber glass vial. After ENM addition, vials were tumbled end-over-end, and samples were collected after 5, 10, 15, 20 and 25 days.
At each sampling point, the ENM was removed, gently wiped with a paper towel to remove superficial residual soil, and rinsed with a small volume (~ 50 to 100 mL) of DI water. We note that to confirm removal of soil via this wiping and washing procedure, SEM images of cleaned ENMs were collected. Moreover, samples of the DI wash water were collected for analysis to measure any loss of target analyte through this cleaning procedure. After cleaning, ENMs were analyzed for sorbed nitrobenzene concentration as described before.
As a final performance test of our ENMs, sediment pore water measurements from highly PCB contaminated sediments collected from the Indiana Harbor and Ship Canal (IHSC), Indiana were carried out. We have previously measured and reported the PCB sediment pore water concentrations using PDMS fiber.5 Sampling and handling of the sediments are presented in details elsewhere.5 Around 0.1 g of ENM was placed in clean amber glass bottle (250 mL) with Teflon liner cap, with sediment and deionized water (~100 g), and gentle shaken (80 rpm and ~25°C) for 28 days.
Analytical Methods. High performance liquid chromatography with diode array detector (LC/DAD, Agilent 1100 Series HPLC) was used to measure hydrophilic and moderately hydrophobic compounds in both the aqueous phase and in ENM extracts corresponding to the sorbed phase. All analyses followed previously published methods.6-13 For aqueous phase analysis, 1 mL of aqueous sample was transferred to an amber autosampler vial, and immediately analyzed. For analysis of the sorbed phase, ENM-bound mass was extracted by mixing the ENM with 10 mL of methanol for 2 d, after which 1 mL of methanol was collected and analyzed.
PCBs and dioxin were measured using a published method from our group that is also used by others.5, 14 For the aqueous phase, 20 mL of sample was spiked with 25 ng of a PCB solution (PCB14, PCB65-d and PCB166) as a surrogate standard. The surrogate congeners were used to estimate any losses during the cleanup and extraction procedures. The mixture was vortexed for 1 minute and subsequently mixed with 8 mL of hexane. This solution was tumbled for 5 minutes, after which the hexane layer was separated from the water. The extracted hexane was concentrated using a Turbo Vap unit to around 0.5 mL and transferred to a gas chromatography (GC) vial. An internal standard consisting of 50 ng of PCB30-d and PCB204 was spiked into this concentrated solution. For analysis of the sorbed phase, the ENM was first spiked with 25 ng of a PCB surrogate standard and then tumbled with 40 mL of hexane for 12 h. The hexane was recovered via pipette and concentrated using a Turbo Vap unit to approximately 1 mL. An internal standard consisting of 50 ng of PCB30-d and PCB204 was

ESI-7
then spiked into this concentrated solution. PCBs and dioxin were then measured using gas chromatography with tandem mass spectrometry (GC-MS/MS, Agilent 7000) in multiple reaction monitoring mode.
QA/QC. Laboratory blanks consisted of DI water, methanol, hexane and unused ENMs were analyzed in parallel with experimental samples. No contamination was found in any of the blanks analyzed. Further, a mass balance approach was carried out to calculate recoveries of aniline, nitrobenzene, PCBs and dioxin. In general, recoveries ranged from 50% to 110% through all the experiments. In the case of replicated measurements of aniline, nitrobenzene, PCBs and dioxin in the aqueous phase of ENM-containing systems, a relative standard deviation (RSD) of 7%, 3%, 16% and 16% were obtained, respectively. Because we used an internal standard method to quantify PCBs and dioxin, we also determined the recoveries of the surrogate standards that were spiked into our samples prior to sample extraction and cleanup. For these compounds, the recoveries of PCB14, PCB-d65 and PCB166 averaged 87 ± 7%, 85 ± 9% and 88 ± 6%, respectively.
Dissociation Constant (D) calculations
The dissociation constant (D) calculations were obtained from the following expressions, 15 and used in Figure 7.
𝐷𝐵𝑎𝑠𝑒=𝐾𝑂𝑊
(1 + 10𝑝𝐾𝑎 ‒ 𝑝𝐻)
𝐷𝐴𝑐𝑖𝑑=𝐾𝑂𝑊
(1 + 10𝑝𝐻 ‒ 𝑝𝐾𝑎)

ESI-8
Figure S1 Set-up of the lab electrospinning apparatus. Left cartoon shows a schematic of an electrospinning apparatus, including high-voltage power supply, spinneret (metallic needle), collector (aluminum foil or metallic drum) and syringe pump. Right photograph shows the laboratory scale electrospinning apparatus used to fabricate all ENMs tested herein.

ESI-9
0 100 200 3000
25
50
0 100 200 3000
25
500 100 200 300
0
25
50
Nanofiber diameter (nm)0 100 200 300
Freq
uenc
y
0
25
50
PS batch 1
PS batch 3
PS batch 2
PS batch 4
Figure S2 Histograms of four batches of PS fabricated. Diameters for at least 100 individual nanofibers within ENMs were quantified via SEM to produce these distributions.

ESI-10
Figure S3 Photographs illustrating the handling, manipulation and mechanical strength of a representative PS.

ESI-11
ENM water contact angle (o)20 40 60 80 100 120 140 160
log
KEN
M-W
0.00.51.01.52.02.53.03.5
Nitrobenzene (p = 0.25)Aniline (p = 0.0029) (a)
ENM surface Area (m2 g-1)0 10 20 30 40
log
K ENM
-W
0.00.51.01.52.02.53.03.5
Nitrobenzene (p = 0.6)Aniline (p = 0.1) (b)
Figure S4 Linear regressions (black=aniline, red=nitrobenzene) between equilibrium partition coefficients and (a) water contact angle and (b) specific surface area. Data are shown for PAN (▲), PMMA (▼), PS (●), and PET (♦). The p-values of the slopes from the regressions are shown as p. Significant is considered with a p-value < 0.05.

ESI-12
PANPMMA
PET PSPVDF
PS bead
s
SPME (PDMS fib
er)
PE film (2
5.4 um
)
log
KEN
M-W
0
1
2
3a) Aniline
PMMA PSPET
EVAPAN
PVDF
PS bead
s
SPME (PDMS fib
er)
PE film (2
5.4 um
)
log
KEN
M-W
0
1
2
3
4b) Nitrobenzene
Figure S5 Comparison of measured equilibrium partition coefficients for (a) aniline and (b) nitrobenzene for all of the ENMs synthetized, and commercially available materials (PS beads, PDMS fiber and LDPE film). Laboratory set up: pH ~ 6.5 (DI water), initial concentrations of aniline: 2 mg L-1 and nitrobenzene: 3 mg L-1, sorbent loading ~1.5 g L-1, equilibration time 4 days.

ESI-13
Time (d)0.0 0.2 0.4 0.6 0.8 1.0 1.2
log
KEN
M-W
0
1
2
3
4
5
6
PAN PMMA PS PET
PCB1
Time (d)0.0 0.2 0.4 0.6 0.8 1.0 1.2
log
KEN
M-W
0
1
2
3
4
5
6
PAN PMMA PS PET
PCB11
Time (d)0.0 0.2 0.4 0.6 0.8 1.0 1.2
log
K ENM
-W
0
1
2
3
4
5
6
PAN PMMA PS PET
PCB29
Time (d)0.0 0.2 0.4 0.6 0.8 1.0 1.2
log
KEN
M-W
0
1
2
3
4
5
6
PAN PMMA PS PET
PCB47
Time (d)0.0 0.2 0.4 0.6 0.8 1.0 1.2
log
K ENM
-W
0
1
2
3
4
5
6
7
PAN PMMA PS PET
PCB121
Time (d)0.0 0.2 0.4 0.6 0.8 1.0 1.2
log
K ENM
-W
0
2
4
6
8
PAN PMMA PS PET
PCB136
Time (d)0.0 0.2 0.4 0.6 0.8 1.0 1.2
log
K ENM
-W
0
1
2
3
4
5
6
PAN PMMA PS PET
PCB187
Time (d)0.0 0.2 0.4 0.6 0.8 1.0 1.2
log
K ENM
-W
0
1
2
3
4
5
6
PAN PMMA PS PET
PCB206

ESI-14
Time (d)0.0 0.2 0.4 0.6 0.8 1.0 1.2
log
K ENM
-W
0
1
2
3
4
5
6
PAN PMMA PS PET
PCB206
Time (d)0.0 0.2 0.4 0.6 0.8 1.0 1.2
log
K ENM
-W
0
1
2
3
4
5
6
7
PAN PMMA PS PET
Dioxin
Figure S6 Uptake curves for selected PCB congeners and dioxin (TCCD) on ENMs. The error bars represent the standard deviation from two replicate uptake experiments. Laboratory set up: pH ~ 6.5 (DI water), initial concentrations from 0.25 to 5 ng L-1, ENM loading ~ 3 g L-1. Please note the difference in the y-axis scale. Lines simply connect data points.

ESI-15
Water Contact Angle (o)20 40 60 80 100 120 140
log
KEN
M-W
2
3
4
5
6
7
8PCB1 (p = 0.02)PCB11 (p = 0.002 )PCB29 (p = 0.001) PCB47 (p = 0.02)PCB121 (p = 0.01)PCB136 (p= 0.2)Dioxin (p = 0.4)
(a)
Surface Area (m2 g-1)0 10 20 30 40
log
KEN
M-W
2
3
4
5
6
7
8
PCB 1 (p = 0.3)PCB 11 (p = 0.3)PCB 29 (p = 0.5)PCB 47 (p = 0.8)PCB 121 (p = 0.7)PCB 136 (p = 0.8)Dioxin (p = 0.9)
(b)
Figure S7 Linear regressions (black=PCB1, red=PCB11, green=PCB29, blue=PCB47, pink=PCB121, cyan=PCB136, grey=Dioxin) between equilibrium partition coefficients and (a) water contact angle and (b) surface area of ENMs. Data are shown for PAN (▲), PMMA (▼), PS (●), and PET (♦). The p-values of the slopes from the regressions are shown as p. Significant is considered with a p-value < 0.05, and are in bold.

ESI-16
4 5 6 7
log
KEN
M-W
3
4
5
6
7PAN (p = 0.0006)
4 5 6 73
4
5
6
7PS (p = 0.048)
log Kow4 5 6 7
log
KEN
M-W
3
4
5
6
7PMMA (p = 0.008)
log Kow4 5 6 7
3
4
5
6
7PET (p = 0.007)
Figure S8 LogKOW versus logKENM-W for selected PCB congeners (PCBs 1, 11, 29, 47, 121 and 136) and dioxin in PAN, PS, PMMA and PET. The p-value in parenthesis corresponds to the linear regression.
ESI-17
Time (h)0 40 80 120
log
KEN
M-W
0
1
2
3
PAN
PMMA PS
PET
PVDF
Figure S9 Uptake profile of nitrobenzene into PAN, PET, PMMA, PS and PVDF under mixing conditions. KENM-W values are the average of at least 3 replicates. The curves show the non-linear least squares regression from the one comparment-first-order kinetic model. Laboratory set up: pH ~ 6.5 (DI water), initial concentrations of aniline: 2 mg L-1 and nitrobenzene: 3 mg L-1, ENM loading ~1.5 g L-1. KENM-W values are also presented in Figure 2b.

ESI-18
pH5 6 7 8 9 10
log
KEN
M-W
1.0
1.5
2.0
2.5
3.0
3.5
PS-AN
PMMA-AN
PS-NB
PMMA-NB
Figure S10 ENM-water equilibrium partition coefficients (L kg-1) for aniline (AN) and nitrobenzene (NB) measured as a function of solution pH for PMMA and PS. Laboratory set up: initial aniline and nitrobenzene concentrations 2 mg L-1 and 3 mg L-1, respectively, ENM loading ~1.5 g L-1. Experiments were performed for 5 days. pH was controlled using commercially available buffers (MES, HEPES, AMPSO and BioXtra).

ESI-19
Cw (mg L-1)0 5 10 15 20
CE
NM (m
g g-
1 E
NM
)0.0
0.5
1.0
1.5
2.0
2.5
Cw (mg L-1)0 5 10 15 20
CEN
M (m
g g-
1 EN
M)
0.0
0.5
1.0
1.5
2.0
2.5
PSPMMAPAN
a) aniline
Cw (mg L-1)0 5 10 15 20 25 30
CE
NM (m
g g-
1 E
NM
)
0
2
4
6
8
10
Cw (mg L-1)0 5 10 15 20 25 30
CEN
M (m
g g-
1 EN
M)
0
2
4
6
8
10
PSPMMA PAN
b) nitrobenzene
Figure S11 Sorption isotherms using PAN, PMMA and PS for (a) aniline and (b) nitrobenzene. All linear regressions are statistically significant (p > 0.001). Calculated KENM-W values from the slopes are presented in Table S3. Initial aqueous concentrations for aniline were 1 - 20 mg L-1 and nitrobenzene were 1 – 29 mg L-1. Uncertainties represent the standard deviation from two replicate uptake experiments. When no uncertainty is visible, the bars are smaller than the data symbol.

ESI-20
PS
PMMA
Figure S12 Photograph sequence of cleaning for PS (top) and PMMA (bottom) after being exposed to model soils for 5 days. SEM image confirmation was not possible to perform to PMMA due to the amount of soil/organic particles attached to it.

ESI-21
Time (days)0 3 6 9
log
KEN
M-W
0.0
0.4
0.8
1.2
1.6
2.0
PANPS
Caffeine
Time (days)0 3 6 9
log
KEN
M-W
0.0
0.4
0.8
1.2
1.6
2.0
PANPS
p-Nitrophenol
Time (days)0 3 6 9
log
KEN
M-W
0.0
0.5
1.0
1.5
2.0
2.5
3.0
3.5
PANPS
Anisole
Time (days)0 3 6 9
log
KEN
M-W
0.0
0.4
0.8
1.2
1.6
2.0
PANPS
Atrazine
Time (days)0 3 6 9
log
KEN
M-W
0.0
0.4
0.8
1.2
1.6
2.0
2.4
2.8
PANPS
Benzylamine
Time (days)0 3 6 9
log
KEN
M-W
0.0
0.4
0.8
1.2
1.6
2.0
PANPS
Diuron
Time (days)0 3 6 9
log
KEN
M-W
0.0
0.4
0.8
1.2
1.6
2.0
PANPS
Phenol
Time (days)0 3 6 9
log
KEN
M-W
0.0
0.5
1.0
1.5
2.0
2.5
3.0
3.5
PANPS
-Estradiol

ESI-22
Time (d)0 3 6 9
log
KEN
M-W
0.0
0.5
1.0
1.5
2.0
2.5
3.0
PANPS
TNT
Time (d)0 3 6 9
log
KEN
M-W
0.0
0.5
1.0
1.5
2.0
2.5
PANPS
RDX
Figure S13 PS and PAN uptake curves for our ten hydrophilic and moderately hydrophobic compounds. The error bars represent the standard deviation from two replicate uptake experiments. Laboratory set up: pH ~ 6.5 (DI water), initial concentrations from 2.4 to 6.8 mg L-1, ENM loading ~ 1.5 g L-1. Please note the different in the y-axis scale.

ESI-23
Table S1 Reagents, physical and chemical properties, and electrospinning synthesis parameters for ENMs investigated herein.
Reagent Details PAN PS PMMA PET PVDFPhysical and Chemical Properties of Polymers
Repeating
structural unit
Ave. Mw ~150,000 ~280,000 ~996,000 n.m. ~534,000
Monomer
formulaC3H3N C8H8 C5H8O2
C8H6O4
And C2H6O2C2H2F2
Hydrogen bond* H-acceptor (1) No H-acceptor (2) H-acceptor (4) H-acceptor (2)
O or N content (w
%)26 0 32 33 0
Aromatic bond** 0 6 0 6/0 0
Density (g/cm3) 1.2 1.0 1.2 1.4 1.8
Hydrophobicity of
functional groupHydrophilic Hydrophobic Hydrophilic Hydrophobic Hydrophobic
ENM
hydrophobicity
(measured water
contact angle)
Hydrophilic Hydrophobic Hydrophobic Hydrophobic Hydrophobic
Electrospinning Receipt and Synthesis Parameters
Solvent (v/v) DMF DMF 5:1 DMF: GAA 1:1 DCM:TFA25:9
Acetone : DMA
Polymer to
solvent ratio (w/w)0.087 0.11 0.071 0.071 0.14
Polymer weight
(%)8 10 6.6 6.6 12
Distance needle-
collector (cm)10 10 10 10 10
Voltage (kV) 13 17 9 16 22
Pump flow (mL/h) 0.5 0.3 0.3 0.4 0.7
Needle gauge size 25G 25G 25G 23G 25G
*Hydrogen bond is a chemical bond in which a hydrogen atom of one molecule is attracted to an electronegative atom, especially a nitrogen, oxygen or fluorine atom, usually of another molecule. The numbers of electronegative atoms that accept covalent bonds in each polymer repeat unit are listed in parentheses.16
**Based on Hückel's rule, the numbers of aromatic bond are counted by delocalized electrons in each polymer repeat unit.

ESI-24
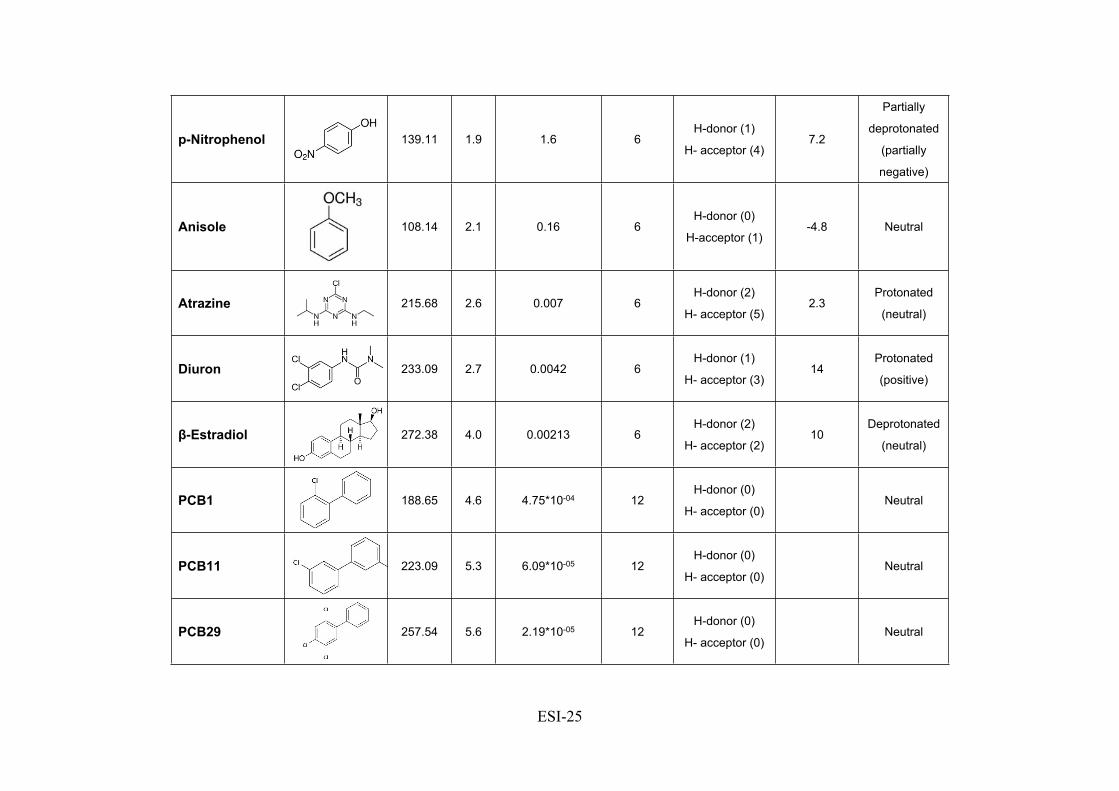
Table S2 Molecular structures and chemical properties of our organic target analyte suite.
Compound StructureMW
(g mol-1)
Log
Kow
Water solubility
(room
temperature)
(g 100 mL-1)
Aromatic
bonds
Hydrogen
bonds
(count)*
pKas
(25 °C)
Charge
@ pH ≈ 6.5
Caffeine 194.19 -0.07 2 10H-donor (0)
H-acceptor (6)0.52, 14 ** Neutral
RDX 222.12 0.9 0.004 0H-donor (0)
H-acceptor (12)-15 Neutral
Aniline 93.13 0.9 3.6 6H-donor (2)
H- acceptor (1)4.9
Protonated
(neutral)
Benzylamine 107.16 1.1 100 6H-donor (2)
H- acceptor (1)9.1
Protonated
(positive)
Phenol 94.11 1.5 8.2 6H-donor (1)
H- acceptor (1)9.9
Deprotonated
(neutral)
TNT 227.13 1.6 0.013 6H-donor (0)
H-acceptor (9)0.65, 12.0** Neutral
Nitrobenzene 123.06 1.9 0.2 6H-donor (0)
H-acceptor (3)4.0 (0 °C) Neutral
ESI-25
p-Nitrophenol 139.11 1.9 1.6 6H-donor (1)
H- acceptor (4)7.2
Partially
deprotonated
(partially
negative)
Anisole 108.14 2.1 0.16 6H-donor (0)
H-acceptor (1)-4.8 Neutral
Atrazine 215.68 2.6 0.007 6H-donor (2)
H- acceptor (5)2.3
Protonated
(neutral)
Diuron 233.09 2.7 0.0042 6H-donor (1)
H- acceptor (3)14
Protonated
(positive)
β-Estradiol 272.38 4.0 0.00213 6H-donor (2)
H- acceptor (2)10
Deprotonated
(neutral)
PCB1 188.65 4.6 4.75*10-04 12H-donor (0)
H- acceptor (0)Neutral
PCB11 223.09 5.3 6.09*10-05 12H-donor (0)
H- acceptor (0)Neutral
PCB29 257.54 5.6 2.19*10-05 12H-donor (0)
H- acceptor (0)Neutral

ESI-26
PCB47 291.99 5.9 7.45*10-06 12H-donor (0)
H- acceptor (0)Neutral
PCB121 326.43 6.6 2.62*10-06 12H-donor (0)
H- acceptor (0)Neutral
PCB136 360.88 6.2 2.73*10-06 12H-donor (0)
H- acceptor (0)Neutral
PCB187 395.32 7.2 8.65*10-07 12H-donor (0)
H- acceptor (0)Neutral
PCB206 464.21 8.1 5.67*10-08 12H-donor (0)
H- acceptor (0)Neutral
PCB209 498.66 8.2 2.65*10-08 12H-donor (0)
H- acceptor (0)Neutral
Dioxin 321.97 6.8 2.0E*10-08 12H-donor (0)
H- acceptor (2)Neutral
* Hydrogen bond is a chemical bond in which a hydrogen atom of one molecule is attracted to an electronegative atom, especially a nitrogen, oxygen or fluorine atom, usually of another molecule. The numbers of electronegative atoms that accept covalent bonds and electropositive hydrogen atoms that participate covalent bonds in each chemical are listed in this table.** Caffeine and TNT contain a weak base and a weak acid corresponding to pKa values of 0.52 and 14, and 0.65 and 12, respectively.

ESI-27
Table S3 Summary of average measured and predicted ENM-water equilibrium partition coefficients for aniline and nitrobenzene (log units, L kg-1) under mixing and static conditions, as well as predicted t90% for both mixing and static conditions. For aniline and nitrobenzene, values were also calculated from the sorption isotherms for PAN, PMMA and PS (Figure S11).
ENM AnilineLog KENM-W (L kg-1) t90% (d)
Measured(n = 10) a
Measuredstatic (n ≥ 3)
Isotherm b Modelmixing
Modelstatic
Mixing Static
PAN 1.9 ± 0.06 2.1 ± 0.04 1.8 ± 0.6 1.9 ± 0.04 2.1 ± 0.03 2.2 ± 0.4 2.4 ± 0.2
PMMA 1.7 ± 0.1 1.9 ± 0.06 2.1 ± 1.0 1.8 ± 0.05 2.0 ± 0.02 7.3 ± 1.2 12 ± 0.6
PS 1.5 ± 0.03 1.5 ± 0.02 1.7 ± 1.0 1.5 ± 0.03 1.5 ± 0.02 0.01 ± 0.01 0.01 ± 0.01
PET 1.7 ± 0.04 1.6 ± 0.01 0.01 ± 0.01
PVDF 0.9 ± 0.1 1.0 ± 0.02 0.3 ± 0.07
NitrobenzeneLog KENM-W (L kg-1) t90% (d)
Measured(n = 10) a
Measuredstatic (n ≥ 3)
Isotherm b Modelmixing
Modelstatic
Mixing Static
PAN 1.9 ± 0.1 1.9 ± 0.08 1.8 ± 0.3 1.9 ± 0.01 2.0 ± 0.03 0.1 ± 0.03 0.4 ± 0.2
PMMA 2.8 ± 0.2 2.9 ± 0.05 2.9 ± 1.1 2.9 ± 0.01 3.0 ± 0.02 1.2 ± 0.06 4.5 ± 0.6
PS 2.8 ± 0.01 2.9 ± 0.09 2.6 ± 1.2 2.8 ± 0.01 2.8 ± 0.02 0.03 ± 0.01 0.1 ± 0.01
PET 2.4 ± 0.09 2.5 ± 0.02 0.1 ± 0.01
PVDF 1.8 ± 0.06 1.9 ± 0.01 0.02 ± 0.01a Equilibrium partition coefficients were calculated from the average data collected from 2 to 5 days under mixing conditions. b From linear regression from the sorption isotherms, Figure S11. Linear regressions yielded very strong correlations (R2 ≥ 0.93, p < 0.0001) with the exception of aniline sorbed to PS, which was also statistical significant (R2 = 0.7, p = 0.0004), but not as strong as the other correlations.

ESI-28
Table S4 Summary of average measured ENM-water equilibrium partition coefficients for our hydrophobic model compounds (log units, L kg-1) under mixing conditions. Values represent average from 0.5 to 1 days collection samples.
Compound PAN PMMA PS PET PVDFPCB1 (n=3) 3.5 ± 0.2 4.9 ± 0.5 4.9 ± 0.1 3.9 ± 0.3 n.m.
PCB11 (n=3) 3.7 ± 0.4 5.3 ± 0.3 5.2 ± 0.4 4.8 ± 0.2 n.m.
PCB29 (n=3) 4.0 ± 0.2 5.3 ± 0.2 5.3 ± 0.4 4.8 ± 0.2 n.m.
PCB47 (n=3) 4.2 ± 0.5 4.9 ± 0.2 4.9 ± 0.4 4.8 ± 0.03 n.m.
PCB121 (n=3) 4.5 ± 0.4 5.7 ± 0.3 5.6 ± 0.5 5.1 ± 0.2 n.m.
PCB136 (n=3) 4.7 ± 0.5 6.2 ± 0.7 6.0 ± 0.4 4.9 ± 0.2 n.m.
PCB187 (n=3) 5.0 ± 0.4 4.7 ± 0.5 5.2 ± 0.3 4.6 ± 0.4 n.m.
PCB206 (n=3) 4.3 ± 0.2 4.6 ± 0.4 4.4 ± 0.4 3.9 ± 0.5 n.m.
PCB209 (n=3) 3.6 ± 0.3 3.8 ± 0.4 3.5 ± 0.4 3.2 ± 0.2 n.m.
Dioxin (n=4) 4.5 ± 0.3 6.4 ± 0.1 5.3 ± 0.3 4.5 ± 0.1 n.m.
Table S5 Comparison of measured and predicted ENM-water equilibrium partition coefficients for nitrobenzene (log units, L kg-1) for different diameter size of PS under no mixing conditions.
Log KENM-W (L kg-1) t90%Nanofiber Diameter (nm) Measured Model (d)140 a 2.8 ± 0.01 2.8 ± 0.01 0.03 ± 0.01
140 2.9 ± 0.09 2.8 ± 0.02 0.1 ± 0.01
300 2.7 ± 0.1 2.8 ± 0.01 0.2 ± 0.02
560 2.8 ± 0.1 2.8 ± 0.01 0.5 ± 0.07a Experiments performed under mixing conditions (Table S3).

ESI-29
Reference1. Peter, K. T.; Vargo, J. D.; Rupasinghe, T. P.; De Jesus, A.; Tivanski, A. V.; Sander, E.
A.; Myung, N. V. and Cwiertny, D. M., Synthesis, Optimization, and Performance Demonstration of Electrospun Carbon Nanofiber-Carbon Nanotube Composite Sorbents for Point-of-Use Water Treatment, ACS Appl. Mater. Interfaces, 2016, 8, 11431-11440.
2. Huang, Z. M.; Zhang, Y. Z.; Kotaki, M. and Ramakrishna, S., A review on polymer nanofibers by electrospinning and their applications in nanocomposites, Compos Sci Technol, 2003, 63, 2223-2253.
3. Persano, L.; Camposeo, A.; Tekmen, C. and Pisignano, D., Industrial Upscaling of Electrospinning and Applications of Polymer Nanofibers: A Review, Macromol Mater Eng, 2013, 298, 504-520.
4. Qu, S.; Kolodziej, E. P. and Cwiertny, D. M., Sorption and Mineral-Promoted Transformation of Synthetic Hormone Growth Promoters in Soil Systems, J. Agric. Food Chem., 2014, 62, 12277-12286.
5. Martinez, A.; O'Sullivan, C.; Reible, D. and Hornbuckle, K. C., Sediment pore water distribution coefficients of PCB congeners in enriched black carbon sediment, Environ Pollut, 2013, 182, 357-363. PMID: 23974165: PMC23833079.
6. Wolfe, N. L.; Carreira, L. H. and Delgado, M. C., Method and composition for remediating environmental contaminants, Journal, 2000.
7. Riggin, R. M.; Lucas, S. V.; Cole, T. F. and Birts, M. A., Analytical procedures for aniline and selected derivatives in wastewater and sludge, Battelle, 1984.
8. Paruta, A. N. and Irani, S. A., Solubility profiles for the xanthines in aqueous alcoholic mixtures. I. Ethanol and methanol, J. Pharm. Sci., 1966, 55, 1055-1059.
9. Van Boven, M.; Laruelle, L. and Daenens, P., HPLC analysis of diuron and metabolites in blood and urine, J Anal Toxicol, 1990, 14, 231-234.
10. Cledera-Castro, M. d. M.; Santos-Montes, A. M. and Izquierdo-Hornillos, R., Method development and validation for phenol and nitrophenols in tap water by HPLC using a monolithic column, LC-GC Eur, 2006, 19, 424-426,428-431.
11. Lang, M. J. and Burns, S. E., Improvement of EPA method 8330: complete separation using a two-phase approach, J. Chromatogr. A, 1999, 849, 381-388.
12. Euerby, M. and Petersson, P., Chromatographic classification and comparison of commercially available reversed-phase liquid chromatographic columns using principal component analysis, J. Chromatogr. A, 2003, 994, 13-36.
13. Guermouche, M. H.; Habel, D. and Guermouche, S., Theoretical aspects of micellar liquid chromatography using C(12)DAPS surfactant, Fluid Phase Equilib., 1998, 147, 301-307.
14. Lambert, M. K.; Friedman, C.; Luey, P. and Lohmann, R., Role of Black Carbon in the Sorption of Polychlorinated Dibenzo-p-dioxins and Dibenzofurans at the Diamond Alkali Superfund Site, Newark Bay, New Jersey, Environ Sci Technol, 2011, 45, 4331-4338.
15. Magner, J. A.; Alsberg, T. E. and Broman, D., Evaluation of Poly(ethylene-co-vinyl

ESI-30
acetate-co-carbon monoxide) and Polydimethylsiloxane for equilibrium sampling of polar organic contaminants in water, Environ Toxicol Chem, 2009, 28, 1874-1880.
16. Kim, S.; Thiessen, P. A.; Bolton, E. E.; Chen, J.; Fu, G.; Gindulyte, A.; Han, L.; He, J.; He, S.; Shoemaker, B. A.; Wang, J.; Yu, B.; Zhang, J. and Bryant, S. H., PubChem Substance and Compound databases, Nucleic Acids Research, 2016, 44, D1202-D1213.