for natalia, pablo and cintia
TRANSCRIPT
FOR NATALIA, PABLO AND CINTIA

DECLARATION
I declare that this thesis was composed by me and is a report of my
analyses of data which were collected by members of the staff of the ARC
Animal Breeding Research Organisation.
Andres E. Carden
University of Edinburgh
November, 1982

ABSTRACT
This thesis investigates different genetic aspects of susceptibility to halothane anaesthesia in pigs. The mode of Inheritance of the reaction to halothane was investigated in a Pietrain/Hampshire (PTH) and a British Landrace experimental herds. The single-recessive mode of inheritance was tested as a hypothesis in the context of (I) a single-locus-two-alleles model where both the heterozygote and one homozygote react to the anaesthetic and (II) a two-locus model involving a susceptibility locus and a suppressor locus. Maximum likelihood techniques were used to fit the models to the data. The results of the single-locus analysis did not disprove the single-recessive hypothesis in PTh. The same analysis rejected a strictly recessive mode of inheritance In Landrace. The two-locus analysis in PTR indicated that the addition of a suppressor locus to a single recessive model could Improve the explanation of halothane testing results. The two-locus analysis also rejected the single-recessive hypothesis in Landrace. A study was conducted to estimate heritability of the time of onset of reaction to halothane. Estimated heritabilities at eight weeks of age were 0.65 ± 0.59 in PTH and 0.12 ± 0.58 in Landrace, after half-sib analyses. The precision of these estimates was too low to allow firm conclusions to be drawn. There were clear indications that a 3-minute halothane test may be too short to detect all positive reactors in the British Landrace breed.
The effect of age on incidence of susceptibility was studied on pigs which were repeatedly exposed to the anaesthetic. In three trials, PTH and Landrace pigs were given three 3-minute halothane tests, at 19, 35 and 54 days of age. In a fourth trial Landrace pigs received four 5-mm tests, at 21, 35, 49 and 63 days. All pigs were offspring of positive x positive matings. Maximum likelihood estimates of the probability of positive reactions were 0.47, 0.73 and 0.88 at the three ages in PTH; 0.20, 0.63 and 0.60 in the first Landrace trial and 0.64, 0.86, 0.84 and 0.90 in the second Landrace trial. Thus, In all trials penetrance increased with age. In both breeds, and at all ages, penetrance was lower In males than in females.
Two studies are presented, assessing effects of susceptibility on reproductive, growth and body composition traits. They evaluate differences between reactor and non-reactor PTH pigs from two lines selected for and against susceptibility: SS and SR respectively. The first study analyses litter records from females of the SS and SR lines. At weaning susceptible females produced about 1.5 piglet/litter less than normal females. This was apparently due to both smaller litters at birth and higher piglet mortality during lactation. The second study analyses results from three trials in which putative heterozygotes at the halothane locus were compared with putative normal homozygotes. There. were no significant differences in growth traits. Heterozygotes had paler meat. There were indications that heterozygotes have about 1.5 % more lean tissue in the carcass. The small sizes of the SS and SR lines proved to be an important source of error in the estimation of differences associated with halothane susceptibility.

CONTENTS
CHAPTER 1
GENERAL INTRODUCTION I
CHAPTER 2
THE GENETICS OF HALOTHANE SUSCEPTIBILITY IN PIGS:
A REVIEW OF THE LITERATURE
I. Malignant hyperthertuia 3
II. The biochemical bases of the malignant
hyperthermia reaction 5
III. The halothane test 6
IV. Genetics of halothane susceptibility
Mode of inheritance 7
Linkage relationships 9
V. Associated effects on production traits
Comparison of phenotypes 14
Comparison of genotypes 16
VI. Incidence of halothane susceptibility 19
VII. Practical Implications 21
VIII. Questions for future research 22
Page

Page
CHAPTER 3
THE INHERITANCE OF HALOTHANE SUSCEPTIBILITY
IN PIGS
Introduction 24
Material and Methods
Animals 25
Models
Model 1. Single-Locus 27
Model 2. Two-Locus 29
Computations 32
Results
Model 1. Single-Locus 33
Model 2. Two-Locus 37
Discussion 37
CHAPTER 4
STUDIES ON THE TIME OF ONSET OF REACTION
TO HALOTHANE ANAESTHESIA
Introduction 48
Material and Methods
Animals 48
s-s4of4.1 ia Lyes
Analysis of heritability 50
Analysis of repeatability 50
Results
Analysis of heritability 54
Analysis of repeatability 57
Discussion 60

Page
CHAPTER 5
THE EFFECT OF AGE ON HALOTHANE SUSCEPTIBILITY
Introduction 68
Material and Methods
Experimental 68
Statistical analysis 70
Results
Effects of previous tests on subsequent ones 77
HP reactions 78
RD reactions 78
HP + RD reactions 81
Discussion 81
CHAPTER 6
THE EFFECTS OF HALOTHANE SUSCEPTIBILITY ON SOME
ECONOMICALLY IMPORTANT TRAITS 87
6a THE GENETIC STRUCTURE OF THE ABRO—PTH LINES
Demographic structure of the PTH population 88
The genetic composition of the SS and SR lines 89
Random genetic differentiation of the lines 95

Page
6b DIFFERENCES IN REPRODUCTIVE TRAITS BETWEEN HALOTHANE
SUSCEPTIBLE AND HALOTHANE TOLERANT PIGS 100
Material and Methods
Animals 101
Statistical analyses
I. Analysis of litter size and piglet weight 102
Within—line matings: all records 103
Within—line matings: first parities 103
Carrier trials 103
Variance of line differences 104
II. Analysis of piglet mortality 106
Results 107
Discussion 107
6c DIFFERENCES BETWEEN PIGS OF PREDICTED GENOTYPES AT
THE HALOTHANE LOCUS IN GROWTH AND CARCASS TRAITS 113
Material and Methods
Animals 114
Performance testing 115
growth traits 116
Carcass traits 116
Ruinpback traits 117
Full dissection traits 119
Statistical analyses
Analysis of growth, carcass and rumpback
traits 119
Analysis of the full dissection results 121
Variance of genotypic differences 124
Results 125
Discussion 127

Page
CHAPTER 7
CONCLUDING REMARKS 140
The mode of inheritance of susceptibility 140
Changes in productivity traits associated
with susceptibility 145
APPENDIX
149
ACKNOWLEDGEMENTS
REFERENCES

CHAPTER 1. GENERAL INTRODUCTION
The discovery of a gene with detectable effects on metric characters
in pigs has prompted a considerable amount of research in recent years.
The existance of a genetic locus with major effects on muscularity was
notably foreseen by 011ivier (1968) after studies with Pietrain pigs.
More recently, research with blood-type markers indicated a major gene
affecting meat quality traits (Jensen et al., 1976). The main
breakthrough, however, was the finding that the malignant hyperthermia
reaction, as triggered by the anaesthetic halothane, was largely
controlled by a single autosomal locus (011ivier, Sellier and Monin,
1975). It has been known for some years that pigs differing in their
susceptibility to halothane anaesthesia differed in meat quality traits
and in their tolerance to stress (Harrison, 1972); it was soon shown that
they also differed in lean content (Eikelenboom, Minkema and van Eldik,
1976). Thus, the discovery of the halothane gene not only confirmed the
existence of a locus with major effects on production traits but also
provided pig breeders with a simple screening tool. A review of the
literature on halothane susceptibility in pigs is presented in Chapter 2.
A research project was started in 1974 at the Animal Breeding Research
Organisation (ABRO), Edinburgh, to investigate several aspects of the
halothane susceptibility phenomenon in pigs. Over the years the project
has generated a comprehensive body of information part of which -a
combination of experimental results and field records' collected
Page 2
routinely at ABRO constitutes the material for the studies in this
thesis. The investigations presented here can be divided into two groups.
The first group comprises studies dealing with the reaction to halothane
anaesthesia: the mode of inheritance of this reaction (Chapter 3), the
genetics of time of onset of reaction (Chapter 4) and the effects of age
on halothane susceptibility (Chapter 5). The second group (Chapter 6)
comprises studies dealing with the effects of halothane susceptibility on
reproductive, growth and body composition traits.

Page 3
CHAPTER 2. THE GENETICS OF HALOTHANE SUSCEPTIBILITY IN PIGS
A REVIEW OF THE LITERATURE
This review deals with the problem of halothane susceptibility in pigs
focussing mainly on the genetic aspects of this trait and its connection
with different production characters. The literature on malignant
hyperthermia was extensively reviewed by Gronert (1980). Particular
aspects of the problem in pigs were also reviewed: the mode of
inheritance was discussed by 011ivier (1980); the practical applications
of the halothane test were reviewed by Webb (1981); Smith (1981 a)
considered practical breeding aspects.
I. MALIGNANT HYPERTHERIEIA.
Harrison et al. (1969) and Sybesma and Eikelenboom (1969) were the
first to report that some pigs, after exposure to halothane anaesthesia,
undergo a characteristic reaction called malignant hyperthermia or
malignant hyperpyrexia. The main clinical symptoms of the malignant
hyperthermia (MM) reaction are:.
1— Dramatic rise in general metabolism, leading to increases in body
temperature and acidosis.

Page 4
Enhanced muscle cell permeability, resulting in increased potassium,
ionized calcium, sodium, creatine-phosphokinase and myoglobin
serum concentrations.
Sympathetic stress response.
Gross muscle contracture.
Tachicardia and decreased heart output.
The symptoms have been described in great detail by Gronert (1980);
the reaction is lethal if the administration of anaesthetic is not
suspended in the early stages; the animal dies from cardiac failure.
In spite of some differences, the MH syndrome in the pig is very
similar to the malignant hyperpyrexia syndrome in humans (Wingard and
Gatz, 1978; Gronert, 1980); in fact, the pig provides a useful model for
the study of the human syndrome. In addition, similar reactions have been
reported in the dog, in the cat and in the horse (Short, 1978). In pigs,
susceptibility to halothane appears to be a manifestation of a more
general disorder known as Porcine Stress Syndrome or PSS (Harrison, 1972).
Any strain to which susceptible pigs are exposed can lead, through the MH
reaction, to sudden death. Thus excsrcse, excitement, high ambient
temperature, anoxia can all trigger MH episodes (Briskey, 1964; Sybesma
and Eikelenboom, 1969; Schulman, 1981). Drugs like succinyleholine,
different volatile anaesthetics and some sympathetic agonists are also
triggering agents of varying effectivity (Gronert, 1980).

Page 5
II. THE BIOCHEMICAL BASES OF THE MALIGNANT HYPERTHERNIA REACTION.
It will be useful to review briefly the biology underlying the MH
syndrome. Although there is controversy about the specific metabolic
error in stress susceptible pigs it is nowadays widely accepted that the
defect lies in the skeletal muscle and that there may be a generalized
alteration in membrane properties affecting calcium movements, perhaps
involving specific enzyme or cell membrane structural protein variants
(Gronert, 1980).
Different studies have shown that there is an enhanced Ca++ efflux
from mitochondria (Cheah. and Cheah, 1976; 1978) and an impaired Ca-f-I-
transport in the sarcoplasmic reticulum of stress susceptible pigs
(Campion and Topel, 1975; McIntosh, Berman and Kench, 1977). Other
studies have shown increased erythrocyte fragility in susceptible pigs
(Harrison and Verburg, 1973; King , 011ivier and Basrur, 1976) which
suggests there are differences in membrane osmotic properties. This type
of evidence supports the hypothesis of a generalized membrane disorder
affecting Ca++ movements.
Briefly, the hypothesis states that after certain stimuli, for
example muscle fibre depolarization by some drugs or increased muscular
activity ; there follows, in susceptible pigs, an uncontrolled rise in
intracellular Ca-H-, the ultimate cause of which is still unknown. This
would in turn cause a rise in general metabolism -an homeostatic attempt
to lower the high intracellular Ca-H- concentration. This situation would
trigger the sympathetic stress response. The process would finally
precipitate into the known series of events: respiratory and metabolic

Page 6
acidosis, increased heat production, decreased heat loss, further loss of
Ca++ control resulting in muscle contracture, generalized failure of cell
membranes and cardiovascular collapse. The theory awaits confirmation of
the increased intracellular Ca++ levels. For a detailed description of
the theory and a discussion of alternative hypotheses, see the review on
malignant hyperthermia by Gronert (1980).
III. THE HALOTHANE TEST.
The use of halothane anaesthesia to identify pigs which are liable to
PSS is known as the 'halothane test. It consists in administering the
animals a mixture of oxygen and halothane through a facial mask. Pigs
developing a clear rigidity of the hind limbs are classified as halothane
positive or stress susceptible. As soon as this symptom is observed the
administration of anaesthesic is interrupted. Most positive pigs react
within the first three minutes; the mean reaction time is about 100
seconds (Bulla et al., 1979; Webb and Jordan, 1979; Fr ,p'ystein at al.,
1981). Mortality during testing varies from around zero to 12 % of
positive reactors, depending on breed and environmental factors (Webb,
1981).
In experiments the flow of oxygen, the concentration of halochane and
the duration of the test have been somewhat variable. In general terms
however the oxygen flow was of the order of 3 1/mm, with a halothane
concentration of about 5 %. The test is usually extended for a period of
3 to 5 minutes (Eikelenboom, Minkema and Sybesma, 1978). Those pigs
remaining relaxed throughout are classified as halothane negative or

Page 7
stress resistant.
Alternative methods for predicting liability to PSS, like the
measurement of plasma creatine-phosphokinase (CPK) activity, the study of
genetic markers in blood or the erythrocyte fragility test were discussed
by Allen et al. (1980) and by McGloughlin (1980); see also the
Proceedings of a recent symposium (FrØystein, Slinde and Standal, 1981).
IV. GENETICS OF HALOTHANE SUSCEPTIBILITY.
(i) Mode of inheritance.
The hereditary aspects of porcine susceptibility to halothane were
recognized early on by Allen et al. (1970); Christian (1972) and Hall,
Trim and Woolf (1972). When the trait is simply defined as 'hind limbs
rigidity after halothane application the phenotypic variation is
discontinuous. Apart from a few doubtful cases there are two classes:
reactors and non-reactors. Christian (1972) suggested that this reaction
was inherited as a single autosomal recessive gene with incomplete
penetrance. Subsequently 011ivier, Sellier and Monin (1975); Minkema,
Eikelenboom and van Eldik (1976); Smith and Bampton (1977); McPhee,
Takken and DArcy (1979); Lnccher ; Schneider and Jucker (1979) and
Schepers (quoted by Simon, 1980) all fitted single autosomal recesive
models to data from planned matings or from field observations. The
conclusions from these studies agree in that halothane susceptibility is
likely to be determined by the recessive homozygote genotype at a single
locus, this genotype having incomplete penetrance (0.9 as averaged by

Page 8
Webb, 1981). It must be pointed out that, apart from McPhee et al.
(1979) who compared recessive and dominant single gene hypotheses, the
studies above did not produce statistical evidence for rejecting
alternative models of inheritance.
Simon (1980) argued that it would be difficult to differentiate
between the single recesive hypothesis and a quantitative-threshold model.
However, the evidence that halothane sensitivity is correlated with
several blood markers belonging to a single linkage group (Andresen and
Jensen; 1977; JØrgensen, 1981) suggests that there is a locus with major
effects on this trait. Simple genetic mechanisms therefore are most
likely but, so far, only the single recessive model has been properly
explored. The possibility that penetrance is under genetic control -as
suggested by the pattern of response to selection in favour of positive
reactions in Pietrain/Hampshire pigs at ABRO (Webb, 1981)- cannot be ruled
out.
When halothane susceptibility was defined in a way different from
above, or when the test procedures were varied, a different mode of
inheritance was also inferred. Hall et al. (1972) treated the pigs with
a combination of halothane and succinyicholine. Their tentative
conclusion was that the NH reaction, after such a test, is controlled by a
single autosotnal dominant gene. Jones et al. (1972) identified halothane
susceptible animals by measuring muscle ATP depletion during exposure to
the anaesthetic in vitro; from the incidence observed within a familiy
they inferred a single autosomal dominant pattern of inheritance. Williams
et al. (1975; 1978) considered rapid heart beat, muscle rigor and/or
rise in rectal temperature' to be the signs of positive reactions. They

Page 9
proposed a 'strongly modified single dominant gene or two dominant genes
acting in concert as the hereditary mechanism for halothane
susceptibility. Britt, Kallow and Endrenyl (1975) recognized five
different classes of response in skeletal muscle biopsies treated with
caffeine or caffeine plus halothane. They concluded that this trait might
be controlled by two loci but did not specify any particular genetic model
nor presented a clear genetic analysis of their observations. In general
terms the latter reports are characterised by a vague definition of the
trait under study and by a less rigorous testing of genetic hypothesis or
no hypothesis testing at all.
For practical agricultural purposes it seems fairly reasonable to
define the trait as hind limbs rigidity after halothane application and
to assume a single-recessive mode of inheritance, at least until clear
evidence is presented on the contrary. However, the trait could be
defined at a higher level of resolution; the possibility that in such
instances it might have a different mode of inheritance cannot be ruled
out.
There is an effect of age on the expression of susceptibility to
halothane. After repeated tests Webb (1980 a; 1981) has shown that the
penetrance of the susceptible genotypes increases with the age of the
pigs. This effect could complicate the interpretation of studies on mode
of inheritance, if the pigs were young or varying in age. It also could
account for the variable penetrance estimates reported in the literature.
(ii) Linkage relationships.

Page 10
Andresen (1971) was the first to report a linkage group involving
three loci in pigs. These were the locus for a red blood-cell antigen, H,
and the loci controlling two enzymatic polymorphisms: phospho-hexose
isomerase (PHI) and 6-phosphogluconate-dehydrogenase (6-PGD).
Later it was discovered that the locus for a gene having major effects
on halothane susceptibility belongs to the same group (Rasmusen and
Christian, 1976; Andresen and Jensen, 1977). Andresen and Jensen (1977)
called this locus HAL. According to Rasmusen, Beece and Christian (1980)
a fifth locus -an inhibitor of the A-0 system- might also belong to the
same linkage group.
Seven alleles have been recognized within the H system (Rasmusen,
1975); for each of the enzyme loci two codominant alleles are known
(Gahne, 1979). HAL comprizes two alleles, designated N and n by Minkema
et al. (1976). Details of the loci are summarised in Table 2.1. Table
2.2 shows the recombination frequencies found in a recent study involving
several Landrace strains (Jrgensen, 1981). From the values in Table 2.2
the most likely sequence for the four loci in the chromosome is:
PHI - HAL - H - 6-PGD
Several population studies have found linkage disequilibria amongst
1
the components of the PHI-HAL-H system. In these investigations HAL has
always been associated with PHI B
(Guerin, 011ivier and Sellier, 1978;
Watanabe et al., 1978; Andresen, 1979; Andresen et al. ) 1980;
Jyrgensen, 1981) even though five different breeds where involved. The
A gamete PHI - HAL has not yet been detected in Danish Landrace
(JØrgensen, 1981). Similarly, linkage disequilibria were also reported

Page 11
Table 2.1. Alleles at the different loci in the 5-loci linkage group.
System Alleles
H : a, b, ab, cd, bd, be, and -;
or simply a and -
PHI: A and B
6-PGD : A and B
HAL: N and n
A-O suppresor : S and s

Page 12
Table 2.2. Per cent recombination frequencies (8)
among the polymorphic systems HAL, PHI,
H and 6-PGD in Landrace pigs (taken from
Jrgensen, 1981).
System 8 S.E.
HAL - PHI 0.0
HAL - H 3.0 (2.3)
HAL - 6-PGD 9.1 (6.3)
PHI - H 4.5 (1.7)
PHI - 6-PGD 12.4 (4.6)
H - 6-PGD 5.2 (1.4)

Page 13
between the HAL and H loci (Andresen et al., 1981; Frystein et al, 1981;
Jrgensen, 1981). The results from these studies, as well as evidence
from other investigations (Hjny et al., 1979; Imlah and Thompson, 1979;
Schulman, 1981) indicate that HAL is generally associated with the H a
allele.
Depending on the existence of linkage disequilibria the PHI and H
systems could be used, as markers of the HAL locus, to identify stress
susceptible pigs and to reduce the frequency of HAL " by selection.
Jrgensen (1981) calculated, that selection against those pigs carrying the
Ha allele and with the PHI -PHI genotype could have the saiue.result as
culling of the halothane reactors in the Danish Landrace breed, but in
order to achieve this the number of pigs to be removed from the population
should be considerable higher in the former case.
The correlations found between H or PHI types and several traits
-mainly carcass traits - are now attributed to the disequilibria in
different populations among these loci and HAL, which is believed to be
the locus directly responsible for the differences (JØrgensen and
Hyldgaard-Jensen , 1981). The maintenance of such disequilibria in pig
populations has been attributed to selection favouring the heterozygote at
the HAL locus, disequilibria already present when selection started and a
hitch-hiking effect (Guerin. 011ivier and Sellier, 1979; 011ivier, 1980).
It remains to be explained why, when disequilibria exist, they have always
the same sign, across so many different breeds. Guerin et al. (1979)
speculated that this could indicate that the HAL 1 genes in those
populations all derive from a common origin.

Page 14
V. ASSOCIATED EFFECTS ON PRODUCTION TRAITS.
A considerable volume of research indicates that the HAL locus has
effects on a variety of traits, many of which are economically important.
These studies can be divided into two types: comparison of phenotypes and
comparison of genotypes.
(i) Comparison of phenotypes.
This was the most common type of investigation. Reactor and
non-reactor pigs were compared for a variety of traits. The results of
such comparisons will depend on the genotypic values and frequencies, they
are therefore likely to vary across populations.
Some results from the literature are summarised in Table 2.3. The
reported differences were pooled after weighting them according to numbers
and variances. The statistical significance of the pooled differences was
determined by means of a t-test. Such a table may undoubtedly remove
important differences in particular breeds or feeding regimes, and the
pooling of data from heterogeneous populations can be misleading. It
could be useful, though, as a general summary of the available
information.
While there were no clear effects in growth rate, food conversion or
appetite, the differences in body composition and meat quality traits were
important and consistent. Halothane susceptible pigs were leaner,
slightly shorter and had a higher carcass yield. Although much variation
in meat quality traits depends on pre-slaughter conditions (Malmfors,

Page 15
Table 2.3 Some differences in performance between halothane positive (HP)
and halothane negative (HN) pigs, summarised from the literature.
No. No. Difference Trait •studies pigs HP-HN (S.E.) Author #
Growth
Growth rate (g/day) 9 4937 -0.1 ( 3.21) 1,2,3,5,7,8,9,13,14
Food conversion (food/gain) 5 3256 0.0 ( 0.03) 1,2,8,9,14
Food intake (g/day) 2 2922 -8.0 (17.21) 1,2
Body composition
Carcass yield (%) 5 1682 0.7 (0.32)* 1,2,7,12,14 Lean content (%) 9 1289 3.2 (0.50)** 1,3,5,6,9,11,12,13,14 Carcass length (mm) 6 1710 -9.0 (3.21)** 1,2,6,7,12,14
Meat quality
Muscle pH (45 mm) 7 1027 -0.3 (0.04)** 1,3,6,9,10,12,13 Muscle pH (>24 h) 5 371 0.0 (0.04) 1,4,6,7,10 Gofo index 4 943 -8.4 (1.24)** 3,9,10,13 Transmission value 4 1502 16.2 (2.65)** 1,2,6,12
* (P<0.05) ** (P<0.01)
# References: (1) Carlson et al.(1980); (2) Eikelenboom et al.(1978); (3) Gerwig, Vögeli and Schwörer (1979);(4)Jensen and Andresen (1980); (5) Kovach (1980); (6) Kukoyi et al.(1981); (7) Monin, 011ivier and Sellier (1976); (8) 011ivier, Sellier and Monin (1978); (9) Rogdakis, Ensinger and Faver (1980); (10) Schmidt and Kaliweit (1979); (11) Schulman (1981); (12) Verstegen et al. (1976); (13) Vdgeli (1978); (14) Webb and Jordan (1978).

Page 16
1981) the defect in pork quality known as Pale, Soft, Exudative (PSE) is
to some extent associated with halothane susceptibility. In fact, the
halothane test was originally introduced as a predictor in vivo of PSE
muscle (Eikelenboom and Minkema, 1974). Webb (1981) reported that the
difference in incidence of PSE between reactor and non-reactor carcases
from the literature averaged 46 %. Table 2.3 shows that muscle from
reactor pigs has a faster post-mortem decline in pH, paler colour as
indicated by the Göfo index and higher protein solubility which have been
used as objective indicators of PSE (Barton-Gade, 1981).
In addition to these results other studies indicated that positive
reactors had a different visual conformation (011ivier et al., 1978) and a
higher post weaning mortality (Eikelenboom et al., 1978; Webb and Jordan,
1978). Furthermore, halothane susceptible sows would produce smaller
litters (Webb and Jordan, 1978). Webb (1981) estimated that the higher
mortality and reduced litter size would offset, under British conditions,
the commercial advantages of higher carcass yield and lean content.
(ii) Comparison of genotypes.
These are based, of course, on the single. recessive model of
inheritance. There were fewer studies of this type; in some of them the
pIgs were classified into genotypes after so many assumptions that their
conclusions should be taken cautiously. Some of the results in the
literature are summarised in Table 2.4 from Webb (1981), giving equal
weight to each study.
As far as growth rate and food conversion are concerned, the results

Page 17
Table 2.4. Some differences in performance between halothane genotypes,
summarised from the literature (Webb, 1981).
Difference
nn-NN Nn-NN No.
Trait studies X range X range Author Ii
Growth rate (g/day) 5 -11 -102 to 42 3 -69 to 47 2,3,5,6,7
Food conversion 2 0.00 -0.01 to 0.01 0.02 0.01 to 0.03 2,7
Carcass yield (%) 2 1.3 0.9 to 1.7 0.8 0.1 to 1.4 2 11 7
Lean content (%) 5 3.6 2.7 to 4.3 1.8 1.0 to 2.3 1 , 3 3, 4 9 6 31 7
Carcass length (mm) 6 -10 -1 to -17 1 -8 to 12 1 31 2,3,4,6,7
P.S.E. (Z) 3 51.8 49.6 to 51.9 1.6 0.4 to 3.2 1,3,7
I! References: (1) Andresen, Jensen and Barton-Gade (1981); (2) Eikelenboom
et al. (1980); (3) Jensen (1981);(4) Jensen and Andresen (1980);(5) Liescher,
Schneider and Jucker (1979);(6) Schneider, Schwrer and Blum (1980); (7) Webb
(1981).

Page 18
in the literature appear inconclusive. There seems to be some indication,
though, that the heterozygote may be intermediate for lean content and
carcass yield. The effects of the gene on carcass length and meat
quality, on the other hand, appear to be recessive, as well as those on
litter size as reported by Schneider et al. (1980). Based on the data of
Eikelenboom et al. (1980) Brascamp, Eikelenboom and Minkema (1980)
estimated that the halothane locus would account for some 60 and 20 Z of
the additive genetic variance in meat quality traits and in lean content
respectively, in the Dutch Landrace breed. According to Webb (1981) the
heterozygote would offer economic advantages when compared with both
homozygote genotypes under British conditions. The locus would show
overdominance in those environments where leanness is an economic goal
(Andresen et al., 1981).
It seems clear that the halothane locus is marking a region in the
chromosome with major effects on traits related to the amount and
physico-chemical properties of muscle tissue, fitness and prolificacy.
However, the genetic nature of the relationship between halothane
susceptibility and the changes in those traits is not clearly established
yet. Are all the differences a cascade of effects arising from a unique
physiological defect -are they pleiotropic effects of the same gene ? or
are some of them the result of linkage disequilibria among the halothane
locus and other loci ? After theoretical considerations the hypothesis of
pleiotropy is generally favoured (Guerin et al., 1979; 011ivier, 1980;
Jrgensen and Hyldgaard-Jensen, 1981) although there is not much
supporting evidence so far. On the other hand the finding that the H
Page 19
locus accounted for about 6 % of the variance in reproductive traits in
Duroc Jersey pigs (Jensen et al., 1968) raises some doubts. It was found
in that study that the Ha allele produced a reduction in litter size;
the same effect was also attributed to HAL ' (Webb and Jordan, 1979;
Schneider et al., 1980). As it was pointed out before, both genes are
generally found positively associated. The important point is that the
present frequency of HAL seems to be negligible in the Duroc Jersey
breed.
The resolution of the dilemma as to whether the effects on performance
arise through plelotropy or linkage will require finer analyses. However,
a proper answer to this question is desirable even from a practical point
of view. Perhaps it would not be impossible to dissociate some of the
beneficial and harmful effects by means of selection of the appropriate
recombinants.
VI. INCIDENCE OF HALOTHANE SUSCEPTIBILITY.
There seems to be a wide range of incidence of reaction to halothane
in the different worlds pig populations. Apparently Large White and the
American breeds would have very low incidences. Most Landrace strains
show intermediate frequencies while Pietrain and Belgian Landrace appear
to have high incidences. Webb (1980 b; 1981) has presented a table
summarising the incidence in different worlds breeds as reported in the
literature. Franceschi and 011ivier (1981) presented a similar table.
Table - 2.5 - is a summary taken from Webbs table. Some of the results are
from field surveys, others from testing stations or from experimental

Page 20
Table 2.5. Frequency of halothane susceptibility in some pig populations
(taken from Webb, 1981).
No. % halothane - Breed pigs positive
Duroc 248 0 American Yorkshire 225 0 Large White 1130 0 Hampshire 232 2
Landrace: Norwegian 576 5 Danish 1990 7 British 1538 11 Swiss 7480 13 French 127 17 Dutch - 4073 22 German 1251 68 Belgian 1260 86
Pietrain: French 335 28-68 German 266 87 Dutch 101 94

Page 2].
herds.
VII. PRACTICAL IMPLICATIONS.
The identification of the halothane locus with its major effects on
several economic traits undoubtedly has several practical implications.
From the point of view of research the discovery is useful for a better
interpretation of results from experiments concerned with traits whose
variances and covariances are partly determined by the frequency of this
gene. Heritabilities and genetic correlations will be affected as
described by Smith and Webb (1981); there could be non-linearity in the
regression offspring-mid parent and asymmetrical responses to
bidirectional selection (Robertson, 1977). Therefore, if neccesary it is
now possible to design experiments without the confounding effects of the
halothane gene.
From a breeding viewpoint the case for manipulating the gene will
finally depend on economical considerations. It could be convenient to
eliminate the gene or even to fix it in specialised sire lines with the
purpose of producing a heterozygous (Nn) commercial generation, as
discussed by Smith (1981 a), Smith and Webb (1981) and Webb (1981). In
any case, reliable information on the genotypic values for all economic
traits is still required.
In small breeding programmes it would not be very difficult to
manipulate the gene. Fixation should take a single generation of
selection. The time until elimination will vary according to the breeding

Page zz
plan: selection after test mating with homozygote recessives would be a
most effective method (Smith , 1981 a).
In breeding programmes of national proportions the opportunities for
manipulating the gene are less clear. If its existence is ignored and
there is selection in the direction of increased lean content there will
be an upward trend in the gene frequency towards fixation. The time to
fixation will depend mainly on the relative genotypic values, on the
selection intensity and on the fitness of suceptible animals. If there is
very low survival rate or culling of susceptible pigs or simultaneous
selection for traits like meat quality, an intermediate equilibrium
frequency could be reached. These problems were studied by Smith (1981
b). Again, to decide on an optimum strategy is an economic problem
depending mainly on the performances of the three genotypes and these have
not been firmly established yet. However, the implementation of such a
strategy at a national scale would be more difficult than in smaller
breeding programmes; some possibilities were discussed by Smith (1981 a).
VIII. QUESTIONS FOR FUTURE RESEARCH.
Although there has been a considerable amount of research in recent
years on the subject, several aspects still deserve further study; some
of them are of major importance from a practical point of view.
Thus, even though a single autosomal recessive model with variable
penetrance provides a reasonably good fit to the observed pattern of
inheritance, the meaning of the variable penetrance remains puzzling. The
possibility that there could be genetic variation in penetrance has to

rage U
be explored. Perhaps it would not be impossible to reduce the
susceptibility to stress by selection without losing some of the economic
advantages conferred by the n allele.
The genotypic values for all traits of economic importance should be
firmly established. Most of the estimates in the literature are from
analysis of data in field or testing station surveys. Although they can
provide initial indications there is still need for well planned
experiments. In this connection, it could be interesting to consider the
possibility of there being more than one normal allele having a range of
gene effects on production traits.
The problem of whether the effects attributed to the HAL locus arise
through pleiotropy or linkage disequilibria is still to be clarified. The
answer may provide the key for separating some of the beneficial from the
harmful effects.
Finally, although blood group testing can already be used to detect
the heterozygote genotype at the HAL locus (Jrgensen, 1981) the method
has some disadvantages, as discussed by Allen et al. (1980). Thus, the
development of new simple and reliable tests for identifying carriers of
the 11 allele is a challenging topic for future research.

Page 24
CHAPTER 3. THE INHERITANCE OF HALOTHANE
SUSCEPTIBILITY IN PIGS -
INTRODUCTION
Many investigators have concluded that the reaction triggered by the
anaesthetic halothane in pigs is a recessive trait controlled by a single
autosomal locus (011ivier, Sellier and Monin, 1975, 1978; Minketna,
Elkelenboom and van Eldik, 1976; Smith and Bampton, 1977; McPhee, Takken
and DArcy, 1979; Mabry, Christian and Kuhlers, 1981). Other authors
have put forward alternative genetic explanations, including
single-dominant and two-locus modes of inheritance (Jones et al., 1972;
Williams et a].., 1975, 1978; Britt, Kallow and Endrenyi, 1978) -but have
not presented any formal genetic analysis supporting their conclusions.
There are no adequate studies as yet in the literature on the relative
merits of the single-recessive hypothesis tested under alternative
Mendelian models. However, taking into account the contrasting
interpretations mentioned above, and considering that the low penetrance
values in some studies (e.g. 011ivier et al., 1975, 1978) might indicate
a poor description of the events by the single-recessive model, there is a
case for more thorough hypothesis testing. This can be particularly
informative on data where it is not immediately obvious that a
single-recessive mode of inheritance provides the most adequate
explanation.

Page 25
The purpose of this study was to test the validity of the
single-recessive hypothesis for mode of inheritance of halothane
susceptibility in pigs, within the framew )rk of (I) a single locus model
and (II) a model involving two epistatic loci. The models were fitted to
data from experimental Pietrain/Hampshire and British Landrace herds by
the method of maximum likelihood.
MATERIAL AND METHODS
Animals.
Halothane testing results from a synthetic population founded from
crosses of Pietrain and Hampshire and a British Landrace experimental
population were used in this study. All pigs received one 3-minute
halothane test at between 5 and 10 weeks of age as described by Webb and
Jordan (1978). Pigs developing a clear rigidity of the hind limbs within
the test period were scored as positive reactors; the rest were
classified as negative reactors.
The Pietrain/Hampshire data were presented by Smith and Bampton (1977)
who first analysed this material. Briefly, pigs from the third generation
of a randomly mated synthetic population containing 40 % Pietrain and 60 %
Hampshire genes were subjected to the halothane test. The population was
subsequently divided into two lines by mating mainly reactors with
reactors and non-reactors with non-reactors. The offspring from these
matings were also halothane tested. In contrast to Smith and Bamptons
investigation, only those families with known parental phenotypes were

Page 26
included in the present study. The frequency of positive reactions
amongst parents was 0.33. The testing results are given in the Appendix.
The Landrace data were collected in an experimental population set up
by the Animal Breeding Research Organisation (ABRO) after a survey of the
incidence of halothane sensitivity in British nucleus herds, which
revealed an average frequency of positive reactors of 0.12 for this breed
(Webb, 1980). The animals constituting the parental group were purchased
from nine of the surveyed herds after being halothane tested on their
original farms. The frequency of positive reactors in this group was
0.48. Two lines were then formed, mating reactors with reactors and
non-reactors with non-reactors. The progeny from these matings were born
and halothane tested at ABRO. These data are also shown in the Appendix.
The Pietrain/Hampshire and the Landrace herds were kept on different
farms.
Models.
The single locus recessive (SLR) hypothesis was tested within the
framework of a general single-locus model where both the heterozygote and
one of the homozygous genotypes were allowed to react to the anaesthetic.
The SLR hypothesis was also tested within the framework of a two-locus
model involving a susceptibility locus and a suppressor locus. The
purpose of this model was to explain genetically part of the variation in
penetrance as observed under the SLR hypothesis. In all cases two
phenotypes were considered: reactor (R) and non-reactor (MR). The models
were fitted to the data by the method of maximum likelihood, following
Smith and Bamptons procedure (1977). This procedure will be described in

Page 27
detail for the single-locus model and outlined for the two-locus model.
(i) Model 1. Single-Locus. The model requires two alleles: n, with
frequency q, and N, with frequency p (= 1 - q). Mating was at random in
the Pietrain/Hampshire population before the subdivision; therefore, for
the parental generation the expected genotypic frequencies and the
penetrances are
Genotype
MN Nn tin
Code (1) 1 2 3
2 Frequency p 2pq q 2
Penetrance 0 f4 f2
Some special cases under this model are f 1 = f = 1 (dominant,
completely penetrant) and f4 0, f2 1 (recessive, completely
penetrant). The model does not allow phenocopies.
The prior joint probabilities of parental phenotypes and genotypes (Q.
and Q.) are
Phenotype
R MR
Probability....
Genotype
NW 0 p2
Mn 2f4 pq 2(1-f4 )pq
nn f (1-f2 ) q
Page 28
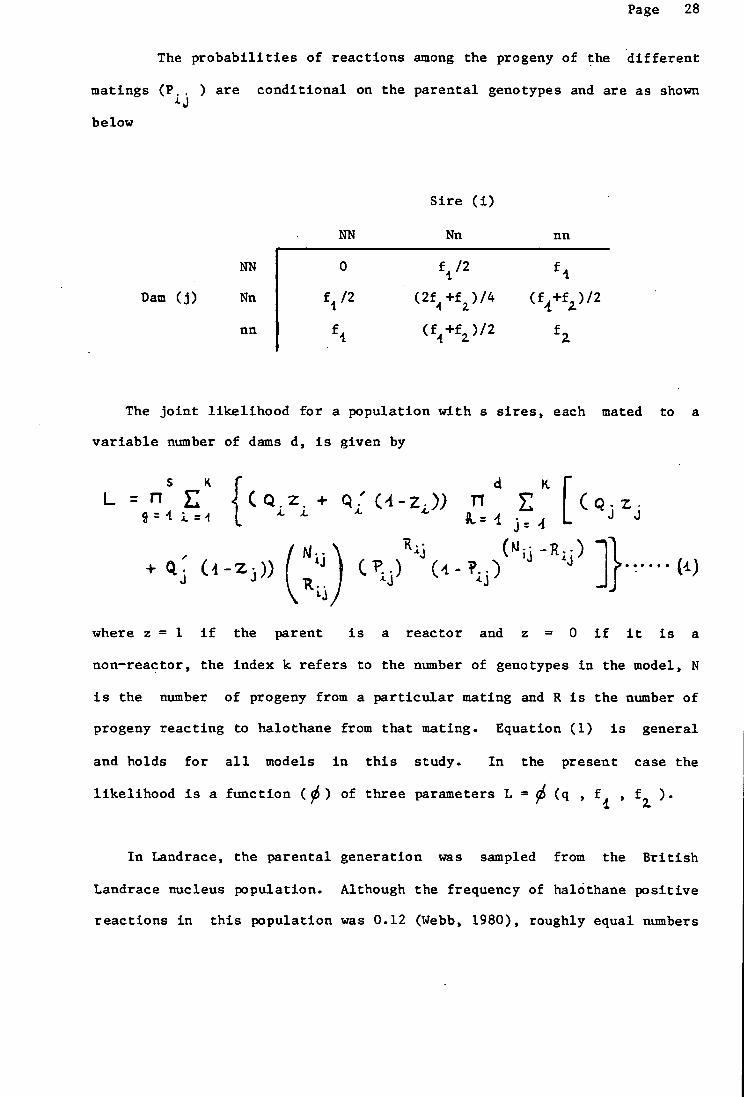
The probabilities of reactions among the progeny of the different
matings (P.. ) are conditional on the parental genotypes and are as shown
below
Sire (1)
NN Nn nn
NN 0
Dam (j) Nn f /2 (2f +f)/4 /2
nn f (f4 +f2 )/2 f2
The joint likelihood for a population with s sires, each mated to a
variable number of dams d, is given by
L =E (A -zd) T1 F, [(QjZ.
Lj P.
+ -Z))
()
(!)zJ )LJ - R u) 1} • .
where z = 1 if the parent is a reactor and z = 0 if it is a
non-reactor, the index k refers to the number of genotypes in the model, N
is the number of progeny from a particular mating and R is the number of
progeny reacting to halothane from that mating. Equation (1) is general
and holds for all models in this study. In the present case the
likelihood is a function (0) of three parameters L (q , f , f ).2.
In Landrace, the parental generation was sampled from the British
Landrace nucleus population. Although the frequency of haláthane positive
reactions in this population was 0.12 (Webb, 1980), roughly equal numbers
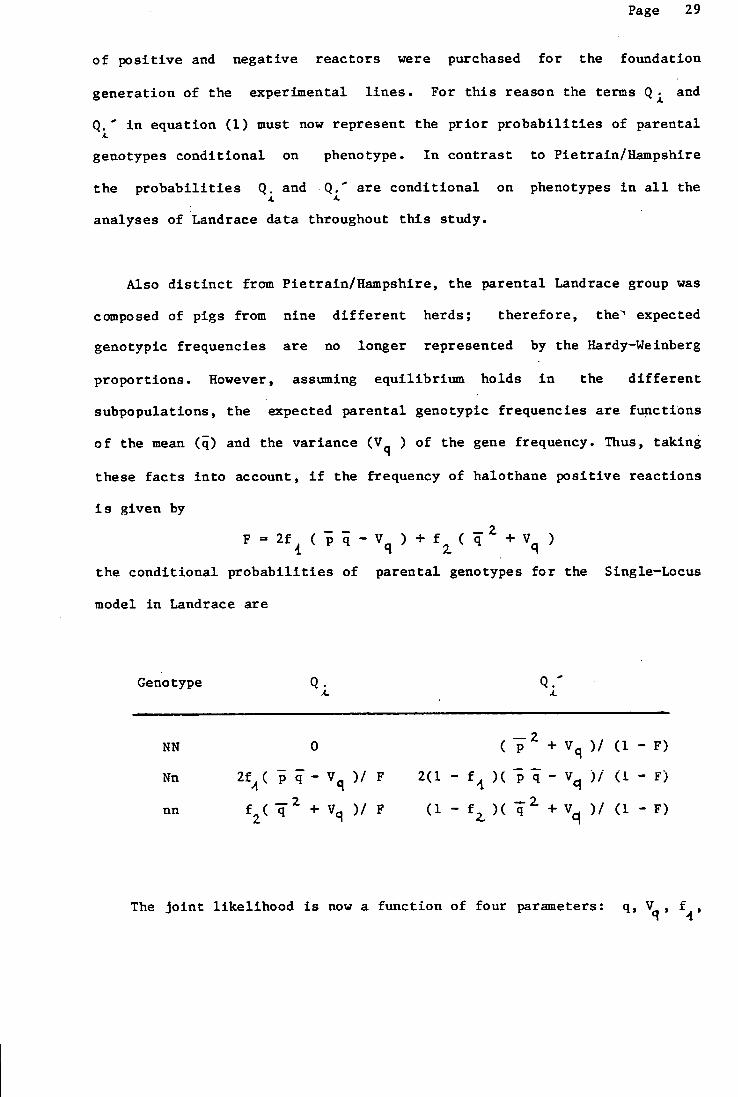
Page 29
of positive and negative reactors were purchased for the foundation
generation of the experimental lines. For this reason the terms Q ;. and
Q. in equation (1) must now represent the prior probabilities of parental
genotypes conditional on phenotype. In contrast to Pietrain/Hainpshire
the probabilities Q. and Q. are conditional on phenotypes in all the A.
analyses of Landrace data throughout this study.
Also distinct from Pietrain/Hampshire, the parental Landrace group was
composed of pigs from nine different herds; therefore, the expected
genotypic frequencies are no longer represented by the Hardy-Weinberg
proportions. However, assuming equilibrium holds in the different
subpopulations, the expected parental genotypic frequencies are functions
of the mean () and the variance (V q ) of the gene frequency. Thus, taking
these facts into account, if the frequency of halothane positive reactions
is given by
F = 2f 4 (p q - V ) +
+ Vq )
the conditional probabilities of parental genotypes for the Single-Locus
model in Landrace are
Genotype Q. A. A.
NN 0 C p + Vq )/ (1 - F)
Nn 2f4 ( p q _ V q )/ F 2(1 - f ,1 )(- Vq )/ (1- F)
nn f2 ( + V )/ F (1 - f )( + V )/ (1 F)
The joint likelihood is now a function of four parameters: q, V1 , f4,

Page 30
f. The SLR hypothesis is obtained if the restriction f 1 = 0 is imposed on
the model.
(ii) Model 2. Two—Locus. The first locus is assumed to determine
susceptibility to the anaesthetic and have two alleles: n with frequency
q and N with frequency p = 1 - q. The second locus is assumed to be a
suppressor locus, also with two alleles: S with frequency u and s with
frequency v = I - u. Under this model pigs require two copies of n at the
susceptibility locus and at least one S allele at the suppressor locus to
be positive reactors. A double dose of s will suppress the reaction in nn
pigs. Genotypes nnSS and nnSs are assumed to have the same penetrance
(f). The suppressor locus acts as a genetic device removing part of the
variation in penetrance as would be observed under the SLR hypothesis.
In general the two loci may be linked and the population may not be in
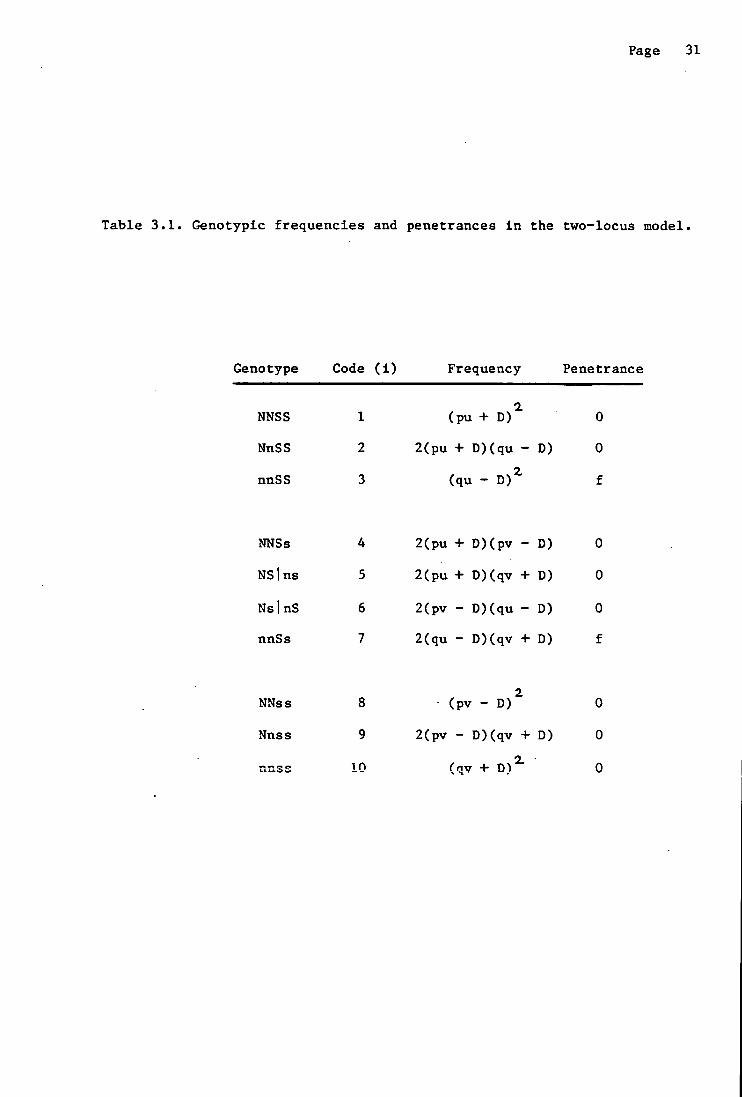
linkage equilibrium. Two types of double—heterozygotes must be
recognized: coupling (NSIns) and repulsion (NsInS). With random mating,
as in. Pletrain/Hampshire, and when linkage disequilibrium D, the
expected genotypic frequencies in the parental group and the corresponding
penetrances are shown in Table 3.1. The conditional probabilities of
reactor progeny given the parental genotypes can readily be computed.
Thus. for the mating NSIns x NSIns:
P = fO(2 —&)/4 55
where 0 is the recombination frequency. The joint likelihood is thus
a function of five parameters: q, v, D, 6 and f. It is possible to test
Page 31
Table 3.1. Genotypic frequencies and penetrances in the two-locus model.
Genotype Code (i) Frequency Penetrance
NNSS 1 (pu + 0
NnSS 2 2(pu + D)(qu - D) 0
nnSS 3 (qu - f
NNSs 4 2(pu + D)(pv - D) 0
NStns 5 2(pu + D)(qv + D) 0
NsInS 6 2(pv - D)(qu - D) 0
nnSs 7 2(qu - D)(qv + D) f
NNss 8 (pv-D) 2 0
Nnss 9 2(pv - D)(qv + D) 0
10 (qv + 0

Page 32
the hypothesis that the population is in linkage equilibrium CD = 0) and
that there is free recombination between the - two loci (6 = 0.5). After
such restrictions a simpler model is obtained where the joint likelihood
is a function of three parameters: q, v and f. This will be called the
Restricted Two-Locus model. The SLR hypothesis is obtained when the
restrictions v = D = 0 and 9 = 0.5 are imposed on the model.
In Landrace, where the parental generation was a mixture of
subpopulations, the genotypic frequencies can be approximately represented
by functions of the mean gene frequencies (lif and V), the variances of gene
frequencies (V q and V) and the covariance between allelic frequencies at
the two loci (Coy, ), after assuming equilibrium holds in the different
subpopulations. For example, the frequency of NNSS pigs is
I Z freq (NNSS) = E(p. U. ); A A.
after dropping a term involving fourth order moments of differences in
gene frequency
22 _2 _2 -- freq (NNSS) ii + i V + u V + 4 p u COV(qv)
Assuming free recombination between the two loci the joint likelihood
in Landrace is a function of six parameters: i, v , V 9 Vs,, Cov(qv) f
The SLR hypothesis is obtained when the restrictions v = = Cove v 0
are imposed on the model.

Page 33
Computations.
A computer program was written to evaluate equation (1) for the
different models in this study. The likelihood surface was searched by
iteration within the parameter space; the maximum likelihood was thus
located and the co—ordinates of this point provided the ML estimates for
the different parameters.
All hypotheses were tested by means of the likelihood ratio MR)
criterion
LR=2 [ln (at )—ln(,,3)]
where in(o. ) and ln( 16 ) are the natural logarithms of the likelihood
maxima under the unrestricted and restricted models respectively. The LR
criterion was compared with a I distribution with n degrees of freedom, n
being the number of parameters on which restrictions were imposed in order
to define the null hypothesis.
Approximate confidence regions for some pairs of parameters in the
different models were estimated by constructing contour maps of constant
values ' on the log likelihood surface such that
2 [in (o ) - ] = 4 = 5.99, 4.60 and 3.22
where in( o. ) is the logarithm of the maximum likelihood and the
values correspond to the 0.05, 0.10 and 0.20 probability levels.
RESULTS

0.30 0.50
0 0 0
CU
..- -J
95
Page 34
Figure 3.1. Likelihood surface for the SLR hypothesis
in PietraiEL/Hampshire.

0 0 -c
—a
0.9(
0.90
Page 35
Figure 3.2. Likelihood surface for the SLR hypothesis in
Landrace. Variance of q (V q ) held at zero.
0.20

Page 36
Table 3.2. Parameter estimates in Pietrain/Hampshire
under Model 1 (Single-Locus).
Gene frequency, q 0.61
Penetrance of Nn, f 4 0.00
Penetrance of nn, f2 0.91
Table 3.3. Parameter estimates and differences in log likelihood in
British Landrace under Model 1 (Single-Locus).
Single-locus SLR SLD model hypothesis hypothesis
Parameter f4 0 f1 =f2 0
Mean gene frequency, q 0.24 0.47 0.26
Variance of q, V 0.055 0.100 0.039
Penetrance of Nn, f4 0.22 - f 0.78 Penetrance of nn, f 0.91 0.67 't 0 . 78
LR criterion 17.22 15.57
Probability of greater 0.00003 0.00008

Page 37
All likelihood surfaces scanned in the study exhibited a single
peak which, in general terms, was always fairly well defined. Figures 3.1
and 3.2 ilustrate typical likelihood surfaces in Pietrain/Hainpshire and in
Landrace respectively.
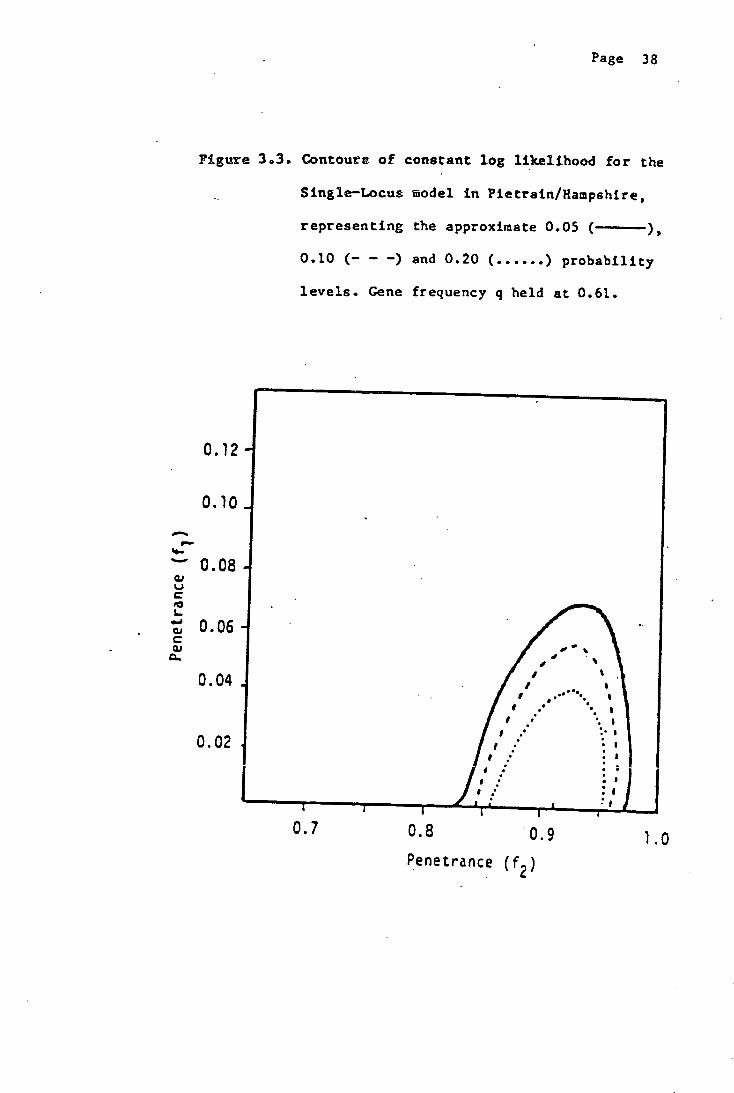
Model 1. Single-Locus: Table 3.2 shows the parameter estimates
under the Single-Locus model in Pietrain/Hampshire. The estimated
penetrance of the heterozygous genotype was 0.00, which is the value
assumed by the SLR hypothesis. Approximate confidence regions are shown
in Figures 3.3 and 3.4.
The results of the Single-Locus analysis in Landrace are summarized in
Table 3.3. The SLR hypothesis was rejected on the ?(.Z test (P<0.01)
indicating that the addition of a non-zero penetrance for the
heterozygotes made a significant improvement in the fit of the model to
these data. Approximate confidence regions for the two penetrances are
shown in Figure 3.5.The marked increase in V when moving from the general
Single-Locus model to the SLR hypothesis is to be noticed. This could be
interpreted as V conferring some flexibility to an intrinsically
inadequate hypothesis.
Model 2. Two-Locus: Table 3.4 summarizes the analysis under the
Two-Locus model in Pietrain/Hampshire. There was no indication of linkage
and the amount of linkage disequilibrium between the two loci was small
-about 20 % of the maximum disequilibrium possible. The inclusion of
these parameters did not improve significantly the fit of the model. The
SLR hypothesis was thus tested against the Restricted Two-Locus model;
0.7 0.8 0.9 1.0
0.12
0.10
0.08 C)
C) 0.06 C)
0
0.04
0.02
Page 38
Figure 3.3. Contours of constant log likelihood for the
Single—Locus model in Pietrain/Hazpshjre,
representing the approximate 0.05 ( —),
0.10 (— — —) and 0.20 ( ...... ) probability
levels. Gene frequency q held at 0.61.
Penetrance (f 2 )

Page 39
Figure 3.4. Contours of constant log likelihood for the
Single-Locus model in Pietrain/Hampshire,
representing the approximate 0.05 ( ),
0.10 (— — —) and 0.20 ( ......) probability
levels. Penetrance of Nn ) held at zero.11
0.7
00
LI
Gj
.. :'
a- G.J
C)
C) 0.5
'..
0.4
0.7 0.8 0.9
1.0
Penetrance (f2)

Page 40
Table 3.4. Parameter estimates and differences in log likelihood
in Pietrain/Hampshire under Model 2 (Two-Locus).
Parameter
Generalized two-locus model
Restricted two-locus
model D0, 9 0..5
SLR hypothesis
v0
Gene frequency, q 0.66 0.64 0.61
Gene frequency, v 0.50 0.38 -
Penetrance, f 1.00 0.97 0.91
Linkage disequilibrium, D -0.034 - -
Recombination frequency,O 0.50 - --
LR criterion 1.72 2.26 #
Probability of greater 0.42 0.13 #
# SLR hypothesis versus Restricted two-locus model.

Page 41
Table 3.5. Parameter estimates and differences in log likelihood in
British Landrace under Model 2 (Two—Locus).
Restricted Two—Locus SLR SLD model hypothesis hypothesis
Parameter VVCOVqyçO c11, VqCO\qO
Mean gene frequency, 0.63 0.47 -
Variance of q, Vq 0.093 0.100 -
Mean gene frequency, 0.67 - 0.74
Variance of v, V 0.009 - 0.039
Covariance (Cov(v) ) —0.025 - --
Penetrance, f 0.81 0.67 0.78
LR criterion 9.83 8.19
Probability of greater 0.020 0.042

Page 42
the LR criterion was 2.26 which is not a very conclusive result for a
variable. Figure 3.6 shows the confidence regions for the two gene
frequencies under the restricted Two-Locus model in Pietrain/Hampshire.
The results of the analysis under the Two-Locus model in Landrace are
shown in Table 3.5. After testing the SLR hypothesis the LR criterion was
9.83 which is statistically significant for a X.variable. Therefore, the
SLR hypothesis was also rejected under the Two-Locus setting (P<O.Ol).
DISCUSSION
The parameter estimates under the Single-Locus model in
Pietrain/Hampshire differed somewhat from those obtained by Smith and
Bampton (1977). The discrepancy could be due to the fact that only a
subset of their data was used in the present study. In agreement with
Smith and Bampton the likelihood was maximised when the penetrance of the
heterozygotes was equal to zero. These results do not disprove the SLR
hypothesis. A different picture emerges from the Single-Locus analysis in
Landrace. The parameter estimates indicate that about a quarter of the
heterozygotes were positive reactors after the halothane test. An
inspection of the Landrace data does not reveal an easy agreement with the
SLR hypoithesis. On the one hand there is a deficiency of segregating
litters among the negative matings while, on the other hand, there is
heterogeneity in the segregation ratios among the progeny from the
positive matings, with several families exhibiting what would appear to be
very low penetrance values. No such heterogeneity was observed among the
positive matings in Pietrain/Hampshire.

?agc 43
Figure 3.5. Contours of constant log likelihood for the
Single-Locus model in Landrace, representing
the approximate 0.05 ( ), 0.10 (— — — )
and 0.20 (......) probability levels. Mean
gene frequency q held at 0.24; variance of
gene frequency (V q ) held at zero.
In
0
'-' -
v4 C~P 44
Cn co I.' 0
w
C
-I
0
I •l%
II II
I
I
II I , II I , I , I / S
I, •• + •1l
:s J'/ .•
/, .. SI
I , .•
0.5 0.6 0.7 0.8 0.9
Penetrance )

Page 44
Figure 3.6. Contours of constant log likelihood for the
Restricted Two-Locus model in Pietrain/
Hampshire, representing the approximate 0,05
( ), 0.10 (— - —) and 0.20 (......)
probability levels. Penetrance (f) held at 0.97.
0.8
0.7
> 0.6
U C
C-
I-
C Cj
UD 0.4
0.3
0.2
/ . I •
I
I
I .8 • S
• S ;5
(.
$ I. :I
+ $51 I I
• .11
a: •5I I ll
$5 ,
I •. I. '
/ t. .. I
\ % I . •$ I •. .•
0.4 0.5 0.6 0.7 0.8
Gene frequency (q)

Page 45
It is possible to test the hypothesis that both heterozygous and
homozygous pigs did react to the anaesthetic with equal penetrance; this
amounts to test a single-dominant (SLD) hypothesis. As shown in Table
3.3, the SLD hypothesis was rejected on the 2C test result. Thus, in
contrast to Pietrain/Hainpshire, there appears to be a gene dosage effect
in Landrace whereby carriers of a single copy of the susceptibility
allele would have a smaller (though non-zero) penetrance than carriers of
two copies of such allele. The reasons for this difference between
Pietrain/Hampshire and British Landrace are unknown. As the two
populations were kept on different farms there could have been differences
in relevant environmental circumstances making some of the heterozygous
Landrace pigs susceptible to the anaesthetic. However, as little is known
about such environmental factors it is difficult to speculate on how a
difference might arise. It is possible, though, to conceive a number of
genetic explanations. Most of them -such as the presence of more than two
alleles at the susceptibility locus or the breeds differing in modifier or
suppressor gene frequencies- require a broadening of the simple
single-biallelic model favoured so far. The Two-Locus model in the
present study represents one such explanation -not necessarily the most
adequate, of course.
Halothane susceptibility thus resembles the double muscle trait in
catiie In that the mode of Inheritance seems to differ between breeds
Under a single-locus hypothesis the double muscle' trait appears to be
recessive in some breeds and dominant in others (Menissier, 1982). Other
similarities between these two traits have already been pointed out
(011ivier, 1980).

Page 46
Although not conclusive, the results of the analysis under the
Two-Locus setting in Pietrain/Hampshire suggest that a model removing
genetically part of the variation in penetrance could explain the
observations better than a single locus with penetrance as a purely
environmental parameter. A mixed model -a major locus, polygenic
variation and environmental effects all contributing to an underlying
liability scale with a threshold determining susceptibility (Morton and
MacLean, 1974)- could perhaps perform the task more flexibly. However, it
is unlikely that in the present circumstances it would have fitted the
data significantly better than the simple two-locus model.
The Two-Locus analysis in Landrace also rejected the SLR hypothesis.
It is possible to test the hypothesis that
q = 1 and Vq = Cov(V) = 0;
after such restrictions the Two-Locus model yields the single-dominant
(SLD) hypothesis. The LR criterion indicated that the Two-Locus model
also fitted the data better than the SLD hypothesis (P<0.05). The maximum
likelihood obtained under the general Single-Locus model was higher than
that obtained under the Two-Locus ode1 It was not possible to test both
models as hypothesis in the same analysis. A general model allowing such
a test would have been unwieldy given the structure of the Landrace
population.
In summary the SLR hypothesis, favoured so far as the mode of

Page 47
inheritance of halothane susceptibility in pigs, could not be conclusively
disproved in Pietrain/Hampshire although there was a suggestion that part
of the variation in penetrance could be genetically determined. The SLR
hypothesis was clearly rejected as the mode of inheritance in British
Landrace. It is important to emphazise the fact that the Landrace parents
were tested in their original farms; the varying environmental conditions
might have increased the probability of misclassifying the reactions. The
lack of matings between reactors and non—reactors and the mixture that
constituted the parental group in this breed should also be eniphazised.
Because of the latter the probability models describing the population
required parameters such as variances and covariance of gene frequencies;
conclusions of general interest were thus conditional on the value of
nuisance parameters in the models. Taking into account all these
deficiencies the present findings should be considered as preliminary
indications that the generally accepted single and strictly recessive mode
of inheritance may not be adequate for the British Landrace breed. Should
these findings be confirmed, a unified explanation of the observations in
different breeds will probably require a more comprehensive genetic model
than a single—biallelic locus. Such new developments, however, would not
detract from the usefulness of the halothane test as a practical screening
tool for reducing the incidence of Porcine Stress Syndrome in pig
populations by means of selection.

Page 48
CHAPTER 4. STUDIES ON THE TIME OF ONSET OF REACTION
TO HALOTHANE ANAESTHESIA
INTRODUCTION
It was shown in Chapter 3 that a model involving a susceptibility
locus and a genetic device accounting for part of the variation in
penetrance could describe the inheritance of reaction to halothane
anaesthesia better than the widely accepted single-recessive model, where
penetrance is assumed to have an entirely environmental determination.
The time of onset of reaction is a concrete quantity which could be
related to the concept of penetrance as follows: the test duration being
limited, those pigs having longer reaction-time would be classified as
negative reactors; penetrance would thus be lowered. The question then
arises as to what proportion of the variation in reaction-time is under
genetic control; if it exists, such genetic variation should be regarded
as modifying the susceptibility status determined by the main locus (or
loci). The purpose of this study was to estimate phenotypic and genetic
parameters of the time taken to react positively to halothane anaesthesia
by Pietrain/Hampshire and Landrace pigs.
MATERIAL AND METHODS
Animals.

Page 49
The data for these studies were collected from a Pietrain/Hampshire
(PTH) and a British Landrace experimental line, both selected for
Increased susceptibility to halothane at the Animal Breeding Research
Organisation (ABRO). The PTH line was selected for six years, with some
overlapping of generations. Two non-overlapping generations of selection
were carried out in the Landrace line (see Webb, 1981). The two lines
were kept on different farms. All pigs received a halothane test at about
eight weeks of age, as described by Webb and Jordan (1978). The duration
of the test was 3 minutes, except In the second Landrace generation when
it was extended to 5 minutes. The pigs were classified as positive,
doubtful and negative reactors; only the former were selected as breeding
stock. All positive reactions recorded in the two lines provided
information for the present studies. The trait under study,
reaction-time, was defined as the time elapsed from the start of
anaesthetic administration until the animal exhibited definite signs of
halothane susceptibility: muscle rigidity at the hind limbs, after which
administration of anaesthesia was interrupted. These data were used in an
attempt to estimate the heritability of reaction-time at eight weeks of
age. Records from 403 PTH and 291 British Landrace halothane positive
pigs. from the two selection lines were available for this purpose.
In order to assess the effect of age on halothane susceptibility three
trials were carried out at ABRO. The design and results of these trials
will be described in Chapter 5; only relevant information will be given
here. Trial 1 comprised the progeny of the fourth year of matings of the
PTH susceptible line. In addition to the test at 8 weeks these pigs
received two previous 3-minute tests, at about 3 and 5 weeks. A similar

Page 50
trial (Trial 2) was carried out with the progeny of the first generation
of the Landrace susceptible line. Trial 3 was performed on the second
Landrace generation: all pigs each received four 5-minute tests, at about
3, 5, 7 and 9 weeks of age. As the animals in these trials received
repeated tests the results allowed estimation of repeatability of
reaction-time. The number of pigs at each test, their average age and
weight, and the number of positive reactors in Trials 1, 2 and 3 are shown
in Table 4.1.
Statistical analyses.
Analysis of heritability. Least squares analyses of variance were
carried out, using the computer program LSML76 (Harvey, 1977).
Exploratory analyses showed that the day of testing had very important
effects on reaction-time. In each breed, separate hierarchical analysis
were then performed on the log 40
reaction-time, fitting a model involving
test-day, sires, dams, sex and weight (covariate). It was assumed that
sires were nested within test-day although, in fact, about 30 % of them
appeared twice; those appearances were counted as different sires. Table
4.2 shows the degrees of freedom from the analyses of variance and the
expectation for the sires mean squares. Standard errors for the
heritabilities were estimated as suggested by Woolf (cited by Faicuuer,
1963).
Analysis of repeatability. The time of onset of all positive
reactions recorded in Trials 1, 2 and 3 (Table 4.1) were analysed by least
squares analysis of variance, using the LSML76 program. Each trial was

Page 51
Table 4.1. The number of pigs at each test, their average age (SD),
weight (SD) and the number of positive reactors, in
Trials 1, 2 and 3.
Test
Trial Trait 1 2 3 4
No. pigs 66 66 66 -
Trial I Age (days) 18(1.8) 35(1.8) 53(1.8) -
PTH Weight (kg) 4.7(2.4) 8.2(2.4) 14.3(2.4) -
(3—mm) No. positive 27 42 55 -
No. pigs 201 198 198 -
Trial 2 Age (days) 21(2.5) 35(2.5) 56(2.5) -
Landrace Weight (kg) 5.3(2.4) 8.7(2.4) 15.4(2.4) -
(3—mm) No. positive 39 123 117 -
No. pigs 253 249 246 244 Trial 3 Age (days) 21(0.9) 35(0.9) 49(0.9) 63(0.9)
Landrace Weight (kg) 5.7(2.7) 9.6(2.7) 15.2(2.7) 19.7(2.6) (5—mm) No. positive 161 215 205 220
It is"
Page 52
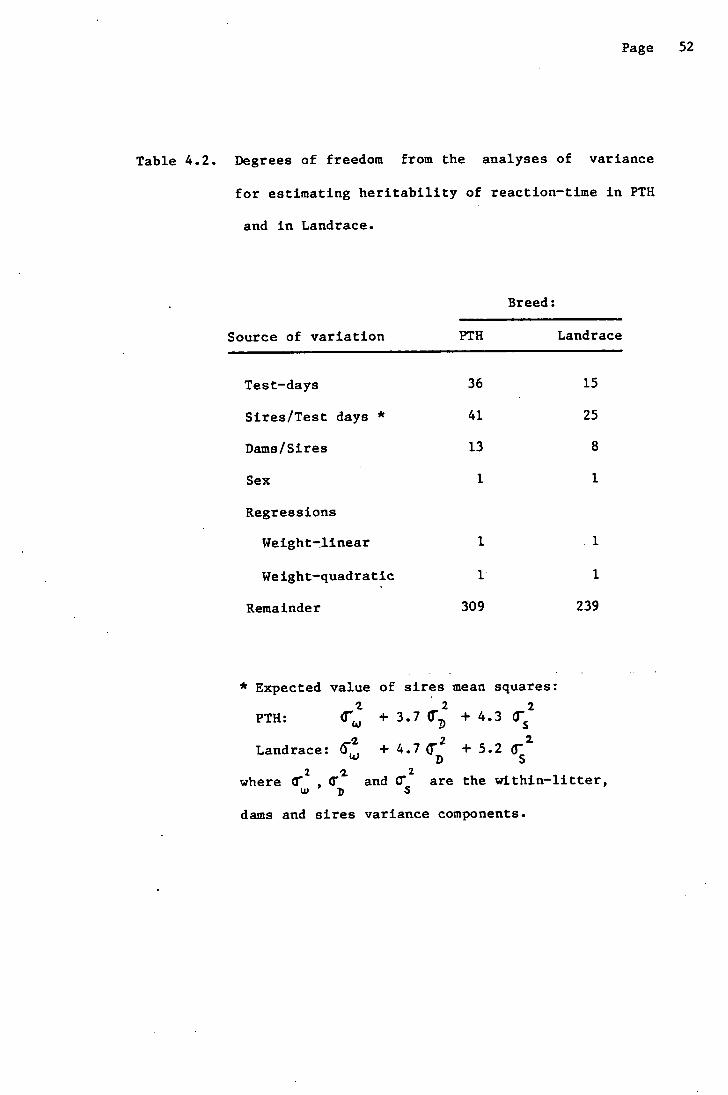
Table 4.2. Degrees of freedom from the analyses of variance
for estimating heritability of reaction-time in PTH
and in Landrace.
Breed:
Source of variation PTH Landrace
Test-days 36 15
Sires/Test days * 41 25
Dams/Sires 13 8
Sex 1 1
Regressions
Weight-linear I 1
Weight-quadratic 1 1
Remainder 309 239
* Expected value of sires mean squares: t 2 2
PTH: + 3.7 T3 + 4.3 TS
Landrace: + 4.7 + 5.2
where T , and 0 are the within-litter, w D S
dams and sires variance components.

Page 53
analysed separately. A simple analysis was done first to examine the
effects of test and sex on reaction—time. The statistical model was
Y = ,U. + T. + S. J U + (TS).. + e..
4j K A.
where Y.. is the reaction—time of the kth pig of the jth sex (male or
female) in the ith test (1, 2, 3 or 4).
In a second analysis a model involving a term for individual pigs was
fitted to different subsets of data from Trials 1, 2 and 3 in order to
2 '2. estimate the variances between () and within (cf) pigs. Repeatability
was estimated as
2.2 '2.
t =T /( + ¶, )
with standard error as suggested by Swiger et al (1964). The model
used was
2. Y )A +S
+/W ~/w ~ e.
.1 j1'c .2. Kt
where Y j is the log 40
of the kth reaction—time of the kth pig,
within the jth sex, having a live weight W. As Trials 1 and 2 included
three tests they allowed estimation of t between 3 different pairs of
tests, as well as among all three tests. Trial 4, comprising four tests,
allowed estimation of t between 6 different pairs of tests and 4 different
Page 54
triplets, as well as among all 4 tests. The coefficients k for the
2. variance component , in the expectation of the mean squares for P,
ranged from 1.25 to 1.82 when t w is estimated between pairs of tests;
from 1.91. to 2.82 when triplets were used; k = 3.27 when t was estimted
among all four tests in Trial 3.
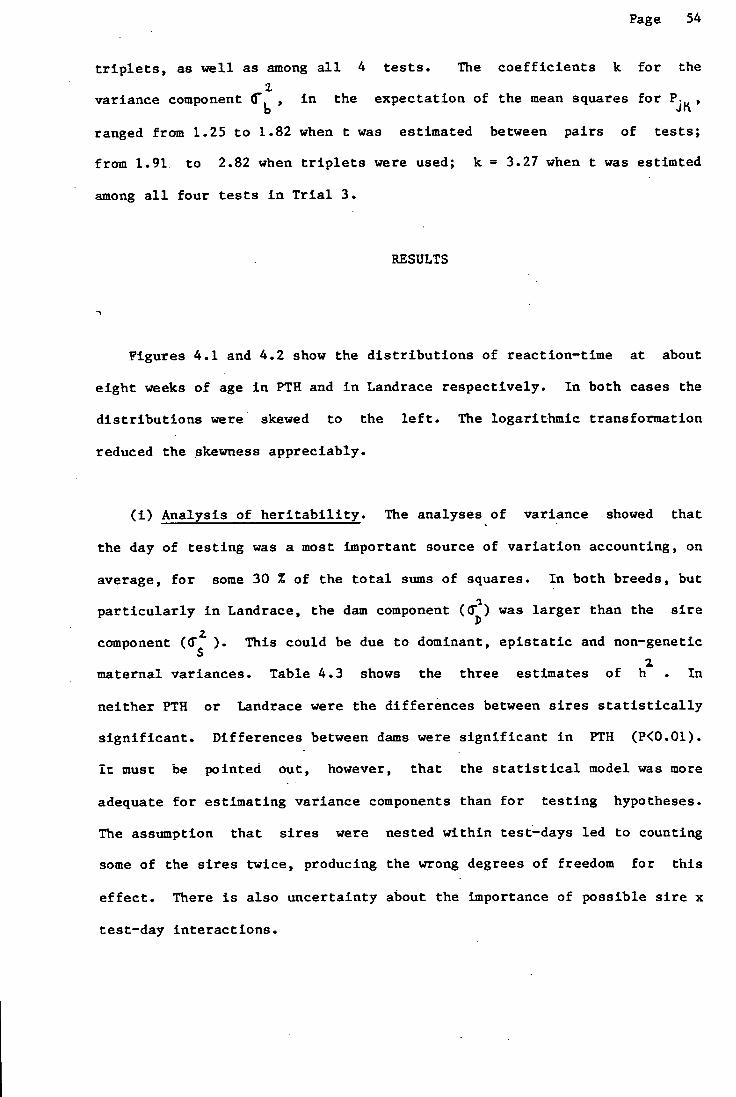
RESULTS
Figures 4.1 and 4.2 show the distributions of reaction-time at about
eight weeks of age in PTH and in Landrace respectively. In both cases the
distributions were skewed to the left. The logarithmic transformation
reduced the skewness appreciably.
(i) Analysis of heritability. The analyses of variance showed that
the day of testing was a most important source of variation accounting, on
average, for some 30 Z of the total sums of squares. In both breeds, but
particularly in Landrace, the dam component (0) was larger than the sire
component (cT z ). This could be due to dominant, epistatic and non-genetic
maternal variances. Table 4.3 shows the three estimates of h2 . In
neither PTH or Landrace were the differences between sires statistically
significant. Differences between dams were significant in PTH (P<0.01).
It must be pointed Out, however, that the statistical model was more
adequate for estimating variance components than for testing hypotheses.
The assumption that sires were nested within test-days led to counting
some of the sires twice, producing the wrong degrees of freedom for this
effect. There is also uncertainty about the importance of possible sire x
test-day interactions.

W
60
50
40
30
20
10
Page 55
Figure 4.1.. Distribution of. time of onset of reaction to
halothane'at eight weeks of age in Pietrai,V
Hampshire pigs.
30 60 90 120 150,180
Reaction time (sec)
Mean = 84 sec
Standard deviation = 40.3 sec
Coefficient of skewness = 1.45
coefficient of kurtosis = 2.00

C, .0 ou u IZO 150 180 210 240 270 300
Reaction time (sec)
Page 56
Figure 4.2. Distribution of time of onset of reaction to halothane at about eight weeks of age in (a) the first and (b) the second generation Landrace.
(a) 50
40
30
20
10
0•
30 60 90 120 150 180
Reaction time (sec)
(b)
50
40
30
20
10
(a) Mean = 117 sec Standard deviation = 40.8 sec -Coefficient-of skewness = 0.06 Coefficient of kurtosis = -1.14
(b) Mean = 145 sec Standard deviation = 65.3 sec Coefficient of skewness = 1.14 Coefficient of kurtosis = 0.55

Page 57
Table 4.3. Heritability estimates (SE) of the time taken to react
to halothane anaesthesia in Pietrain/Hampshire and in
British Landrace pigs.
Heritability estimate
2. 2. Breed h
2 s h hs+D
Pietrain/Hampshire 0.65 (0.592) 0.90 (0.527) 0.77 (0.144)
British Landrace 0.12 (0.582) 0.45 (0.694) 0.28 (0.277)
(ii) Analysis of repeatability. The results from the analyses of
effects of test and sex on reaction—time indicated that these were not
important sources of variation in Trial 1. In Trials 2 and 3, however,
the tests were a significant source of variation; in addition, females in
Trial 3 reacted faster than males. There were no significant test x sex
interactions. These results are shown in Table 4.4. There seems to be a
difference between trials, Trial 3 exhibiting longer reaction—times than
the other two. There also seems to be a trial .x test interaction, as the
pattern of reaction time lengthening with age which was observed in Trials
I and 2 was not observed in Trial 3. Since the trials were analysed
separately the statistical significance of these differences could not be
tested.
The reduction in total sums of squares after fitiig the term
(pigs within sexes) averaged 69 % when analysing pairs of test and 50 %
when dealing with triplets, over the three trials. Table 4.5 shows the
different estimates of repeatability in the three trials. In general
terms the repeatabilities were somewhat lower in Trial 3 than in the other

Page 58
Table 4.4. Least squares means (X) and standard deviations (SD) of
reaction-time (seconds) for the four tests and the two
sexes, and F ratios from the analyes of variance, in
Trials 1, 2 and 3.
Trial I Trial 2 Trial 3 PTH (3-mm) Landrace (3-mitt) Landrace (5-mitt)
Source X SD X SD X SD
Test number
1 75 39.0 85 41.2 163 64.7 2 84 39.5 101 38.8 106 64.5 3 96 40.0 118 38.9 138 64.4 4 - - - - 146 63.8
F-ratio: 2.70 11.19** 26.15**
Sex
Males 85 40.2 99 47.8 149 65.0 Females 85 40.7 104 43.1 128 65.0
F-ratio: 0.00 0.98 21.58**
** P < 0.01.

1-2-4 1-3-4
1-2-3-4
0.11 0.050 0.11 0.18 .051 0.18
0.15 0.038 0.15
Page 59
Table 4.5. Repeatability (t) of reaction time estimated
over different tests, in Trials 1, 2 and 3.
Trial 1 Trial 2 Trial 3 Pooled Test
combination t SE ̂t SE t SE t
1-2 0.40 0.191 0.44 0.135 0.34 0.074 0.36 2-3 0.39 0.155 0.40 0.087 0.30 0.070 0.33 3-4 - - - - 0.20 0.073 0.20
1-3 0.26 0.216 0.44 0.145 0.24 0.084 0.27 2-4 - - - - 0.18 0.072 0.18
1-4 - - - - 0.04 0.091 0.04
1-2-3
0.29 0.080 0.39 0.075 0.20 0.052 0.25
2-3-4 - - - - 0.23 0.047 0.23'

Page 60
two trials. There was also a decreasing trend in repeatability, as
estimated between pairs of tests, as the time interval between tests
A increased. The t values ranged from about 0.30 when this interval was
about two weeks to 0.04 when it was six weeks. A similar trend can be
A observed among the t values estimated from triplets.
DISCUSSION
It was shown in a previous section that a model accounting genetically
for variation in penetrance might fit the inheritance of halothane
susceptibility better than a single-locus model with penetrance as a
purely environmental parameter. The main purpose of the present study was
to detect signs of genetic variation in the time susceptible pigs take to
react to halothane, associating this concrete quantity with the concept of
penetrance. Figure 4.3 illustrates how, with a given test duration,
differences in the mean and variance, of reaction-time between two
hypothetical populations, a and b, might cause a proportion of susceptible
subjects to be classified as negative reactors.
The number and size of the sibships and the shape of the frequency
distributions discouraged the search for a major gene affecting
reaction-time. Such analysis was further discouraged by the possibility
that any multimodality in the frequency distributions (Merat, 1968) might
have been blurred by a too short halothane test. Instead, the analysis
was directed towards detecting differences between half-sib groups and
estimating repeatabilities and heritabilities, even though the structure
and amount of data were far from ideal for these purposes. Furthermore,
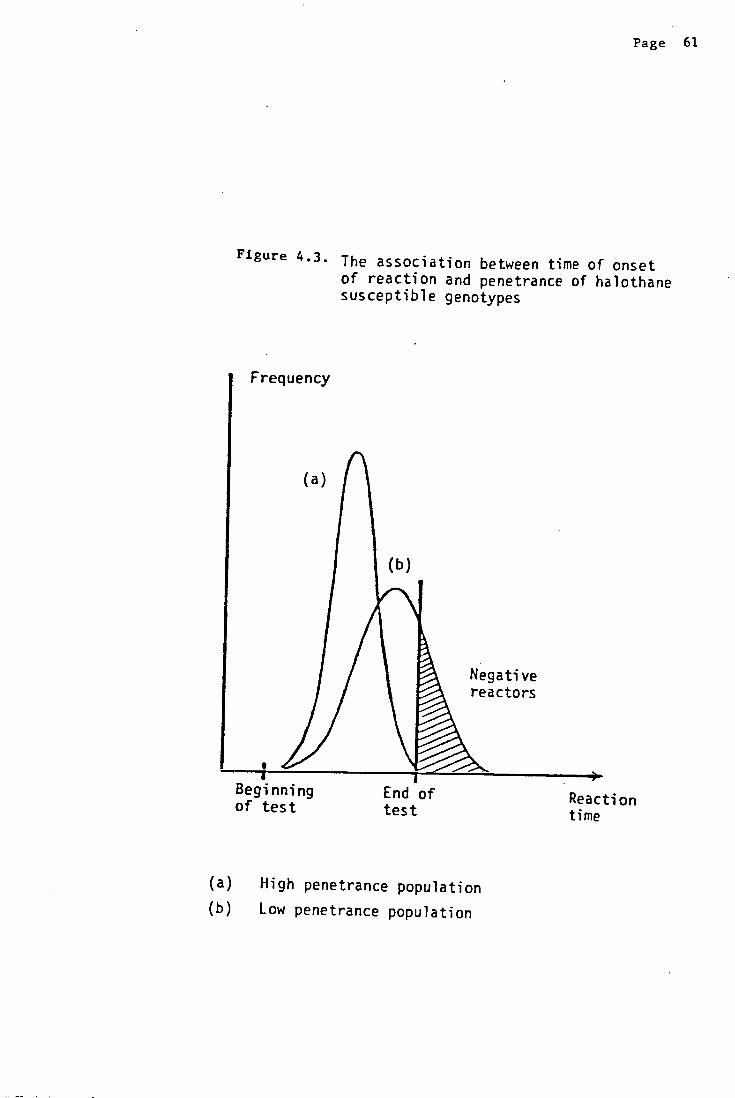
Page 61
Figure 43, The association between time of onset of reaction and penetrance of halothane susceptible genotypes
Beginning End of Reaction of test test time
High penetrance population
Low penetrance population

Page 62
if the test was shorter than the range of reaction-times, there could have
been selection for fast reactions among the parents (which were selected
for susceptibility on a 3-minute basis) and truncation of the phenotypic
frequency distributions among the subjects of these studies. This could
have biased the heritability and repeatability estimates, probably
downwards, while increasing their standard errors (Robertson, 1977).
As for the possibility of truncation, when the test was extended to 5
minutes, in Trial 3, about 18 % of all positive reactions occurred after
the third minute, both at 7 and at 9 weeks of age (Figure 4.4). The
longer mean reaction-time in Trial 3 was, In fact, a consequence of the
longer halothane test. Thus, a 3-minute test could have been too short
for the purposes of this study. Methods of estimation on censored data
are available; Maximum Likelihood estimation would be appropriate for the
type of censoring in the present data. However, a distribution function
has to be assumed and there is no evidence which would justify the
adoption of any particular one. Other methods of estimation are very
troublesome (Kendall and Stuart, 1979; vol 2, pp 551-556). Therefore,
conventional estimation methods were used ignoring the problem of
censoring; the study, however, was intended as a tentative, preliminary
examination.
The fact that the herItabilIty estimates were all higher than the
repeatability estimates in PTH is a somewhat anomalous result. Perhaps
the requirement that the trait at different ages remains genetically the
same was not met, even though reaction-time was not greatly affected by
the different tests in this breed. However, the heritabilities were
estimated with very low precision and the figures in Table 4.3 are

50
40
30
20
10
0
(b)
C
50
40
30
20
10
0
(a)
A'
Page 63
Figure 4.4. Distribution of time of onset of reaction to halcthane at seven (a) and nine (b) weeks of ace in British Landrace pigs (Trial 3).
1 2 3 4
1 2 3 4 5
Reaction time (mm)
Reaction time (mm)

Page 64
reported for illustration more than anything. The analyses failed to
detect significant differences among sires, both in PTH and in Landrace.
The only results that could serve as indication of genetic determination
are the repeatabilities, which were estimated with better precision;
however, they merely represent an upper limit to the degree of genetic
determination of a trait. The estimates were in broad agreement with a
value of 0.3 reported by Webb and Jordan (1979).
This study thus failed to produce satisfactory evidence of genetic
variation in the time of onset of reaction to halothane, which should not
be surprising in view of the limited information available. Further
research is necessary, on what could be an Important aspect of halothane
susceptibility. The possibility of censoring the data with a test too
short must be taken into account. There are reports of halothane positive
reactions recorded, on average, after 8 and 28 minutes of anaesthesia, in
two different pig crosses (Britt, Kallow and Endrenyi, 1978) and even
after 40 minutes in Poland China pigs (Allen, 1980; Jones et al., 1972).
This suggests that a test longer than 5 minutes could be necessary for a
proper study of the genetics of reaction-time and for a better
understanding of halothane susceptibility.
Reaction-time could enter in different ways in models for the
nhertance of halothane susceptIbIlIty, as Illusttated by the two
following examples. Figure 4.5 shows how the effects depicted in Figure
4.3 might be caused by gene subtitution at a single locus. The variance
in population a is assumed to be environmental. The increases in mean and
variance in population b are due to segregation, at intermediate
frequency, of a mutant allele. This allele increases reaction-time in a

raL .1 Ofl
time nn nn tin 55 55 ss
Page 65
Figure 1e5 • A model for the genetic control of penetrance of a halothane susceptible genotype (nn) by a single locus with two alleles : S and s, affecting reaction-time (see text).
Beginning End of of test test
Population a : frequency (s) = 0 Population b : frequency (s) = 0.5

Page 66
strictly additive fashion but, given the test duration, it appears to
suppress the reaction in a recessive way. Such a model is not entirely
different from the two-locus model used previously to study the mode of
inheritance of halothane susceptibility. The extension to polygenic
control of reaction-time is an obvious development.
The second example is sketched in Figure 4.6. As reported previously,
under a single locus model susceptibility was strictly recessive in PTH
while one homozygote and about a half of the heterozygotes appeared to be
susceptible in Landrace. Breed differences in modifier gene frequencies,
or multiple allelism at the susceptibility locus, were mentioned as
hypothetical genetic explanations. Figure 4.6 shows how they could be
expressed in terms of reaction time. All pigs would, sooner or later,
react to the anaesthetic. A major locus controls the time of onset of
reaction. The breeds differ in modifier frequencies (N is modified to N)
or in allelic frequencies at the reaction-time locus. Of course, the
models sketched in Figures 4.5 and 4.6 can be combined, and other,
different models are possible. A feature of these models is that the mode
of inheritance of susceptibility is an artifact of the test duration.
Thus, it could he important to examine properly the role of the time of
onset of reaction in the halothane susceptibility phenomenon, for which
halothane tests longer than 5 minutes may be required. The findings in
this s tudy that of _.cc_.____i b 1. LL '¼ r
weight) and sex of the pigs, and that the day of test can be a very
Important source of random variation might help in the planning of
experiments and data collections for future studies.
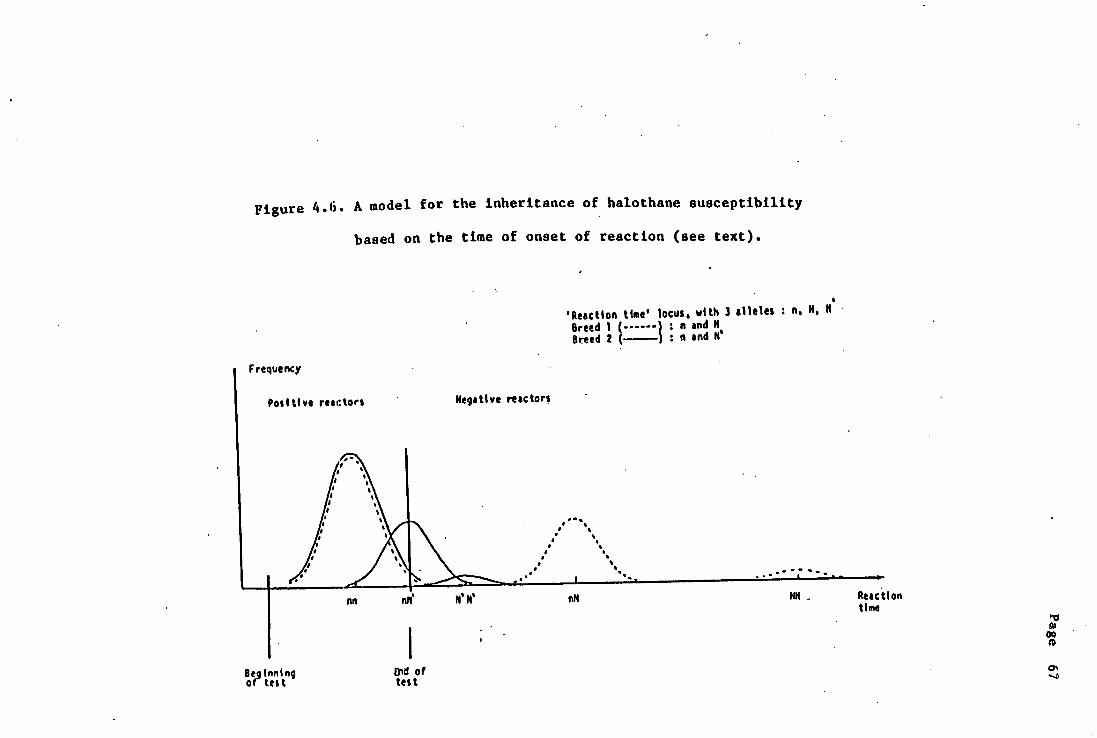
Figure 4.6. A model for the inheritance of halothane susceptibility
based on the time of onset of reaction (see text).
'Reaction time' locus, with 3 alleles : n, N, N '
Breed (- ...... ) :n and N ore ed 2 ( ) : nand N'
Ion
00
0' Beoinnlng Did of orteit test

Page 68
CHAPTER 5. THE EFFECT OF AGE ON HALOTHANE SUSCEPTIBILITY
INTRODUCTION
The diagnosis of Porcine Stress Susceptibility by means of the
halothane test has been done at ages ranging broadly from 20 to 100 days
(Webb, 1980). From a practical point of view it may be convenient to
carry out the test at the youngest possible age, as pigs are then easier
to handle. However, since many traits cannot be observed before a certain
age of onset, a point of some interest is whether the incidence of
halothane susceptibility changes with the age of the animals. If this is
the case it might be necessary to establish a suitable age for testing in
practice. From a research viewpoint, appropriate allowances for an
age—dependent penetrance might have to be made when studying the mode of
inheritance of susceptibility in pigs of varying ages. It seems
important, therefore, to determine whether there are changes in the
incidence of susceptibility with advancing age. The purpose of this study
was to assess the effects of age on the frequency of halothane
susceptibility in pigs which were repeatedly exposed to the anaesthetic.
MATERIAL AND METHODS
Experimental.
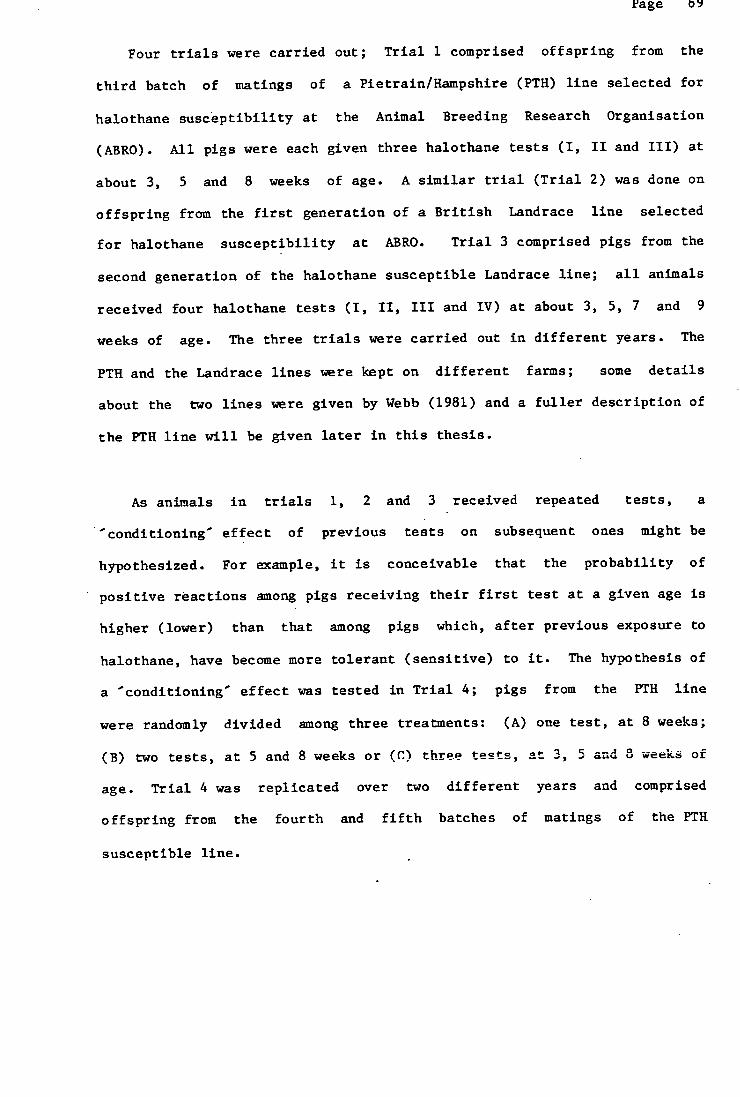
Page b5
Four trials were carried out; Trial 1 comprised offspring from the
third batch of matings of a Pietrain/Hainpshire (PTH) line selected for
halothane susceptibility at the Animal Breeding Research Organisation
(ABRO). All pigs were each given three halothane tests (I, II and III) at
about 3, 5 and 8 weeks of age. A similar trial (Trial 2) was done on
offspring from the first generation of a British Landrace line selected
for halothane susceptibility at ABRO. Trial 3 comprised pigs from the
second generation of the halothane susceptible Landrace line; all animals
received four halothane tests (I, II, III and IV) at about 3, 5, 7 and 9
weeks of age. The three trials were carried out in different years. The
PTH and the Landrace lines were kept on different farms; some details
about the two lines were given by Webb (1981) and a fuller description of
the PITH line will be given later in this thesis.
As animals in trials 1, 2 and 3 received repeated tests, a
conditioning effect of previous tests on subsequent ones might be
hypothesized. For example, it is conceivable that the probability of
positive reactions among pigs receiving their first test at a given age is
higher (lower) than that among pigs which, after previous exposure to
halothane, have become more tolerant (sensitive) to it. The hypothesis of
a conditioning effect was tested in Trial 4; pigs from the PTH line
were randomly divided among three treatments: (A) one test, at 8 weeks;
(B) two tests, at 5 and 8 weeks or (C) three tests, at 3, 5 and 8 weeks of
age. Trial 4 was replicated over two different years and comprised
offspring from the fourth and fifth batches of matings of the PTR
susceptible line.

Page 70
The halothane testing procedure was described by Webb and Jordan
(1978). Anaesthesia was induced with 4 to 8 % halothane concentration in
oxygen (2-3 litres/minute) and maintained with a 0.5 to 2.0 % halothane
concentration. In all trials the test duration was 3 minutes except in
Trial 3, when it was extended to 5 minutes. The pigs were scored as
positive reactors (HP) when clear rigidity of the hind limbs was observed,
and negative reactors (RN) when they remained relaxed throughout the test.
Those pigs for which a clear diagnosis was not possible were scored as
doubtful (HD). Table 5.1 shows the distribution of pigs in the four
trials; Table 5.2 shows the average age and weight of the pigs at each
test. All pigs were offspring of HP x HP matings.
Statistical analysis.
The method of maximum likelihood was used to estimate the effects of
test and other variables on the probability of obtaining HP reactions.
Each observation y4 , y1 ,...,y was considered a binary random variableTL
taking value I if the individual was HP and 0 otherwise (i.e. RD or RN),
with probability
Pr(y. = 1) p. , !. 1, 2,..., ii. .4.
A transformation was required to represent the probabilities p. by a
linear function of r explanatory variables so that, on an underlying
scale

Page 71
Table 5.1. The total number of pigs, and of HP and RD reactions,
by test and sex in trials 1, 2 and 3, and by test
and treatment in Trial 4.
Trial 1 Trial 2 Trial 3 Trial 4
Test Reaction d' - 2 0 2 A B C
I All 34 32 105 96 130 123 - -- 71 HP 14 1`3 13 26 76 85 -- - 51 HD 4 8 8 9 9 10 - -- 3
II All 34 32 104 94 128 121 - 50 70 HP 24 18 56 67 108 106 -- 39 42 HD 1 6 5 6 6 3 -- 4 3
III All 34 32 104 94 125 121 54 48 64 HP 24 28 49 68 99 106 37 54 61 RD 8 2 8 8 6 7 8 4 3
IV All -- -- -- -- 123 121 - -- -
HP - -- - -- 105 115 - - -
RD - -- -- -- 4 2 - - -
Table 5.2. The average age (days) and weight (kg) at each test
in all trials (standard errors in brackets).
Trials 1 0 2 and 4 (pooled) Trial 3
Test Age Weight Age Weight
I 19 (2.2) 5.1 (2.5) 21 (09) 5.7
II 35 (2.1) 8.6 (2.5) 35 (0.9) 9.6 (2.6)
III 54 (2.0) 15.2 (2.6) 49 (0.9) 15.2 (2.6)
IV - --- - 63 (0.9) 19.7 (2.6)

Page 72
where the x. are the values of the explanatory variables for the ith xj
observation. The logistic transformation was chosen, which defines the
logit of p. as
L ln(p. 1(1 - P ;. ))
(Finney, 1970), so
p.e /(l+e )
As the logit scale ranges from - oG to + oO it allows the fitting of
linear models without any restriction on the parameters; furthermore, the
logistic probability density function
& f(&)e /(1+e )
is symmetric about 0 and, as shown in Figure 5.1, very similar to a
normal distribution.
The individual observations y were assumed to come from a binomial
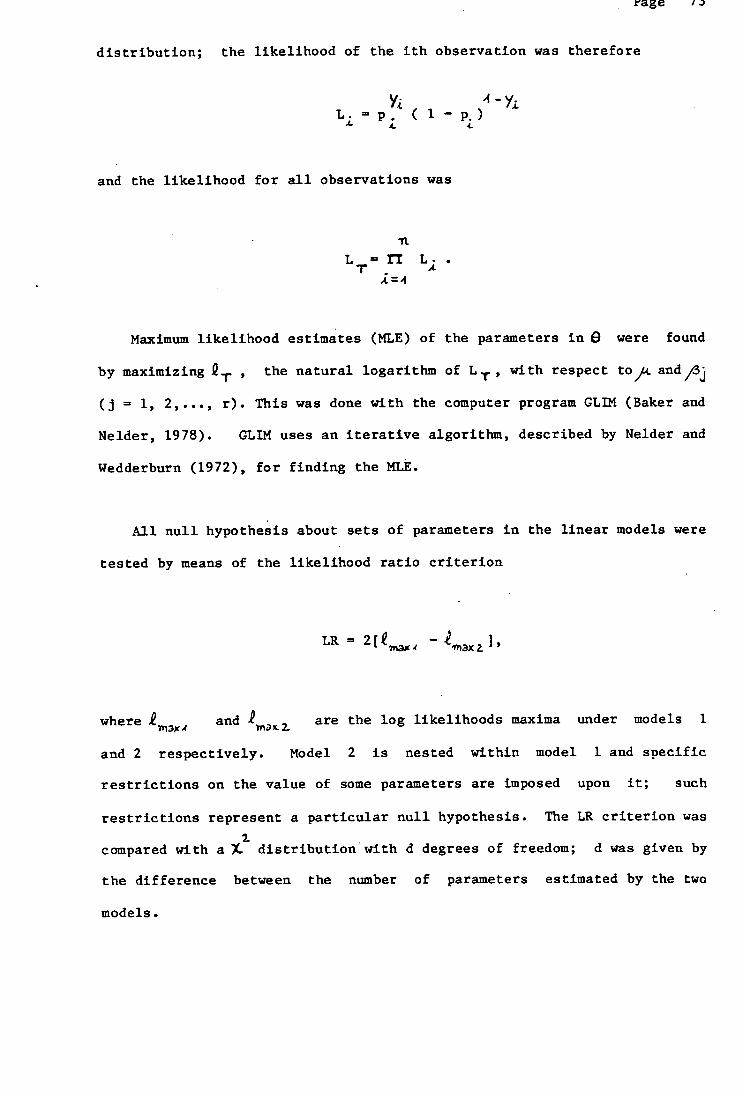
rage I.)
distribution; the likelihood of the ith observation was therefore
Yi 4- y L.p (i — p.)
4.
and the likelihood for all observations was
11.
L =
ri L. A
h.l
Maximum likelihood estimates (MLE) of the parameters in 0 were found
by maximizing 2 T 9 the natural logarithm of L T9 with respect to ,M. and 1 J
(j = 1, 2,..., r). This was done with the computer program GLIM (Baker and
Nelder, 1978). GLIM uses an iterative algorithm, described by Nelder and
Wedderburn (1972), for finding the MLE.
All null hypothesis about sets of parameters in the linear models were
tested by means of the likelihood ratio criterion
LR = -7nax .4
where and are the log likelihoods maxima under models 1
and 2 respectively. Model 2 is nested within model 1 and soecifie
restrictions on the value of some parameters are imposed upon it; such
restrictions represent a particular null hypothesis. The LR criterion was
2. compared with a distributionwith d degrees of freedom; d was given by
the difference between the number of parameters estimated by the two
models.

Frequency
0.3
0.2
0.1
0
- -. -' - I 0 1 2 3 4
Figure! 5.1. The Logistic and Normal distributions: both with Al
0 and (T. (IT /3) 2.
Value of e
00

rage i
The statistical significance of several explanatory variables was
tested by fitting a sequence of nested models. The fullest model for
trials 1 and 2 was
O..+ TL + Sj + (TxS). + P + eKe
where ,u is the general mean, T. is the effect of the ith test (I, II
or III), Si is the effect of the jth sex (male or female), P. is the
effect of the kth pig within the jth sex and eKe is a random error
associated with the £th observation. The hypothesis testing procedure for
trials 1 and 2 is shown in Table 5.3.
Because of the limitation in the number of parameters that may be
estimated with GLIM it was not possible to include the set of parameters
(pigs within sexes) in the analysis of Trial 3. For the rest, the
fullest model fitted to these data was similar to that of trials I and 2;
T , the effect of the ith test was for I = 1, ..., 4.
The fullest model fitted to the data from Trial 4 was
0 T+S + Tr 0 + + (TxS),, + (TxTr)0 + (SxTr) 70 + Tnnoq M 71
e m-n b6
where T Tnis the effect of the mth test (I, II or III), S is the
effect of the nth sex, Tr0 is the effect of the oth treatment (A, B or C)

Page 76
Table 5.3. Hypothesis testing procedure in trials 1 and 2
(for explanation of symbols see text).
Hypothesis
S = S t = 0
T 1 = T ;L = T 3 = 0
MS) 44
=,...,(TxS)3 = 0
PA = P =0
4 2. '' K.
LR
2[ ()c, T, S ) - (,Li, T )]
2[. (i&, T, S, P ) — 1(,s., S, P )]
2[ (full model) -i(,Lc., T, S, P)]
2[. (full model) - 2çP- T, S, TxS)]
Table 5.4. Hypothesis testing procedure in Trial 4
(for explanation of symbols see text).
Hypothesis
S4 = S 2 = 0
T = T 2. = T 3 =0
(TxS)44 0
Tr4 = Tr Tr = 0
(TxTr)44 =""' (TxTr) 33 0
,..., (SxTr) 3 = 0 (SxTr)4 =
Y .4 = Y 2 =0
IN 2['(,z,T,S,Tr,Y,TxTr) - i(,k,T,Tr,Y,TxTr)1
2[2 ()&,T,S,Tr,Y,SxTr) - j(,L(.,S,Tr,Y,SxTr)]
2[l (full model) - ,T,S,Tr,Y,TxTr,SxTr)]
2[ (,M.,T,S,Tr,Y,TXS) - 1( 1L,T,S,Y,TxS)]
2[J(full model) -(L&.,T,S, Tr, Y,ThS,SxTr)]
2[ 2 (full model) - (,LT,S,Tr,Y,TxS,TxTr)]
2[ .(full model) - 2(,14,T,S,Tr,TxS,TxTr,SXTr)]
Page 77
and Y is the effect of the pth year (1. or 2). The hypothesis testing
procedure is shown in Table 5.4. Again, it was not possible to fit the
set of parameters representing the effects of individual pigs because
their number exceeded the capabilities of the GLIM program.
The same statistical analysis was repeated separately for the
probability of RD (versus HP or HN) and of HP+}ID (versus HN) reactions.
The results of a preliminary analysis on data from trials 1 and 4 were
presented earlier by Webb (1980, 1981).
RESULTS
The numbers of HP and HD reactions recorded in the four trials are
shown in Table 5.1. The results from the statistical analyses are
summarised in Tables 5.5 to 5.10. A feature of all trials is that the age
effect was assessed by repeating tests on the same pigs. As mentioned
earlier, the effects of the individual pigs were disregarded in trials 3
and 4 because of limitations in the number of parameters that could be
estimated. However, if these effects were important the LR tests of age
effects need not be- equal to those that could have been obtained had the
models included the parameters for individual pigs. Statistically,
thcrcfore, the test of age effects in trials 3 and 4 is conservative.
Effects of previous tests on subsequent ones.
It is convenient to present the results of Trial 4 in the first place.

rage '0
Table 5.5 shows the ML probability estimates of HP and HD reactions for
the three treatments. As shown in Table 5.6 there were no significant
effects of the treatments on the probabilities of either type of reaction.
The effects of test and sex on HP reactions, however, were statistically
significant.
If the treatments are ignored the data from trials 1 and 4 can be
conveniently pooled and re—analysed, as both were carried out on the same
type of pigs under the same conditions. The largest model for this
analysis was the one used in the analysis of Trial 3, to which .a term for
the effects of the different years (y, m = 1, 2 or 3) was added.
HP reactions.
Table 5.7 shows that the probability of this type of reaction
increased with age in all trials; these changes were always statistically
significant (Table 5.8). With the exception of Trial 1, all the results
indicate that the frequency of HP was significantly lower in males than in
females; the test x sex interaction, however, was significant in PTH pigs
(Table 5.8). Finally, the analyses of trials 1 and 2 revealed that the
pattern of halothane reactivity was significantly affected by the
individual pigs.
HD reactions.
Table 5.9 shows the estimated probabilities of doubtful reactions for

Page 79
Table 5.5. Estimated probabilities (p) of HP and HD reactions
for the different tests and treatments in Trial 4.
Treatment
A B C
Test HP RD HP HD HP RD
I -- - -- -- 0.52 0.10
II -- -- 0.77 0.08 0.76 0.06
III 0.94 0.06 0.88 0.06 0.95 0.05
Table 5.6. Hypothesis testing results, showing likelihood ratios (LR),
2. degrees of freedom (df) and probabilities of greater (Pr)
for several variables affecting the probabilities of HP
and RD reactions in Trial 4.
HP RD
Variable df LR Pr(X2 ) LR Pr(X2.
Test 2 49.1 0.000 2.3 0.317
Sex 1 6.2 0.013 0.3 0.584
Test x Sex 2 2.4 0.301 245 0.287
Treatment 2 1.1 0.577 0.4 0.819
Test x Treat 1 1.7 0.192 0.3 0.584
Sex x Treat 2 0.7 0.705 4.5 0.105
Year 1 1.6 0.206 0.6 0.439
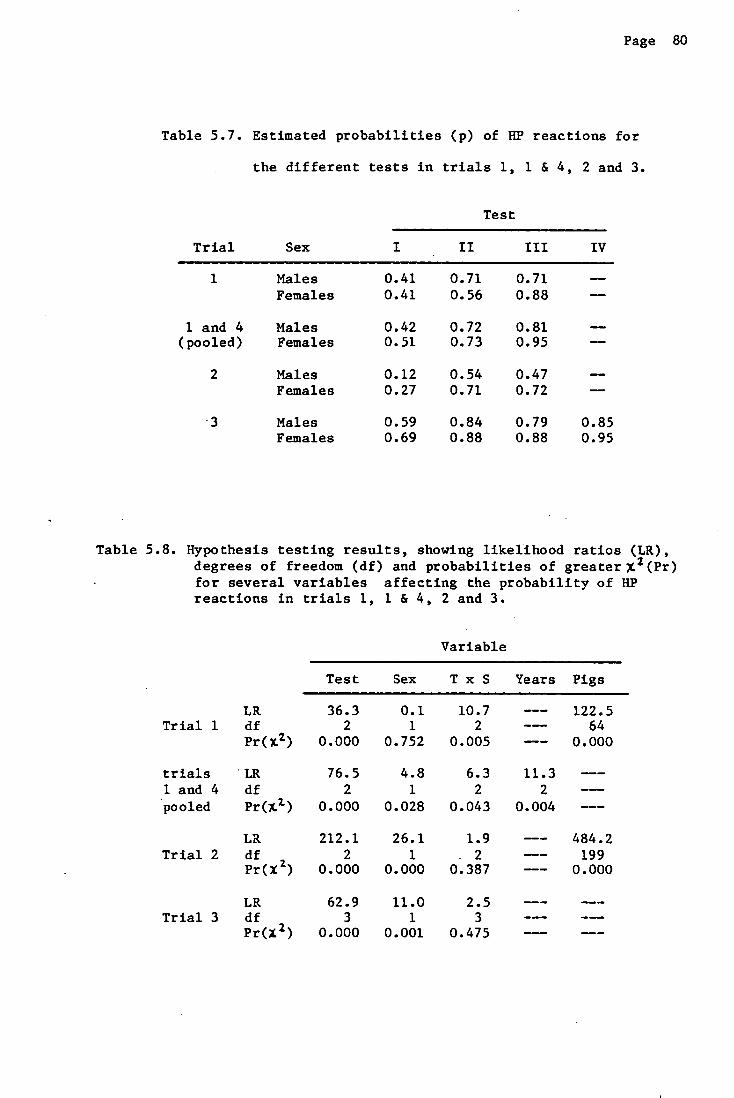
Page 80
Table 5.7. Estimated probabilities (p) of HP reactions for
the different tests in trials 1, 1 & 4, 2 and 3.
Test
Trial Sex I II III IV
1 Males Females
1 and 4 Males (pooled) Females
2 Males Females
3 Males Females
0.41 0.71 0.71 -- 0.41 0.56 0.88 -
0.42 0.72 0.81 -- 0.51 0.73 0.95 -
0.12 0.54 0.47 - 0.27 0.71 0.72 -
0.59 0.84 0.79 0.85 0.69 0.88 0.88 0.95
Table 5.8. Hypothesis testing results, showing likelihood ratios (La), degrees of freedom (df) and probabilities of greaterx(Pr) for several variables affecting the probability of HP reactions in trials 1, 1 & 4 1, 2 and 3.
Variable
Test Sex T x S Years Pigs
LR 36.3 0.1 10.7 122.5 Trial df 2 1 2 -- 64
Pr(7-2 ) 0.000 0.752 0.005 -- 0.000
trials LR 76.5 4.8 6.3 11.3 l and 4 df 2 1 2 2 -- pooled Pr(X) 0.000 0.028 0.043 0.004
LR 212.1 26.1 1.9 -- 484.2 Trial 2 df 2 1 2 - 199
Pr(X 1 ) 0.000 0.000 0.387 -- 0.000
LR 62.9 11.0 2.5 -- --
Trial3 df 3 1 3 -- --
Pr(X 1 ) 0.000 0.001 0.475 --

Page Si
the different tests and sexes in the four trials. As shown in Table 5.10
there were significant effects of individual pigs and years, and even the
test x sex interaction was significant in Trial 1. The frequency of
indeterminate diagnoses , however, was largely unaffected by systematic
sources of variation like test and sex. The exception was Trial 3, where
the differences between tests were significant. The probability of RD
reactions averaged 0.07 over all trials.
HP + RD reactions.
The estimated probabilities of HP+HD reactions for the two sexes at
different ages were very similar, in all trials, to those that can be
obtained by adding the separate estimates for HP and HD, and are therefore
not reported. The conclusions from the statistical analysis followed
closely those obtained for HP reactions.
DISCUSSION
All animals in the present study were . offspring of HP x HP matings;
if a single-locus biallelic model is assumed for mode of inheritance of
susceptibility then, according to the findings in Chapter 3. pigs In
trials 1 and 4 (PTH) will be homozygous recessive and the frequency of HP
will represent the penetrance of that genotype. Animals in trials 2 and
3, however, will be expected to be a mixture of three genotypes since, in
addition to one homozygote, about a half of the heterozygotes were HP in
British Landrace. The expectation for the frequency of HP in trials 2 and

Page 82
Table 5.9. Estimated probabilities (p) of HD reactions for
the different tests in trials 1, 1 & 4, 2 and 3.
Test
Trial Sex I II III IV
1 Males 0.12 0.03 0.24 - Females 0.25 0.19 0.06 -
1 and 4 Males 0.11 0.05 0.14 - (pooled) Females 0.18 0.11 0.04 -
2 Males 0.08 0.05 0.08 -- Females 0.09 0.06 0.08 -
3 Males 0.07 0.05 - 0.05 0.03 Females 0.08 0.03 0.06 0.02
Table 5.10. Hypothesis testing results, showing likelihood ratios (LR), degrees of freedom (df) and probabilities of greaterx.L(Pr)
for several variables affecting the probability of MD reactions in trials 1, 1 & 4, 2 and 3.
Variable
Test Sex T x S Years Pigs
LR 2.4 0.6 16.0 793 Trial df 2 1 2 -- 64
Pr(X 2 ) 0.301 0.438 0.000 0.094
trials LR 4.5 0.1 11.4 6.7 - l and 4 df 2 1 2 2 pooled Pr(X 1 ) 0.105 0.752 0.003 0.035
LR 2.2 0.4 0.1 - 150.3 Trial 2 df 2 1 2 -- 199
Pr(x 2 ) 0.333 0.527 0.951 -- 0.015
LR 8.0 0.1 1.7 -- --
Trial3 df 3 1 3 -- --
Pr(XZ) 0.046 0.752 0.637

Page 83
3 will be the sum of the penetrances of the two susceptible genotypes
weighted by their frequencies. The increase in frequency of HP from Trial
2 to Trial 3 could thus be due to selection in favour of susceptibility,
combined with a longer halothane test in Trial 3.
As shown in Figure 5.2, the results from all trials indicate clearly
that penetrance tends to increase between the third and eighth week of
age, both in PTH and in Landrace pigs. This is interpreted as halothane
susceptibility having a variable age of onset (Falconer, 1967). It could
be interesting to investigate whether part of the variation is genetic.
Although the general trend was for penetrance to increase with age, a
proportion of animals exhibited HP reactions in earlier tests but did not
react in later ones; they illustrate another aspect of penetrance. All
pigs that completed 3 tests were classified into eight categories,
according to the sequence of HP reactions they exhibited. For example,
pigs in the category 011 did not react positively in the first test but
did so in the second and third tests. Table 5.11 shows the distribution
of pigs into such categories. Although a variable age of onset may give
rise to systematic changes in penetrance, there is still a proportion of
animals -those in categories 4 to 7- that, having shown susceptibility at
some stage, failed to exhibit HP reactions later on. According to the
results from Trial 4, an effect of previous tests reducing the probability
of HP reactions in subsequent ones is unlikely. Such cases, therefore,
must indicate that random variation in the exertional, nutritional or
health status (Mabry, Christian and Kuhiers, 1981) or even
misclassification can make some susceptible pigs fail to exhibit an HP
reaction, even though they reached their age of onset.

Page 84
Figure 5.2. Age changes in the probability of HP reactions (p)
estimated in (a) PTH and (b) Landrace.
0 Z0 30 49 DU Di,
Age (days)
-' (a) PTH LO - -
0.9
0.8
0.7
0.6
0.5
0.4
0.3
0.2
0.1
(b) Landrace A n of HP
----- /
trial 2
0 20 30 40 so Go
Age (days)
- Females
Males
1.0
0.9
0.8
0.7
0.6
0.5
0.4
0.3
0.2
0.1
trt
Page 85
The differences between sexes in incidence of HP were unexpected.
Although a test x sex interaction was detected in PTH (Table 5.8)
penetrance was always higher in females than in males; the effect was
particularly marked in Trial 2 (Figure 5.2). Such differences in
penetrance could not be related to differences in weight or age, as the
sexes were always very similar in those respects; differences in
reaction-time cannot be invoked either (see Table 4.4). The reasons for
this interesting sex effect have still to be investigated.
The finding that penetrance changes with the age of the animals would
have to be considered when studying the mode of inheritance of halothane
susceptibility on pigs of different ages. Batsehelet (1963) has shown how
to incorporate penetrance as a non-decreasing function of age into models
for testing genetic hypothesis and estimating parameters. It could also
be worthwhile to construct such models allowing for penetrance to differ
between sexes.
From a practical point of view, if penetrance is an increasing
function of age an optimum age for testing could be defined, after which
the marginal increments would be considered not worth the while; this is,
naturally, a rather arbitrary concept. Judging crudely from the results
in Landrace (see Figure 5.2) such age could be somewhere around five weeks
of age. Breeds might, however, differ in the functional relationchip
between age and penetrance and so, perhaps, in the optimum age for
testing.

Page 86
Table 5.11. The distribution of all pigs (%) that received
three halothane tests into categories according
to the sequence of HP reactions they exhibited.
Breed
PTH Landrace
Trial 2 Trial 3 Category* n130 n=198 n=244
001 16.9 10.1 6.1
011 25.4 32.3 20.5
111 37.7 16.2 52.9
4: 100 0.0 0.5 0.8
5: 010 4.6 11.1 6.1
6: 110 3.1 2.5 7.0
7: 101 6.9 0.5 4.1
8: 000 5.4 26.8 2.5
* 0 indicates absence of HP,
I indicates presence of HP.

Page 87
CHAPTER 6. THE EFFECTS OF HALOTHANE SUSCEPTIBILITY
ON SOME ECONOMICALLY IMPORTANT TRAITS
The incidence of halothane susceptibility varies widely among
different pig breeds; the trait has a relatively simple mode of
inheritance so that the frequency can be changed readily by selection (see
for example Webb, 1981). Therefore, a question of some importance to pig
breeders concerns the breeding policy to adopt in relation to
susceptibility in order to improve production efficiency. At first sight
the occurrence of stress—related deaths among susceptible pigs may call
for elimination. However, there is growing evidence to show that these
pigs exhibit a variety of changes some of which, such as reduced meat
quality, are detrimental while others, such as increased lean content, are
economically desirable (for a review see Webb, 1981). Since a profitable
breeding policy should be based on the economic balance between beneficial
and harmful effects it is necessary to identify all the traits that are
affected and to characterise properly the changes (Smith and Webb, 1981).
A research project was started in 1974 at the Animal Breeding Research
Organisation (ABRO) to investigate several aspects of halothane
susceptibility, including It associat i ons with econic performance. A
Pietrain/Hampshire (PTH) synthetic population, from which susceptible and
tolerant lines have been derived, played an important role in these
investigations. In this chapter the effects of susceptibility on
reproductive, growth and carcass traits are assessed by looking at the
differences between pigs of the susceptible and tolerant ABRO—PTH lines.
Page 88
It is convenient therefore to begin by analysing the genetic structure of
those lines.
6a THE GENETIC STRUCTURE OF THE ABRO-PTH LINES OF PIGS
(i) Demographic structure of the PTH population.
A series of crosses between Pietrain and HampsHire pigs was started in
1971 at ABRO with the aim of creating a synthetic sire line. Between 1971
and 1974 three batches of matings involving overlapping generations
(designated here as blocks) were carried out. Following a report that
liability to the Porcine Stress Syndrome could be predicted from the
reaction to halothane (Eikelenboom and Ninkema, 1974) the population was
screened for susceptibility and an incidence of about 20 % was found. Two
lines were then formed, by mating mainly reactors with reactors and
non-reactors with non-reactors (these matings provided information for
studies on the genetics of susceptibility: see Smith and Bampton, 1977;
and this thesis). At this stage the population was a mixture of Fl, F2
and F3 pigs and even some backcrosses. The two lines were subsequently
selected for and against positive reactions; they were called the Stress
Susceptible (SS) and Stress Resistant (SR) PTH lines. Only halothane
positive reactors. from litters where all sbs reacted positively, were
kept as replacement breeding stock in SS. All breeding animals in SR were
halothane negative reactors, most from all-negative litters.
In 1973 -one year before the subdivision- four male and three female
immigrants were introduced into the population from a PTH herd at the

Page 89
University of Newcastle. A year later two new male immigrants were
introduced from Newcastle, this time into the SR line. This immigrant
material played an important role in the genetic make—up of the SR line.
This study covers the first annual batches of matings (blocks) of
the SS and SR lines. Figure 6.1 illustrates the changes in susceptibility
frequency as a result of selection. Tables 6.1 and 6.2 show the
population sizes and the distribution of breeding animals according to sex
and generation. Since some matings. took place between animals of
different generations the convention was adopted of assigning a pig to
generation it + i when its father belonged to generation it.
Two features in Tables 6.1 and 6.2 must be mentioned: neither the
population size nor the age distribution remained constant over the
different blocks. Another interesting feature is that there was more
overlapping of generations in SS than in SR; a reduced conception rate in
SS females' was one of the reasons for such difference (Webb, personal
communication).
(ii) The genetic composition of the SS and SR lines.
The PTH population was founded with 28 animals: 5 Pietrain and 10
Hampshire males, 6 Pietrain and 7 Hampshire females. Nine PTH immigrants
were introduced later into the population as described above. These 37
animals were the source of all genes in the SS and SR lines; they are
designated as founders, A (n = 1,..., 37).In
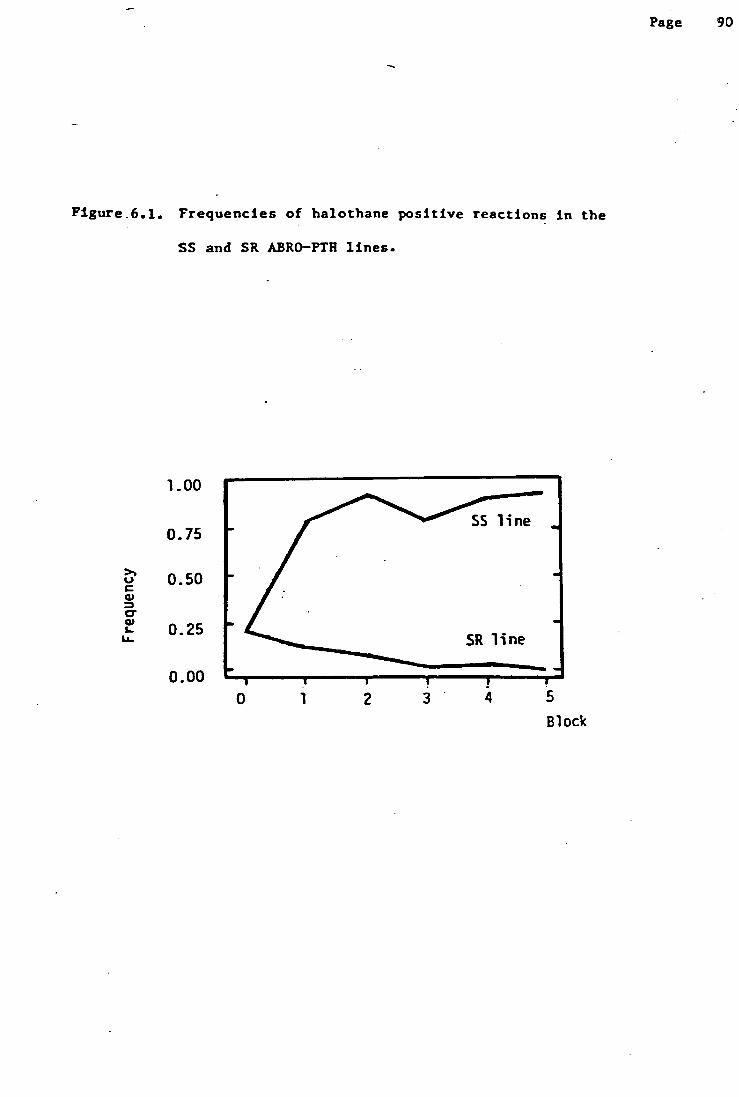
Page 90
Figure,6.. Frequencies of halothane positive reactions in the
SS and SR ABRO-PTH lines.
1.00
0.75
I ::: 0.00
I) I Z i
Block

Page 91
Table 6.1 Population size and distribution of the breeding animals
according to sex and generation in the SS line.
Males
Generation Total
Block 1 , 2 3 4
1 6 6
2 - 3 3
3 - 7 4 11
4 -- 2 2 7 11
5 -- 1 1 6 4 12
Females
Generation Total Total
1 2 3 4 5 population
25 25 31
- 6 6 9
-- 11 7 18 29
-- 5 3 4 12 23
-- 4 1 9 11 25 37
Table 6.2. Population size and distribution of the breeding animals
according to sex and generation in the SR line.
Males Females
Generation Total Generation Total Total
Block 1 2 3 4 5 d' 1 2 3 4 5 population
1 10 10 27 27 37
2 -- 5 5 —14 14 19
3 - 3 4 7 --1110 21 28
4 ---- 2 9 11 -- 1 423 28 39
5 ------- 8 8 ---------2929 37

rage 14
For any individual P in SS or SR there is a vector of values
. #i , representing the probabilities that a gene,
131
taken at random from P. , is a copy of a gene in founder A . The vector of
mean values of over all members of block i (=1,..., 5) in line k (SS
or SR):
= [~ • jK,4
characterises the line, at each stage, in terms of origin of genes
(Jaquard, 1974).
For each individual P. the probabilities Øi were calculated from the
occurrences of A in the pedigree. For example, if A was parent of P
then 09 = 1/2; if it was a grandparent then ø9 = 1/4 and so on; if
A occurred more than once in a genealogy the probabilities from each line TI
of descent were summed. A computer program was written to derive the
probabilities . from the pedigrees.
Tables 6.3 and 6.4 suinmarise the results of these calculations. In
these tables the founders were divided into three groups: the 10 Pietrain
or Hampshire pigs which contributed most to the genetic make-up of the
lines are. shown singly and as a group; the contributions from the
immigrants and from the remaining founders are given as group
contributions only. The tables also show the expected proportions of
Pietrain and Hampshire genes, calculated by assuming the genetic
composition of the 9 immigrants to be 50 % Pietrain and 50 Z Hampshire
(Webb, personal communication).

Page 93
Table 6.3. Probabilities of origin of genes from the different
founders in the SS line.
Block Breed of founder Founder 1 2 3 4 5
10 0.028 0.049 0.047 0.048 0.051 80 0.048 0.042 0.037 0.036 0.033
Pietrain 6826 0.085 0.083 0.074 0.073 0.076 7567 0.032 0.028 0.039 0.046 0.039 8054 0.065 0.097 0.080 0.077 0.086
89 0.065 0.097 0.080 0.077 0.086 5493 0.089 0.070 0.058 0.068 0.066
Hampshire 1035 0.089 0.090 0.083 0.089 0.092 1353 0.137 0.125 0.125 0.146 0.138 2793 0.028 0.049 0.047 0.048 0.051
10 principal founders 0.666 0.730 0.670 0.708 0.718
Other 18 founders 0.318 0.270 0.278 0.292 0.270
Immigrants 0.016 0.000 0.052 0.000 0.012
Total 1.000 1.000 1.000 1.000 1.000
Pietrain 0.390 0.390 0.405 0.384 0.385
Hampshire 0.610 0.610 0.595 0.616 0.615

Page 94
Table 6.4. Probabilities of origin of genes from the different
founders in the SR line.
Block Breed of founder Founder 1 2 3 4 5
10 0.061 0.020 0.036 0.036 0.032 80 0.051 0.043 0.047 0.046 0.040 6826 0.044 0.049 0.054 0.044 0.039 7567 0.027 0.033 0.029 0.021 0.016 8054 0.034 0.026 0.029 0.038 0.033
89 0.034 0.026 0.029 0.038 0.033 5493 0.057 0.066 0.063 0.054 0.047 1035 0.065 0.049 0.051 0.045 0.039 1353 0.122 0.109 0.109 0.094 0.078 2793 0.061 0.020 0.036 0.036 0.032
10 principal founders 0.556 0.441 0.483 0.452 0.389
Other 18 founders 0.304 0.192 0.212 0.222 0.204
Immigrants 0.140 0.367 0.305 0.326 0.407
Total 1.000 1.000 1.000 1.000 1.000
Pietrain 0.386 0.424 0.420 0.426 0.438
Hampshire 0.614 0.576 0.580 0.574 0.562
Pietrain
Hampshire

rage VD
The results of the analysis indicated that the different founders
contributed rather unevenly. Many of them were scarcely represented in
the composition of the lines; this must have produced some loss of
genetic variance. The results also indicate that the contributions of
some Pietrain and Hampshire founders differed between the lines, as in the
case of male Hampshire 89 or female Hampshire 1353. The most important
finding, however, was the differential contribution of the immigrants to
the composition of the lines. In numbers they represented about 24 % of
the founder group. However, while they contributed some 40 % of the genes
to the last block of SR, the corresponding contribution to SS was almost
nil. The composition of the two lines in terms of Pietrain and Hampshire
genes was quite similar: about 40 and 60 % respectively.
(iii) Random genetic differentiation of the lines.
As inferences about the effects of halothane susceptibility on several
quantitative traits are to be based on differences between pigs of the SS
and SR lines it is important to estimate the expected random
differentiation of the lines, due to genetic sampling and immigration.
Any estimate of the drift variance based on an effective population number
(N ), as in Hill (1972), is bound to be very imprecise because there are
no formulae for N€ capable of accommodating the complicated population
structures shown in Tables 6.1 and 6.2 or of taking into account the
differential immigration. The genealogical information, however, offers a
way round these difficulties. The following derivation was suggested by
Dr. W. G. Hill (personal communication). Consider a quantitative trait
controlled by a single locus with two alleles and write p and (1 - p) for

Page 96
the allelic frequencies in a large, random mating population. In the
absence of dominance the mean of this population will be
a (2p - 1)
where a is the difference between homozygotes and heterozygotes (e.g.
Falconer, 1981; pp 101). Let a pair of lines, j and k, be derived from
this base population. The variance of differences in means between such
pairs of lines is
V(,Zz. V[ (a ( 2 -1)) - (a 1))]
= 4a2 V(p. - p ) ....... ..............(1)
The variance of the difference in allelic frequencies is
- p ) = E(p? ) + E(p 1 ) - 2E(p p. )
with
E(p ) p + (1 -/3 , )P 2•
where is the mean coancestry coefficient among members of line J.
Similarly
2. E(p 'K
p + (1-113. )p
where is the mean coancestry of members of j with members of k.
Therefore
V(p3 - p ) p(l - )(/ /3K
= p(l - p) DJ ................. (2)
The quantity
= /J
D Jit . i3.+/2 -2/3.
/ k /jK

Page 97
is called here the random genetic differentiation between lines j and
k. Replacing (2) in (1)
V( p. _,(LK) = 4p(l - p) a DJ ft
= 2 crA D *K ................ ( 3 )
where T represents the additive genetic variance (e.g. Falconer,
1981; pp 116); the same formula applies for polygenic traits determined
only by additive genes and is an approximation otherwise.
The mean coancestries for each block of the SS and SR lines ( /3 and / Ss
) were estimated by taking a sample of animals and calculating the SR
coancestries among all possible pairs, including animals with themselves.
Twenty pigs were sampled from each block/line, except when population size
was less than 20, in which case the coancestries were calculated amongst
all animals in the block. When numbers permitted, 10 males and 10 females
were sampled. The mean coancestries among members of SS with members of
SR (1S ) were estimated on the same samples that were used for / SS,SIt
estimating the within—line coancestries. The block previous to the
separation of the lines was taken as the base population. All
computations were carried out with a computer program that calculates
coancestries and inbreeding coefficients (W. G. Hill, personal
communication).
The evolution of the coancestries within and between lines together
with the random genetic differentiation during the period covered
by the study, are shown in Table 6.5 and in Figure 6.2.
There is a potential bias in taking equation (3) as the expected

Page 98
Table 6.5. Changes in the estimated mean coancestry coefficients
( 1 3 ) within and between lines, and in the random
genetic differentiation between SS and SR (Dss sm
Mean coancestry
Between Within lines lines
Block /'sp SS, $a
1 0.0339 0.0224 0.0259 0.0045
2 0.0209 0.0401 0.0253 0.0104
3 0.0499 0.0604 0.0204 0.0695
4 0.0652 0.0742. 0.0250 0.0894
5 0.0835 0.0987 0.0178 0.1466

Page 99
Figure 6.2. The evolution of the average coancestry (jS) within
the SS and SR lines, and of the random genetic
differentiation ) between the two lines.
0.14 0 '.4
0.12
Old w 0.10 4 1
lj 1.4 1J ,-I
0.08 ('U !I
:::
0.02
tlsssR
)SR
I3 s
0 1 2 3 4 5
Block

rage WV
drift' variance of. the difference between populations SS and SR in
quantitative traits. The bias arises because the two lines were brought
apart by selection for and against halothane susceptibility. In the
present case the variance of the random genetic differentiation should be
2 2.
- ) 2 -1 )D A AS SS,S
approximately. The term .a_ represents the additive varianceAS
controlled directly by the locus (or loci) determining susceptibility.
Therefore, for traits affected by the halothane gene equation (3) yields
overestimates of the true random differentiation variance. It is not
possible to make allowances for such source of bias in this study;
nevertheless, when considering the opportunities for random changes
between SS and SR because of small population size, genetic - bottlenecks'
and differential immigration it seems only desirable to have some
approximate, albeit biased, idea of the size of the drift variance.
6b DIFFERENCES IN REPRODUCTIVE TRAITS BETWEEN HALOTHANE
SUSCEPTIBLE AND HALOTHANE TOLERANT PIGS
Of all the changes in economic traits that are presumably brought
about by halothane susceptibility those concerning reproduction are
perhaps among the less well documented. In his comprehensive review of
the literature Webb (1981) quoted only two studies (Webb and Jordan, 1978;
Schneider, Schwrer and Blum, 1980) as reporting halothane susceptibility
effects on reproduction. While the results of both studies agree in that
susceptible females have a reduced litter productivity such effects are

Page 101
far from being firmly established. In general, reliable estimates of
reproductive performance are required to optimise the use of genetic
resources available to pig production, particularly with crossbreeding
(Smith, 1964; Moav, 1966); the requirement still holds when a breeding
strategy has to be decided with halothane susceptibility (Smith, 1981).
The objective of this study was to assess the effects of halothane
susceptibility on some litter traits by looking at the differences between
reacting and non-reacting - females from the SS and SR ABRO-PTH lines of
pigs.
MATERIAL AND METHODS
Animals.
Two data sets were available. The first one comprised 206 litter
records from females in blocks 1 to 5 of the SS and SR lines. All females
were mated to boars from their own lines. The farrowings took place in
winter; concrete floored farrowing pens were used. The second data set
consisted of 93 records of females from blocks 3, 4 and 5 of the SS and SR
lines which, after the winter farrowing, were re-mated to boars from the
SR line. The purpose of such matings was to produce animals for the
carrier trials. Briefly, if susceptibility Is a reccsIvc trait
controlled by a single locus, pigs from SS are expected to be homozygous
recessive (nn); most pigs from SR are expected to be homozygous normal
(MN). Offspring from SS dams with SR sires are expected to be mostly
heterozygotes (Nn); SR x SR matings are expected to produce mainly NN
progeny. The objective of the carrier trials was to compare NM versus

rage LUL
Mn pigs for several growth and carcass traits. A fuller description of
these trials will be given later. These farrowings took place in summer;
field arks were used as farrowing pens. The piglets were weaned, on
average, at 50 days of age.
Six traits were studied, which were treated as traits of the mother:
(a) At birth:
Litter size = (live + stillborn),
Average piglet weight = (litter weight)/(number of piglets),
Perinatal mortality = number of stillborn piglets.
(b) At weaning:
Litter size,
Average piglet weight,
Mortality during lactation = deaths from birth to weaning.
Statistical analyses.
I. Analysis of litter size and piglet weight.
Differences between the SS and SR lines in litter size and in mean
piglet weight, at birth and at weaning, were estimated by the method of
least-squares after fitting different linear models to the data with the
computer program LSML76 (Harvey, 1977). Three separate analyses of
variance were done:

Page 103
(1) Within—line matigs: all records. The following linear model was
used
Y = ,M + B. + + P )( + (BL).. + (BP). + (LP). + e.. A,) J
where Y<e is the size (or mean piglet weight) of the lth litter, of
kth parity (1, 2 or 3 and higher) in the jth line (SS or SR) and in the
ith block (1,..., 5). Some females had multiple records, the analysis
however assumed that all records came from different females. When piglet
weights were studied litter size was included as a covariate in the model.
Within—line matings: first parities. The previous analysis
ignores the family structure of the population and probably underestimates
line—mean variances. Therefore, it may yield unreliable tests of
hypotheses. However, it was difficult to fit a model accounting for
family relationships since a complex population structure produced several
unconnected groups of data. Therefore, the subset of all first parities
(165 records) was re—analysed, using the following hierarchical model:
.. Y. =)+ (BL) +SAj AJK + -L.Kt +e
where Y.. is the performance of female m, the daughter of dam I and .4-i <tn
sire k, within line j (SS or SR) and block 1 (1,..., 5). A small number
of sires and dams were counted twice because they appeared in two z
different blocks. This analysis allowed the estimation of the sireIs ;
variance component.
Carrier trials. The statistical model fitted to the 93 records
from this data set was the same as that in (i); the effect of the ith
block was here for i = 3, 4 or 5. No attempt was made to account for the

rage .v
family structure of the population because the data set was very small.
The analysis was intended as a tentative examination but is reported for
completeness.
Table 6.6 summarises the degrees of freedom and expected mean squares
for the three analyses of variance.
(iv) Variance of line differences. For each trait the variance of the
difference between SS and SR was assumed to be
2. '2. V(SS— SR) = ;
2. represents the error variance of the line difference, arising from
2. estimating genetic means from phenotypic means; is the variance due
to random genetic differentiation (Hill, 1981).
The error variance was estimated as
7- - _z e(SSSR) IF
where F is the appropriate variance ratio from the analysis of
variance. The drift variance was estimated from equation (3) as
2. =20 D
d n SS 1SR
2 2 where tT. , the additive genetic variance was taken as 4 T and
was the mean value of (Table 6.5) over the i blocks
considered in the analysis.

Page 105
Table 6.6. Degrees of freedom from the analyses of variance
of litter sizes and piglet weights in the within-
line matings and in the 'carrier trials.
Within-line matings
All First Carrier Source records parities trials
Block (B) 4 - 2
Line (L) 1 - I
Parity (P) 2. - 2
B x L 4 9 2
B x P 5 - 3
L x P 2 - 2
Sires/(B x - 55 -
Dams/Sires/(B x - 33 -
Remainder 187 67 80
2.
* Expected value of dam mean square: + 1.66 , and of sires
2 21 2 2. 1 2
mean square: 11., + 1.64ç + 2.38 T°'D and 1s are the
within-litter, dams and sires variance components respectively.

Page 106
The null hypothesis that differences between SS and SR were different
from zero was tested by means of a t-test.
II. Analysis of piglet mortality.
The probabilities of perinatal deaths and of deaths during lactation
in litters of SS and SR sows were estimated by the method of maximum
likelihood. The procedure was similar to that used in Chapter 5 when
studying age effects on halothane susceptibility. The number of deaths in
the ith litter, dL (1 = 1,..., ), was considered to be a binomial random
variable. The total likelihood was
L = rt
.=1
where n. is the number of piglets in the ith litter. The
probabilities of deaths, p. , were linked to linear functions of several
explanatory variables by means of the logit transformation (Finney, 1970).
Maximum likelihood estimates of the parameters in the linear functions
(MLE) were obtained after maximising log L with respect to those
parameters; this was done with the computer program GLIM (Baker and
Nelder, 1978).
Analyses using models (i), (ii) and (iii) were repeated for the two
mortality traits; the same linear functions were used, but including now
the number of piglets born as a covariate. The statistical significance
of the line effects was tested by means of the likelihood ratio
criterion (LR, as in Chapter 5), after fitting linear models with and

Page 107
without the L set of parameters; the LR was compared with a
distribution. No attempt was made to estimate the drift variance (Od
in these traits.
RESULTS
Tables 6.7 and 6.8 show the estimated differences between SS and SR
females in litter and mortality traits. In general terms the estimates in
Tables 6.7 and 6.8 show SS females as producing about 1.5 piglets
less than the SR, probably as a result of smaller litters at birth and
higher lactation mortality. There were no indications of differences in
piglet weights. Most of the differences were estimated with low precision
and only a few reached statistical significance.
DISCUSSION
The small sizes of the SS and SR populations proved to be an important
source of error in the estimation of changes associated with halothane
susceptibility; in most cases the drift variance more than doubled the
error variance. In spite of this difficulty the differences in litter
size at weaning were found to be significantly different from zero in a
consistent way. The question may be asked whether such differences were
caused by differential mortality during lactation or by both differences
in prolificacy and in mortality. This might concern pig farmers since it
could be more feasible for them to reduce lactation mortality by
management than to alter prolificacy differences. Unfortunately there is

Page 108
Table 6.7. Overall means, standard deviations (SD) and estimated differences
between females of the SS and SR lines for some litter traits, in
the within-line matings (WL) and in the carrier-trials.
Difference Overall
Trait mean SD SS - SR SE SE b
No. records
WL, all records 86 vs 120 WL, first parities 56 vs 109 Carrier-trials 36 vs 57
Litter size at birth (piglets)
WI., all records 8.6 2.91 -1.07 0.438 0.873 WI., first parities 8.3 2.85 -1.01 0.577 0.951 Carrier-trials 10.1 2.86 -1.27 0.470 1.063
Piglet weight at birth (kg)
WL, all records 1.2 0.24 -0.07 0.036 0.048 WI., first parities 1.2 0.24 -0.06 0.048 0.055 Carrier-trials 1.3 0.20 -0.12 0.063 0.077
Litter size at weaning (piglets)
WI., all records 6.0 3.29 -1.56 0.498 0.804 * WL, first parities 5.8 3.42 -1.84 0.637 0.897 * Carrier-trials 7.5 2.82 -1.88 0.379 0.881 *
Piglet weight at weaning (Kg)
WI., all records 11.0 5.26 -0.67 0.624 1.050 WI., first parities 10.3 5.17 -0.76 0.646 1.064 Carrier-trials 13.6 4.24 0.50 1.151 1.568
* P < 0.05 after a two-tailed t-test.
standard error, not including the drift variance.
standard error, including the drift variance.
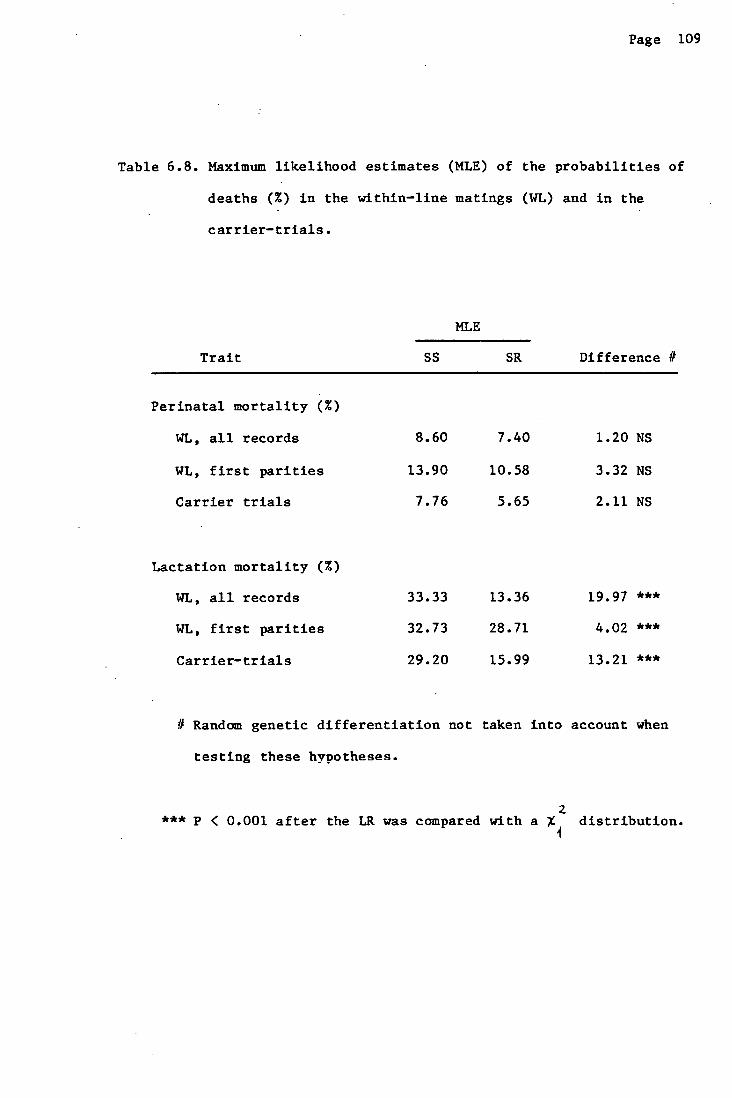
Page 109
Table 6.8. Maximum likelihood estimates (MLE) of the probabilities of
deaths (7.) in the within-line matings (WL) and in the
carrier-trials.
MLE
Trait SS SR Difference 1/
Perinatal mortality (%)
WL, all records 8.60 7.40 1.20 NS
WL, first parities 13.90 10.58 3.32 NS
Carrier trials 7.76 5.65 2.11 NS
Lactation mortality (%)
WL, all records 33.33 13.36 19.97 ***
WL, first parities 32.73 28.71 4.02 ***
Carrier-trials 29.20 15.99 13.21 ***
1/ Random genetic differentiation not taken into account when
testing these hypotheses.
P < 0.001 after the LR was compared with a X distribution.

Page 110
not a clear-cut answer: on the one hand the differences in lactation
mortality were large, but there are doubts about the role played by drift
in the differentiation of the lines. On the other hand, although the
differences in litter size at birth were not significant they were large
and consistent with the results at weaning, and it could well be that the
analysis simply lacked the power to detect such differences. Thus, while
providing indications that susceptible sows had smaller litters at weaning
because of both reduced prolificacy and increased lactation mortality this
study falls short of proving that this interpretation is correct.
Schneider et al. (1980) also found that halothane susceptible sows were
less prolific than halothane resistant sows.
The fact that there are differences between the SS and the SR lines in
any given trait does not neccesarily mean that they are pleiotropic
effects of the halothane susceptibility gene. The reason is that the PTH
population consisted of a mixture of Fl, F2 and F3 Pietrain x Hampshire 0
crossbred pigs when the two lines were founded. Therefore, Pietrain and
Hampshire genes were not expected to be randomly associated at that stage.
If, as suggested by Smith and Bampton (1977), the susceptibility genes
came into PTH mainly from the Pietrain breed, the first cycle of selection
would have made them 'hitch-hike' a piece of Pietrain chromosome of
variable length into the SS. line. If any locus affecting the trait in
question happened to be in these pieces of chromosome, and if the Pietrain
and Hampshire populations differed in gene frequencies at this locus, a
difference would have arisen between SS and SR due to the hitch-hiking
effect.
This possibility is particularly relevant in the case of litter size.

Page 111
It has been found that H, a red-cell antigen locus cioseiy linked to the
halothane locus (Andresen and Jensen, 1977), has effects on reproductive
traits in pigs (Jensen et al., 1968; Rasmusen and Hagen, 1973). Both
studies agree that the H a
allele would reduce litter size. It is
Important to emphasise that these findings were made in breeds where
halothane susceptibility is now virtually absent, such as the Duroc (Webb,
1981). Therefore, it is possible that gene substitutions at loci linked
to the halothane locus have an effect of their own on litter size.
Imlah and Thompson (1979) surveyed the allelic frequencies at the H
locus in the founder PTH group and in the first block of the SS and SR
lines. They found that halothane susceptibility was associated with a.
and that there was a large excess of this allele in SS. Therefore, there
is a distinct possibility that a gene with effects on litter size might
have been hitch-hiked Into SS by the halothane gene, due to linkage
disequilibrium in the founder group. If this was the case, at least part
of the differences between SS and SR would be due to gene frequency
differences at loci other than the halothane locus. Obviously, this
would Imply that the present findings need not apply to all pig
populations. Also, that it might be possible to dissociate halothane
susceptibility from the litter size effects in SS by selecting for
appropriate recombinants. It would be Interesting to assess the present
gene frequencies at the H locus In the SS and SR lines.
The finding that postnatal mortality in litters of halothane
susceptible sows was very similar both in the within-line matings and in
the carrier trials is somewhat surprising. Although all traits were
treated as traits of the mother this working hypothesis was assumed in
Page 112
order to set up the analysis. In fact, it was expected that the genotype
of the piglets would have been an important source of variation,
particularly for lactation deaths, after Eikelenboom et al. (1978) found
higher postweaning mortality among susceptible pigs when compared with
normal pigs. Under the single-recessive hypothesis the progeny from SS
sows in the within-line matings were expected to be halothane susceptible
(nn) while those in the carrier trials were expected to be normal (Nn).
The fact that the incidence of deaths was very similar in both groups,
while there were important differences between halothane susceptible and
normal sows, suggests that mortality during lactation is largely a
maternal trait in PTH.
The differences shown in Tables 6.7 and 6.8 are large enough to have
practical implications for pig farmers. However, since they were
estimated with low precision, and as the possibility exists that they are
peculiar to the ABRO-PTH population, it would be desirable to verify the
present findings in commercial pig populations.

Page 113
6c DIFFERENCES BETWEEN PIGS OF PREDICTED GENOTYPES AT THE HALOTHANE
LOCUS IN GROWTH AND CARCASS TRAITS
In recent years there has been considerable research on the effects of
halothane susceptibility on production traits in pigs. The results
consistently show that reactors are leaner and have higher carcass yields
than non-reactors. Such desirable effects are opposed, on economic
grounds, by lowered meat quality, reduced female productivity and
increased postweaning mortality (for a review see Webb, 1981). If the
question arises today as to the consequences of selecting for or against
susceptibility there will be information available on which to base an
economic balance. Elimination or fixation, however, does not exhaust all
breeding alternatives. The advantages in carcass traits might be
exploited by using specialised sire and dam lines; the adverse effects on
reproduction might be confined to susceptible sire lines which could be
crossed with non-susceptible dams to produce commercial offspring, as
first suggested by Minkema, Eikelenboom and van Eldik (1976). The
economic analysis of such a strategy demands knowledge of the mode of
inheritance of suseptibility and of -the genotypic values for all
production traits (Smith and Webb, 1981). The same information is
required for predicting what correlated changes in susceptibility
incidence are to be expected given any selection program for economic
efficiency. Concerning genotypic values, though, the information in the
literature is still rather sparse (see Webb, 1981) and more research seems
to be required.
Page 114
After it was considered that a single-recessive model represented
satisfactorily the mode of inheritance of susceptibility in the PTH
population (Smith and Bampton, 1977) a series of trials was started at
ABRO in order to estimate genotypic values for several traits of economic
relevance. The objective of these trials was to estimate the differences
between the heterozygous (Nn) and the homozygous normal (NN) genotypes.
The possibility of estimating all three genotypic values at the halothane
locus was foregone in favour of this particular comparison. Given a
fixed amount of resources it was preferred to estimate with better
precision the differences between normal and carrier pigs, on which the
economic benefit of exploiting specialised sire and dam lines would mainly
depend. Seven trials were carried out at ABRO for this purpose, based on
three different experimental designs (Webb, 1981). In this section the
analysis of three such trials based on PTH pigs is presented. Some
preliminary results have been reported earlier by Webb (1981).
MATERIAL AND METHODS
Animals.
Two groups of pigs were performance tested in three trials. The two
groups were putative heterozygotes (Nn) vs putative homozygous normals
(NN). They were offspring of dams from the SS and SR lInes respectively
mated to sires of the SR line. The experimental design was thus a
within-sire comparison of Nn vs NN pigs. The three trials corresponded to
the third, fourth and fifth blocks of matings in the PTH lines. The
desired genotypic composition for the progeny was:

Page 115
SIRE DAM PROGENY.
(SS) nn Nn
(SR) _______
(SR) NN NN
All animals in the present series of trials were given one halothane
test at about eight weeks of age, following Webb and Jordan's (1978)
procedure; only negative reactors were included in Nu; the NN group
comprised only negative reactors from all-negative litters. Since sires
and dams were not progeny tested prior to the trials, however, the
possibility that the NN group included a small proportion of heterozygotes
(Nn) cannot be ruled out.
Performance testing.
The pigs were weaned at an average age of fifty days. Two full-sib
pairs from each litter were then sent to the Meat and Livestock (MLC)
testing station at Stirling. On some occasions only one full-sib pair per
litter was tested. Most pairs consisted of a castrated male and a gilt
although there were some hog:hog and gilt:gilt pairs as well. Each pair
was allocated to a pen indoors and fed twice daily to appetite a standard
ration containing 13.2 NJ/kg digestible energy and 16.8 % crude protein.
The test started when the pair reached 54 kg total weight and was
completed when it reached 165 kg total weight. Both pigs were then

rage LiD
slaughtered. For details of the testing procedure see Buck (1961). The
following traits are studied here:
I. Growth traits. Measured on a pen basis for each pair.
Age at start of test.
Daily weight gain on test.
Daily food consumption.
Food conversion ratio (food/gain).
II. Carcass traits. Measured on all pigs.
Back-fat thickness: average of the shoulder, mid-back and loin fat
thickness, as defined by Smith, King and Gilbert (1962).
Side-fat thickness: average of theC and K depths of subcutaneous
fat, following Smith et al. (1962).
Eye-muscle area: the area of the muscle longissimus dorsi, as
defined by Smith et al. (1962).
Carcass length: measured from the anterior edge of the symphisis
pubis to the anterior edge of the first rib.
Page 117
Carcass yield: the cold carcass weight as a percentage of the last
live weight.
Trimming percentage: the weight of the trimmed carcass (ex kidney,
fat, kidneys, psoas muscles, feet and head) as a percentage of the
cold carcass weight.
Hind-quarters percentage: the weight of the ham, rump and
rumpstreak joints (see Figure 6.3) as a percentage of the cold
carcass weight.
Carcass pH: recorded on the m. longissimus dorsi 90 mm
post-mortem.
Neat colour: light reflectance as measured with an Evans
Electrical Ltd (EEL) reflectometer on the surface of the muscle
longissimus dorsi.
III. Rumpback traits. Dissections of the rumpback joint (see Figure
6.3) were carried out for one randomly chosen pig in a sample of pens,
according to the method described by Cuthbertson (1968). The following
traits are studied here:
Weight of rumpback joint.
Lean percentage.

RU
RIB f.
Page 118
Figure 6.3. Standardized joints used in )fl..Cs
pig dissection technique.

Page 119
Fat percentage.
Bone percentage.
IV. Full dissection traits. The left hand sides of the carcasses in
a sub-sample of the rump-back dissected animals were divided into six
joints (see Figure 6.3) which were defined by reference to skeletal points
(Cuthbertson, 1968). Each joint was then dissected into lean,
subcutaneous fat, intermuscular fat, bone and remainder. The following
traits are studied here:
Lean percentage: 200 x (weight of m.psoas + lean in left side)/
carcass weight.
Fat percentage: 200 x (weight of dissected fat in left side)/
carcass weight.
Bone percentage: 200 x (weight of bone in left side) / carcass
weight.
The weights of lean, dissected fat and bone in each of the six
joints.
Statistical analyses.
(1) Analysis of growth, carcass and rumpback traits.
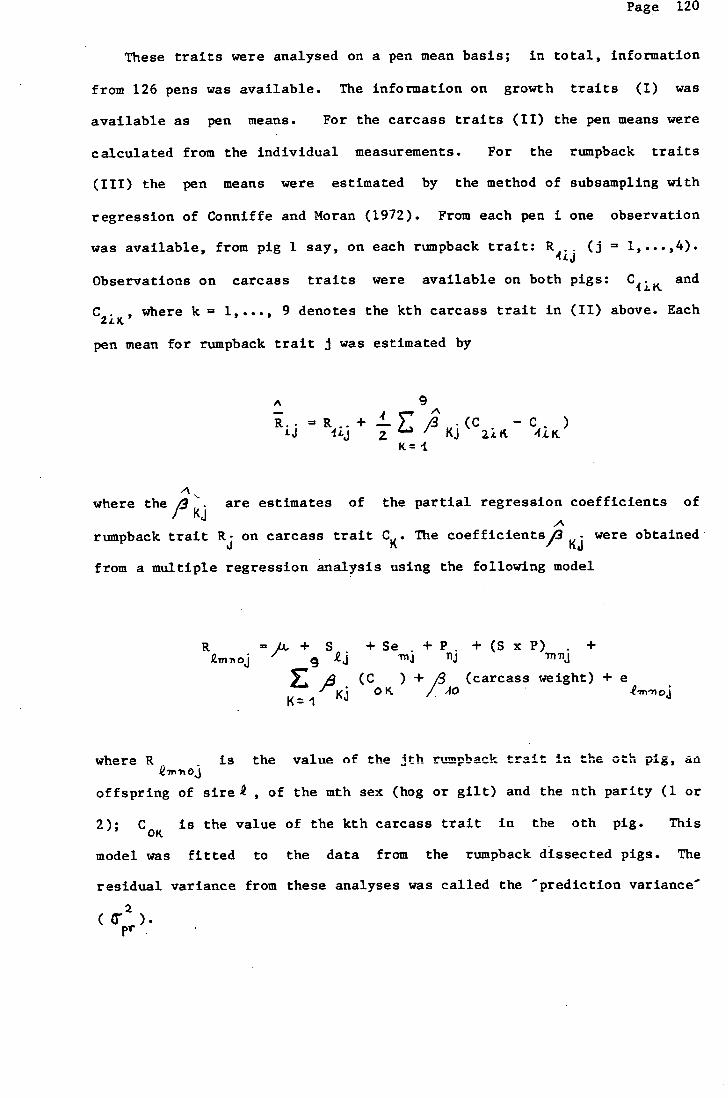
Page 120
These traits were analysed on a pen mean basis; In total, information
from 126 pens was available. The information on growth traits (I) was
available as pen means. For the carcass traits (II) the pen means were
calculated from the individual measurements. For the rumpback traits
(III) the pen means were estimated by the method of subsainpling with
regression of Conniffe and Moran (1972). From each pen i one observation
was available, from pig 1 say, on each rumpback trait: R 41J (j =
Observations on carcass traits were available on both pigs: and
where k =1,..., 9 denotes the kth carcass trait in (II) above. Each
pen mean for rumpback trait j was estimated by
A 9 R. R, +L J3 .(C —c )
U IL3 z KJ 2iI. 4iK K= 1
where the J1C
are estimates of the partial regression coefficients of
rtunpback trait R7 on carcass trait CK. The coefficients werewere obtained
from a multiple regression analysis using the following model
R M+ g S +Se
m +P
ij . +(SxP) +
Tnnj
E (C ) +^ (carcass weight) + e OK /. 40 innoj
where R - is the value of the fth rt'mpback trait in the oth pig, a
offspring of siren , of the mth sex (hog or gilt) and the nth parity (1 or
2); COK Is the value of the kth carcass trait in the oth pig. This
model was fitted to the data from the rumpback dissected pigs. The
residual variance from these analyses was called the prediction variance'
Pr
2 (0).
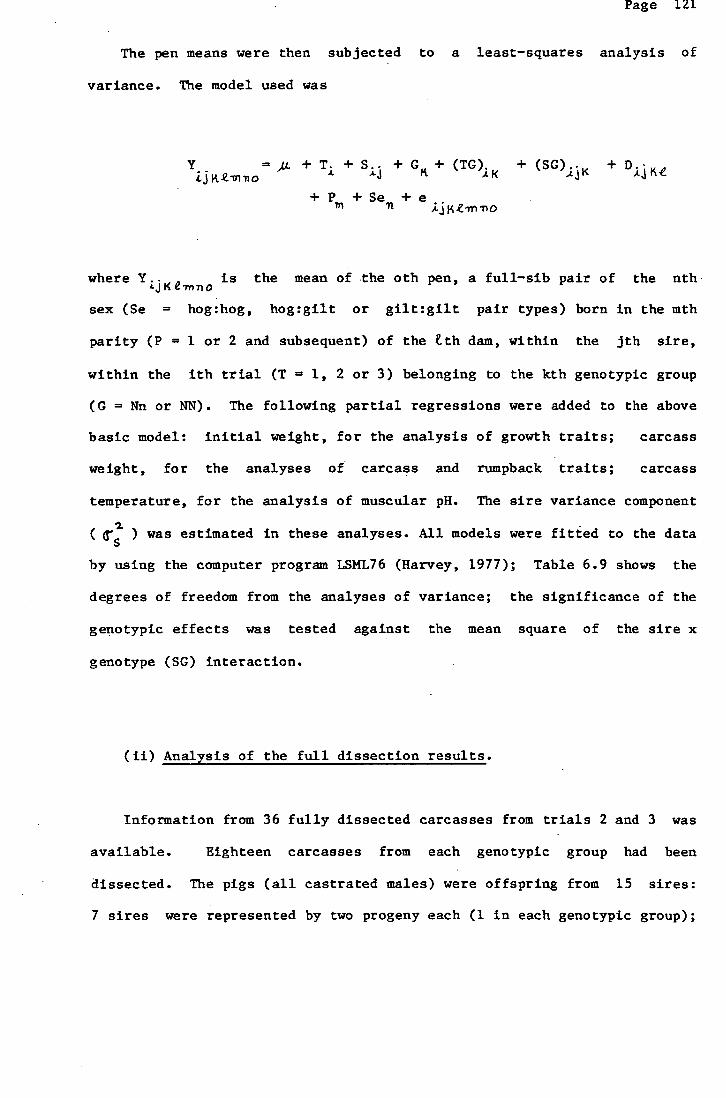
Page 121
The pen means were then subjected to a least-squares analysis of
variance. The model used was
Y .. = LL + T. + S.-. + C + (TG). + (SG).. 1< + I.. .L}<
+P +Se +e
where Y.. is the mean of -the oth pen, a full-sib pair of the nth 4J K eTn•no
sex (Se = hog:hog, hog:gilt or gilt:gilt pair types) born in the mth
parity (P 1 or 2 and subsequent) of the tth dam, within the jth sire,
within the ith trial CT = 1, 2 or 3) belonging to the kth genotypic group
(C = Nn or NN). The following partial regressions were added to the above
basic model: initial weight, for the analysis of growth traits; carcass
weight, for the analyses of carcass and rumpback traits; carcass
temperature, for the analysis of muscular pH. The sire variance component
( f ) was estimated in these analyses. All models were fitted to the data
by using the computer program LSML76 (Harvey, 1977); Table 6.9 shows the
degrees of freedom from the analyses of variance; the significance of the
genotypic effects was tested against the mean square of the sire x
genotype (SC) interaction.
(ii) Analysis of the full dissection results.
Information from 36 fully dissected carcasses from trials 2 and 3 was
available. Eighteen carcasses from each genotypic group had been
dissected. The pigs (all castrated males) were offspring from 15 sires:
7 sires were represented by two progeny each (1 in each genotypic group);

Page 122
Table 6.9. Degrees of freedom from the multiple regression analysis of
rumpback traits on carcass traits and from the analyses
variance of pen means.
Pen-means analyses
Multiple Growth and Rumpback Source regression carcass traitsa traits 6
Trials (T) - 2 2
Sires/Trials (S) 19 19 19
Genotypes (G) - 1 1
T x G - 2 2
S x G - 15 15
Dams/Sires (D) - 68 66
Parity (P) 1 1 1
Sex (Se) 1 2 2
PxSe 1 - -
Regressions 10 1 1
Remainder 129 89 67
Expected value of sire mean-squares:
2 2 a: + 2.27 + 6.88 2
+ 1.99 + 5.72
1 2 2 where , t1, and TW are the sire, dam and
1/2 within litter variance components respectively.

Page lZi
5 sires had four progeny each (2 in each genotypic group); finally, 2
sires had only one progeny each.
Three least-squares analyses of variance were carried out. In the
first, - the differences between genotypes in percentage of tissue t (lean,
fat or bone) in the carcass were estimated after fitting the model
Y.. =, + S. + G.. (carcass weight) LJKt 4.t it
(carcass weight) +
where Y.. represents the percentage of tissue t in the carcass of A.JI(t
the kth pig, an offspring of the ith sire (1,..., 15) in the jth genotypic
group (Nn or NN); 113 3t is the deviation of the regression coefficient
within genotype j from the common regression coefficient/k
The second analysis was intended to quantify the relationship between
carcass and rumpback % tissue compositions. The following model was
fitted to the full dissection results
,M. + S •+ G,j +/S4 (carcass weight) +
+ (Z of t in ruxnpback) +,. (% of t in rumpback)
+ e &j...
Kt -
with terms as in the previous model.
In a third analysis the following model was used to estimate genotypic
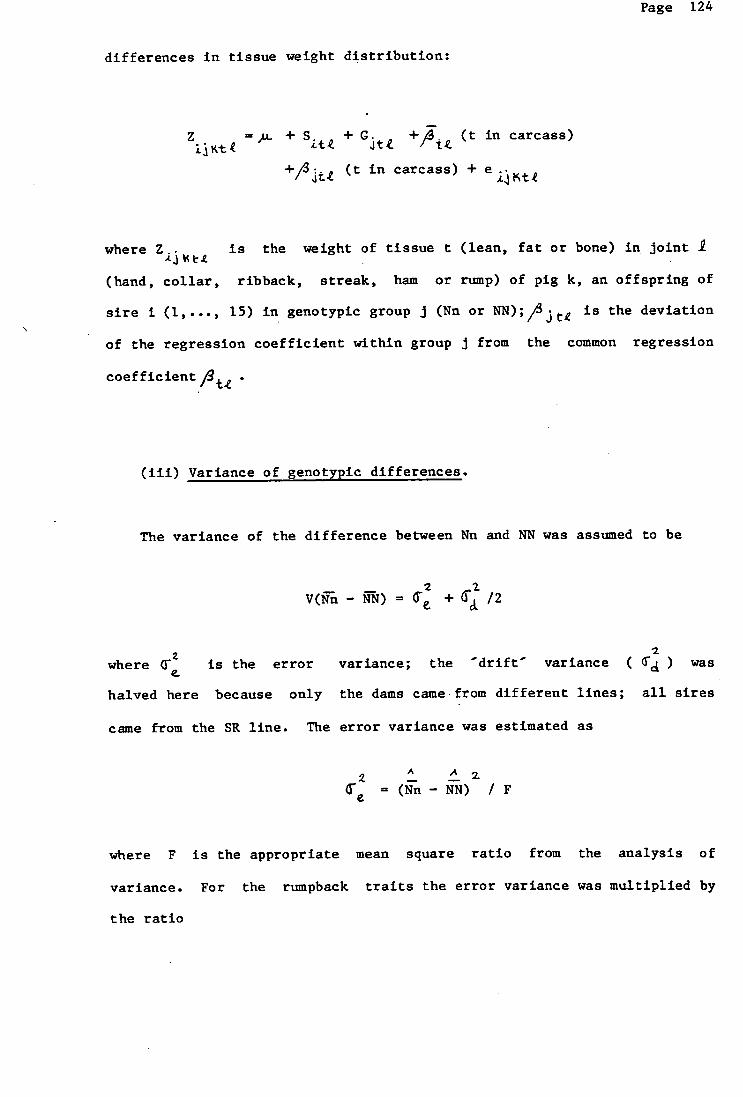
Page 124
differences in tissue weight distribution:
Z =,u+ S. +G. + (t in carcass)
+/3. (t in carcass) + e..te
where Z.. is the weight of tissue t (lean, fat or bone) in joint I
(hand, collar, ribback, streak, ham or rump) of pig k, an offspring of
sire i (1,..., 15) in genotypic group j (Nn or NN);/jt is the deviation
of the regression coefficient within group j from the common regression
coefficient
(iii) Variance of genotypic differences.
The variance of the difference between Nn and NN was assumed to be
2 1 - ) = + /2CL e.
2 where cr is the error variance; the drift variance ( ) was
halved here because only the dams came from different lines; all sires
came from the SR line. The error variance was estimated as
2 (Nn - NN) /F
where F is the appropriate mean square ratio from the analysis of
variance. For the rumpback traits the error variance was multiplied by
the ratio

Page 125
( ci; + 1/2 T pr / CW
2 in order to account for prediction errors; T. is the error mean
square from the pen mean analysis and TP, is the 'prediction variance'
(R. A. Sutherland, personal communication). The 'drift' variance was
estimated by
2 2. = 2 Ta D s1sR (5)
2. 2.
where ci , the additive genetic variance, was taken as 4
D SS,SB. (5) is the random genetic differentiation between the SS and SR
lines in the fifth 'block' of matings (Table 6.5). It was not possible to
estimate the 'drift' variance for the full dissection traits as the data
2. set was too small to allow estimation of T . The statistical tests in
(ii) are thus expected to overestimate the significance of the genotypic
differences.
RESULTS
Table 6.10 shows the overall means, standard deviations and the
estimated differences between genotypes in growth, carcass and rumpback
traits. All the differences were estimated with low precision and only
those in meat colour reached statistical significance (Pv 0.05); meat was
paler amongst heterozygotes. Barring the lack of precision, there were
indications that the heterozygotes were leaner than the homozygotes. The
subcutaneous fat depths were consistent with the differences in the
rumpback joint: at a constant carcass weight the rumpback was apparently

Page 126
Table 6.10. Overall means, standard deviations (SD) and estimated differences
between Nn and NN ABRO-PTH pigs in performance test traits.
Difference Overall
Trait mean SD Nn - NN SE SE b
Growth traits.
no. pens 54 vs 108
Age at start (days) 88.3 9.22 1.0 1.84 2.79 Daily weight gain (g) 662.1 56.81 13.0 9.30 17.47 Daily food consumption (g) 2000.1 124.23 25.0 24.30 33.75 Food conversion ratio 3.03 0.197 -0.02 0.024 0.070
Carcass traits.
no. pens 54 vs 108
Carcass weight (kg) 65.6 2.18 Backfat thickness (mm) 28.6 3.44 -1.3 0.66 1.05 Sidefat thickness (mm) 22.9 3.69 -1.1 0.84 1.17 Eye muscle area (cm ) 32.3 2.46 0.4 0.29 0.57 Carcass length (mm) 720.0 17.08 -1.8 2.81 6.88 Carcass yield (7.) 78.1 1.38 0.3 0.17 0.37 Trimming (7.) 84.9 0.56 0.1 0.11 0.18 Hindquarter (7.) 46.7 0.98 -0.1 0.15 0.31 pH 90 6.1 0.76 0.0 0.06 0.09 Meat colour (EEL) 43.1 3.53 1.6 0.75 0.90 *
Rumpback traits.
no. pens 54 vs 84
Carcass weight 65.7 2.23 Rumpback weight (g) 3893.8 269.36 -72.0 65.08 83.47 Lean (7.) 52.2 3.67 1.5 1.05 1.36 Fat (7.) 30.9 4.34 -1.9 1.22 1.58 Bone (7.) 10.7 1.69 0.2 0.56 0.69
* ! < 0.05
standard error, not including the drift variance.
standard error, including the drift variance.

Page 127
leaner in Nn pigs. Such results, in turn, agreed with those from the full
dissections. There was a close association between % lean and fat in the
carcass with those in the rumpback joint (Table 6.11). Thus, there were
clear indications that Nn pigs could have about 1.5 Z more lean in the
carcass than NN pigs in the ABRO-PTH lines. All the differences in growth
traits were small and their standard errors comparatively large.
The full dissections also provided suggestions of differences in
tissue weight distribution. At a constant lean weight Nn pigs apparently
had less lean in the ribback and in the streak and more in the rumpback
(Table 6.12). Similarly, at a constant fat weight Nn animals had more fat
in the rumpback (Table 6.13). Finally, there were indications of
genotypic differences in the rate of bone growth in some joints relative
to total bone growth (Table 6.14); such a difference was not observed in
the lean and fat tissues.
Contrary to what was found in the pen-mean analysis (Table 6.10), the
genotypic difference in rumpback weight was statistically significant in
the sub-sample of fully dissected pigs (Nn = 4036, vs NN = 3904 g). The
fact that the former group included hog:hog, hog:gilt and gilt:gilt pairs
while the latter only included hogs could be the reason for this
inconsistency. The statistical model in the pen-mean analysis did not
include a term for the genotype x sex interaction-
DISCUSSION
Although the only significant difference in this study was that in

Page 128
Table 6.11. Overall means, standard deviations and estimated differences
between Nn and NN ABRO-PTH pigs in full dissection traits, and
the relationship between carcass and rwnpback tissue composition.
Trait Overall mean SD
Difference
Nn - MN SE
Regression on rumpback tissue (%)
SE r (1
no. pigs 18 vs 18
Carcass weight (kg) 66.5 4.18
Carcass lean (%) 44.2 2.74 1.6 1.13 0.71 0.07 0.89
Carcass fat () 32.1 3.42 -1.6 1.38 0.79 0.06 0.94
Carcass bone (%) 7.4 0.63 0.2 0.20 0.29 0.07 0.70
If Residual correlation, after fitting second model in (ii).

Page 129
meat colour there are reasons to suspect that the changes in lean content
reflected a true genotypic difference which could not be demonstrated with
statistical significance because of insufficient data. As shown in Table
6.15, previous investigations found an average increase of 1.5 % leanness
in heterozygotes (Nn) relative to homozygous normal (NN) pigs. The
current estimates are thus in good agreement with those findings. The
present results should also be contrasted with a difference of about 3.5 %
between the two homozygous genotypes, and with a 3.2 ¼ difference between
reactor and non-reactor pigs, as averaged from the literature (see Table-
6.15). Thus, the experimental evidence gathered so far seems to support
the opinion that, while halothane susceptibility is a recessive trait the
accompanying effects on lean content are more or less additive (e.g.
Jensen, 1981; Webb, 1981). The same would seem to apply to other effects
of susceptibility, such as those on meat colour. Nevertheless, better
estimates are still required to confirm this indications.
The question may be asked as to how some effects of the halothane
gene are recessive while others appear to be additive. The following
model, though simplistic, might provide one possible explanation.
According to Gronert (1980), the first event in the malignant hyperthermia
reaction -which characterises halothane susceptibility- is an abrupt
increase in intracellular ionized calcium triggered by two types of
stimuli (a) some anaesthetic drugs (b) muscular contractile t1v1ty The
Ca-f-f- rise causes a sharp increase in circulating catecholamines and an
elevation in general metabolism -an homeostatic attempt to reverse the
calcium elevation. Gronert (1980) suggested that the halothane locus
might code for a cell membrane enzyme controlling Ca++ movements.
Therefore, suppose that there are normal and mutant alleles, the latter

Page 130
Table 6.12. Overall means, standard deviations and
estimated differences between Nn and NN
PTH pigs in amount of lean in the joints
at constant total lean weight.
Difference # Overall
Joint mean (g) SD Nn-NN SE
Hand 4859 588 186 171.8
Collar 4107 527 50 135.5
Ribback 3608 484 -225 140.5 *
Streak 3951 551 -363 219.7 *
Ham 8095 716 210 173.8
Rumpback 1881 210 132 69.5 **
# Difference between mean weight of lean in the
joint, adjusted to 26500 g total lean in the
carcass.
*P < 0.10
**p < 0.05
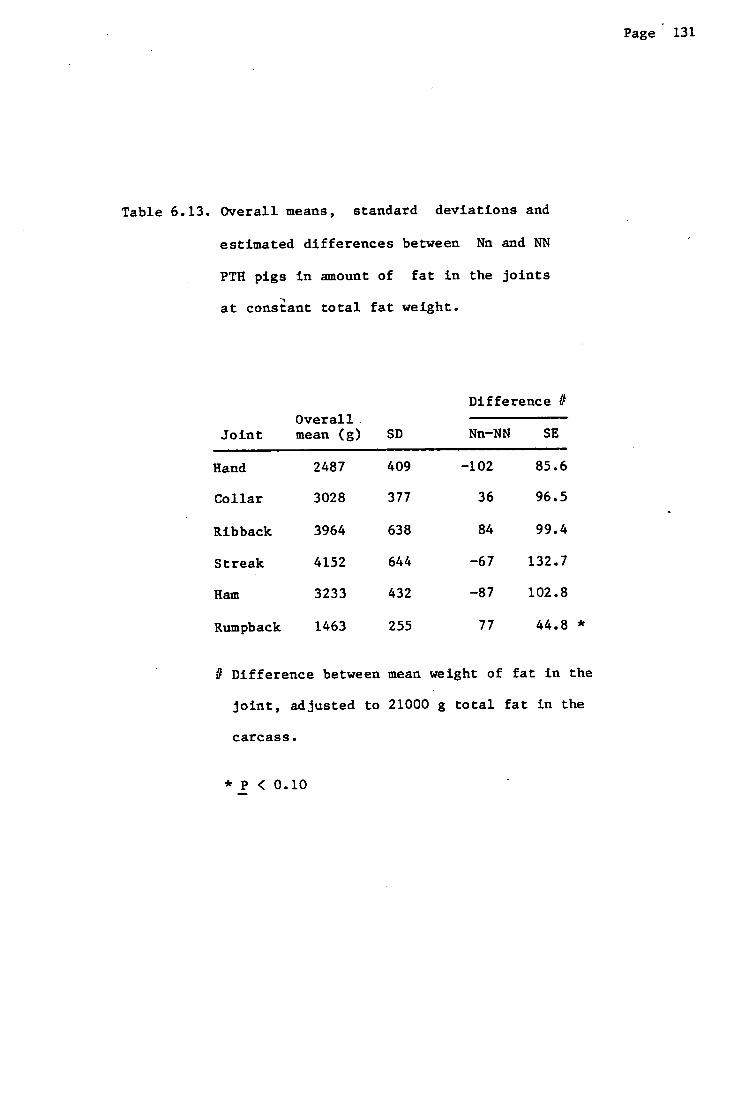
Page 131
Table 6.13. Overall means, standard deviations and
estimated differences between Nn and NN
PTH pigs in amount of fat in the joints
at constant total fat weight.
Joint Overall mean (g) SD
Difference #
Nn-NN SE
Hand 2487 409 -102 85.6
Collar 3028 377 36 96.5
Ribback 3964 638 84 99.4
Streak 4152 644 -67 132.7
Ham 3233 432 -87 102.8
Rumpback 1463 255 77 44.8 *
if Difference between mean weight of fat in the
joint, adjusted to 21000 g total fat in the
carcass.
*p < 0.10
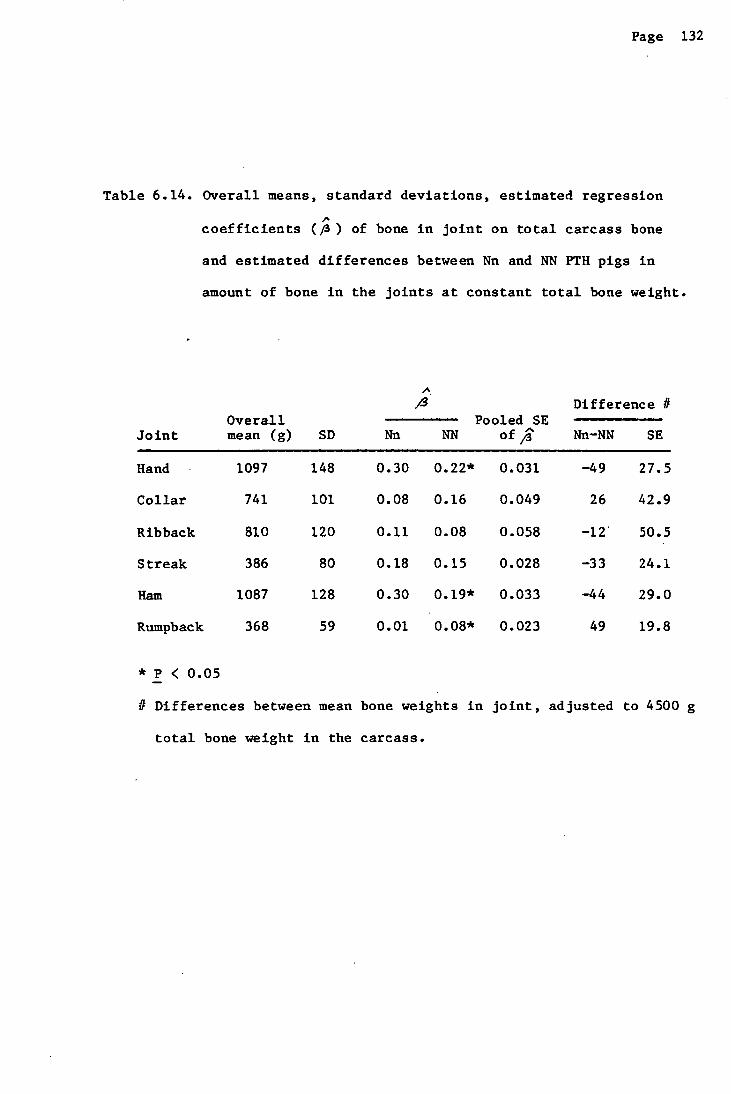
Page 132
Table 6.14. Overall means, standard deviations, estimated regression
1
coefficients (/3) of bone in joint on total carcass bone
and estimated differences between Nn and NN PTH pigs in
amount of bone in the joints at constant total bone weight.
Joint Overall mean (g) SD Nn
Pooled SE NN of",
Difference #
Nn-NN SE
Hand 1097 148 0.30 0.22* 0.031 -49 27.5
Collar 741 101 0.08 0.16 0.049 26 42.9
Ribback 810 120 0.11 0.08 0.058 -12 50.5
Streak 386 80 0.18 0.15 0.028 -33 24.1
Ham 1087 128 0.30 0.19* 0.033 -44 29.0
Rumpback 368 59 0.01 0.08* 0.023 49 19.8
*p < 0.05
# Differences between mean bone weights in joint, adjusted to 4500 g
total bone weight in the carcass.

Page 133
producing an hypofunctional -or functionless- enzyme variant. The
enzymatic activity in heterozygotes would then be intermediate. Following
an appropriate stimulus there would be a rise in intracellular Ca++, both
in mutant homozygotes and in heterozygotes; the increase, however, would
be twice as high in the former than in the latter. Thus, Ca++ levels in
heterozygotes would not reach a threshold where control of the metabolic
processes is lost and malignant hyperthermia ensues. Those levels would
only occur in homozygous mutant pigs after type (a) stimuli, or after very
intense muscular activity. Liability to malignant hyperthermia would thus
be a recessive.trait. Type (b) stimuli, however, occur often in everyday
life, during exercise or excitement. In most cases their intensity would
not be high enough to make Ca-I-I- reach a critical level; nevertheless,
they would still elicit an increase in circulating catecholamines and in
general metabolism proportional to the calcium rise. The lipolytic and
fat mobilizing effects of noradrenaline are well known (see Gregory,
1981). By enhancing glycolysis the catecholamines may also be a factor of
meat quality (Opsahi et al., 1981). More or less additive genotypic
values in traits like body leanness and meat colour would occur in this
way. Of course, similar models could be constructed with different
assumptions. The details are less important than the general features:
a primary metabolic reaction, whose kinetics is affected by varying
cnvrozertal stimuli and by a locus with gene dosage effects,
- a series of secondary metabolic reactions, whose intensity depends
on the concentration of product from the primary reaction,
- a threshold on the scale of concentration of product, after which

Page .134
Table 6.15. Summary of effects of the halothane locus on
% lean content in pigs.
Estimated Comparison difference Trait Source *
11 HP vs RN 3.2 3.8
nn vs NN 2.7 4.3 3.5
Mn vs NN
carcass lean 1 rump lean 2
carcass lean 3 carcass lean 4
mean
1.0 carcass lean 3
2.1 carcass lean 4
1.6 carcass lean this study
1.5 rump lean this study
# HP = halothane positive reactors; RN = halothane negative ractors
* References
Pool of nine estimates from the literature; see Chapter 2 (Table 2.3).
ABRO-PTH; Webb and Jordan (1978).
German Landrace; Schneider, Schworer and Blum (1980).
Danish Landrace; Jensen (1981).

Page 135
the secondary reactions develop into malignant hyperthertnia.
A model with such features would determine that the property of
dominance is a function of the trait being looked at, rather than of the
locus.
The next question is whether the secondary effects are indeed
plelotropic manifestations of the halothane locus or, rather, the result
of non-random association with other genes. As discussed earlier, there
had been less than three generations of random mating following the
original Pietrain x Hampshire crosses, before PTH was divided into the SS
and SR lines. Under such conditions the - susceptibility' allele might
have 'hitch-hiked some Pietrain genes into SS. Is it possible,
therefore, that some loci, linked to the halothane locus, might affect
traits like lean content? The locus of the structural gene for the enzyme
6-PGD, which recent studies situated at about 9 centimorgans from the
halothane locus (Jrgensen, 1981), could meet the requirements. This
enzyme acts in the pentose cycle, whose function is to produce NADPH for
lipid biosynthesis. Steele et al. (1972) and Rogdakis (1974, 1979) have
demonstrated a clear relationship betweenenzyme activity in the pentose
shunt and fatness in pigs. The genetic correlation between NADPH
generating enzymes activity and backfat thickness was estimated at 0.73 ±
0.16 (Rogdakis, 1979). The gene for 6-PGD is polymorphic in the pig; two
codominant alleles produce three electrophoretic genotypes (Cahne, 1979).
If 6-PGD genotypes affect lipid synthesis in the pig as they do in
Drosophila (Cavener and Clegg, 1981) their effects will be confounded, in
populations out of linkage equilibrium, with the halothane genotypic

Page 13b
effects. Unfortunately, 6-PGD was not investigated in PTH. However, its
map distance to the halothane locus might be well below the expected
length of the linkage block remaining intact after three generations of
random mating (Hanson, 1959). Here again, as in the case of the
reproductive traits, the effects of the halothane locus might be
confounded, in the PTH lines, with those of other loci in a linkage block
around it. As was remarked for the H locus, it would be interesting to
assess the present allelic frequencies at 6-PGD in the SS and SR lines.
And yet, the present differences in leanness agree with all previous
investigations, in direction and in order of magnitude. Apart from PTH,
those investigations involved samples from the Dutch Landrace (Elkelenboom
et al., 1980), German Landrace (Schneider et al., 1980) and Danish
Landrace (Jensen, 1981) breeds. The studies did not provide information
on 6-PGD genotypes; however, it would be surprising if the halothane
gene was associated with the same 6-PGD allele in all the experiments.
In fact, population studies revealed that the halothane locus was in
linkage equilibrium with 6-PGD in the Danish Landrace breed (JØrgensen and
Hyldgaard-Jensen, 1981). On this basis it could be concluded that the
halothane locus exerts its own, additive effects on leanness. The
possibility still remains that linkage, disequilibrium with 6-PGD causes
some confusion as to the correct magnitude of the halothane genotypic
values but this hypothesis is still to be tested.
Judging the present results from a practical viewpoint, the paler
musculature in heterozygotes might, in some instances, be regarded as a
disadvantage. Paleness is one of the characteristics defining PSE -pale,
soft, exudative- pork; another is lower muscle pH (Briskey, 1964);

Page 137
thus, colour and pH are included in the so-called meat quality index
used in Denmark (Barton-Gade, 1981; Jensen, 1981). Meat colour, however,
does not seem to be an economic problem in itself; a recent British study
concluded that there is no adverse consumer reaction against paler pork;
paler lean did not represent a sales problem for fresh or cured meats
(Smith and Lesser, 1982). Paleness is associated with increased drip
losses in fresh pork and with reduced brine uptake during curing, in PSE
carcasses. These might constitute disadvantages for pigmeat traders or
curers; their economic significance, however, varies widely (Month et
al., 1981; Smith and Lesser, 1982). At any rate, this study failed to
detect differences in muscle pH and the genotypic difference in meat
colour was far from reaching the magnitude of those usually observed
between PSE and non-PSE carcasses (see Smith and Lesser, 1981).
Therefore, it seems difficult that differences in meat colour such as those
found in this study might represent an Important economic disadvantage for
the heterozygotes, relative to the homozygous normal pigs.
The practical significance of the differences in tissue weight
distribution is unknown. Perhaps the genotypic differences in relative
growth of some bones are interesting to those who use prediction equations
of carcass bone based on bone content In some particular joint. One
requirement of such predictors is that their relationship with the
predicted vriab1a remains stable across different genotypes. In economic
terms, changes in tissue weight distribution are usually assumed to be
unimportant (Fowler, Bichard and Pease, 1976). In the present case it is
difficult to atribute any obvious economic significance to the differences
shown in Tables 6.12 and 6.13.

Page 138
At present, the main concern of most pig breeding programmes is to
produce leaner animals. Therefore, the most important result in this
study is the indication of a 1.5 % increase in lean content in
heterozygotes. To put this effect in perspective, the annual progress in
% (rump) lean obtained by the Pig Improvement Scheme of Great Britain was
recently estimated at 0.46 and 0.87, in Large White and Landrace
respectively (Jones, 1982). In national terms, thus, the advantage in
heterozygotes would represent some 1.5 - 3.5 years of selection.
Since PTH is a synthetic experimental population the extent to which
the present results can be extrapolated to commercial pig populations may
be arguable. A further experiment has therefore been started at ABRO to
estimate genotypic values in British Landrace. In the meantime, if a
decision has to be taken on the likely benefits of developing specialised
sire lines the present results might be conveniently pooled with other
results in the literature and an economic assessment might be attempted on
this basis. Such evaluation must consider the costs incurred in
maintaining and selecting additional lines with reduced prolificacy and
with stress susceptibility problems (Smith, 1981). The set of economic
values to be assigned to the traits will vary with the circumstances; for
example: a susceptible sire line may be bred by some integrated scheme
producing and selling fresh pork; alternatively, it may be developed by a
breed society on a national scale; the economic weighting of the traits
is likely to vary between these two alternatives. Because of simpler
organisational problems it would seem more feasible, in principle, to
exploit the halothane gene by means of specialised lines in an integrated
production scheme, than in a general breeding program of national
proportions (Smith, 1981). However, as pointed out by Webb (1981), the
Page 139
Theterozygote mating system is already in use in some European countries,
with sires from halothane susceptible type of breeds, such as Pietrain or
Belgian Landrace, mated to halothane tolerant type of darn breeds, such as
Large White x Landrace.

Page 140
CHAPTER 7. CONCLUDING REMARKS
The studies in the preceding chapters have dealt with diverse aspects
of the halothane susceptibility phenomenon in pigs. In two instances they
utilized results from experiments performed with specific aims at ABRO:
to assess the effects of age on susceptibility incidence and to estimate
genotypic values for growth and carcass traits. The rest of the studies
relied on field data resulting from the development of halothane
positive and negative experimental stocks. In general, most of the
results can not be regarded as conclusive. Instead, they provided
indications which, together with some speculation, might hopefully serve
as a framework for testing hypotheses in future investigations. In this
chapter these will be briefly reviewed with the aim of outlining some
problems for future research.
(i) The mode of inheritance of susceptibility.
In Chapter 3 the single—recessive hypothesis was rejected as the mode
of inheritance in British Landrace. While this is the first time this
hypothesis was relected it also seems to have been one of the few
occasions when it was formally tested against some rival hypothesis. The
study was prompted by the observation that penetrance was unusually low in
Landrace; furthermore, it seemed to vary between families.
However, the Landrace data were not entirely adequate for testing

Page 141
genetic hypothesies because: (a) the population was a mixture, its
probability structure required nuisance parameters which rendered the
conclusions of the analysis conditional on their value; and (b) there
were no matings between reactors and non-reactors. Ideally, inferences
about the mode of inheritance of any trait should be based on the outcome
of all possible mating types. Hence, these results should be seen as
preliminary indications that a single and strictly recessive mode of
inheritance may not be appropriate in British Landrace. These pigs are
thus interesting for future investigations, as they offer the possibility
of discovering new aspects of halothane susceptibility. There are also
practical implications since the breed is widely exploited in Great
Britain. Clearly, the mode of Inheritance has to be satisfactorily
elucidated before the benefits of alternative breeding policies can be
fully assessed.
It thus seems Important to verify these findings, which can be
summarised as follows: under a single-locus model with two alleles 91 %
of one of the homozygotes and 22 % of the heterozygotes appeared to be
reactors in British Landrace. This was in contrast with the findings in
Pietrain/Hampshire, where susceptibility appeared to be strictly
recessive.
Irrespective of what genetIc hypotheses are to be tetcd in future
research, it is now clear that with halothane susceptibility the classical
Mendelian segregation ratios tend to be distorted by differential
mortality and incomplete penetrance. The problem, therefore, is one of
estimation of parameter values in genetic models. The adequacy of
different hypotheses about the parameter values has to be judged in

Page 142
probabilistic terms. In these circumstances the general method of genetic
inference called segregation analysis (Morton, 1969), which is based on
the concept of likelihood, would seem to be the most appropriate
analytical tool. Hypotheses can be tested by standard likelihood ratios
(Edwards, 1972).
What general models could be used? A single-locus with two alleles
could provide the first framework. Hypotheses should concern the value of
penetrance in heterozygotes, that is, whether it is different from zero
(recessivity) or from unity (dominance). If an intermediate penetrance
for the heterozygotes is confirmed curiosity will then demand the testing
of new hypotheses. After all, how could it be that this trait sometimes
behaves dominantly, sometimes recessively ? New hypotheses will in turn
require some extension of the single-locus-two-alleles model. Multiple
allelism is a possibility under a single-locus model. Otherwise the
number of loci can be increased. Simon (1980) suggested that the
multifactorial-threshold model could be an alternative. However, a good
amount of evidence shows that there is a locus with major effects on
halothane susceptibility in a well studied linkage group in pigs (e.g.
Andresen, 1981; Jrgensen, 1981). Thus, models keeping a -major locus
but involving some genetic modifier device seem a more realistic option.
The two-locus-suppressor niüdi of Chapter 3 Is one such model. It
allowed rejection of the single-recessive and -dominant hypotheses in
Landrace and also showed it could improve the single-recessive hypothesis
in Pietrain/Hampshire. However, some alternatives can be envisaged, which
werenot compared with the two-locus-suppressor model. For example,
genotypes at the second locus might confer, or fail to confer,
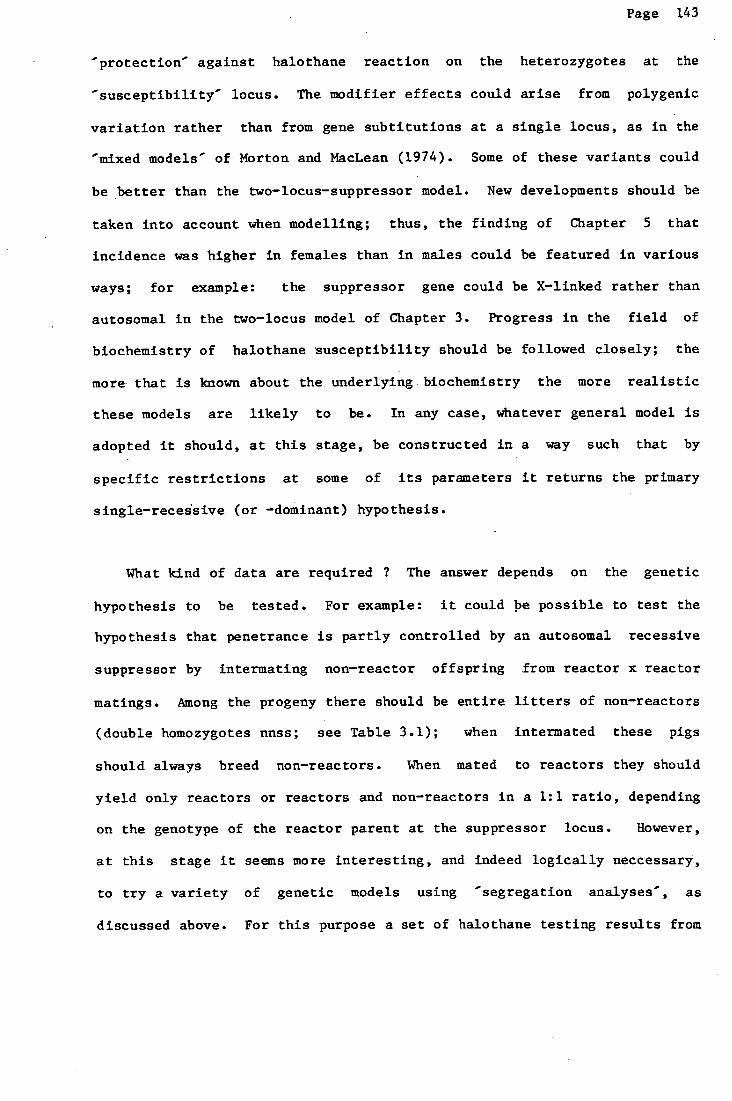
Page 143
protection against halothane reaction on the heterozygotes at the
susceptibility locus. The modifier effects could arise from polygenic
variation rather than from gene subtitutions at a single locus, as in the
mixed models of Morton and MacLean (1974). Some of these variants could
be better than the two-locus-suppressor model. New developments should be
taken into account when modelling; thus, the finding of Chapter 5 that
incidence was higher in females than in males could be featured in various
ways; for example: the suppressor gene could be X-linked rather than
autosomal in the two-locus model of Chapter 3. Progress in the field of
biochemistry of halothane susceptibility should be followed closely; the
more that is known about the underlying biochemistry the more realistic
these models are likely to be. In any case, whatever general model is
adopted it should, at this stage, be constructed in a way such that by
specific restrictions at some of Its parameters it returns the primary
single-recessive (or -dominant) hypothesis.
What kind of data are required ? The answer depends on the genetic
hypothesis to be tested. For example: it could be possible to test the
hypothesis that penetrance is partly controlled by an autosomal recessive
suppressor by Intermating non-reactor offspring from reactor x reactor
matings. Among the progeny there should be entire litters of non-reactors
(double homozygotes nnss; see Table 3.1); when intermated these pigs
should always breed non-reactors. When mated to reactors they should
yield only reactors or reactors and non-reactors in a 1:1 ratio, depending
on the genotype of the reactor parent at the suppressor locus. However,
at this stage It seems more interesting, and indeed logically neccessary,
to try a variety of genetic models using segregation analyses, as
discussed above. For this purpose a set of halothane testing results from

Page 144
reactor and non—reactor parents and their offspring constitutes the basic
experiment advocated here.
The prior probability structure of this population should be as simple
as possible, not only for computational economy but also because it is
desirable that statements about the value of parameters of interest in the
model can be made without having to invoke the value of nuisance
parameters. Thus, if a population is set up after mixing pigs from
different subpopulations or lines, the parental group should come from the
F2 or later if models are not to include such nuisance parameters as
variances and covariances of gene frequency differences among lines.
Mating should be random in the grandparental generation and all possible
mating combinations between reactors and non—reactors should be
accomplished in the parental group. Ideally, all pigs should be kept on
the same farm.
At this point it is convenient to recall some results from previous
chapters. In Chapter 4 it was discussed how, given certain assumptions,
the mode of inheritance of susceptibility can be an artifact of the
duration of the halothane test. It was also found that about 20 %
positive reactions in a 5—minute test occurred after the .third minute in
British Landrace. Thus, there is evidence showing that the standard
3—minute test is too short to detect the slower reactors of this breed.
It might be rewarding to extend the test duration as much as possible
Reaction time can also enter into models for the inheritance of
susceptibility in several ways, as discussed in Chapter 4. It was shown
in Chapter 5 that the incidence of susceptibility changes markedly with
the age of the pigs. If the complication of treating penetrances as

Page l'5
functions of age is to be avoided, all pigs in the experiment, parents and
offspring, should be tested at an uniform age which, according to findings
in Chapter 5, should not be earlier than five weeks.
A multi—purpose data set derived from such an experiment would be
very useful at this stage, when there is a need not only of verifying the
specific findings of Chapter 3, but also of exploring a variety of genetic
models. Once a model has been chosen it can be validated further by
testing some of its consequences in ad hoc experiments.
(ii) Changes in productivity traits associated with susceptibility.
There is now a large amount of evidence showing what traits of
economic importance are likely to be affected by halothane susceptibility.
Moreover, the direction of these changes and, in some instances (e.g.
lean content), the order of magnitude are also reasonably well
established. Nevertheless, there are still a number of problems that
require elucidation.
The question of whether these effects are pleiotropic manifestations
of the halothane locus or the consequences of linkage disequilibria with
other closely linked loci has been discussed in Chapters 2 and 6. It
should suffice here to stress the point that results in the literature

Page 146
call for a thorough assessment of the effects of genotypes at the H and
6—PGD loci on reproduction and leanness respectively, independently of,
and also interacting with, genotypes at the halothane locus. A number of
very interesting genetic problems could arise from a situation where two
loci in a relatively short chromosomal tract are found to have effects on
the same metric trait.
Another question springs from the findings of Chapter 3 on the mode of
inheritance of susceptibility: if there is genetic variation modifying
gene action at the susceptibility locus, how will it affect the secondary
effects of this locus ? The question was proposed by Webb (1981) in a
slightly different form : could it be possible to separate harmful
effects, associated with stress susceptibility, from beneficial effects,
by exploiting modifier genetic variation ? In principle, the possibility
that genetic modifiers could act partially, modifying only some aspects
of susceptibility leaving others unchanged, seems unlikely. Harmful and
beneficial effects, like stress susceptibility and increased leanness, are
seen here as closely related manifestations of a single biochemical or
physiological phenomenon. However, this is a matter of empirical
investigation, which can be tackled once the problems raised in Chapter 3,
concerning the mode of inheritance ; are clarified If there are lcd
whose alleles are modifiers of gene action at the susceptibility locus
selection for and against halothane reaction will change their allelic
frequencies. In this case, how adequate are selected experimental lines
as models of commercial pig populations ?
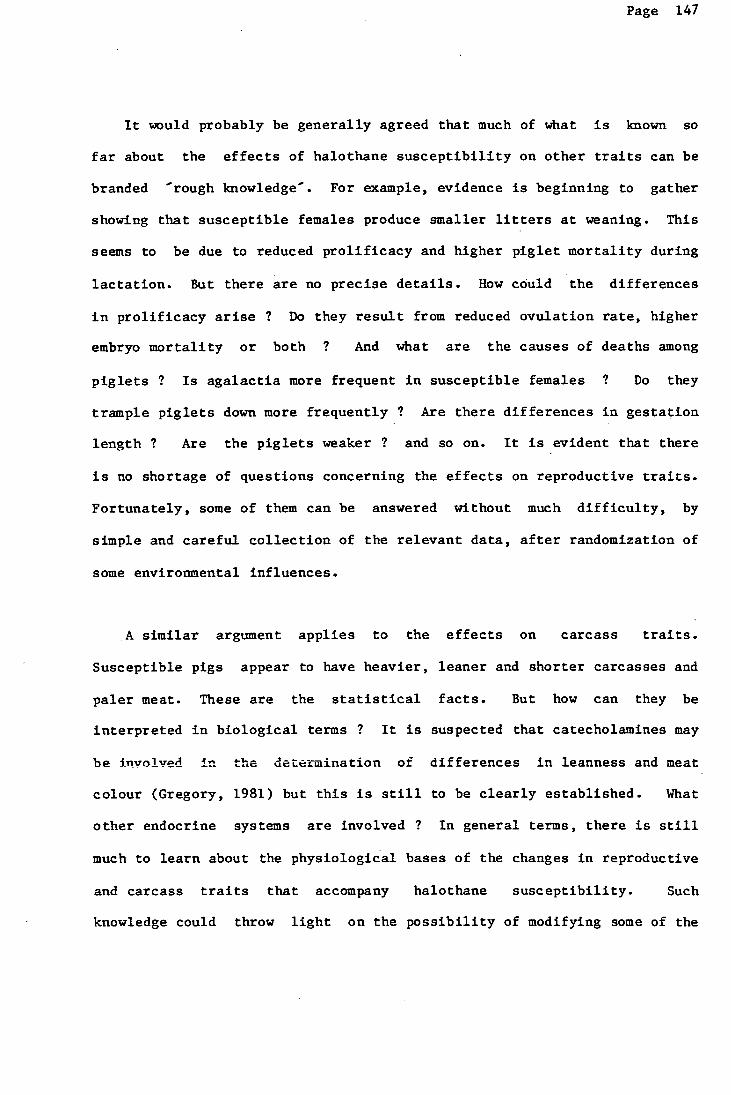
Page 147
It would probably be generally agreed that much of what is known so
far about the effects of halothane susceptibility on other traits can be
branded rough knowledge'. For example, evidence is beginning to gather
showing that susceptible females produce smaller litters at weaning. This
seems to be due to reduced prolificacy and higher piglet mortality during
lactation. But there are no precise details. How could the differences
in prolificacy arise ? Do they result from reduced ovulation rate, higher
embryo mortality or both ? And what are the causes of deaths among
piglets ? Is agalactia more frequent in susceptible females ? Do they
trample piglets down more frequently ? Are there differences in gestation
length ? Are the piglets weaker ? and so on. It is evident that there
is no shortage of questions concerning the effects on reproductive traits.
Fortunately, some of them can be answered without much difficulty, by
simple and careful collection of the relevant data, after randomization of
some environmental influences.
A similar argument applies to the effects on carcass traits.
Susceptible pigs appear to have heavier, leaner and shorter carcasses and
paler meat. These are the statistical facts. But how can they be
interpreted in biological terms ? It Is suspected that catecholamlnes may
be involved In the determination of differences in leanness and meat
colour (Gregory, 1981) but this is still to be clearly established. What
other endocrine systems are Involved ? In general terms, there is still
much to learn about the physiological bases of the changes in reproductive
and carcass traits that accompany halothane susceptibility. Such
knowledge could throw light on the possibility of modifying some of the

Page 148
undesirable effects of susceptibility by means of background genetic
variation.
In general terms, most problems concerning the genetics of halothane
susceptibility in pigs have so far been approached on a statistical level.
Although there is still a need for more and better estimates, particularly
in relation to reproductive traits, this approach has already produced
useful information which nowadays enables breeders to make some judgement
of the economic balance between expected beneficial and harmful. effects.
However, a growing list of unanswered questions now requires an attack on
physiological and metabolic grounds. This will give geneticists a better
understanding of the halothane susceptibility trait, and could also yield
information of potential usefulness for practical breeding. Eventually,
such investigations may turn this genetic system into a candidate for
manipulation by means of genetic engineering techniques.

Page 149
APPENDIX
Halothane testing results in Pietrain/Hanipshire:
Positive x Positive matings Negative x Negative matings
Sire Darn No.Progeny No.Positive
1 1 8 8 2 6 6
2 3 7 6 4 7 7 5 8 5
3 6 3 3 7 1 1 8 4 4
4 9 6 6 10 8 8 11 3 3
Positive x Negative matings
1 12 8. 8 4 13 10 0
14 7 3 15 8 0 16 7 0
Negative x Positive matings
5 17 11 9 18 6 6
6 19 8 8
Sire Dam No.Progeny No.Positive
6 20 7 4 21 9 0
7 22 8 1 23 6 .2 24 9 0
8 25 7 1 26 6 0 27 2 0
9 28 6 0 29 6 0 30 5 1
10 31 2 0 32 7 2
11 33 6 0 34 4 0 35 6 2
12 36 9 0 37 7 0
13 38 6 1 39 9 2
1.4 40 9 3

Page 150
Halothane testing results in Landrace:
Positive z Positive matings
Sire Dam No.Progeny No.Positive
1 1 12 7 2 3 3
2 3 9 9 3 4 10 . 7
5 10 3 6 7 2 7 2 1
4 8 11 10 5 9 7 2 6 10 5 0
11 5 5 7 12 6 4
13 4 3 14 7 6 15 1 1
8 16 6 3 17 7 4
9 18 9 4 19 10 9 20 11 9
10 21 9 4 22 5 4 23 9 6
11 24 6 1 12 25 4 4 13 26 7 6
27 6 6 14 28 10 10
Negative x Negative matings
Sire Darn No.Progeny No.Positive
15 29 9 2 30 4 0
16 31 6 5 32 8 0
17 33 10 0 34 3 0
18 35 7 0 36 7 1
19 37 1 0 38 12 0 39 3 0
20 40 8 0 41 5 0 42 4 0
21 43 6 . 2 22 44 7 0
45 11 2 46 6 0
23 47 6 0. 48 5 0 49 4 0
24 50 6 0 51 9 2 52 7 0
25 53 6 0 26 54 10 0
55 9 0 56 5 0
27 57 5 0 28 58 6 0
59 10 0 60 9 0

ACKNOWLEDGEMENTS
This thesis was done under the joint supervision of Dr A. J. Webb
and Dr W. C. Hill. Above all I wish to express my deep gratitude to
them for their generous support, constant encouragement and invaluable
guidance during the course of my studies. Dr Webb made available the
data, for which I am particularly indebted.
I should like to express my appreciation to Professor J. W. B. King
for providing excellent facilities at the ARC Animal Breeding Research
Organisation. Dr C. Smith read Chapters 3 and 6 and provided careful and
constructive criticism which saved me from some errors. Professor A.
Robertson gave me valuable suggestions on the problem of random genetic
differentiation of lines. I am most grateful to them.
Eduardo Avalos read and criticised the manuscript. I owe a great debt
to him for his constant friendship and support. I am also indebted to
Andy Sutherland who clarified to =c many statistical problems and placed a
battery of useful programs at my disposal.
I would also like to thank:
Mr D. I. Sales and Mrs C. McCoubrey for statistical advice; Mr D.

Nicholson, Mr D. Maxwell and Mr R. Findlay for their guidance in the use
of computing facilities and for their help in debugging many programs;
Anne Douglas and Maureen Edwards for computational assistance; Mr I.
Will and staff at ABROs Mountmarle farm for collecting most of the data
for this work and Miss H. MacLean for data preparation.
I wish to express my great obligation to CONICET and INTA, from
Argentina, for their financial support. Of my colleagues at INTA
Pergamino I must mention Mr Manuel Bonino for his faithful support over.
the years.
Finally, I wish to express my special gratitude to my wife, Nora, and
our children Natalia, Pablo and Cintia, for their love, encouragement and
patience, and to my parents for their constant support.

REFERENCES.
ALLEN, W.M. (1980). Malignant hypertherinia. In: Animal Models of
Neurological Disease. Ed. Clifford Rose, F. and Behan, P. 0.;
Pitman Medical Ltd., Tunbridge Wells, Kent; pp 65-71.
ALLEN, W.M.; BERRET, S.; HARDING, J.D. and PATERSON, D.S.D (1970).
Experimentally induced acute stress syndrome in Pietrain pigs..
Veterinary Record 87, 64-69.
ALLEN,W.M.; CHEAR, K.S.; IMLAR, P.; LISTER, D.; STEANE, D.E. and
WEBB, A.J. (1980). Testing methods for PSE syndrome: current
research in the U.K.. Livestock Production Science 7, 305-315.
ANDRESEN, E. (1971). Linear sequence of the autosomal loci PHI, H and
6-PGD in pigs. Animal Blood Groups and Biochemical Genetics
2, iiq-in

ANDRESEN, E. (1979). Linkage disequilibrium responsible for
association between susceptibility to the malignant
hyperthermia syndrome (MHS) and the PHI types in Danish
Landrace pigs. Acta Agriculturae Scandinavica 29, 369-373.
ANDRESEN, E. (1981). Evidence for a five-locus linkage group involving
direct and associative interactions with the A-0 blood group locus
in pigs. In: Papers dedicated to Professor Johanes Moustgaard; Ed:
Bruinmerstedt, E. ; The Royal Danish Agricultural Society,
Copenhagen, pp. 208-212.
ANDRESEN, E. and JENSEN, P. (1977). Close linkage established between
the HAL locus for halothane sensitivity and the PHI (phospho-
hexose isomerase) locus in pigs of the Danish Landrace breed.
Nordisk Veterinarmedicin 29, 502-504.
ANDRESEN. E; JENSEN, P. and BARTON-CADE, P. (1981). The porcine
HAL locus: A major locus exhibiting overdominance. Zeitschrift
fur Tierzuchtung und Zuchtungsbiologie .98, 170-175.
A!ThOEN E. - an ' JUL'U1l P. (1981). Population studies
of PHI, HAL, H haplotype frequencies and linkage disequilibria
in Danish Landrace pigs. Zeitschrift fur Tierzuchtung und
Zuchtungsbiologie 98, 45-54

BAKER, J. and NELDER, J. A. (1978). The GLIM System Manual. Numerical
Algorithms Group; 7 Banbury Road, Oxford.
BARTON-GADE, P. (1981). The measurement of meat quality in pigs post
mortem. In: Porcine Stress and Meat Quality. Ed: Frystein, T;
Slinde, B. and Standal, N.; Agricultural Food Research Society,
As, Norway; pp 205-218.
BATSC}IELET, E. (1963). Testing hypothesis and estimating parameters in
human genetics if the age of onset is random. Biometrika 50, 265
-279.
BR.ASCAMP, E.W.; EIKELENBOOM, G. and MINKEMA, D. (1980). The effect of a
single locus (halothane) on variances of and correlations among
quantitative production traits. In: 31st Meeting of the EAAP,
Munich, Paper GP3.4, 6 pp.
BRISKEY, E.J.(1964). Etiological status and associated studies of pale,
soft, exhudative porcine musculature. Advances in Food Research 13,
89-178.
BRITT, B.A.; KALLOW, W. and ENDRENYI, L. (1978). Malignant hyperthermia
-Pattern of inheritance in swine. In: Second International Symposium
on Malignant Hyperthermia. Ed: Aldrete, J.A. and Britt,.B.A., New
York, Grune and Stratton, pp 195-211.

BUCK, S. I. (1961). Annual Report. National Pig Progeny Testing Board.
NPPTB, Stotfold, Hitchin, Herts., 298 pp.
BULLA, J., EIKELENBOOM, C., ZELNIK, J. and POLTARSKY, J. (1979).
Halothane test In early diagnosis of stress susceptibility. In
Muscle Function and Porcine Meat Quality. Acta Agriculturae
Scandinavica, Suplementum 21, pp 418-426.
CANPION, D.R. and TOPEL, D.C. (1975). A review of the role of swine
skeletal muscle in malignant hyperthermla. Journal of Animal
Science 41, 779-786.
CARLSON, J.P.; CHRISTIAN, L.L.; KUHLERS, D.L. and RASMTJSEN, B.A.
(1980). Influence of the porcine stress syndrome on production
and carcass traits. Journal of Animal Science 50, 21-28.
CAVENER, D. R. and CLEGG, M..(1981). Evidence for biochemical and
physiological differences between enzyme genotypes in Drosophila
Melanogaster. Proceedings of the National Academy of Sciences,
USA, 78 9 4444-4447.
CHEAH, K.S. and CHEAH, A.M. (1976). The trigger for PSE condition in
stress susceptible pigs. Journal of the Science of Food and
Agriculture 27, 1137-1144.
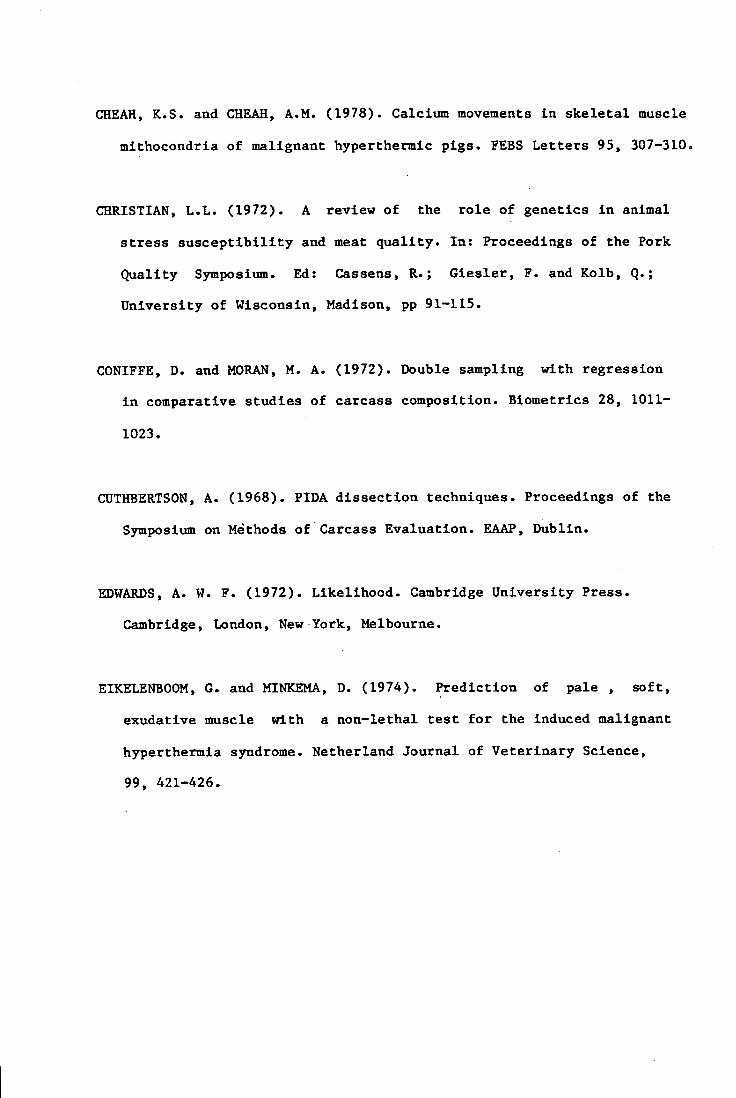
CHEAR, K.S. and CHEAH, A.M. (1978). Calcium movements in skeletal muscle
mithocondria of malignant hyperthertaic pigs. FEBS Letters 95, 307-310.
CHRISTIAN, L.L. (1972). A review of the role of genetics in animal
stress susceptibility and meat quality. In: Proceedings of the Pork
Quality Symposium. Ed: Cassens, R.; Giesler, F. and Kolb, Q.;
University of Wisconsin, Madison, pp 91-115.
CONIFFE, D. and MORAN, N. A. (1972). Double sampling with regression
in comparative studies of carcass composition. Biometrics 28, 1011-
1023.
CUTHBERTSON, A. (1968). PIDA dissection techniques. Proceedings of the
Symposium on Methods of Carcass Evaluation. EAAP, Dublin.
EDWARDS, A. W. F. (1972). Likelihood. Cambridge University Press.
Cambridge, London, New-York, Melbourne.
EIKELENBOOM, G. and MINKENA, D. (1974). Prediction of pale , soft,
exudative muscle with a non-lethal test for the induced malignant
hyperthermia syndrome. Netherland Journal of Veterinary Science,
991, 421-426.

EIKELENBOOM, C.; MINKEMA, D. and van ELDIK, P. (1976). The application
the halothane test. Differences in production characteristics between
pigs qualified as reactors (MHS-susceptible) and non-reactors. In
Proceedings of the Third International Conference on Production
Disease in Farm Animals. Centre for Agricultural Publishing and
Documentation; Wageningen, The Netherlands, pp. 183-185.
EIKELENBOOM, G.; MINKENA, D. and SYBESMA, W. (1978). The halothane
test, a new selection tool in pig breeding. World Animal Review
28, 9-12.
EIKELENBOOM, G. ; MINKEMA, D. ; van ELDIK, P. and SYBESMA, W.
(1978). Production characteristics of Dutch Landrance and Dutch
Yorkshire pigs as related to their susceptibility for the halothane
induced malignant hyperthermia syndrome. Livestock Production
Science 5, 277-284.
EIKELENBOOM, C.; MINKEMA, D.; van ELDIK, P. and SYBESMA, W. (1980).
Performance of Dutch Landrace pigs with different genotypes for
the halothane induced malignant hyperthermia syndrome. Livestock
Production Science 7, 317-324.
FALCONER, D. S. (1963). Quantitative inheritance. In: Methodology in
Mammalian Genetics. Ed: Burdette, W. J.; Holden-Day, San Francisco;
pp 193-216.

FALCONER, D. S. (1967). The inheritance of liability to diseases with
variable age of onset , with particular reference to diabetes
mellitus. Annals of Human Genetics, London 31, 1-20.
FALCONER, D. S. (1981). Introduction to Quantitative Genetics. Second
Edition. Longman; London and New York.
FINNEY, D. J. (1970). Statistical Method in Biological Assay, 2nd ed;
C. Griffin and Co.; London.
FOWLER, V. R., BICHARD, M. and PEASE, A. (1976). Objectives in pig
breeding. Animal Production 23, 365-387.
FRANCESCRI, P. F. and OLLIVIER, L.'(1981). Frequences de quelques genes
importants dans lea populations porcines. Zeitschrift fur Tierzuchtung
und Zuchtungsbiologie 98, 176-186.
FRiYSTEIN, T.; SLINDE, E. and STANDAL, N. (1981). Porcine Stress and
Meat Quality. Agricultural Food Research Society, As, Norway, pp
105-191.
FRYSTEIN, T.; NOSTVOLD, S. 0., BRAEND, M.; STORSETH, A. and SCHIE,
K.A. (1981). Halothane sensitivity and blood types in the
norwegian pig breeding stock and the associations with production
and meat quality traits. In: Porcine Stress and Meat Quality. Ed:
Frystein, T; Slinde, E. and Standal, N.; Agricultural Food
Research Society, As, Norway, pp 161-176.

GARNE, B. (1979). Immunogenetics and biochemical genetics as a tool
in pig breeding programmes. In: Muscle Function and Porcine
Meat Quality. Acts, Agiculturae Scandinavica, Suplementum 21,
185-197.
GERWIG, C.; VOGELI, P. and SCHWORER, D. (1979). Halothane sensitivity
in a positive and a negative selection line. In Muscle Function
and Porcine Meat Quality. Acta Agriculturae Scandinavica,
Suplementum 21, 441-450.
GREGORY, N. G. (1981). Neurological control of muscle metabolism in
stress sensitive pigs. In: Porcine Stress and Meat Quality. Ed:
Frystein, T; Slinde, E. and Standal, N.; Agricultural Food
Research Society, As, Norway, pp 11-20.
GRONERT, G.A.(1980). Malignant hyperthermia. Anaesthesiology 53, 35-63.
GUERIN, G.; OLLIVIER, L. and SELLIER, P. (1978). Desequilibres de
linkage entre les locus HAL (hyperthermie maligne), PHI et 6-PGD
dans deux lignees Pietrain. Annales de Genetique et de Selection
Animale 10, 125-129.
GUERIN, C.; OLLIVIER, L. and SELLIER, P. (1979). Hitch-hicking effect
and linkage disequilibrium: the example of two closely linked loci
in the pig, halothane sensitivity (HAL) and phosphohexose-isomerase
PHI. In 30th Meeting of the EAAP, paper G6.1, 4pp.

HALL, L. W.; TRIM, C. M. and WOOLF, N. (1972). Further studies of
Porcine Malignant Hyperthermia. British Medical Journal 2, 145
-148.
HANSON, W. D. (1959). Theoretical distribution of the initial linkage
block length intact -dn the gametes of a population intermated for
n generations. Genetics 44, 839-846.
HARRISON, G.G. (1972). Pale, soft, exhudative pork, porcine stress
syndrome and malignant hyperthermia -an identity B. Journal of
the South African Veterinary Medicine Association 43, 57-63.
HARRISON, C. G. and VERBURG, C. (1973). Erythrocite osmotic fragility
in hyperthermia-susceptible swine. British Journal of Anaesthesiology
45, 131-133.
HARRISON, G.G.; SAUNDERS, S.J.; BYEBRYCK, R.; HICKMAN, D.M.; DENT,
V.; WEAVER, V. and TERREBLANCHE, J. (1969). Anaesthetic induced
malignant hyperpyrexia and a method for its prediction. British
journal of Anaesthesiology 41, 844-855.
HARVEY, W. R. (1977). Users Guide for LSML76. Monography . The Ohio
State University , pp 76.
HILL, W. G. (1972). Estimation of genetic change. I. General theory and
design of control populations. Animal Breeding Abstracts 40, 1-15.
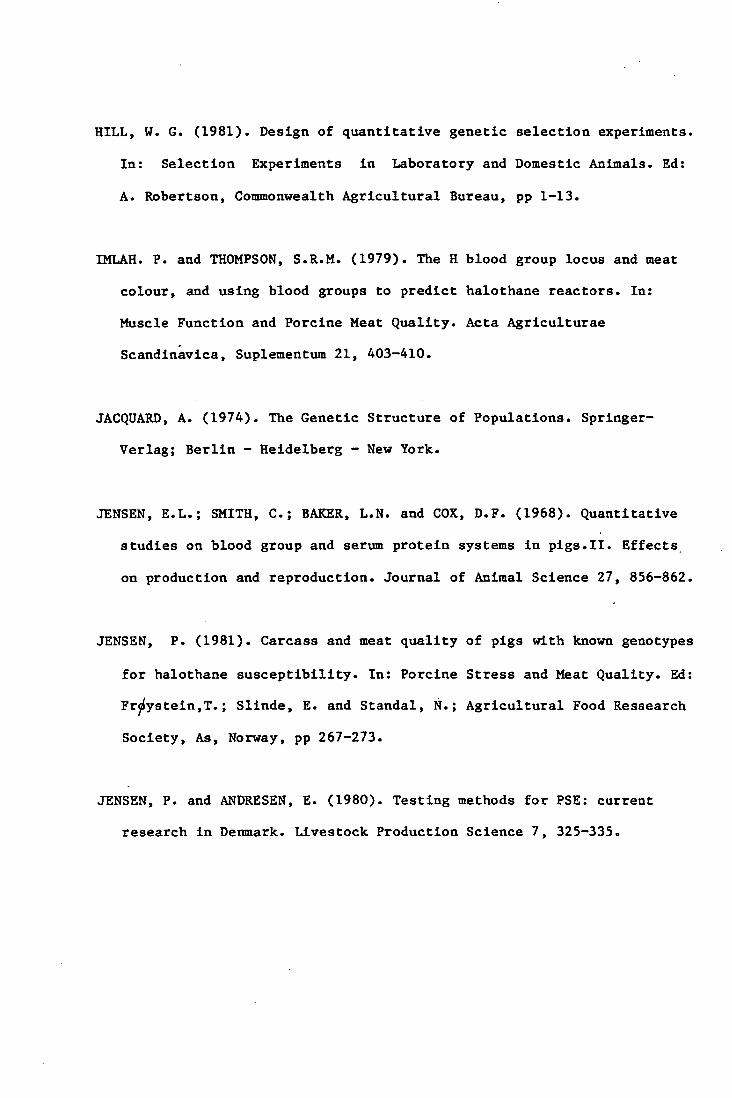
HILL, W. C. (1981). Design of quantitative genetic selection experiments.
In: Selection Experiments in Laboratory and Domestic Animals. Ed:
A. Robertson, Commonwealth Agricultural Bureau, pp 1-13.
IMLAR. P. and THOMPSON, S.R.M. (1979). The H blood group locus and meat
colour, and using blood groups to predict halothane reactors. In:
Muscle Function and Porcine Meat Quality. Acta Agriculturae
Scandinavica, Suplementum 21, 403-410.
JACQUARD, A. (1974). The Genetic Structure of Populations. Springer-
Verlag; Berlin - Heidelberg - New York.
JENSEN, E.L.; SMITH, C.; BAKER, L.N. and COX, D.F. (1968). Quantitative
studies on blood group and serum protein systems in pigs.II. Effects
on production and reproduction. Journal of Animal Science 27, 856-862.
JENSEN, P. (1981). Carcass and meat quality of pigs with known genotypes
for halothane susceptibility. In: Porcine Stress and Meat Quality. Ed:
Frystein,T.; Slinde, E. and Standal, N.; Agricultural Food Ressearch
Society, As, Norway, pp 267-273.
JENSEN, P. and ANDRESEN, E. (1980). Testing methods for PSE: current
research in Denmark. Livestock Production Science 7, 325-335.

JENSEN, P.; STAUN, H.; BRAUNER NIELSEN, P. and MOUSTGAARD, J. (1976).
Investigations on the association between blood group system H and
points for meat colour in pigs. Meddedelingen Statens
Husdyrbrugsforsog no. 83, 4 pp.
JONES, D. W. (1982). Summary of Wye and Newcastle Control Herd results.
(Unpublished). Meat and Livestock Commission.
JONES, E.W.; NELSON, T.E.; ANDERSON, I.L.; KERR, D.D. and BURNAP, T.K.
(1972). Malignant hyperthermia of swine. Anaesthesiology 36, 42-51.
JRGENSEN, F.(1981). Blood types and other biochemical markers for stress
susceptibility and meat quality in pig. In: Porcine Stress and Meat
Quality. Ed: Frystein, T.; Slinde, E. and Standal, N.; Agricultural
Food Research Society, As, Norway, pp 146-159.
JRGENSEN. F. and HYLDGAARD-JENSEN, J. (1981). Blood parameters and meat
quality. Pig News and Information 2, 9-15.
KENDALL, M. C. and STUART, A. (1979). The Advanced Theory of Statistics,
3 vols; C. Griffin and Co.; London.
KING, W.A.; OLLIVIER, L. and BASRUR, P.K. (1976). Erythrocyte osmotic
response test on malignant hyperthermia-susceptible pigs. Annales de
Cenetique et de Selection Aniinale 8, 537-540.

KOVACH, C. (1980). Phenotypic correlations among fattening performances
and, meat quality of halothane positive and negative KA-HYB hybrid
swine populations. In 31st Meeting of the EAAP, Munich, paper GP.37,
8 pp.
KUKOYI, E. A.; •ADDIS, P.B.; McGRATH, C.J.; REMPEL, W.E. and MARTIN,
F.B. (1981). Porcine Stress Syndrome and post-mortem muscle
characteristics of two purebreds and three specific terminal crosses.
Journal of Animal Science 52, 278-284.
LUESCHER, U.; SCHNEIDER, A. and JUCKER, H. (1979). Genetics of the
halothane sensitivity and change of performance, carcass and meat
quality traits, induced by selection against halothane sensitivity.
In: 30th Meeting of the EAAP, Harrogate; paper HP2.11, 4 pp.
MABRY,J. W.; CHRISTIAN, L. L. and KUHLERS, D.L. (1981). Inheritance of
porcine stress syndrome. The Journal of Heredity 72, 429-430.
MALMFORS,G.(1981). Relationships between visually judged degree of stress
just prior to slaughter and pig meat quality. In: Porcine Stress and
Meat Quality. Ed: Frystein, T; Slinde, E. and Standal, N. ;
Agricultural Food Research Society, As, Norway, pp 179-184.
McINTOSH, D.B.; BERMAN, M.c. and KENCH, J.E. (1977). Characteristics
of sarcoplasinic reticulum from slowly glycolising and from rapidly
glycolysing pig skeletal muscle post-mortem. Biochemical Journal 166,
387-398.
McGLOtJGHLIN, P. (1980). Genetic aspects of pignieat quality. Pig News and
Information 1, 5-9.
McPHEE, C.P.; TAKEN, A. and DARCY, K.J. (1979). Genetic variation in
meat quality and the Incidence of malignant hyperthermia syndrome in
Large White and Landrace boars. Australian Journal of Experimental.
Agriculture and Animal Husbandry 19, 43-47.
MENISSIER, F. (1982). Present state of knowledge about.the genetic
determination of muscular hypertrophy or the double muscled trait
in cattle. In: Muscle Hypertrophy of Genetic Origin and Its Use To
Improve Beef Production. Ed: King, J. W. B. and Menissier, F;
The Hague/Boston/London; The Commission of The European
Communities, 387-428.
HERAT, P. (1968). Distributions des frequences, Interpretation du
determinisme genetique des caracters quantitatifs et recherche de
'genes majeurs. Biometrics 24, 277-293.
MINKEMA, D.; EIKELENBOOM, C. and van ELDIK, P. (1976). Inheritance of
MRS susceptibility in pigs. In: Proceedings of the Third International
Conference on Production Diseases in Farm Animals. Centre for
Agricultural Publishing and Documentation, Wageningen, The Netherlands
pp 203-207.

MOAV, R. (1966). Specialised sire and dam lines. I. Economic evaluation
of crossbreds. Animal Production 8, 193-202.
MONIN, C.; OLLIVIER, L. and SELLIER, P. (1976). Etude du syndrome
d'hyperthermie maligne chez le porc de Pietrain: premier resultats.
In: Journees de la Rechereche Porcine en France. Ed: Institut
Technique du Porc, pp 229-239.
MONIN, C.; SELLIER, P.; OLLIVIER, L.; GOUTENFOGEA, R. and GIRARD,
J. P. (1981). Carcass characteristics and meat quality of halothane
negative and halothane positive Pietrain pigs. Meat Science 5, 413
-423.
MORTON, N. (1969). Segregation Analysis. In: Computer Applications in
Genetics. Ed: Morton, N. ; The University of Hawaii Press,
Honolulu, Hawaii, USA; pp 129-139.
MORTON, N. E. and MACLEAN, C.J. (1974). Analysis of family resemblance.
III. Complex segregation of quantitative traits. American Journal of
Human Genetics 26, 489-503.
NELDER, J. A. and WEDDERBURN, R. W. M. (1972). Generalized linear
models. Journal of the Royal Statistical Society A 135, 370-384.
OLLIVIER, L. (1968). Etude du determinisme hereditaire de l'hypertrophie
muscular du porc de Pietrain. Annales de Zootechnie 17, 393-407

OLLIVIER, L. (1980). Le determinisme genetique de lThypertrophie
inusculaire chez le porc. Annales de Genetique et de Selection
Animale 12, 383-394.
OLLIVIER, L.; SELLIER, P. and MONIN, C. (1975). Determinisme genetique
du syndrome dThyperthermie maligne chez le porc de Pietrain. Annales
de Genetique et de Selection Animale 7, 159-169.
OLLIVIER, L.; SELLIER, P. and MONIN, C. (1978). Frequence du syndrome
d'hyperthermie maligne dana des populations porcines francaises;
relation avec le developpement musculaire. Annales de Genetique et
de Selection Animale 10, 191-208.
OPSAHL, M.; OPSTAD, P. K.; FRØYSTEIN, T. and NOVSTOLD, S. 0. (1981).
Plasma catecholamlnes in pigs during halothane anaesthesia. In:
Porcine Stress and Meat Quality. Ed: Frystein, T; Slinde, E.
and Standal, N.; Agricultural Food Research Society; As, Norway,
pp 59-64. -
RASMUSEN, B.A. (1975). Blood-group alleles of domestic animals. In:
Handbook of Genetics, IV. Ed: King, R.C.; Plenum Press, New York
& London; pp 447-457.
RASMUSEN, B. A. and HAGEN, K. (1973). The H blood-group system and
reproduction in pigs. Journal of Animal Science 37, 568-573.

RASMUSEN, B.A. and CHRISTIAN, L.L. (1976). H blood types in pigs as
predictors of stress susceptibility. Science 191, 947-948.
RASMUSEN, B. A.; BEECE, C.K. and CHRISTIAN, L.L. (1980). Halothane
sensitivity and linkage of genes for H red blood cell antigens,
phospho-hexose-isotuerase (PHI) and 6-phosphogluconate-dehydrogenase
(6-PGD) variants in pigs. Animal Blood Groups and Biochemical
Genetics 11, 93-107.
ROBERTSON, A. (1977 a). The non-linearity of offspring-parent regression.
In: Proceedings of the International Conference on Quantitative
Genetics. Ed: Pollak, E.; Kempthorne, 0. and Bailey, T.B.; Iowa State
University Press; Ames, Iowa. U.S.A.
ROBERTSON, A. (1977). The effect of selection on the estimation of
genetic parameters. Zeitschcrift fur Tierzuchtung und
Zuchstungsbiologie 94, 131-135.
ROGDAKIS, E. (1974). Einflub der Selektion nach der Ruckenspeckdicke
auf die Aktivitat der NADP-abhangigen Dehydrogenasen in Fettsewebe
des Schweines. Zeitschrift fur Tierzuchtung und Zuchtungsbiologie
91, 75-87.
ROGDAKIS, E. (1979). Effects of selection on level of NADPH producing
enzymes in the adipose tissue of pigs. In: 30th Meeting of the
EAAP; Harrogate. 4 pp.

ROGDAKIS, E.; ENSINGER, V. and PAVER, H.V. (1980). Hormone levels in
relation to the halothane reaction of pigs. In: 31st Meeting of the
EAAP; Munich. Paper P5/6.18; 6 pp.
SCHMIDT, U. and KALLWEIT, E. (1979). Die Prufung physiologiseher
merkmalke halothan-geprufter schweine auf dem hauf-band und nach
der Schlachtung. In: 30th Meeting of the EAAP; Harrogate;
paper MP2.7, 4 pp.
SCHNEIDER, A.; SCHWöRER D. and BLUMM, J. (1980). Bezielung des
halothan-genotyps zu der Produktions- und Reproduktions merkmalen der
Schweizerischen Landrasse. In: 31st Meeting of the EAAP; Munich;
paper GP3.9, 6 pp.
SCHULMAN, A. (1981). Exertional myopathy in Finnish Landrace pigs. A
survey of the situation and evaluation of different control methods.
Journal of the Scientific Agricultural Society of Finland 52, 505-570.
SHORT, C.E. (1978). The significance of malignant hyperthermia In animal
anaesthesia. In: Second International Symposium on Malignant
Hyperthermia. Ed: Aidrete, J.A. and Britt, B.A.; New York; Grune
and Stratton, pp 175-182.
SIMON, D.L. (1980). Is Kalothane susceptibility caused by a single locus
and what other single locus traits are important in the pig. In: 31st
Meeting of the EAAP; Munich; paper GP3/1, 10 pp.
SMITH, C. (1964). The use of specialised sire and dam lines in selection
for meat production. Animal Production 6, 337-344.
SMITH, C. (1981 a). Genetic aspects of PSS and meat quality in pigs:
breeding strategies with the halothane gene. In: Porcine Stress and
Meat Quality. Ed: Frjystein, T.; Slinde, E. and Standal, N.;
Agricultural Food Research Society; As; Norway; pp 251-259.
SMITH, C. (1981 b). Estimation of trends in the halothane gene in pig
stocks wih selection (unpublished).
SMITH, C. and BAMPTON, P.R. (1977). Inheritance of reaction to halothane
anaesthesia in pigs. Genetical Research, Cambridge 29, 287-292.
SMITH, C. and WEBB, A.J.(1981). Effects of major genes on animal breeding
strategies. Zeitschrift fur Tierzuchtung mid Zuchtungbiologie 98, 170
-175.
SMITH, C.; KING, J. W. B. and GILBERT, N. (1962). Genetic parameters of
British Large White bacon pigs. Animal Production 4 ; 128143
SMITH, W. C. and LESSER, D. (1982). An economic assessment of pale, soft
exudative musculature in the fresh and cured pig carcass. Animal
Production 34, 291-299.

STEELE, N. C.; FROBISH, L. T.; DAVEY, R. J. and KEENEY, N. (1972).
Effects of selection for backfat thickness in swine lipogenic enzyme
levels. Journal of Animal Science 35, 225 (Abstract).
SWIGER, L. A.; HARVEY, W. R.; EVERSON, D. 0. and GREGORY, K. E. (1964).
The variance of the intraclass correlation involving groups with one
observation. Biometrics 20, 818-826.
SYBESMA, W. and EIKELENBOOM, G. (1969). Malignant hyperthermia syndrome
in pigs. Netherland Journal of Veterinary Science 2, 155-160.
VERSTEGEN, N.W.A.; BRASCAMP, E.W.; van der HEL, W.; de GROOT, P.N. and
EIKELENBOOM, G. (1976). Effect of susceptibility to the malignant
hyperthermia syndrome(MHS) as detected by halothane on some production
and energy balance characteristics in Dutch Landrace pigs. In:
Proceedings of the Third International Conference on Production
Disease in Farm Animals. Centre for Agricultural Publishing and
Documentation; Wageningen, The Netherlands, pp 188-192.
VOGELI, P. (1978). Mast-und Schalichtleistung in einen Selektionsversuch.
Der Kleiviehzuchter 27, 689-691.
WATANABE, S.; AKITA, T.; MIKANI, H. and HINENO, K. (1978). Further
evidence for the existance of the PHI A-HAL n haplotype in the
Landrace breed. Animal Blood groupps and Biochemical Genetics 9,
197-205.
WEBB, A.J. (1980 a). The effect of age on the expression of the halothane
gene in pigs. 31st Meeting of the EAAP; Munich; paper p5/6.22, 6 pp.
WEBB, A.J. (1980 b). The incidence of halothane sensitivity in British
pigs. Animal Production 31, 101-105.
WEBB, A.J. (1981). The halothane sensitivity tests. In: Porcine Stress
and Meat Quality. Ed: Fr'ystein, T.; Slinde, E. and Standal. N.;
Agricultural Food Research Society; As; Norway; pp 105-134.
WEBB, A.J. and JORDAN, C.H.C.(1978). Halothane sensitivity as a field test
for stress-susceptibility in the pig. Animal Production 26, 157-168.
WEBB, A.J. and JORDAN, C.R.C. (1979). The halothane test in genetic
improvement programmes: experiments with Pietrain/Hampshire pigs.
In: Muscle Function and Porcine Meat Quality. Acta Agriculturae
Scandinavica; Suplementum 21; pp 418-426.
WEBB, A.J. and SMITH, C. (1976). Some preliminary observations on the
inheritance and application of halothane-induced MHS in pigs. In:
Proceedings of the Third International Conference on Production
Disease in Farm Animals. Centre for Agricultural Publishing and
Documentation; Wageningen; The Netherlands; 00 211-213.

WILLIAMS, C.R.; LASLEY, J.F.; MIJURER, M.E. and HEDRICK, H.B. (1975).
Relationship between fulminant hyperthermia and the porcine stress
syndrome. Journal of Animal Science 41, 261 (abstract).
WILLIAMS, C.H.; SHANKLIN, M.D.; HEDRICK, H.B.; MURRER, M.E.; STUBBS,
D.H.; KRAUSE, G.F.; PAYNE, C.G.; BENEDICT, J.D.; HUTCHESON, D.P.
and LASLEY, J.F. (1978). The fulminant hyperthermia-stress syndrome:
genetic aspects, hemodynamic and metabolic measurements in susceptible
and normal pigs. In: Second International Symposium on Malignant
Hyperthermia. Ed: Aidrete, J.A. and Britt, B.A.; New York; Grune
and Stratton; pp 113-140.
WINGARD, D. W. and GATZ, E. E. (1978). Some observations on stress
susceptible patients. In: Second International Symposium on
Malignant Hyperthermia. Ed: Aidrete, J.A. and Britt, B.A.; New York;
Grune and Stratton; pp 363-372.