for more information about the prince’s trust visit: the ... · pdf filethe cost of...
TRANSCRIPT

The Cost of ExclusionCounting the cost of youth disadvantage in the UK
For more information about The Prince’s Trust visit:princes-trust.org.uk
The Prince’s Trust18 Park Square EastLondon NW1 4LH
Telephone:020 7543 1234Fax:020 7543 1200Email:[email protected]
DSN1233 © The Prince’s Trust 2010 - all rights reserved. The Prince’s Trust is a registered charity, incorporated by Royal Charter, in England and Wales (1079675) and Scotland (SC041198).
Supported by:
COE4PPCOVER+3MMSPINE.indd 1 25/11/2010 13:52

Acknowledgements
The Prince’s Trust would like to thank Sandra McNally and Shqiponja Telhaj at the Centre for Economic Performance, London School of Economics for undertaking the research on which this report is based.
The publication of this report would not have been possible without the invaluable support of The Royal Bank of Scotland Group – the largest corporate supporter of The Prince’s Trust Enterprise Programme.
We would also like to thank all the young people supported by The Prince’s Trust who were featured as case studies in this report.
Published by The Prince’s Trust© The Prince’s Trust
First published November 2010
The Prince’s Trust is a registered charity number 1079675, incorporated by Royal Charter.
All rights reserved. No part of this publication may be reproduced, stored in a retrieval system or transmitted by any means, electronically, mechanical, photocopying, recorded or otherwise without prior permission of the publisher.
Some pictures in this reportare posed by models.
COE4PPCOVER+3MMSPINE.indd 2 25/11/2010 13:52
The Cost of ExclusionCounting the cost of youth disadvantage in the UK
Supported by:
COE56PPINNERS.indd 1 25/11/2010 13:51

Contents04/05
Foreword 06 Introduction 07 Executive Summary 08
1. The cost of youth unemployment 121.1 Youth unemployment: calculating the costs 13 Case study 161.2 Youth unemployment: the long-term picture 181.3 Youth unemployment: a regional perspective 191.4 Youth unemployment and inactivity: an international perspective 221.5 Youth unemployment: the long-term consequences 23 Case study 241.6 Tackling youth unemployment: The Prince’s Trust 26 Counting the Cost 27 Case study 28
2. The cost of youth crime 302.1 Youth crime: calculating the costs 31 Case study 342.2 Youth crime: links to unemployment and educational underachievement 362.3 Youth crime: a regional perspective 382.4 Youth imprisonment: an international perspective 402.5 Tackling youth crime: The Prince’s Trust 41 Case study 42
3. The cost of educational underachievement 443.1 Educational underachievement: calculating the costs 45 Case study 463.2 Educational underachievement: a regional perspective 483.3 Educational underachievement: an international perspective 493.4 Tackling educational underachievement: The Prince’s Trust 50 Case study 52 Conclusion 54 Notes on methodology 56 References 57
COE56PPINNERS.indd 2-3 25/11/2010 13:51

This report shows that there is a cost to the taxpayer of £22 million a week in terms of Jobseeker’s Allowance. On top of this, there is the cost to the economy of lost productivity. A conservative estimate for this is approximately the same amount per week again. An upper bound figure for lost productivity is £133 million, making the upper estimate for youth unemployment £155 million a week.
The cost of youth crime is a further £23 million a week. This is £1.2 billion a year.
In addition to this, the cost for educational underachievement is estimated at £22 billion for a generation.
The cost of exclusion can be quantified in monetary terms, but at The Prince’s Trust we also see the devastating effect on individuals and communities. Every day at The Trust we meet another young person who has grown up without a positive adult role model or has left
school without any hope they will find a job.
The Prince’s Trust runs programmes to give young people the skills and confidence to move on with their lives.
What we do works. Even in these tough economic times, more than three-quarters of young people helped by The Trust go on to work, education or training.
Not only this; the schemes we run are value for money. A conservative estimate for the annual cost of a young jobseeker would be £5,400 but, based on the upper estimates in this report, it can be as much as £16,000. The Trust can use just a fraction of this cost - from as little as £1,000 - to put this young person through an intensive personal development course, helping them leave the dole queue for good.
Last year, The Prince’s Trust helped more than 44,000 disadvantaged young people. What is clear from this report is that there are thousands more who need our help.
IntroductionMartina Milburn, Chief Executive, The Prince’s Trust
This report reveals the cost of youth disadvantage to our economy.
We know that long-term youth unemployment has recently hit a 16-year high, but what is the true cost of this to the taxpayer?
ForewordFionnuala Earley, Economist, The Royal Bank of Scotland Group
The unemployment rate for young people in the UK is around 20 per cent. This is more than three times the unemployment rate among older workers. And those without qualifications have an even lower chance of getting a job as more people compete for each vacancy.
The UK also has one of the highest rates of young people not in education, employment or training - otherwise known as NEETs - in Europe today.
Even though unemployment seems to be stabilising, the proportion of young people who are long-term unemployed continues to climb. With fewer skills and little experience, these young people become increasingly unattractive to potential employers.
The newspapers have labelled them a ‘lost generation’. We would rather describe them as an undiscovered generation. With the right support, we can turn the tragic cost of youth
exclusion into an immeasurable profit of youth inclusion by helping young people into jobs, training, education and enterprise.
This is why The Royal Bank of Scotland Group has been a long-term supporter of The Prince’s Trust, helping to give disadvantaged young people the skills and confidence they need for work and helping them put this into practice through the Enterprise Programme.
By giving young people who have been left behind in life a second chance, we can not only help change young lives; we can help address the deficit, lift the load on the taxpayer and strengthen communities across the UK.
When we released our first Cost of Exclusion report with The Prince’s Trust in 2007, the UK had a strong economy and lower levels of youth unemployment.
Today, the work of The Prince’s Trust is more relevant than ever – with the cost of youth unemployment, crime and underachievement at a new high.
06/07
COE56PPINNERS.indd 4-5 25/11/2010 13:51

to JSA, an aggregate estimate of lost productivity would be approximately £26 million.1 If the productivity of unemployed young people age 20-24 were equal in value to the average weekly pay of employed young people, the productivity loss would be £133 million a week.
The report also highlights a significant rise in the number of long-term unemployed young people, with the number of 16-to-24-year-olds who have been unemployed for 12 months or longer recently hitting a 16-year high.
Long-term unemployment comes at a cost. A conservative estimate for the annual cost of a young jobseeker would be £5,400 but, based on the upper estimates in this report, it can be as much as £16,000.
The report also shows how The Prince’s Trust can use just £1,000 - a comparatively low sum - to support an unemployed young person through an intensive personal development programme into work, training or education, helping them leave the dole queue for good.
See chapter 1 for the full analysis of youth unemployment and the solutions available.
Executive Summary
The cost of youth crime The estimated cost of youth crime for
Great Britain was in excess of £1.2 billion in 2009. This is £23 million a week.
> This is based on the average cost associated with each crime committed, together with information on the total number of convictions.
>The sum takes into account the cost of imprisoning children and young people, which is estimated at £587 million for 2009.
Clearly, any reduction in youth crime could lead to a significant saving to our economy.
The rate of re-offending after prison for
children and young people is extremely high – about 75 per cent re-offend within two years.
Even though the number of convictions has reduced, the rate of imprisonment has continued to accelerate in the UK. The prison rate in England, Wales and Scotland is very high relative to most European countries. Also, children and young people account for a relatively high proportion of prisoners compared to other countries.
The cost of youth unemployment
The cost of youth unemployment in the
UK is estimated in this report in terms of productivity loss and Jobseeker’s Allowance (JSA). A conservative estimate of costs would be £48 million, based on the productivity of unemployed people being equal in value to JSA. An upper bound estimate is based on the productivity of young unemployed people being equal to the average weekly wage for their age group (20-24). On this basis, the cost of youth unemployment is £155 million a week.
> The cost to the Exchequer of youth unemployment and inactivity is £22 million per week in JSA.
>A conservative estimate of the productivity loss to the economy would be around this amount again. An upper estimate is £133 million a week.
The unemployment rate for 16-to-24-year-olds for the period April 2009 to March 2010 was 19.7 per cent in the UK. The unemployment rate has increased significantly since before the recession. For the period April 2007 to March 2008, the rate was 13.7 per cent.
JSA alone costs the taxpayer £22 million every week. On top of this there is the cost to the economy of lost productivity. If the productivity of unemployed young people age 20-24 were equal in value
This report also highlights a strong causal link between both unemployment and crime and educational underachievement and crime. A one per cent reduction in unemployment or educational underachievement is estimated to lead to a one per cent reduction in the crime rate, in relation to property offences.
Children and young people who end
up in prison are disadvantaged in many other ways. High proportions have been in care, have been homeless or have experienced violence at home.
Chapter 2 of this report looks at how we spend more than £1.2 billion on youth crime a year. It also highlights the work that is being done to help young people turn their lives around, therefore reducing these high costs.
1 We consider persons aged between 20-24 (rather than 16-24) because many 16-to-19-year-olds are in education rather than in employment. Also, we do not follow this procedure to estimate foregone earnings of the economically inactive because of the greater difficulty of comparing such people to those in employment (for example, people may be economically inactive because of an illness).
08/09
COE56PPINNERS.indd 6-7 25/11/2010 13:51

The cost of educational underachievement
The cost of educational under-achievement in the UK is estimated as £22 billion for a generation.
>This calculation is based on the estimated lifetime cost of an individual not having qualifications (£45,000) multiplied by the number of young people in the population who have no qualifications.
>It takes into account evidence that there are high wage returns for those who stay in education – at least 10 per cent on average.
The percentage of people with no qualifications is very high. In 2009, the percentage of people aged 16-24 with no qualifications in England, Wales, Scotland and Northern Ireland respectively was 11 per cent, 12.4 per cent, 9.2 per cent and 19.3 per cent.
The UK compares unfavourably with many other countries when it comes to the percentage of young people who leave the education system with low-level qualifications.
There is a lot of evidence of high wage returns for those who stay on in education - at least 10 per cent on average. Over the working life, this is estimated to be worth £45,000, illustrating the high potential loss of income for those who are
unable to take advantage of opportunities to pursue their education.
There is also evidence suggesting that Level 1 and 2 qualifications increase the probability of employment. Moreover, evidence suggests that education not only impacts on wages and employment but also has a direct or indirect effect on other aspects of wellbeing such as health.
See chapter 3 for the full analysis and details of The Prince’s Trust’s in-school xl curriculum, helping young people at risk of exclusion and underachievement at school.
10/11
COE56PPINNERS.indd 8-9 25/11/2010 13:51

1. The cost of youth unemployment 1.1 Youth unemployment: calculating the costs
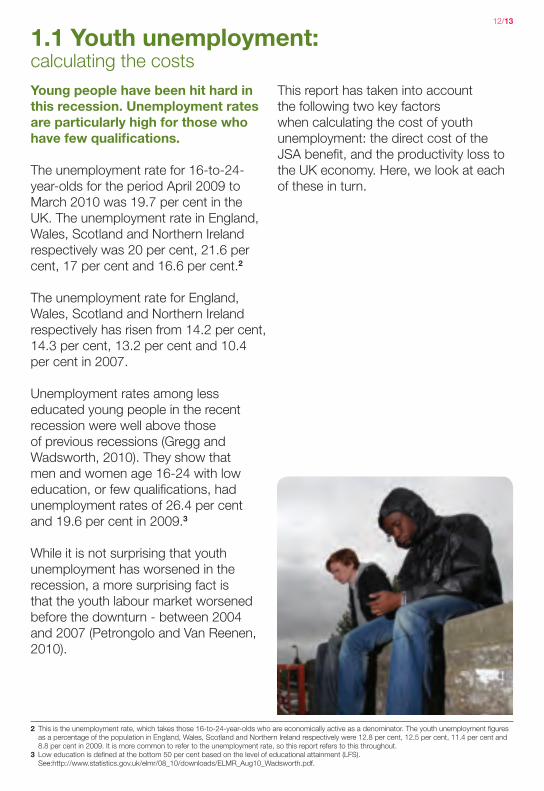
Young people have been hit hard in this recession. Unemployment rates are particularly high for those who have few qualifications.
The unemployment rate for 16-to-24-year-olds for the period April 2009 to March 2010 was 19.7 per cent in the UK. The unemployment rate in England, Wales, Scotland and Northern Ireland respectively was 20 per cent, 21.6 per cent, 17 per cent and 16.6 per cent.2
The unemployment rate for England, Wales, Scotland and Northern Ireland respectively has risen from 14.2 per cent, 14.3 per cent, 13.2 per cent and 10.4 per cent in 2007.
Unemployment rates among less educated young people in the recent recession were well above those of previous recessions (Gregg and Wadsworth, 2010). They show that men and women age 16-24 with low education, or few qualifications, had unemployment rates of 26.4 per cent and 19.6 per cent in 2009.3
While it is not surprising that youth unemployment has worsened in the recession, a more surprising fact is that the youth labour market worsened before the downturn - between 2004 and 2007 (Petrongolo and Van Reenen, 2010).
This report has taken into account the following two key factors when calculating the cost of youth unemployment: the direct cost of the JSA benefit, and the productivity loss to the UK economy. Here, we look at each of these in turn.
2 This is the unemployment rate, which takes those 16-to-24-year-olds who are economically active as a denominator. The youth unemployment figures as a percentage of the population in England, Wales, Scotland and Northern Ireland respectively were 12.8 per cent, 12.5 per cent, 11.4 per cent and 8.8 per cent in 2009. It is more common to refer to the unemployment rate, so this report refers to this throughout.3 Low education is defined at the bottom 50 per cent based on the level of educational attainment (LFS). See:http://www.statistics.gov.uk/elmr/08_10/downloads/ELMR_Aug10_Wadsworth.pdf.
12/13
The cost of youth unemployment in the UK is estimated in this report in terms of productivity loss and JSA.
There is a cost to the taxpayer of £22 million a week in terms of Jobseeker’s Allowance. On top of this, there is the cost to the economy of lost productivity. A conservative estimate for this is approximately the same amount per week again. An upper bound figure for lost productivity is £133 million, making the upper estimate for youth unemployment £155 million a week.
This chapter looks at the facts and the costs of youth unemployment. It provides a regional comparison across
the UK and it shows how we compare to other countries. It concludes with some solutions, showing how The
Prince’s Trust is tackling youth unemployment. By helping young people into jobs and training, we could save up to £155 million a week and make a difference to hundreds of thousands of lives.
COE56PPINNERS.indd 10-11 25/11/2010 13:51
1. The cost of youth unemployment 1.1 Youth unemployment: calculating the costs
Young people have been hit hard in this recession. Unemployment rates are particularly high for those who have few qualifications.
The unemployment rate for 16-to-24-year-olds for the period April 2009 to March 2010 was 19.7 per cent in the UK. The unemployment rate in England, Wales, Scotland and Northern Ireland respectively was 20 per cent, 21.6 per cent, 17 per cent and 16.6 per cent.2
The unemployment rate for England, Wales, Scotland and Northern Ireland respectively has risen from 14.2 per cent, 14.3 per cent, 13.2 per cent and 10.4 per cent in 2007.
Unemployment rates among less educated young people in the recent recession were well above those of previous recessions (Gregg and Wadsworth, 2010). They show that men and women age 16-24 with low education, or few qualifications, had unemployment rates of 26.4 per cent and 19.6 per cent in 2009.3
While it is not surprising that youth unemployment has worsened in the recession, a more surprising fact is that the youth labour market worsened before the downturn - between 2004 and 2007 (Petrongolo and Van Reenen, 2010).
This report has taken into account the following two key factors when calculating the cost of youth unemployment: the direct cost of the JSA benefit, and the productivity loss to the UK economy. Here, we look at each of these in turn.
2 This is the unemployment rate, which takes those 16-to-24-year-olds who are economically active as a denominator. The youth unemployment figures as a percentage of the population in England, Wales, Scotland and Northern Ireland respectively were 12.8 per cent, 12.5 per cent, 11.4 per cent and 8.8 per cent in 2009. It is more common to refer to the unemployment rate, so this report refers to this throughout.3 Low education is defined at the bottom 50 per cent based on the level of educational attainment (LFS). See:http://www.statistics.gov.uk/elmr/08_10/downloads/ELMR_Aug10_Wadsworth.pdf.
12/13
The cost of youth unemployment in the UK is estimated in this report in terms of productivity loss and JSA.
There is a cost to the taxpayer of £22 million a week in terms of Jobseeker’s Allowance. On top of this, there is the cost to the economy of lost productivity. A conservative estimate for this is approximately the same amount per week again. An upper bound figure for lost productivity is £133 million, making the upper estimate for youth unemployment £155 million a week.
This chapter looks at the facts and the costs of youth unemployment. It provides a regional comparison across
the UK and it shows how we compare to other countries. It concludes with some solutions, showing how The
Prince’s Trust is tackling youth unemployment. By helping young people into jobs and training, we could save up to £155 million a week and make a difference to hundreds of thousands of lives.
COE56PPINNERS.indd 10-11 25/11/2010 13:51
The taxpayer’s bill for benefits:£22 million per week
The net cost of youth unemployment to the Exchequer depends on the duration of unemployment and the extent to which young people move on to other types of income benefit. Even if they find a job, a working person on a low income may be eligible to claim for income support or a working tax credit.
JSA is unique to unemployed people. The weekly allowance has recently increased from £50.95 to £51.85. For 16-to-24-year-olds, the amount paid out in JSA alone adds up to £22 million per week.
The productivity loss to the UK economy in terms of foregone income: up to £133 million per week 4
In calculating the productivity loss, we have an upper bound figure and a more conservative estimate. A more conservative estimate would be that the productivity cost of unemployed people is equal in value to the JSA amount of £51.85 a week. We can multiply this by the number of unemployed young people age 20-24 to obtain an aggregate estimate of weekly foregone productivity across this UK.5 This conservative estimate of foregone earnings comes to around £26 million.6
The upper bound figure is based on average earnings for employed people in this age range as an estimate of the average earnings unemployed persons might expect to receive if they were in employment. On this basis, weekly pay is about £262. This should be thought of as an upper band since young people who are unemployed may be different from those in employment in a way that is difficult to capture using variables in the Labour Force Survey.7
Average weekly pay of £262 compares very favourably to the income and non-income related benefits received by unemployed persons in the same age range (£95 on average – estimated using the Family Resources Survey).
If we use £262 per person, per week as an estimate of foregone earnings and multiply this by the number of unemployed 20-to-24-year-olds by region, we obtain an aggregate estimate of weekly foregone earnings. The productivity loss in terms of foregone earnings is £133 million per week for the UK when measured in this way. The table opposite shows the estimated cost of youth unemployment, based on the upper bound calculation for lost productivity.
Exchequer costs of youth unemployment per week (Based on Jobseeker’s Allowance rate for 2010 - £51.85 for those aged under 24)
Government Unemployed Maximum lost JSA claimant JSA Maximum office region 20-24* productivity count 24 total total lost per week and under** region to the economy
Northern Ireland 13,600 3,563,200 19,165 993,705 4,556,905
Scotland 36,200 9,484,400 38,355 1,988,707 11,473,107
Wales 27,500 7,205,000 23,815 1,234,808 8,439,808
England 431,700 113,105,400 344,845 17,880,213 130,985,613
Total 509,100 133,384,200 426,185 22,097,692 155,481,892
* Labour Force Survey (2010); ** Office for National Statistics (2010)
4 This is an upper bound estimate.5 We consider persons aged between 20-24 (rather than 16-24) because many 16-to-19-year-olds are in education rather than in employment. Also, we do not follow this procedure to estimate foregone earnings of the economically inactive because of the greater difficulty of comparing such people
to those in employment (for example, people may be economically inactive because of an illness).6 In England, Wales, Scotland and Northern Ireland respectively, the more conservative estimates would be £22 million, £1.4 million, £1.9 million and £0.7 million per week respectively.7 There are also issues of general equilibrium effects arising from large increases in employment. This is another reason for thinking of the ‘productivity loss’ as an estimate.
14/15
COE56PPINNERS.indd 12-13 25/11/2010 13:51
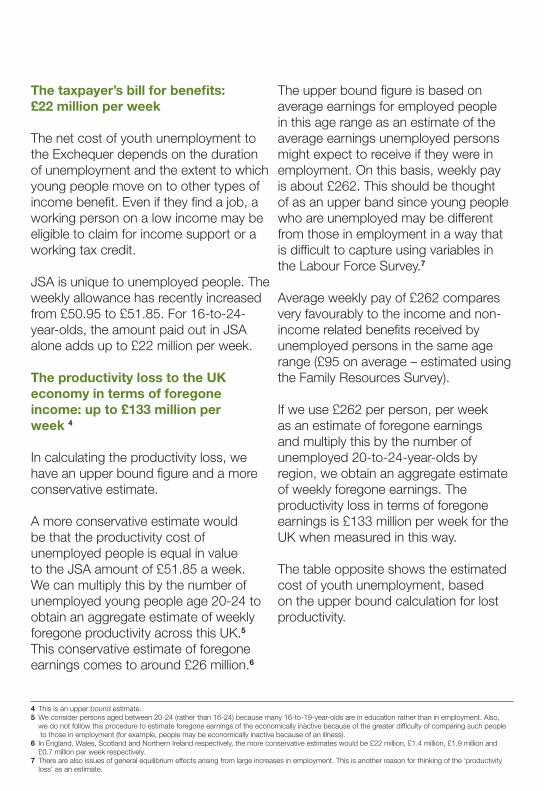
Case studyNathan Cuddihy
Nathan took the news hard. His father was also struggling to find work so his family were relying on Nathan’s mother’s part-time income to survive. Times were tough and - although Nathan applied for anything he could find - he was on the dole for almost a year.
Being out of work knocked Nathan’s confidence; he became despondent and lost all motivation. With hardly any friends and no confidence, Nathan was in a bad place, sitting at home all day.
His mum knew he needed help and took him to see The Prince’s Trust. The Trust signed Nathan up for its personal development course, the Team programme.
The programme gave Nathan a reason to get up in the morning. Over the 12 weeks he improved his confidence, communication and teamwork skills to such an extent he was offered a role as a volunteer Assistant Team Leader for the following programme.
The Trust went on to help Nathan through a Get into Logistics course in partnership with DHL. He used this as an opportunity to impress the company and as a result was offered full-time paid work.
Nathan says:”The Trust came along at just the right time. The Team programme helped me get my head together and figure out what I wanted and the work experience gave me the opportunity to get a job.”
When Nathan Cuddihy was 13 his family relocated to Rugby. He didn’t have many friends and struggled through school. When he left he managed to secure a full-time job but when the recession hit he was made redundant.
16/17
COE56PPINNERS.indd 14-15 25/11/2010 13:51

1.2 Youth unemployment: the long-term picture
1.3 Youth unemployment: a regional perspective
Youth unemployment soared in the recession and is still very high compared to before the recession. However, the overall figures appear to be stabilising. It is a very different picture when we look at long-term unemployment. The number of 16-to-24-year-olds who have been out of work for six months or more in the UK is 388,000 - this has increased almost 70 per cent since before the recession (2008). The number out of work for 12 months or more is 232,000 - this is a 90 per cent increase and the highest number for 16 years.
The number of JSA claimants has also increased significantly. The tables below show the number of JSA claimants who have been out of work for six months and those who have been out of work for 12 months.
As shown in the tables above, long-term unemployment among young people has increased dramatically during and since the recession. The next section includes the regional breakdown of these figures across the UK.
Youth unemployment has increased in all regions of the UK since our last Cost of Exclusion report was published before the recession (The Prince’s Trust, 2007). Gregg and Wadsworth (2010) suggest that the reason the increase has not been even higher, given the depth of the recession, is due to a substantial rise in the number of young people staying on in education. The unemployment rate for 16-to-24-year-olds for the period April 2009 to March 2010 was 19.7 in the UK. The unemployment rate in England, Wales, Scotland and Northern Ireland respectively was 20 per cent, 21.6 per cent, 17 per cent and 16.6 per cent. Youth unemployment (16-to-24-year-olds)
2008 2009 2010 Percentage rise over two yearsUnemployed 229,000 381,000 388,000 69%– six months or more Unemployed 121,000 180,000 232,000 92%– 12 months or more
Source: Labour Market Statistical Bulletin, figures are from October in each year
JSA claimants (16-to-24-year-olds)
Sep-08 Sep-09 Sep-10 Percentage rise over two yearsClaiming 39,290 99,785 80,790 106%– six months or more Claiming 5,840 10,745 25,830 342%– 12 months or more
Source: Office for National Statistics
Unemployment rate by region and country across the UK
Apr 2004- Apr 2005- Apr 2006- Apr 2007- Apr 2008- Apr 2009- Mar 2005 Mar 2006 Mar 2007 Mar 2008 Mar 2009 Mar 2010North East 14.7 16.8 15.8 16.5 19.9 23.1 London 18.7 20.0 19.9 17.4 19.2 23.1 North West 13.0 13.9 14.9 14.6 16.8 22.1 West Midlands 14.2 14.4 14.8 16.3 18.7 22.0 Yorkshire andThe Humber 11.3 13.8 13.9 13.1 18.0 20.1 East Midlands 10.5 12.5 14.4 14.4 15.3 19.0 East 10.3 10.2 12.3 11.7 14.0 18.0 South East 9.5 10.9 11.3 11.9 13.3 17.2 South West 9.1 9.8 11.2 9.6 11.0 16.7 England 12.3 13.4 14.2 13.8 16.0 20.0 Wales 13.5 14.3 14.3 14.6 17.7 21.6 Scotland 12.2 14.1 13.2 13.0 13.5 17.0 Northern Ireland 12.3 10.2 10.4 10.2 13.7 16.6
Source: Annual population survey
18/19
COE56PPINNERS.indd 16-17 25/11/2010 13:51

Claiming JSA for twelve months or more (16-24-year-olds)
Government September September September Percentage office region 2008 2009 2010 over two yearsEast Midlands 335 720 2,750 721% Yorkshire and The Humber 365 845 2,960 711% South East 415 810 2,055 395% East 340 670 1,475 334% West Midlands 1,140 1,770 4,615 305% North West 835 1,330 3,040 264% South West 250 505 640 156% North East 345 620 875 154% London 775 1,045 1,725 123% Wales 430 780 2,015 369% Scotland 350 730 1,870 434% Northern Ireland 255 915 1,810 610% Column Total 5,840 10,745 25,830 342%
Source: The Labour Force Survey
Claiming JSA for six months or more (16-24-year-olds)
Government September September September Percentage office region 2008 2009 2010 rise over two yearsYorkshire and The Humber 3,635 9,795 8,215 126% East Midlands 2,805 7,915 6,305 125% South East 2,760 8,720 6,195 124% East 2,505 6,855 5,350 114% West Midlands 5,755 12,995 11,115 93% North West 5,595 13,735 9,955 78% South West 1,665 5,370 2,950 77% North East 2,565 5,860 4,390 71% London 4,950 9,915 7,925 60% Wales 2,330 5,955 5,220 124% Scotland 2,910 7,375 7,360 153% Northern Ireland 1,820 5,290 5,815 220% Column Total 39,290 99,785 80,790 106%
Source: The Labour Force Survey
As illustrated in section 1.2, the number of young people in long-term unemployment has increased in the recession and is still rising. The tables below show figures for the UK broken down by region and country. In the English regions, Yorkshire and The Humber and the East Midlands have seen the highest percentage increase in young people claiming JSA for six months or more and those claiming for 12 months or more.
20/21
COE56PPINNERS.indd 18-19 25/11/2010 13:51

1.5 Youth unemployment: the long-term consequences
Gregg and Wadsworth (2010) have argued that the justification for intervention to prevent long or frequent periods out of work or education among young people does not rest just on the current unemployment, but on the long-term scars that these young people experience and potentially feed into the next generation. Although these scarring effects are not confined to young people, they are more common for this age group.
Gregg and Tominey (2005) estimate that youth unemployment imposes a wage scar on individuals in the order of 12-15 per cent at the age of 42, with a lower penalty if individuals avoid repeat incidence of unemployment.
Burgess et al. (2004) show that the long-term effects of unemployment are conditional on the individual’s skill level with a lasting adverse effect for low-skilled individuals but not for mid to high skilled individuals. The former group is more likely to experience unemployment in the long-term.
The Prince’s Trust YouGov Youth Index (2010) has also illustrated that “psychological scarring” due to unemployment can leave young people at risk of lower happiness and poorer health.
Many argue that there is a ‘wage penalty’ or ‘scar’ from youth unemployment, even if individuals avoid being unemployed again.
This is a personal cost of not being in work, education or training, which goes beyond the immediate loss of earnings and impacts on future earnings too.
1.4 Youth unemployment and inactivity: an international perspective
The recession has had a huge impact on youth unemployment in many countries. Data from the European Labour Force Survey is shown below (Eurostat, 2010). This shows that the youth unemployment rate for those aged under 25 is much higher in the UK than in countries such as Germany, Denmark, Austria, Norway and The Netherlands.8 With regard to the change over the last 10 years, there has been a large increase in youth unemployment in the UK of more than six percentage points between 1999 and 2009.
22/23
Country 1999 2009 Change
Ireland 8.5 24.4 15.9
Portugal 8.8 20.0 11.2
Spain 27.3 37.8 10.5
United Kingdom 12.7 19.1 6.4
Austria 5.4 10.0 4.6
Germany 8.1 10.4 2.3
Denmark 9.1 11.2 2.1
Belgium 21.0 21.9 0.9
France 22.9 23.3 0.4
Finland 21.4 21.5 0.1
The Netherlands 6.8 6.6 -0.2
Norway 9.2 8.9 -0.3
Italy 28.7 25.3 -3.4 Greece 31.5 25.8 -5.7
Source: Eurostat, 2010
8 The UK also has one of the highest rates of young people who are NEET in Europe today. See OECD Education at a Glance, 2010: % of 15-24 year olds who are not in education and unemployed or out of the labour force in 2008.http://www.oecd.org/document/52/0,3343, en_2649_39263238_45897844_1_1_1_1,00.html.
COE56PPINNERS.indd 20-21 25/11/2010 13:51

00/00Case studyAdam Turner
Adam says: “I started having a few drinks so that I could fall asleep without having horrible dreams. It got to the point that I couldn’t sleep without alcohol and then I realised that I couldn’t do anything without drinking. In the end, I was scared to go outside.” Adam would get out of bed early in the morning to stock up on alcohol before locking himself away for the day. Then his best friend committed suicide. Adam said: “I began to realise that I was actually jealous that he was dead and I still had to wake up every morning. On New Year’s Eve 2007, I decided that I didn’t want to see another year in so I took an overdose.” Adam’s suicide attempt was a turning point and he sought professional help for his depression and drinking. His GP knew that having a reason to get up in the morning was key to Adam’s recovery and he recommended that Adam contact The Prince’s Trust.
Adam joined The Team Programme. The 12-week personal development programme rebuilt his confidence and gave his life structure and routine. Adam decided that he wanted to work with animals and the Team programme gave him the motivation to pursue his ambition. Once he completed the scheme, Adam took part in an access course and has since started a degree in zoology at Chester University. Alongside his degree, Adam works at the Blue Planet Aquarian. He says: “I have lots of positive things in my life now. I don’t see the future as something to be scared of anymore.”
When Adam Turner lost his job in a local garage in Crewe, he began to drink heavily. He became depressed and his life started to unravel - to the point that he attempted suicide.
24/25
COE56PPINNERS.indd 22-23 25/11/2010 13:51

00/00 1.6 Tackling youth unemployment: The Prince’s Trust
The Team programmeTeam is The Trust’s flagship 12-week personal development scheme, giving unemployed young people confidence, motivation and skills for work. Last year, more than three-quarters of the young people on the course moved into work, education or training. The ‘Get into’ programme‘Get into’ is a short, pre-apprenticeship course giving young people experience in a specific sector. The scheme is run across different sectors including, among others, construction, retail, hospital services and social care. Currently, more than half of young participants are in work three months after they have completed the programme and 76 per cent are in work, education, volunteering or training.
The Enterprise ProgrammeThe Prince’s Trust Enterprise Programme gives young people the opportunity to develop their enterprise skills and explore the world of business. For those who go on to set up their own businesses, The Trust offers a low-interest loan and a mentor. After 12 months, 87 per cent of young people are still trading or in alternative employment.
The ‘Get Started’ programmeThe ‘Get Started’ programme is a short, intensive personal development scheme. The Prince’s Trust uses sport and the artsto engage young people who are out of work and lacking the skills and confidence to more their lives forward. 73 per cent move into work, education, volunteeringor training after the course.
The role of youth charity The Prince’s Trust has arguably become more relevant than ever due to the recent recession. The Trust runs a range of programmes to support young people into work, training and education. The charity focuses on young people who have struggled at school, are long-term unemployed, are in or leaving care and those who have been in trouble with the law.
Rob, 20, has been out of work and claiming JSA for 12 months. According to the more conservative estimate for lost productivity in this report, there is an annual cost to the economy of around £5,400 associated with Rob’s unemployment. Based on the upper bound calculations used in this report, Rob costs the economy more than £16,000 a year. The Prince’s Trust can use a relatively low sum of around £1,000 to support Rob through an intensive development programme into work, training or education, helping him leave the dole queue for good. More than three in four young people on Prince’s Trust programmes move into jobs, training and education, and The Trust helps more than 40,000 young people every year. As illustrated by Rob’s example, every young person supported out of unemployment and into work represents a significant saving to the UK economy.
Counting the Cost26/27
COE56PPINNERS.indd 24-25 25/11/2010 13:51

00/00Case studyJay Kamiraz
He says: “I was always different from everyone else at school. I never felt like I fitted in and people could see that and used it as a way to target me.”
At 17, Jay was brutally attacked and put in hospital. An operation saved his life but he suffered internal injuries, which still affect him now.
He said: “It was really hard. I didn’t think I was going to survive. I was in such a bad state of mind. Whatever confidence I had was knocked out of me by the attack and becoming homeless.”
Jay began to get his life back on track with the help of a key worker and slowly started to build up his confidence, eventually moving into his own flat.
He also got involved in a project to raise money for Tsunami victims, bringing together singers to form a diverse choir called ‘Souls of Prophecy Gospel Choir’. The choir was so successful Jay realised he could turn it into a business.
Jay came to The Prince’s Trust for help creating JK Creative Arts Management Ltd, providing bespoke entertainment for weddings, corporate events, film and TV and other industries.
With the popular Souls of Prophecy Gospel Choir on the books, business is now booming, growing from four engagements in its first year to more than 40 in the second.
Jay says: “If you need support then The Prince’s Trust is there to help you. They transformed my life. I want to let other young people know that they can achieve their dreams too.”
Jay Kamiraz had a difficult childhood, growing up in a family where no-one worked. He was bullied at school and, at the age of 16, problems at home led to him becoming homeless.
28/29
COE56PPINNERS.indd 26-27 25/11/2010 13:51

The estimated cost of youth crime in Great Britain today is in excess of £23 million a week. This is more than £1.2 billion a year.
The cost of youth crime has been calculated by using the average cost associated with each crime committed together with information on the total number of convictions.
This chapter looks at the facts, the costs and the regional
and international comparisons of youth crime. It concludes with how The Prince’s Trust is working to reduce the costs of youth crime and break the cycle of youth offending.
2. The cost of youth crime 2.1 Youth crime: calculating the costs
Although the number of convictions of young people has fallen in recent years in England, Scotland and Wales, the prison population has increased in all parts of the UK.
Furthermore, the UK has a higher number of children and young people incarcerated than many other countries.
More than 200,000 young people aged under 21 were cautioned or found guilty of offences by the courts in 2008 in England and Wales. About 84 per cent of these young people were male. The most common types of offence were motoring offences and ‘theft and handling stolen goods’.
Here are some key facts and figures about youth crime:9
> In England and Wales, the number of children (under 18) held in a secure children’s home was 167 in September 2009. The number in a secure training centre was 224 and the number in a young offender institution was 2,165. The cost per place per year in each of these institution types was £125,000 (secure children’s home), £160,000 (secure training centre) and £60,000 (young offender institution).
>At the end of June 2009, there were 9,775 young people aged 18-20 in prison.
>The total cost per prisoner per year is £41,000.
Given these facts, we can estimate an approximate cost of incarceration of children and young people under 21. This amounts to £587 million.
The re-offending rate is high for children and young people when they are released from prison.
>75 per cent of children released from custody in 2007 re-offended within a year.10
>Around 75 per cent of young men released from prison in 2004 were reconvicted within two years of release.11
Therefore, the cost of incarceration seems to be high and not particularly effective (given a very high re-offending rate). This is all against a backdrop of severe social disadvantage for the children and young people who end up in prison. For example, according to The Prison Reform Trust (2009):
>71 per cent of children in custody have been involved with, or in the care of, social services before entering custody.
>40 per cent of children in custody in England and Wales have previously been homeless.
>Two out of five girls and one out of four boys in custody report suffering violence at home.
Young people are also the most common victims of crime. Over half of young offenders have themselves been a victim of crime over the same year in which they committed their offence (Devitt et
al. 2009).
30/31
9 The Prison Reform Trust (2009) 10 Ministry of Justice (2009), Reoffending of Juveniles: results from the 2008 cohort. England and Wales. London: TSO11 Home Office Statistical Bulletin. Reoffending of adults: results from 2004 cohort.
COE56PPINNERS.indd 28-29 25/11/2010 13:51

00/00
The cost of imprisoning children and young people is estimated as £587 million for 2009. However, reconviction rates are very high. Around 75 per cent of young men released from prison in 2004 were reconvicted within two years of release.
The costs of youth crime are not only those that accrue to the Criminal Justice System. Dubourg and Hammond (2005) follow Brand and Price (2000) in an attempt to estimate broadly-defined costs of a subset of crimes (under ‘notifiable offence categories’). Costs are incurred in anticipation of crimes occurring (such as security expenditure), as a consequence of criminal events (such as property stolen and damaged) and in the course of responding to crime. By using the average cost per crime, together with information on the number of convictions in each region in 2008, we estimate the total regional and national cost. This is inevitably an estimate, not least because a conviction is not the same as a crime.12
Note: The average cost is a weighted average of the following types of crime: violence against the person, sexual offences, robbery, burglary, theft and handling goods, criminal damage. Weights are derived from the prevalence of these crimes among young people. This cost (£4,056) is multiplied by the number of convictions to obtain the estimated total cost. The average cost of crime in England and Wales is also applied to Scotland.
The total cost of crime for those age 10-17 (£390,508,000) and those age18-21 (£833,877,000) comes to £1,224,385,000 a year.
Estimated costs of crime by young people aged 10-21 in 2008
Number of Estimated Number of Estimated convictions total cost convictions total cost (age 10-17) (£000s) (age 18-21) (£000s)
England 83,996 340,688 174,627 708,287
Wales 4,395 17,826 111,53 45,237
Scotland 7,888 31,994 19,811 80,353
Great Britain 96,279 390,508 205,591 833,877
12 Others have put the costs of youth crime much higher. For example, the Youth Crime Commission, organised by the Police Foundation, published a report this year that puts it at £4 billion. They reached this figure by combining the known costs of youth offending services and custody with rough
estimates for how much ‘dealing with young offenders’ costs the police, the courts, legal aid and the Crown Prosecution Service. These estimates were achieved by taking a fifth of each of these services’ expenditure (as 21 per cent of all people arrested for a notifiable offence and proceeded against are under 18). This makes our figure, based on the same methodology as our last report (The Prince’s Trust, 2007), a more conservative estimate.
32/33
COE56PPINNERS.indd 30-31 25/11/2010 13:51

00/00Case studyBilly Webb
From the age of 11, Billy started playing truant from school and hanging out with a bad crowd. His new friends were involved in petty crime and would carry knives.
The gang culture made Billy feel safe and gave him the sense of belonging he was lacking in his home life.
However, this safety was an illusion and Billy lost two friends to knife crime.
He says: “I vividly remember a 17-year-old friend dying in my arms. I looked at him and thought that could be me.”
Billy realised if he carried on down this path he would end up dead like so many around him. He made the decision to leave the gang and try to make something of his life.
Billy was trying to get work and keep on the straight and narrow when a caretaker on his estate pointed him in the direction of The Prince’s Trust and Rydon Construction’s Get into Construction programme.
The course was just what Billy needed. It gave him structure and a focus that had been missing from his life. He excelled on the course and his enthusiasm was such he was given a full-time job by Rydon and is now in management training.
Billy is now a role model to others on his estate, including his younger brother.
He says: “If I had carried on with my life the way it was I would be dead or in prison by now. As it is, I am someone who people look up to on my estate. I have been able to prove you can make a success of your life by working hard.”
Billy Webb grew up in a house where recreational drugs were normal and his father would come andgo for large periods of time.
34/35
COE56PPINNERS.indd 32-33 25/11/2010 13:51
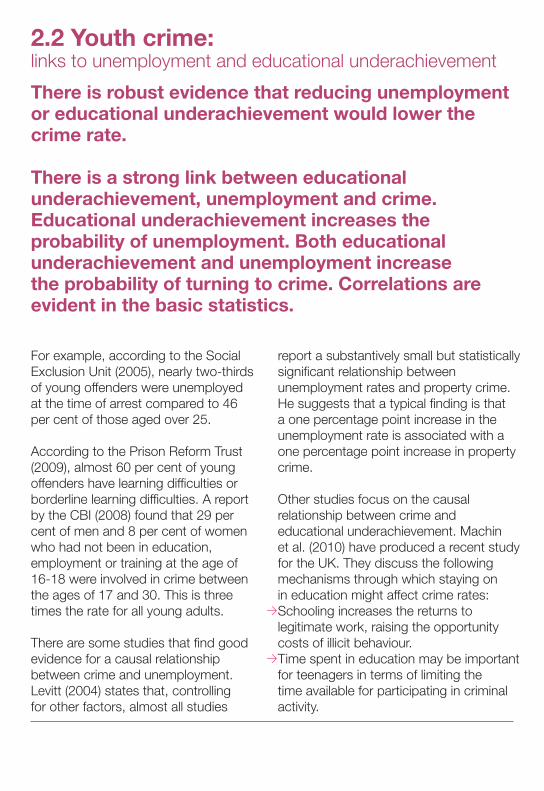
2.2 Youth crime: links to unemployment and educational underachievement
For example, according to the Social Exclusion Unit (2005), nearly two-thirds of young offenders were unemployed at the time of arrest compared to 46 per cent of those aged over 25.
According to the Prison Reform Trust (2009), almost 60 per cent of young offenders have learning difficulties or borderline learning difficulties. A report by the CBI (2008) found that 29 per cent of men and 8 per cent of women who had not been in education, employment or training at the age of 16-18 were involved in crime between the ages of 17 and 30. This is three times the rate for all young adults.
There are some studies that find good evidence for a causal relationship between crime and unemployment. Levitt (2004) states that, controlling for other factors, almost all studies
report a substantively small but statistically significant relationship between unemployment rates and property crime. He suggests that a typical finding is that a one percentage point increase in the unemployment rate is associated with a one percentage point increase in property crime.
Other studies focus on the causal relationship between crime and educational underachievement. Machin
et al. (2010) have produced a recent study for the UK. They discuss the following mechanisms through which staying on
in education might affect crime rates: >Schooling increases the returns to
legitimate work, raising the opportunity costs of illicit behaviour.
>Time spent in education may be important for teenagers in terms of limiting the time available for participating in criminal activity.
There is robust evidence that reducing unemployment or educational underachievement would lower the crime rate.
There is a strong link between educational underachievement, unemployment and crime. Educational underachievement increases the probability of unemployment. Both educational underachievement and unemployment increase the probability of turning to crime. Correlations are evident in the basic statistics.
>Schooling may alter preferences in indirect ways which may affect decisions to engage in crime – risk aversion, for example.
Machin et al. (2010) use the change in the compulsory school leaving age in 1972, to investigate whether crime reduced as a result of forcing teenagers to stay an extra year in school (from 15 to 16). The effect of education on crime might work through any of the mechanisms mentioned above. They show a strong causal impact of education on property crime (though not on violent crime). Their estimates suggest that a one per cent reduction in the population with no educational qualifications results in a 0.85 to one per cent fall in property crime.
Therefore, it would be logical to expect a one per cent fall in the unemployment rate or a one per cent fall in the population with no educational qualifications to have a commensurate impact on the crime rate. In a cost-benefit analysis, these estimates would be applied to the whole population and not only young people. However, if we apply these estimates only to those who were found guilty by the courts or cautioned for relevant offences (i.e. burglary; robbery; theft), a one per cent fall would mean 381 fewer such offences by those aged under 20.
Of course, not only does unemployment make crime more likely but a criminal record also makes future unemployment more likely. This could be a result of both the stigma attached to a period in prison and the effect of imprisonment on the acquisition of human and social capital.13
A previous study suggests that at least 90 per cent of those leaving prison enter unemployment, comprising two to three per cent of the average monthly in-flow to the unemployment pool.14 What is clear from most studies is that incarceration at a young age can have a long-term and significant impact on an individual’s life.
36/37
13 This is discussed by Western et al (2001).14 This is according to Fletcher et al (1996).
COE56PPINNERS.indd 34-35 25/11/2010 13:51

2.3 Youth crime: a regional perspective
Convictions If we look at the regional picture since the last Cost of Exclusion report, the pattern looks quite different across regions. While the fall in convictions has been evident in most regions, the direction of change has been the opposite in London, where the number of convictions is a good deal higher (particularly for those aged 18-21) than it was in 2004. When we consider the overall number of convictions expressed as a proportion of 15-to-24-year-olds in each region, the long-term trend has been one of decline. There has been increasing convergence between countries of Great Britain, with major improvements evident in Wales over recent years.
Convictions of young people aged 18-21
• England • Wales • Scotland
• England • Wales • Scotland
Average number of convictions: Average number of convictions: age 18-21 age 10-17 2004 2008 % change 2004 2008 % change
East of England 17,048 17,244 1.1% 8,258 7,753 -6.1%
East Midlands 17,972 13,047 -27.4% 7,076 6,342 -10.4%
London 27,899 35,359 26.7% 11,688 12,809 9.6%
North East 18,256 15,221 -16.6% 8,847 8,854 0.1%
North West 32,579 26,130 -19.8% 16,618 13,999 -15.8%
South East 23,986 22,709 -5.3% 11,538 11,574 0.3%
South West 15,936 13,678 -14.2% 6,329 6,351 0.3%
West Midlands 15,552 16,708 7.4% 9,235 8,385 -9.2%
Yorkshire 18,358 14,531 -20.8% 8,775 7,929 -9.6%
England 187,586 174,627 -6.9% 88,364 83,996 -4.9%
Wales 16,489 11,153 -32.4% 6,016 4,395 -26.9%
Scotland 19,244 19,811 2.9% 7,250 7,888 8.8%
Number of Estimated Number of Estimated convictions total cost convictions total cost (age 10-17) (£000s) (age 18-21) (£000s)
East of England 7,753 31,446 17,244 69,942
East Midlands 6,342 25,723 13,047 52,919
London 12,809 51,953 35,359 143,416
North East 8,854 35,912 15,221 61,736
North West 13,999 56,780 26,130 105,983
South East 11,574 46,944 22,709 92,108
South West 6,351 25,760 13,678 55,478
West Midlands 8,385 34,010 16,708 67,768
Yorkshire 7,929 32,160 14,531 58,938
England 83,996 340,688 174,627 708,287
Wales 4,395 17,826 11,153 45,237
Scotland 7,888 31,994 19,811 80,353
Great Britain 96,279 390,508 205,591 833,877
38/39
6.0%
5.0%
4.0%
3.0%
2.0%
1.0%
0.0%1984 1986 1988 1990 1992 1994 1996 1998 2000 2002 2004 2006 2008
Convictions of young people aged 10-17
3.0%
2.5%
2.0%
1.5%
1.0%
0.5%
0.0%1984 1986 1988 1990 1992 1994 1996 1998 2000 2002 2004 2006 2008
COE56PPINNERS.indd 36-37 25/11/2010 13:51

2.4 Youth imprisonment: an international perspective
With the exception of Northern Ireland, the prison rate per head of population is much higher in the UK, compared to many other countries. This was true in our last report (The Prince’s Trust, 2007), and remains so today. The rate of imprisonment has continued to accelerate. Furthermore, the percentage of prisoners who are children (i.e. under 18 years of age) is higher in England and Wales compared to all countries on the below list apart from the Netherlands. The situation is similar in Scotland. All parts of the UK have a relatively high proportion of prisoners who are between the age of 18 and 21 when compared with other countries.
Note: Statistics from the Council of Europe, Annual Penal Statistics. Survey 2002 and 2008The prison population includes pre-trial detainees.
2.5 Tackling youth crime: The Prince’s Trust
The Prince’s Trust works with young people in custody and former offenders in the community, giving them the skills they need to turn their lives around and give back to society.
The ‘Working One-to-One with Young
Offenders’ scheme is run by The Prince’s Trust in prisons and young offender institutes (YOIs). Mentors, who are former offenders themselves, volunteer to be trained up by The Trust to visit prisons and YOIs to give talks and recruit young people to the scheme. The young people are offered one-to-one mentoring support inside, as well as support for their transition back into society on release.
The scheme was created following a
Prince’s Trust discussion with 25 ex-offenders in 2006. Only one of the 25 young people present had been met by someone at the prison gate on the day of their release.
The Trust’s mentoring scheme gives
young offenders a positive role model and someone to meet them on their first day out of custody to help them make the right decisions to break the cycle of re-offending. Mentors help with such things as finding accommodation, drugs rehabilitation, a job or training opportunities.
Other Prince’s Trust schemes such as the Team programme and Get Started with Football are run in prisons to engage young offenders in positive activities, building their confidence and skills before release.
As well as the support offered on
the inside, many young offenders are supported after their release. As well as direct recruitment, they are often referred from statutory agencies including Youth Offending Teams, Probation and Prison Resettlement Units.
In 2009/10, more than 20 per cent
of participants on Trust programmes were offenders or ex-offenders. Of these, around three in four moved into employment, self-employment, volunteering, further education or training.
The Trust also provides support for
young people at risk of offending. Its xl programme helps tackle truancy and school exclusion, while its Community Cash Awards provide financial support for young people to make a positive contribution to their communities, instilling a sense of ownership and pride.
Population of Penal Institutions on 1 September 2002 and 1 September 2008
Countries Prison Prison Percentage Percentage population population of Prisoners of Prisoners rate per rate per under 18 from 18 100,000 100,000 years of 21 years of inhabitants inhabitants age, 2008 age, 2008 in 2002 2008
England and Wales 137.1 152.8 3.0 10.6
Northern Ireland 62.3 85.8 1.2 9.0
Scotland 128.7 156.5 2.5 10.4
Austria 92.3 96.3 2.7 7.8
Belgium 90.2 98.4 0.3 4.6
Denmark 64.1 62.9 0.3 10.1
Finland 66.7 67.3 0.2 2.5
France 87.6 104.1 1.1 7.3
Ireland 78.0 84.8 2.4 10.1
Italy 99.8 96.0 … 3.0
Netherlands 100.8 102.8 8.3 7.1
Norway 58.8 70.6 0.2 5.2
Portugal 132.8 101.2 0.2 3.0
Spain 126.2 159.7 … 2.3
Sweden 73.0 75.8 0 3.2
40/41
COE56PPINNERS.indd 38-39 25/11/2010 13:51

00/00Case studyKyle Baptiste
His mum was working two jobs to make ends meet but still the family was living in extreme poverty.
He says: “Our house wasn’t decorated and we didn’t have a fridge. At times, I could hear my mum crying at night because she couldn’t afford to buy me the things I needed.”
When his mother was at work Kyle had the evenings to himself and the local gang became his surrogate family. Crime became part of his life and he ended up serving an 18-month sentence at the age of 21.
Kyle wanted to do something positive with his time in prison and to help other inmates. He researched his options and decided to build a radio station from scratch. He applied to The Prince’s Trust for help with his plan and was given Community Cash Award funding to start up the project.
Working on the radio station gave the prisoners skills, qualifications and experiences they could take with them when they left custody. Now over a thousand people have now done the course.
With the motivation and self-confidence he gained from working on the project he left prison determined not to go back to his old ways.
Kyle wanted to go on helping people and has secured a job as a community outreach worker with a Leeds-based social enterprise, Future Arts, which aims to help young people who want to make it in the music industry but who lack the technology they need.
Kyle says: “Prison was a real turning point for me. I had time to think about who I was and where I was going with my life. I was lucky that I had a chance to do something with my time there, something that has had a long lasting positive effect on my future.”
By the age of 14, Kyle Baptiste from Leeds had been repeatedly excluded from school after school in West Yorkshire and his future looked bleak.
42/43
COE56PPINNERS.indd 40-41 25/11/2010 13:51

The cost of educational underachievement for the current generation of young people age 17-24 is estimated at £22 billion.
Educational underachievement has a substantial
– and lasting – effect on individuals. Oreopoulos and Salvanes (2009) document evidence on the relationship between education and a long list of benefits: success in the labour market; better health; reduced probability of risky behaviours; trust and civic participation. At a macro-economic level, educational underachievement also affects the relative performance of the UK economy over time.
Young people most at risk of educational underachievement include pupils who truant, those who are excluded, those with offending backgrounds and those with poor literacy or numeracy skills. Other influential factors include gender, health, low family income and parents’ education and unemployment. This chapter concludes by highlighting how The Prince’s Trust is working to help young people achieve more at school.
3. The cost of educationalunderachievement
3.1 Educational underachievement: calculating the costs
Many studies show a strong causal relationship between staying longer in education and average earnings. These studies suggest there are large payoffs to investment in education – either in terms of boosting employability or from wage returns.
Even basic qualifications can have a significant knock-on effect on the probability of employment and on wages. Studies have found that, controlling for other characteristics, Level 1 numeracy or literacy skills raise the probability of employment by about five percentage points.15 For those in work, these skills can raise wages by about nine percentage points in the case of numeracy skills and seven percentage points in the case of literacy skills.16 Although Level 1 numeracy and literacy are equivalent to standards that should be achieved by age 11, around 20 per cent of adults do not meet this standard.
Dearden et al. (2004) analyse the returns to education for the individual at the margin of deciding whether or not to stay on in education beyond the age of 16. They use the British Cohort Study, which surveys individuals born in a week of April 1970 at intervals through their lives. Returns to staying on in education are estimated for various subgroups of ‘marginal learners’ when they were aged 29-30 (1999/2000). They find substantial returns to staying on in education for all subgroups of the population. On average, the wage return to ‘staying
on’ is about 11 per cent for men and 18 per cent for women. Lower returns of six to eight per cent are estimated for male drop-outs of either low ability or lower socio-economic group. However, higher returns are estimated for people from low income families. Within this subgroup, the wage return estimate is 13 and 17 per cent for men and women respectively.
For the purposes of this report, we will estimate an average wage return for leaving school with qualifications of 10 per cent. To get an idea of how much a wage return of 10 per cent is worth over working life, the Family Resources Survey 2008/09 was used to obtain a wage profile for a cross-section of men of each age between 20 and 64.17 The aggregate discounted value of a 10 per cent rise in average wages was then calculated. This comes to around £45,000, illustrating the high potential loss of income for those who are unable to take advantage of opportunities to pursue their education.
We estimate the cost to the UK economy
under the assumption that each person without qualifications suffers a 10 per cent loss in earnings over their lifetime. We do this by multiplying the individual cost (£45,000) with the number of young people (aged 17-24) with no qualifications (i.e. % with no qualifications in the Labour Force Survey multiplied by population figures). This amounts to £22 billion.
15 See McIntosh and Vignoles (2000) and Layard et al. (2002) for the importance of basic literacy and numeracy skills for labour market returns.16 The estimate for literacy is not statistically significant. However, results for literacy skills are more sensitive to the data set used. Estimates using the International Adult Literacy Survey suggest higher effects. Estimates reported here control for family background and age seven ability.17 We use the Family Resources Survey from 2008-09 and a discount rate of 3.5%.
44/45
COE56PPINNERS.indd 42-43 25/11/2010 13:51

00/00Case studyToni Elkington
As her mother’s condition worsened, Toni started to run away from home and was eventually taken into foster care. Shortly after this, her mum died.
Toni says: “After my mum died, I thought the only place I would end up would be in prison or dead. I never got up in the morning to go to school. I would spend a whole day in bed, taking drugs and getting off my head on booze. I think I went through practically every foster home in Leeds.”
Toni was also getting in trouble with the police and ended up on a supervision order.
Toni was heading for disaster but then she was given a new foster placement. This was a turning point as her new foster parents insisted she attend school.
The school recommended Toni join The Prince’s Trust xl club, which offers 14-to-16-year-olds an alternative curriculum and one-to-one support.
The xl club gave structure to Toni’s disjointed life. She started to put effort into her studies and even took extra classes. As a result, just 10 months later she sat and passed 10 GCSEs.
After finishing school, Toni went to college to study construction and has since secured a job as a plasterer.
Toni says: “If it wasn’t for The Prince’s Trust, I think I would have been sent down a long time ago or maybe I would have overdosed on drugs. Instead, I’m in full-time work, sober and in control of my life.”
Toni Elkington was 12 when she found out her mum had cancer. Her world fell apart and she turned to drink and drugs to block out the pain.
46/47
COE56PPINNERS.indd 44-45 25/11/2010 13:51

3.2 Educational underachievement: a regional perspective
The percentage of young people with no qualifications is very high. In 2009, the percentage of people aged 16-24 with no qualifications in England, Wales, Scotland and Northern Ireland was 11 per cent, 12.4 per cent, 9.2 per cent and 19.3 per cent respectively. Within England, there is little variation, with most regions having 10-11 per cent of young people without qualifications, apart from the West Midlands - where the figure is 13.7 per cent - and the South West - where the figure is 8.7 per cent.
3.3 Educational underachievement: an international perspective
The UK compares unfavourably to many other countries in respect to the percentage of young people who leave the education system with low-level educational qualifications.
The graph below shows the percentage of the population aged 18-24, with - at most - lower secondary education, who are now not in further education or training.
In 2009, nearly 16 per cent of 18-24 year olds in the UK fell into this category. Although this is greatly exceeded in some other countries (Portugal, Spain and Italy), it is higher than in many others. The UK ranks fourth out of the 13 countries listed below.
Government Number of 16-24 16-24 year-olds Percentage of office region year-olds with no 16-24 with no qualifications qualifications West Midlands 652,900 86,900 13.3 East Midlands 542,800 64,500 11.9 North West 857,300 101,700 11.9 North East 328,600 35,800 10.9 London 894,900 93,600 10.5 Yorkshire and The Humber 681,500 68,400 10.0 East 630,800 62,600 9.9 South East 945,800 93,900 9.9 South West 589,300 43,400 7.4 England 6,123,900 650,800 10.6 Wales 368,100 41,200 11.2 Scotland 613,000 55,100 9.0 Northern Ireland 228,000 40,600 17.8 UK 7,333,000 787,600 10.7
Source: Labour Force Survey
• England • Wales • Scotland • Northern Ireland
48/49
The percentage of young people (aged 16-24) with no qualifications
40%
35%
30%
25%
20%
15%
10%
5%
0%1984 1986 1988 1990 1992 1994 1996 1998 2000 2002 2004 2006 2008
Eurostat (2010). http://epp.eurostat.ec.europa.eu/portal/page/portal/employment_unemployment_lfs/data/main_tables
35
30
25
20
15
10
5
0
Po
rtug
al
Sp
ain
Ital
y
Uni
ted
Kin
gd
om
Gre
ece
Fran
ce
Irel
and
Bel
giu
m
Ger
man
y
Net
herl
and
s
Sw
eden
Den
mar
k
Aus
tria
COE56PPINNERS.indd 46-47 25/11/2010 13:51

00/00 3.4 Tackling educational underachievement The Prince’s Trust
The Prince’s Trust xl programme runs in mainstream schools as well as in pupil referall units, secure units and young offender institutions. It empowers young people to play an active role in planning their activities, helping keep them in school and gain qualifications. Last year, The Prince’s Trust worked in partnership with 596 schools and centres, helping 12,864 young people through 1,054 xl clubs.
The cost of a full-time placement in a Pupil Referral Unit is about £15,000 a year.18 To run The Prince’s Trust xl programme, helping up to 15 pupils for two years, costs a school just £2,000.
Seventy-three per cent of young people helped by The Prince’s Trust are educational underachievers, including young people who are facing exclusion from school. The Prince’s Trust is tackling educational underachievement in schools through its xl curriculum for pupils at risk of truanting or exclusion.
50/51
18 Back on Track - A strategy for modernising alternative provision for young people, DCSF, 2008.
COE56PPINNERS.indd 48-49 25/11/2010 13:52

00/00Case studyLisa Dunlop
Her employment prospects were hampered by a lack of GCSEs and she had a number of temporary jobs but nothing with any real future.
At the age of 18, Lisa became pregnant but unfortunately the father of her child was sent to prison leaving Lisa to cope on her own. She struggled financially and emotionally.
Ten years later, Lisa was a single mum with two children, no job prospects and post-natal depression, which led to a breakdown.
Lisa started to feel that the only way out was suicide. She had her suicide note already written but knew deep down she didn’t want to leave her two young children.
The morning after writing her suicide note Lisa received a letter telling her a business unit she had enquired about was available.
Lisa took this as a sign that she was meant to do something with her life and, with the support of The Prince’s Trust, set up her business – Beauty Secrets. The Prince’s Trust gave Lisa a low-interest loan and a mentor for support. Located in a busy area of Belfast, the shop offers beauty treatments and holistic therapy.
Lisa is now a successful business woman with plans to expand.
She says: “My life is a million miles away from those dark days when I was thinking about ending it all. Being a business woman is something that makes me feel good about myself. It’s an important part of who I am now.”
Lisa Dunlop from Northern Ireland was devastated by the break-up of her parents. She started to rebel and dropped out of school at the age of 14 with no qualifications.
52/53
COE56PPINNERS.indd 50-51 25/11/2010 13:52
00/00
The recent recession has hit young people particularly hard, pushing those with few qualifications ever further from the jobs.
This report finds that the implications of youth unemployment stretch beyond the immediate effects on those in the dole queue. There is a cost to the taxpayer of £22 million a week in terms of Jobseeker’s Allowance. On top of this, there is the cost to the economy of lost productivity. A conservative estimate for this is approximately the same amount per week again. The upper bound figure given in this report for lost productivity is £133 million, making the upper estimate for youth unemployment £155 million a week.
00/004. Conclusion
Other aspects of youth disadvantage add a further burden to the taxpayer. Youth crime is estimated to cost more than £23 million a week, while educational underachievement comes at a cost of £22 billion for the current generation of young people.
And the costs go beyond the financial. Unemployment has a huge emotional toll on young people across the UK, who all too often face a downward spiral towards depression, poverty, drug addiction or worse. This unemployment trap has a massive impact on young people, as well as their families and the communities they live in.
With the cost of disadvantage in the UK at a new high, the work of charities such as The Prince’s Trust is arguably more relevant than ever. Young people who approach The Trust have often reached rock bottom after years of fruitless job hunting, a failed education or time spent in prison. They may feel that there is little hope for them.
But every day, The Trust supports 100 more of these young people, giving
them the skills and confidence for work and enterprise. With the right support, hundreds of thousands of young people who were once a huge burden to the economy are now able to pay taxes, act as role models to others and even create new jobs where there were none.
This report reveals that these interventions – which help young people into jobs, stay on in education or avoid crime – are vital for the sake of the UK economy. They also represent excellent value for money, given the massive price that the state is already paying for social exclusion. For a fraction of this cost, The Prince’s Trust can support a jobless young person through an intensive personal development course, helping them leave the dole queue for good.
At this time when there is huge pressure on the public purse, the Cost of Exclusion shows that it is possible to help young people into jobs while saving the state billions. Government, charities and employers must work together now to deliver this vital change.
54/55
COE56PPINNERS.indd 52-53 25/11/2010 13:52

COE56PPINNERS.indd 54-55 25/11/2010 13:52
00/00 References
Blundell,R.,L.Dearden,andB.Sianesi(2005)‘MeasuringtheReturnstoEducation’,inS.MachinandA.Vignoles(eds.)What’stheGoodofEducation?,PrincetonUniversityPress,Princeton,US.
Black,S.E.,P.J.DevereuxandK.G.Salvanes,(2006),“FromtheCradletotheLaborMarket?TheEffectofBirthWeightonAdultOutcomes,”CEEDiscussionPaper61.
Brand,S.,andR.Price,(2000),“TheEconomicandSocialCostsofCrime,”HomeOfficeResearchStudy,217.
Burgess,S.,C.Propper,H.Rees,andA.Shearer,(2003),“TheClassof1981:theEffectsofEarlyCareerUnemploymentonSubsequentUnemploymentExperiences,”LabourEconomics,10,291-309.
ConfederationofBritishIndustry,(2008),“TowardsaNEETSolution:tacklingunderachievementinyoungpeople.”October2008.
Dearden,L.,S.McIntosh,M.Myck.,andA.Vignoles,(2002),“TheReturnstoAcademicandVocationalQualificationsinBritain,”BulletinofEconomicResearch,Vol.54,pp.249-274.
Dearden,L.,L.McGranahan,andB.Sianesi,(2004),“ReturnstoEducationforthe‘MarginalLearner’:EvidencefromtheBCS70,”CEEDiscussionPaper,No.45.
Devitt,K.,L.Knighton,andK.Lowe,(2009),“YoungAdultsToday:KeyDataon16-25year-olds.Transitions,DisadvantageandCrime”.YoungPeopleinFocus.Ltd.
Dubourg,R.,andJ.Hamed,(2005),“EstimateoftheEconomicandSocialCostsofCrimeinEnglandandWales:CostsofCrimeAgainstIndividualsandHouseholds2003/04,”HomeOfficeReport(online)30/05
Fletcher,D.,Woodhill,D.andHerrington,A.(1996),“BuildingBridgesintoEmploymentandTrainingforEx-Offenders,”JosephRowntreeFoundation.
Gregg,P.(2001)“TheImpactofYouthUnemploymentonAdultUnemploymentintheNCDS,”EconomicJournal,111:626:653.
Gregg,P.andTominey,E.(2005)TheWageScarfromYouthUnemployment,LabourEconomics,12(4):487-509
Gregg,P,andJ.Wadsworth,(2010),“UnemploymentandInactivityintheRecession.”EconomicandLabourMarketReview.4(8)
Gregg,P,andJ.Wadsworth,(2010),“TheLabourMarketinthe2008-2009Recession:employment,”EconomicandLabourMarketReview.4(8)
Levitt,S.D.,(2004),“UnderstandingWhyCrimeFellinthe1990s:FourFactorsthatExplaintheDeclineandSixthatDoNot,”JournalofEconomicPerspectives,18,1,163-190.
Layard,R.,(2005),Happiness,ThePenguinPress,NewYork.
Layard,R.,McIntosh,S.,andVignoles,A.,(2002),“Britain’sRecordonSkills”,CEEDiscussionPaper23.
Machin,S.,O.MarieandS.Vujic,(2010),“TheCrimeReducingEffectofEducation”.Mimeo.CentreforEconomicPerformance.LondonSchoolofEconomics.
McIntosh,S.,(2004),“TheImpactofVocationalQualificationsontheLabourMarketOutcomesofLow-AchievingSchool-Leavers,”CEPDiscussionPaperNo.621.
McIntosh,S.,(2004),“FurtherAnalysisoftheReturnstoAcademicandVocationalQualifications,”CEEDiscussionPaper35.
McIntosh,S.,andVignoles,A.,(2000),MeasuringandAssessingtheImpactofBasicSkillsonLabourMarketOutcomes,CEEDiscussionPaperNo.3.
Oreopoulos,P.,andK.G.Salvanes,(2009),“HowLargeareReturnstoSchooing?Hint:MoneyIsn’tEverything.”NBERDiscussionPape.No.15339.
Oswald,A.J.,(1997),“HappinessandEconomicPerformance,”EconomicJournal,107,1815-1831.
Petrongolo,B.,andJ.VanReenen,(2010),“JobsandYouthUnemployment:It’sbad,butnotasbadasyoumightthink”.ElectionAnalysis.CentreforEconomicPerformance,LondonSchoolofEconomics.
Prince’sTrust,(2007),“TheCostofExclusion:CountingtheCostofYouthDisadvantageintheUK.”
PrisonReformTrust,(2009),“BromleyBriefings.PrisonFactfile”.November2009.
Sampson,R.J.andJ.H.Laub,(1993),CrimeintheMaking:PathwaysandTurningPointsthroughLife,HarvardUniversityPress.CambridgeMA.
Sampson,R.J.andJ.H.Laub,(1997),“ALife-CourseTheoryofCumulativeDisadvantageandtheStabilityofDelinquency,”AdvancesinCriminologicalTheory,7,133-161.
Shaw,J.,andL.Sibieta,(2005),“ASurveyoftheUKBenefitSystem,”TheInstituteforFiscalStudies,BriefingNoteNo.13.
Sianesi,B.,(2003),“ReturnstoEducation:ANon-technicalSummaryofCEEWorkandPolicyDiscussion,”InstituteforFiscalStudies,mimeo.
SocialExclusionUnit,(2005),“Transitions:YoungAdultswithComplexNeeds,”OfficeoftheDeputyPrimeMinister,London.
Western,B.,J.R.KlingandD.F.Weiman(2001),“TheLaborMarketConsequencesofIncarceration,”CrimeandDelinquency,47:3,410-427
Notesonmethodology
YouthunemploymentWehaveusedtheinformationavailableintheLabourForceSurveytoestimatetheprobabilityofunemploymentforpeopleinthe20-24agerangeaccordingtoobservablecharacteristics–age,gender,maritalstatus,ethnicity,qualifications,healthanddependents.Collectively,thesevariableshaverelativelylowpowerinexplainingunemployment.Hence,ourmethodologydoesnotproducedifferentresultsthanifwesimplyuseaverageearningsforemployedpersonsinthisagerangeasanestimateoftheaverageearningsunemployedpersonsmightexpecttoreceive.
Weuseanaverageof£262perweek,perperson.ThisshouldbethoughtofasanupperboundsinceyoungpeoplewhoareunemployedmaybedifferentfromthoseinemploymentinawaythatisdifficulttocaptureusingvariablesintheLabourForceSurvey.Weeklypayof£262onaveragecomparesveryfavourablytotheincomeandnon-incomerelatedbenefitsreceivedbyunemployedpersonsinthesameagerange(£95onaverage–estimatedusingtheFamilyResourcesSurvey).Theestimatedcostsvarybyregion,dependingontheproportionofpersonsunemployedandthenumberofpeopleinthe20-24agerange.
AmoreconservativeestimateoflostproductivityisbasedonthevalueofJobseeker’sAllowance.Itisreasonabletoassumethatunemployedpeoplearelessproductiveonaveragethanthoseinemployment–particularlyiftheyremainunemployedforalongtime.Furthermore,aproportionofunemploymentislikelytobe‘voluntary’inthatthereisawageabovewhichunemployedpeoplewouldtakeanyjob.Inthatcontext,onemightthinkofJSAasbeinglikeareservationwage.Ifallunemployedpeoplewereatthispoint,theproductivitylosscouldbevaluedasequaltotheJSA.Thisisthebasisofourconservativeestimate.
CrimeWehavebeenabletoobtaininformationonconvictionsbyregion(exceptforNorthernIreland)andonthepopulationofpenalinstitutionsforallcountriesoftheUK.However,suchdataareonlyindicatorsoftheextentofcrime.Itisimportanttonotethatmanyrecordedcrimesareneverbroughttojustice.
ThegraphsshowthenumberofconvictionsofyoungpersonsinEngland,WalesandScotlandfortwoagecategories:age18-21andage10-17.Thesenumbersarepresentedasapercentageofthepopulationagedbetween15and24soastoadjustfordemographictrends.Itisnotpossibletogetpopulationnumbersinexactlytherightcategoriesforthewholetimeperiod.Inanycase,sincethereareoftenmultipleconvictionsperperson,itwouldnotmakesensetointerpretnumbersasthepercentageofthepopulationwhoareconvicted.
EducationalunderachievementTodiscoverthescaleofunderachievementintheUK,welookedatthepercentageof16-24yearoldsinthepopulationwhodonothaveanyeducationalqualification,usingsuccessivewavesoftheLabourForceSurvey(from1979to2009).Weightingfactorsareappliedtoeachsurveyrespondentinsuchawaythatresultsarerepresentativeofthepopulationintermsofagedistribution,sexandregionofresidence(seeLFSSurveyUserGuideforfurtherdetails).
56/57

COE56PPINNERS.indd 56 25/11/2010 13:52