for: greenacre homes & school atkinson · specifically, dataquest is a dynamic system that...
TRANSCRIPT

Page 2 of 27
For: Greenacre Homes & School Atkinson Address: 438 Eddie Lane (main office) Phone: (707) 829-1366 Principal: Benjamin Swenson-Aguirre Grade Span: K-12 By February 1 of each year, every school in California is required by state law to publish a School Accountability Report Card (SARC). The SARC contains information about the condition and performance of each California public school. Under the Local Control Funding Formula (LCFF) all local educational agencies (LEAs) are required to prepare a Local Control and Accountability Plan (LCAP), which describes how they intend to meet annual school-specific goals for all pupils, with specific activities to address state and local priorities. Additionally, data reported in an LCAP is to be consistent with data reported in the SARC. ➢ For more information about SARC requirements, see the California Department of Education (CDE)
SARC Web page at http://www.cde.ca.gov/ta/ac/sa/. ➢ For more information about the LCFF or LCAP, see the CDE LCFF Web page at
http://www.cde.ca.gov/fg/aa/lc/. ➢ For additional information about the school, parents/guardians and community members should contact
the school principal or the district office. DataQuest DataQuest is an online data tool located on the CDE DataQuest Web page at http://dq.cde.ca.gov/dataquest/ that contains additional information about this school and comparisons of the school to the district and the county. Specifically, DataQuest is a dynamic system that provides reports for accountability (e.g., test data, enrollment, high school graduates, dropouts, course enrollments, staffing, and data regarding English learners). Internet Access Internet access is available at public libraries and other locations that are publicly accessible (e.g., the California State Library). Access to the Internet at libraries and public locations is generally provided on a first-come, first-served basis. Other use restrictions may include the hours of operation, the length of time that a workstation may be used (depending on availability), the types of software programs available on a workstation, and the ability to print documents. Throughout this document, the letters DPL mean data provided by the LEA, and the letters DPC mean data provided by the CDE.
California Department of Education School Accountability Report Card
Reported Using Data from the 2015–16 School Year

Page 3 of 27
About This School District Contact Information (School Year 2016–17) District Name Sonoma County Office of Education Phone Number (707) 534-2710 Superintendent Steven Herrington E-mail Address [email protected] Web Site scoe.org School Contact Information (School Year 2016–17) School Name Greenacre Homes & School • Gravenstein Street 7590 Atkinson Road City, State, Zip Sebastopol, CA 95472 Phone Number (707) 829-1366 Principal Ben Swenson-Aguirre E-mail Address [email protected] Web Site Greenacrehomes.org County-District-School (CDS) Code 49-70938-69060 School Description and Mission Statement (School Year 2016–17) The school program is consistent and complimentary to the residential program catalyzing the clients' transition into a less restrictive placement and a greater overall independent level of functioning. Dysfunctional behavior more than any other factor prevents integration of students into a less restrictive setting, thus it is a prime focus for the school program. The school provides a solid consistent, and predictable structured setting supported by a strong behavior modification program employing a point system, privilege program, and a realistic student store. A major portion of each day is dedicated to raising the reading, writing, and arithmetic skills of the clients. Development of these basic skills eases students’ transition into public school classrooms. There are a number of enrichment classes during the school week focusing on natural sciences, history, current events, physical fitness, and the arts. The academic program also includes regular practicing of speech and language exercises designed by our Speech and Language Pathologist. We create a therapeutic milieu focusing on relationships, development, and care. Also, our school specializes in vocational training (5 job sites in the community), and our many licensed therapists provide individual, group, family counseling, and weekly social skills classes. Additional professionals include 2 Occupational Therapists and a Psychiatrist overseeing medication. Student Enrollment by Grade Level (School Year 2015–16)
Grade Level Number of Students Kindergarten 0 Grade 1 0 Grade 2 1 Grade 3 2 Grade 4 4 Grade 5 5 Grade 6 5

Page 4 of 27
Grade 7 4 Grade 8 8 Ungraded Elementary 0 Grade 9 5 Grade 10 0 Grade 11 1 Grade 12 0 Ungraded Secondary 0 Total Enrollment 35

Page 5 of 27
Student Enrollment by Student Group (School Year 2015–16)
Student Group Percent of Total Enrollment
Black or African American 35 American Indian or Alaska Native 2.8 Asian 3.5 Filipino 0 Hispanic or Latino 28 Native Hawaiian or Pacific Islander 0 White 59.5 Two or More Races 84 Socioeconomically Disadvantaged 85 English Learners 28 Students with Disabilities 100 Foster Youth 22.8 A. Conditions of Learning State Priority: Basic The SARC provides the following information relevant to the State priority: Basic (Priority 1):
• Degree to which teachers are appropriately assigned and fully credentialed in the subject area and for the pupils they are teaching;
• Pupils have access to standards-aligned instructional materials; and
• School facilities are maintained in good repair Teacher Credentials
Teachers School 2014–15
School 2015–16
School 2016–17
District 2016–17
With Full Credential 3 3 3 3 Without Full Credential 0 0 0 0 Teaching Outside Subject Area of Competence (with full credential) 0 0 0 0 Teacher Misassignments and Vacant Teacher Positions
Indicator 2014–15 2015–16 2016–17 Misassignments of Teachers of English Learners 0 0 0 Total Teacher Misassignments 0 0 0 Vacant Teacher Positions 0 0 0 Note: “Misassignments” refers to the number of positions filled by teachers who lack legal authorization to teach that grade level, subject area, student group, etc. * Total Teacher Misassignments includes the number of Misassignments of Teachers of English learners.

Page 6 of 27
Core Academic Classes Taught by Highly Qualified Teachers (School Year 2015–16)
Location of Classes Percent of Classes In Core
Academic Subjects Taught by
Highly Qualified Teachers
Percent of Classes In Core Academic Subjects
Not Taught by Highly Qualified Teachers
This School 100 0 All Schools in District n/a n/a High-Poverty Schools in District n/a n/a Low-Poverty Schools in District n/a n/a Note: High-poverty schools are defined as those schools with student eligibility of approximately 40 percent or more in the free and reduced price meals program. Low-poverty schools are those with student eligibility of approximately 39 percent or less in the free and reduced price meals program.
Quality, Currency, Availability of Textbooks and Instructional Materials (School Year 2016–17) Year and month in which the data were collected: August 2017 .
Subject Textbooks and Instructional
Materials/year of Adoption
From Most Recent Adoption?
Percent Students Lacking Own
Assigned Copy
Reading/Language Arts 2008-2010 Mathematics 2008-2010 Science 2008-2010 History-Social Science 2008-2010 Foreign Language 2008-2010 Health 2008-2010 Visual and Performing Arts 2008-2010 Science Laboratory Equipment (grades 9-12) N/A N/A DPL
Note: Cells with N/A values do not require data. School Facility Conditions and Planned Improvements The following is a list of projects to be completed this school year:
§ New playground equipment § Repave area between classroom 3 and the school office § Purchase new portable for the Vocational Training School § Expand the grass playground area § Remodel bathroom next to kitchen § Cut tree limbs near parking area § Plant additional fruit trees and expand winter garden § New roof on workshop § Purchased new therapy office
Page 7 of 27
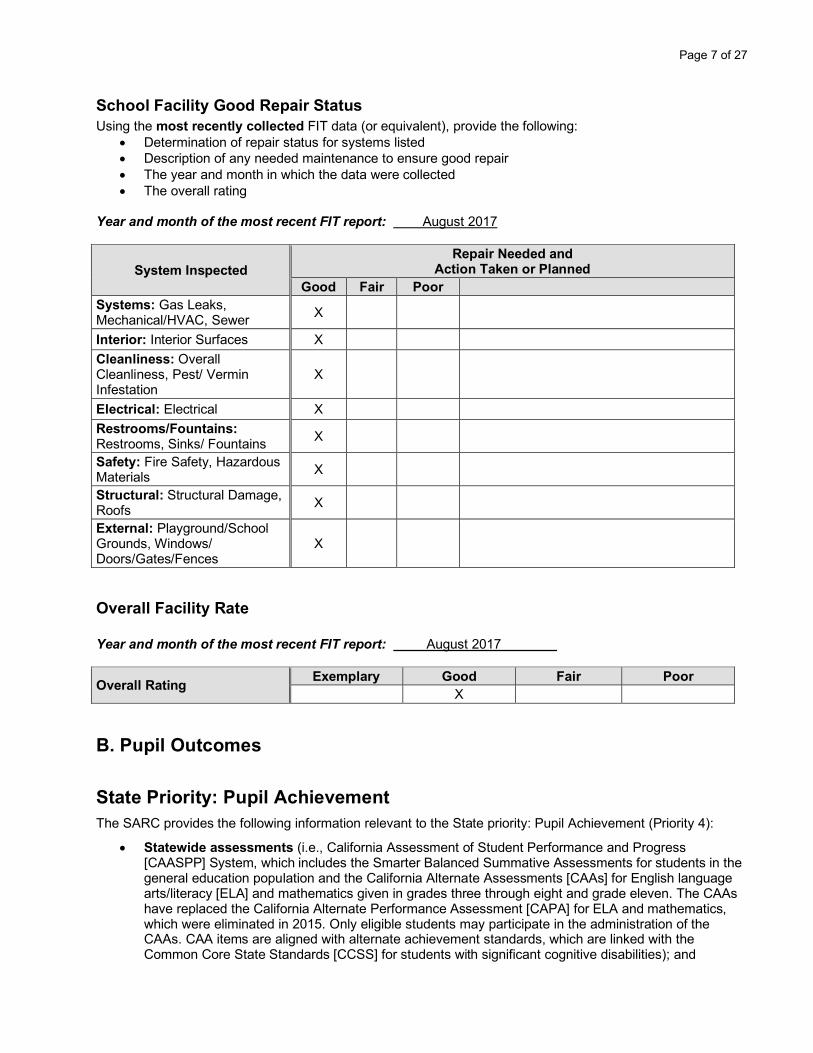
School Facility Good Repair Status Using the most recently collected FIT data (or equivalent), provide the following:
• Determination of repair status for systems listed • Description of any needed maintenance to ensure good repair • The year and month in which the data were collected • The overall rating
Year and month of the most recent FIT report: August 2017
System Inspected Repair Needed and
Action Taken or Planned Good Fair Poor
Systems: Gas Leaks, Mechanical/HVAC, Sewer X
Interior: Interior Surfaces X Cleanliness: Overall Cleanliness, Pest/ Vermin Infestation
X
Electrical: Electrical X Restrooms/Fountains: Restrooms, Sinks/ Fountains X
Safety: Fire Safety, Hazardous Materials X
Structural: Structural Damage, Roofs X
External: Playground/School Grounds, Windows/ Doors/Gates/Fences
X
Overall Facility Rate Year and month of the most recent FIT report: August 2017
Overall Rating Exemplary Good Fair Poor X
B. Pupil Outcomes State Priority: Pupil Achievement The SARC provides the following information relevant to the State priority: Pupil Achievement (Priority 4):
• Statewide assessments (i.e., California Assessment of Student Performance and Progress [CAASPP] System, which includes the Smarter Balanced Summative Assessments for students in the general education population and the California Alternate Assessments [CAAs] for English language arts/literacy [ELA] and mathematics given in grades three through eight and grade eleven. The CAAs have replaced the California Alternate Performance Assessment [CAPA] for ELA and mathematics, which were eliminated in 2015. Only eligible students may participate in the administration of the CAAs. CAA items are aligned with alternate achievement standards, which are linked with the Common Core State Standards [CCSS] for students with significant cognitive disabilities); and
Page 8 of 27
• The percentage of students who have successfully completed courses that satisfy the requirements for entrance to the University of California and the California State University, or career technical education sequences or programs of study
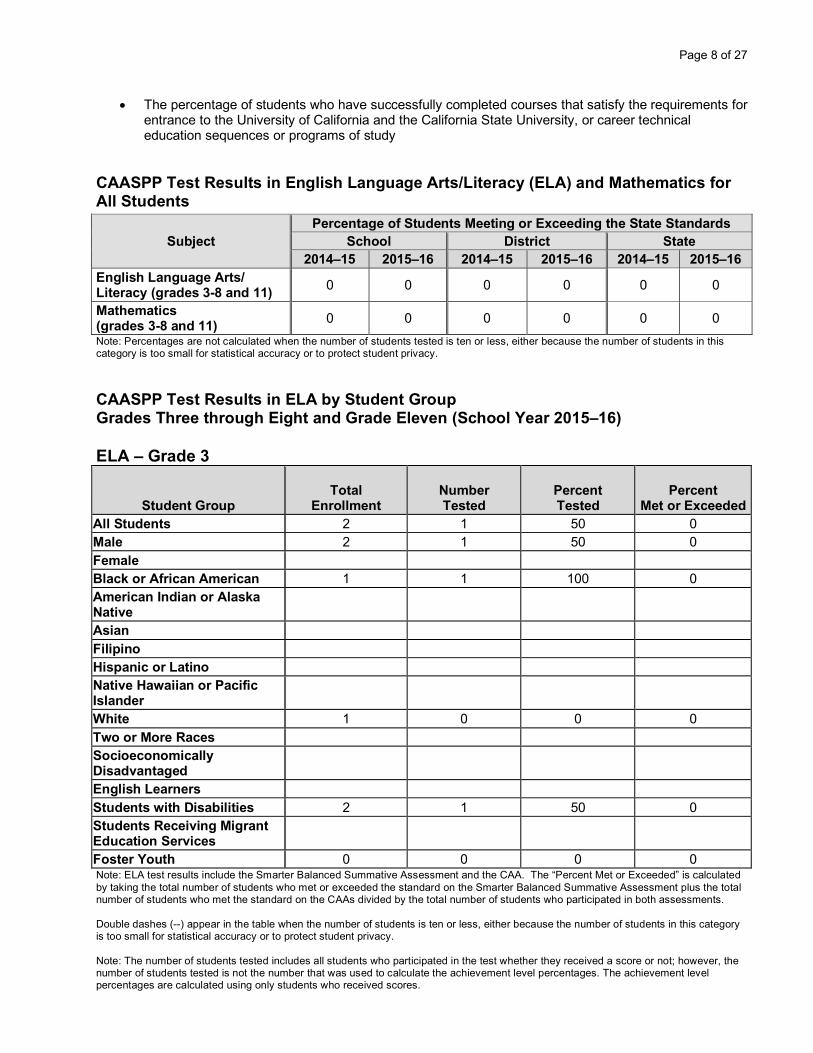
CAASPP Test Results in English Language Arts/Literacy (ELA) and Mathematics for All Students
Subject Percentage of Students Meeting or Exceeding the State Standards
School District State 2014–15 2015–16 2014–15 2015–16 2014–15 2015–16
English Language Arts/ Literacy (grades 3-8 and 11) 0 0 0 0 0 0
Mathematics (grades 3-8 and 11) 0 0 0 0 0 0 Note: Percentages are not calculated when the number of students tested is ten or less, either because the number of students in this category is too small for statistical accuracy or to protect student privacy. CAASPP Test Results in ELA by Student Group Grades Three through Eight and Grade Eleven (School Year 2015–16) ELA – Grade 3
Student Group
Total
Enrollment Number Tested
Percent Tested
Percent Met or Exceeded
All Students 2 1 50 0 Male 2 1 50 0 Female Black or African American 1 1 100 0 American Indian or Alaska Native
Asian Filipino Hispanic or Latino Native Hawaiian or Pacific Islander
White 1 0 0 0 Two or More Races Socioeconomically Disadvantaged
English Learners Students with Disabilities 2 1 50 0 Students Receiving Migrant Education Services
Foster Youth 0 0 0 0 Note: ELA test results include the Smarter Balanced Summative Assessment and the CAA. The “Percent Met or Exceeded” is calculated by taking the total number of students who met or exceeded the standard on the Smarter Balanced Summative Assessment plus the total number of students who met the standard on the CAAs divided by the total number of students who participated in both assessments. Double dashes (--) appear in the table when the number of students is ten or less, either because the number of students in this category is too small for statistical accuracy or to protect student privacy. Note: The number of students tested includes all students who participated in the test whether they received a score or not; however, the number of students tested is not the number that was used to calculate the achievement level percentages. The achievement level percentages are calculated using only students who received scores.

Page 9 of 27
ELA – Grade 4
Student Group
Total
Enrollment Number Tested
Percent Tested
Percent Met or Exceeded
All Students 4 3 75 0 Male 4 3 75 0 Female Black or African American American Indian or Alaska Native
Asian Filipino Hispanic or Latino Native Hawaiian or Pacific Islander
White 4 3 75 0 Two or More Races Socioeconomically Disadvantaged
English Learners Students with Disabilities 4 3 75 0 Students Receiving Migrant Education Services
Foster Youth 0 0 0 0 Note: ELA test results include the Smarter Balanced Summative Assessment and the CAA. The “Percent Met or Exceeded” is calculated by taking the total number of students who met or exceeded the standard on the Smarter Balanced Summative Assessment plus the total number of students who met the standard on the CAAs divided by the total number of students who participated in both assessments. Double dashes (--) appear in the table when the number of students is ten or less, either because the number of students in this category is too small for statistical accuracy or to protect student privacy. Note: The number of students tested includes all students who participated in the test whether they received a score or not; however, the number of students tested is not the number that was used to calculate the achievement level percentages. The achievement level percentages are calculated using only students who received scores.
Page 10 of 27
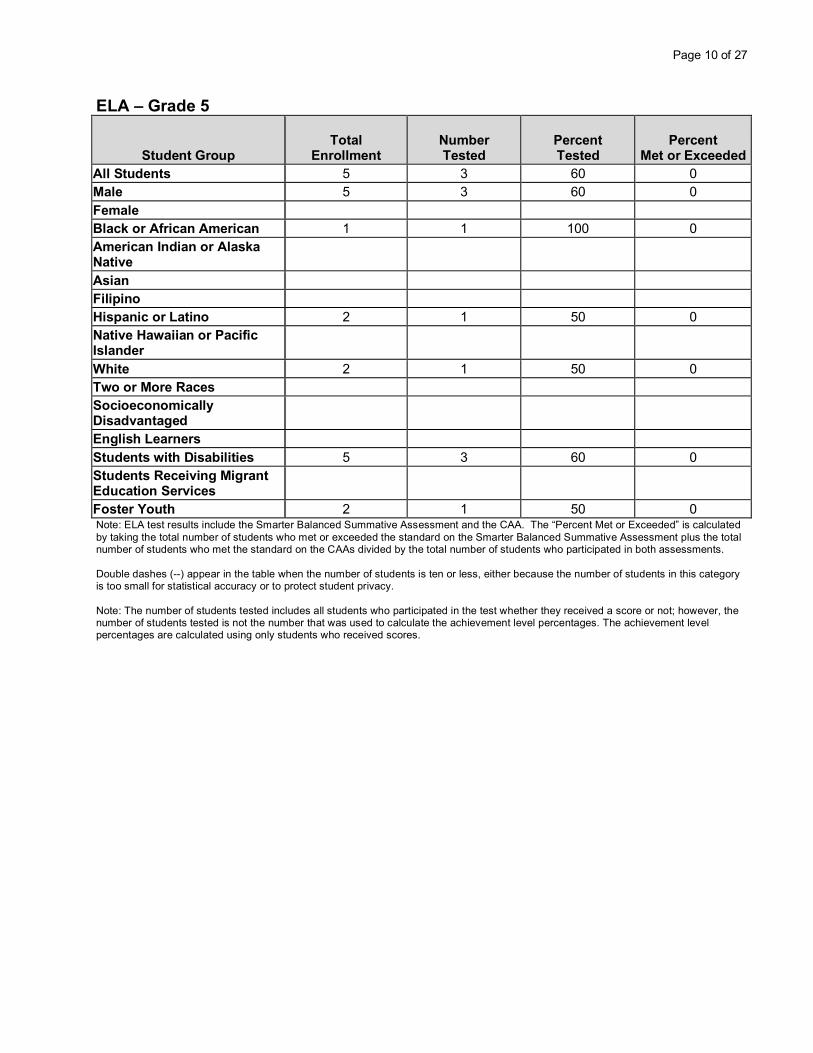
ELA – Grade 5
Student Group
Total
Enrollment Number Tested
Percent Tested
Percent Met or Exceeded
All Students 5 3 60 0 Male 5 3 60 0 Female Black or African American 1 1 100 0 American Indian or Alaska Native
Asian Filipino Hispanic or Latino 2 1 50 0 Native Hawaiian or Pacific Islander
White 2 1 50 0 Two or More Races Socioeconomically Disadvantaged
English Learners Students with Disabilities 5 3 60 0 Students Receiving Migrant Education Services
Foster Youth 2 1 50 0 Note: ELA test results include the Smarter Balanced Summative Assessment and the CAA. The “Percent Met or Exceeded” is calculated by taking the total number of students who met or exceeded the standard on the Smarter Balanced Summative Assessment plus the total number of students who met the standard on the CAAs divided by the total number of students who participated in both assessments. Double dashes (--) appear in the table when the number of students is ten or less, either because the number of students in this category is too small for statistical accuracy or to protect student privacy. Note: The number of students tested includes all students who participated in the test whether they received a score or not; however, the number of students tested is not the number that was used to calculate the achievement level percentages. The achievement level percentages are calculated using only students who received scores.

Page 11 of 27
ELA – Grade 6
Student Group
Total
Enrollment Number Tested
Percent Tested
Percent Met or Exceeded
All Students 5 3 60 0 Male 5 3 60 0 Female Black or African American 1 0 0 0 American Indian or Alaska Native
Asian Filipino Hispanic or Latino 2 2 100 0 Native Hawaiian or Pacific Islander
White 2 1 50 0 Two or More Races Socioeconomically Disadvantaged
English Learners Students with Disabilities 5 3 60 0 Students Receiving Migrant Education Services
Foster Youth 0 0 0 0 Note: ELA test results include the Smarter Balanced Summative Assessment and the CAA. The “Percent Met or Exceeded” is calculated by taking the total number of students who met or exceeded the standard on the Smarter Balanced Summative Assessment plus the total number of students who met the standard on the CAAs divided by the total number of students who participated in both assessments. Double dashes (--) appear in the table when the number of students is ten or less, either because the number of students in this category is too small for statistical accuracy or to protect student privacy. Note: The number of students tested includes all students who participated in the test whether they received a score or not; however, the number of students tested is not the number that was used to calculate the achievement level percentages. The achievement level percentages are calculated using only students who received scores.

Page 12 of 27
ELA – Grade 7
Student Group
Total
Enrollment Number Tested
Percent Tested
Percent Met or Exceeded
All Students 4 2 50 0 Male 4 2 50 0 Female Black or African American 1 0 0 0 American Indian or Alaska Native
Asian Filipino Hispanic or Latino 1 1 100 0 Native Hawaiian or Pacific Islander
White 2 1 50 0 Two or More Races Socioeconomically Disadvantaged
English Learners Students with Disabilities 4 2 50 0 Students Receiving Migrant Education Services
Foster Youth 1 1 100 0 Note: ELA test results include the Smarter Balanced Summative Assessment and the CAA. The “Percent Met or Exceeded” is calculated by taking the total number of students who met or exceeded the standard on the Smarter Balanced Summative Assessment plus the total number of students who met the standard on the CAAs divided by the total number of students who participated in both assessments. Double dashes (--) appear in the table when the number of students is ten or less, either because the number of students in this category is too small for statistical accuracy or to protect student privacy. Note: The number of students tested includes all students who participated in the test whether they received a score or not; however, the number of students tested is not the number that was used to calculate the achievement level percentages. The achievement level percentages are calculated using only students who received scores.

Page 13 of 27
ELA – Grade 8
Student Group
Total
Enrollment Number Tested
Percent Tested
Percent Met or Exceeded
All Students 8 4 50 0 Male 8 4 50 0 Female Black or African American 2 1 50 0 American Indian or Alaska Native
Asian Filipino Hispanic or Latino 3 1 33 0 Native Hawaiian or Pacific Islander
White 3 2 66 0 Two or More Races Socioeconomically Disadvantaged
English Learners Students with Disabilities 8 4 50 0 Students Receiving Migrant Education Services
Foster Youth 3 2 66 0 Note: ELA test results include the Smarter Balanced Summative Assessment and the CAA. The “Percent Met or Exceeded” is calculated by taking the total number of students who met or exceeded the standard on the Smarter Balanced Summative Assessment plus the total number of students who met the standard on the CAAs divided by the total number of students who participated in both assessments. Double dashes (--) appear in the table when the number of students is ten or less, either because the number of students in this category is too small for statistical accuracy or to protect student privacy. Note: The number of students tested includes all students who participated in the test whether they received a score or not; however, the number of students tested is not the number that was used to calculate the achievement level percentages. The achievement level percentages are calculated using only students who received scores.

Page 14 of 27
ELA – Grade 11
Student Group
Total
Enrollment Number Tested
Percent Tested
Percent Met or Exceeded
All Students 1 1 100 0 Male 1 1 100 0 Female Black or African American American Indian or Alaska Native
Asian Filipino Hispanic or Latino Native Hawaiian or Pacific Islander
White 1 1 100 0 Two or More Races Socioeconomically Disadvantaged
English Learners Students with Disabilities 1 1 100 0 Students Receiving Migrant Education Services
Foster Youth 1 1 100 0 Note: ELA test results include the Smarter Balanced Summative Assessment and the CAA. The “Percent Met or Exceeded” is calculated by taking the total number of students who met or exceeded the standard on the Smarter Balanced Summative Assessment plus the total number of students who met the standard on the CAAs divided by the total number of students who participated in both assessments. Double dashes (--) appear in the table when the number of students is ten or less, either because the number of students in this category is too small for statistical accuracy or to protect student privacy. Note: The number of students tested includes all students who participated in the test whether they received a score or not; however, the number of students tested is not the number that was used to calculate the achievement level percentages. The achievement level percentages are calculated using only students who received scores.
Page 15 of 27
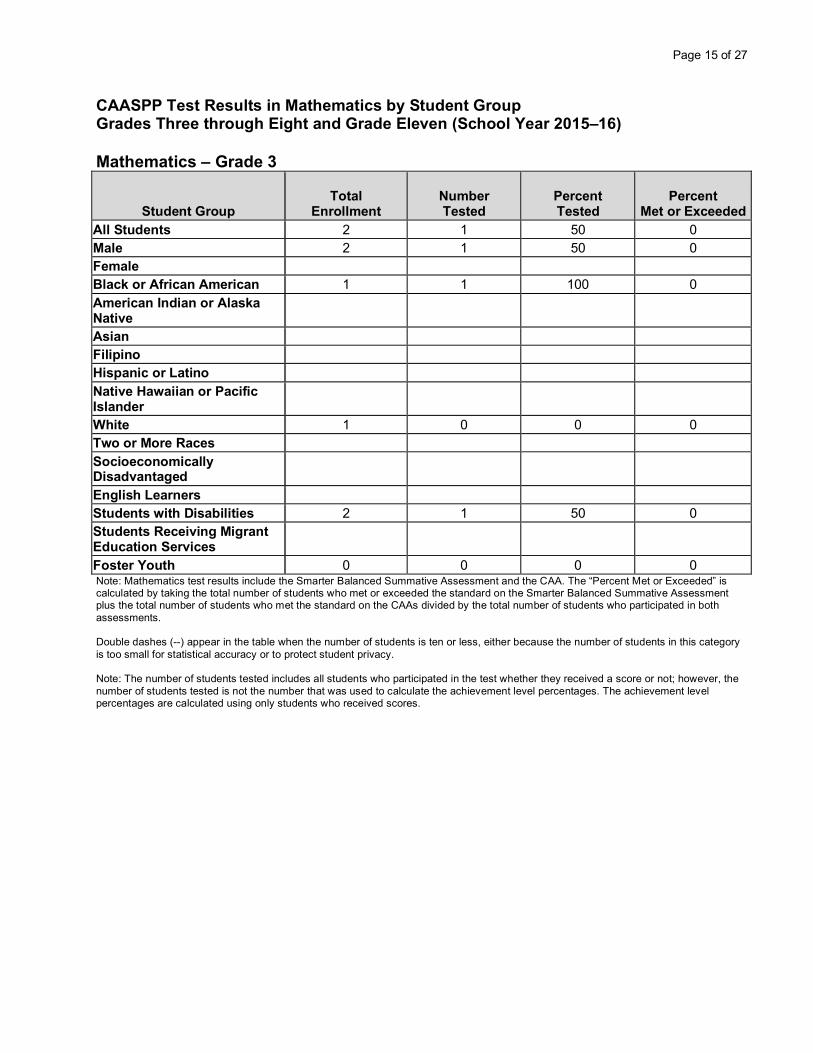
CAASPP Test Results in Mathematics by Student Group Grades Three through Eight and Grade Eleven (School Year 2015–16) Mathematics – Grade 3
Student Group
Total
Enrollment Number Tested
Percent Tested
Percent Met or Exceeded
All Students 2 1 50 0 Male 2 1 50 0 Female Black or African American 1 1 100 0 American Indian or Alaska Native
Asian Filipino Hispanic or Latino Native Hawaiian or Pacific Islander
White 1 0 0 0 Two or More Races Socioeconomically Disadvantaged
English Learners Students with Disabilities 2 1 50 0 Students Receiving Migrant Education Services
Foster Youth 0 0 0 0 Note: Mathematics test results include the Smarter Balanced Summative Assessment and the CAA. The “Percent Met or Exceeded” is calculated by taking the total number of students who met or exceeded the standard on the Smarter Balanced Summative Assessment plus the total number of students who met the standard on the CAAs divided by the total number of students who participated in both assessments. Double dashes (--) appear in the table when the number of students is ten or less, either because the number of students in this category is too small for statistical accuracy or to protect student privacy. Note: The number of students tested includes all students who participated in the test whether they received a score or not; however, the number of students tested is not the number that was used to calculate the achievement level percentages. The achievement level percentages are calculated using only students who received scores.

Page 16 of 27
Mathematics – Grade 4
Student Group
Total
Enrollment Number Tested
Percent Tested
Percent Met or Exceeded
All Students 4 3 75 0 Male 4 3 75 0 Female Black or African American American Indian or Alaska Native
Asian Filipino Hispanic or Latino Native Hawaiian or Pacific Islander
White 4 3 75 0 Two or More Races Socioeconomically Disadvantaged
English Learners Students with Disabilities 4 3 75 0 Students Receiving Migrant Education Services
Foster Youth 0 0 0 0 Note: Mathematics test results include the Smarter Balanced Summative Assessment and the CAA. The “Percent Met or Exceeded” is calculated by taking the total number of students who met or exceeded the standard on the Smarter Balanced Summative Assessment plus the total number of students who met the standard on the CAAs divided by the total number of students who participated in both assessments. Double dashes (--) appear in the table when the number of students is ten or less, either because the number of students in this category is too small for statistical accuracy or to protect student privacy. Note: The number of students tested includes all students who participated in the test whether they received a score or not; however, the number of students tested is not the number that was used to calculate the achievement level percentages. The achievement level percentages are calculated using only students who received scores.

Page 17 of 27
Mathematics – Grade 5
Student Group
Total
Enrollment Number Tested
Percent Tested
Percent Met or Exceeded
All Students 5 3 60 0 Male 5 3 60 0 Female Black or African American 1 1 100 0 American Indian or Alaska Native
Asian Filipino Hispanic or Latino 2 1 50 0 Native Hawaiian or Pacific Islander
White 2 1 50 0 Two or More Races Socioeconomically Disadvantaged
English Learners Students with Disabilities 5 3 60 0 Students Receiving Migrant Education Services
Foster Youth 2 1 50 0 Note: Mathematics test results include the Smarter Balanced Summative Assessment and the CAA. The “Percent Met or Exceeded” is calculated by taking the total number of students who met or exceeded the standard on the Smarter Balanced Summative Assessment plus the total number of students who met the standard on the CAAs divided by the total number of students who participated in both assessments. Double dashes (--) appear in the table when the number of students is ten or less, either because the number of students in this category is too small for statistical accuracy or to protect student privacy. Note: The number of students tested includes all students who participated in the test whether they received a score or not; however, the number of students tested is not the number that was used to calculate the achievement level percentages. The achievement level percentages are calculated using only students who received scores.

Page 18 of 27
Mathematics – Grade 6
Student Group
Total
Enrollment Number Tested
Percent Tested
Percent Met or Exceeded
All Students 5 3 60 0 Male 5 3 60 0 Female Black or African American 1 0 0 0 American Indian or Alaska Native
Asian Filipino Hispanic or Latino 2 2 100 0 Native Hawaiian or Pacific Islander
White 2 1 50 0 Two or More Races Socioeconomically Disadvantaged
English Learners Students with Disabilities 5 3 60 0 Students Receiving Migrant Education Services
Foster Youth 0 0 0 0 Note: Mathematics test results include the Smarter Balanced Summative Assessment and the CAA. The “Percent Met or Exceeded” is calculated by taking the total number of students who met or exceeded the standard on the Smarter Balanced Summative Assessment plus the total number of students who met the standard on the CAAs divided by the total number of students who participated in both assessments. Double dashes (--) appear in the table when the number of students is ten or less, either because the number of students in this category is too small for statistical accuracy or to protect student privacy. Note: The number of students tested includes all students who participated in the test whether they received a score or not; however, the number of students tested is not the number that was used to calculate the achievement level percentages. The achievement level percentages are calculated using only students who received scores.

Page 19 of 27
Mathematics – Grade 7
Student Group
Total
Enrollment Number Tested
Percent Tested
Percent Met or Exceeded
All Students 4 2 50 0 Male 4 2 50 0 Female Black or African American 1 0 0 0 American Indian or Alaska Native
Asian Filipino Hispanic or Latino 1 1 100 0 Native Hawaiian or Pacific Islander
White 2 1 50 0 Two or More Races Socioeconomically Disadvantaged
English Learners Students with Disabilities 4 2 50 0 Students Receiving Migrant Education Services
Foster Youth 1 1 100 0 Note: Mathematics test results include the Smarter Balanced Summative Assessment and the CAA. The “Percent Met or Exceeded” is calculated by taking the total number of students who met or exceeded the standard on the Smarter Balanced Summative Assessment plus the total number of students who met the standard on the CAAs divided by the total number of students who participated in both assessments. Double dashes (--) appear in the table when the number of students is ten or less, either because the number of students in this category is too small for statistical accuracy or to protect student privacy. Note: The number of students tested includes all students who participated in the test whether they received a score or not; however, the number of students tested is not the number that was used to calculate the achievement level percentages. The achievement level percentages are calculated using only students who received scores.
Page 20 of 27
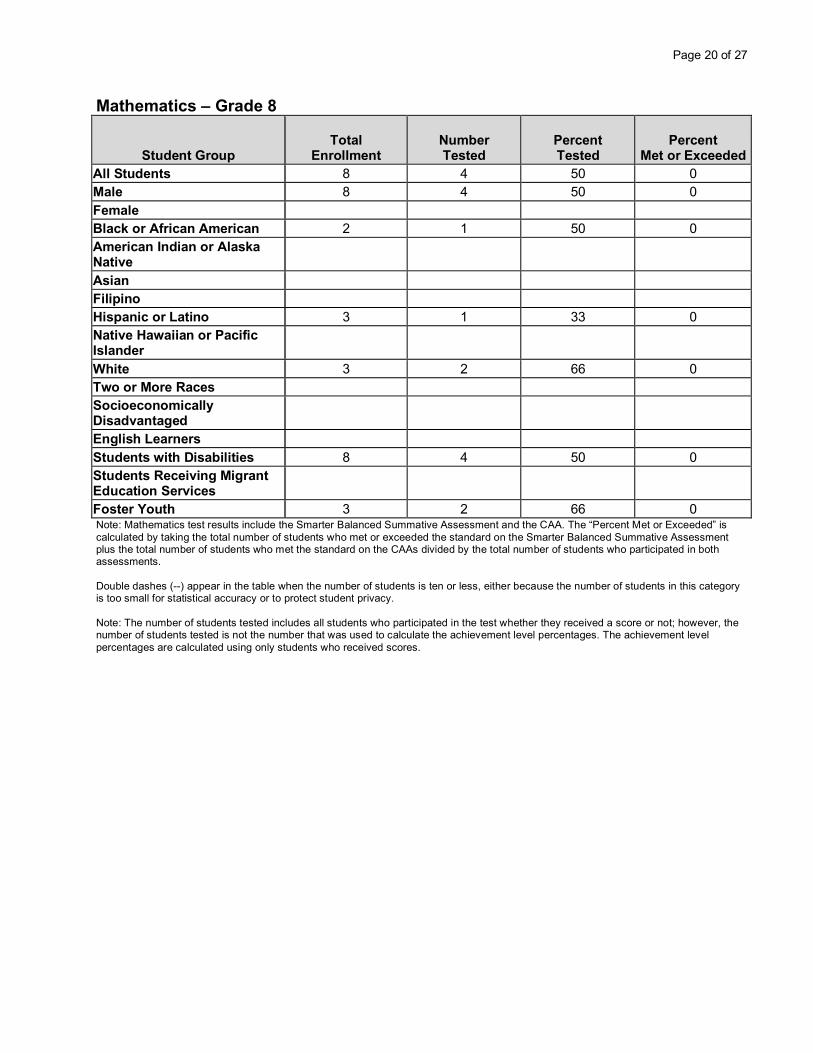
Mathematics – Grade 8
Student Group
Total
Enrollment Number Tested
Percent Tested
Percent Met or Exceeded
All Students 8 4 50 0 Male 8 4 50 0 Female Black or African American 2 1 50 0 American Indian or Alaska Native
Asian Filipino Hispanic or Latino 3 1 33 0 Native Hawaiian or Pacific Islander
White 3 2 66 0 Two or More Races Socioeconomically Disadvantaged
English Learners Students with Disabilities 8 4 50 0 Students Receiving Migrant Education Services
Foster Youth 3 2 66 0 Note: Mathematics test results include the Smarter Balanced Summative Assessment and the CAA. The “Percent Met or Exceeded” is calculated by taking the total number of students who met or exceeded the standard on the Smarter Balanced Summative Assessment plus the total number of students who met the standard on the CAAs divided by the total number of students who participated in both assessments. Double dashes (--) appear in the table when the number of students is ten or less, either because the number of students in this category is too small for statistical accuracy or to protect student privacy. Note: The number of students tested includes all students who participated in the test whether they received a score or not; however, the number of students tested is not the number that was used to calculate the achievement level percentages. The achievement level percentages are calculated using only students who received scores.

Page 21 of 27
Mathematics – Grade 11
Student Group
Total
Enrollment Number Tested
Percent Tested
Percent Met or Exceeded
All Students 1 1 100 0 Male 1 1 100 0 Female Black or African American American Indian or Alaska Native
Asian Filipino Hispanic or Latino Native Hawaiian or Pacific Islander
White 1 1 100 0 Two or More Races Socioeconomically Disadvantaged
English Learners Students with Disabilities 1 1 100 0 Students Receiving Migrant Education Services
Foster Youth 1 1 100 0 Note: Mathematics test results include the Smarter Balanced Summative Assessment and the CAA. The “Percent Met or Exceeded” is calculated by taking the total number of students who met or exceeded the standard on the Smarter Balanced Summative Assessment plus the total number of students who met the standard on the CAAs divided by the total number of students who participated in both assessments. Double dashes (--) appear in the table when the number of students is ten or less, either because the number of students in this category is too small for statistical accuracy or to protect student privacy. Note: The number of students tested includes all students who participated in the test whether they received a score or not; however, the number of students tested is not the number that was used to calculate the achievement level percentages. The achievement level percentages are calculated using only students who received scores.

Page 22 of 27
CAASPP Test Results in Science for All Students
Subject Percentage of Students Scoring at Proficient or Advanced
School District State 2013–14 2014–15 2015–16 2013–14 2014–15 2015–16 2013–14 2014–15 2015–16
Science (grades 5, 8, and 10) 0 0 0 n/a n/a n/a n/a n/a n/a Note: Science test results include California Standards Tests (CSTs), California Modified Assessment (CMA), and California Alternate Performance Assessment (CAPA) in grades five, eight, and ten. Note: Scores are not shown when the number of students tested is ten or less, either because the number of students in this category is too small for statistical accuracy or to protect student privacy. CAASPP Test Results in Science by Student Group Grades Five, Eight, and Ten (School Year 2015–16)
Student Group
Total
Enrollment
Number of Students with
Valid Scores
Percent of Students with
Valid Scores
Percent Proficient
or Advanced All Students 13 0 0 0 Male 13 0 0 0 Female Black or African American 1 0 0 0 American Indian or Alaska Native
Asian 1 0 0 0 Filipino Hispanic or Latino 3 0 0 0 Native Hawaiian or Pacific Islander
White 8 0 0 0 Two or More Races Socioeconomically Disadvantaged
English Learners Students with Disabilities 13 0 0 0 Students Receiving Migrant Education Services
Foster Youth 2 0 0 0 Note: Science test results include CSTs, CMA, and CAPA in grades five, eight, and ten. The “Proficient or Advanced” is calculated by taking the total number of students who scored at Proficient or Advanced on the science assessment divided by the total number of students with valid scores. Note: Scores are not shown when the number of students tested is ten or less, either because the number of students in this category is too small for statistical accuracy or to protect student privacy.
Page 23 of 27
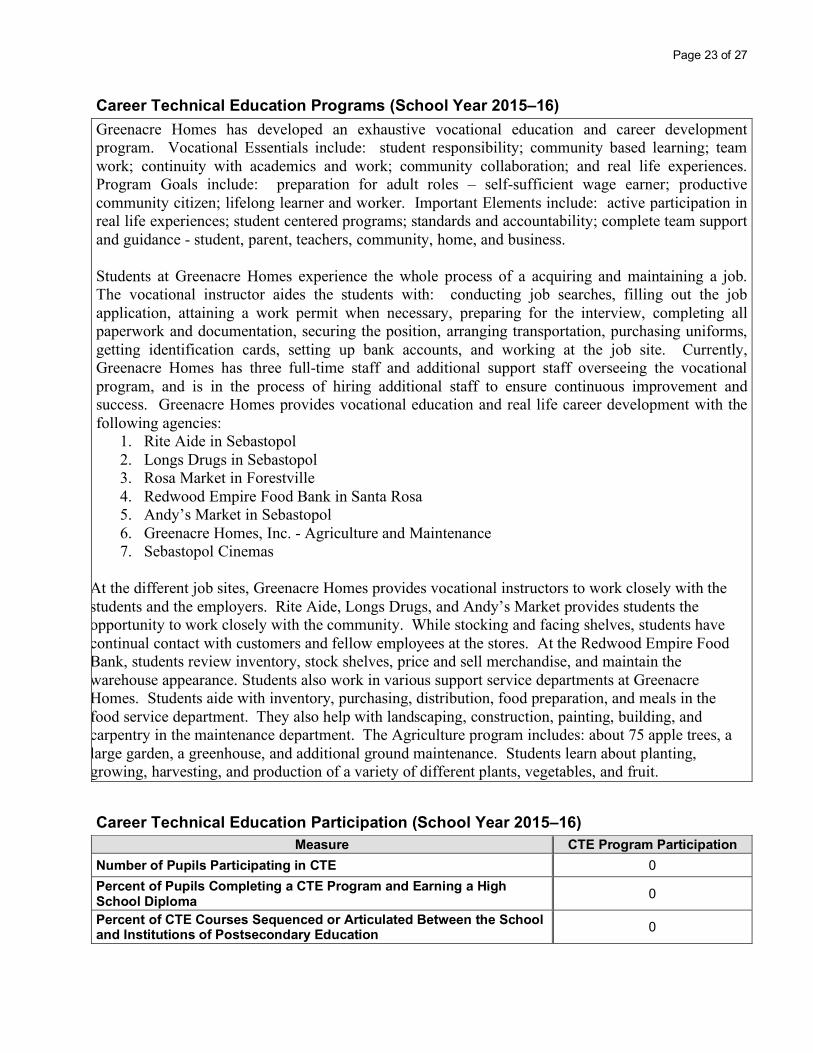
Career Technical Education Programs (School Year 2015–16) Greenacre Homes has developed an exhaustive vocational education and career development program. Vocational Essentials include: student responsibility; community based learning; team work; continuity with academics and work; community collaboration; and real life experiences. Program Goals include: preparation for adult roles – self-sufficient wage earner; productive community citizen; lifelong learner and worker. Important Elements include: active participation in real life experiences; student centered programs; standards and accountability; complete team support and guidance - student, parent, teachers, community, home, and business. Students at Greenacre Homes experience the whole process of a acquiring and maintaining a job. The vocational instructor aides the students with: conducting job searches, filling out the job application, attaining a work permit when necessary, preparing for the interview, completing all paperwork and documentation, securing the position, arranging transportation, purchasing uniforms, getting identification cards, setting up bank accounts, and working at the job site. Currently, Greenacre Homes has three full-time staff and additional support staff overseeing the vocational program, and is in the process of hiring additional staff to ensure continuous improvement and success. Greenacre Homes provides vocational education and real life career development with the following agencies: 1. Rite Aide in Sebastopol 2. Longs Drugs in Sebastopol 3. Rosa Market in Forestville 4. Redwood Empire Food Bank in Santa Rosa 5. Andy’s Market in Sebastopol 6. Greenacre Homes, Inc. - Agriculture and Maintenance 7. Sebastopol Cinemas
At the different job sites, Greenacre Homes provides vocational instructors to work closely with the students and the employers. Rite Aide, Longs Drugs, and Andy’s Market provides students the opportunity to work closely with the community. While stocking and facing shelves, students have continual contact with customers and fellow employees at the stores. At the Redwood Empire Food Bank, students review inventory, stock shelves, price and sell merchandise, and maintain the warehouse appearance. Students also work in various support service departments at Greenacre Homes. Students aide with inventory, purchasing, distribution, food preparation, and meals in the food service department. They also help with landscaping, construction, painting, building, and carpentry in the maintenance department. The Agriculture program includes: about 75 apple trees, a large garden, a greenhouse, and additional ground maintenance. Students learn about planting, growing, harvesting, and production of a variety of different plants, vegetables, and fruit. Career Technical Education Participation (School Year 2015–16)
Measure CTE Program Participation Number of Pupils Participating in CTE 0 Percent of Pupils Completing a CTE Program and Earning a High School Diploma 0 Percent of CTE Courses Sequenced or Articulated Between the School and Institutions of Postsecondary Education 0

Page 24 of 27
Courses for University of California (UC) and/or California State University (CSU) Admission
UC/CSU Course Measure Percent 2015–16 Pupils Enrolled in Courses Required for UC/CSU Admission 0 2014–15 Graduates Who Completed All Courses Required for UC/CSU Admission 0 State Priority: Other Pupil Outcomes The SARC provides the following information relevant to the State priority: Other Pupil Outcomes (Priority 8):
• Pupil outcomes in the subject area of physical education
California Physical Fitness Test Results (School Year 2015–16)
Grade Level Percentage of Students
Meeting Four of Six Fitness Standards
Percentage of Students Meeting Five of Six Fitness Standards
Percentage of Students Meeting Six of Six Fitness Standards
5 n/a 7 33 33 0 9 50 50 0
Note: Percentages are not calculated when the number of students tested is ten or less, either because the number of students in this category is too small for statistical accuracy or to protect student privacy.

Page 25 of 27
C. Engagement State Priority: Parental Involvement The SARC provides the following information relevant to the State priority: Parental Involvement (Priority 3):
• Efforts the school district makes to seek parent input in making decisions for the school district and each schoolsite
Opportunities for Parental Involvement (School Year 2016–17) Greenacres School communicates with the parents on a daily basis and will hold meetings when necessary or requested by the parents. Parents attend annual IEP meetings and are welcome to participate in annual events including: Graduation, Christmas and Holiday Party, Harvest Extravaganza, Talent Shows, and other special events. Summer Camp is offered to all day students and parent involvement is encouraged. State Priority: Pupil Engagement The SARC provides the following information relevant to the State priority: Pupil Engagement (Priority 5):
• High school dropout rates; and
• High school graduation rates Dropout Rate and Graduation Rate (Four-Year Cohort Rate)
Indicator School District State 2012–13 2013–14 2014–15 2012–13 2013–14 2014–15 2012–13 2013–14 2014–15
Dropout Rate n/a n/a n/a n/a n/a n/a n/a n/a n/a Graduation Rate n/a n/a n/a n/a n/a n/a n/a n/a n/a Completion of High School Graduation Requirements – Graduating Class of 2015 (One-Year Rate)
Student Group School District State All Students 0 Black or African American 0 American Indian or Alaska Native 0 Asian 0 Filipino 0 Hispanic or Latino 0 Native Hawaiian or Pacific Islander 0 White 0 Two or More Races 0 Socioeconomically Disadvantaged 0 English Learners 0 Students with Disabilities 0 Foster Youth 0

Page 26 of 27
State Priority: School Climate The SARC provides the following information relevant to the State priority: School Climate (Priority 6):
• Pupil suspension rates;
• Pupil expulsion rates; and
• Other local measures on the sense of safety Suspensions and Expulsions
Rate School District State 2013–14 2014–15 2015–16 2013–14 2014–15 2015–16 2013–14 2014–15 2015–16
Suspensions DPC DPC DPC DPC DPC DPC DPC DPC DPC Expulsions DPC DPC DPC DPC DPC DPC DPC DPC DPC School Safety Plan (School Year 2016–17)Health, Emergency and Fire Plan Each class is supplied with an Emergency Care And Disaster Plan information sheet. This form is posted in a prominent place in the facility. The disaster plan form provides vital emergency information. You should familiarize yourself with the location of the form and the information that it provides, such as. Emergency names and phone numbers: Doctor, Dentist, Police, Fire, Poison control, Crises hotline, Where exits are located within the school, Temporary relocation sites, Utility shut-off points, The location of smoke detectors, The location of the fire alarm and Where to find fire extinguishers The temporary relocation addresses provided are given in case some event occurs that renders the school uninhabitable or hazardous. Your supervisor will make the determination as to whether or not the school is hazardous. Obviously, in the event of fire, flood or explosion this would be the case and the students should be taken to the first facility that is listed. Fire Plan Each classroom has a hard wired smoke detector system as well as a pull station fire alarm. These are not directly connected to the fire department. In the event of a fire, dial 911 or the fire department number listed on the Emergency Care And Disaster Plan. The procedure for fire drills is the same for each classroom. Remove yourself and the students from the classroom as quickly as possible. No one should stop to remove valuables or possessions. The only difference between classrooms would be the meeting place that is established. The meeting place is the basketball court all staff members and students should go in order to be accounted for. Once there, one staff member should be responsible for making a head count of students to insure everyone's safety. D. Other SARC Information The information in this section is required to be in the SARC but is not included in the state priorities for LCFF. Federal Intervention Program (School Year 2016–17)
Indicator School District Program Improvement Status n/a Unknown First Year of Program Improvement n/a Unknown
Page 27 of 27
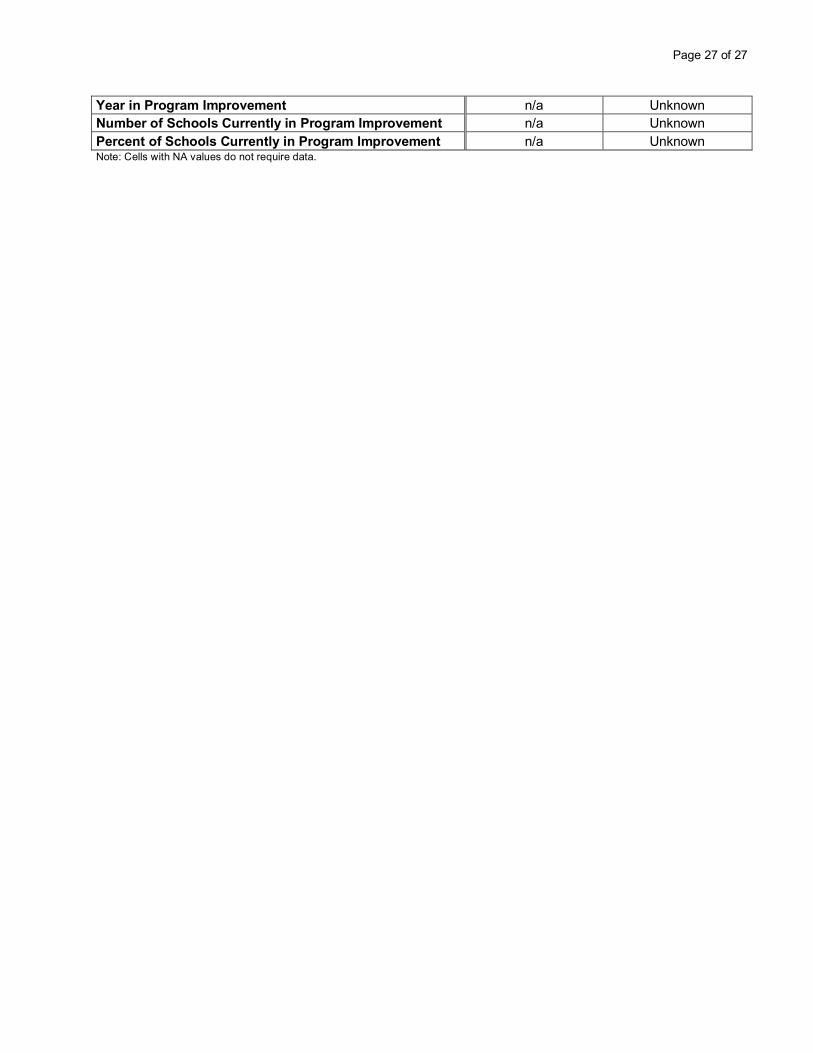
Year in Program Improvement n/a Unknown Number of Schools Currently in Program Improvement n/a Unknown Percent of Schools Currently in Program Improvement n/a Unknown Note: Cells with NA values do not require data.