footwear pref survey sec d gr 2
TRANSCRIPT
8/12/2019 Footwear Pref Survey Sec D Gr 2
http://slidepdf.com/reader/full/footwear-pref-survey-sec-d-gr-2 1/10
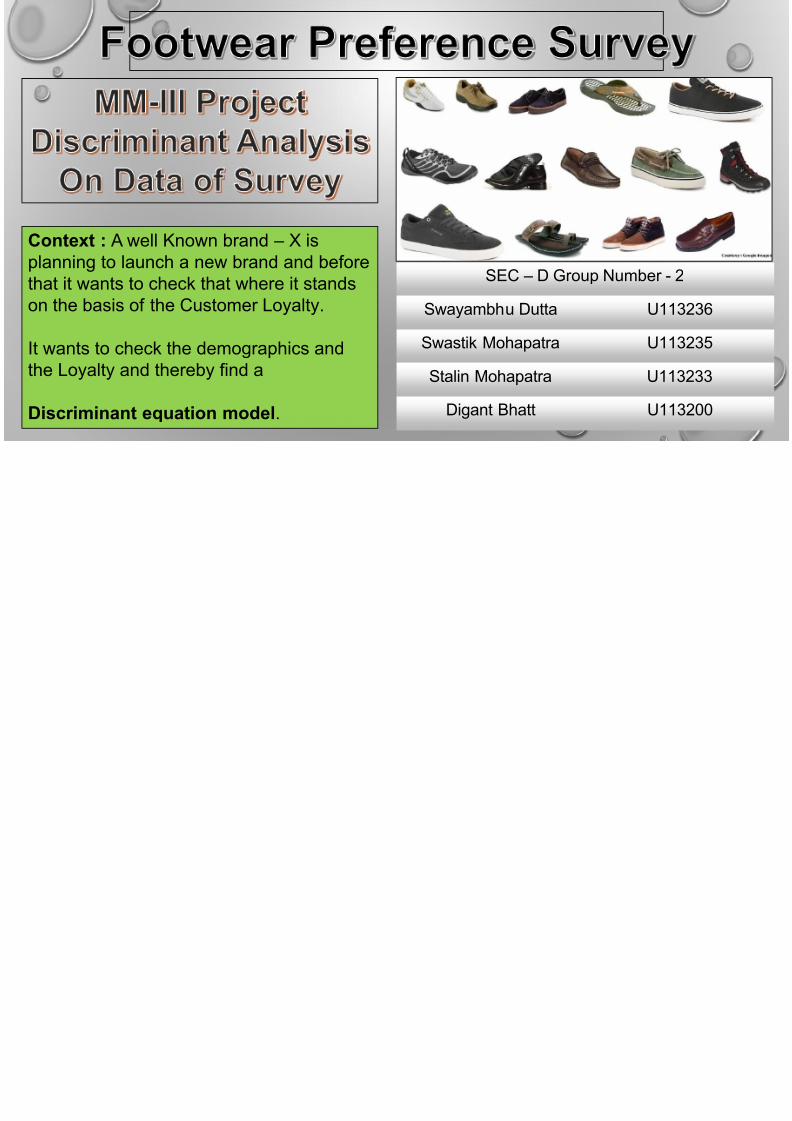
SEC – D Group Numb
Swayambhu Dutta U
Swastik Mohapatra U
Stalin Mohapatra U
Digant Bhatt
Context : A well Known brand – X isplanning to launch a new brand and beforethat it wants to check that where it standson the basis of the Customer Loyalty.
It wants to check the demographics andthe Loyalty and thereby find a
Discriminant equation model .

8/12/2019 Footwear Pref Survey Sec D Gr 2
http://slidepdf.com/reader/full/footwear-pref-survey-sec-d-gr-2 2/10
Male79%
Female21%
Gender Distribution
Male Female
Married26%
Marita
Sing
0
3842
5 20
10
20
30
40
50
Below 16 16-25 26-35 36-45 46 & Above
Age DemographicDistribution
Age Demographic Distribution
17
34
05
101520253035
40
Below 3 L 3L-5L
Annual Inc
Annual
714
35 29
205
10152025303540
Expenditure on Footwears
Expenditure on Footwears
DemographyDiscriminant
AnalysisModel
Accuracy ofthe Model
StatisticalSignificance
BestDiscriminator
DiscriminCriterio

8/12/2019 Footwear Pref Survey Sec D Gr 2
http://slidepdf.com/reader/full/footwear-pref-survey-sec-d-gr-2 3/10
Discriminant Analysis Model : Categorizing the Customers into Loyal or non-Loyal
= + ∗ + ∗ +
StandardiDiscrim
Co
Income
Expenditure
Freq
Variables Meaning
Income Average income
Expenditure Average Purchase perTransaction
Freq Frequency of Purchase in a year
= + ∗ . + ∗ . + ∗
DemographyDiscriminant
AnalysisModel
Accuracy ofthe Model
StatisticalSignificance
BestDiscriminator
DiscriminCriterio

8/12/2019 Footwear Pref Survey Sec D Gr 2
http://slidepdf.com/reader/full/footwear-pref-survey-sec-d-gr-2 4/10
Classification Results a
LoyaltyPredicted Group Membership
1 2
OriginalCount 1 352 1% 1 94.6
2 2.0 9a. 96.6% of original grouped cases correctly classified.
Here Normal Customers (Code = 1) and Loyal Customers (Code = 2)
Customer Types ValuesOriginal Normal Customer(Code = 1) 35+2 = 37
Original Loyal Customer(Code = 2) 1+49= 50
Total Customers 37+50 = 87
Predicted Normal Customers(Code = 1) 35+1= 36
Predicted Loyal Customers(Code = 2) 2+49= 51
Accuracy Ratio =(94.6 % + 98 % )/ 2
= 96.3%
Finding the AccDiscriminant Analy
DemographyDiscriminant
AnalysisModel
Accuracy ofthe Model
StatisticalSignificance
BestDiscriminator
DiscriminCriterio
8/12/2019 Footwear Pref Survey Sec D Gr 2
http://slidepdf.com/reader/full/footwear-pref-survey-sec-d-gr-2 5/10
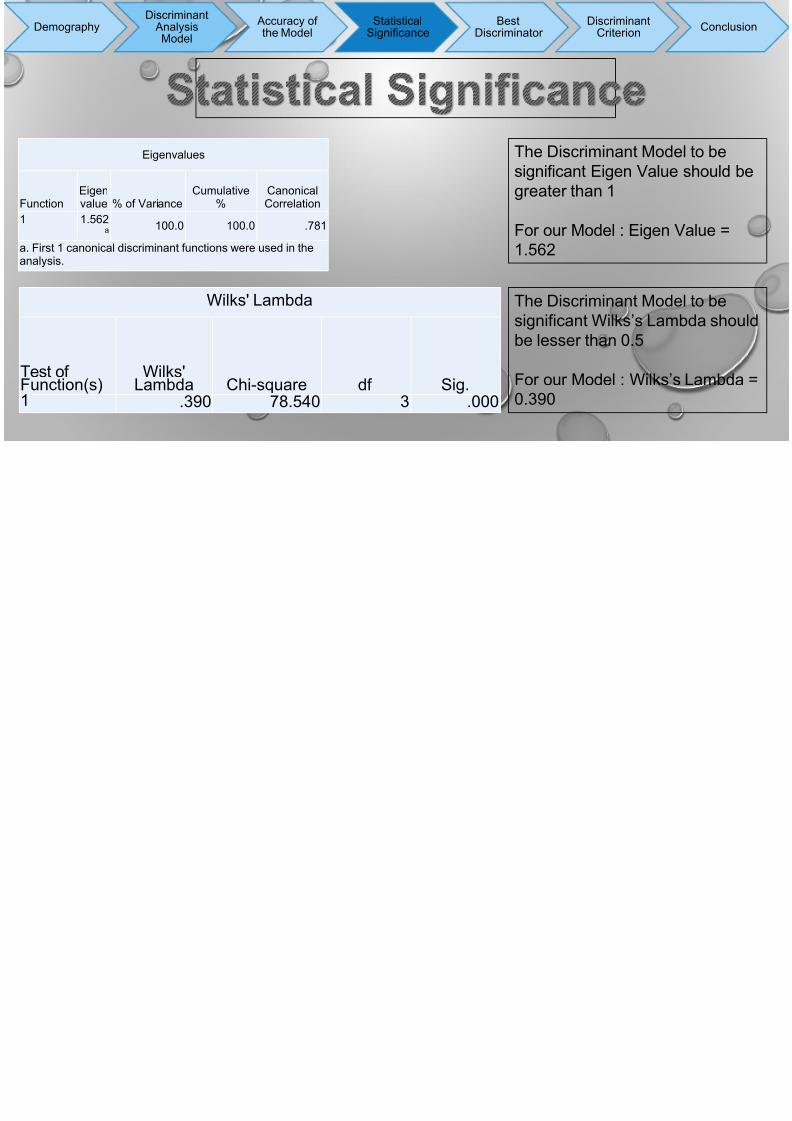
Eigenvalues
FunctionEigenvalue % of Variance
Cumulative%
CanonicalCorrelation
1 1.562a 100.0 100.0 .781
a. First 1 canonical discriminant functions were used in theanalysis.
Wilks' Lambda
Test ofFunction(s)
Wilks'Lambda Chi-square df Sig.
1 .390 78.540 3 .000
The Discriminant Msignificant Eigen Vgreater than 1
For our Model : Eig1.562
The Discriminant Msignificant Wilks’sbe lesser than 0.5
For our Model :0.390
DemographyDiscriminant
AnalysisModel
Accuracy ofthe Model
StatisticalSignificance
BestDiscriminator
DiscriminCriterio
8/12/2019 Footwear Pref Survey Sec D Gr 2
http://slidepdf.com/reader/full/footwear-pref-survey-sec-d-gr-2 6/10
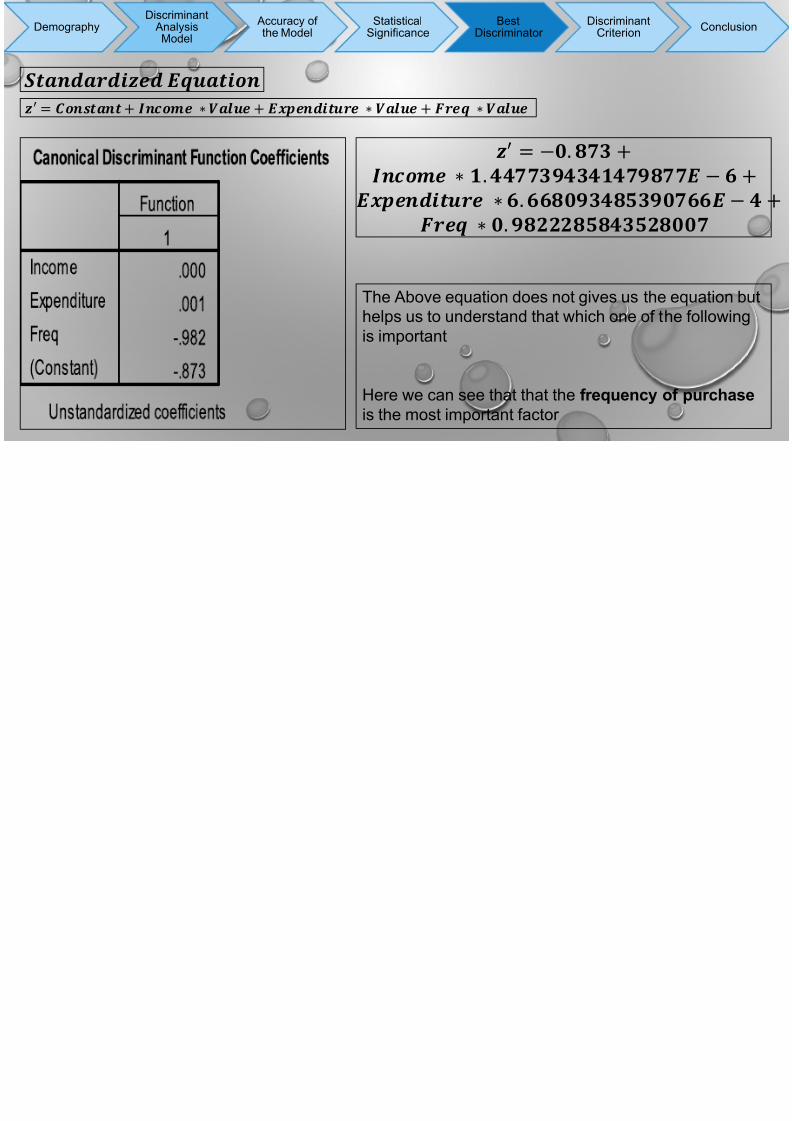
′ = + ∗ + ∗ + ∗
= − . + ∗ .
∗ . ∗ .
The Above equation does not gives us the eqhelps us to understand that which one of theis important
Here we can see that that the frequenc
is the most important factor
DemographyDiscriminant
AnalysisModel
Accuracy ofthe Model
StatisticalSignificance
BestDiscriminator
DiscriminCriterio

8/12/2019 Footwear Pref Survey Sec D Gr 2
http://slidepdf.com/reader/full/footwear-pref-survey-sec-d-gr-2 7/10
Functions at Group Centroids - These are the means ofthe discriminant function scores by group for each functioncalculated. If we calculated the scores of the first function
for each case in our dataset, and then looked at themeans of the scores by group, we would find thatthe Normal Customer group has a mean of 1.436,the Loyal Customer group has a mean of -1.063. Weknow that the function scores have a mean of zero, andwe can check this by looking at the sum of the groupmeans multiplied by the number of cases in each group.
Misfit Data Data Points( Case Number)
Original Normal but will be Loyal 25, 51
Original Loyal but will be Norma 84
DemographyDiscriminant
AnalysisModel
Accuracy ofthe Model
StatisticalSignificance
BestDiscriminator
DiscriminCriterio
8/12/2019 Footwear Pref Survey Sec D Gr 2
http://slidepdf.com/reader/full/footwear-pref-survey-sec-d-gr-2 8/10
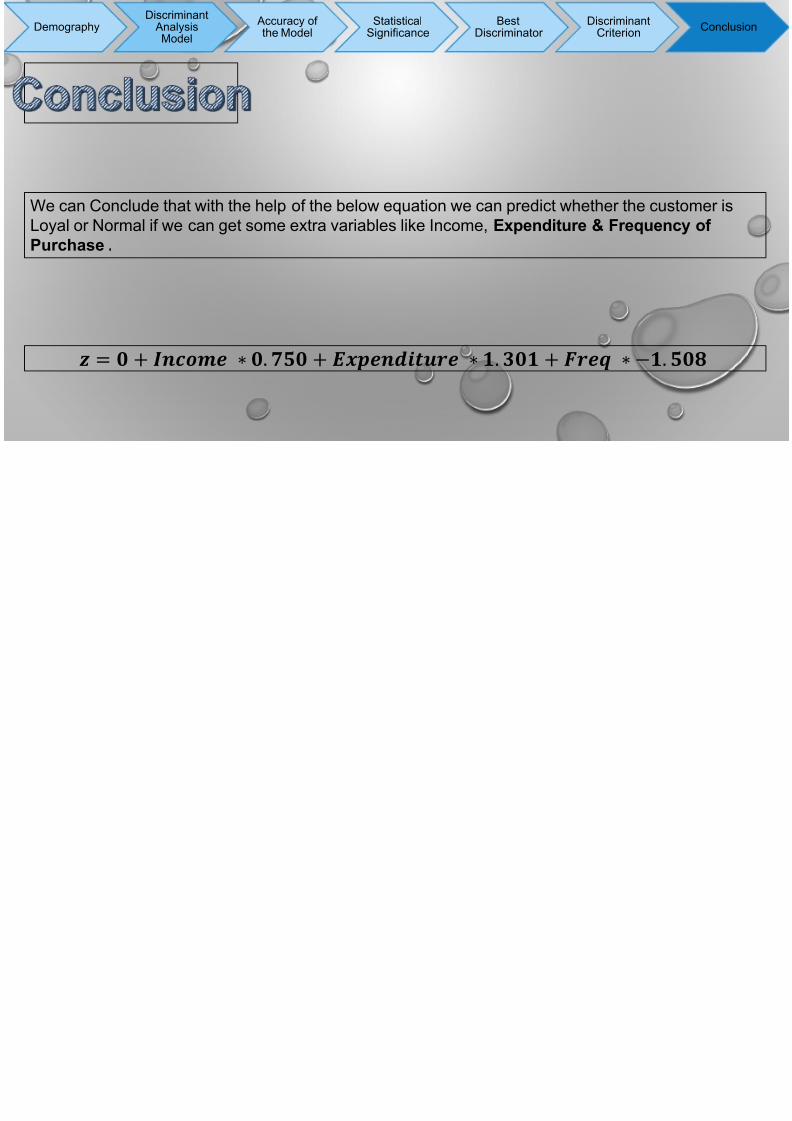
= + ∗ . + ∗ . + ∗
We can Conclude that with the help of the below equation we can predict whether the customer isLoyal or Normal if we can get some extra variables like Income, Expenditure & FrequePurchase .
DemographyDiscriminant
AnalysisModel
Accuracy ofthe Model
StatisticalSignificance
BestDiscriminator
DiscriminCriterio

8/12/2019 Footwear Pref Survey Sec D Gr 2
http://slidepdf.com/reader/full/footwear-pref-survey-sec-d-gr-2 9/10
Data Name Files
Data
Data in SPSS
Output File of SPSS
Word output File of SPSS

8/12/2019 Footwear Pref Survey Sec D Gr 2
http://slidepdf.com/reader/full/footwear-pref-survey-sec-d-gr-2 10/10