footwear industry analysis: nike, inc. and adidas€¦ · web view · 2010-12-04with the recent...
TRANSCRIPT
2010
Andy Johnson
Anna Neugent
BJ Granack
Footwear Industry Analysis: Nike, Inc. and Adidas
Table of Contents
PART I: DESCRIBE TWO PUBLICLY TRADED BUSINESS RIVALS…………………..3
Question 1…………………...……………………………………………………………3
PART II: OPPORTUNITY……………………………………………………………………..4
Question 1…………………………………………………………………………….…..4
Question 2………………………………………………………………………………...5
PART III: INDUSTRY ANALYSIS……………………………………………………………6
Question 1………………………………………………………………………………..6
Question 2………………………………………………………………………………..9
Question 3………………………………………………………………………………..9
Question 4……………………………………………………………………………….11
PART IV: STRENGTH ASSESSMENT……………………………………………………..12
Citations…………………………………………………………………………………………13
2
PART I: DESCRIBE TWO PUBLICLY TRADED BUSINESS RIVALS
1. What two publicly traded business rivals is this paper about? Give their Corporate addresses.
Describe the businesses in which they compete against each other. What industry are these
businesses competing in?
Nike Inc. and Adidas AG are the two largest and arguably well known sportswear companies in the
world. Both companies compete against one another in the numerous industries including the athletic
footwear industry. Nike Inc. is in itself the world’s largest athletic footwear supplier, holding an
astonishing 50% of a 20 billion dollar global industry (S&P, 2010) and 40% of the US market (IBIS,
2010). Nike powers its massive lead on the market with innovative technology and product creation often
bringing all new ideas and offerings to the market before any other. Nike Inc. describes their principle
business activity as “the design, development and worldwide marketing of high quality footwear, apparel,
equipment, and accessory products” Nike earned 2009 revenues of $19,014,000,000, netting
$1,906,700,000 in profits (Nike 10-K, 2010). Nike boasts an extremely lucrative stable of world renowned
endorsers. Those endorsers include Tiger Woods, Michael Jordan, Roger Federer and Kobe Bryant to
name a few. Nike also outfits high profile sports teams such as the U.S. National basketball and soccer
teams, as well as many top tier collegiate programs across the country including Ohio State, USC and
Oregon. In 2012, Nike Inc. will also equip the National Football League (NFL) for all on-field and
officially licensed apparel. Nike’s world headquarters are located at Nike World Headquarters, One
Bowerman Drive, Beaverton, OR 97005.
Nike Inc.’s main competitor and 2nd place occupant is Adidas AG, located in Herzogenaurach, Germany.
Although Adidas falls significantly below Nike in global market share, the US is an entirely different
situation. With the recent acquisition of Reebok, Adidas AG now boasts a 40% share of the US athletic
footwear market and is a direct competitor with rival Nike (IBIS, 2010). In 2009, the Adidas Group
3
earned 10,381,000,000 euro in revenues ($13,656,209,752) (AG Annual, 2010). Primarily, Adidas had
been focused on soccer and other sports that flourished globally. Yet with their increased presence in the
United States, Adidas has launched an all out assault on territories once believed to be untouchable by
anyone other than Nike, namely the basketball market. Adidas holds significant endorsement deals just as
Nike does, with namesakes such as Kareem Abdul-Jabaar, Tyson Gay, Jim Furyk and Dwight Howard.
Adidas also is the exclusive outfitter of the NBA, as well as numerous collegiate programs such as
Michigan, NC State, and UCLA.
PART II: OPPORTUNITY
1. Define or describe the industry that these businesses compete in.
As stated, both Nike Inc. and Adidas AG have many facets to their businesses, and compete in several
industries. The athletic footwear industry is the marquee industry in which most athletic companies are
judged, and is the topic of this discussion. In the United States, sports are a way of life. Whether it is for
fashion, sport, or leisure, the athletic footwear industry in the United States is a significant industry, with
2009 sales reaching $27.4 billion (S&P, 2010). As lucrative as the business has been for a companies
such as Nike or Adidas, the tightening economy has played a role in the faltering performance of the
industry. As previously mentioned, $27.4 billion was earned in 2009, which was a drop in percentage
from 2008 figures. Over the past 5 years, industry sales revenues have decreased on an average annual
rate of 0.3% (IBIS, 2010). In the future, it will be imperative for both Nike and Adidas to develop strong
branding and desirability to appeal to the U.S. market. Nike must plan for a head on competitive battle
against Adidas and their emergence as a power in the U.S., as the business has become much more
competitive than before. The footwear industry is like a chess match, in which each decision is critical to
the immediate future of a company. For instance, Adidas’ acquisition of Reebok has proven to be
extremely valuable in garnishing a huge share of the female athletic footwear market. So much so that
Nike has refused to even enter into the women’s toning market, occupied heavily by Reebok’s Easy -
4
Tone brand and rival Sketchers. In 2009 alone, Reebok “more than doubled” its share of the female
athletic shoe market to 6.7%, in large part due to the emergence of the toning footwear market. Coupled
with Sketchers brand tripling its share to 17%, Nike lost over 7% of its market leading 31% share
(Townsend, 2010).
According to 2009 numbers, the US footwear manufacturing industry is on the steady decline, projected
to decrease at an average of 5.2% annually. Coupled with the surprising fact that over 90% of footwear
sold in the US is sourced from foreign manufacturers, the industry truly has “one foot in the grave” (IBIS,
2010). With increased competition and rising prices in the U.S., it comes as no surprise that both Nike
and Adidas have moved overseas in search of both market growth opportunities and lower production
costs.
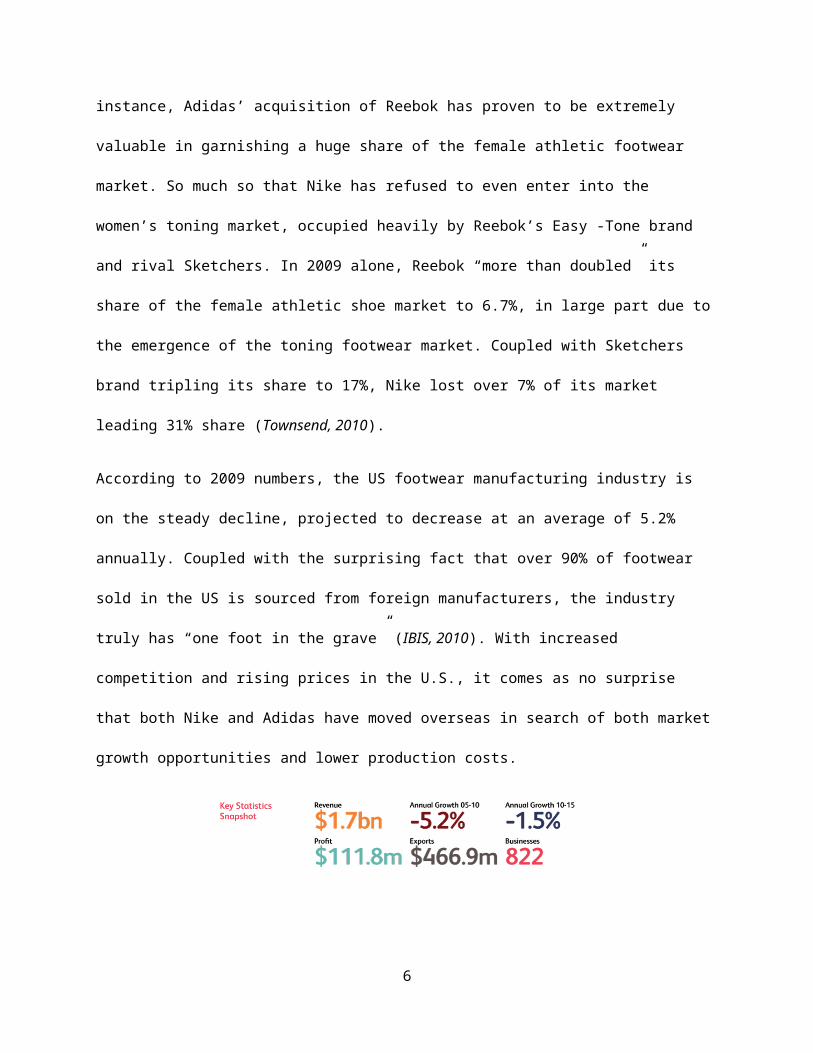
Listed above are 2009 figures, courtesy of IBISWorld, that depict the steady decline of the US athletic
footwear manufacturing industry.
This increased competition has also positioned the two companies to compete in an area traditionally
dominated by Adidas: soccer. As the 2010 South Africa World Cup sponsor, Adidas has enjoyed a firm
grasp of the market. However Nike has made a push in the segment, even making an attempt to sponsor
the German national team during the 2010 World Cup. However Adidas CEO Herbert Hainer
immediately doubled their existing offer with the Germans, whom they had sponsored since 1954, stating
that “soccer is, of course, the heart and soul of our company” (Townsend/Holger, 2010).
2. In the industry as you defined it, which geographic area is there currently the largest amount of
demand? How large is the amount of demand in this geographic area? How fast is demand
growing in this geographic area?
5
Currently, the North American market produces the highest demand for athletic footwear. At the end of
August, Nike had increased its North American market share by almost $1 billion, an increase of 8% over
quarter 2 figures. Nike complemented their North American success with gains in China, rising 11% to
$460 million (Townsend/Fenner, 2010). Adidas, who has emerged as a major player in the North
American market, reported Q2 to Q3 growth of 14% in North America and 9% in China, besting rival
Nike in its home country for only the 2nd time (Adidas Q3, 2010). Adidas group CEO Hainer echoed the
importance of the Chinese market, as well as the attempt by Adidas to directly compete in North America
with Nike in his statement, saying “I am pleased to report that the third quarter met our high expectations.
Double-digit revenue growth in football, Adidas Sport Style and Reebok year-to-date, as well as a
resumption of growth in Greater China in the third quarter all reflect a well executed 2010 strategy.”
PART III: INDUSTRY ANALYSIS
1. Do a “5-forces” Analysis for the industry you identified above. For each force, state its power
magnitude as either High, Moderate, or Low; and explain why you assigned it that magnitude of
power using the most current facts available from required sources.
With the Footwear Manufacturing dwindling in the US, buyers are beginning to gain more and more
power. Because of this, the threat of buyers is classified as high. This added power does come with a
cost though. The number of US wholesalers will drop to 1,325 in 2015 due to cheaper imports and labor
continuing to be ship overseas (IBISWorld). In 2010, footwear wholesalers made up 36.1% of the market
for manufacturers (IBISWorld). This number is expected to decline as footwear retailers also begin to
gain power. Wholesaler margins have decreased due to retailers sourcing directly from the manufacturer
(Driscoll). Fewer wholesaler buyers with diminishing profit margins mean each wholesaler is very
important to the manufacturer. Established wholesalers are acquiring increasingly larger market shares
due to smaller companies being forced out of business, thus their contracts with manufactures are
instrumental in keeping the manufacturer in business. Another reason why wholesaler contracts are
important is because the wholesale market is declining as well. This leaves a concentrated group of
6
wholesale companies who are vital to obtaining a sustainable competitive advantage. Even though the
US Footwear Retailers market segment is gaining market share on the wholesale segment, it is also
feeling the effects of off shoring. Retailers only account for 31.6% of the market (IBISWorld). These
difficult conditions have forced many retailers out of business. Enterprise numbers have fallen from
10,985 in 2005 to 10,415 in 2010 (IBISWorld). This is pushing the retail market in the same direction as
the wholesale market. Manufacturers will begin to rely more heavily on the established retailers who can
provide them enough business to maintain their own market share within the footwear manufacturing
industry. Without these wholesale and retail buyers, the manufacturer would lose a substantial amount of
profit and ultimately be forced out of business by competitors who are stronger in key success factors.
Rivalry is a high-power threat in the Footwear Manufacturing industry. This is partly due to a
diminishing US Footwear Manufacturing industry and the increase in buyer power. IBISWorld forecasts
industry revenue will decline at a five-year annual rate of 1.5% to $1.6 billion by 2015 (IBISWorld). Less
revenue and the shift of the power to the buyers makes each buyer more and more important to a
manufacturer. Also, with their increase in power, buyers are able place orders infrequently which
increases the threat of rivalry. To further the threat of rivalry, there are many competitors that are roughly
the same size. Nike, Adidas AG, and The Timberland Company are 3 of the largest footwear
manufacturers (IBISWorld). The threat of rivalry is even more prevalent in offshore manufacturing. The
opportunity for low cost labor has driven many manufacturers to transplant operations abroad. Because
of this you have these large companies such as Nike and Adidas competing for resources in the same
regions. Some companies, like Nike, are posting revenue declines even with these opportunities for low-
cost labor. Nike's revenues dropped to $19.0 billion at the end of the 2010 fiscal year (Nike).
Substitutes were classified as a high power threat. When determining power magnitude of Substitutes, it
is important to distinguish the difference between the US Footwear Manufacturing industry and US
companies that have their footwear manufactured overseas. The US Footwear Manufacturing industry
encompasses companies that manufacture shoes within the borders of the United States. Due to the trend
7
of outsourcing and the declining US Footwear Manufacturing industry, the threat of substitutes is
classified as “High”. Even if a US company was created and instituting a low cost leadership strategy, it
would not be able to compete in the cost of doing business when compared to a company that has
outsourced their manufacturing. Wholesalers and retailers are much more likely to purchase footwear
from manufacturing industries in Asia, where Adidas does 97% of its total footwear production, or in
Vietnam, where Nike does 37% of its manufacturing, because it is cheaper (IBISWorld). The US
footwear consumer market continues to thrive off of imported shoes. China remains the single largest
importer of footwear into the United States, accounting for 76.3% of total imports, an estimated $14.7
billion in 2010 (IBISWorld). If a company that is currently manufacturing in the United States is
unwilling to outsource its labor, it will not be able to compete with the larger companies such as Nike and
Adidas on a price based strategy.
Due to the various geographic locations that are typically associated with outsourcing manufacturing and
their abundance of resources, the threat of suppliers was given a moderate power-level. While Adidas
produces 97% of their total production in Asia, most of this comes from China. This has forced
companies such as Nike to look for other suppliers and have spread out their manufacturing to Vietnam,
Thailand, and Indonesia (IBISWorld). The vast majority of these suppliers are not capable of forward
integration and look to manufacturing companies to purchase their supplies. With the increase in demand
for low-cost labor, came an increase in the amount of suppliers. There is not, however, a surplus in
supplies as larger companies seek to engage in contracts with these companies as soon as possible
(Driscoll).
Currently, the US Footwear Manufacturing industry is not a very attractive option for new entrants.
Because of this, the threat of entry has been classified as low-to-moderate. Imports continue to infiltrate
the industry, growing at an average rate of 2.5% annually and satisfying nearly 95.0% of domestic
demand by 2015. This will force participants out of the industry at an average annual rate of 1.5% to 662
companies in 2015 (1). This is a result of weak domestic demand and strong price competition from low-
8
cost importers. Companies have not been able to sustain profits or operations, sending the industry into a
state of decline (4). The future does not look promising either. IBISWorld forecasts imports to grow at
an annual rate of 2.5% to $21.8 billion from 2010 to 2015 (5). In order to enter the US Footwear
Manufacturing industry, a company would have to identify a niche market and focus their efforts on
that. One benefit to the Footwear Manufacturing industry is that the start-up investment requirement is
relatively low. Footwear manufacturers operating within this industry use approximately 10.6 units of
labor for each unit of capital. A labor-to-capital ratio of 10.6:1 indicates a low level of capital
requirements (6). Also, the level of technological advancement in the Footwear Manufacturing industry
is low. This means machinery turn-over due to innovation is low and thus capital spent in acquiring the
machine is well spent. Even with benefits such as these, the declining US Footwear Manufacturing
industry is not attractive due to the lack of opportunities for profit.
2. Count the LOW-power forces you identified in your 5-forces analysis and use the count to make a
conclusion about whether the expected profitability for the average rival is High, Moderate, or
Low. Briefly explain what that magnitude of profitability means financially.
The footwear industry only has one low-power force, threat of entry. Due to this, the expected
profitability for a company with no unique strengths or weaknesses on key success factors will be less
than the cost of capital. This makes the industry very unattractive to potential businesses. If an average
business was to enter this industry, it would more than likely be forced to cease its operations by a larger,
more established manufacturer.
3. Explain the meaning of the term “Key Success Factor?” List and describe (in words, like a
definition) at least six Key Success Factors that any competitor in this industry must be good at to
be profitable. For each KSF, give a calculation that you can use to measure each rival on it.
9
A Key Success Factor (KSF) is a specific resource or activity a company must be good at in order to be
profitable within an industry. Key Success Factors allow a company to defend against high power threats
to profit and satisfy consumer demand (Young).
Low internal cost is a key success factor that a company must be strong on when competing in the
footwear manufacturing industry. Manufacturing a product at the lowest possible cost is very important
in today's Footwear Manufacturing industry. The outsourcing of manufacturing is very prevalent and
because of this, the US Footwear Manufacturing industry is declining. In order to stay competitive,
manufacturers must lower their internal cost. Low internal cost is determined by looking at cost of good
sold.
Another key success factor is economies of scope. Footwear manufacturing firms that produce a wide
range of footwear products can satisfy various segments of consumer demand. Economies of scope is
important in footwear manufacturing because fixed costs associated with production can be spread across
multiple product lines. This lowers the cost per item and increased profit. Economies of scope is
calculated by dividing the number of product lines by the cost of goods sold.
Economies of Scale are based on achieving a lower cost of production due to an increased amount of
production. Producing footwear items at the lowest marginal cost is an important competitive factor. A
larger amount of production spreads the costs of production over a wider range and thus reduces the cost
of production per product.
G* is calculated by taking (1 minus the dividend payout ratio) multiplied by the Return on Equity. G* is
used to determine the potential growth from a financial standpoint. The higher the G*, the more potential
for growth. If the G* is a negative number, the company will require more financial investment in order
to maintain its current place in the market.
10
Manufacturing Efficiency is calculated by taking the total sales number and dividing them by the cost of
goods sold. In this case, the lower the percentage, the better. Manufacturing efficiency is important
because it gives the company an idea of how much their costs are factored into their sales. If a company
is high in manufacturing efficiency, they can manufacture more products that will meet the demands of
their customers.
The final key success factor is outsourcing a portion of manufacturing. This can be seen by looking at the
total amount of production done within the United States compared to production doneIn order to keep
input costs down, manufacturers must be willing to source their products from low-priced foreign
providers, either by establishing supply contracts with third parties or moving their own facilities
overseas. This is vital for success in the footwear manufacturing industry because approximately 67.7%
of manufacturers business comes from wholesalers and retailers who typically look to purchase the
cheapest product (IBISWorld). By outsourcing some manufacturing, internal costs are kept to a
minimum and the manufacturer can sell their product at a lower price. If a manufacturer does not
outsource, they will not be able to compete and be forced out of business by larger, more integrated
companies.
4. For one KSF you listed, explain how it protects profit from one Hi-Power Threat you listed in
(III.1). If there are no Hi-power threats, then explain for a Moderate-Power threat.
One major key success factor that will protect profit is having low internal cost. Having a low internal
cost allows the manufacturer to be competitive on price. This helps protect profit from the high-power
threat of rivalry. In order to stay competitive in the waning US Footwear Manufacturing industry, a
manufacturer must be able to compete on price. By being strong in having a low internal cost, the
manufacturer can pass these cost savings onto the price of the product and thus charge less to wholesalers
and retailers looking to purchase their footwear.
11
PART IV: STRENGTH ASSESSMENT
Key Success Factor Formula Nike Distinctive Competency Score(Scale of 1-5, 1=Weakest,
5=Strongest)Low Internal Costs Cost of Goods Sold $10,571,700 1Economies of Scope Product Lines/Cost of Goods Sold (33/$10,571,700)=
.000003121
Economies of Scale Costs/Total Assets $10,571,700/$13,249,600=.79788824
1
G-Star (G*) Rating (1-Dividend Payout) * ROE (1-.31963409) * .17101479=.11635263 or 11.635263%
5
Manufacturing Efficiency Sales/Cost of Goods Sold $19,176,100/$10,571,700=1.81390883
5
Willingness to Outsource a % of Manufacturing
Total % of Manufacturing done outside of the US
100% 3
Average 2.66
Key Success Factor Formula Adidas Distinctive Competency Score(Scale of 1-5, 1=Weakest,
5=Strongest)Low Internal Costs Cost of Goods Sold $7,586,255 5Economies of Scope Product Lines/Cost of Goods Sold (27/$7,586,255)=
.000003565
Economies of Scale Costs/Total Assets ($7,586,355/$11,876,525)=.63876892
5
G-Star (G*) Rating (1-Dividend Payout) * ROE [(1-.28000956) * .04854992]=.03495548 or 3.495548%
1
Manufacturing Efficiency Sales/Cost of Goods Sold ($13,891,854.20/$7,586,260)=1.83118216
1
Willingness to Outsource a % of Manufacturing
Total % of Manufacturing done outside of the US
100% 3
Average 3.33
***Based on the strength assessment of the key success factors for both Nike, Inc. and Adidas, Adidas comes out with the higher strength average. This makes Adidas a stronger competitor in comparison to Nike, Inc. based on the Key Success Factors from the Footwear Industry.
12
Citations
Adidas, Group. Adidas Group 9 Months 2010 Results. Adidas AG, 4 Nov. 2010. Web. 1 Dec. 2010.
<http://www.adidas-group.com/en/pressroom/archive/2010/04Nov2010.aspx>.
Adidas Group 2009 Annual Report. Adidas Group, 2010. Web. 1 Dec. 2010. <http://adidas
group.corporate-publications.com/2009/gb/en/adidas-kompakt/financial-highlights.html>.
Adidas Consolidated Balance Sheet. Adidas Group, 2010. Web. 1 Dec. 2010.
<http://adidasgroup.corporate-publications.com/2009/gb/en/consolidated-financial-statements/
consolidated-balance-sheet.html>
Adidas Consolidated Income Statement. Adidas Group, 2010. Web. 1 Dec. 2010. <http://adidas
group.corporate-publications.com/2009/gb/en/consolidated-financial-statements/consolidated-
income-statement.html>
Driscoll, Marie. Apparel & Footwear: Retailers & Brands. Standard & Poor's, 2 Sept. 2010. Web. 2 Dec.
2010. <http://www.netadvantage.standardandpoors.com.www.lib.ncsu.edu:2048/NASApp
/NetAdvantage/showIndustrySurvey.do?code=apf>.
Footwear Manufacturing in the US. IBISWorld, October 2010. Web. 1 Dec. 2010.
<http://www.ibisworld.com.www.lib.ncsu.edu:2048/industryus/default.aspx?indid=369>.
IBIS World U.S. Footwear Manufacturing. IBISWorld, 2010. Web. 1 Dec. 2010.<http://www.
ibisworld.com.www.lib.ncsu.edu:2048/industryus/Majorcompanies.aspx?indid=369>.
Nike, Inc. Form 10-K. United States Securities and Exchange Commission. 20 July 2010. Web. 1 Dec.
2010. <http://secfilings.com/SearchResults.aspx?ticker=NKE>.
Nike Incorporated: Highlights. MSN, 2010. Web. 1 Dec. 2010.<http://moneycentral.msn.com/investor/
invsub/results/hilite.asp?Symbol=US:NKE>
13
Nike/SEC,. United States Securities and Exchange Commission Form 10-K. Nike Inc., 31 May 2010.
Web. 1 Dec. 2010.<http://investing.businessweek.com/research/stocks/financials/drawFiling
.asp?formType=10-K>.
Paula L. Stepankowsky. (2007, September 21). Nike's Net Gets Big Boost From Overseas Markets. Wall
Street Journal (Eastern Edition), p. B.3. Retrieved December 3, 2010, from Wall Street Journal.
(Document ID: 1339233611).
Standard and Poor's Net Advantage. Standard & Poor\'s, 2010. Web. 1 Dec. 2010.
<http://www.netadvantage.standardandpoors.com.www.lib.ncsu.edu:2048/NASApp/NetAdvanta
ge/simpleSearchRun.do?ControlName=HomePageSearch>.
Standard & Poor's Net Advantage. Standard & Poor\'s, 2010. Web. 1 Dec. 2010.
<http://www.netadvantage.standardandpoors.com.www.lib.ncsu.edu:2048/NASApp/
NetAdvantage/simpleSearchRun.do?ControlName=CompaniesSimpleSearch>.
Townsend, Matt. As Nike Scoffs, Toning Shoes Gain Traction. Business Week, 6 June 2010. Web. 1 Dec.
2010.<http://web.ebscohost.com.www.lib.ncsu.edu:2048/ehost/detail?
vid=2&hid=112&sid=2891efef-8823-4e3f
af4933b0f7944408%40sessionmgr113&bdata=JnNpdGU9ZWhvc3QtbGl2ZSZz
Y29 wZT1zaXRl#db=buh&AN=51241985>.
Townsend, Matt, and Holger Elfes "Adidas' Big Boney Defense Against Nike." Bloomberg Businessweek
2/3.4179 (2010): 22. NCSU Libraries. Web. 1 Dec.2010.<http://web.ebscohost.com.www.lib.
ncsu.edu:2048/ehost/detail?vid=6&hid=112&sid=2891efef-8823-4e3f-af49-
33b0f7944408%40sessionmgr113&bdata=JnNpdGU9ZWhvc3QtbGl2ZSZzY29wZT1zaXRl#
db=buh&AN=50542554>.
Townsend, Matt & Robert Fenner. Nike China Orders Rise 25% on Demand for Basketball Sportswear.
Bloomberg, 24 Sep. 2010. Web. 1 Dec. 2010. <http://www.bloomberg.com/news/2010-09
23/nike-s-first-quarter-profit-beats-somes-estimates-as-china-sales-climb-10-.html>.
Young, Greg. Strategic Vision, Mission, and Plan. North Carolina State University. 25 Aug. 2010. Web.
30 Nov. 2010 <http://mie480.files.wordpress.com/2010/08/mie480_lec03.ppt>.
14
15