foot locker flagship store, hollywood & highland, …...internet, mobile, and catalog channels....
TRANSCRIPT

CHAMPS SPORTS STORE OPENING, STATE STREET, CHICAGO
•• •••• ••••
••••
••• •
•
• ••
••••
••
•
•••
•••
•
•• ••
•••
•
••••••••• • • •••
•••••
•••• •
••
••
•••
••
• • • •• • •
•
•
330 WEST 34TH STREET New York, NY 10001
2017 Annual R
eport
Connecting With Our CustomersConnecting With Our Customers
NAS AT FOOT LOCKERSIX:02 EVENT, NEW YORK CITY REGIONAL CHAMPIONSHIP, KENOSHA, WISCONSIN
KEVIN LOVE VISITED BOYS & GIRLS CLUBS OF CLEVELAND FOR THE KIDS FOOT LOCKER FITNESS CHALLENGE
BROADWAY CLUB - THURSDAY, APRIL 6, 2017
JOEL EMBIID AT CHAMPS SPORTS
SIDESTEP STORE OPENING, COLOGNE, GERMANY
TYLER THE CREATOR AT TIMES SQUARE, NEW YORK CITY
FOOT LOCKER STORE OPENING, GEORGE STREET, SYDNEY
KEVIN DURANT AT THE HARLEM HOUSE OF HOOPS, NEW YORK CITY
JASMINE SANDERS AT LADY FOOT LOCKER
2017 Annual Report
Photography by Ryan Muir c/o Converse Inc.
FOOT LOCKER STORE OPENING, ROTTERDAM, NETHERLANDS
FOOT LOCKER STORE OPENING, ROME, ITALY
CAM NEWTON WITH 2 CHAINZ AT CHAMPS SPORTS
JAMES HARDEN FOOT LOCKER AD
FOOT LOCKER STORE OPENING, PARIS
FLY 89 GRAFFITI IN AMSTERDAM
PHADE APPEARANCE AT THE ARTS COLLECTIVE, NEW YORK CITY
FOOT LOCKER STORE OPENING, TIMES SQUARE, NEW YORK CITY
JUMPMAN STORE OPENING, TORONTO

2
Foot Locker, Inc. (NYSE: FL) is a leading global retailer of athletically
inspired shoes and apparel. Headquartered in New York City, the
Company operates 3,310 athletic retail stores in 24 countries in
North America, Europe, Australia, and New Zealand under the
brand names Foot Locker, Champs Sports, Kids Foot Locker,
Footaction, SIX:02, Lady Foot Locker, Runners Point, and Sidestep.
The Company also operates a direct-to-customer business
offering athletic footwear, apparel, and equipment through its
Internet, mobile, and catalog channels. In addition to websites
for each of the store banners, such as footlocker.com, the direct-to-
customer business includes Eastbay, a leading destination for the
serious athlete.
This report contains forward-looking statements within the meaning of the federal securities laws. Other than statements of historical facts, all statements which address activities, events, or developments that the Company anticipates will or may occur in the future, including, but not limited to, such things as future capital expenditures, expansion, strategic plans, financial objectives, dividend payments, stock repurchases, growth of the Company’s business and operations, including future cash flows, revenues, and earnings, and other such matters, are forward-looking statements. These forward-looking statements are based on many assumptions and factors which are detailed in the Company’s filings with the U.S. Securities and Exchange Commission.
These forward-looking statements are based largely on our expectations and judgments and are subject to a number of risks and uncertainties, many of which are unforeseeable and beyond our control. For additional discussion on risks and uncertainties that may affect forward-looking statements, see “Risk Factors” disclosed in the 2017 Annual Report on Form 10-K. Any changes in such assumptions or factors could produce significantly different results. The Company undertakes no obligation to update forward-looking statements, whether as a result of new information, future events, or otherwise.
1
Financial Highlights ............................................................. 1 Our Vision, Core Values, Strategies, and Goals ................... 2Letter to Shareholders ........................................................ 3Foot Locker and Lady Foot Locker ...................................... 7Foot Locker Europe.............................................................. 9Foot Locker Canada and Foot Locker Asia Pacific .............. 10Kids Foot Locker .................................................................. 11Champs Sports .................................................................... 12
Footaction ............................................................................ 13Eastbay ................................................................................. 14Runners Point and Sidestep ................................................ 15SIX:02 ................................................................................... 16Our Community .................................................................... 17Form 10-K ............................................................................ 18Board of Directors, Corporate Management, Division Management, Corporate Information .................... IBC
2013 2014 2015 2016 2017
Sales** $ 6,505 $ 7,151 $ 7,412 $ 7,766 $ 7,687Sales per Gross Square Foot $ 460 $ 490 $ 504 $ 515 $ 495Adjusted Financial Results: Earnings Before Interest and Taxes** $ 676 $ 816 $ 946 $ 1,012 $ 762 EBIT Margin 10.4% 11.4% 12.8% 13.0% 9.9% Net Income** $ 432 $ 522 $ 606 $ 652 $ 510 Net Income Margin 6.6% 7.3% 8.2% 8.4% 6.6% Diluted EPS from Continuing Operations $ 2.87 $ 3.58 $ 4.29 $ 4.82 $ 3.99 Return on Invested Capital 14.1% 15.0% 15.8% 15.1% 11.0%Cash, Cash Equivalents and Short-Term Investment Position, Net of Debt** $ 728 $ 833 $ 891 $ 919 $ 724
* Results in this table and throughout pages 1 through 16 refer to non-GAAP, adjusted figures, on a 52-week basis. See pages 17-19 of Form 10-K for the reconciliation of GAAP to non-GAAP adjusted results.
** In Millions
Financial Highlights*
FOOT LOCKER FLAGSHIP STORE, HOLLYWOOD & HIGHLAND, LOS ANGELES

2FOOT LOCKER FLAGSHIP STORE, HOLLYWOOD & HIGHLAND, LOS ANGELES
2FOOT LOCKER FLAGSHIP STORE, HOLLYWOOD & HIGHLAND, LOS ANGELES

While 2017 proved to be a year with many challenges for Foot Locker, Inc., we remained a highly profitable company and I am proud of the way our team handled the dramatic shifts influencing the preferences and shopping patterns of our customers. I believe the efforts, passion, and intensity of our global team of associates was just as strong in 2017 as it was in recent years of record financial performance — perhaps even more so.
Most of the challenges encountered this year were not unique to our Company, or even the broader athletic industry. In fact, almost all of the retail industry was profoundly affected by rapidly-changing customer expectations and behaviors, fueled largely by technology that allows virtually simultaneous global access to information, influences, and ideas. Although our consistent focus on the core customers of each of our banners enabled us to get started early on many efforts to respond to and harness the fundamental changes permeating retail, we and our outstanding industry partners recognize that we need to evolve together even faster in order to succeed with these fast-changing customers. A case in point is that in 2017 there was a lack of depth and variety, at least compared to recent years, of innovative new product at the premium end of the athletic footwear market, which is the core of Foot Locker, Inc.’s position. This challenge, combined with an exceptionally promotional environment throughout most of the athletic market, led to intense pressure on profit margins.
There were also some once-in-a-generation events that happened during the year, such as tax reform in the United States, which significantly lowered our profits in the fourth quarter of the year, but which will also be an important benefit in the future. There was also a difficult decision to restructure our organization, which caused some highly respected colleagues to leave the business. We did this primarily to facilitate shifting our focus forward onto a number of initiatives, which I will describe below, to transform our business to be in an even better position to lead our industry from our base at the center of sneaker culture.
2017 SUMMARY
Against this challenging backdrop, we produced some notable achievements, including:
• Reported total sales of $7.78 billion on a 53-week basis, the most in our history as an athletic company despite the first comparable sales decline (-3.1 percent) in eight years;
• Cash flow from operations of more than $800 million, an indication of the Company’s ability to generate substantial cash flow even in a challenging operating environment;
• $157 million of this cash was returned to shareholders in the form of dividends, with another $467 million returned through share repurchases;
• A slight improvement in our inventory turnover rate to just below our long-term goal of 3 times, a testament to our team’s sharp focus on managing our inventory levels to be positioned for what we anticipate will be a stronger flow of product in 2018; and
• Earnings on an adjusted basis of $3.99 per share, below recent years’ record results but still a solid performance given the disruption taking place throughout retail.
INDUSTRY POSITION
In last year’s letter to shareholders, I described that being at the center of sneaker culture has been one of the most important contributors to the progress we have made in achieving our current vision, which is to be the leading global retailer of athletically inspired shoes and apparel. The efforts we undertake on a daily basis to maintain that central position with our customers have led us to understand more
clearly than ever that sneaker culture — as huge, global, and inclusive as it is — is
in reality part of something even larger, which we describe broadly
as youth culture. Our youthful consumers who love sneakers (they can be any age, in fact) often love sports, but
Current Long-Term 2015 2016 2017 Objectives
Sales (billions)* $7.4 $7.8 $7.7 $10
Sales per Gross Square Foot $504 $515 $495 $600
Adjusted EBIT Margin 12.8% 13.0% 9.9% 12.5%
Adjusted Net Income Margin 8.2% 8.4% 6.6% 8.5%
Return on Invested Capital 15.8% 15.1% 11.0% 17%*On a 52-week basis.
LETTER TO SHAREHOLDERS
Connecting With Our Customers
3

they also love the latest in music, art, cuisine, and travel, among many other experiences and interests.
As we analyze and understand the myriad of cultural influences that reach these consumers, very often through their mobile devices and almost 24/7, it is clear that the work we do to stay relevant to our core customers is never ending. Given the rapid pace of change in fashion, retail in general, and the world at large, we and our supplier partners must always know what and who is important to these consumers, and why. We believe Foot Locker can lead the industry in creating meaningful, personal connections with them, developing powerful stories behind the innovative products we sell, and maintaining authentic and beneficial relationships with them on their journey through the various aspects of an exceptionally dynamic youth culture.
It is important to point out that, while in business — as in life — we often have to react to unforeseen changes in the external environment, most of the work we are doing today and the investments we are making now, and will make in the future, are intended to proactively adjust our course to achieve, over time, the same long-term goals of being a top quartile performer, with improving sales, productivity, and overall profitability, that we laid out back in 2015. We will describe in the pages that follow how we believe that the combination of: exceptional customer experiences and engagement, on both global and local levels; a flexible, fast, and efficient organization; and, most importantly, carefully-selected and compelling premium footwear and apparel assortments from the very best athletic vendors, creates the potential to attain those goals and the opportunity for you, our shareholders, to be rewarded with strong returns, as well.
STRATEGIC INITIATIVES
Let me describe some of the significant steps we took in 2017 to position our Company for a dynamic future.
• We realigned our organizational structure to give all-channel sales and profit responsibility to the general managers of each of our banners.
Our digital commerce team in Wisconsin and our various U.S. store divisions had been managed separately ever since
the Company acquired the powerful direct-to-customer business, Eastbay, back in 1997. That separate structure, with a major emphasis on direct-to-customer capabilities, contributed significantly to Foot Locker, Inc. being an early leader in athletic e-commerce. While the marketing and product coordination between the groups improved tremendously in recent years, the separate structure was no longer the optimal approach to creating truly seamless brand experiences for the customers of our brands. Having fully-integrated sales responsibility regardless of channel is a natural evolution in the process of providing cohesive experiences to consumers who are always connected digitally, but also love to regularly visit our stores.
• We created a new North American product and marketing strategy team to collaborate with our suppliers in the cultivation, development, and implementation of unique product platforms and stories that only a partner with the power and reach of Foot Locker, Inc. can truly scale globally.
The new team is working closely with all of our top vendors on ideas to generate significant incremental revenue streams through new brand and product ideas. An early example of this new strategic approach was our partnership late in the year with Nike on Sneakeasy, which is a window into what is next in the world of sneakers that we executed with exciting pop-up shops in New York and Boston. The combination of exclusive and innovative product with compelling local marketing stories sets a powerful initial example of the sort of differentiated retail that Nike is dedicated to working with key partners like us to deliver to consumers.
• We concentrated a significant portion of our capital and operating spending on enhancing our digital capabilities.
We executed a nationwide roll out of our launch reservation app during 2017, although the year was primarily one of platform development for our most important digital initiatives. These initiatives, which we have already started deploying and which should be mostly rolled out in 2018, are:
1. A new digital commerce website platform for all of our banners globally,
2. New point-of-sale software, also for all of our store banners around the world, and
3. A common mobile app platform.
4
FOOT LOCKER STORE OPENING, TIMES SQUARE, NEW YORK CITY FOOT LOCKER STORE OPENING, ROTTERDAM, NETHERLANDS

Each of these multi-year projects will enhance how our customers experience and engage with our banners. We will have greater insight into the shopping and buying patterns of individual customers and households, which we intend to leverage into even more effective loyalty and marketing program initiatives. We will have improved visibility and access to inventory across our entire enterprise, thereby facilitating availability for our customers of all the outstanding products that we carry. And we will elevate our story-telling and the alignment between our stores, digital sites, and mobile apps in order to produce even stronger customer satisfaction and higher rates of converting shoppers into buyers.
We are accelerating these and a number of other digital projects this year; however, going faster is not just a digital initiative; it is an imperative for everyone in our business to move quickly and embrace the inevitable change that is affecting retail.
We expect the concentration of investment into digital initiatives will peak in 2018 as we accelerate and pull forward as many technology projects as we believe we can successfully execute. Although we know that with premium sneakers, the most critical element of the purchase decision tends to be an emotional connection with the product, we also know that our youthful customers are extremely tech-savvy, and much of retail is being disrupted by the advent of new technologies, so we are working hard to be in a position to exceed consumer expectations.
• Speed of delivery is certainly an important element of consumer expectations, and we are also making significant investments in our supply chain capabilities.
We are well underway with the process of enhancing the capabilities of our primary distribution facility in Kansas to fulfill direct-to-customer shipments, easing the capacity constraints on our facility in Wisconsin that came with the Eastbay acquisition. We are also upgrading existing logistics
facilities in Pennsylvania and New Jersey to test a mini-hub distribution concept to serve major metropolitan areas along the upper East Coast. We believe mini-hubs will facilitate faster deliveries directly to our customers, and they should enable quick and efficient replenishment of nearby stores with our great product offerings, thereby over time reducing the need for expensive back room retail space.
• Even with all these other initiatives, we still spent the majority of our capital on our store fleet, the exceptional overall quality of which continues to be a key competitive advantage.
More than 90 percent of the sales of our banners that have stores take place in those stores, even though we have had strong direct-to-customer capabilities for 20 years and the young males (ages 12 to 25) who form the core of most of our banners’ customers seem to live with a mobile device in their hand. These customers have many reasons to come to a store and they continue to place a high value on a compelling store experience. Thus, the integration of the digital and store experience remains a critical component of fulfilling their desire for an emotional connection with the premium sneakers and apparel that we sell.
In addition to remodeling 108 stores during 2017 — bringing the cumulative total over the last five years to 831 — we opened several high-profile stores around the world, highlighted by a new store in Times Square which combines pinnacle expressions of Foot Locker, Kids Foot Locker, and SIX:02. In early 2018 that store was joined across the street by a new Champs Sports flagship store, as we strengthened
our already significant presence in and around New York City. During the course of 2017,
we also opened other prominent new stores in cities such as Sydney,
Melbourne, Chicago, Los Angeles, Toronto, Prague,
Rome, Paris, and Oslo, with Norway becoming the
24th country in which we operate our own Foot Locker stores.
5
We remained a highly profitable company and I am proud of the way our team handled the dramatic shifts influencing the preferences and shopping patterns of our customers. I believe the efforts, passion, and intensity of our global team of associates was just as strong in 2017 as it was in recent years of record financial performance — perhaps even more so.

CAPITAL ALLOCATION
These initiatives led to the investment of $270 million of capital into the business in 2017, down slightly from the $284 million of capital expenditures in 2016. As we announced in February 2018, our Board of Directors approved a $230 million capital spending program in 2018, somewhat lower than the past two years as we focus an increasing portion of our capital on digital and supply chain initiatives, compared to real estate — although the majority of the spend will continue to be on our outstanding store fleet.
In February 2018, our Board of Directors also approved an 11 percent increase in our quarterly dividend, to 34.5 cents per share. We believe the continuation of our multi-year trend of double-digit annual dividend increases, even in a challenging year for profits, sends a strong signal of the Board’s confidence in our ability to execute our initiatives effectively in the rapidly-changing retail landscape.
No new formal action was taken on our share repurchase program, but we are only one year along on the $1.2 billion program that the Board authorized in 2017. We were judicious in the timing of spending $467 million over the course of the year, $442 million of which was spent under the new program, leaving $758 million available going into 2018. Management is in ongoing dialogue with the Board on the timing and pace of share repurchases, which are affected by many factors, including business performance, share price, and such macro factors as the effect of tax reform.
CONCLUSION
Although our overall financial performance fell short of our expectations, the strength of our team, which I noted at the beginning of this letter, was the primary factor in Foot Locker, Inc.’s overall resilience throughout the year, and we did gain market share for premium sneakers in key regions such as North America. I want to thank all of our associates for their dedication and perseverance in the face of the changes and challenges affecting our business, and I am fully confident in their ability to deliver better results in 2018.
Our Board of Directors also deserves a hearty thanks for its leadership and counsel during this challenging year. Some of our directors have extensive retail experience, and they all understand the need to constantly reinvent retail businesses to adapt to changing macroeconomic factors and technologies.
I want to especially thank Jarobin Gilbert Jr., who will be retiring from our Board this spring after serving for an incredible 36 years. Having joined the Board when the Company was known as F.W. Woolworth and the Foot Locker banner was less than a decade old, he certainly knows much about retail disruption and reinvention, and I know I speak for the rest of the Board and our senior leadership team when I say we will very much miss his guidance and support.
As always, I want to finish by thanking you, our shareholders, for your patience as we navigate through the turbulence that defines the retail industry today. The dialogue we maintain with our shareholders who are focused on our long-term strategy continues to be, I believe, mutually beneficial and informative. I am also confident that we have in place the strategies and initiatives to inspire the members of youth culture with great experiences and excellent product, and we have the team and the financial strength to execute these initiatives quickly and effectively. And as we do that, I am confident we will succeed together as we rebuild our momentum towards achieving the long-term financial and operational goals that we set for ourselves in 2015.
Richard JohnsonChairman and Chief Executive Officer
FOOT LOCKER AT THE YEARLY SNEAKERNESS CONVENTION, PARIS FOOT LOCKER STORE OPENING, ROME
6

7
Our flagship Foot Locker banner caters especially to the sneaker-obsessed young male, the North
American muse for whom we identified as Makai in last year’s annual report. Whether Makai lives in
Los Angeles, Detroit, Toronto, or New York — or we talk about his peers in London, Barcelona, Milan, or
Sydney, he participates fully in an exceptionally dynamic youth culture. Despite his awareness of global
celebrities, trends, and issues, Makai lives in the moment in his local community and wants to have his
individuality recognized, he seeks self-expression through his sneakers, and he is passionate about the
connections to the people, experiences, and products that are important to him.
In the United States, Foot Locker has 889 store locations, with another 21 stores in Puerto Rico,
the Virgin Islands, and Guam.
The female equivalent of Makai is Arielle, who is equally at home at Foot Locker and Lady Foot Locker,
which has another 85 stores across the United States and Puerto Rico. Sneakers form a critical
part of her wardrobe, just as they do for Makai. They are both ardent followers of styles as well as
broad societal movements, participating actively on social media as a primary means of engagement.
Extending our connections with these consumers is an ongoing imperative for our Company.
7 CAM’RON AT REEBOK 3:AM EVENT, NYC33, NEW YORK CITY CONVERSE EVENT AT FOOT LOCKER TIMES SQUARE
NAS PERFORMING AT TIMBERLAND’S LEGENDS CLUB EVENT, NYC33, NEW YORK CITY TYLER THE CREATOR AT TIMES SQUARE, NEW YORK CITY
Photography by Ryan Muir c/o Converse Inc.

We opened new high-profile retail destinations for these
consumers, including an exciting new flagship store in
New York City’s Times Square to go along with our nearby
flagship store on 34th Street that we opened in 2016.
We unveiled our most powerful store yet in the Los Angeles
market at Hollywood & Highland, as seen above.
In addition, we completed remodels or relocations of
44 stores, bringing the total percentage of the Foot Locker
locations in the U.S. that are new or have been remodeled to
over 40 percent of the fleet.
We launched several initiatives with Nike, including energizing
our House of Hoops by Foot Locker shop-in-shops — we have
185 of them in the U.S. alone — with exclusive NBA player
editions; placing Nike Pro Associates in some top Foot Locker
properties in order to tell the unique and compelling stories
behind all of the great Nike product in our stores; and our
newest elevated customer experience, Sneakeasy.
8
KEVIN DURANT AT THE HARLEM HOUSE OF HOOPS, NEW YORK CITY

In Europe, the Foot Locker banner connects with and serves
its primary muses, Mike and Laura. Mike is much like Makai,
except that Mike’s favorite sport is undoubtedly soccer —
which explains his preference for running silhouettes in
footwear — and his tastes in music include many local or
regional artists. Mike and Laura also favor athletic apparel,
which led to a gain in the category for the year.
There are 635 Foot Locker stores in Europe, and one
Jumpman store operated in Paris in partnership with
Brand Jordan.
We signed Dua Lipa as brand ambassador in early 2017 when she was just bursting onto the music scene in Europe. She has since become a major global pop star.
Foot Locker entered Norway, its 24th country, opening our first store in downtown Oslo, as pictured above.
We also opened the banner’s first-ever store on the Avenue des Champs-Élysées, pictured above center, further fortifying our strong market position in and around Paris.
Fulfilling Mike’s desire for fresh styles, we developed strong product assortments with Vans and Puma during 2017, while also fueling growth in our biggest vendor, Nike, with a focus on premium running styles.
Our e-commerce business in Europe continues to
increase in scale and as a percent of total sales.
FOOT LOCKER STORE OPENING, OSLO
FOOT LOCKER STORE OPENING, ROTTERDAM
9

10
Foot Locker in Canada posted a low-single digit comparable-
store sales gain for 2017, as we successfully built on the strong
momentum generated by the NBA All-Star game that was
held in Toronto in 2016. Sneaker culture is alive and thriving
across Canada, with distinct local flavors in major cities such as
Toronto, Montreal, Calgary, and Vancouver.
Foot Locker operates over a 100 stores in Canada, as well as one
Jumpman store in Toronto in partnership with Brand Jordan, as
seen below.
In Australia and New Zealand, Foot Locker operates almost 100
stores, which continue to generate double-digit profit margins.
Early in the year, we unveiled a pinnacle retail experience on George Street in Sydney, including an exciting activation space known as The Key, where celebrities, influencers, and our customers can gather to celebrate their love of sneakers.
We also opened a high-profile store on Bourke Street in Melbourne.
We launched our Australian e-commerce website and linked it with our stores to provide seamless inventory across the country.
JUMPMAN STORE OPENING, TORONTO FOOT LOCKER STORE OPENING, GEORGE STREET, SYDNEY
Foot Locker’s e-commerce sales in Canada continue to be an important source of strength, as our digital connections with Makai have been extended by increasing our social media activation and leveraging our national footprint of Foot Locker stores to service the marketplace.
We increased the penetration of apparel in our business during 2017, with compelling collections from core vendor partners, such as Nike, Jordan, and adidas, and up-and-coming vendors, such as Champion, Fila, and Kappa.

Sneaker culture continues to spread across the globe and across age groups. As the kids who grew up with sneakers over the last 10 or 15 years
get older, not only are they carrying their passion for sneakers to the workplace and other grown-up venues, they are also having kids of their own and introducing them to cool kicks at ever younger ages. That, combined with kids having
access to technology almost from birth, has led
to our Kids Foot Locker banner being exceptionally well-positioned to connect with sneaker-savvy kids and their parents as they share and bond over various elements of sneaker culture.
At year end, there were 365 Kids Foot Locker stores in the U.S., 40 in Europe, and 31 others across Puerto Rico, the Virgin Islands, Canada, and Australia.
Opened its first flagship store in Times Square in February in conjunction with its big brother Foot Locker. In December, duplicated the feat with an exciting flagship location in the Los Angeles market.
Signed a partnership with DJ Khaled and Haddad Brands, the Brand Jordan licensee for children’s product, to feature DJ’s son, Asahd, in marketing campaigns for our banner over the next year.
Took the lead in building strong secondary brands, with Champion and Vans being prime examples.
During the course of 2017, Kids Foot Locker:
BROADWAY CLUB - THURSDAY, APRIL 6, 2017
KEVIN LOVE VISITED BOYS & GIRLS CLUBS OF CLEVELAND FOR THE KIDS FOOT LOCKER FITNESS CHALLENGE
11

The muses for Champs Sports are Traun and Crystal. They
are likely top athletes in their school, and much like Makai at
Foot Locker, Traun is passionate about all aspects of youth
culture, including music, art, and, of course, sports and
sneakers. Traun and Crystal are digital natives and absorb
cultural influences at a pace never seen before.
With a strong performance in apparel and running footwear,
Champs Sports posted the strongest results of our banners
in the U.S. In addition to its 512 stores in the U.S. and Puerto
Rico, Champs Sports also operated 29 stores in Canada at the
end of 2017.
In the summer of 2017, Champs Sports opened its first flagship store on State Street in Chicago, and recently opened its second flagship in March, 2018 in Times Square in New York.
Indicative of Champs Sports’ strong connection with Crystal, the banner produced a record year for women’s footwear sales.
The banner also posted a record sales year in apparel, with particular strength in premium branded assortments.
Champs Sports created powerful marketing partnerships, led by the digital franchises: Going Numb, Illustrated, and Her Take, and partnered with vendors around its The Moment and Sneaker Watch franchises.
STEPH LECOR AND MICHELLE CARIGMA ON THE SET OF HER TAKE, AT CHAMPS SPORTSCAM NEWTON WITH 2 CHAINZ AT CHAMPS SPORTS CHAMPS SPORTS STORE, STATE STREET, CHICAGO
12CHAMPS SPORTS STATE STREET OPENING CONCERT

Our Footaction banner, with 260 stores located throughout
the United States, Puerto Rico, and Canada, serves a core
customer in his early 20s we identified in last year’s report as
Ike, who loves to create and experience new things, and who is
inspired by music, art, sports, and fashion.
Total sales increased slightly in 2017,
led by apparel, which increased double
digits on the strength of branded fleece,
t-shirts, and windwear.
Opened its first two stores in Canada, and unveiled the first Toronto Jumpman stand-alone flagship in partnership with Nike and Brand Jordan.
Launched Capsule by Footaction, brand activation spaces in two new high-profile locations in Los Angeles that elevated local connectivity and cultural relevance. Among other highlights, we launched the ongoing consumer engagement series ‘How to Make it Workshop’ with socially relevant local creatives in photography, music and publishing, and we extended our community engagement with the Boys and Girls Club of East Los Angeles.
Created bespoke vendor partnerships, including with UGG (starring rapper Kyle), Champion (and hip hop fashion artist Phade of Shirt Kings), and Timberland (featuring rapper Taylor Bennett).
In order to extend our connections with Ike, Footaction:
SUMMER HUSTLE CAMPAIGN WITH GUCCI MANE
CUFFING SEASON CONFESSIONALS WITH MARQUESE CHRISS, JADAKISS, AND BUDDY HIELD AT THE GLOBAL SPIN AWARDS, NBA ALL STAR WEEKEND
R&B DUO MAJID JORDAN PERFORMING AT ASICS’ SPACE DYE KNIT LAUNCH EVENT, NYC33, NEW YORK CITY
13

Eastbay is our only banner that has no store presence.
It operates digitally and through a Team Sales field
organization. For decades now, Eastbay has had great
connections with elite varsity high school athletes, the sort
of kids — like our muses Connor and Emily — who are
competitive in the classroom, on the court or field, and in
everything else in their lives. They aspire to pursue athletics
at the collegiate or perhaps even pro level, and value highly
the deep assortments of performance footwear, apparel, and
accessories that Eastbay specializes in. At the same time,
they favor casual athletic looks when they’re not competing
in their sport.
Eastbay had the strongest comparable sales gain of any of our banners, increasing at a mid-single digit percentage pace.
The team sales organization participated in a variety of events, such as Amateur Athletic Union, California Interscholastic Federation, and Bigfoot Hoops, forging relationships with coaches and parents as well as the athletes.
Eastbay sponsored top athletic facilities in Illinois, Colorado, and California in order to elevate engagement with Connor and Emily.
For the first time, Eastbay co-sponsored the prestigious national Foot Locker Cross Country Championships.
EKF7
FEBRUARY
TROY’S CHALLENGE:
HIT A BUCKET OF
BASEBALLS EVERY DAY
SCAN WITH THE EASTBAY LENS
GET TO KNOW TROY AND TAMPA BAY’S KEVIN KIERMAIER
YOUNG
ATHLETES
SPRING SPORTS
PREVIEW
FREE SHIPPING
EVERY DAY*
ORDERS OF $75 OR MORE15% OFF**
TROY READER
CATCHER/SECOND BASE
SEE HIS STORY ON PAGE 3
14

15
Runners Point’s sales, although down for the year, did improve over time and comparable sales turned positive in the fourth quarter.
We are investing in the latest in-store technology to help active runners analyze their gait and select the best shoes for their physique and style of running.
After the successful opening of a newly redesigned, high-profile Sidestep store in Cologne in 2016, we took the best features of that store to remodel several additional stores last year, in a format we call Sidestep 2.0. These stores significantly outperformed the rest of the Sidestep fleet.
Sidestep’s overall sales also improved in 2017, inflecting to a comparable-store sales gain in the final quarter of the year.
As the banner name suggests, Runners Point’s goal is to
be all things running for both the serious runner and the
customer looking for the comfort and style of the latest
cool sneakers. The banner operates 118 stores, mostly in
Germany but also in Austria and Switzerland.
Like Runners Point, Sidestep operates mostly in Germany,
featuring 83 stores. The customers for Sidestep are
serious about fashion, music, and their local community,
and the banner features more lifestyle and casual footwear
assortments.
SIDESTEP 2.0, DUSSELDORF, GERMANY

Grace, the muse for SIX:02, embraces an active lifestyle that
encompasses all of her interests, ranging from fashion, music,
healthy living, and, related to that, working out. She aspires to
always fulfill her workout needs showcasing the latest stylish,
functional, and high-performance apparel and sneakers. She also
does not hesitate to wear them almost anywhere, at any time.
After opening its first flagship store in 2016 in conjunction with the Foot Locker store on 34th Street in New York, SIX:02 opened two similarly high-profile locations in 2017, one in Times Square in New York and most recently at Hollywood & Highland in the Los Angeles market. These three flagship stores have significantly increased awareness of the brand, which operates 32 stores in the U.S. and an exciting website.
All three of these high-profile stores include Collection spaces through which carefully-selected, limited edition product rotates frequently, based on the hottest new trends in athletically-inspired styles.
16
LOVE SQUAD EVENT, NYC33, NEW YORK CITYNEW YORK CITY BALLET PRESENTS PUMA SWAN PACK FASHION SHOW AT SIX:02 TIMES SQUARE

17
Supporting Our Communities
As a company, our commitment to support the communities in which we work and live has never been stronger. Giving to those in need and enriching people’s lives is a deep-rooted philosophy that has become an integral part of our corporate culture, and extends to our associates all around the world as well.
With 2017 being notable for the number of devastating storms and natural disasters in the United States, the Caribbean, and elsewhere in the world, many of our customers — as well as many of our own Foot Locker, Inc. associates — were significantly affected by these events. In the aftermath, our Company and our associates brought to life our core value of supporting our communities by uniting to produce positive change during a time of incredible need.
Beyond monetary contributions from the Foot Locker Foundation to the American Red Cross and our long-standing partner, The Two Ten Footwear Foundation, our merchant and marketing teams within the U.S. joined forces to donate shoes, apparel, and socks to families in need in the areas affected by hurricanes, wildfires, and other events. We also encouraged consumers to donate to the Red Cross through a nationwide in-store and online fundraising campaign for all those affected by the storms. In addition, we spearheaded an emergency response effort providing early shipments of much-needed supplies, including water, food, and toiletries, and launched a philanthropic platform as part of our sixth annual Week of Greatness campaign, centered on support for victims of Hurricane Maria.
The Foot Locker Foundation also continued to promote a better world for today’s youth through educational initiatives and programs that encourage
health and well-being through physical activity. The Foot Locker Scholar Athletes Program has been a hallmark of the Foot Locker Foundation’s efforts to support our communities since its launch in 2011. The Scholar Athletes Program awards $20,000 college scholarships to 20 exceptional students who demonstrate academic excellence and exemplify strong leadership skills both in sports and within their communities, and so far the program has invested almost $2.5 million in the education and future of some of America’s most promising scholar athletes. Beyond this program, we have also raised millions of dollars in support of higher education through our annual “On Our Feet” fundraising gala, benefitting hundreds of students through a joint scholarship program with our partner, UNCF.
Since 2014, Kids Foot Locker has teamed up each year with the Boys & Girls Clubs of America to run The Kids Foot Locker Fitness Challenge, which promotes physical fitness among today’s youth. The national program challenges Club kids within select markets each year through a six-week “Fitness Challenge,” with a variety of physical fitness activities, urging them to be more active on a daily basis.
The Company continues to dedicate significant resources to key causes that connect closely with our customers, associates, suppliers, and shareholders domestically and internationally. Our support of programs and initiatives, such as The Fred Jordan Mission, American Cancer Society’s Making Strides Against Breast Cancer Walk, The Pluryn Foundation in The Netherlands, The Starlight Children’s Foundation in Australia, and the Special Olympics in Canada, provide associates with opportunities to connect with important social issues while making positive contributions around the world.
FRED JORDAN MISSION EVENT, LOS ANGELES, CALIFORNIAWEEK OF GREATNESS PUERTO RICO GIVEAWAY

Form 10-K
18


UNITED STATES SECURITIES AND EXCHANGE COMMISSION
Washington, D.C. 20549
FORM 10-K
(Mark One)
ANNUAL REPORT PURSUANT TO SECTION 13 OR 15(d) OF THE SECURITIES EXCHANGE ACT OF 1934
For the fiscal year ended February 3, 2018
OR TRANSITION REPORT PURSUANT TO SECTION 13 OR 15(d) OF THE SECURITIES EXCHANGE ACT OF 1934
For the transition period from __________ to __________
Commission File No. 1-10299
(Exact name of registrant as specified in its charter)
New York 13-3513936 (State or other jurisdiction of (I.R.S. Employer Identification No.) incorporation or organization)
330 West 34th Street, New York, New York 10001 (Address of principal executive offices) (Zip Code)
Registrant’s telephone number, including area code: (212) 720-3700 Securities registered pursuant to Section 12(b) of the Act:
Title of each class Name of each exchange on which
registered Common Stock, par value $0.01 New York Stock Exchange
Securities registered pursuant to Section 12(g) of the Act: None Indicate by check mark if the registrant is a well-known seasoned issuer, as defined in Rule 405 of the Securities Act. Yes No Indicate by check mark if the registrant is not required to file reports pursuant to Section 13 or Section 15(d) of the Act. Yes No Indicate by check mark whether the Registrant (1) has filed all reports required to be filed by Section 13 or 15(d) of the Securities Exchange Act of 1934 during the preceding 12 months (or for such shorter period that the Registrant was required to file such reports), and (2) has been subject to such filing requirements for the past 90 days. Yes No
Indicate by check mark whether the Registrant has submitted electronically and posted on its corporate Website, if any, every Interactive Data File required to be submitted and posted pursuant to Rule 405 of Regulation S-T (§ 232.405 of this chapter) during the preceding 12 months (or for such shorter period that the registrant was required to submit and post such files). Yes No
Indicate by check mark if disclosure of delinquent filers pursuant to Item 405 of Regulation S-K is not contained herein, and will not be contained, to the best of Registrant’s knowledge, in definitive proxy or information statements incorporated by reference in Part III of this Form 10-K or any amendment to this Form 10-K.
Indicate by check mark whether the registrant is a large accelerated filer, an accelerated filer, a non-accelerated filer, smaller reporting company, or an emerging growth company. See the definitions of “large accelerated filer,” “accelerated filer,” “smaller reporting company,” and “emerging growth company” in Rule 12b-2 of the Exchange Act.
Large accelerated filer Accelerated filer Non-accelerated filer Smaller reporting company
Emerging growth company If an emerging growth company, indicate by check mark if the registrant has elected not to use the extended transition period for complying with any new or revised financial accounting standards pursuant to Section 13(a) of the Exchange Act.
Indicate by check mark whether the registrant is a shell company (as defined in Rule 12b-2 of the Act). Yes No
The number of shares of the Registrant’s Common Stock, par value $0.01 per share, outstanding as of March 26, 2018: 118,115,818
The aggregate market value of voting stock held by non-affiliates of the Registrant computed by reference to the closing price as of the last business day of the Registrant’s most recently completed second fiscal quarter, July 29, 2017, was approximately:
$4,504,950,585*
* For purposes of this calculation only (a) all directors plus three executive officers and owners of five percent or more of the Registrant are deemed to be affiliates of the Registrant and (b) shares deemed to be “held” by such persons include only outstanding shares of the Registrant’s voting stock with respect to which such persons had, on such date, voting or investment power.
DOCUMENTS INCORPORATED BY REFERENCE
Portions of the Registrant’s definitive Proxy Statement (the “Proxy Statement”) to be filed in connection with the Annual Meeting of Shareholders to be held on May 23, 2018: Parts III and IV.


FOOT LOCKER, INC. TABLE OF CONTENTS
PART I Item 1. Business 1Item 1A. Risk Factors 1Item 1B. Unresolved Staff Comments 9Item 2. Properties 9Item 3. Legal Proceedings 9Item 4. Mine Safety Disclosures 9Item 4A. Executive Officers of the Registrant 10 PART II Item 5.
Market for the Company’s Common Equity, Related Stockholder Matters and Issuer Purchases of Equity Securities
11
Item 6. Selected Financial Data 13Item 7. Management’s Discussion and Analysis of Financial Condition and Results of Operations 14Item 7A. Quantitative and Qualitative Disclosures About Market Risk 35Item 8. Consolidated Financial Statements and Supplementary Data 35Item 9. Changes in and Disagreements with Accountants on Accounting and Financial Disclosure 74Item 9A. Controls and Procedures 74Item 9B. Other Information 76
PART III Item 10. Directors, Executive Officers and Corporate Governance 76Item 11. Executive Compensation 76
Item 12. Security Ownership of Certain Beneficial Owners and Management and Related Stockholder Matters 76
Item 13. Certain Relationships and Related Transactions, and Director Independence 76Item 14. Principal Accounting Fees and Services 76
PART IV Item 15. Exhibits and Financial Statement Schedules 77SIGNATURES 78INDEX OF EXHIBITS 79

1
PART I Item 1. Business General Foot Locker, Inc., incorporated under the laws of the State of New York in 1989, is a leading global retailer of athletically inspired shoes and apparel. As of February 3, 2018, the Company operated 3,310 primarily mall-based stores, as well as stores in high-traffic urban retail areas and high streets, in the United States, Canada, Europe, Australia, and New Zealand. Foot Locker, Inc. and its subsidiaries hereafter are referred to as the “Registrant,” “Company,” “we,” “our,” or “us.” Information regarding the business is contained under the “Business Overview” section in “Item 7. Management’s Discussion and Analysis of Financial Condition and Results of Operations.” The Company maintains a website on the Internet at www.footlocker-inc.com. The Company’s filings with the U.S. Securities and Exchange Commission (the “SEC”), including its annual reports on Form 10-K, quarterly reports on Form 10-Q, current reports on Form 8-K, and all amendments to those reports are available free of charge through this website as soon as reasonably practicable after they are filed with or furnished to the SEC by clicking on the “SEC Filings” link. The Corporate Governance section of the Company’s corporate website contains the Company’s Corporate Governance Guidelines, Committee Charters, and the Company’s Code of Business Conduct for directors, officers and employees, including the Chief Executive Officer, Chief Financial Officer, and Chief Accounting Officer. Copies of these documents may also be obtained free of charge upon written request to the Company’s Corporate Secretary at 330 West 34th Street, New York, N.Y. 10001. Information Regarding Business Segments and Geographic Areas The financial information concerning business segments, divisions, and geographic areas is contained under the “Business Overview” and “Segment Information” sections in “Item 7. Management’s Discussion and Analysis of Financial Condition and Results of Operations.” Information regarding sales, operating results, and identifiable assets of the Company by business segment and by geographic area is contained under the Segment Information note in “Item 8. Consolidated Financial Statements and Supplementary Data.” The service marks, trade names, and trademarks appearing in this report (except for Nike, Jordan, adidas, and Puma) are owned by Foot Locker, Inc. or its subsidiaries. Employees The Company and its consolidated subsidiaries had 15,141 full-time and 34,068 part-time employees as of February 3, 2018. The Company considers employee relations to be satisfactory. Competition Financial information concerning competition is contained under the “Business Risk” section in the Financial Instruments and Risk Management note in “Item 8. Consolidated Financial Statements and Supplementary Data.” Merchandise Purchases Financial information concerning merchandise purchases is contained under the “Liquidity” section in “Item 7. Management’s Discussion and Analysis of Financial Condition and Results of Operations” and under the “Business Risk” section in the Financial Instruments and Risk Management note in “Item 8. Consolidated Financial Statements and Supplementary Data.” Item 1A. Risk Factors The statements contained in this Annual Report on Form 10-K (“Annual Report”) that are not historical facts, including, but not limited to, statements regarding our expected financial position, business and financing plans found in “Item 1. Business” and “Item 7. Management’s Discussion and Analysis of Financial Condition and Results of Operations,” constitute “forward-looking statements” within the meaning of the Private Securities Litigation Reform Act of 1995.

2
Please also see “Disclosure Regarding Forward-Looking Statements.” Our actual results may differ materially due to the risks and uncertainties discussed in this Annual Report, including those discussed below. Additional risks and uncertainties that we do not presently know about or that we currently consider to be insignificant may also affect our business operations and financial performance. Our inability to implement our long-range strategic plan may adversely affect our future results. Our ability to successfully implement and execute our long-range plan is dependent on many factors. Our strategies may require significant capital investment and management attention. Additionally, any new initiative is subject to certain risks including customer acceptance of our products and renovated store designs, competition, product differentiation, the ability to attract and retain qualified personnel, and our ability to successfully implement technological initiatives. If we cannot successfully execute our strategic growth initiatives or if the long-range plan does not adequately address the challenges or opportunities we face, our financial condition and results of operations may be adversely affected. Additionally, failure to meet shareholder expectations, particularly with respect to sales, operating margins, and earnings per share, would likely result in volatility in the market value of our stock. The retail athletic footwear and apparel business is highly competitive. Our athletic footwear and apparel operations compete primarily with athletic footwear specialty stores, sporting goods stores, department stores, traditional shoe stores, mass merchandisers, and Internet retailers, many of which are units of national or regional chains that have significant financial and marketing resources. The principal competitive factors in our markets are selection of merchandise, customer experience, reputation, store location, advertising, and price. We cannot assure that we will continue to be able to compete successfully against existing or future competitors. Our expansion into markets served by our competitors, and entry of new competitors or expansion of existing competitors into our markets, could have a material adverse effect on our business, financial condition, and results of operations. Although we sell an increasing proportion of our merchandise via the Internet, a significantly faster shift in customer buying patterns to purchasing athletic footwear, athletic apparel, and sporting goods via the Internet could have a material adverse effect on our business results. In addition, all of our significant suppliers operate retail stores and distribute products directly through the Internet and others may follow. Should this continue to occur, and if our customers decide to purchase directly from our suppliers, it could have a material adverse effect on our business, financial condition, and results of operations. The industry in which we operate is dependent upon fashion trends, customer preferences, product innovations, and other fashion-related factors. The athletic footwear and apparel industry, especially at the premium end of the price spectrum, is subject to changing fashion trends and customer preferences. In addition, retailers in the athletic industry rely on their suppliers to maintain innovation in the products they develop. We cannot guarantee that our merchandise selection will accurately reflect customer preferences when it is offered for sale or that we will be able to identify and respond quickly to fashion changes, particularly given the long lead times for ordering much of our merchandise from suppliers. A substantial portion of our highest margin sales are to young males (ages 12–25), many of whom we believe purchase athletic footwear and athletic apparel as a fashion statement and are frequent purchasers. Our failure to anticipate, identify or react appropriately in a timely manner to changes in fashion trends that would make athletic footwear or athletic apparel less attractive to our customers could have a material adverse effect on our business, financial condition, and results of operations. If we do not successfully manage our inventory levels, our operating results will be adversely affected. We must maintain sufficient inventory levels to operate our business successfully. However, we also must guard against accumulating excess inventory. For example, we order most of our athletic footwear four to six months prior to delivery to our stores. If we fail to anticipate accurately either the market for the merchandise in our stores or our customers’ purchasing habits, we may be forced to rely on markdowns or promotional sales to dispose of excess or slow moving inventory, which could have a material adverse effect on our business, financial condition, and results of operations.

3
A change in the relationship with any of our key suppliers or the unavailability of key products at competitive prices could affect our financial health. Our business is dependent to a significant degree upon our ability to obtain exclusive product and the ability to purchase brand-name merchandise at competitive prices from a limited number of suppliers. In addition, we have negotiated volume discounts, cooperative advertising, and markdown allowances with our suppliers, as well as the ability to cancel orders and return excess or unneeded merchandise. We cannot be certain that such terms with our suppliers will continue in the future. We purchased approximately 93 percent of our merchandise in 2017 from our top five suppliers and we expect to continue to obtain a significant percentage of our athletic product from these suppliers in future periods. Approximately 67 percent of all merchandise purchased in 2017 was purchased from one supplier — Nike, Inc. (“Nike”). Each of our operating divisions is highly dependent on Nike: they individually purchased 44 to 73 percent of their merchandise from Nike during the year. Merchandise that is high profile and in high demand is allocated by our suppliers based upon their internal criteria. Although we have generally been able to purchase sufficient quantities of this merchandise in the past, we cannot be certain that our suppliers will continue to allocate sufficient amounts of such merchandise to us in the future. Our inability to obtain merchandise in a timely manner from major suppliers as a result of business decisions by our suppliers or any disruption in the supply chain could have a material adverse effect on our business, financial condition, and results of operations. Because of the high proportion of purchases from Nike, any adverse development in Nike’s reputation, financial condition or results of operations or the inability of Nike to develop and manufacture products that appeal to our target customers could also have an adverse effect on our business, financial condition, and results of operations. We cannot be certain that we will be able to acquire merchandise at competitive prices or on competitive terms in the future. These risks could have a material adverse effect on our business, financial condition, and results of operations. We are affected by mall traffic and our ability to secure suitable store locations. Many of our stores, especially in North America, are located primarily in enclosed regional and neighborhood malls. Our sales are affected, in part, by the volume of mall traffic. Mall traffic may be adversely affected by, among other factors, economic downturns, the closing or continued decline of anchor department stores and/or specialty stores, and a decline in the popularity of mall shopping among our target customers. Further, any terrorist act, natural disaster, public health or safety concern that decreases the level of mall traffic, or that affects our ability to open and operate stores in such locations, could have a material adverse effect on our business. To take advantage of customer traffic and the shopping preferences of our customers, we need to maintain or acquire stores in desirable locations such as in regional and neighborhood malls, as well as high-traffic urban retail areas and high streets. We cannot be certain that desirable locations will continue to be available at favorable rates. Some traditional enclosed malls are experiencing significantly lower levels of customer traffic, driven by economic conditions as well as the closure of certain mall anchor tenants. Several large landlords dominate the ownership of prime malls and because of our dependence upon these landlords for a substantial number of our locations, any significant erosion of their financial condition or our relationships with these landlords could negatively affect our ability to obtain and retain store locations. Additionally, further landlord consolidation may negatively affect our ability to negotiate favorable lease terms. We may experience fluctuations in, and cyclicality of, our comparable-store sales results. Our comparable-store sales have fluctuated significantly in the past, on both an annual and a quarterly basis, and we expect them to continue to fluctuate in the future. A variety of factors affect our comparable-store sales results, including, among others, fashion trends, product innovation, promotional events, the highly competitive retail sales environment, economic conditions, timing of income tax refunds, changes in our merchandise mix, calendar shifts of holiday periods, supply chain disruptions, and weather conditions. Many of our products represent discretionary purchases. Accordingly, customer demand for these products could decline in an economic downturn or if our customers develop other priorities for their discretionary spending. These risks could have a material adverse effect on our business, financial condition, and results of operations.

4
Economic or political conditions in other countries, including fluctuations in foreign currency exchange rates and tax rates may adversely affect our operations. A significant portion of our sales and operating income for 2017 was attributable to our operations in Europe, Canada, Australia, and New Zealand. As a result, our business is subject to the risks associated with doing business outside of the United States such as local customer product preferences, political unrest, disruptions or delays in shipments, changes in economic conditions in countries in which we operate, foreign currency fluctuations, real estate costs, and labor and employment practices in non-U.S. jurisdictions that may differ significantly from those that prevail in the United States. In addition, because our suppliers manufacture a substantial amount of our products in foreign countries, our ability to obtain sufficient quantities of merchandise on favorable terms may be affected by governmental regulations, trade restrictions, labor, and other conditions in the countries from which our suppliers obtain their product. Fluctuations in the value of the euro and the British Pound may affect the value of our European earnings when translated into U.S. dollars. Similarly our earnings in Canada, Australia, and New Zealand may be affected by the value of currencies when translated into U.S. dollars. Except for our business in the United Kingdom (the “U.K”), our international subsidiaries conduct most of their business in their local currency. Inventory purchases for our U.K. business are denominated in euros, which could result in foreign currency transaction gains or losses. Our products are subject to import and excise duties and/or sales or value-added taxes in many jurisdictions. Fluctuations in tax rates and duties and changes in tax legislation or regulation could have a material adverse effect on our results of operations and financial condition. Significant developments stemming from the U.K.’s decision to withdraw from the European Union could have a material adverse effect on the Company. The U.K. has voted in favor of leaving the European Union (“E.U.”), and such withdrawal (commonly referred to as “Brexit”) is scheduled to take effect over the next two years. This decision has created political and economic uncertainty, particularly in the U.K. and the E.U., and this uncertainty may last for several years. The pending withdrawal and its possible future consequences have caused and may continue to cause significant volatility in global financial markets, including in global currency and debt markets. This volatility could cause a slowdown in economic activity in the U.K., Europe or globally, which could adversely affect the Company's operating results and growth prospects. In addition, Brexit could lead to legal uncertainty and potentially divergent national laws and regulations as the U.K. determines which E.U. laws to replace or replicate, and those laws and regulations may be cumbersome, difficult or costly in terms of compliance. Any of these effects of Brexit, among others, could adversely affect our business, results of operations and financial condition. Macroeconomic developments may adversely affect our business. Our performance is subject to global economic conditions and the related effects on consumer spending levels. Continued uncertainty about global economic conditions poses a risk as consumers and businesses may postpone spending in response to tighter credit, unemployment, negative financial news, and/or declines in income or asset values, which could have a material negative effect on demand for our products. As a retailer that is dependent upon consumer discretionary spending, our results of operations are sensitive to changes in macroeconomic conditions. Our customers may have less money for discretionary purchases as a result of job losses, foreclosures, bankruptcies, increased fuel and energy costs, higher interest rates, higher taxes, reduced access to credit, and lower home values. These and other economic factors could adversely affect demand for our products, which could adversely affect our financial condition and operating results. Instability in the financial markets may adversely affect our business. Instability in the global financial markets could reduce availability of credit to our business. Although we currently have a revolving credit agreement in place until May 19, 2021, tightening of credit markets could make it more difficult for us to access funds, refinance our existing indebtedness, enter into agreements for new indebtedness, or obtain funding through the issuance of the Company’s securities. Other than insignificant amounts used for standby letters of credit, we do not have any borrowings under our credit facility.

5
We rely on a few key suppliers for a majority of our merchandise purchases (including a significant portion from one key supplier). The inability of these key suppliers to access liquidity, or the insolvency of key suppliers, could lead to their failure to deliver merchandise to us. Our inability to obtain merchandise in a timely manner from major suppliers could have a material adverse effect on our business, financial condition, and results of operations. Material changes in the market value of the securities we hold may adversely affect our results of operations and financial condition. At February 3, 2018, our cash and cash equivalents totaled $849 million. The majority of our investments were short-term deposits in highly-rated banking institutions. As of February 3, 2018, $669 million of our cash and cash equivalents were held in foreign jurisdictions, almost half of which was held in U.S. dollars. We regularly monitor our counterparty credit risk and mitigate our exposure by making short-term investments only in highly-rated institutions and by limiting the amount we invest in any one institution. We continually monitor the creditworthiness of our counterparties. At February 3, 2018, all of the investments were in investment grade institutions. Despite an investment grade rating, it is possible that the value or liquidity of our investments may decline due to any number of factors, including general market conditions and bank-specific credit issues. Our U.S. pension plan trust holds assets totaling $639 million at February 3, 2018. The fair values of these assets held in the trust are compared to the plan’s projected benefit obligation to determine the pension funding liability. We attempt to mitigate funding risk through asset diversification, and we regularly monitor investment risk of our portfolio through quarterly investment portfolio reviews and periodic asset and liability studies. Despite these measures, it is possible that the value of our portfolio may decline in the future due to any number of factors, including general market conditions and credit issues. Such declines could affect the funded status of our pension plan and future funding requirements. If our long-lived assets, goodwill or other intangible assets become impaired, we may need to record significant non-cash impairment charges. We review our long-lived assets, goodwill and other intangible assets when events indicate that the carrying value of such assets may be impaired. Goodwill and other indefinite lived intangible assets are reviewed for impairment if impairment indicators arise and, at a minimum, annually. As of February 3, 2018, we had $160 million of goodwill; this asset is not amortized but is subject to an impairment test, which consists of either a qualitative assessment on a reporting unit level, or a two-step impairment test, if necessary. The determination of impairment charges is significantly affected by estimates of future operating cash flows and estimates of fair value. Our estimates of future operating cash flows are identified from our long-range strategic plans, which are based upon our experience, knowledge, and expectations; however, these estimates can be affected by factors such as our future operating results, future store profitability, and future economic conditions, all of which can be difficult to predict accurately. Any significant deterioration in macroeconomic conditions could affect the fair value of our long-lived assets, goodwill, and other intangible assets and could result in future impairment charges, which would adversely affect our results of operations. Our financial results may be adversely affected by tax rates or exposure to additional tax liabilities. We are a U.S.-based multinational company subject to tax in multiple U.S. and foreign tax jurisdictions. Our provision for income taxes is based on a jurisdictional mix of earnings, statutory rates, and enacted tax rules, including transfer pricing. Significant judgment is required in determining our provision for income taxes and in evaluating our tax positions on a worldwide basis. Our effective tax rate could be adversely affected by a number of factors, including shifts in the mix of pretax results by tax jurisdiction, changes in tax laws or related interpretations in the jurisdictions in which we operate, and tax assessments and related interest and penalties resulting from income tax audits. Changes in tax laws and interpretations may affect our earnings negatively. On December 22, 2017, the Tax Cuts and Jobs Act (H.R. 1) (the “Tax Act”) was signed into law. The Tax Act includes a number of changes in existing tax law affecting businesses including, among other things, a reduction in the U.S. corporate income tax rate from 35 percent to 21 percent, disallowance of certain deductions that had previously been allowed, limitations on interest deductions, alteration of the expensing of capital expenditures, adoption of a territorial tax system, assessment of a repatriation tax or “toll-charge” on undistributed earnings and profits of U.S.-owned foreign corporations, and introduction of certain anti-base erosion provisions.

6
In the fourth quarter of 2017, we recognized a provisional net tax expense of $99 million associated with the Tax Act; however, the ultimate effect on our financial condition and results of operations in 2018 and future years remains uncertain and may differ materially from our expectations due to the issuance of technical guidance regarding elements of the Tax Act and changes in interpretations and assumptions we have made with respect to the Tax Act. In addition, it is unclear how these U.S. federal income tax changes will affect state and local taxation, which often uses federal taxable income as a starting point for computing state and local tax liabilities. As such, there may be material adverse effects resulting from the Tax Act that we have not yet identified. The effects of natural disasters, terrorism, acts of war, and public health issues may adversely affect our business. Natural disasters, including earthquakes, hurricanes, floods, and tornadoes may affect store and distribution center operations. In addition, acts of terrorism, acts of war, and military action both in the United States and abroad can have a significant effect on economic conditions and may negatively affect our ability to purchase merchandise from suppliers for sale to our customers. Public health issues, such as flu or other pandemics, whether occurring in the United States or abroad, could disrupt our operations and result in a significant part of our workforce being unable to operate or maintain our infrastructure or perform other tasks necessary to conduct our business. Additionally, public health issues may disrupt, or have an adverse effect on, our suppliers’ operations, our operations, our customers, or customer demand. Our ability to mitigate the adverse effect of these events depends, in part, upon the effectiveness of our disaster preparedness and response planning as well as business continuity planning. However, we cannot be certain that our plans will be adequate or implemented properly in the event of an actual disaster. We may be required to suspend operations in some or all of our locations, which could have a material adverse effect on our business, financial condition, and results of operations. Any significant declines in public safety or uncertainties regarding future economic prospects that affect customer spending habits could have a material adverse effect on customer purchases of our products. Manufacturer compliance with our social compliance program requirements. We require our independent manufacturers to comply with our policies and procedures, which cover many areas including labor, health and safety, and environmental standards. We monitor compliance with our policies and procedures using internal resources, as well as third-party monitoring firms. Although we monitor their compliance with these policies and procedures, we do not control the manufacturers or their practices. Any failure of our independent manufacturers to comply with our policies and procedures or local laws in the country of manufacture could disrupt the shipment of merchandise to us, force us to locate alternate manufacturing sources, reduce demand for our merchandise, or damage our reputation. Complications in our distribution centers and other factors affecting the distribution of merchandise may affect our business. We operate multiple distribution centers worldwide to support our businesses. In addition to the distribution centers that we operate, we have third-party arrangements to support our operations in the United States, Canada, Australia, and New Zealand. If complications arise with any facility or if any facility is severely damaged or destroyed, our other distribution centers may be unable to support the resulting additional distribution demands. We also may be affected by disruptions in the global transportation network such as port strikes, weather conditions, work stoppages or other labor unrest. These factors may adversely affect our ability to deliver inventory on a timely basis. We depend upon third-party carriers for shipment of merchandise; any interruption in service by these carriers for any reason could cause disruptions in our business, a loss of sales and profits, and other material adverse effects. We are subject to technology risks including failures, security breaches, and cybersecurity risks which could harm our business, damage our reputation, and increase our costs in an effort to protect against such risks. Information technology is a critically important part of our business operations. We depend on information systems to process transactions, make operational decisions, manage inventory, operate our websites, purchase, sell and ship goods on a timely basis, and maintain cost-efficient operations. There is a risk that we could experience a business interruption, theft of information, or reputational damage as a result of a cyber-attack, such as an infiltration of a data center or data leakage of confidential information, either internally or at our third-party providers. We may experience operational problems with our information systems as a result of system failures, system implementation issues, viruses, malicious hackers, sabotage, or other causes.

7
We invest in security technology to protect the data stored by us, including our data and business processes, against the risk of data security breaches and cyber-attacks. Our data security management program includes enforcement of standard data protection policies such as Payment Card Industry compliance. Additionally, we certify our major technology suppliers and any outsourced services through accepted security certification measures. We maintain and routinely test backup systems and disaster recovery, along with external network security penetration testing by an independent third party as part of our business continuity preparedness. While we believe that our security technology and processes follow leading practices in the prevention of security breaches and the mitigation of cybersecurity risks, given the ever-increasing abilities of those intent on breaching cybersecurity measures and given the necessity of our reliance on the security procedures of third-party vendors, the total security effort at any point in time may not be completely effective. Any such security breaches and cyber incidents could adversely affect our business. Failure of our systems, including failures due to cyber-attacks that would prevent the ability of systems to function as intended, could cause transaction errors, loss of customers and sales, and negative consequences to us, our employees, and those with whom we do business. Any security breach involving the misappropriation, loss, or other unauthorized disclosure of confidential information by us could also severely damage our reputation, expose us to the risks of litigation and liability, increase operating costs associated with remediation, and harm our business. While we carry insurance that would mitigate the losses, such insurance may be insufficient to compensate us for potentially significant losses. Risks associated with digital operations. Our digital operations are subject to numerous risks, including risks related to the failure of the computer systems that operate our websites and mobile sites and their related support systems, computer viruses, cybersecurity risks, telecommunications failures, denial of service attacks, and similar disruptions. Also, we will require additional capital in the future to sustain or grow our digital commerce business. Risks related to digital commerce include those associated with credit card fraud, the need to keep pace with rapid technological change, governmental regulation, and legal uncertainties with respect to Internet regulatory compliance. If any of these risks materialize, it could have a material adverse effect on our business. Privacy and data security concerns and regulation could result in additional costs and liabilities. The protection of customer, employee, and Company data is critical. The regulatory environment surrounding information security and privacy is demanding, with the frequent imposition of new and changing requirements. In addition, customers have a high expectation that we will adequately protect their personal information. Any actual or perceived misappropriation or breach involving this data could attract negative media attention, cause harm to our reputation or result in liability (including but not limited to fines, penalties or lawsuits), any of which could have a material adverse effect on our business, operational results, financial position and cash flows. Additionally, the E.U. adopted a comprehensive General Data Privacy Regulation (the “GDPR”), which will become fully effective in May 2018. The GDPR requires companies to satisfy new requirements regarding the handling of personal and sensitive data, including its use, protection and the ability of persons whose data is stored to correct or delete such data about themselves. Failure to comply with GDPR requirements could result in penalties of up to 4 percent of worldwide revenue. The GDPR and other similar laws and regulations, as well as any associated inquiries or investigations or any other government actions, may be costly to comply with, result in negative publicity, increase our operating costs, require significant management time and attention, and subject us to remedies that may harm our business, including fines or demands or orders that we modify or cease existing business practices. The technology enablement of omni-channel in our business is complex and involves the development of a new digital platform and a new order management system in order to enhance the complete customer experience. We continue to invest in initiatives designed to deliver a high-quality, coordinated shopping experience online, in-stores, and on mobile devices, which requires substantial investment in technology, information systems, and employee training, as well as significant management time and resources. Our omni-channel retailing efforts include the integration and implementation of new technology, software, and processes to be able to fulfill orders from any point within our system of stores and distribution centers, which is extremely complex and may not meet customer expectations for timely and accurate deliveries. These efforts involve substantial risk, including risk of implementation delays, cost overruns, technology interruptions, supply and distribution delays, and other issues that can affect the successful implementation and operation of our omni-channel initiatives.

8
If our omni-channel initiatives are not successful, or we do not realize the return on our omni-channel investments that we anticipate, our financial performance and future growth could be materially adversely affected. Our reliance on key management. Future performance will depend upon our ability to attract, retain, and motivate our executive and senior management teams. Our executive and senior management teams have substantial experience and expertise in our business and have made significant contributions to our success. Our future performance depends to a significant extent both upon the continued services of our current executive and senior management teams, as well as our ability to attract, hire, motivate, and retain additional qualified management in the future. While we feel that we have adequate succession planning and executive development programs, competition for key executives in the retail industry is intense, and our operations could be adversely affected if we cannot retain and attract qualified executives. Risks associated with attracting and retaining store and field associates. Our success depends, in part, upon our ability to attract, develop, and retain a sufficient number of qualified store and field associates. The turnover rate in the retail industry is generally high. If we are unable to attract and retain quality associates, our ability to meet our growth goals or to sustain expected levels of profitability may be compromised. Our ability to meet our labor needs while controlling costs is subject to external factors such as unemployment levels, prevailing wage rates, minimum wage legislation, overtime regulations, and changing demographics. Changes in employment laws or regulation could harm our performance. Various foreign and domestic labor laws govern our relationship with our employees and affect our operating costs. These laws include minimum wage requirements, overtime and sick pay, paid time off, work scheduling, healthcare reform and the Patient Protection and Affordable Care Act (“ACA”), unemployment tax rates, workers’ compensation rates, European works council requirements, and union organization. A number of factors could adversely affect our operating results, including additional government-imposed increases in minimum wages, overtime and sick pay, paid leaves of absence and mandated health benefits, and changing regulations from the National Labor Relations Board or other agencies. At this time, there is uncertainty concerning whether the ACA will be repealed or what requirements will be included in a new law, if enacted. Complying with any new legislation and/or reversing changes implemented under the ACA could be time-intensive and expensive, and may affect our business. Legislative or regulatory initiatives related to global warming/climate change concerns may negatively affect our business. There has been an increasing focus and significant debate on global climate change, including increased attention from regulatory agencies and legislative bodies. This increased focus may lead to new initiatives directed at regulating an as-yet unspecified array of environmental matters. Legislative, regulatory, or other efforts to combat climate change could result in future increases in taxes or in the cost of transportation and utilities, which could decrease our operating profits and could necessitate future additional investments in facilities and equipment. We are currently unable to predict the potential effects that any such future environmental initiatives may have on our business. We may be adversely affected by regulatory and litigation developments. We are exposed to the risk that federal or state legislation may negatively affect our operations. Changes in federal or state wage requirements, employee rights, health care, social welfare or entitlement programs, such as health insurance, paid leave programs, or other changes in workplace regulation could increase our cost of doing business or otherwise adversely affect our operations. Additionally, we are regularly involved in various litigation matters, including class actions, which arise in the ordinary course of our business. Litigation or regulatory developments could adversely affect our business operations and financial performance.

9
We operate in many different jurisdictions and we could be adversely affected by violations of the U.S. Foreign Corrupt Practices Act and similar worldwide anti-corruption laws. The U.S. Foreign Corrupt Practices Act (“FCPA”) and similar worldwide anti-corruption laws, including the U.K. Bribery Act of 2010, which is broader in scope than the FCPA, generally prohibit companies and their intermediaries from making improper payments to government officials for the purpose of obtaining or retaining business. Our internal policies mandate compliance with these anti-corruption laws. Despite our training and compliance programs, we cannot be assured that our internal control policies and procedures will always protect us from reckless or criminal acts committed by our employees or agents. Our continued expansion outside the United States, including in developing countries, could increase the risk of FCPA violations in the future. Violations of these laws, or allegations of such violations, could result in a material adverse effect on our results of operations or financial condition. Failure to fully comply with Section 404 of the Sarbanes-Oxley Act of 2002 could negatively affect our business, market confidence in our reported financial information, and the price of our common stock. We continue to document, test, and monitor our internal controls over financial reporting in order to satisfy all of the requirements of Section 404 of the Sarbanes-Oxley Act of 2002; however, we cannot be assured that our disclosure controls and procedures and our internal controls over financial reporting will prove to be completely adequate in the future. Failure to fully comply with Section 404 of the Sarbanes-Oxley Act of 2002 could negatively affect our business, market confidence in our reported financial information, and the price of our common stock. Item 1B. Unresolved Staff Comments None. Item 2. Properties The properties of the Company and its consolidated subsidiaries consist of land, leased stores, administrative facilities, and distribution centers. Gross square footage and total selling area for the Athletic Stores segment at the end of 2017 were approximately 13.30 and 7.71 million square feet, respectively. These properties, which are primarily leased, are located in the United States and its territories, Canada, various European countries, Australia, and New Zealand. We currently operate five distribution centers, of which two are owned and three are leased, occupying an aggregate of 2.9 million square feet. Three distribution centers are located in the United States, one in Germany, and one in the Netherlands. The location in Germany serves as the central warehouse distribution center for the Runners Point and Sidestep stores and their direct-to-customer business. We also own a cross-dock and manufacturing facility, and operate a leased warehouse in the United States, both of which support our Team Edition apparel business. The lease for our leased distribution center in Germany expires during 2019 and the Company is currently negotiating a lease extension for this facility. We believe that all leases of properties that are material to our operations may be renewed, or that alternative properties are available, on terms not materially less favorable to us than existing leases. Item 3. Legal Proceedings Information regarding the Company’s legal proceedings is contained in the Legal Proceedings note under “Item 8. Consolidated Financial Statements and Supplementary Data.” Item 4. Mine Safety Disclosures Not applicable.

10
Item 4A. Executive Officers of the Registrant The following table provides information with respect to all persons serving as executive officers as of March 29, 2018, including business experience for the last five years.
Chairman, President and Chief Executive Officer Richard A. Johnson Executive Vice President and Chief Executive Officer — North America Stephen D. Jacobs Executive Vice President and Chief Executive Officer — International Lewis P. Kimble Executive Vice President and Chief Financial Officer Lauren B. Peters Executive Vice President and Chief Information and
Customer Connectivity Officer Pawan Verma
Senior Vice President and Chief Human Resources Officer Paulette R. Alviti Senior Vice President and Chief Accounting Officer Giovanna Cipriano Senior Vice President, General Counsel and Secretary Sheilagh M. Clarke Senior Vice President — Strategy and Store Development W. Scott Martin Vice President, Treasurer John A. Maurer
Richard A. Johnson, age 60, has served as Chairman of the Board since May 2016 and President and Chief Executive Officer since December 2014. Mr. Johnson previously served as Executive Vice President and Chief Operating Officer from May 2012 through November 2014. He served as Executive Vice President and Group President from July 2011 to May 2012; President and Chief Executive Officer of Foot Locker U.S., Lady Foot Locker, Kids Foot Locker, and Footaction from January 2010 to July 2011; President and Chief Executive Officer of Foot Locker Europe from August 2007 to January 2010; and President and Chief Executive Officer of Footlocker.com/Eastbay from April 2003 to August 2007. Stephen D. Jacobs, age 55, has served as Executive Vice President and Chief Executive Officer-North America since February 2016. He previously served as Executive Vice President and Chief Executive Officer Foot Locker North America from December 2014 through February 2016 and President and Chief Executive Officer of Foot Locker U.S., Lady Foot Locker, Kids Foot Locker, and Footaction from July 2011 to November 2014. Lewis P. Kimble, age 59, has served as Executive Vice President and Chief Executive Officer-International since February 2016. Mr. Kimble previously served as President and Chief Executive Officer of Foot Locker Europe from February 2010 to February 2016. Lauren B. Peters, age 56, has served as Executive Vice President and Chief Financial Officer since July 2011. Pawan Verma, age 41, has served as Executive Vice President, Chief Information and Customer Connectivity Officer since October 2017 and as Senior Vice President and Chief Information Officer from August 2015 to September 2017. From February 2013 to July 2015, Mr. Verma served in various technology leadership roles at Target Corporation ranging from enterprise architecture, e-commerce, mobile and digital, with his most recent role at Target as Vice President - Digital Technology and API Platforms. Paulette R. Alviti, age 47, has served as Senior Vice President and Chief Human Resources Officer since June 2013. From March 2010 to May 2013, Ms. Alviti served in various roles at PepsiCo, Inc., with her most recent role as Senior Vice President and Chief Human Resources Asia, Middle East, Africa. Giovanna Cipriano, age 48, has served as Senior Vice President and Chief Accounting Officer since May 2009. Sheilagh M. Clarke, age 58, has served as Senior Vice President, General Counsel and Secretary since June 2014. She previously served as Vice President, Associate General Counsel and Assistant Secretary from May 2007 to May 2014. W. Scott Martin, age 50, has served as Senior Vice President - Strategy and Store Development since October 2017 and as Senior Vice President — Real Estate from June 2016 to September 2017. Mr. Martin previously served as Vice President, Store Development – Asia Pacific with Gap Inc. from June 2014 to June 2016. Prior to that role, he served in various roles at Starbucks Coffee Company: Director, Strategy Development, China, Asia Pacific and Emerging Brands (July 2013 to July 2014); Director, Global Store Development (June 2007 to July 2013). John A. Maurer, age 58, has served as Vice President, Treasurer since September 2006. In addition to this role, he also served as the Vice President of Investors Relations from February 2011 through March 2018. There are no family relationships among the executive officers or directors of the Company.

11
PART II
Item 5. Market for the Company’s Common Equity, Related Stockholder Matters and Issuer Purchases of Equity Securities
Foot Locker, Inc. common stock (ticker symbol “FL”) is listed on The New York Stock Exchange as well as on the Börse Stuttgart stock exchange in Germany. As of February 3, 2018, the Company had 13,244 shareholders of record owning 119,829,023 common shares. The following table provides the intra-day high and low sales prices for the Company’s common stock for the periods indicated below:
2017 2016 High Low High Low 1st Quarter $ 77.86 $ 65.88 $ 69.65 $ 58.172nd Quarter 77.71 44.59 62.45 50.903rd Quarter 51.29 29.89 69.61 56.804th Quarter 53.17 28.42 79.43 65.39 During each of the quarters of 2017, the Company declared a dividend of $0.31 per share. The Board of Directors reviews the dividend policy and rate, taking into consideration the overall financial and strategic outlook for our earnings, liquidity, and cash flow. On February 20, 2018, the Board of Directors declared a quarterly dividend of $0.345 per share to be paid on May 4, 2018. This dividend represents an 11 percent increase over the previous quarterly per share amount.
The following table is a summary of our fourth quarter share repurchases:
Approximate Total Number of Dollar Value of Total Average Shares Purchased as Shares that may Number Price Part of Publicly yet be Purchased of Shares Paid Per Announced Under the Date Purchased Purchased (1) Share (1) Program (2) Program (2) Oct. 29 - Nov. 25, 2017 1,500,000 $ 30.96 1,500,000 $ 816,552,335 Nov. 26 - Dec. 30, 2017 1,333,433 43.87 1,323,930 758,463,867 Dec. 31 - Feb. 3, 2018 — — — 758,463,867 2,833,433 $ 37.04 2,823,930
(1) These columns also reflect shares acquired in satisfaction of the tax withholding obligation of holders of restricted stock awards which vested during the quarter, and shares repurchased pursuant to Rule 10b5-1 under the Securities Exchange Act of 1934. The calculation of the average price paid per share includes all fees, commissions, and other costs associated with the repurchase of such shares.
(2) On February 14, 2017, the Board of Directors approved a 3-year, $1.2 billion share repurchase program extending through January 2020. Through February 3, 2018, 12 million shares of common stock were purchased under this program, for an aggregate cost of $442 million.

12
Performance Graph The graph below compares the cumulative five-year total return to shareholders (common stock price appreciation plus dividends, on a reinvested basis) on Foot Locker, Inc.’s common stock relative to the total returns of the S&P 500 Specialty Retailing Index and the S&P 500 Index. The following Performance Graph and related information shall not be deemed “soliciting material” or deemed to be filed with the SEC, nor shall such information be incorporated by reference into any future filing under the Securities Act of 1933 or Securities Exchange Act of 1934, each as amended, except to the extent that we specifically incorporate it by reference into such filing.
2/2/2013 2/1/2014 1/31/2015 1/30/2016 1/28/2017 2/3/2018 Foot Locker, Inc. $ 100.00 $ 114.24 $ 160.33 $ 206.69 $ 211.63 $ 154.65 S&P 500 Index $ 100.00 $ 120.29 $ 137.39 $ 136.47 $ 164.93 $ 202.57 S&P 500 Specialty Retailing Index $ 100.00 $ 118.15 $ 157.66 $ 170.76 $ 183.70 $ 226.17

13
Item 6. Selected Financial Data
FIVE-YEAR SUMMARY OF SELECTED FINANCIAL DATA The selected financial data below should be read in conjunction with the Consolidated Financial Statements and the Notes thereto and other information contained elsewhere in this report.
2017 (1) 2016 2015 2014 2013 Summary of Operations (in millions, except per share amounts) Sales $ 7,782 7,766 7,412 7,151 6,505 Gross margin 2,456 2,636 2,505 2,374 2,133 Selling, general and administrative expenses 1,501 1,472 1,415 1,426 1,334 Depreciation and amortization 173 158 148 139 133 Litigation and other charges 211 6 105 4 2 Interest (income) / expense, net (2) 2 4 5 5 Other income (5) (6) (4) (9) (4)Net income 284 664 541 520 429 Per Common Share Data Basic earnings 2.23 4.95 3.89 3.61 2.89 Diluted earnings 2.22 4.91 3.84 3.56 2.85 Common stock dividends declared per share 1.24 1.10 1.00 0.88 0.80 Weighted-average Common Shares Outstanding Basic earnings 127.2 134.0 139.1 143.9 148.4 Diluted earnings 127.9 135.1 140.8 146.0 150.5 Financial Condition Cash, cash equivalents, and short-term investments $ 849 1,046 1,021 967 867 Merchandise inventories 1,278 1,307 1,285 1,250 1,220 Property and equipment, net 866 765 661 620 590 Total assets 3,961 3,840 3,775 3,577 3,487 Long-term debt and obligations under capital leases 125 127 130 134 139 Total shareholders’ equity 2,519 2,710 2,553 2,496 2,496 Financial Ratios Sales per average gross square foot (2) $ 495 515 504 490 460 SG&A as a percentage of sales 19.3 % 19.0 19.1 19.9 20.5 Net income margin 3.6 % 8.6 7.3 7.3 6.6 Adjusted net income margin (3) 6.6 % 8.4 8.2 7.3 6.6 Earnings before interest and taxes (EBIT) (3) $ 576 1,006 841 814 668 EBIT margin (3) 7.4 % 13.0 11.3 11.4 10.3 Adjusted EBIT (3) $ 762 1,012 946 816 676 Adjusted EBIT margin (3) 9.9 % 13.0 12.8 11.4 10.4 Return on assets (ROA) 7.3 % 17.4 14.7 14.7 12.5 Return on invested capital (ROIC) (3) 11.0 % 15.1 15.8 15.0 14.1 Net debt capitalization percent (3), (4) 54.4 % 48.5 47.4 43.4 42.5 Current ratio 4.1 4.3 3.7 3.5 3.8 Other Data Capital expenditures $ 274 266 228 190 206 Number of stores at year end 3,310 3,363 3,383 3,423 3,473 Total selling square footage at year end (in millions) 7.71 7.63 7.58 7.48 7.47 Total gross square footage at year end (in millions) 13.30 13.12 12.92 12.73 12.71
(1) 2017 represents the 53 weeks ended February 3, 2018.
(2) Calculated as Athletic Store sales divided by the average monthly ending gross square footage of the last thirteen months. The computation for each of the years presented reflects the foreign exchange rate in effect for such year. The 2017 amount has been calculated excluding the sales of the 53rd week.
(3) These represent non-GAAP measures, see Item 7, “Management’s Discussion and Analysis of Financial Condition and Results of Operations” for additional information and calculation.
(4) Represents total debt and obligations under capital leases, net of cash, cash equivalents, and short-term investments. This calculation includes the present value of operating leases and therefore is considered a non-GAAP measure.

14
Item 7. Management’s Discussion and Analysis of Financial Condition and Results of Operations Disclosure Regarding Forward-Looking Statements This report contains forward-looking statements within the meaning of the federal securities laws. Other than statements of historical facts, all statements which address activities, events, or developments that the Company anticipates will or may occur in the future, including, but not limited to, such things as future capital expenditures, expansion, strategic plans, financial objectives, dividend payments, stock repurchases, growth of the Company’s business and operations, including future cash flows, revenues, and earnings, and other such matters, are forward-looking statements. These forward-looking statements are based on many assumptions and factors which are detailed in the Company’s filings with the U.S. Securities and Exchange Commission. These forward-looking statements are based largely on our expectations and judgments and are subject to a number of risks and uncertainties, many of which are unforeseeable and beyond our control. For additional discussion on risks and uncertainties that may affect forward-looking statements, see “Risk Factors” in Part I, Item 1A. Any changes in such assumptions or factors could produce significantly different results. The Company undertakes no obligation to update forward-looking statements, whether as a result of new information, future events, or otherwise. Business Overview Foot Locker, Inc., through its subsidiaries, operates in two reportable segments — Athletic Stores and Direct-to-Customers. The Athletic Stores segment is one of the largest athletic footwear and apparel retailers in the world, with formats that include Foot Locker, Kids Foot Locker, Lady Foot Locker, Champs Sports, Footaction, Runners Point, Sidestep, and SIX:02. The Direct-to-Customers segment includes Footlocker.com, Inc. and other affiliates, including Eastbay, Inc., and our international e-commerce businesses, which sell to customers through their Internet and mobile sites and catalogs. The Foot Locker brand is one of the most widely recognized names in the markets in which we operate, epitomizing premium quality for the active lifestyle customer. This brand equity has aided our ability to successfully develop and increase our portfolio of complementary retail store formats, such as Lady Foot Locker and Kids Foot Locker, as well as Footlocker.com, part of our direct-to-customer business. Through various marketing channels and experiences, including social, digital, broadcast, and print media, as well as various sports sponsorships and events, we reinforce our image with a consistent message — namely, that we are the destination for premium athletically-inspired shoes and apparel with a wide selection of merchandise in a full-service environment. Store Profile
Square Footage January 28, February 3, Relocations/ (in thousands) 2017 Opened Closed 2018 Remodels Selling Gross Foot Locker U.S. 948 4 42 910 44 2,430 4,225 Foot Locker Europe 622 24 10 636 47 957 2,071 Foot Locker Canada 119 1 9 111 6 264 431 Foot Locker Asia Pacific 95 5 2 98 9 140 230 Kids Foot Locker 411 39 14 436 25 747 1,285 Lady Foot Locker 124 — 39 85 — 115 195 Champs Sports 545 4 8 541 23 1,934 2,994 Footaction 261 13 14 260 21 829 1,374 Runners Point 122 1 5 118 — 150 258 Sidestep 86 — 3 83 8 76 131 SIX:02 30 3 1 32 — 65 109 Total 3,363 94 147 3,310 183 7,707 13,303

15
Athletic Stores We operated 3,310 stores in the Athletic Stores segment as of the end of 2017. The following is a brief description of the Athletic Stores segment’s operating businesses: Foot Locker — Foot Locker is a leading global youth culture brand that connects the sneaker obsessed consumer with the most innovative and culturally relevant sneakers and apparel. Across all of our consumer touchpoints (stores, websites, mobile apps, social media), Foot Locker enables consumers to fulfill their desire to be part of sneaker and youth culture. We curate special product assortments and marketing content that supports our premium position – from leading global brands such as Nike, Jordan, adidas, and Puma, as well as new and emerging brands in the athletic and lifestyle space. We connect emotionally with our consumers through a combination of global brand events and highly targeted and personalized experiences in local markets. Foot Locker’s 1,755 stores are located in 24 countries including 910 in the United States, Puerto Rico, U.S. Virgin Islands, and Guam, 111 in Canada, 636 in Europe, and a combined 98 in Australia and New Zealand. Our domestic stores have an average of 2,700 selling square feet and our international stores have an average of 1,600 selling square feet. Kids Foot Locker — Kids Foot Locker offers the largest selection of brand-name athletic footwear, apparel and accessories for children. Our stores, websites and social media channels feature products, content and experiences geared toward youth sneaker culture. Of our 436 stores, 375 are located in the United States, Puerto Rico, and the U.S. Virgin Islands, 40 in Europe, 19 in Canada, and a combined 2 in Australia and New Zealand. These stores have an average of 1,700 selling square feet. Lady Foot Locker — Lady Foot Locker is a U.S. retailer of athletic footwear, apparel, and accessories dedicated to sneaker-obsessed young women. Our stores provide premium sneakers and apparel, carefully selected to reflect the latest styles. Lady Foot Locker operates 85 stores that are located in the United States and Puerto Rico. These stores have an average of 1,400 selling square feet. Champs Sports — Champs Sports is one of the largest mall-based specialty athletic footwear and apparel retailers in North America. With a focus on the lifestyle expression of sport, Champs Sports’ product categories include athletic footwear and apparel, and sport-lifestyle inspired accessories. This assortment allows Champs Sports to offer the best head-to-toe fashion stories representing the most powerful athletic brands, sports teams, and athletes in North America. Of our 541 stores, 512 are located throughout the United States, Puerto Rico, and the U.S. Virgin Islands and 29 in Canada. The Champs Sports stores have an average of 3,600 selling square feet. Footaction — Footaction is a North American athletic footwear and apparel retailer that offers the freshest, best edited selection of athletic lifestyle brands and looks. This banner is uniquely positioned at the intersection of sport and style, with a focus on authentic, premium product. The primary consumer is a style-obsessed, confident, influential young male who is always dressed to impress. Of our 260 stores, 258 are located throughout the United States and Puerto Rico and 2 are in Canada. The Footaction stores have an average of 3,200 selling square feet. Runners Point — Runners Point specializes in running footwear, apparel, and equipment for both performance and lifestyle purposes. This banner offers athletically inspired premium products and personalized service. Runners Point also caters to local running communities providing technical products, training tips and access to local running and group events, while also serving their lifestyle running needs. Our 118 stores are located in Germany, Austria, and Switzerland. Runners Point stores have an average of 1,300 selling square feet. Sidestep — Sidestep is a predominantly athletic fashion footwear banner. Our 83 stores are located in Germany, Austria, the Netherlands, and Switzerland. Sidestep caters to a more discerning, fashion forward consumer. Sidestep stores have an average of 900 selling square feet. SIX:02 — SIX:02 is for women who want to look and feel great both at the gym and in everyday life. This banner provides stylish casual and fitness looks for women on the go. SIX:02 is unique in the market place because of the ability to feature both footwear and apparel assortments across many brands – from traditional athletic brands, such as Nike, adidas and Puma – to new up-and-coming brands. Whether she is working out, going out or just hanging out, SIX:02 has an expansive selection of apparel, footwear, and accessories to choose from. SIX:02 operates 32 stores in the United States and have an average of 2,000 selling square feet.

16
Direct-to-Customers Our Direct-to-Customers segment is multi-branded and sells directly to customers through Internet and mobile sites and catalogs. The Direct-to-Customers segment operates the websites for eastbay.com, final-score.com, and eastbayteamsales.com. Additionally, this segment includes the websites, both desktop and mobile, aligned with the brand names of our store banners (footlocker.com, ladyfootlocker.com, six02.com, kidsfootlocker.com, champssports.com, footaction.com, footlocker.ca, footlocker.eu, footlocker.au, runnerspoint.com, and sidestep-shoes.com). These sites offer some of the largest online selections of athletically inspired shoes and apparel, while providing a seamless link between e-commerce and physical stores. Eastbay — Eastbay is among the largest direct marketers in the United States, providing serious high school and other athletes with a complete sports solution including athletic footwear, apparel, equipment, and team licensed merchandise for a broad range of sports. Franchise Operations The Company operates franchised Foot Locker stores located within the Middle East, as well as franchised stores in Germany under the Runners Point banner. In addition, we entered into a franchise agreement during 2017 with Fox-Wizel Ltd for franchised stores operating in Israel. Also during 2017, we terminated our franchise agreement with the third party that operated stores in the Republic of Korea. A total of 112 franchised stores were operating at February 3, 2018, 14 were operating in Germany and 98 were operating in the Middle East, of which 25 are in Israel. U.S. Tax Reform On December 22, 2017, the United States enacted tax reform legislation (“Tax Act”) that included a broad range of business tax provisions, including but not limited to a reduction in the U.S. corporate income tax rate from 35 percent to 21 percent as well as provisions that limit or eliminate various deductions or credits. The legislation also results in certain U.S. allocated expenses (e.g. interest and general administrative expenses) to be taxed and imposes a new tax on U.S. cross-border payments. Furthermore, the legislation includes a one-time transition tax on accumulated foreign earnings and profits. In response to the enactment of the Tax Act, the SEC issued Staff Accounting Bulletin No. 118 which provides guidance to address the complexity in accounting for this new legislation. When the initial accounting for items under the new legislation is incomplete, the guidance allows us to recognize provisional amounts when reasonable estimates can be made or to continue to apply the prior tax law if a reasonable estimate cannot be made. The SEC has provided up to a one-year window for companies to finalize the accounting for the effect of this new legislation and we anticipate finalizing our accounting during 2018. While our accounting for the new U.S. tax legislation is not complete, we have made reasonable estimates for some provisions and recognized a $99 million tax liability for the mandatory deemed repatriation of foreign sourced net earnings and a change in our permanent reinvestment assertion. The remeasurement of our deferred tax assets and liabilities was not significant. The 2017 charge for these provisions reflects our best estimate based on information currently available and our current interpretation of the Tax Act. The Tax Act includes a provision effective in 2018, to tax global intangible low-taxed income ("GILTI") of the Company’s foreign subsidiaries. Under generally accepted accounting principles (“GAAP”), we can make an accounting policy election to either treat taxes due on the GILTI inclusion as a current period expense, or factor such amounts into our measurement of deferred taxes. Due to the complexity of the new GILTI rules, we are continuing to evaluate this provision of the Tax Act and the application of GAAP and we have not yet elected an accounting policy. As of the date of this Form 10-K, we are continuing to evaluate the accounting for this legislation. We continue to assemble and analyze all the information required to prepare and analyze these effects and await additional guidance from the U.S. Treasury Department, the IRS or other standard-setting bodies. Additionally, we continue to analyze other information. Accordingly, we may record additional provisional amounts or adjustments to provisional amounts. Any subsequent adjustments will be recorded to tax expense in the quarter when the analysis is complete. See Critical Accounting Policies within this item and Note 17, Income Taxes in “Item 8. Consolidated Financial Statements and Supplementary Data” for further details on U.S. tax reform.

17
Reconciliation of Non-GAAP Measures In addition to reporting the Company’s financial results in accordance with GAAP, the Company reports certain financial results that differ from what is reported under GAAP. In the following tables, we have presented certain financial measures and ratios identified as non-GAAP such as sales excluding 53rd week, Earnings Before Interest and Taxes (“EBIT”), adjusted EBIT, adjusted EBIT margin, adjusted income before income taxes, adjusted net income, adjusted net income margin, adjusted diluted earnings per share, Return on Invested Capital (“ROIC”), free cash flow, and net debt capitalization. We present these non-GAAP measures because we believe they assist investors in comparing our performance across reporting periods on a consistent basis by excluding items that are not indicative of our core business or which affect comparability. In addition, these non-GAAP measures are useful in assessing our progress in achieving our long-term financial objectives. Additionally, we present certain amounts as excluding the effects of foreign currency fluctuations, which are also considered non-GAAP measures. Throughout the following discussions, where amounts are expressed as excluding the effects of foreign currency fluctuations, such changes are determined by translating all amounts in both years using the prior-year average foreign exchange rates. Presenting amounts on a constant currency basis is useful to investors because it enables them to better understand the changes in our businesses that are not related to currency movements. Fiscal year 2017 represents the fifty-three weeks ended February 3, 2018. Accordingly, certain non-GAAP results have also been adjusted to exclude the effects of the 53rd week to assist in comparability. We estimate the tax effect of the non-GAAP adjustments by applying a marginal rate to each of the respective items. The income tax items represent the discrete amount that affected the period. The non-GAAP financial information is provided in addition to, and not as an alternative to, our reported results prepared in accordance with GAAP. Presented below is a reconciliation of GAAP and non-GAAP results discussed throughout this Annual Report on Form 10-K. Please see the non-GAAP reconciliations for free cash flow and net debt capitalization in the “Liquidity and Capital Resources” section.
2017 2016 2015 ($ in millions) Sales $ 7,782 $ 7,766 $ 7,412 53rd week 95 — — Sales excluding 53rd week (non-GAAP) $ 7,687 $ 7,766 $ 7,412 Pre-tax income: Income before income taxes $ 578 $ 1,004 $ 837 Pre-tax adjustments excluded from GAAP:
Litigation and other charges (1) 211 6 105 53rd week (25) — —
Adjusted income before income taxes (non-GAAP) $ 764 $ 1,010 $ 942 Calculation of Earnings Before Interest and Taxes (EBIT): Income before income taxes $ 578 $ 1,004 $ 837 Interest (income) / expense, net (2) 2 4 EBIT $ 576 $ 1,006 $ 841 Adjusted income before income taxes $ 764 $ 1,010 $ 942 Interest (income) / expense, net (2) 2 4 Adjusted EBIT $ 762 $ 1,012 $ 946 EBIT margin % 7.4 % 13.0 % 11.3 % Adjusted EBIT margin % 9.9 % 13.0 % 12.8 %

18
2017 2016 2015 ($ in millions, except per share amounts) After-tax income: Net income $ 284 $ 664 $ 541 After-tax adjustments excluded from GAAP:
Litigation and other charges, net of income tax benefit of $78, $1, and $40 million, respectively (1) 133 5 65
U.S. tax reform (2) 99 — — Income tax valuation allowances (3) 8 — — Tax expense related to French tax rate change (4) 2 2 — Tax benefit related to enacted change in foreign branch
currency regulations (5) — (9) — Tax benefit related to intellectual property reassessment (6) — (10) — 53rd week, net of income tax expense of $9 million (16) — —
Adjusted net income (non-GAAP) $ 510 $ 652 $ 606 Earnings per share: Diluted EPS $ 2.22 $ 4.91 $ 3.84 Diluted EPS amounts excluded from GAAP:
Litigation and other charges (1) 1.02 0.03 0.45 U.S. tax reform (2) 0.78 — — Income tax valuation allowances (3) 0.07 — — Tax expense related to French tax rate change (4) 0.02 0.02 — Tax benefit related to enacted change in foreign branch
currency regulations (5) — (0.07) — Tax benefit related to intellectual property reassessment (6) — (0.07) — 53rd week (0.12) — —
Adjusted diluted EPS (non-GAAP) $ 3.99 $ 4.82 $ 4.29 Net income margin % 3.6 % 8.6 % 7.3 % Adjusted net income margin % 6.6 % 8.4 % 8.2 %
(1) Litigation and other charges for 2017 includes a pension litigation charge ($178 million, or $111 million after-tax), severance and related costs ($13 million, or $8 million after-tax), and non-cash impairment charges ($20 million, or $14 million after-tax). The 2016 amount represents non-cash impairment charges of $6 million, or $5 million after-tax. The 2015 amount includes a charge of $100 million related to the pension litigation ($61 million after-tax) and non-cash impairment charges of $5 million ($4 million after-tax).
Pension litigation - The Company recorded pre-tax charges of $50 million and $128 million in connection with its U.S. retirement plan litigation during the second and fourth quarters of 2017, respectively. The Company had previously recorded a pre-tax charge for $100 million during 2015. These charges reflect the Company’s revised estimate of its exposure for this matter, bringing the total pre-tax amount accrued to $278 million. The Company has exhausted all of its legal remedies and will reform the pension plan as required by the court rulings.
Severance and related costs – The Company recorded a pre-tax charge of $13 million during the third quarter of 2017 associated with the reorganization and the reduction of staff taken to improve efficiency.
Impairment charges – The Company recognized pre-tax non-cash impairment charges totaling $20 million during the fourth quarter of 2017. These charges were associated with our SIX:02, Runners Point, and Sidestep businesses and primarily represented the write-down of store fixtures and leasehold improvements. The 2016 and 2015 amounts related to Runners Point and Sidestep.
(2) On December 22, 2017, the United States enacted tax reform legislation that included a broad range of business tax provisions. The recognized charge was based on current interpretation of the tax law changes and includes a $99 million tax liability for the mandatory deemed repatriation of foreign sourced net earnings and a corresponding change in our permanent reinvestment assertion under ASC 740-30. The effect of remeasurement of our deferred tax assets and liabilities was not significant. Our accounting for the new legislation is not complete and we have made reasonable estimates for some tax provisions. We exclude the discrete U.S. tax reform effect from our Adjusted diluted EPS as it does not reflect our ongoing tax obligations under U.S. tax reform.
(3) During the fourth quarter of 2017, the Company determined that certain valuation allowances should be established against deferred tax assets associated with the Runners Point and Sidestep stores and e-commerce businesses.
(4) During the fourth quarters of 2017 and 2016, the Company recognized tax expense of $2 million in both periods in connection to two separate tax rate reductions in France.
(5) In the fourth quarter of 2016, the U.S. Treasury issued regulations under Internal Revenue Code Section 987, which required us to change our method for determining the tax effects of foreign currency translation gains and losses for our foreign businesses that are operated as branches and are reported in a currency other than the currency of their parent. This change resulted in an increase to deferred tax assets and a corresponding reduction in our income tax provision in the amount of $9 million.
(6) During the third quarter of 2016, we performed a scheduled reassessment of the value of the intellectual property provided to our European business by Foot Locker in the U.S. during the fourth quarter of 2012. The new, higher valuation resulted in catch-up deductions that reduced tax expense by $10 million.

19
ROIC is presented below and represents a non-GAAP measure. We believe it is a meaningful measure because it quantifies how efficiently we generated operating income relative to the capital we have invested in the business. In order to calculate ROIC, we adjust our results to reflect our operating leases as if they qualified for capital lease treatment. Operating leases are the primary financing vehicle used to fund store expansion and, therefore, we believe that the presentation of these leases as if they were capital leases is appropriate. Accordingly, the asset base and net income amounts are adjusted to reflect this in the calculation of ROIC. ROIC, subject to certain adjustments, is also used as a measure in executive long-term incentive compensation. The closest U.S. GAAP measure to ROIC is Return on Assets (“ROA”) and is also represented below. ROA decreased to 7.3 percent as compared to 17.4 percent in the prior year, with the decline primarily due to litigation and other charges recorded during 2017, as well as a provisional charge of $99 million relating to tax reform as discussed earlier in this section. Our ROIC decreased to 11.0 percent in 2017, as compared to 15.1 percent in the prior year. Average invested capital increased compared with the prior year and earnings declined, which resulted in the overall decrease in ROIC. Average invested capital increased as a result of the effect of opening larger stores, as well as signing certain high-profile leases with longer lease terms. The earnings decline is more fully discussed on the following pages.
2017 2016 2015 ROA (1) 7.3 % 17.4 % 14.7 % ROIC % 11.0 % 15.1 % 15.8 %
(1) Represents net income of $284 million, $664 million, and $541 million divided by average total assets of $3,901 million, $3,808 million, and $3,676 million for 2017, 2016, and 2015, respectively.
Calculation of ROIC:
2017 2016 2015 ($ in millions) Adjusted EBIT $ 762 $ 1,012 $ 946 + Rent expense 735 690 640 - Estimated depreciation on capitalized operating leases (1) (593) (552) (498) Adjusted net operating profit 904 1,150 1,088 - Adjusted income tax expense (2) (304) (409) (391) = Adjusted return after taxes (3) $ 600 $ 741 $ 697 Average total assets $ 3,901 $ 3,808 $ 3,676 - Average cash and cash equivalents (948) (1,034) (994) - Average non-interest bearing current liabilities (614) (656) (697) - Average merchandise inventories (1,293) (1,296) (1,268) + Average estimated asset base of capitalized operating
leases (1) 2,978 2,687 2,346 + 13-month average merchandise inventories 1,413 1,388 1,337 = Average invested capital $ 5,437 $ 4,897 $ 4,400 ROIC % 11.0 % 15.1 % 15.8 %
(1) The determination of the capitalized operating leases and the adjustments to income have been calculated on a lease-by-lease basis and have been consistently calculated in each of the years presented above. Capitalized operating leases represent the best estimate of the asset base that would be recorded for operating leases as if they had been classified as capital or as if the property were purchased. The present value of operating leases is discounted using various interest rates ranging from 2.5 percent to 14.5 percent, which represents our incremental borrowing rate at inception of the lease. The capitalized operating leases and related income statement amounts disclosed above do not reflect the requirements of Accounting Standards Update 2016-02, Leases.
(2) The adjusted income tax expense represents the marginal tax rate applied to net operating profit for each of the periods presented.
(3) The adjusted return after taxes does not include interest expense that would be recorded on a capital lease.

20
Overview of Consolidated Results The following represents our long-term objectives and our progress towards meeting those objectives. Non-GAAP results are presented for all the periods. Please see “Reconciliation of Non-GAAP Measures” earlier in this section for further information relating to non-GAAP measures, including why we believe they are useful and how they are calculated. Long-term Objectives 2017 2016 2015 Sales ($ in millions) $ 10,000 $ 7,782 $ 7,766 $ 7,412 Sales per gross square foot $ 600 $ 495 $ 515 $ 504 Adjusted net income margin % 8.5 % 6.6 % 8.4 % 8.2 % Adjusted EBIT margin % 12.5 % 9.9 % 13.0 % 12.8 % ROIC % 17.0 % 11.0 % 15.1 % 15.8 % Highlights of our 2017 financial performance include:
• Despite a challenging retail year, the Company remained highly profitable and our financial position is strong. We are well positioned for the future.
• Total sales increased 0.2 percent to a record $7,782 million, with the 53rd week contributing $95 million of sales. Footwear sales represented 82 percent of total sales for all periods presented. The overall comparable-sales gains of 6.9 percent in our Direct-to-Customer segment was not enough to offset the declines experienced by our Athletic Store Segment, which experienced a comparable-store sales decline of 4.7 percent. 2017 2016 2015 Sales increase 0.2 % 4.8 % 3.6 % Comparable-store sales (decrease) / increase (3.1)% 4.3 % 8.5 %
• Sales of the Direct-to-Customers segment increased by 8.5 percent to $1,109 million, compared with
$1,022 million in 2016 and increased 110 basis points as a percentage of total sales to 14.3 percent. The direct business has been steadily increasing as a percentage of total sales over the last several years, led by the continued growth and expansion into new geographies of our store banners’ e-commerce businesses.
• Gross margin, as a percentage of sales, decreased by 230 basis points to 31.6 percent in 2017. The decline was primarily driven by a decrease in our merchandise margin rate, reflecting a higher markdown rate as compared with the prior year. The 53rd week contributed an improvement to the gross margin rate of 20 basis points.
• SG&A expenses were 19.3 percent of sales, an increase of 30 basis points as compared with the prior year, and primarily reflected store wage pressures. The 53rd week did not significantly affect the SG&A expense rate.
• EBIT margin was 7.4 percent and our adjusted EBIT margin was 9.9 percent in 2017. As compared with the prior year, the decline in the adjusted EBIT margin from 13.0 percent to 9.9 percent reflected lower pre-tax income, which was primarily due to lower gross margin and higher SG&A expenses described above.
• Net income was $284 million, or $2.22 diluted earnings per share, a decrease of 54.8 percent from the prior-year period. Adjusted net income was $510 million, or $3.99 diluted earnings per share, a decline of 17.2 percent from the corresponding non-GAAP prior-year period.
• Net income margin decreased to 3.6 percent as compared with 8.6 percent in the prior year. Our adjusted net income margin declined to 6.6 percent in 2017 as compared to 8.4 percent in the prior year.
Highlights of our financial position for the period ended February 3, 2018 include:
• We ended the year in a strong financial position. At year end, we had $724 million of cash and cash equivalents, net of debt. Cash and cash equivalents at February 3, 2018 were $849 million.
• Net cash provided by operating activities was $813 million, representing a $31 million decrease over last year, related to the earnings decline partially offset by substantial working capital improvements.
• Cash capital expenditures during 2017 totaled $274 million and were primarily directed to the remodeling or relocation of 183 stores, the build-out of 94 new stores, as well as other technology and infrastructure projects.
• During 2017 we returned significant amounts of cash to our shareholders. Dividends totaling $157 million were declared and paid during 2017, and 12.4 million shares were repurchased under our share repurchase program at a cost of $467 million.

21
Summary of Consolidated Statements of Operations
2017 2016 2015 (in millions, except per share data) Sales $ 7,782 $ 7,766 $ 7,412 Gross margin 2,456 2,636 2,505 Selling, general and administrative expenses 1,501 1,472 1,415 Depreciation and amortization 173 158 148 Interest (income) / expense, net (2) 2 4 Net income $ 284 $ 664 $ 541 Diluted earnings per share $ 2.22 $ 4.91 $ 3.84 Sales All references to comparable-store sales for a given period relate to sales of stores that were open at the period-end and had been open for more than one year. The computation of consolidated comparable-store sales also includes the sales of the Direct-to-Customers segment. Stores opened or closed during the period are not included in the comparable-store base; however, stores closed temporarily for relocation or remodeling are included. Computations exclude the effect of foreign currency fluctuations. Comparable-store sales for 2017 does not include the sales from the 53rd week. Sales of $7,782 million in 2017 increased by 0.2 percent from sales of $7,766 million in 2016. Results from 2017 include the effect of the 53rd week, which represented sales of $95 million. Excluding the effect of foreign currency fluctuations, sales declined 0.5 percent as compared with 2016. Comparable-store sales declined 3.1 percent during 2017 as compared with 2016. Sales of $7,766 million in 2016 increased by 4.8 percent from sales of $7,412 million in 2015, this represented a comparable-store sales increase of 4.3 percent. Excluding the effect of foreign currency fluctuations, sales increased 5.2 percent as compared with 2015. Gross Margin
2017 2016 2015 Gross margin rate 31.6 % 33.9 % 33.8 % Basis point (decrease) / increase in the gross margin rate
(230) 10 Components of the change-
Merchandise margin rate (decline) / improvement (160) 20 Higher occupancy and buyers' compensation expense rate (70) (10)
Gross margin is calculated as sales minus cost of sales. Cost of sales includes: the cost of merchandise, freight, distribution costs including related depreciation expense, shipping and handling, occupancy and buyers’ compensation. Occupancy costs include rent, common area maintenance charges, real estate taxes, general maintenance, and utilities. The gross margin rate decreased to 31.6 percent in 2017 as compared to 33.9 percent in the prior year. The decline in the merchandise margin rate in 2017 primarily reflects a higher markdown rate in both our Athletic Stores and Direct-to-Customer segments. The higher markdowns were the result of a more promotional environment and were necessary to ensure merchandise inventory remained current and in line with the sales trend. Although to a lesser degree, a decline in our shipping and handling revenue also negatively affected the merchandise margin for the Direct-to-Customer segment. The decline in the gross margin rate also reflects an increase in the occupancy and buyers’ compensation rate as compared to 2016. Rent-related costs continued to increase while our sales were relatively flat. The increase in rent-related costs was primarily driven by recently entering into leases for high-profile locations. Gross margin in 2016 improved 10 basis points to 33.9 percent as compared with 2015. The improvement was driven by a lower markdown rate, primarily in our Athletic Stores segment, due to an increase in full-priced selling. This improvement was partially offset by increased promotional activity within our Direct-to-Customers segment. The change in the gross margin rate also reflected an increase in the occupancy and buyers’ compensation rate compared to 2015. This pressured our gross margin rate as certain high-profile locations were closed for remodeling for all or part of 2016, which increased the occupancy expense rate since these locations were not generating sales while incurring tenancy costs.

22
Selling, General and Administrative Expenses (SG&A)
2017 2016 2015 ($ in millions) SG&A $ 1,501 $ 1,472 $ 1,415 $ Change $ 29 $ 57 % Change 2.0 % 4.0 % SG&A as a percentage of sales 19.3 % 19.0 % 19.1 % SG&A increased by $29 million and 2.0 percent in 2017, as compared with the prior year. As a percentage of sales, the SG&A rate increased by 30 basis points as compared with 2016. Excluding the effect of foreign currency fluctuations, SG&A increased by $16 million compared to the prior year. The 53rd week contributed $16 million of additional expenses, however as a percent of sales the SG&A rate remained unchanged at 19.3 percent. The rise in the SG&A expense rate during 2017 primarily relates to the Athletic Stores segment, partially offset by a decline in the Direct-to-Customers segment’s SG&A rate. The Athletic Stores segment reflected an increase in store-related compensation costs as a result of increased minimum wage levels. Additionally, we incurred higher expenses related to wages, such as payroll taxes and benefits. These increases in the SG&A expense rate were partially offset by declines in incentive compensation and marketing related costs. SG&A increased by $57 million in 2016 as compared with 2015. As a percentage of sales, the SG&A rate in 2016 decreased by 10 basis points as compared with 2015, which reflected diligent expense management specifically in store wages by our Athletic Stores segment and was partially offset by increased marketing costs incurred by our Direct-to-Customers segment in order to drive traffic to its websites. Depreciation and Amortization
2017 2016 2015 ($ in millions) Depreciation and amortization $ 173 $ 158 $ 148 $ Change $ 15 $ 10 % Change 9.5 % 6.8 % Depreciation and amortization increased $15 million in 2017 as compared with 2016. Excluding the effect of foreign currency fluctuations, depreciation and amortization increased $13 million as compared with the prior year. The increases in both 2017 and 2016 reflect a rise in capital spending on store improvements, the enhancement of our digital sites, and various other technologies and infrastructure. The increase in 2016 as compared with 2015 also reflected capital spending on our relocated corporate headquarters. Litigation and Other Charges Litigation and other charges recorded totaled $211 million, $6 million, and $105 million for 2017, 2016, and 2015, respectively. Related to our pension litigation, we recorded charges totaling $178 million during 2017. We previously recorded a $100 million pension litigation charge during 2015. These charges relate to a class action in which the plaintiffs alleged that the Company failed to properly disclose the effects of the 1996 conversion of the U.S. retirement plan to a defined benefit plan with a cash balance formula. In February 2018, the Company’s Petition for Writ of Certiorari with the U.S. Supreme Court was denied. Accordingly, the Company must reform the pension plan consistent with the trial court’s order. The Company has estimated that the cost of plan reformation is $278 million as of February 3, 2018 based upon our current understanding of the court order. This amount will increase with interest until paid, as required by the provisions of the required plan reformation. The Company is currently formulating the actions and steps necessary to reform the plan. During 2017, we reduced and reorganized our division and corporate staff which resulted in a charge of $13 million. The substantial majority of the charge was for severance and related costs.

23
Impairment charges recorded during 2017 totaled $20 million. The charges related to the write-down of store fixtures and leasehold improvements of our SIX:02, Runners Point, and Sidestep stores. During 2016 and 2015, we also recorded non-cash impairment charges totaling $6 million and $4 million, respectively, relating to the write down of store fixtures and leasehold improvements for our Runners Point and Sidestep stores. Also during 2015, we recorded a non-cash impairment charge totaling $1 million to fully write down the value of an e-commerce trade name. Interest (Income) / Expense, Net
2017 2016 2015 ($ in millions) Interest expense $ 12 $ 11 $ 11 Interest income (14) (9) (7) Interest (income) / expense, net $ (2) $ 2 $ 4 Weighted-average interest rate (excluding fees) 7.3 % 7.2 % 7.2 % The changes during 2017 and 2016 primarily relate to the amounts earned as interest income. Interest income increased by $5 million in 2017 as compared with 2016, and increased $2 million in 2016 as compared with 2015. The increase for both periods primarily represented increased income due to higher average interest rates on our cash investments. We did not have any short-term borrowings, other than small amounts related to capital leases, for any of the periods presented. Income Taxes Our effective tax rate for 2017 was 50.8 percent, as compared with 33.9 percent in 2016. The increase was primarily attributable to the Tax Act. We recorded a provisional tax of $99 million for the mandatory deemed repatriation of historical foreign sourced net earnings and related items. The tax effect of the remeasurement of our deferred tax assets and liabilities was not significant. Also contributing to the increased rate was tax expense of $8 million related to the establishment of certain valuation allowances against the deferred tax assets associated with Runners Point, Sidestep, and their respective e-commerce businesses. In both 2017 and 2016 we recorded tax expense of $2 million for two separate tax rate reductions in France. Partially offsetting these increases were $9 million in excess tax benefits reflecting the change required by ASC 718 adopted during 2017. We regularly assess the adequacy of provisions for income tax contingencies in accordance with the applicable authoritative guidance on accounting for income taxes. As a result, reserves for unrecognized tax benefits may be adjusted due to new facts and developments, such as changes to interpretations of relevant tax law, assessments from taxing authorities, settlements with taxing authorities, and lapses of statutes of limitations. The effective tax rate, for both 2017 and 2016, includes reserve releases totaling $1 million due to audit settlements and lapses of statutes of limitations. In the fourth quarter of 2016, the U.S. Treasury issued regulations under Internal Revenue Code Section 987, which required us to change our method for determining the tax effects of foreign currency translation gains and losses for our foreign businesses that are operated as branches and are reported in a currency other than the currency of their parent. This change resulted in an increase to deferred tax assets and a corresponding reduction in our income tax provision in the amount of $9 million. Also during 2016, we performed a scheduled reassessment of the value of the intellectual property provided to our European business by Foot Locker in the U.S. during the fourth quarter of 2012. The new, higher valuation resulted in catch-up deductions that reduced tax expense by $10 million. Excluding the provisional repatriation and related items, the establishment of valuation allowances, the effects of excess tax benefits, the effect of the charges recorded during 2017, the IP valuation catch-up deductions in 2016, and the effect of Section 987 Regulations on 2016, the effective tax rate for 2017 decreased as compared with 2016, primarily due to the partial year benefit of the federal income tax rate reduction as well as mix of income. The effective tax rate for 2016 was 33.9 percent, as compared with 35.4 percent in 2015. Excluding the reserve releases, the effects of the IP valuation catch-up deductions, the French rate change, the effect of Section 987 Regulations, and the pension litigation charge in 2015, the effective tax rate for 2016 decreased slightly as compared with 2015, primarily due to the mix of income as well as current year tax benefit related to the higher IP valuation.

24
Segment Information As of February 3, 2018, we had two reportable segments, Athletic Stores and Direct-to-Customers, which were based on our method of internal reporting. We evaluate performance based on several factors, the primary financial measure of which is division results. Division profit reflects income before income taxes, pension litigation and reorganization charges, corporate expense, non-operating income, and net interest (income) / expense. Effective as of the beginning of fiscal year 2018, the Company will report one reportable segment based upon the change in our method of internal reporting.
2017 2016 2015 Sales ($ in millions) Athletic Stores $ 6,673 $ 6,744 $ 6,468 Direct-to-Customers 1,109 1,022 944 $ 7,782 $ 7,766 $ 7,412 Operating Results Athletic Stores $ 675 $ 927 $ 872 Direct-to-Customers 135 143 142 Division profit 810 1,070 1,014 Less: Pension litigation and reorganization charges 191 — 100 Less: Corporate expense 48 70 77 Operating profit 571 1,000 837 Other income 5 6 4 Earnings before interest expense and income taxes 576 1,006 841 Interest (income) / expense, net (2) 2 4 Income before income taxes $ 578 $ 1,004 $ 837
Athletic Stores 2017 2016 2015 ($ in millions) Sales $ 6,673 $ 6,744 $ 6,468 $ Change $ (71) $ 276 % Change (1.1)% 4.3 % Division profit $ 675 $ 927 $ 872 Division profit margin 10.1 % 13.7 % 13.5 % 2017 compared with 2016 Excluding the effect of foreign currency fluctuations, sales from our Athletic Stores segment decreased by 1.9 percent. The sales decline during 2017, excluding the effect of foreign currency fluctuations, was across almost all of our store banners. The Company experienced declines in sales of footwear and accessories, partially offset by a gain in apparel sales. Comparable-store sales decreased by 4.7 percent during 2017, as compared with the corresponding prior-year period. The overall decline in comparable-store sales was primarily driven by a decrease in footwear sales. The decline in footwear sales reflected a lack of depth and variety of innovative new product at the premium end of the athletic footwear market to suit our customers’ quickly-changing style preferences. Children’s and women’s footwear sales were the major contributors to the comparable-store declines in footwear, although men’s footwear also experienced a modest comparable-store decline. Women’s court styles primarily contributed to the comparable-store decline in women’s footwear, particularly in Foot Locker, Lady Foot Locker, and Foot Locker Europe. The comparable store-sales decrease in children’s footwear mostly reflected declines in the basketball category. All of our store banners, with the exception of Foot Locker Canada, experienced declines in men’s footwear. Gains in men’s lifestyle running shoes were not enough to compensate for the comparable-store sales declines in basketball and court lifestyle footwear, again due to insufficient product depth. The comparable-store sales increase in apparel as compared to the prior year was across almost all of our store banners, with gains experienced across all genders. The gain in men’s apparel sales was driven by strong results in branded outerwear partially offset by declines in sales of private label and licensed apparel.

25
Included in our 2017 division profit was a non-cash impairment charge of $20 million related to the write-down of primarily store fixtures and leasehold improvements. SIX:02 recorded a charge of $16 million and our Runners Point and Sidestep stores recorded a charge of $4 million. The effect of the impairment charges decreased the division profit rate by 30 basis points. Most of the remaining decline in the division profit rate was related to a decrease in the merchandise margin rate reflecting higher markdowns coupled with an increase in the SG&A rate. The division profit decline was most pronounced in our European business. The 53rd week did not have a significant effect on the overall division profit rate. 2016 compared with 2015 Excluding the effect of foreign currency fluctuations, sales from our Athletic Stores segment increased by 4.7 percent. Of the total increase, 69 percent was generated by our domestic businesses, with almost all banners contributing to the growth. Champs Sports produced the best domestic performance, while internationally the increase was driven by our Foot Locker Europe operations. Partially offsetting these increases were declines in our Lady Foot Locker and our Runners Point and Sidestep banners. The Lady Foot Locker sales decline primarily represented the effect of store closures. The Runners Point and Sidestep banners continued to experience sales declines during 2016 as a result of assortment and traffic challenges. During 2016, we continued our focus on improving these banners by better diversifying and refining our product offerings, along with providing a more elevated in-store experience. During 2015 and 2016, we began broadening the assortment in the Runners Point stores beyond performance running to include more lifestyle running products, while the Sidestep stores shifted to lifestyle and casual footwear. Comparable-store sales increased by 3.6 percent as compared with 2015. Footwear sales continued to be the primary contributor to our sales growth during 2016 and reflected strong gains across men’s, children’s, and women’s footwear categories. Our children’s footwear business had a very successful year, experiencing comparable-store gains across almost all of our store banners, led by sales from Champs Sports and Kids Foot Locker. During 2016, we opened 45 new Kids Foot Locker stores, 16 of which are in Europe or Canada. The addition of these stores reflected our expectation that the momentum of our children’s business would continue. Within footwear, lifestyle running was the strongest category, while our basketball business slightly declined for the year. Our apparel sales also generated positive results during 2016. This category was led primarily by gains in branded and private-label apparel sales at Champs Sports. Foot Locker Europe’s apparel sales also increased during 2016 and was driven by sales of men’s branded apparel. Division profit, as a percentage of sales, increased 20 basis points as compared with 2015. During 2016, a $6 million non-cash impairment charge was recorded to write down the value of store fixtures and leasehold improvements for 116 Runners Point and Sidestep stores. Excluding the effect of the impairment charge, division profit, as a percentage of sales, increased 30 basis points as compared with 2015. The division profit rate improvement reflected an improved merchandise margin rate due to a lower markdown rate coupled with diligent expense management.
Direct-to-Customers 2017 2016 2015 ($ in millions) Sales $ 1,109 $ 1,022 $ 944 $ Change $ 87 $ 78 % Change 8.5 % 8.3 % Division profit $ 135 $ 143 $ 142 Division profit margin 12.2 % 14.0 % 15.0 % 2017 compared with 2016 Comparable-sales for the Direct-to-Customers segment increased 6.9 percent as compared with the prior year. The comparable-sales gain primarily reflected growth in our domestic and international store-banner e-commerce businesses coupled with an increase in our Eastbay business. Internationally, we continued to expand the geographies that we serve in 2017, including most notably launching our e-commerce business in Australia.

26
The footwear category, across men’s, women’s and children’s, was the main driver for the overall comparable-sales gains experienced for this segment. Combined, apparel and accessories sales increased modestly. The men’s and women’s lifestyle running category and men’s basketball styles primarily drove the increase in footwear sales. Additionally, the children’s footwear category contributed to the overall increase. Direct-to-Customers division profit, as a percent of sales, declined 180 basis points as compared with the prior year. Although sales increased during the year, the gross margin rate declined as a result of increased markdowns due to a more promotional sales environment, including additional free shipping offers that reduced our shipping and handling revenue and thereby deteriorated our gross margin. The gross margin rate decline was partially offset by an expense rate improvement relating to lower marketing costs and incentive compensation. 2016 compared with 2015 Comparable-sales for the Direct-to-Customers segment increased 8.8 percent as compared with 2015. Our domestic and international store-banner websites continued to represent the majority of the overall growth in sales, which was partially offset by declines in the Eastbay, Runners Point, and Sidestep e-commerce businesses. The overall increase in sales was led by our footwear category. Consistent with our Athletic Stores segment, footwear sales increased in men’s, women’s, and children’s. The positive sales increase in men’s footwear was primarily driven by strong gains by the Jordan brand. The increase in women’s footwear was driven by casual styles. Direct-to-Customers division profit, as a percent of sales, declined 100 basis points as compared with 2015. The decline in the division profit rate reflected increased spending in marketing-related costs, which was incurred in order to drive traffic to our websites. Also contributing to the decline in the division profit rate was a decrease in the gross margin rate as a result of greater promotional activity by our domestic e-commerce business, especially Eastbay. Corporate Expense
2017 2016 2015 ($ in millions) Corporate expense $ 48 $ 70 $ 77 $ Change $ (22) $ (7) Corporate expense consists of unallocated general and administrative expenses as well as depreciation and amortization related to the Company’s corporate headquarters, centrally managed departments, unallocated insurance and benefit programs, certain foreign exchange transaction gains and losses, and other items. Depreciation and amortization included in corporate expense was $16 million, $14 million, and $11 million in 2017, 2016, and 2015, respectively. The allocation of corporate expense to the operating divisions is adjusted annually based upon an internal study; accordingly, the allocation increased by $4 million in 2017, thus reducing corporate expense. Excluding the corporate allocation change, corporate expense decreased by $18 million as compared to 2016. This was primarily due to a $13 million decline in incentive compensation, which reflects the Company’s underperformance relative to its plan. Share-based compensation declined by $7 million and is also primarily related to the portion of share-based compensation that is tied directly to the Company’s performance. Additionally, the decline in corporate expense also reflects a decrease of $4 million relating to the prior-year corporate headquarters relocation costs. These decreases were partially offset by a $2 million litigation charge, increased corporate support costs, such as information technology and real estate management, and increased depreciation and amortization expense. The effect of the 53rd week on corporate expense was not significant. Corporate expense decreased by $7 million in 2016 as compared with 2015. The annual adjustment of the allocation of corporate expense to the operating divisions reduced corporate expense by $9 million. This was partially offset by an increase of $3 million in depreciation and amortization included in corporate expense. During 2016, we also incurred $4 million of expenses related to our corporate headquarters relocation within New York City, as compared with $3 million spent during 2015. The remaining change primarily reflected lower incentive compensation expense in 2016.

27
Liquidity and Capital Resources Liquidity Our primary source of liquidity has been cash flow from earnings, while the principal uses of cash have been: to fund inventory and other working capital requirements; to finance capital expenditures related to store openings, store remodelings, Internet and mobile sites, information systems, and other support facilities; to make retirement plan contributions, quarterly dividend payments, and interest payments; and to fund other cash requirements to support the development of our short-term and long-term operating strategies. We generally finance real estate with operating leases. We believe our cash, cash equivalents, and future cash flow from operations will be adequate to fund these requirements. As of February 3, 2018, we had $849 million of cash and cash equivalents, of which $669 million was held in foreign jurisdictions. After accounting for the deemed repatriation tax required by the Tax Act, our offshore cash can be repatriated without significant additional U.S. income tax cost. In connection with the Tax Act, the Company recorded a $99 million tax liability for the mandatory deemed repatriation of foreign sourced net earnings and related items. The tax for the mandatory deemed repatriation is payable over an 8 year period beginning with 2017, 8 percent is payable for years 1 to 5, 15 percent in year 6, 20 percent in year 7, and 25 percent in the final year. The Company may also from time to time repurchase its common stock or seek to retire or purchase outstanding debt through open market purchases, privately negotiated transactions, or otherwise. Such repurchases and retirement of debt, if any, will depend on prevailing market conditions, liquidity requirements, contractual restrictions, and other factors. The amounts involved may be material. As of February 3, 2018, approximately $758 million remained available under our current $1.2 billion share repurchase program. On February 20, 2018, the Board of Directors declared a quarterly dividend of $0.345 per share to be paid on May 4, 2018, representing an 11 percent increase over the previous quarterly per share amount. As discussed further in the Legal Proceedings note under “Item 8. Financial Statements and Supplementary Data,” during 2017, in connection with our pension litigation, we recorded pre-tax charges of $178 million. The accrued amount as of February 3, 2018 was $278 million and is classified as a long-term liability. The Company has exhausted all legal remedies and will reform the pension plan. The Company will be working with the plaintiffs’ counsel and the court on the specific steps needed to implement the trial court’s judgment. During the fourth quarter of 2017, we deposited $150 million into a qualified settlement fund, classified as restricted cash. This settlement fund will be used for future pension contributions and plaintiffs’ legal costs related to the pension plan reformation. Also, the Company expects to make a $128 million contribution to the pension plan during 2018. The timing and the amount of actual contributions to the pension plan are dependent on the funded status of the plan and various other factors, such as interest rates and the performance of the plan’s assets. Any material adverse change in customer demand, fashion trends, competitive market forces, or customer acceptance of our merchandise mix and retail locations, uncertainties related to the effect of competitive products and pricing, our reliance on a few key suppliers for a significant portion of our merchandise purchases and risks associated with global product sourcing, economic conditions worldwide, the effects of currency fluctuations, as well as other factors listed under the heading “Disclosure Regarding Forward-Looking Statements,” could affect our ability to continue to fund our liquidity needs from business operations. Maintaining access to merchandise that we consider appropriate for our business may be subject to the policies and practices of our key suppliers. Therefore, we believe that it is critical to continue to maintain satisfactory relationships with these key suppliers. In 2017 and 2016, we purchased approximately 93 percent and 91 percent, respectively, of our merchandise from our top five suppliers and expect to continue to obtain a significant percentage of our athletic product from these suppliers in future periods. Approximately 67 percent in 2017 and 68 percent in 2016 was purchased from one supplier — Nike, Inc. Planned capital expenditures in 2018 are $229 million and lease acquisition costs related to our operations in Europe are $1 million. Capital expenditures reflect $124 million dedicated to elevating our in-store experience through continued relocation and remodels in major cities and key markets. It also includes the remodeling and expansion of over 100 existing stores, as well as the planned opening of approximately 40 stores, primarily related to the continued expansion of Foot Locker in Europe and our entry into Asia in a limited number of locations.

28
Planned spending for 2018 also includes $105 million for digital and other investments, including enhancements to our mobile and web platforms, the global roll-out of our new point-of-sale software, expanding data analytics capabilities, and supply chain initiatives. We have the ability to revise and reschedule much of the anticipated capital expenditure program, should our financial position require it. Free Cash Flow (non-GAAP measure) In addition to net cash provided by operating activities, we use free cash flow as a useful measure of performance and as an indication of our financial strength and our ability to generate cash. We define free cash flow as net cash provided by operating activities less capital expenditures (which is classified as an investing activity). We believe the presentation of free cash flow is relevant and useful for investors because it allows investors to evaluate the cash generated from underlying operations in a manner similar to the method used by management. Free cash flow is not defined under U.S. GAAP. Therefore, it should not be considered a substitute for income or cash flow data prepared in accordance with U.S. GAAP, and may not be comparable to similarly titled measures used by other companies. It should not be inferred that the entire free cash flow amount is available for discretionary expenditures. The following table presents a reconciliation of net cash flow provided by operating activities, the most directly comparable U.S. GAAP financial measure, to free cash flow.
2017 2016 2015 ($ in millions) Net cash provided by operating activities $ 813 $ 844 $ 791 Capital expenditures (274) (266) (228)Free cash flow $ 539 $ 578 $ 563 Operating Activities
2017 2016 2015 ($ in millions) Net cash provided by operating activities $ 813 $ 844 $ 791 $ Change $ (31) $ 53 The amount provided by operating activities reflects income adjusted for non-cash items and working capital changes. Adjustments to net income for non-cash items include non-cash impairment charges, depreciation and amortization, deferred income taxes, share-based compensation expense and related tax benefits. The decline in 2017 primarily reflects the decrease in net income partially offset by working capital improvements. During 2017, we contributed $25 million to our U.S. qualified pension plan. We contributed $33 million to our U.S. qualified pension plan and $3 million to our Canadian qualified pension plan in 2016. During 2015, we contributed $4 million to the U.S. qualified pension plan. The amounts and timing of pension contributions are dependent on several factors, including asset performance. Cash paid for income taxes was $237 million, $341 million, and $283 million for 2017, 2016, and 2015, respectively. Investing Activities
2017 2016 2015 ($ in millions) Net cash used in investing activities $ 289 $ 266 $ 230 $ Change $ 23 $ 36 Capital expenditures in 2017 were $274 million, an increase of $8 million as compared with the prior year. The increase was due to increased spending on technology projects and cash payments related to the prior year capital program. During 2017, we completed the remodeling or relocation of 183 existing stores and opened 94 new stores. As of the end of fiscal 2017, approximately 40 percent of our Foot Locker, Champs Sports, and Footaction stores have been remodeled to their respective new store formats. Capital expenditures in 2016 were $266 million, primarily related to the remodeling or relocation of 218 existing stores, and the build-out of 96 new stores. The increase in 2016 as compared with 2015 primarily related to our corporate headquarters build out and two new flagship stores.

29
The Company invested $15 million in a privately-held company during 2017, which was accounted for as a cost method investment. During the third quarter of 2015, we completed an asset acquisition for $2 million involving 10 previously franchised Runners Point and Sidestep stores in Switzerland. Financing Activities
2017 2016 2015 ($ in millions) Net cash used in financing activities $ 616 $ 556 $ 500$ Change $ 60 $ 56 Cash used in financing activities consisted primarily of our return to shareholders initiatives, including our share repurchase program and cash dividend payments, as follows:
2017 2016 2015 ($ in millions) Share repurchases $ 467 $ 432 $ 419Dividends paid on common stock 157 147 139Total returned to shareholders $ 624 $ 579 $ 558 During 2017, 2016, and 2015, we repurchased 12,413,590 shares, 6,984,643 shares, and 6,693,100 shares of our common stock under our share repurchase programs, respectively. Additionally, the Company declared and paid dividends representing a quarterly rate of $0.31, $0.275, and $0.25 per share in 2017, 2016, and 2015, respectively. During 2017, 2016 and 2015, we paid $10 million, $7 million and $9 million, respectively, to satisfy tax withholding obligations relating to the vesting of share-based equity awards. Offsetting the amounts above were proceeds received from the issuance of common stock and treasury stock in connection with the employee stock programs of $18 million, $33 million, and $69 million for 2017, 2016, and 2015, respectively. During 2016, we paid fees of $2 million in connection with the credit agreement, see below for further details. During 2016 and 2015, we made payments relating to capital lease obligations of $1 million and $2 million, respectively. These obligations were recorded in connection with the acquisition of the Runners Point Group. Capital Structure On May 19, 2016, we entered into a credit agreement with our banks (“2016 Credit Agreement”). The 2016 Credit Agreement provides for a $400 million asset-based revolving credit facility maturing on May 19, 2021. During the term of the 2016 Credit Agreement, we may also increase the commitments by up to $200 million, subject to customary conditions. Interest is determined, at our option, by the federal funds rate plus a margin of 0.125 percent to 0.375 percent, or a Eurodollar rate, determined by reference to LIBOR, plus a margin of 1.125 percent to 1.375 percent depending on availability under the 2016 Credit Agreement. In addition, we are paying a commitment fee of 0.20 percent per annum on the unused portion of the commitments. The 2016 Credit Agreement provides for a security interest in certain of our domestic store assets, including inventory assets, accounts receivable, cash deposits, and certain insurance proceeds. We are not required to comply with any financial covenants unless certain events of default have occurred and are continuing, or if availability under the 2016 Credit Agreement does not exceed the greater of $40 million and 10 percent of the Loan Cap (as defined in the 2016 Credit Agreement). There are no restrictions relating to the payment of dividends and share repurchases as long as no default or event of default has occurred and the aggregate principal amount of unused commitments under the 2016 Credit Agreement is not less than 15 percent of the lesser of the aggregate amount of the commitments and the Borrowing Base, determined as of the preceding fiscal month and on a proforma basis for the following six fiscal months. We do not currently expect to borrow under the facility in 2018, other than amounts used to support standby letters of credit. Credit Rating As of March 29, 2018, our corporate credit ratings from Standard & Poor’s and Moody’s Investors Service are BB+ and Ba1, respectively. In addition, Moody’s Investors Service has rated our senior unsecured notes Ba2.

30
Debt Capitalization and Equity (non-GAAP Measure) For purposes of calculating debt to total capitalization, we include the present value of operating lease commitments in total net debt. Total net debt including the present value of operating leases is considered a non-GAAP financial measure. The present value of operating leases is discounted using various interest rates ranging from 2.5 percent to 14.5 percent, which represent our incremental borrowing rate at inception of the lease. Operating leases are the primary financing vehicle used to fund store expansion and, therefore, we believe that the inclusion of the present value of operating leases in total debt is useful to our investors, credit constituencies, and rating agencies.
2017 2016 ($ in millions) Long-term debt and obligations under capital leases $ 125 $ 127 Present value of operating leases 3,729 3,469 Total debt including the present value of operating leases 3,854 3,596 Less: Cash and cash equivalents 849 1,046 Total net debt including the present value of operating leases 3,005 2,550 Shareholders’ equity 2,519 2,710 Total capitalization $ 5,524 $ 5,260 Total net debt capitalization percent — % —% Total net debt capitalization percent including the present value of
operating leases 54.4 % 48.5 % Including the present value of operating leases, net debt capitalization percent increased 590 basis points in 2017, primarily reflecting the effect of new high-profile leases and ongoing lease renewals coupled with foreign exchange fluctuations. Also contributing to the net capitalization increase during 2017 was a $197 million decline in our cash and cash equivalents, which primarily reflected the $150 million deposit to a qualified settlement fund in connection with the pension litigation matter. Contractual Obligations and Commitments The following tables represent the scheduled maturities of the Company’s contractual cash obligations and other commercial commitments at February 3, 2018:
Payments Due by Fiscal Period Contractual Cash 2023 and Obligations Total 2018 2019-2020 2021-2022 Beyond ($ in millions) Long-term debt (1) $ 162 $ 11 $ 22 $ 129 $ —Operating leases (2) 4,680 678 1,231 1,050 1,721 Other long-term liabilities (3) 217 145 14 20 38 Total contractual cash obligations $ 5,059 $ 834 $ 1,267 $ 1,199 $ 1,759
(1) The amounts presented above represent the contractual maturities of our long-term debt, including interest; however, it excludes the unamortized gain of the interest rate swap of $7 million. Additional information is included in the Long-Term Debt note under “Item 8. Consolidated Financial Statements and Supplementary Data.”
(2) The amounts presented represent the future minimum lease payments under non-cancellable operating leases. In addition to minimum rent, certain of our leases require the payment of additional costs for insurance, maintenance, and other costs. These costs have historically represented approximately 20 to 30 percent of the minimum rent amount. These additional amounts are not included in the table of contractual commitments as the timing and/or amounts of such payments are unknown.
(3) Other liabilities in the Consolidated Balance Sheet at February 3, 2018 primarily comprise pension and postretirement benefits, deferred rent liability, income taxes, workers’ compensation and general liability reserves, and various other accruals. The amount presented in the table includes the 2018 scheduled contribution of $128 million to our U.S. qualified pension plan. However, it does not include any amounts that will be paid from the $150 million qualified settlement fund as the timing and amount are not presently known. With regards to amounts payable related to the Tax Act, we have included $89 million in the table above but we have excluded other payments totaling $10 million, as the timing is not determinable at this time. Other than these liabilities, other amounts (including our unrecognized tax benefits of $44 million) have been excluded from the table above as the timing and/or amount of any cash payment is uncertain. Remaining amounts for which the timing is known have not been included as they are minimal and not useful to the presentation. Additional information is included in the Other Liabilities, Financial Instruments and Risk Management, and Retirement Plans and Other Benefits notes under “Item 8. Consolidated Financial Statements and Supplementary Data.

31
Payments Due by Fiscal Period Other Commercial 2023 and Commitments Total 2018 2019-2020 2021-2022 Beyond ($ in millions) Purchase commitments (1) $ 2,130 $ 2,130 $ — $ — $ —Other (2) 44 21 22 1 —Total other commercial commitments $ 2,174 $ 2,151 $ 22 $ 1 $ —
(1) Represents open purchase orders, as well as other commitments for merchandise purchases, at February 3, 2018. We are obligated under
the terms of purchase orders; however, we are generally able to renegotiate the timing and quantity of these orders with certain suppliers in response to shifts in consumer preferences.
(2) Represents payments required by non-merchandise purchase agreements. Off-Balance Sheet Arrangements The majority of our contractual obligations relate to operating leases for our stores. Future scheduled lease payments under non-cancellable operating leases as of February 3, 2018 are described in the table under Contractual Obligations and Commitments on the preceding page and with additional information in the Leases note in “Item 8. Consolidated Financial Statements and Supplementary Data.” We have not entered into any transactions with unconsolidated entities that expose the Company to material continuing risks, contingent liabilities, or any other obligation under a variable interest in an unconsolidated entity. Also, our financial policies prohibit the use of derivatives for which there is no underlying exposure. In connection with the sale of various businesses and assets, we may be obligated for certain lease commitments transferred to third parties and pursuant to certain normal representations, warranties, or indemnifications entered into with the purchasers of such businesses or assets. Although the maximum potential amounts for such obligations cannot be readily determined, we believe that the resolution of such contingencies will not significantly affect our consolidated financial position, liquidity, or results of operations. We also operate certain stores for which lease agreements are in the process of being negotiated with landlords. Although there is no contractual commitment to make these payments, it is likely that leases will be executed. Critical Accounting Policies Our responsibility for integrity and objectivity in the preparation and presentation of the financial statements requires diligent application of appropriate accounting policies. Generally, our accounting policies and methods are those specifically required by U.S. generally accepted accounting principles. Included in the Summary of Significant Accounting Policies note in “Item 8. Consolidated Financial Statements and Supplementary Data” is a summary of the most significant accounting policies. In some cases, we are required to calculate amounts based on estimates for matters that are inherently uncertain. We believe the following to be the most critical of those accounting policies that necessitate subjective judgments. Merchandise Inventories and Cost of Sales Merchandise inventories for the Athletic Stores segment are valued at the lower of cost or market using the retail inventory method (“RIM”). The RIM is commonly used by retail companies to value inventories at cost and calculate gross margins due to its practicality. Under the retail method, cost is determined by applying a cost-to-retail percentage across groupings of similar items, known as departments. The cost-to-retail percentage is applied to ending inventory at its current owned retail valuation to determine the cost of ending inventory on a department basis. The RIM is a system of averages that requires estimates and assumptions regarding markups, markdowns and shrink, among others, and as such, could result in distortions of inventory amounts. Judgment is required for these estimates and assumptions, as well as to differentiate between promotional and other markdowns that may be required to correctly reflect merchandise inventories at the lower of cost or market. Reserves are established based on current selling prices when the inventory has not been marked down to market. The failure to take permanent markdowns on a timely basis may result in an overstatement of cost under the retail inventory method. The decision to take permanent markdowns includes many factors, including the current retail environment, inventory levels, and the age of the item. We believe this method and its related assumptions, which have been consistently applied, to be reasonable.

32
Impairment of Long-Lived Tangible Assets and Goodwill
Long-Lived Tangible Assets
We perform an impairment review when circumstances indicate that the carrying value of long-lived tangible assets may not be recoverable. Our policy for determining whether an impairment indicator exists, a triggering event, comprises measurable operating performance criteria at the division level as well as qualitative measures. If an analysis is necessitated by the occurrence of a triggering event, we use assumptions which are predominately identified from our long-range strategic plans in performing an impairment review. In the calculation of the fair value of long-lived assets, we compare the carrying amount of the asset with the estimated future cash flows expected to result from the use of the asset. If the carrying amount of the asset exceeds the estimated expected undiscounted future cash flows, we measure the amount of the impairment by comparing the carrying amount of the asset with its estimated fair value. The estimation of fair value is measured by discounting expected future cash flows at our weighted-average cost of capital. We believe our policy is reasonable and is consistently applied. Future expected cash flows are based upon estimates that, if not achieved, may result in significantly different results.
During 2017 and 2016, we conducted impairment reviews of the Runners Point and Sidestep store-level assets, which resulted in non-cash impairment charges of $4 million and $6 million, respectively. Also during 2017, we recorded a $16 million non-cash impairment charge related to our SIX:02 business.
Goodwill We review goodwill for impairment annually during the first quarter of our fiscal year or more frequently if impairment indicators arise. The review of impairment consists of either using a qualitative approach to determine whether it is more likely than not that the fair value of the assets is less than their respective carrying values or a two-step impairment test, if necessary.
In performing the qualitative assessment, we consider many factors in evaluating whether the
carrying value of goodwill may not be recoverable, including declines in our stock price and market capitalization in relation to the book value of the Company and macroeconomic conditions affecting retail. If, based on the results of the qualitative assessment, it is concluded that it is not more likely than not that the fair value of a reporting unit exceeds its carrying value, additional quantitative impairment testing is performed using a two-step test.
The initial step requires that the carrying value of each reporting unit be compared with its estimated fair value. The second step — to evaluate goodwill of a reporting unit for impairment — is only required if the carrying value of that reporting unit exceeds its estimated fair value. We use a discounted cash flow approach to determine the fair value of a reporting unit. The determination of discounted cash flows of the reporting units and assets and liabilities within the reporting units requires significant estimates and assumptions. These estimates and assumptions primarily include, but are not limited to, the discount rate, terminal growth rates, earnings before depreciation and amortization, and capital expenditures forecasts. Due to the inherent uncertainty involved in making these estimates, actual results could differ from those estimates. We evaluate the merits of each significant assumption, both individually and in the aggregate, used to determine the fair value of the reporting units, as well as the fair values of the corresponding assets and liabilities within the reporting units.
In 2017, we elected to perform the first step of the two-step impairment analysis in connection with our annual review. This analysis concluded that the fair value of all of the reporting units substantially exceeded their carrying values. In 2015 and 2016, we elected to perform our review of goodwill using a qualitative approach, and no reporting units were evaluated using the two-step impairment method and based on that assessment we concluded that it was more likely than not that the fair values of our reporting units exceeded their respective carrying values and that there are no reporting units at risk of impairment.

33
Legal Contingencies We are exposed to various legal proceedings and claims arising in the ordinary course of business. We record a liability when a loss is probable and the amount of loss can be reasonably estimated. The accrual is recorded based on the reasonably estimable loss or range of loss. When no point of loss is more likely than another, we record the lowest amount in the estimated range of loss and disclose the estimated range. In 2017, we recorded pre-tax charges of $178 million related to the pension plan litigation. We previously recorded a pre-tax charge of $100 million related to this matter in 2015. There is significant judgment required in both the probability determination and as to whether an exposure can be reasonably estimated. We believe the accruals recorded within the consolidated financial statements properly reflect loss exposures that are both probable and reasonably estimable. Due to the inherent uncertainty involved in making these estimates, actual results could differ from those estimates. Pension and Postretirement Liabilities We review all assumptions used to determine our obligations for pension and postretirement liabilities annually with our independent actuaries, taking into consideration existing and future economic conditions and our intentions with regard to the plans. The assumptions used are:
Long-Term Rate of Return
The expected rate of return on plan assets is the long-term rate of return expected to be earned on the plans’ assets and is recognized as a component of pension expense. The rate is based on the plans’ weighted-average target asset allocation, as well as historical and future expected performance of those assets. The target asset allocation is selected to obtain an investment return that is sufficient to cover the expected benefit payments and to reduce the variability of future contributions. The expected rate of return on plan assets is reviewed annually and revised, as necessary, to reflect changes in the financial markets and our investment strategy. The weighted-average long-term rate of return used to determine 2017 pension expense was 5.8 percent.
A decrease of 50 basis points in the weighted-average expected long-term rate of return would
have increased 2017 pension expense by approximately $3 million. The actual return on plan assets in a given year typically differs from the expected long-term rate of return, and the resulting gain or loss is deferred and amortized into expense over the average life expectancy of the inactive participants.
Discount Rate
An assumed discount rate is used to measure the present value of future cash flow obligations of the plans and the interest cost component of pension expense and postretirement income. The cash flows are then discounted to their present value and an overall discount rate is determined. The discount rate is determined by reference to the Bond:Link interest rate model based upon a portfolio of highly-rated U.S. corporate bonds with individual bonds that are theoretically purchased to settle the plan’s anticipated cash outflows. The discount rate selected to measure the present value of our Canadian benefit obligations was developed by using that plan’s bond portfolio indices, which match the benefit obligations. The weighted-average discount rates used to determine the 2017 benefit obligations related to our pension and postretirement plans was 3.7 percent. Changing the weighted-average discount rate by 50 basis points would have changed the accumulated benefit obligation of the pension plans at February 3, 2018 by approximately $32 million and $35 million, depending on if the change was an increase or decrease, respectively. A decrease of 50 basis points in the weighted-average discount rate would have increased the accumulated benefit obligation on the postretirement plan by approximately $1 million. Such a decrease would not have significantly changed 2017 pension expense or postretirement income.
Trend Rate We maintain two postretirement medical plans, one covering certain executive officers and key
employees (“SERP Medical Plan”), and the other covering all other associates. With respect to the SERP Medical Plan, a one percent change in the assumed health care cost trend rate would change this plan’s accumulated benefit obligation by approximately $3 million and $2 million, depending on if the change was an increase or decrease, respectively.

34
With respect to the postretirement medical plan covering all other associates, there is limited risk to us for increases in health care costs since, beginning in 2001, new retirees have assumed the full expected costs and then-existing retirees have assumed all increases in such costs.
Mortality Assumptions
In 2017, the mortality table used to determine the U.S. pension obligations was updated to the modified RP-2017 mortality table with generational projection using modified MP-2017 for both males and females and terminated vested participants. The mortality table was updated as the Company’s actual experience more closely matched the RP-2017 than the previous table. In 2016, the mortality table used to determine the pension obligation was the RP-2000 mortality table with generational projection using scale AA for both males and females. This table was also used to value the Canadian pension obligations for 2017 and 2016. For the SERP Medical Plan, the mortality assumption used to value the 2017 obligation was updated to the RPH-2017 table with generational projection using MP-2017, while in the prior year the obligation was valued using the RPH-2016 table with generational projection using MP-2016, which represents the most recent study from the Society of Actuaries.
Income Taxes In accordance with U.S. GAAP, deferred tax assets are recognized for tax credit and net operating loss carryforwards, reduced by a valuation allowance, which is established when it is more likely than not that some portion or all of the deferred tax assets will not be realized. We are required to estimate taxable income for future years by taxing jurisdiction and to use our judgment to determine whether or not to record a valuation allowance for part or all of a deferred tax asset. Estimates of taxable income are based upon our long-range strategic plans. A one percent change in the overall statutory tax rate for 2017 would have resulted in a change of $1 million to the carrying value of the net deferred tax asset and a corresponding charge or credit to income tax expense depending on whether the tax rate change was a decrease or an increase. We have operations in multiple taxing jurisdictions and we are subject to audit in these jurisdictions. Tax audits by their nature are often complex and can require several years to resolve. Accruals of tax contingencies require us to make estimates and judgments with respect to the ultimate outcome of tax audits. Actual results could vary from these estimates. The Tax Act significantly changes how the U.S. taxes corporations. It requires complex computations to be performed that were not previously required in U.S. tax law, significant judgments to be made in interpretation of the provisions of the law and significant estimates in calculations, and the preparation and analysis of information not previously relevant or regularly produced. The U.S. Department of the Treasury, the Internal Revenue Service, and other standard-setting bodies could interpret or issue guidance on how provisions of the law will be applied or otherwise administered that is different from our interpretation underlying our income tax accruals. As we complete our analysis of the Tax Act, collect data and prepare the necessary calculations, and interpret any additional guidance, we may make adjustments to provisional amounts that we have recorded that may materially affect our provision for income taxes in the period in which the adjustments are made. Excluding the effect of any nonrecurring items that may occur, we expect the 2018 effective tax rate to approximate 27.5 percent. The actual tax rate will vary if the level of stock option exercise activity and the stock price at the vesting or exercise date differs from our expectations. Additionally, the tax rate will also depend on the level and mix of income earned in the United States, as compared with our international operations. Recent Accounting Pronouncements Descriptions of the recently issued accounting principles, and the accounting principles adopted by us during the year ended February 3, 2018 are included in the Summary of Significant Accounting Policies note in “Item 8. Consolidated Financial Statements and Supplementary Data.”

35
Item 7A. Quantitative and Qualitative Disclosures About Market Risk Information regarding foreign exchange risk management is included in the Financial Instruments and Risk Management note under “Item 8. Consolidated Financial Statements and Supplementary Data.” Item 8. Consolidated Financial Statements and Supplementary Data The following Consolidated Financial Statements of the Company are included as part of this Report:
• Consolidated Statements of Operations for the fiscal years ended: • February 3, 2018 • January 28, 2017 • January 30, 2016
• Consolidated Statements of Comprehensive Income for the fiscal years ended: • February 3, 2018 • January 28, 2017 • January 30, 2016
• Consolidated Balance Sheets as of:
• February 3, 2018 • January 28, 2017
• Consolidated Statements of Shareholders’ Equity for the fiscal years ended:
• February 3, 2018 • January 28, 2017 • January 30, 2016
• Consolidated Statements of Cash Flows for the fiscal years ended:
• February 3, 2018 • January 28, 2017 • January 30, 2016
• Notes to the Consolidated Financial Statements.

36
REPORT OF INDEPENDENT REGISTERED PUBLIC ACCOUNTING FIRM To the Board of Directors and Shareholders of Foot Locker, Inc.:
Opinion on the Consolidated Financial Statements
We have audited the accompanying consolidated balance sheets of Foot Locker, Inc. and subsidiaries (the “Company”) as of February 3, 2018 and January 28, 2017, the related consolidated statements of operations, comprehensive income, stockholders’ equity, and cash flows for each of the years in the three-year period ended February 3, 2018 and the related notes (collectively, the “consolidated financial statements”). In our opinion, the consolidated financial statements present fairly, in all material respects, the financial position of the Company as of February 3, 2018 and January 28, 2017, and the results of its operations and its cash flows for each of the years in the three-year period ended February 3, 2018, in conformity with U.S. generally accepted accounting principles.
We also have audited, in accordance with the standards of the Public Company Accounting Oversight Board (United States) (PCAOB), the Company’s internal control over financial reporting as of February 3, 2018, based on criteria established in Internal Control – Integrated Framework (2013) issued by the Committee of Sponsoring Organizations of the Treadway Commission”, and our report dated March 29, 2018 expressed an unqualified opinion on the effectiveness of the Company’s internal control over financial reporting.
Basis for Opinion
These consolidated financial statements are the responsibility of the Company’s management. Our responsibility is to express an opinion on these consolidated financial statements based on our audits. We are a public accounting firm registered with the PCAOB and are required to be independent with respect to the Company in accordance with the U.S. federal securities laws and the applicable rules and regulations of the Securities and Exchange Commission and the PCAOB.
We conducted our audits in accordance with the standards of the PCAOB. Those standards require that we plan and perform the audit to obtain reasonable assurance about whether the consolidated financial statements are free of material misstatement, whether due to error or fraud. Our audits included performing procedures to assess the risks of material misstatement of the consolidated financial statements, whether due to error or fraud, and performing procedures that respond to those risks. Such procedures included examining, on a test basis, evidence regarding the amounts and disclosures in the consolidated financial statements. Our audits also included evaluating the accounting principles used and significant estimates made by management, as well as evaluating the overall presentation of the consolidated financial statements. We believe that our audits provide a reasonable basis for our opinion.
/s/ KPMG LLP We have served as the Company’s auditor since 1995. New York, New York March 29, 2018

37
FOOT LOCKER, INC. CONSOLIDATED STATEMENTS OF OPERATIONS
2017 2016 2015 (in millions, except per share amounts) Sales $ 7,782 $ 7,766 $ 7,412 Cost of sales 5,326 5,130 4,907 Selling, general and administrative expenses 1,501 1,472 1,415 Depreciation and amortization 173 158 148 Litigation and other charges 211 6 105 Income from operations 571 1,000 837 Interest (income) / expense, net (2) 2 4 Other income (5) (6) (4)Income before income taxes 578 1,004 837 Income tax expense 294 340 296 Net income $ 284 $ 664 $ 541 Basic earnings per share $ 2.23 $ 4.95 $ 3.89 Weighted-average shares outstanding 127.2 134.0 139.1 Diluted earnings per share $ 2.22 $ 4.91 $ 3.84 Weighted-average shares outstanding, assuming dilution 127.9 135.1 140.8
See Accompanying Notes to Consolidated Financial Statements.

38
FOOT LOCKER, INC. CONSOLIDATED STATEMENTS OF COMPREHENSIVE INCOME
2017 2016 2015 ($ in millions) Net income $ 284 $ 664 $ 541 Other comprehensive income, net of income tax Foreign currency translation adjustment: Translation adjustment arising during the period, net of income tax
expense (benefit) of $18, $1 and $(2) million, respectively 114 (8) (44)Reclassification due to the adoption of ASU 2018-02 4 — —
Cash flow hedges:
Change in fair value of derivatives, net of income tax (1) (1) 5
Available for sale securities: Unrealized gain on available-for-sale securities 1 — —
Pension and postretirement adjustments: Net actuarial gain (loss) and foreign currency fluctuations arising
during the year, net of income tax expense (benefit) of $2, $4 and $(10) million, respectively 4 4 (16)
Amortization of net actuarial gain/loss and prior service cost included in net periodic benefit costs, net of income tax expense of $4, $4 and $5 million, respectively 7 8 8
Reclassification due to the adoption of ASU 2018-02 (45) — —Comprehensive income $ 368 $ 667 $ 494
See Accompanying Notes to Consolidated Financial Statements.

39
FOOT LOCKER, INC. CONSOLIDATED BALANCE SHEETS
2017 2016 ($ in millions) ASSETS Current assets:
Cash and cash equivalents $ 849 $ 1,046 Merchandise inventories 1,278 1,307 Other current assets 424 280
2,551 2,633 Property and equipment, net 866 765 Deferred taxes 48 161 Goodwill 160 155 Other intangible assets, net 46 42 Other assets 290 84 $ 3,961 $ 3,840 LIABILITIES AND SHAREHOLDERS’ EQUITY Current liabilities:
Accounts payable $ 258 $ 249 Accrued and other liabilities 358 363
616 612 Long-term debt 125 127 Other liabilities 701 391 Total liabilities 1,442 1,130 Shareholders’ equity 2,519 2,710 $ 3,961 $ 3,840
See Accompanying Notes to Consolidated Financial Statements.

FOOT LOCKER, INC. CONSOLIDATED STATEMENTS OF SHAREHOLDERS’ EQUITY
40
Additional Paid-In Accumulated Capital & Other Total Common Stock Treasury Stock Retained Comprehensive Shareholders'(shares in thousands, amounts in millions) Shares Amount Shares Amount Earnings Loss Equity Balance at January 31, 2015 170,529 $ 979 (29,665) $ (944) $ 2,780 $ (319) $ 2,496 Restricted stock issued 299 — — — —Issued under director and stock plans 2,570 70 — — 70 Share-based compensation expense — 22 — — 22 Excess tax benefits from equity awards — 35 35 Forfeitures of restricted stock — 2 (45) (2) —Shares of common stock used to satisfy
tax withholding obligations — — (142) (9) (9)Share repurchases — — (6,693) (419) (419)Reissued -- employee stock purchase
plan ("ESPP") — — 124 3 3 Net income 541 541 Cash dividends declared on common
stock ($1.00 per share) (139) (139)Translation adjustment, net of tax (44) (44)Change in cash flow hedges, net of tax 5 5 Pension and postretirement adjustments,
net of tax (8) (8)Balance at January 30, 2016 173,398 $ 1,108 (36,421) $ (1,371) $ 3,182 $ (366) $ 2,553 Restricted stock issued 203 — — — —Issued under director and stock plans 1,342 32 — — 32 Share-based compensation expense — 22 — — 22 Excess tax benefits from equity awards — 20 20 Forfeitures of restricted stock — 1 (20) (1) —Shares of common stock used to satisfy
tax withholding obligations — — (102) (7) (7)Share repurchases — — (6,985) (432) (432)Reissued -- ESPP — — 81 2 2 Retirement of treasury stock (42,327) (283) 42,327 1,728 (1,445) —Net income 664 664 Cash dividends declared on common
stock ($1.10 per share) (147) (147)Translation adjustment, net of tax (8) (8)Change in cash flow hedges, net of tax (1) (1)Pension and postretirement adjustments,
net of tax 12 12 Balance at January 28, 2017 132,616 $ 900 (1,120) $ (81) $ 2,254 $ (363) $ 2,710 Restricted stock issued 169 — — — —Issued under director and stock plans 608 11 — — 11 Share-based compensation expense — 15 — — 15 Shares of common stock used to satisfy
tax withholding obligations — — (140) (10) (10)Share repurchases — — (12,414) (467) (467)Reissued -- ESPP — — 110 8 8 Retirement of treasury stock (12,131) (84) 12,131 487 (403) —Net income 284 284 Cash dividends declared on common
stock ($1.24 per share) (157) (157)Translation adjustment, net of tax 114 114 Change in cash flow hedges, net of tax (1) (1)Pension and postretirement adjustments,
net of tax 11 11 Unrealized gain on available-for-sale
securities 1 1 Reclassification due to the adoption of
ASU 2018-02 41 (41) —Balance at February 3, 2018 121,262 $ 842 (1,433) $ (63) $ 2,019 $ (279) $ 2,519
See Accompanying Notes to Consolidated Financial Statements.

41
FOOT LOCKER, INC. CONSOLIDATED STATEMENTS OF CASH FLOWS
2017 2016 * 2015 * ($ in millions) From operating activities:
Net income $ 284 $ 664 $ 541 Adjustments to reconcile net income to net cash provided by operating activities: Non-cash impairment charges 20 6 5 Depreciation and amortization 173 158 148 Deferred income taxes 105 (1) (6)Share-based compensation expense 15 22 22 Qualified pension plan contributions (25) (36) (4)Change in assets and liabilities:
Merchandise inventories 69 (25) (49)Accounts payable — (31) (17)Accrued and other liabilities (30) 27 —Pension litigation accrual 178 — 100 Other, net 24 60 51
Net cash provided by operating activities 813 844 791 From investing activities:
Capital expenditures (274) (266) (228)Cash paid for a cost method investment (15) — —Purchase of business, net of cash acquired — — (2)
Net cash used in investing activities (289) (266) (230) From financing activities:
Purchase of treasury shares (467) (432) (419)Dividends paid on common stock (157) (147) (139)Proceeds from exercise of stock options 13 29 64 Treasury stock reissued under employee stock plan 5 4 5 Shares of common stock repurchased to satisfy tax withholding obligations
(10) (7) (9)Payment of revolving credit agreement costs — (2) —Reduction in obligations under capital leases — (1) (2)
Net cash used in financing activities (616) (556) (500) Effect of exchange rate fluctuations on cash, cash equivalents, and restricted cash 50 3 (6)
Net change in cash, cash equivalents, and restricted cash (42) 25 55 Cash, cash equivalents, and restricted cash at beginning of year 1,073 1,048 993 Cash, cash equivalents, and restricted cash at end of year $ 1,031 $ 1,073 $ 1,048 Cash paid during the year:
Interest $ 11 $ 11 $ 11 Income taxes $ 237 $ 341 $ 283
See Accompanying Notes to Consolidated Financial Statements.
* Amounts for 2016 and 2015 have been revised from previously reported amounts to reflect the adoption of new accounting standards in 2017. For additional information, see Note 1, Summary of Significant Accounting Policies.

FOOT LOCKER, INC.
NOTES TO CONSOLIDATED FINANCIAL STATEMENTS
42
1. Summary of Significant Accounting Policies Basis of Presentation The consolidated financial statements include the accounts of Foot Locker, Inc. and its domestic and international subsidiaries (the “Company”), all of which are wholly owned. All significant intercompany amounts have been eliminated. The preparation of financial statements in conformity with U.S. generally accepted accounting principles requires management to make estimates and assumptions relating to the reporting of assets and liabilities and the disclosure of contingent liabilities at the date of the financial statements, and the reported amounts of revenues and expenses during the reporting period. Actual results may differ from those estimates. Reporting Year The fiscal year end for the Company is the Saturday closest to the last day in January. Fiscal year 2017 represents the 53 weeks ended February 3, 2018. Fiscal years 2016 and 2015 represented the 52 weeks ended January 28, 2017 and January 30, 2016, respectively. References to years in this annual report relate to fiscal years rather than calendar years. Revenue Recognition Revenue from retail stores is recognized at the point of sale when the product is delivered to customers. Internet and catalog sales revenue is recognized upon estimated product receipt by the customer. Sales include shipping and handling fees for all periods presented. Sales include merchandise, net of returns, and exclude taxes. The Company provides for estimated returns based on return history and sales levels. Revenue from layaway sales is recognized when the customer receives the product, rather than when the initial deposit is paid. Please see the Recent Accounting Pronouncements section later in this note regarding the accounting changes relating to the 2018 adoption of Accounting Standards Update (“ASU”) 2014-09, Revenue from Contracts with Customers. Gift Cards The Company sells gift cards to its customers, which do not have expiration dates. Revenue from gift card sales is recorded when the gift cards are redeemed or when the likelihood of the gift card being redeemed by the customer is remote and there is no legal obligation to remit the value of unredeemed gift cards to the relevant jurisdictions, referred to as breakage. The Company has determined its gift card breakage rate based upon historical redemption patterns. Historical experience indicates that after 12 months, the likelihood of redemption is deemed to be remote. Gift card breakage income is included in selling, general and administrative expenses and unredeemed gift cards are recorded as a current liability. Gift card breakage was $6 million for both 2017 and 2016, and was $5 million for 2015. Please see the Recent Accounting Pronouncements section later in this note regarding the accounting changes relating to the 2018 adoption of ASU 2014-09, Revenue from Contracts with Customers. Store Pre-Opening and Closing Costs Store pre-opening costs are charged to expense as incurred. In the event a store is closed before its lease has expired, the estimated post-closing lease exit costs, less any sublease rental income, is provided for once the store ceases to be used. Advertising Costs and Sales Promotion Advertising and sales promotion costs are expensed at the time the advertising or promotion takes place, net of reimbursements for cooperative advertising. Advertising expenses also include advertising costs as required by some of the Company’s mall-based leases. Cooperative advertising reimbursements earned for the launch and promotion of certain products agreed upon with vendors are recorded in the same period as the associated expenses are incurred.

FOOT LOCKER, INC.
NOTES TO CONSOLIDATED FINANCIAL STATEMENTS
43
1. Summary of Significant Accounting Policies – (continued) Digital advertising costs are expensed as incurred, net of reimbursements for cooperative advertising. Digital advertising includes search engine marketing, such as display ads and keyword search terms, and other various forms of digital advertising. Reimbursement received in excess of expenses incurred related to specific, incremental, and identifiable advertising costs is accounted for as a reduction to the cost of merchandise and is reflected in cost of sales as the merchandise is sold. Advertising costs, including digital advertising, which are included as a component of selling, general and administrative expenses, were as follows:
2017 2016 2015 ($ in millions) Advertising expenses $ 108 $ 118 $ 119 Digital advertising expenses 96 84 65 Cooperative advertising reimbursements (20) (20) (19)Net advertising expense $ 184 $ 182 $ 165 Catalog Costs Catalog costs, which are primarily comprised of paper, printing, and postage, are capitalized and amortized over the expected customer response period related to each catalog, which is generally 90 days. Cooperative reimbursements earned for the promotion of certain products are agreed upon with vendors and are recorded in the same period as the associated catalog expenses are amortized. Prepaid catalog costs were $1 million at both February 3, 2018 and January 28, 2017. Catalog costs, which are included as a component of selling, general and administrative expenses, were as follows:
2017 2016 2015 ($ in millions) Catalog costs $ 19 $ 26 $ 28 Cooperative reimbursements (2) (6) (7)Net catalog expense $ 17 $ 20 $ 21 Earnings Per Share
The Company accounts for and discloses earnings per share using the treasury stock method. Basic earnings per share is computed by dividing net income for the period by the weighted-average number of common shares outstanding at the end of the period. Restricted stock awards, which contain non-forfeitable rights to dividends, are considered participating securities and are included in the calculation of basic earnings per share. Diluted earnings per share reflects the weighted-average number of common shares outstanding during the period used in the basic earnings per share computation plus dilutive common stock equivalents.
The computation of basic and diluted earnings per share is as follows:
2017 2016 2015 (in millions, except per share data) Net Income $ 284 $ 664 $ 541 Weighted-average common shares outstanding 127.2 134.0 139.1Dilutive effect of potential common shares 0.7 1.1 1.7Weighted-average common shares outstanding assuming dilution 127.9 135.1 140.8 Earnings per share - basic $ 2.23 $ 4.95 $ 3.89Earnings per share - diluted $ 2.22 $ 4.91 $ 3.84 Anti-dilutive share-based awards excluded from diluted calculation 1.6 0.4 0.6

FOOT LOCKER, INC.
NOTES TO CONSOLIDATED FINANCIAL STATEMENTS
44
1. Summary of Significant Accounting Policies – (continued) The Company adopted ASU 2016-09 during the first quarter of 2017. As a result, excess tax benefits and tax deficiencies are no longer included as assumed proceeds in the calculation of diluted shares outstanding. This change was adopted prospectively. Contingently issuable shares of 0.2 million, for all periods presented, have not been included as the vesting conditions have not been satisfied. These shares relate to restricted stock unit awards issued in connection with the Company’s long-term incentive program. Share-Based Compensation The Company recognizes compensation expense for share-based awards based on the grant date fair value of those awards. Additionally, stock-based compensation expense is recognized on a straight-line basis over the requisite service period for each vesting tranche of the award. See Note 21, Share-Based Compensation, for information on the assumptions used to calculate the fair value of share-based compensation. Upon exercise of stock options, issuance of restricted stock or units, or issuance of shares under the employees stock purchase plan, the Company will issue authorized but unissued common stock or use common stock held in treasury. Cash, Cash Equivalents and Restricted Cash Cash consists of funds held on hand and in bank accounts. Cash equivalents include amounts on demand with banks and all highly liquid investments with original maturities of three months or less, including money market funds. Additionally, amounts due from third-party credit card processors for the settlement of debit and credit card transactions are included as cash equivalents as they are generally collected within three business days. Restricted cash represents cash that is restricted as to withdrawal or use under the terms of various agreements. Restricted cash includes amounts held in a qualified settlement fund in connection with the pension litigation, amounts held in escrow in connection with various leasing arrangements in Europe, and deposits held in insurance trusts in order to satisfy the requirement to collateralize part of the self-insured workers’ compensation and liability claims. The following table provides the reconciliation of cash, cash equivalents, and restricted cash, as reported on our consolidated statements of cash flows.
2017 2016 2015 ($ in millions) Cash and cash equivalents (1) $ 849 $ 1,046 $ 1,021 Restricted cash included in other current assets 1 — 1 Restricted cash included in other non-current assets (2) 181 27 26 Cash, cash equivalents, and restricted cash $ 1,031 $ 1,073 $ 1,048
(1)
Includes cash equivalents of $780 million, $1,000 million, and $983 million for the year ended February 3, 2018, January 28, 2017, and January 30, 2016, respectively.
(2)
Restricted cash for the year ended February 3, 2018 includes $150 million deposited to a qualified settlement fund in connection with the pension litigation. Please see Note 22, Legal Proceedings for further information.
Investments Changes in the fair value of available-for-sale securities are reported as a component of accumulated other comprehensive loss in the Consolidated Statements of Shareholders’ Equity and are not reflected in the Consolidated Statements of Operations until a sale transaction occurs or when declines in fair value are deemed to be other-than-temporary. Available-for-sale securities are routinely reviewed for other-than-temporary declines in fair value below the cost basis, and when events or changes in circumstances indicate the carrying value of a security may not be recoverable, the security is written down to fair value. As of February 3, 2018, the Company held one available-for-sale security, which was the Company’s $7 million auction rate security. See Note 19, Fair Value Measurements, for further discussion.

FOOT LOCKER, INC.
NOTES TO CONSOLIDATED FINANCIAL STATEMENTS
45
1. Summary of Significant Accounting Policies – (continued) Additionally, the Company’s investment in a privately-held company is accounted for using the cost method and had a carrying value of $15 million as of February 3, 2018. This investment is included within other assets. If a significant adverse effect on the fair value of the investment were to occur and was deemed to be other-than-temporary, the fair value of the investment would be estimated, and the amount by which the carrying value of the cost-method investment exceeds its fair value would be recorded as an impairment loss. Merchandise Inventories and Cost of Sales Merchandise inventories for the Company’s Athletic Stores are valued at the lower of cost or market using the retail inventory method. Cost for retail stores is determined on the last-in, first-out (“LIFO”) basis for domestic inventories and on the first-in, first-out (“FIFO”) basis for international inventories. Merchandise inventories of the Direct-to-Customers business are valued at the lower of cost or market using weighted-average cost, which approximates FIFO. The retail inventory method is commonly used by retail companies to value inventories at cost and calculate gross margins due to its practicality. Under the retail inventory method, cost is determined by applying a cost-to-retail percentage across groupings of similar items, known as departments. The cost-to-retail percentage is applied to ending inventory at its current owned retail valuation to determine the cost of ending inventory on a department basis. The Company provides reserves based on current selling prices when the inventory has not been marked down to market. Transportation, distribution center, and sourcing costs are capitalized in merchandise inventories. The Company expenses the freight associated with transfers between its store locations in the period incurred. The Company maintains an accrual for shrinkage based on historical rates. Cost of sales is comprised of the cost of merchandise, as well as occupancy, buyers’ compensation, and shipping and handling costs. The cost of merchandise is recorded net of amounts received from suppliers for damaged product returns, markdown allowances, and volume rebates, as well as cooperative advertising reimbursements received in excess of specific, incremental advertising expenses. Occupancy costs include the amortization of amounts received from landlords for tenant improvements. Property and Equipment Property and equipment are recorded at cost, less accumulated depreciation and amortization. Significant additions and improvements to property and equipment are capitalized. Depreciation and amortization are computed on a straight-line basis over the following estimated useful lives:
Buildings Maximum of 50 years Store leasehold improvements Shorter of the asset useful life or expected term of the lease Furniture, fixtures, and equipment 3-10 years Software 2-7 years
Maintenance and repairs are charged to current operations as incurred. Major renewals or replacements that substantially extend the useful life of an asset are capitalized and depreciated. Internal-Use Software Development Costs The Company capitalizes certain external and internal computer software and software development costs incurred during the application development stage. The application development stage generally includes software design and configuration, coding, testing, and installation activities. Capitalized costs include only external direct cost of materials and services consumed in developing or obtaining internal-use software, and payroll and payroll-related costs for employees who are directly associated with and devote time to the internal-use software project. Capitalization of such costs ceases no later than the point at which the project is substantially complete and ready for its intended use. Training and maintenance costs are expensed as incurred, while upgrades and enhancements are capitalized if it is probable that such expenditures will result in additional functionality. Capitalized software, net of accumulated amortization, is included as a component of property and equipment and was $67 million and $59 million at February 3, 2018 and January 28, 2017, respectively.

FOOT LOCKER, INC.
NOTES TO CONSOLIDATED FINANCIAL STATEMENTS
46
1. Summary of Significant Accounting Policies – (continued) Recoverability of Long-Lived Tangible Assets The Company performs an impairment review when circumstances indicate that the carrying value of long-lived tangible assets may not be recoverable. Management’s policy in determining whether an impairment indicator exists, a triggering event, comprises measurable operating performance criteria at the division level, as well as qualitative measures. The Company considers historical performance and future estimated results, which are predominately identified from the Company’s long-range strategic plans, in its evaluation of potential store-level impairment and then compares the carrying amount of the asset with the estimated future cash flows expected to result from the use of the asset. If the carrying amount of the asset exceeds the estimated expected undiscounted future cash flows, the Company measures the amount of the impairment by comparing the carrying amount of the asset with its estimated fair value. The estimation of fair value is measured by discounting expected future cash flows at the Company’s weighted-average cost of capital. The Company estimates fair value based on the best information available using estimates, judgments, and projections as considered necessary. Goodwill and Other Intangible Assets Goodwill and intangible assets with indefinite lives are reviewed for impairment annually during the first quarter of each fiscal year or more frequently if impairment indicators arise. The review of goodwill impairment consists of either using a qualitative approach to determine whether it is more likely than not that the fair value of the assets is less than their respective carrying values or a two-step impairment test, if necessary. If, based on the results of the qualitative assessment, it is concluded that it is not more likely than not that the fair value of the intangible asset is greater than its carrying value, the two-step test is performed to identify potential impairment. If it is determined that it is not more likely than not that the fair value of the reporting unit is less than its carrying value, it is unnecessary to perform the two-step impairment test. Based on certain circumstances, we may elect to bypass the qualitative assessment and proceed directly to performing the first step of the two-step impairment test. The first step of the two-step goodwill impairment test compares the fair value of the reporting unit to its carrying amount, including goodwill. The second step includes hypothetically valuing all the tangible and intangible assets of the reporting unit as if the reporting unit had been acquired in a business combination. Then, the implied fair value of the reporting unit’s goodwill is compared to the carrying amount of that goodwill. If the carrying value of the asset exceeds its fair value, an impairment loss is recognized in the amount of the excess. The fair value of each reporting unit is determined using a discounted cash flow approach. Intangible assets that are determined to have finite lives are amortized over their useful lives and are measured for impairment only when events or changes in circumstances indicate that the carrying value may be impaired. Intangible assets with indefinite lives are tested for impairment if impairment indicators arise and, at a minimum, annually. The impairment review for intangible assets with indefinite lives consists of either performing a qualitative or a quantitative assessment. If the results of the qualitative assessment indicate that it is more likely than not that the fair value of the indefinite-lived intangible is less than its carrying amount, or if we elect to proceed directly to a quantitative assessment, we calculate the fair value using a discounted cash flow method, based on the relief from royalty concept, and compare the fair value to the carrying value to determine if the asset is impaired. Derivative Financial Instruments All derivative financial instruments are recorded in the Company’s Consolidated Balance Sheets at their fair values. For derivatives designated as a hedge, and effective as part of a hedge transaction, the effective portion of the gain or loss on the hedging derivative instrument is reported as a component of other comprehensive income/loss or as a basis adjustment to the underlying hedged item and reclassified to earnings in the period in which the hedged item affects earnings. The effective portion of the gain or loss on hedges of foreign net investments is generally not reclassified to earnings unless the net investment is disposed of. To the extent derivatives do not qualify or are not designated as hedges, or are ineffective, their changes in fair value are recorded in earnings immediately, which may subject the Company to increased earnings volatility.

FOOT LOCKER, INC. NOTES TO CONSOLIDATED FINANCIAL STATEMENTS
47
1. Summary of Significant Accounting Policies – (continued)
Fair Value
The Company categorizes its financial instruments into a three-level fair value hierarchy that prioritizes the inputs to valuation techniques used to measure fair value into three broad levels. The fair value hierarchy gives the highest priority to quoted prices in active markets for identical assets or liabilities (Level 1) and the lowest priority to unobservable inputs (Level 3). If the inputs used to measure fair value fall within different levels of the hierarchy, the category level is based on the lowest priority level input that is significant to the fair value measurement of the instrument. Fair value is determined based upon the exit price that would be received to sell an asset or paid to transfer a liability in an orderly transaction between market participants exclusive of any transaction costs. The Company’s financial assets recorded at fair value are categorized as follows:
Level 1 - Quoted prices for identical instruments in active markets. Level 2 - Quoted prices for similar instruments in active markets; quoted prices for identical or similar instruments
in markets that are not active; and model-derived valuations in which all significant inputs or significant value-drivers are observable in active markets.
Level 3 - Model-derived valuations in which one or more significant inputs or significant value-drivers are unobservable.
Income Taxes
The Company accounts for its income taxes under the asset and liability method, which requires the recognition of deferred tax assets and liabilities for the expected future tax consequences of events that have been included in the financial statements. Under this method, deferred tax assets and liabilities are determined on the basis of the differences between the financial statements and the tax basis of assets and liabilities, using enacted tax rates in effect for the year in which the differences are expected to reverse. Deferred tax assets are recognized for tax credits and net operating loss carryforwards, reduced by a valuation allowance, which is established when it is more likely than not that some portion or all of the deferred tax assets will not be realized. The effect of a change in tax rates on deferred tax assets and liabilities is recognized in income in the period that includes the enactment date.
The Company recognizes net deferred tax assets to the extent that it believes these assets are more likely than not to be realized. In making such a determination, the Company considers all available positive and negative evidence, including future reversals of existing taxable temporary differences, projected future taxable income, tax-planning strategies, and results of recent operations. If the Company determines that it would be able to realize its deferred tax assets in the future in excess of their net recorded amount, the Company would make an adjustment to the deferred tax asset valuation allowance, which would reduce the provision for income taxes.
A taxing authority may challenge positions that the Company adopted in its income tax filings. Accordingly, the Company may apply different tax treatments for transactions in filing its income tax returns than for income tax financial reporting. The Company regularly assesses its tax positions for such transactions and records reserves for those differences when considered necessary. Tax positions are recognized only when it is more likely than not, based on technical merits, that the positions will be sustained upon examination. Tax positions that meet the more-likely-than-not threshold are measured using a probability weighted approach as the largest amount of tax benefit that is greater than fifty percent likely of being realized upon settlement. Whether the more-likely-than-not recognition threshold is met for a tax position is a matter of judgment based on the individual facts and circumstances of that position evaluated in light of all available evidence. The Company recognizes interest and penalties related to unrecognized tax benefits within income tax expense in the accompanying Consolidated Statement of Operations. Accrued interest and penalties are included within the related tax liability line in the Consolidated Balance Sheet.
Provision for U.S. income taxes on undistributed earnings of foreign subsidiaries is made only on those amounts in excess of the funds considered to be permanently reinvested.

48
FOOT LOCKER, INC. NOTES TO CONSOLIDATED FINANCIAL STATEMENTS
1. Summary of Significant Accounting Policies – (continued)
Our income tax provision for 2017 includes the estimated effects of U.S. tax reform (“Tax Act”) enacted on December 22, 2017. The Tax Act significantly revises U.S. corporate income taxation, among other changes, lowering corporate income tax rates, implementing a modified territorial tax regime, and imposing a one-time transition tax through a deemed repatriation of accumulated untaxed earnings and profits of foreign subsidiaries. The Company has made estimates of the effects and recorded provisional amounts in its 2017 financial statements as permitted under Staff Accounting Bulletin No. 118, Income Tax Accounting Implications of the Tax Cuts and Jobs Act, which provides guidance on accounting for the Tax Act’s effects. The ultimate effect of the Tax Act may differ from the provisional amount, possibly materially, due to, among other things, further refinement of our calculations, changes in interpretations and assumptions we have made, regulatory and administrative guidance that may be issued, and actions we may take as a result of the Tax Act. See also Note 17, Income Taxes for more information.
Pension and Postretirement Obligations
The discount rate for the U.S. plans is determined by reference to the Bond : Link interest rate model based upon a portfolio of highly-rated U.S. corporate bonds with individual bonds that are theoretically purchased to settle the plan’s anticipated cash outflows. The cash flows are discounted to their present value and an overall discount rate is determined. The discount rate selected to measure the present value of the Company’s Canadian benefit obligations was developed by using that plan’s bond portfolio indices, which match the benefit obligations. The Company measures its plan assets and benefit obligations using the month-end date that is closest to our fiscal year end.
Insurance Liabilities
The Company is primarily self-insured for health care, workers’ compensation, and general liability costs. Accordingly, provisions are made for the Company’s actuarially determined estimates of discounted future claim costs for such risks, for the aggregate of claims reported, and claims incurred but not yet reported. Self-insured liabilities totaled $10 million and $12 million at February 3, 2018 and January 28, 2017, respectively. The Company discounts its workers’ compensation and general liability reserves using a risk-free interest rate. Imputed interest expense related to these liabilities was not significant for any of the periods presented.
Accounting for Leases
The Company recognizes rent expense for operating leases as of the possession date for store leases or the commencement of the agreement for a non-store lease. Rental expense, inclusive of rent holidays, concessions, and tenant allowances are recognized over the lease term on a straight-line basis. Contingent payments based upon sales and future increases determined by inflation related indices cannot be estimated at the inception of the lease and, accordingly, are charged to operations as incurred.
Treasury Stock Retirement
The Company periodically retires treasury shares that it acquires through share repurchases and returns those shares to the status of authorized but unissued. The Company accounts for treasury stock transactions under the cost method. For each reacquisition of common stock, the number of shares and the acquisition price for those shares is added to the existing treasury stock count and total value. When treasury shares are retired, the Company’s policy is to allocate the excess of the repurchase price over the par value of shares acquired to both retained earnings and additional paid-in capital. The portion allocated to additional paid-in capital is determined by applying a percentage, which is determined by dividing the number of shares to be retired by the number of shares issued, to the balance of additional paid-in capital as of the retirement date.
During 2017 and 2016, the Company retired 12 million and 42 million shares, respectively, of its common stock held in treasury. The shares were returned to the status of authorized but unissued. As a result, treasury stock decreased by $487 million and $1,728 million as of February 3, 2018 and January 28, 2017, respectively.

FOOT LOCKER, INC.
NOTES TO CONSOLIDATED FINANCIAL STATEMENTS
49
1. Summary of Significant Accounting Policies – (continued) Foreign Currency Translation The functional currency of the Company’s international operations is the applicable local currency. The translation of the applicable foreign currency into U.S. dollars is performed for balance sheet accounts using current exchange rates in effect at the balance sheet date and for revenue and expense accounts using the weighted-average rates of exchange prevailing during the year. The unearned gains and losses resulting from such translation are included as a separate component of accumulated other comprehensive loss within shareholders’ equity. Recent Accounting Pronouncements In May 2014, the Financial Accounting Standards Board (“FASB”) issued Accounting Standards Update (“ASU”) 2014-09, Revenue from Contracts with Customers. The core principle of this amendment is that an entity should recognize revenue to depict the transfer of promised goods or services to customers in an amount that reflects the consideration to which the entity expects to be entitled in exchange for those goods or services. ASU 2014-09 is effective for annual reporting periods beginning after December 15, 2017, and interim periods therein. This ASU can be adopted either retrospectively to each prior reporting period presented or on a modified retrospective basis with the cumulative-effect recognized as an adjustment to retained earnings as of the date of adoption. The Company has identified a change for the following items:
• Timing change relating to the recognition of gift card breakage as well as recognition of gift card breakage as part of sales instead of recognition of breakage as part of SG&A expense.
• Timing change relating to the recognition of revenue for our e-commerce sales to be recognized at the shipping point rather than upon receipt by the customer.
• Timing change relating to the recognition of expenses for direct-response advertising costs. • Balance sheet reclassification from inventory to other current assets relating to our right to recover
products for expected returns. • Change to the accounting for our unredeemed rewards for our loyalty program as a reduction to sales
instead of recording the charge to cost of goods sold. We have substantially completed our evaluation of the effect of ASU 2014-09, and will adopt the guidance beginning with our first quarter ending May 5, 2018, using the modified retrospective transition method. The adjustment to retained earnings will primarily represent the change in timing relating to gift card breakage and the change in timing related to the recognition of e-commerce sales, and is not expected to be significant. In February 2016, the FASB issued ASU 2016-02, Leases. This ASU requires lessees to recognize a lease liability and a right-of-use asset for all leases, as well as additional disclosure regarding leasing arrangements. This standard will be effective for fiscal years beginning after December 15, 2018, including interim periods therein, and requires a modified retrospective adoption, with earlier adoption permitted. The Company does not expect to adopt this ASU until required and is evaluating the effect of this guidance. The Company has historically presented a non-GAAP measure to adjust its balance sheet to present operating leases as if they were capital leases. Based upon that analysis and preliminary evaluation of the standard, we estimate the adoption will result in the addition of $3 to $4 billion of assets and liabilities on our consolidated balance sheet, with no significant change to our consolidated statements of operations or cash flows. In October 2016, the FASB issued ASU 2016-16, Income Taxes (Topic 740): Intra-Entity Transfers of Assets Other Than Inventory. ASU 2016-16 requires recognition of income tax consequences of an intra-entity transfer of an asset other than inventory when the transfer occurs. This ASU is effective and will be adopted by the Company for annual reporting periods beginning after December 15, 2017, including interim periods therein. The amendments in this update should be applied on a modified retrospective basis through a cumulative-effect adjustment directly to retained earnings as of the beginning of the period of adoption. Upon adoption, a company would write off any income tax effects that had been deferred from past intercompany transactions involving non-inventory assets to opening retained earnings. In addition, an entity would record deferred tax assets with an offset to opening retained earnings for amounts that entity had previously not recognized under existing guidance but would recognize under the new guidance. Based on deferred tax amounts related to applicable past intercompany transactions and the foreign exchange rates as of February 3, 2018, we expect the adoption will result in an increase in deferred income tax assets of $37 million.

FOOT LOCKER, INC.
NOTES TO CONSOLIDATED FINANCIAL STATEMENTS
50
1. Summary of Significant Accounting Policies – (continued) Other recently issued accounting pronouncements did not, or are not believed by management to, have a material effect on the Company’s present or future consolidated financial statements. Recently Adopted Accounting Pronouncements In March 2016, the FASB issued ASU 2016-09, Improvements to Employee Share-Based Payment Accounting. ASU 2016-09 simplifies the accounting for share-based payment transactions, including tax consequences, forfeitures, and classifications of the tax related items in the statement of cash flows. The Company adopted ASU 2016-09 during the first quarter of 2017. Amendments relating to accounting for excess tax benefits and deficiencies have been adopted prospectively. For the year ended February 3, 2018, the Company recorded $9 million of excess tax benefits related to share-based compensation awards to the income statement, within the income tax provision, whereas such benefits were previously recognized in equity. Also, in the diluted net earnings per share calculation, when applying the treasury stock method for shares that could be repurchased, the assumed proceeds no longer include the amount of excess tax benefits. This ASU also requires that we present excess tax benefits or deficiencies as operating activities in our consolidated statement of cash flow. As a result of adopting this change retrospectively, we reclassified excess tax benefits of $20 million and $35 million, which were previously classified as cash flows from financing activities, to operating activities for the years ended January 28, 2017 and January 30, 2016, respectively. Additionally, the presentation of employee taxes paid to taxing authorities for share-based transactions of $7 million and $9 million, previously classified as cash flows from operating activities, were reclassified to financing activities for the years ended January 28, 2017 and January 30, 2016, respectively. The Company has made a policy election of recording forfeitures as they occur instead of estimating forfeitures using a modified retrospective approach. The cumulative effect of this change was not significant. In November 2016, the FASB issued ASU 2016-18, Statement of Cash Flows (Topic 230): Restricted Cash. ASU 2016-18 requires that a statement of cash flows explain the change during the period in the total cash, cash equivalents, and amounts generally described as restricted cash and restricted cash equivalents when reconciling the beginning-of-period and end-of-period total amounts. This ASU is effective for annual reporting periods beginning after December 15, 2017 including interim periods therein. The Company has adopted this ASU as of the first quarter of 2017. Accordingly, we restated our cash and cash equivalents balances in the consolidated statements of cash flows to include restricted cash of $27 million as of January 28, 2017 and January 30, 2016. Please see the Cash, Cash Equivalents, and Restricted Cash section earlier in this note for a reconciliation of cash and cash equivalents as presented on our consolidated balance sheets to cash, cash equivalents, and restricted cash as reported on our consolidated statements of cash flows. In February 2018, the FASB issued ASU 2018-02, Income Statement—Reporting Comprehensive Income (Topic 220): Reclassification of Certain Tax Effects from Accumulated Other Comprehensive Income. ASU 2018-02 allows a reclassification from accumulated other comprehensive income to retained earnings for stranded tax effects resulting from the newly enacted corporate tax rates. As permitted by the ASU, the Company has elected to adopt this ASU early as of the year ended February 3, 2018, resulting in a reclassification of $41 million from accumulated other comprehensive loss to retained earnings. The amount of the reclassification is calculated on the basis of the difference between the historical and newly enacted tax rates on deferred taxes related primarily to our pension and postretirement benefit plans. 2. Segment Information The Company has determined that its reportable segments are those that are based on its method of internal reporting. As of February 3, 2018, the Company had two reportable segments, Athletic Stores and Direct-to-Customers. The accounting policies of both segments are the same as those described in Note 1, Summary of Significant Accounting Policies. The Company evaluates performance based on several factors, of which the primary financial measure is division results. Division profit reflects income before income taxes, pension litigation and reorganization charges, corporate expense, non-operating income, and net interest (income) / expense. Effective as of the beginning of fiscal year 2018, the Company will report one reportable segment based upon the change in our method of internal reporting.

FOOT LOCKER, INC.
NOTES TO CONSOLIDATED FINANCIAL STATEMENTS
51
2. Segment Information – (continued)
2017 2016 2015 Sales ($ in millions) Athletic Stores $ 6,673 $ 6,744 $ 6,468 Direct-to-Customers 1,109 1,022 944 Total sales $ 7,782 $ 7,766 $ 7,412 Operating Results Athletic Stores (1) $ 675 $ 927 $ 872 Direct-to-Customers (2) 135 143 142 Division profit 810 1,070 1,014 Less: Pension litigation and reorganization charges (3), (4) 191 — 100
Less: Corporate expense (5) 48 70 77 Operating profit 571 1,000 837 Interest (income) / expense, net (2) 2 4 Other income 5 6 4 Income before income taxes $ 578 $ 1,004 $ 837
(1)
Included in the results for 2017, 2016, and 2015 are non-cash impairment charges of $20 million, $6 million, and $4 million, respectively. The 2017 amount includes a charge of $16 million to write down long-lived store assets of SIX:02, and a charge of $4 million to write down primarily long-lived store assets of Runners Point and Sidestep. The 2016 and 2015 amounts reflect charges to write down long-lived store assets of Runners Point and Sidestep. See Note 3, Litigation and Other Charges for additional information.
(2)
Included in the results for 2015 is a $1 million non-cash impairment charge relating to an e-commerce trade name. See Note 3, Litigation and Other Charges for additional information. (3)
Included in the 2017 and 2015 amounts is a pre-tax charge of $178 million and $100 million, respectively, relating to a pension litigation matter described further in Note 22, Legal Proceedings.
(4)
Included in the 2017 amount is $13 million in pre-tax reorganization costs related to the reduction and reorganization of division and corporate staff that occurred in the third quarter of 2017, described more fully in Note 3, Litigation and Other Charges.
(5)
Corporate expense for all years presented reflects the reallocation of expense between corporate and the operating divisions. Based upon annual internal studies of corporate expense, the allocation of such expenses to the operating divisions was increased by $4 million for 2017, $9 million for 2016, and $5 million for 2015, thereby reducing corporate expense.
Depreciation and Amortization Capital Expenditures (1) Total Assets 2017 2016 2015 2017 2016 2015 2017 2016 2015 ($ in millions) Athletic Stores $ 153 $ 140 $ 130 $ 202 $ 193 $ 181 $ 2,775 $ 2,802 $ 2,612 Direct-to-Customers 4 4 7 3 4 7 357 338 330 157 144 137 205 197 188 3,132 3,140 2,942 Corporate 16 14 11 69 69 40 829 700 833 Total Company $ 173 $ 158 $ 148 $ 274 $ 266 $ 228 $ 3,961 $ 3,840 $ 3,775 (1) Reflects cash capital expenditures for all years presented.
Sales and long-lived asset information by geographic area as of and for the fiscal years ended February 3, 2018, January 28, 2017, and January 30, 2016 are presented in the following tables. Sales are attributed to the country in which the sales transaction is fulfilled. Long-lived assets reflect property and equipment.
2017 2016 2015 Sales ($ in millions) United States $ 5,532 $ 5,562 $ 5,305 International 2,250 2,204 2,107 Total sales $ 7,782 $ 7,766 $ 7,412

FOOT LOCKER, INC.
NOTES TO CONSOLIDATED FINANCIAL STATEMENTS
52
2. Segment Information – (continued)
2017 2016 2015 Long-Lived Assets ($ in millions) United States $ 607 $ 575 $ 486 International 259 190 175 Total long-lived assets $ 866 $ 765 $ 661
For the year ended February 3, 2018, the countries that comprised the majority of the sales and long-lived assets for the international category were Canada, Italy, Germany, and France. No other individual country included in the international category was significant. 3. Litigation and Other Charges
2017 2016 2015 ($ in millions) Pension litigation charge $ 178 $ — $ 100 Reorganization costs 13 — —Impairment of long-lived assets 20 6 4 Other intangible asset impairments — — 1 Total litigation and other charges $ 211 $ 6 $ 105
During the third quarter of 2017, the Company reorganized its organizational structure by adjusting certain responsibilities between our various businesses. As a result of this, as well as certain corporate staff reductions taken to improve corporate efficiency, the Company recorded a charge of $13 million. The charge consisted primarily of severance payments and benefit continuation costs for approximately 190 associates. The following is a reconciliation of the accrual as of February 3, 2018:
Severance and Other Related Benefit Costs Charges Total ($ in millions) Balance at January 28, 2017 $ — $ — $ —
Amounts charged to expense 11 2 13 Cash payments (6) — (6)
Balance at February 3, 2018 $ 5 $ 2 $ 7
During 2017, due to the underperformance of our SIX:02 stores, and the continued underperformance of our Runners Point and Sidestep stores, management determined that a triggering event had occurred and, therefore, an impairment review was conducted. The Company evaluated the long-lived assets of our SIX:02 stores for impairment and recorded a non-cash charge of $16 million to write down store fixtures and leasehold improvements for 30 stores. The Company also evaluated the long-lived assets of our Runners Point and Sidestep stores for impairment and recorded a non-cash charge of $4 million to write down store fixtures and leasehold improvements for 123 stores. As of February 3, 2018, the remaining net book value of long-lived assets totaled $2 million for SIX:02, and totaled $12 million for Runners Point and Sidestep. The Company also performed an impairment review of other intangible assets for Runners Point and Sidestep, and the resulting non-cash impairment charge was not significant. In 2016 and 2015, the Company also recorded non-cash impairment charges for Runners Point and Sidestep stores to write down long-lived assets of $6 million for 116 stores and $4 million for 61 stores, respectively. As a result of the impairment review related to long-lived assets, the Company performed a review of other intangible assets in 2016 and 2015. No impairment charges of these assets was required as a result of the 2016 review; however, in 2015 a non-cash impairment charge of $1 million was recorded to fully write down the value of an e-commerce trade name resulting from a decline in sales, as the Company shifted away from the use of this website. The Company recorded $178 million and $100 million in pension litigation charges during 2017 and 2015, respectively. Please see Note 22, Legal Proceedings for further information.

FOOT LOCKER, INC.
NOTES TO CONSOLIDATED FINANCIAL STATEMENTS
53
4. Other Income Other income includes non-operating items, such as: gains from insurance recoveries; discounts/premiums paid on the repurchase and retirement of bonds; royalty income; changes in fair value, premiums paid, and realized gains associated with foreign currency option contracts; and property sales. Other income was $5 million in 2017, $6 million in 2016, and $4 million in 2015. For 2017, other income includes $4 million of royalty income and $1 million of lease termination gains related to the sales of leasehold interests. Other income in 2016 included a gain of $2 million on a forward foreign currency contract associated with an intercompany transaction that did not qualify for hedge accounting; $2 million of royalty income; $1 million related to an insurance recovery; and $1 million of lease termination gains related to the sales of leasehold interests. Included in 2015 is a $2 million insurance recovery related to a business interruption claim and $2 million of royalty income. 5. Merchandise Inventories
2017 2016 ($ in millions) LIFO inventories $ 809 $ 861 FIFO inventories 469 446 Total merchandise inventories $ 1,278 $ 1,307
The value of the Company’s LIFO inventories, as calculated on a LIFO basis, approximates their value as calculated on a FIFO basis.
6. Other Current Assets
2017 2016 ($ in millions) Prepaid income taxes $ 174 $ 48 Net receivables 106 101 Prepaid rent 96 86 Other prepaid expenses 31 27 Deferred tax costs 13 13 Other 4 5 $ 424 $ 280
7. Property and Equipment, Net
2017 2016 ($ in millions) Land $ 4 $ 4 Buildings: Owned 44 43 Furniture, fixtures, equipment and software development costs: Owned 1,145 1,029 Assets under capital leases — 2 1,193 1,078 Less: accumulated depreciation (753) (674) 440 404 Alterations to leased and owned buildings: Cost 965 849 Less: accumulated amortization (539) (488) 426 361 $ 866 $ 765

FOOT LOCKER, INC.
NOTES TO CONSOLIDATED FINANCIAL STATEMENTS
54
8. Goodwill The Athletic Stores segment’s goodwill is net of accumulated impairment charges of $167 million for all periods presented. The 2017 and 2016 annual goodwill impairment tests did not result in an impairment charge.
Direct-to- Athletic Stores Customers Total ($ in millions) Goodwill at January 30, 2016 $ 17 $ 139 $ 156 Foreign currency translation adjustment (1) — (1)Goodwill at January 28, 2017 $ 16 $ 139 $ 155 Foreign currency translation adjustment 3 2 5 Goodwill at February 3, 2018 $ 19 $ 141 $ 160 9. Other Intangible Assets, net
February 3, 2018 January 28, 2017
Wtd. Avg.
Gross Accum. Net Life in Gross Accum. Net ($ in millions) value amort. value Years (2) value amort. value Amortized intangible assets: (1) Lease acquisition costs $ 135 $ (122) $ 13 10.0 $ 116 $ (105) $ 11 Trademarks / trade names 20 (14) 6 20.0 20 (13) 7 Favorable leases 7 (6) 1 8.6 7 (5) 2 $ 162 $ (142) $ 20 13.8 $ 143 $ (123) $ 20 Indefinite life intangible assets: (1)
Runners Point Group trademarks /
trade names 26 22 Other intangible assets, net $ 46 $ 42
(1) The change in the ending balances also reflect the effect of foreign currency fluctuations due primarily to the movements of the euro in
relation to the U.S. dollar.
(2) The weighted-average useful life is as of February 3, 2018 and excludes those assets that are fully amortized. Amortizing intangible assets primarily represent lease acquisition costs, which are amounts that are required to secure prime lease locations and other lease rights, primarily in Europe. During 2017, the Company recorded $2 million of lease acquisition additions, primarily related to our European businesses. These additions are being amortized over a weighted-average life of 10 years. Amortization expense recorded is as follows:
($ in millions) 2017 2016 2015 Amortization expense $ 4 $ 4 $ 4 Estimated future amortization expense for finite lived intangibles for the next five years is as follows:
($ in millions) 2018 $ 4 2019 4 2020 3 2021 3 2022 2

FOOT LOCKER, INC.
NOTES TO CONSOLIDATED FINANCIAL STATEMENTS
55
10. Other Assets
2017 2016 ($ in millions) Restricted cash (1) $ 181 $ 27 Pension asset 36 10 Deferred tax costs 11 10 Auction rate security 7 6 Cost method investment 15 —Other 40 31 $ 290 $ 84 (1)
Restricted cash for the year ended February 3, 2018 includes $150 million deposited to a qualified settlement fund in connection with the pension litigation. Please see Note 22, Legal Proceedings for further information.
11. Accrued and Other Liabilities
2017 2016 ($ in millions) Other payroll and payroll related costs, excluding taxes $ 67 $ 57 Taxes other than income taxes 63 66 Property and equipment (1) 58 38 Customer deposits (2) 49 49 Advertising 22 35 Income taxes payable 11 5 Incentive bonuses 6 32 Other 82 81 $ 358 $ 363 (1) Accruals for property and equipment are excluded from the statements of cash flows for all years presented.
(2) Customer deposits include unredeemed gift cards, merchandise credits, and deferred revenue related to undelivered merchandise, including layaway sales.
12. Revolving Credit Facility On May 19, 2016, the Company entered into a credit agreement with its banks (“2016 Credit Agreement”). The 2016 Credit Agreement provides for a $400 million asset-based revolving credit facility maturing on May 19, 2021. During the term of the 2016 Credit Agreement, the Company may also increase the commitments by up to $200 million, subject to customary conditions. Interest is determined, at the Company’s option, by the federal funds rate plus a margin of 0.125 percent to 0.375 percent, or a Eurodollar rate, determined by reference to LIBOR, plus a margin of 1.125 percent to 1.375 percent depending on availability under the 2016 Credit Agreement. In addition, the Company is paying a commitment fee of 0.20 percent per annum on the unused portion of the commitments. The 2016 Credit Agreement provides for a security interest in certain of the Company’s domestic store assets, including inventory assets, accounts receivable, cash deposits, and certain insurance proceeds. The Company is not required to comply with any financial covenants unless certain events of default have occurred and are continuing, or if availability under the 2016 Credit Agreement does not exceed the greater of $40 million and 10 percent of the Loan Cap (as defined in the 2016 Credit Agreement). There are no restrictions relating to the payment of dividends and share repurchases as long as no default or event of default has occurred and the aggregate principal amount of unused commitments under the 2016 Credit Agreement is not less than 15 percent of the lesser of the aggregate amount of the commitments and the Borrowing Base, determined as of the preceding fiscal month and on a proforma basis for the following six fiscal months.

FOOT LOCKER, INC.
NOTES TO CONSOLIDATED FINANCIAL STATEMENTS
56
12. Revolving Credit Facility – (continued) The Company uses the 2016 Credit Agreement to support standby letters of credit in connection with insurance programs. The letters of credit outstanding as of February 3, 2018 were not significant. During 2016, the Company paid approximately $2 million in fees relating to the 2016 Credit Agreement. Deferred financing fees are amortized over the life of the facility on a straight-line basis, which is comparable to the interest method. The unamortized balance at February 3, 2018 is $1 million. The quarterly facility fees paid on the unused portion was 0.20 percent in 2017. Interest expense, including facility fees, related to the revolving credit facility was $1 million for all years presented. 13. Long-Term Debt
2017 2016 ($ in millions) 8.5% debentures payable January 2022 $ 118 $ 118 Unamortized gain related to interest rate swaps (1) 7 9 $ 125 $ 127
(1) In 2009, the Company terminated an interest rate swap at a gain. This gain is being amortized as part of interest expense over the remaining term of the debt using the effective-yield method.
Interest expense related to long-term debt and the amortization of the associated debt issuance costs was $9 million and $8 million as of February 3, 2018 and January 28, 2017, respectively. 14. Other Liabilities
2017 2016 ($ in millions) Pension litigation liability $ 278 $ 100 Straight-line rent liability (1) 245 205 Income taxes 114 23 Pension benefits 19 26 Deferred taxes 15 3 Postretirement benefits 14 14 Workers’ compensation and general liability reserves 7 8 Other 9 12 $ 701 $ 391
(1) Includes unamortized tenant allowances of $64 million and $59 million for the year ended February 3, 2018 and January 28, 2017, respectively.
15. Leases The Company is obligated under operating leases for almost all of its store properties. Some of the store leases contain renewal options with varying terms and conditions. Management expects that in the normal course of business, expiring leases will generally be renewed or, upon making a decision to relocate, replaced by leases on other premises. Operating lease periods generally range from 5 to 10 years. Certain leases provide for additional rent payments based on a percentage of store sales. Also, most of the Company’s leases require the payment of certain executory costs such as insurance, maintenance, and other costs in addition to the future minimum lease payments. These costs, including the amortization of lease rights, totaled $146 million in 2017, $141 million in 2016, and $137 million in 2015.

FOOT LOCKER, INC.
NOTES TO CONSOLIDATED FINANCIAL STATEMENTS
57
15. Leases – (continued) Included in the amounts below are non-store expenses that totaled $24 million in both 2017 and 2016, and $18 million in 2015.
2017 2016 2015 ($ in millions) Minimum rent $ 714 $ 667 $ 618 Contingent rent based on sales 26 29 27 Sublease income (5) (6) (5) $ 735 $ 690 $ 640 Future minimum lease payments under non-cancellable operating leases, net of future non-cancellable operating sublease payments, are:
($ in millions) 2018 $ 678 2019 637 2020 594 2021 554 2022 496 Thereafter 1,721 Total operating lease commitments $ 4,680
16. Accumulated Other Comprehensive Loss Accumulated other comprehensive loss, net of tax, is comprised of the following:
2017 2016 2015 ($ in millions) Foreign currency translation adjustments $ (9) $ (127) $ (119)Cash flow hedges — 1 2 Unrecognized pension cost and postretirement benefit (270) (236) (248)Unrealized loss on available-for-sale security — (1) (1) $ (279) $ (363) $ (366) The changes in accumulated other comprehensive loss for the period ended February 3, 2018 were as follows:
Unrealized Foreign Items Related (Loss)/Gain Currency to Pension and on Translation Cash Flow Postretirement Available-For- ($ in millions) Adjustments Hedges Benefits Sale Security Total Balance as of January 28, 2017 $ (127) $ 1 $ (236) $ (1) $ (363) OCI before reclassification 114 (1) 4 1 118 Reclassified from AOCI — — 7 — 7 Reclassification of tax effects due to the adoption of ASU 2018-02 4 — (45) — (41)
Other comprehensive income/ (loss) 118 (1) (34) 1 84
Balance as of February 3, 2018 $ (9) $ — $ (270) $ — $ (279)

FOOT LOCKER, INC.
NOTES TO CONSOLIDATED FINANCIAL STATEMENTS
58
16. Accumulated Other Comprehensive Loss – (continued) Reclassifications to income from accumulated other comprehensive loss for the period ended February 3, 2018 were as follows:
($ in millions) Amortization of actuarial (gain) loss: Pension benefits- amortization of actuarial loss $ 13 Postretirement benefits- amortization of actuarial gain (2)Net periodic benefit cost (see Note 20) 11 Income tax benefit 4 Net of tax $ 7
17. Income Taxes The domestic and international components of pre-tax income are as follows:
2017 2016 2015 ($ in millions) Domestic $ 432 $ 779 $ 668 International 146 225 169 Total pre-tax income $ 578 $ 1,004 $ 837
Domestic pre-tax income includes the results of non-U.S. businesses that are operated in branches owned directly by the U.S. which, therefore, are subject to U.S. income tax. The income tax provision consists of the following:
2017 2016 2015 Current: ($ in millions) Federal $ 129 $ 249 $ 212 State and local 18 44 37 International 42 48 53 Total current tax provision 189 341 302 Deferred: Federal 98 (6) (8) State and local 5 1 (1) International 2 4 3 Total deferred tax provision 105 (1) (6)Total income tax provision $ 294 $ 340 $ 296
The Company previously considered the earnings in its non-U.S. subsidiaries to be indefinitely reinvested and, accordingly, recorded no deferred income taxes. Given the Tax Act’s significant changes and potential opportunities to repatriate cash without significant incremental U.S. federal tax, the Company is in the process of evaluating its current permanent reinvestment assertions. This evaluation includes the possible repatriation of historical earnings (2017 and prior) that have now been taxed under the Tax Act. The Company had aggregate undistributed earnings and profits (“E&P”) from foreign subsidiaries of approximately $1,407 million at February 3, 2018, which is now classified as previously taxed income (“PTI”) subsequent to the Tax Act. The Company recorded a provisional $86 million “transition tax” in connection with this E&P. Additionally, the Company has recorded a provisional $13 million deferred tax liability as of the date of the change in the Company’s permanent reinvestment assertion primarily for state income taxes and foreign withholding taxes on the future repatriation of PTI. The Company currently considers the remaining financial statement carrying amounts over the tax basis of investments in its foreign subsidiaries to be indefinitely reinvested, and has not recorded a provisional deferred tax liability. The determination of any unrecorded provisional deferred tax liability on this amount is not practicable due to the uncertainty of how these investments would be recovered.

FOOT LOCKER, INC.
NOTES TO CONSOLIDATED FINANCIAL STATEMENTS
59
17. Income Taxes – (continued) A reconciliation of the significant differences between the federal statutory income tax rate and the effective income tax rate on pre-tax income is as follows:
2017 2016 2015 Federal statutory income tax rate (1) 33.7 % 35.0 % 35.0 % Deemed repatriation tax 17.1 — — Increase in valuation allowance 1.6 — — State and local income taxes, net of federal tax benefit 2.0 3.1 2.8 International income taxed at varying rates (2.3) (3.7) (2.1) Foreign tax credits (2.6) (1.9) (2.8) Domestic/foreign tax settlements (0.2) (0.1) (0.1) Federal tax credits (0.2) (0.2) (0.2) Other, net 1.7 1.7 2.8 Effective income tax rate 50.8 % 33.9 % 35.4 %
(1) On December 22, 2017, the United States enacted tax reform legislation that included a broad range of business tax provisions, including but not limited to a reduction in the U.S. corporate income tax rate from 35 percent to 21 percent as well as provisions that limit or eliminate various deductions or credits. In accordance with Section 15 of the Internal Revenue Code, the tax rate for 2017 represented a blended rate of 33.7 percent, calculated by applying a prorated percentage of the number of days prior to and subsequent to the January 1, 2018 effective date.
Deferred income taxes are provided for the effects of temporary differences between the amounts of assets and liabilities recognized for financial reporting purposes and the amounts recognized for income tax purposes. Items that give rise to significant portions of the Company’s deferred tax assets and liabilities are as follows:
2017 2016 Deferred tax assets: ($ in millions)
Tax loss/credit carryforwards and capital loss $ 23 $ 12 Employee benefits 16 76 Property and equipment 54 110 Straight-line rent 44 51 Other 27 47
Total deferred tax assets $ 164 $ 296 Valuation allowance (17) (7) Total deferred tax assets, net $ 147 $ 289
Deferred tax liabilities: Merchandise inventories $ 79 $ 104 Goodwill and other intangible assets 20 21 Other 15 6
Total deferred tax liabilities $ 114 $ 131 Net deferred tax asset $ 33 $ 158 Balance Sheet caption reported in:
Deferred taxes $ 48 $ 161 Other liabilities (15) (3)
$ 33 $ 158
As a result of the Tax Act’s corporate income tax rate reduction to 21 percent, the Company remeasured its deferred tax assets and liabilities, and the adjustment was not significant. Based upon the level of historical taxable income and projections for future taxable income, which are based upon the Company’s long-range strategic plans, management believes it is more likely than not that the Company will realize the benefits of these deductible differences, net of the valuation allowances at February 3, 2018, over the periods in which the temporary differences are anticipated to reverse. However, the amount of the deferred tax asset considered realizable could be adjusted in the future if estimates of taxable income are revised.

FOOT LOCKER, INC.
NOTES TO CONSOLIDATED FINANCIAL STATEMENTS
60
17. Income Taxes – (continued) As of February 3, 2018, the Company has a valuation allowance of $17 million to reduce its deferred tax assets to an amount that is more likely than not to be realized. A valuation allowance of $15 million was recorded against tax loss carryforwards of certain foreign entities. Based on the history of losses and the absence of prudent and feasible business plans for generating future taxable income in these entities, the Company believes it is more likely than not that the benefit of these loss carryforwards will not be realized. An additional valuation allowance of $2 million relates to the deferred tax assets arising from a capital loss associated with an impairment of the Northern Group note receivable in 2008. The Company does not anticipate realizing capital gains to utilize the capital loss associated with the note receivable impairment. At February 3, 2018, the Company has U.S. state operating loss carryforwards with a potential tax benefit of $1 million that expire between 2021 and 2037. The Company will have, when realized, a capital loss with a potential benefit of $2 million arising from a note receivable. This loss will carryforward for 5 years after realization. The Company has international minimum tax credit carryforwards with a potential tax benefit of $4 million and operating loss carryforwards with a potential tax benefit of $16 million, a portion of which will expire between 2018 and 2026 and a portion of which will never expire. The state and international operating loss carryforwards do not include unrecognized tax benefits. The Company operates in multiple taxing jurisdictions and is subject to audit. Audits can involve complex issues that may require an extended period of time to resolve. A taxing authority may challenge positions that the Company has adopted in its income tax filings. Accordingly, the Company may apply different tax treatments for transactions in filing its income tax returns than for income tax financial reporting. The Company regularly assesses its tax positions for such transactions and records reserves for those differences. The Company’s U.S. Federal income tax filings have been examined by the Internal Revenue Service through 2016. The Company is participating in the IRS’s Compliance Assurance Process (“CAP”) for 2017, which is expected to conclude during 2018. The Company has started the CAP for 2018. Due to the recent utilization of net operating loss carryforwards, the Company is subject to state and local tax examinations effectively including years from 2000 to the present. To date, no adjustments have been proposed in any audits that will have a material effect on the Company’s financial position or results of operations. At February 3, 2018 and January 28, 2017, the Company had $44 million and $38 million, respectively, of gross unrecognized tax benefits, and $44 million and $38 million, respectively, of net unrecognized tax benefits that would, if recognized, affect the Company’s annual effective tax rate. The Company has classified certain income tax liabilities as current or noncurrent based on management’s estimate of when these liabilities will be settled. Interest expense and penalties related to unrecognized tax benefits are classified as income tax expense. Interest income was not significant in 2017, was $1 million in 2016, and was not significant for 2015. Accrued interest and penalties was not significant for 2017, $1 million in 2016, and $2 million in 2015. The following table summarizes the activity related to unrecognized tax benefits:
2017 2016 2015 ($ in millions) Unrecognized tax benefits at beginning of year $ 38 $ 38 $ 40 Foreign currency translation adjustments 4 1 (2)Increases related to current year tax positions 3 8 4 Increases related to prior period tax positions 1 1 2 Decreases related to prior period tax positions — (2) —Settlements (1) (7) (1)Lapse of statute of limitations (1) (1) (5)Unrecognized tax benefits at end of year $ 44 $ 38 $ 38

FOOT LOCKER, INC.
NOTES TO CONSOLIDATED FINANCIAL STATEMENTS
61
17. Income Taxes – (continued) It is reasonably possible that the liability associated with the Company’s unrecognized tax benefits will increase or decrease within the next twelve months. These changes may be the result of foreign currency fluctuations, ongoing audits, or the expiration of statutes of limitations. Settlements could increase earnings up to $5 million based on current estimates. Audit outcomes and the timing of audit settlements are subject to significant uncertainty. Although management believes that adequate provision has been made for such issues, the ultimate resolution could have an adverse effect on the earnings of the Company. Conversely, if these issues are resolved favorably in the future, the related provision would be reduced, generating a positive effect on earnings. Due to the uncertainty of amounts and in accordance with its accounting policies, the Company has not recorded any potential consequences of these settlements. 18. Financial Instruments and Risk Management The Company operates internationally and utilizes certain derivative financial instruments to mitigate its foreign currency exposures, primarily related to third-party and intercompany forecasted transactions. As a result of the use of derivative instruments, the Company is exposed to the risk that counterparties will fail to meet their contractual obligations. To mitigate this counterparty credit risk, the Company has a practice of entering into contracts only with major financial institutions selected based upon their credit ratings and other financial factors. The Company monitors the creditworthiness of counterparties throughout the duration of the derivative instrument. Additional information is contained within Note 19, Fair Value Measurements. Derivative Holdings Designated as Hedges For a derivative to qualify as a hedge at inception and throughout the hedged period, the Company formally documents the nature of the hedged items and the relationships between the hedging instruments and the hedged items, as well as its risk-management objectives, strategies for undertaking the various hedge transactions, and the methods of assessing hedge effectiveness and ineffectiveness. In addition, for hedges of forecasted transactions, the significant characteristics and expected terms of a forecasted transaction must be specifically identified, and it must be probable that each forecasted transaction would occur. If it were deemed probable that the forecasted transaction would not occur, the gain or loss on the derivative instrument would be recognized in earnings immediately. Gains or losses recognized in earnings for any of the periods presented were not significant. Derivative financial instruments qualifying for hedge accounting must maintain a specified level of effectiveness between the hedging instrument and the item being hedged, both at inception and throughout the hedged period, which management evaluates periodically. The primary currencies to which the Company is exposed are the euro, British pound, Canadian dollar, and Australian dollar. For the most part, merchandise inventories are purchased by each geographic area in their respective local currency. The most significant exception to this is the United Kingdom, whose merchandise inventory purchases are denominated in euros. For option and foreign exchange forward contracts designated as cash flow hedges of the purchase of inventory, the effective portion of gains and losses is deferred as a component of Accumulated Other Comprehensive Loss (“AOCL”) and is recognized as a component of cost of sales when the related inventory is sold. The amount reclassified to cost of sales related to such contracts was not significant for any of the periods presented. The effective portion of gains or losses associated with other forward contracts is deferred as a component of AOCL until the underlying transaction is reported in earnings. The ineffective portion of gains and losses related to cash flow hedges recorded to earnings was not significant for any of the periods presented. When using a forward contract as a hedging instrument, the Company excludes the time value of the contract from the assessment of effectiveness.
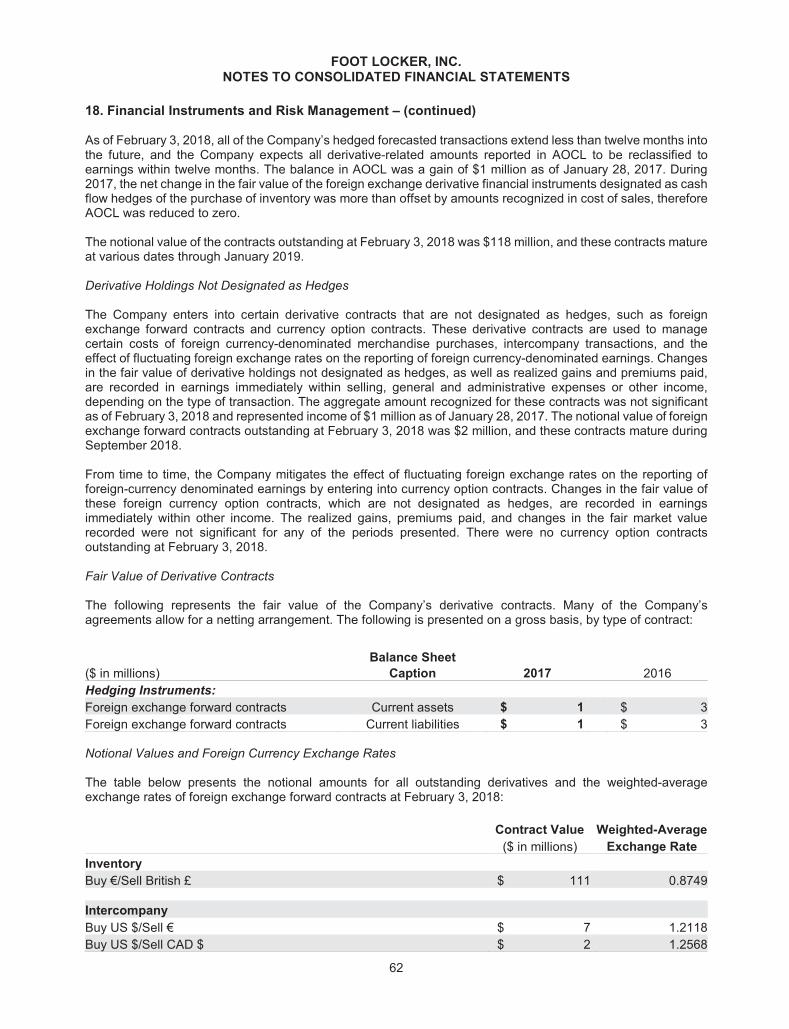
FOOT LOCKER, INC.
NOTES TO CONSOLIDATED FINANCIAL STATEMENTS
62
18. Financial Instruments and Risk Management – (continued) As of February 3, 2018, all of the Company’s hedged forecasted transactions extend less than twelve months into the future, and the Company expects all derivative-related amounts reported in AOCL to be reclassified to earnings within twelve months. The balance in AOCL was a gain of $1 million as of January 28, 2017. During 2017, the net change in the fair value of the foreign exchange derivative financial instruments designated as cash flow hedges of the purchase of inventory was more than offset by amounts recognized in cost of sales, therefore AOCL was reduced to zero. The notional value of the contracts outstanding at February 3, 2018 was $118 million, and these contracts mature at various dates through January 2019. Derivative Holdings Not Designated as Hedges The Company enters into certain derivative contracts that are not designated as hedges, such as foreign exchange forward contracts and currency option contracts. These derivative contracts are used to manage certain costs of foreign currency-denominated merchandise purchases, intercompany transactions, and the effect of fluctuating foreign exchange rates on the reporting of foreign currency-denominated earnings. Changes in the fair value of derivative holdings not designated as hedges, as well as realized gains and premiums paid, are recorded in earnings immediately within selling, general and administrative expenses or other income, depending on the type of transaction. The aggregate amount recognized for these contracts was not significant as of February 3, 2018 and represented income of $1 million as of January 28, 2017. The notional value of foreign exchange forward contracts outstanding at February 3, 2018 was $2 million, and these contracts mature during September 2018. From time to time, the Company mitigates the effect of fluctuating foreign exchange rates on the reporting of foreign-currency denominated earnings by entering into currency option contracts. Changes in the fair value of these foreign currency option contracts, which are not designated as hedges, are recorded in earnings immediately within other income. The realized gains, premiums paid, and changes in the fair market value recorded were not significant for any of the periods presented. There were no currency option contracts outstanding at February 3, 2018. Fair Value of Derivative Contracts The following represents the fair value of the Company’s derivative contracts. Many of the Company’s agreements allow for a netting arrangement. The following is presented on a gross basis, by type of contract: Balance Sheet ($ in millions) Caption 2017 2016 Hedging Instruments: Foreign exchange forward contracts Current assets $ 1 $ 3Foreign exchange forward contracts Current liabilities $ 1 $ 3 Notional Values and Foreign Currency Exchange Rates The table below presents the notional amounts for all outstanding derivatives and the weighted-average exchange rates of foreign exchange forward contracts at February 3, 2018: Contract Value Weighted-Average ($ in millions) Exchange Rate Inventory Buy €/Sell British £ $ 111 0.8749 Intercompany Buy US $/Sell € $ 7 1.2118Buy US $/Sell CAD $ $ 2 1.2568

FOOT LOCKER, INC.
NOTES TO CONSOLIDATED FINANCIAL STATEMENTS
63
18. Financial Instruments and Risk Management – (continued) Business Risk The retailing business is highly competitive. Price, quality, selection of merchandise, reputation, store location, advertising, and customer experience are important competitive factors in the Company’s business. The Company operates in 24 countries and purchased approximately 93 percent of its merchandise in 2017 from its top 5 suppliers. In 2017, the Company purchased approximately 67 percent of its athletic merchandise from one major supplier, Nike, Inc. (“Nike”). Each of our operating divisions is highly dependent on Nike; they individually purchased 44 to 73 percent of their merchandise from Nike. Included in the Company’s Consolidated Balance Sheet at February 3, 2018, are the net assets of the Company’s European operations, which total $1,058 million and are located in 20 countries, 11 of which have adopted the euro as their functional currency.
19. Fair Value Measurements The following table provides a summary of the recognized assets and liabilities that are measured at fair value on a recurring basis:
As of February 3, 2018 As of January 28, 2017 ($ in millions) Level 1 Level 2 Level 3 Level 1 Level 2 Level 3 Assets Available-for-sale security $ — $ 7 $ — $ — $ 6 $ —Foreign exchange forward contracts — 1 — — 3 —Total Assets $ — $ 8 $ — $ — $ 9 $ — Liabilities Foreign exchange forward contracts — 1 — — 3 —Total Liabilities $ — $ 1 $ — $ — $ 3 $ — Securities classified as available-for-sale are recorded at fair value with unrealized gains and losses reported, net of tax, in other comprehensive income, unless the unrealized gains or losses are determined to be other than temporary. The fair value of the auction rate security is determined by using quoted prices for similar instruments in active markets and accordingly is classified as a Level 2 instrument. The Company’s derivative financial instruments are valued using market-based inputs to valuation models. These valuation models require a variety of inputs, including contractual terms, market prices, yield curves, and measures of volatility and therefore are classified as Level 2 instruments. There were no transfers into or out of Level 1, Level 2, or Level 3 for any of the periods presented. In 2017 and 2016, the Company performed impairment reviews of long-lived and intangible assets for Runners Point and Sidestep. Additionally, during 2017, the Company performed an impairment review of long-lived assets for SIX:02. The fair value of all of the assets reviewed for both periods were measured using Level 3 inputs. Please see Note 3, Litigation and Other Charges for further information. The carrying value and estimated fair value of long-term debt were as follows:
2017 2016 ($ in millions) Carrying value $ 125 $ 127Fair value $ 144 $ 148 The fair value of long-term debt is determined by using model-derived valuations in which all significant inputs or significant value-drivers are observable in active markets and therefore are classified as Level 2. The carrying values of cash and cash equivalents, restricted cash, and other current receivables and payables approximate their fair value.

FOOT LOCKER, INC.
NOTES TO CONSOLIDATED FINANCIAL STATEMENTS
64
20. Retirement Plans and Other Benefits The Company and the Company’s U.S. retirement plan are defendants in a class action lawsuit. Please see Note 22, Legal Proceedings for further information. The amounts presented in this note do not include the expected plan reformation. Pension and Other Postretirement Plans The Company has defined benefit pension plans covering certain of its North American employees, which are funded in accordance with the provisions of the laws where the plans are in effect. In addition, the Company has a defined benefit plan for certain individuals of Runners Point Group. The Company also sponsors postretirement medical and life insurance plans, which are available to most of its retired U.S. employees. These plans are contributory and are not funded. The measurement date of the assets and liabilities is the month-end date that is closest to our fiscal year end. The following tables set forth the plans’ changes in benefit obligations and plan assets, funded status, and amounts recognized in the Consolidated Balance Sheets, as of February 3, 2018 and January 28, 2017:
Pension Benefits Postretirement Benefits 2017 2016 2017 2016 ($ in millions) Change in benefit obligation Benefit obligation at beginning of year $ 666 $ 667 $ 15 $ 14 Service cost 17 16 — — Interest cost 25 26 1 1 Plan participants’ contributions — — 1 1 Actuarial loss 25 7 — 1 Foreign currency translation adjustments 3 4 — — Benefits paid (53) (54) (2) (2) Benefit obligation at end of year $ 683 $ 666 $ 15 $ 15 Change in plan assets Fair value of plan assets at beginning of year $ 647 $ 602 Actual return on plan assets 70 55 Employer contributions 29 40 Foreign currency translation adjustments 4 4 Benefits paid (53) (54) Fair value of plan assets at end of year $ 697 $ 647 Funded status $ 14 $ (19) $ (15) $ (15) Amounts recognized on the balance sheet: Other assets $ 36 $ 10 $ — $ — Accrued and other liabilities (3) (3) (1) (1) Other liabilities (19) (26) (14) (14) $ 14 $ (19) $ (15) $ (15) Amounts recognized in accumulated other comprehensive loss, pre-tax: Net loss (gain) $ 368 $ 387 $ (5) $ (7) Prior service cost 1 1 — — $ 369 $ 388 $ (5) $ (7)

FOOT LOCKER, INC.
NOTES TO CONSOLIDATED FINANCIAL STATEMENTS
65
20. Retirement Plans and Other Benefits – (continued) As of February 3, 2018, the assets of both the Canadian and U.S. qualified pension plans exceeded their accumulated benefit obligations. As of January 28, 2017, the Canadian qualified pension plan’s assets exceeded its accumulated benefit obligation. The Company’s non-qualified pension plans have an accumulated benefit obligation in excess of plan assets, as these plans are unfunded. Accordingly, the table below reflects the non-qualified plans for 2017, whereas the amounts presented for 2016 included both the U.S. qualified plan and the non-qualified plans.
2017 2016 ($ in millions) Projected benefit obligation $ 22 $ 617Accumulated benefit obligation 22 617Fair value of plan assets — 589 The following tables set forth the changes in accumulated other comprehensive loss (pre-tax) at February 3, 2018:
Pension Postretirement Benefits Benefits ($ in millions) Net actuarial loss (gain) at beginning of year $ 387 $ (7)Amortization of net (loss) gain (13) 2 Gain arising during the year (8) —Foreign currency fluctuations 2 —Net actuarial loss (gain) at end of year (1) $ 368 $ (5)Net prior service cost at end of year (2) 1 —Total amount recognized $ 369 $ (5)
(1) The amounts in accumulated other comprehensive loss that are expected to be recognized as components of net periodic benefit cost
(income) during the next year are approximately $13 million and $(1) million related to the pension and postretirement plans, respectively.
(2) The net prior service cost did not change during the year and is not expected to change significantly during the next year. The following weighted-average assumptions were used to determine the benefit obligations under the plans:
Pension Benefits Postretirement Benefits 2017 2016 2017 2016 Discount rate 3.7 % 4.0% 3.7% 4.0% Rate of compensation increase 3.6 % 3.7% Pension expense is actuarially calculated annually based on data available at the beginning of each year. The expected return on plan assets is determined by multiplying the expected long-term rate of return on assets by the market-related value of plan assets for the U.S. qualified pension plan and market value for the Canadian qualified pension plan. The market-related value of plan assets is a calculated value that recognizes investment gains and losses in fair value related to equities over three or five years, depending on which computation results in a market-related value closer to market value. Market-related value for the U.S. qualified plan was $585 million and $550 million for 2017 and 2016, respectively. Assumptions used in the calculation of net benefit cost include the discount rate selected and disclosed at the end of the previous year, as well as other assumptions detailed in the table below:
Pension Benefits Postretirement Benefits 2017 2016 2015 2017 2016 2015 Discount rate 4.0% 4.1% 3.4% 4.0% 4.1% 3.4% Rate of compensation increase 3.6% 3.7% 3.7% Expected long-term rate of return on assets 5.8% 6.1% 6.1%

FOOT LOCKER, INC.
NOTES TO CONSOLIDATED FINANCIAL STATEMENTS
66
20. Retirement Plans and Other Benefits – (continued) The expected long-term rate of return on invested plan assets is based on the plans’ weighted-average target asset allocation, as well as historical and future expected performance of those assets. The target asset allocation is selected to obtain an investment return that is sufficient to cover the expected benefit payments and to reduce the variability of future contributions by the Company. The components of net benefit expense (income) are:
Pension Benefits Postretirement Benefits 2017 2016 2015 2017 2016 2015 ($ in millions) Service cost $ 17 $ 16 $ 17 $ — $ — $ —Interest cost 25 26 24 1 1 1 Expected return on plan assets (37) (37) (39) — — —Amortization of net loss (gain) 13 14 14 (2) (2) (1)Net benefit expense (income) $ 18 $ 19 $ 16 $ (1) $ (1) $ — Beginning in 2001, new retirees were charged the expected full cost of the medical plan, and then-existing retirees will incur 100 percent of the expected future increases in medical plan costs. Any changes in the health care cost trend rates assumed would not affect the accumulated benefit obligation or net benefit income, since retirees will incur 100 percent of such expected future increases. The Company maintains a Supplemental Executive Retirement Plan (“SERP”), which is an unfunded plan that includes provisions for the continuation of medical and dental insurance benefits to certain executive officers and other key employees of the Company (“SERP Medical Plan”). The SERP Medical Plan’s accumulated projected benefit obligation at February 3, 2018 was $12 million. The following initial and ultimate cost trend rate assumptions were used to determine the benefit obligations under the SERP Medical Plan:
Medical Trend Rate Dental Trend Rate 2017 2016 2015 2017 2016 2015 Initial cost trend rate 7.0% 7.0 % 7.0 % 5.0% 5.0% 5.0% Ultimate cost trend rate 5.0% 5.0 % 5.0 % 5.0% 5.0% 5.0% Year that the ultimate cost
trend rate is reached 2025 2021 2021 2018 2017 2016 The following initial and ultimate cost trend rate assumptions were used to determine the net periodic cost under the SERP Medical Plan:
Medical Trend Rate Dental Trend Rate 2017 2016 2015 2017 2016 2015 Initial cost trend rate 7.0% 7.0 % 7.0 % 5.0% 5.0% 5.0% Ultimate cost trend rate 5.0% 5.0 % 5.0 % 5.0% 5.0% 5.0% Year that the ultimate cost
trend rate is reached 2021 2021 2019 2017 2016 2015 A one percentage-point change in the assumed health care cost trend rates would have the following effects on the SERP Medical Plan:
1% Increase 1% (Decrease) ($ in millions) Effect on total service and interest cost components $ — $ —Effect on accumulated postretirement benefit obligation 3 (2)

FOOT LOCKER, INC.
NOTES TO CONSOLIDATED FINANCIAL STATEMENTS
67
20. Retirement Plans and Other Benefits – (continued) In 2017, the mortality assumption used to value the Company’s U.S. pension obligations was updated to the modified RP-2017 mortality table with generational projection using modified MP-2017 for both males and females and terminated vested participants. The mortality assumption was updated during the current year as the Company’s actual experience more closely matched the RP-2017 table than the previous table. In 2016, the Company used the RP-2000 mortality table with generational projection using scale AA for both males and females to value its pension obligations. This table was also used to value the Canadian pension obligations for 2017. For the SERP Medical Plan, the mortality assumption used to value the 2017 obligation was updated to the RPH-2017 table with generational projection using MP-2017, while in the prior year the obligation was valued using the RPH-2016 table with generational projection using MP-2016. Plan Assets The target composition of the Company’s Canadian qualified pension plan assets is 95 percent fixed-income securities and 5 percent equities. The Company believes plan assets are invested in a prudent manner with the same overall objective and investment strategy as noted below for the U.S. pension plan. The bond portfolio is comprised of government and corporate bonds chosen to match the duration of the pension plan’s benefit payment obligations. This current asset allocation will limit future volatility with regard to the funded status of the plan. The target composition of the Company’s U.S. qualified pension plan assets is 60 percent fixed-income securities, 36.5 percent equities, and 3.5 percent real estate. The Company may alter the asset allocation targets from time to time depending on market conditions and the funding requirements of the pension plan. This current asset allocation has and is expected to limit volatility with regard to the funded status of the plan, but may result in higher pension expense due to the lower long-term rate of return associated with fixed-income securities. Due to market conditions and other factors, actual asset allocations may vary from the target allocation outlined above. The Company believes plan assets are invested in a prudent manner with an objective of providing a total return that, over the long term, provides sufficient assets to fund benefit obligations, taking into account the Company’s expected contributions and the level of funding risk deemed appropriate. The Company’s investment strategy seeks to diversify assets among classes of investments with differing rates of return, volatility, and correlation in order to reduce funding risk. Diversification within asset classes is also utilized to ensure that there are no significant concentrations of risk in plan assets and to reduce the effect that the return on any single investment may have on the entire portfolio.
Valuation of Investments Significant portions of plan assets are invested in commingled trust funds. These funds are valued at the net asset value of units held by the plan at year end. Stocks traded on U.S. and Canadian security exchanges are valued at closing market prices on the measurement date. The fair values of the Company’s Canadian pension plan assets at February 3, 2018 and January 28, 2017 were as follows:
Level 1 Level 2 Level 3 2017 Total 2016 Total* ($ in millions) Cash and cash equivalents $ — $ 1 $ — $ 1 $ 1 Equity securities: Canadian and international (1) 4 — — 4 3 Fixed-income securities: Cash matched bonds (2) — 53 — 53 54 Total assets at fair value $ 4 $ 54 $ — $ 58 $ 58 *Each category of plan assets is classified within the same level of the fair value hierarchy for 2017 and 2016.
(1) This category comprises one mutual fund that invests primarily in a diverse portfolio of Canadian securities. (2) This category consists of fixed-income securities, including strips and coupons, issued or guaranteed by the Government of Canada,
provinces or municipalities of Canada including their agencies and crown corporations, as well as other governmental bonds and corporate bonds.
No Level 3 assets were held by the Canadian pension plan during 2017 and 2016.

FOOT LOCKER, INC.
NOTES TO CONSOLIDATED FINANCIAL STATEMENTS
68
20. Retirement Plans and Other Benefits – (continued) The fair values of the Company’s U.S. pension plan assets at February 3, 2018 and January 28, 2017 were as follows:
Level 1 Level 2 Level 3 2017 Total 2016 Total* ($ in millions) Cash and cash equivalents $ — $ 4 $ — $ 4 $ 4 Equity securities:
U.S. large-cap (1) — 115 — 115 103 U.S. mid-cap (1) — 34 — 34 31 International (2) — 78 — 78 70 Corporate stock (3) 19 — — 19 27
Fixed-income securities: Long duration corporate and government bonds (4) — 254 — 254 231
Intermediate duration corporate and government bonds (5) — 113 — 113 103
Other types of investments: Real estate securities (6) — 21 — 21 19 Insurance contracts — 1 — 1 1
Total assets at fair value $ 19 $ 620 —
$ — $ 639 $ 589 *Each category of plan assets is classified within the same level of the fair value hierarchy for 2017 and 2016.
(1) These categories consist of various managed funds that invest primarily in common stocks, as well as other equity securities and a combination of other funds.
(2) This category comprises three managed funds that invest primarily in international common stocks, as well as other equity securities and a combination of other funds.
(3) This category consists of the Company’s common stock.
(4) This category consists of various fixed-income funds that invest primarily in long-term bonds, as well as a combination of other funds, that together are designed to exceed the performance of related long-term market indices.
(5) This category consists of two fixed-income funds that invest primarily in intermediate duration bonds, as well as a combination of other funds, that together are designed to exceed the performance of related indices.
(6) This category consists of one fund that invests in global real estate securities.
No Level 3 assets were held by the U.S. pension plan during 2017 and 2016. The Company made a contribution of $25 million to its U.S. qualified pension plan during 2017. During 2017, the Company also paid $4 million in pension benefits related to its non-qualified pension plans. The Company continually evaluates the amount and timing of any potential contributions. Actual contributions are dependent on several factors; however the Company anticipates making a $128 million contribution during 2018 in connection with the expected U.S. pension plan reformation. See Note 22, Legal Proceedings, for further information. Estimated future benefit payments (excluding any amounts related to the expected U.S. pension plan reformation) for each of the next five years and the five years thereafter are as follows:
Pension Postretirement Benefits Benefits ($ in millions) 2018 $ 66 $ 1 2019 54 1 2020 53 1 2021 52 1 2022 51 1 2023–2027 236 2

FOOT LOCKER, INC.
NOTES TO CONSOLIDATED FINANCIAL STATEMENTS
69
20. Retirement Plans and Other Benefits – (continued) Savings Plans The Company has two qualified savings plans, a 401(k) plan that is available to employees whose primary place of employment is the U.S., and another plan that is available to employees whose primary place of employment is in Puerto Rico. Prior to January 1, 2018, both plans limited participation to employees who had attained at least the age of twenty-one and have completed one year of service consisting of at least 1,000 hours. Effective January 1, 2018, eligible associates may contribute to the plans following 28 days of employment and are eligible for Company matching contributions upon completion of one year of service consisting of at least 1,000 hours. As of January 1, 2018, the savings plans allow eligible employees to contribute up to 40 percent of their compensation on a pre-tax basis, subject to a maximum of $18,500 for the U.S. plan and $15,000 for the Puerto Rico plan. The Company matches 25 percent of employees’ pre-tax contributions on up to the first 4 percent of the employees’ compensation (subject to certain limitations). Matching contributions made before January 1, 2016 were made with Company stock, subsequent to this date matching contributions were made in cash. Such matching contributions are vested incrementally over the first 5 years of participation for both plans. The charge to operations for the Company’s matching contribution was $3 million for each of the years presented. 21. Share-Based Compensation Stock Awards Under the Company’s 2007 Stock Incentive Plan (the “2007 Stock Plan”), stock options, restricted stock, restricted stock units, stock appreciation rights, or other stock-based awards may be granted to officers and other employees of the Company, including its subsidiaries and operating divisions worldwide. Nonemployee directors are also eligible to receive stock options under this plan, although none are outstanding as of February 3, 2018. Options for employees become exercisable in substantially equal annual installments over a three-year period, beginning with the first anniversary of the date of grant of the option, unless a shorter or longer duration is established at the time of the option grant. The options terminate up to ten years from the date of grant. On May 21, 2014, the 2007 Stock Plan was amended to increase the number of shares of the Company’s common stock reserved for all awards to 14 million shares. As of February 3, 2018, there were 10,760,270 shares available for issuance under this plan. Employees Stock Purchase Plan Under the Company’s 2013 Foot Locker Employees Stock Purchase Plan (“ESPP”), participating employees are able to contribute up to 10 percent of their annual compensation, not to exceed $25,000 in any plan year, through payroll deductions to acquire shares of the Company’s common stock at 85 percent of the lower market price on one of two specified dates in each plan year. Of the 3,000,000 shares of common stock authorized under this plan, there were 2,523,865 shares available for purchase as of February 3, 2018. During 2017 and 2016, participating employees purchased 109,790 shares and 80,992 shares, respectively. Share-Based Compensation Expense Total compensation expense included in SG&A and the associated tax benefits recognized related to the Company’s share-based compensation plans were as follows:
2017 2016 2015 ($ in millions) Options and shares purchased under the ESPP $ 9 $ 10 $ 11 Restricted stock and restricted stock units 6 12 11 Total share-based compensation expense $ 15 $ 22 $ 22 Tax benefit recognized $ 4 $ 6 $ 8

FOOT LOCKER, INC.
NOTES TO CONSOLIDATED FINANCIAL STATEMENTS
70
21. Share-Based Compensation – (continued) Valuation Model and Assumptions The Black-Scholes option-pricing model is used to estimate the fair value of share-based awards. The Black-Scholes option-pricing model incorporates various and highly subjective assumptions, including expected term and expected volatility. The Company estimates the expected term of share-based awards using the Company’s historical exercise and post-vesting employment termination patterns, which it believes are representative of future behavior. The expected term for the employee stock purchase plan valuation is based on the length of each purchase period as measured at the beginning of the offering period, which is one year. The Company estimates the expected volatility of its common stock at the grant date using a weighted-average of the Company’s historical volatility and implied volatility from traded options on the Company’s common stock. The Company believes that this combination of historical volatility and implied volatility provides a better estimate of future stock price volatility. The risk-free interest rate assumption is determined using the Federal Reserve nominal rates for U.S. Treasury zero-coupon bonds with maturities similar to those of the expected term of the award being valued. The expected dividend yield is derived from the Company’s historical experience. As of Q1 2017, in connection with the adoption of ASU 2016-09, we have made the accounting policy election to discontinue estimating forfeitures and will account for forfeitures as they occur. Prior to 2017, the Company recorded share-based compensation expense only for those awards expected to vest using an estimated forfeiture rate based on its historical pre-vesting forfeiture data. The following table shows the Company’s assumptions used to compute the share-based compensation expense:
Stock Option Plans Stock Purchase Plan 2017 2016 2015 2017 2016 2015 Weighted-average risk free rate of
interest 2.1 % 1.4 % 1.5 % 1.0 % 0.5 % 0.2 % Expected volatility 25 % 30 % 30 % 30 % 27 % 25 % Weighted-average expected award
life (in years) 5.4 5.7 6.0 1.0 1.0 1.0 Dividend yield 1.9 % 1.7 % 1.6 % 2.0 % 1.8 % 1.6 % Weighted-average fair value $ 14.74 $ 15.71 $ 16.07 $ 10.96 $ 13.33 $ 10.47 The information set forth in the following table covers options granted under the Company’s stock option plans:
Weighted- Weighted- Number Average Average of Remaining Exercise Shares Contractual Life Price (in thousands) (in years) (per share) Options outstanding at January 28, 2017 2,806 $ 42.61Granted 547 69.58Exercised (593) 21.35Expired or cancelled (21) 61.50Options outstanding at February 3, 2018 2,739 6.5 $ 52.45Options exercisable at February 3, 2018 1,699 5.2 $ 43.85

FOOT LOCKER, INC.
NOTES TO CONSOLIDATED FINANCIAL STATEMENTS
71
21. Share-Based Compensation – (continued) The total fair value of options vested during 2017, 2016, and 2015 was $8 million, $9 million, and $15 million, respectively. During the year ended February 3, 2018, the Company received $13 million in cash from option exercises and recognized a related tax benefit of $8 million. The total intrinsic value of options exercised (the difference between the market price of the Company’s common stock on the exercise date and the price paid by the optionee to exercise the option) is presented below:
2017 2016 2015 ($ in millions) Exercised $ 22 $ 56 $ 99 The aggregate intrinsic value for stock options outstanding, and those outstanding and exercisable (the difference between the Company’s closing stock price on the last trading day of the period and the exercise price of the options, multiplied by the number of in-the-money stock options) is presented below:
2017 ($ in millions) Outstanding $ 17 Outstanding and exercisable $ 17 As of February 3, 2018, there was $5 million of total unrecognized compensation cost related to nonvested stock options, which is expected to be recognized over a remaining weighted-average period of 1.5 years. The following table summarizes information about stock options outstanding and exercisable at February 3, 2018:
Options Outstanding Options Exercisable Weighted- Average Weighted- Weighted- Remaining Average Average Range of Exercise Number Contractual Exercise Number Exercise Prices Outstanding Life Price Exercisable Price (in thousands, except prices per share and contractual life) $9.85 to $24.75 312 2.6 $ 17.40 312 $ 17.40 $30.92 to $45.75 762 5.2 38.46 722 38.64 $48.55 to $62.11 703 6.6 61.04 499 61.08 $63.79 to $73.21 962 8.6 68.60 166 64.35 2,739 6.5 $ 52.45 1,699 $ 43.85 Restricted Stock and Restricted Stock Units Restricted shares of the Company’s common stock and restricted stock units (“RSU”) may be awarded to certain officers and key employees of the Company. Additionally, RSU awards are made to employees in connection with the Company’ long-term incentive program and to nonemployee directors. Each RSU represents the right to receive one share of the Company’s common stock provided that the performance and vesting conditions are satisfied. In 2017, 2016, and 2015 there were 360,782, 648,558, and 588,308 RSU awards outstanding, respectively.

FOOT LOCKER, INC.
NOTES TO CONSOLIDATED FINANCIAL STATEMENTS
72
21. Share-Based Compensation – (continued) Generally, awards fully vest after the passage of time, typically three years. However, RSU awards made in connection with the Company’s long-term incentive program are earned after the attainment of certain performance metrics and vest after the passage of time. Restricted stock is considered outstanding at the time of grant and the holders have voting rights. Dividends are paid to holders of restricted stock that vest with the passage of time. With regard to performance-based restricted stock, dividends will be accumulated and paid after the performance criteria are met. No dividends are paid or accumulated on RSU awards. Compensation expense is recognized using the fair market value on the date of grant and is amortized over the vesting period, provided the recipient continues to be employed by the Company. Restricted stock and RSU activity is summarized as follows:
Weighted-Average Number Remaining Weighted-Average of Contractual Grant Date Shares Life Fair Value (in thousands) (in years) (per share) Nonvested at January 28, 2017 798 $ 56.91Granted 329 63.68Vested (305) 49.97Expired or cancelled (448) 64.75Nonvested at February 3, 2018 374 1.3 $ 59.15Aggregate value ($ in millions) $ 22 The total fair value of awards for which restrictions lapsed was $15 million, $9 million, and $10 million for 2017, 2016, and 2015, respectively. At February 3, 2018, there was $8 million of total unrecognized compensation cost related to nonvested restricted stock and RSU awards. 22. Legal Proceedings Legal proceedings pending against the Company or its consolidated subsidiaries consist of ordinary, routine litigation, including administrative proceedings, incidental to the business of the Company or businesses that have been sold or disposed of by the Company in past years. These legal proceedings include commercial, intellectual property, customer, environmental, and employment-related claims. Additionally, the Company is a defendant in a purported Fair Credit Reporting Act class action in California and a purported meal break class action in California. The Company and certain officers of the Company are defendants in purported securities law class actions in New York. The Company and the Company’s U.S. retirement plan are defendants in a class action (Osberg v. Foot Locker Inc. et ano., filed in the U.S. District Court for the Southern District of New York) in which the plaintiff alleges that, in connection with the 1996 conversion of the retirement plan to a defined benefit plan with a cash balance formula, the Company and the retirement plan failed to properly advise plan participants of the “wear-away” effect of the conversion. Plaintiff’s claims were for breach of fiduciary duty under the Employee Retirement Income Security Act of 1974, as amended, and violation of the statutory provisions governing the content of the Summary Plan Description. In February 2018, the Company’s Petition for Writ of Certiorari with the U.S. Supreme Court was denied. Accordingly, the Company must reform the pension plan consistent with the trial court’s judgment, and will be working with plaintiffs’ counsel and the court on the specific steps needed to implement the judgment. The Company has estimated that the cost of plan reformation is $278 million as of February 3, 2018 and this amount will continue to increase with interest until paid, as required by the provisions of the required plan reformation. The previous amount accrued was $150 million. Accordingly, during the fourth quarter of 2017, the Company recorded an additional charge of $128 million, bringing the cumulative amount accrued for this matter to $278 million. The Company is currently formulating the actions and steps necessary to reform the plan and has determined that it will make a $128 million contribution during 2018 to the pension trust to fund a portion of this obligation. Also during the fourth quarter of 2017, the Company established a qualified settlement fund in the amount of $150 million, which will also be used to fund future pension contributions that may be required as a result of the plan reformation and plaintiffs’ legal fees.

FOOT LOCKER, INC.
NOTES TO CONSOLIDATED FINANCIAL STATEMENTS
73
22. Legal Proceedings – (continued) Management does not believe that the outcome of any such legal proceedings pending against the Company or its consolidated subsidiaries, as described above, would have a material adverse effect on the Company’s consolidated financial position, liquidity, or results of operations, taken as a whole, based upon current knowledge and taking into consideration current accruals. Litigation is inherently unpredictable, and judgments could be rendered or settlements entered into that could adversely affect the Company’s operating results or cash flows in a particular period. 23. Quarterly Results (Unaudited)
1st Quarter 2nd Quarter 3rd Quarter 4th Quarter (1) Fiscal Year Sales
2017 2,001 1,701 1,870 2,210 $ 7,782 2016 1,987 1,780 1,886 2,113 $ 7,766
Gross margin (2) 2017 680 503 580 693 $ 2,456 2016 696 587 640 713 $ 2,636
Operating profit (3) 2017 268 72 155 76 $ 571 2016 296 198 228 278 $ 1,000
Net income/(loss) (4), (5), (6), (7) 2017 180 51 102 (49) $ 284 2016 191 127 157 189 $ 664
Basic earnings per share (8) 2017 1.37 0.39 0.81 (0.40) $ 2.23 2016 1.40 0.94 1.18 1.43 $ 4.95
Diluted earnings per share (8) 2017 1.36 0.39 0.81 (0.40) $ 2.22 2016 1.39 0.94 1.17 1.42 $ 4.91
(1) The fourth quarter of 2017 represents the 14 weeks ended February 3, 2018.
(2) Gross margin represents sales less cost of sales. Cost of sales includes: the cost of merchandise, freight, distribution costs including related depreciation expense, shipping and handling, occupancy and buyers’ compensation. Occupancy costs include rent, common area maintenance charges, real estate taxes, general maintenance, and utilities.
(3) Operating profit represents income before income taxes, interest (income)/expense, net, and non-operating income.
(4) During the second and fourth quarters of 2017, the Company recorded pre-tax charges of $50 million and $128 million, respectively, related to its U.S. retirement plan litigation. See Note 22, Legal Proceedings for further information.
(5) During the third quarter of 2017, the Company recorded a pre-tax charge of $13 million associated with the reorganization and the reduction in staff taken to improve efficiency. See Note 3, Litigation and Other Charges for further information.
(6) During the fourth quarter of 2017 and the third quarter of 2016, the Company recorded pre-tax non-cash impairment charges totaling $20 million and $6 million, respectively. See Note 3, Litigation and Other Charges for further information.
(7) During the fourth quarter of 2017, the Company recorded a provisional $99 million tax liability for the mandatory deemed repatriation of foreign sourced net earnings and a corresponding change in our permanent reinvestment assertion under ASC 740-30. See Note 17, Income Taxes for further information.
(8) Quarterly income per share amounts do not total to the annual amount due to changes in weighted-average shares outstanding during the year. Additionally, stock options and other potentially dilutive common shares were excluded from the computation of diluted earnings per common share for the quarter ended February 3, 2018 as the Company reported a net loss.

74
Item 9. Changes in and Disagreements with Accountants on Accounting and Financial Disclosure There were no disagreements between the Company and its independent registered public accounting firm on matters of accounting principles or practices. Item 9A. Controls and Procedures (a) Evaluation of Disclosure Controls and Procedures.
The Company’s management performed an evaluation, under the supervision and with the participation of the Company’s Chief Executive Officer (“CEO”) and Chief Financial Officer (“CFO”), of the effectiveness of the design and operation of the Company’s disclosure controls and procedures (as that term is defined in Rules 13a-15(e) and 15d-15(e) under the Securities Exchange Act of 1934, as amended (the “Exchange Act”)) as of February 3, 2018. Based on that evaluation, the Company’s CEO and CFO concluded that the Company’s disclosure controls and procedures were effective to ensure that information relating to the Company that is required to be disclosed in the reports that we file or submit under the Exchange Act is recorded, processed, summarized, and reported within the time periods specified in the SEC rules and forms, and is accumulated and communicated to management, including the CEO and CFO, as appropriate to allow timely decisions regarding required disclosure.
(b) Management’s Annual Report on Internal Control over Financial Reporting.
The Company’s management is responsible for establishing and maintaining adequate internal control over financial reporting (as that term is defined in Exchange Act Rules 13a-15(f) and 15d-15(f)). To evaluate the effectiveness of the Company’s internal control over financial reporting, the Company uses the framework in Internal Control-Integrated Framework (2013) issued by the Committee of Sponsoring Organizations of the Treadway Commission (the “2013 COSO Framework”). Using the 2013 COSO Framework, the Company’s management, including the CEO and CFO, evaluated the Company’s internal control over financial reporting and concluded that the Company’s internal control over financial reporting was effective as of February 3, 2018. KPMG LLP, the independent registered public accounting firm that audits the Company’s consolidated financial statements included in this annual report, has issued an attestation report on the Company’s effectiveness of internal control over financial reporting, which is included in Item 9A(d).
(c) Changes in Internal Control over Financial Reporting.
During the Company’s last fiscal quarter there were no changes in internal control over financial
reporting that materially affected, or are reasonably likely to materially affect, the Company’s internal control over financial reporting.
(d) Report of Independent Registered Public Accounting Firm on Internal Control Over Financial Reporting-
the report appears on the following page.

75
REPORT OF INDEPENDENT REGISTERED PUBLIC ACCOUNTING FIRM
The Board of Directors and Shareholders of Foot Locker, Inc.:
Opinion on Internal Control Over Financial Reporting
We have audited Foot Locker, Inc.’s and subsidiaries (the “Company”) internal control over financial reporting as of February 3, 2018, based on criteria established in Internal Control – Integrated Framework (2013) issued by the Committee of Sponsoring Organizations of the Treadway Commission. In our opinion, the Company maintained, in all material respects, effective internal control over financial reporting as of February 3, 2018, based on criteria established in Internal Control – Integrated Framework (2013) issued by the Committee of Sponsoring Organizations of the Treadway Commission.
We also have audited, in accordance with the standards of the Public Company Accounting Oversight Board (United States) (PCAOB), the consolidated balance sheets of the Company as of February 3, 2018 and January 28, 2017, the related consolidated statements of operations, comprehensive income, stockholders’ equity, and cash flows for each of the years in the three-year period ended February 3, 2018, and the related notes (collectively, the “consolidated financial statements”), and our report dated March 29, 2018 expressed an unqualified opinion on those consolidated financial statements.
Basis for Opinion
The Company’s management is responsible for maintaining effective internal control over financial reporting and for its assessment of the effectiveness of internal control over financial reporting, included in the accompanying Management’s Annual Report on Internal Control over Financial Reporting. Our responsibility is to express an opinion on the Company’s internal control over financial reporting based on our audit. We are a public accounting firm registered with the PCAOB and are required to be independent with respect to the Company in accordance with the U.S. federal securities laws and the applicable rules and regulations of the Securities and Exchange Commission and the PCAOB.
We conducted our audit in accordance with the standards of the PCAOB. Those standards require that we plan and perform the audit to obtain reasonable assurance about whether effective internal control over financial reporting was maintained in all material respects. Our audit of internal control over financial reporting included obtaining an understanding of internal control over financial reporting, assessing the risk that a material weakness exists, and testing and evaluating the design and operating effectiveness of internal control based on the assessed risk. Our audit also included performing such other procedures as we considered necessary in the circumstances. We believe that our audit provides a reasonable basis for our opinion.
Definition and Limitations of Internal Control Over Financial Reporting
A company’s internal control over financial reporting is a process designed to provide reasonable assurance regarding the reliability of financial reporting and the preparation of financial statements for external purposes in accordance with generally accepted accounting principles. A company’s internal control over financial reporting includes those policies and procedures that (1) pertain to the maintenance of records that, in reasonable detail, accurately and fairly reflect the transactions and dispositions of the assets of the company; (2) provide reasonable assurance that transactions are recorded as necessary to permit preparation of financial statements in accordance with generally accepted accounting principles, and that receipts and expenditures of the company are being made only in accordance with authorizations of management and directors of the company; and (3) provide reasonable assurance regarding prevention or timely detection of unauthorized acquisition, use, or disposition of the company’s assets that could have a material effect on the financial statements.
Because of its inherent limitations, internal control over financial reporting may not prevent or detect misstatements. Also, projections of any evaluation of effectiveness to future periods are subject to the risk that controls may become inadequate because of changes in conditions, or that the degree of compliance with the policies or procedures may deteriorate.
/s/ KPMG LLP New York, New York March 29, 2018

76
Item 9B. Other Information None.
PART III Item 10. Directors, Executive Officers and Corporate Governance (a) Directors of the Company
Information relative to directors of the Company will be set forth under the section captioned “Proposal 1: Election of Directors” in the Proxy Statement and is incorporated herein by reference.
(b) Executive Officers of the Company Information with respect to executive officers of the Company will be set forth in Item 4A in Part I. (c)
Information with respect to compliance with Section 16(a) of the Securities Exchange Act of 1934 will be set forth under the section captioned “Section 16(a) Beneficial Ownership Reporting Compliance” in the Proxy Statement and is incorporated herein by reference.
(d)
Information on our audit committee and the audit committee financial expert will be contained in the Proxy Statement under the section captioned “Committees of the Board” and is incorporated herein by reference.
(e)
Information about the Code of Business Conduct governing our employees, including our Chief Executive Officer, Chief Financial Officer, Chief Accounting Officer, and the Board of Directors, will be set forth under the heading “Code of Business Conduct” under the Corporate Governance section of the Proxy Statement and is incorporated herein by reference.
Item 11. Executive Compensation Information set forth in the Proxy Statement beginning with the section captioned “Directors’ Compensation and Benefits” through and including the section captioned “Pension Benefits” is incorporated herein by reference, and information set forth in the Proxy Statement under the heading “Compensation and Management Resources Committee Interlocks and Insider Participation” is incorporated herein by reference. Item 12. Security Ownership of Certain Beneficial Owners and Management and Related Stockholder Matters Information set forth in the Proxy Statement under the sections captioned “Equity Compensation Plan Information” and “Beneficial Ownership of the Company’s Stock” is incorporated herein by reference. Item 13. Certain Relationships and Related Transactions, and Director Independence Information set forth in the Proxy Statement under the section captioned “Related Person Transactions” and under the section captioned “Directors’ Independence” is incorporated herein by reference. Item 14. Principal Accounting Fees and Services Information about the principal accounting fees and services is set forth under the section captioned “Proposal 3: Ratification of the Appointment of Independent Registered Public Accounting Firm — Audit and Non-Audit Fees” in the Proxy Statement and is incorporated herein by reference. Information about the Audit Committee’s pre-approval policies and procedures is set forth in the section captioned “Proposal 3: Ratification of the Appointment of Independent Registered Public Accounting Firm — Audit Committee Pre-Approval Policies and Procedures” in the Proxy Statement and is incorporated herein by reference.

77
PART IV Item 15. Exhibits and Financial Statement Schedules (a)(1) and (2) Financial Statements
The list of financial statements required by this item is set forth in Item 8. “Consolidated Financial Statements and Supplementary Data.” All other schedules specified under Regulation S-X have been omitted because they are not applicable, because they are not required, or because the information required is included in the financial statements or notes thereto.
(a)(3) and (c) Exhibits
An index of the exhibits which are required by this item and which are included or incorporated herein by reference in this report appears on pages 79 through 81.

78
SIGNATURES
Pursuant to the requirements of Section 13 or 15(d) of the Securities Exchange Act of 1934, the Company has duly caused this report to be signed on its behalf by the undersigned, thereunto duly authorized. FOOT LOCKER, INC.
By: /s/ RICHARD A. JOHNSON
Richard A. Johnson Chairman of the Board, President and Chief Executive Officer
Date: March 29, 2018 Pursuant to the requirements of the Securities Exchange Act of 1934, this report has been signed below on March 29, 2018, by the following persons on behalf of the Company and in the capacities indicated.
/s/ RICHARD A. JOHNSON
/s/ LAUREN B. PETERS Richard A. Johnson Lauren B. Peters
Chairman of the Board, President and Executive Vice President and Chief Executive Officer Chief Financial Officer
/s/ GIOVANNA CIPRIANO /s/ STEVEN OAKLAND Giovanna Cipriano Steven Oakland
Senior Vice President and Chief Accounting Officer Director
/s/ MAXINE CLARK /s/ ULICE PAYNE, JR. Maxine Clark Ulice Payne, Jr.
Director Director
/s/ ALAN D. FELDMAN /s/ CHERYL NIDO TURPIN Alan D. Feldman Cheryl Nido Turpin
Director Director
/s/ JAROBIN GILBERT, JR /s/ KIMBERLY K. UNDERHILL Jarobin Gilbert, Jr. Kimberly K. Underhill
Director Director
/s/ GUILLERMO G. MARMOL /s/ DONA D. YOUNG Guillermo G. Marmol Dona D. Young
Director Lead Director
/s/ MATTHEW M. MCKENNA Matthew M. McKenna
Director

79
FOOT LOCKER, INC. INDEX OF EXHIBITS
Exhibit No. Description 3(i)(a)
Certificate of Incorporation of the Registrant, as filed by the Department of State of the State of New York on April 7, 1989 (incorporated herein by reference to Exhibit 3(i)(a) to the Quarterly Report on Form 10-Q for the quarterly period ended July 26, 1997 filed on September 4, 1997 (the “July 26, 1997 Form 10-Q”)).
3(i)(b)
Certificates of Amendment of the Certificate of Incorporation of the Registrant, as filed by the Department of State of the State of New York on (a) July 20, 1989, (b) July 24, 1990, (c) July 9, 1997 (incorporated herein by reference to Exhibit 3(i)(b) to the July 26, 1997 Form 10-Q), (d) June 11, 1998 (incorporated herein by reference to Exhibit 4.2(a) to the Registration Statement on Form S-8 (Registration No. 333-62425) (the “1998 Form S-8”)), (e) November 1, 2001 (incorporated herein by reference to Exhibit 4.2 to the Registration Statement on Form S-8 (Registration No. 333-74688) (the “2001 Form S-8”)), and (f) May 28, 2014 (incorporated herein by reference to Exhibit 3.1 to the Current Report on Form 8-K dated May 21, 2014 filed on May 28, 2014).
3(ii) By-Laws of the Registrant, as amended (incorporated herein by reference to Exhibit 3.1 to the Current Report on Form 8-K dated February 20, 2018 filed on February 22, 2018).
4.1 The rights of holders of the Registrant’s equity securities are defined in the Registrant’s Certificate of Incorporation, as amended (incorporated herein by reference to (a) Exhibits 3(i)(a) and 3(i)(b) to the July 26, 1997 Form 10-Q, Exhibit 4.2(a) to the 1998 Form S-8, and Exhibit 4.2 to the 2001 Form S-8.
4.2 Indenture, dated as of October 10, 1991 (incorporated herein by reference to Exhibit 4.1 to the Registration Statement on Form S-3 (Registration No. 33-43334)).
4.3 Form of 8-1/2% Debentures due 2022 (incorporated herein by reference to Exhibit 4 to the Current Report on Form 8-K dated January 16, 1992).
10.1
Credit Agreement, dated as of May 19, 2016, among Foot Locker, Inc., a New York corporation, the guarantors party thereto, the lenders party thereto and Wells Fargo, National Association, as agent, letter of credit issuer and swing line lender (incorporated herein by reference to Exhibit 10.1 to the Current Report on Form 8-K dated May 19, 2016 filed on May 19, 2016).
10.2† Foot Locker 2007 Stock Incentive Plan, amended and restated as of May 21, 2014 (incorporated herein by reference to Exhibit 10.1 to the Current Report on Form 8-K dated December 23, 2014 filed on December 30, 2014.
10.3† Amendment Number One to the Foot Locker 2007 Stock Incentive Plan, amended and restated as of May 21, 2014 (incorporated herein by reference to Exhibit 10.5 to the Annual Report on Form 10-K for the fiscal year ended January 28, 2017 filed on March 23, 2017).
10.4† Foot Locker Long-Term Incentive Compensation Plan, as amended and restated (incorporated herein by reference to Exhibit 10.3 to the Current Report on Form 8-K dated March 23, 2016 filed on March 29, 2016) (the “March 23, 2016 Form 8-K”).
10.5† Foot Locker Annual Incentive Compensation Plan, as amended and restated (incorporated herein by reference to Exhibit 10.1 to the Current Report on Form 8-K dated May 17, 2017 filed on May 19, 2017).
10.6† Executive Supplemental Retirement Plan (incorporated herein by reference to Exhibit 10(d) to the Registration Statement on Form 8-B filed on August 7, 1989 (Registration No. 1-10299) (the “8-B Registration Statement”)).
10.7† Amendment to the Executive Supplemental Retirement Plan (incorporated herein by reference to Exhibit 10(c)(i) to the Annual Report on Form 10-K for the fiscal year ended January 28, 1995 filed on April 24, 1995).
10.8† Amendment to the Executive Supplemental Retirement Plan (incorporated herein by reference to Exhibit 10(d)(ii) to the Annual Report on Form 10-K for the fiscal year ended January 27, 1996 filed on April 26, 1996).
10.9† Supplemental Executive Retirement Plan, as amended and restated (incorporated herein by reference to Exhibit 10.1 to the Current Report on Form 8-K dated August 13, 2007 filed on August 17, 2007).
10.10† Amendment to the Foot Locker Supplemental Executive Retirement Plan (incorporated herein by reference to Exhibit 10.1 to the Current Report on Form 8-K dated May 25, 2011 filed on May 27, 2011).

80
Exhibit No. Description 10.11†
Amendment Number Two to the Foot Locker Supplemental Executive Retirement Plan (incorporated herein by reference to Exhibit 10.3 to the Current Report on Form 8-K dated March 26, 2014 filed on April 1, 2014 (the “March 26, 2014 Form 8-K”)).
10.12† Foot Locker Directors’ Retirement Plan, as amended (incorporated herein by reference to Exhibit 10(k) to the 8-B Registration Statement).
10.13† Amendments to the Foot Locker Directors’ Retirement Plan (incorporated herein by reference to Exhibit 10(c) to the Quarterly Report on Form 10-Q for the quarterly period ended October 28, 1995 filed on December 11, 1995).
10.14† Foot Locker, Inc. Excess Cash Balance Plan (incorporated herein by reference to Exhibit 10.22 to the Annual Report on Form 10-K for the fiscal year ended January 31, 2009 filed on March 30, 2009 (the “2008 Form 10-K”)).
10.15† Automobile Expense Reimbursement Program for Senior Executives (incorporated herein by reference to Exhibit 10.26 to the 2008 Form 10-K).
10.16† Executive Medical Expense Allowance Program for Senior Executives (incorporated herein by reference to Exhibit 10.27 to the 2008 Form 10-K).
10.17† Financial Planning Allowance Program for Senior Executives (incorporated herein by reference to Exhibit 10.28 to the 2008 Form 10-K).
10.18† Long-Term Disability Program for Senior Executives (incorporated herein by reference to Exhibit 10.32 to the 2008 Form 10-K).
10.19† Form of Nonstatutory Stock Option Award Agreement for Executive Officers (incorporated herein by reference to Exhibit 10.40 to the Annual Report on Form 10-K for the fiscal year ended January 28, 2006 filed on March 27, 2006).
10.20† Form of Nonstatutory Stock Option Award Agreement for Executive Officers (incorporated herein by reference to Exhibit 10.1 to the March 26, 2014 Form 8-K).
10.21† From of Restricted Stock Agreement (incorporated herein by reference to Exhibit 10.2 to the March 26, 2014 Form 8-K).
10.22† Form of Restricted Stock Unit Award Agreement (incorporated herein by reference to Exhibit 10.3 to the March 28, 2013 Form 8-K).
10.23† Form of Restricted Stock Unit Award Agreement for RSU portion of long-term incentive compensation awards (incorporated herein by reference to Exhibit 10.1 to the March 23, 2016 Form 8-K).
10.24† Form of Restricted Stock Unit Award Agreement for long-term incentive RSU awards (incorporated herein by reference to Exhibit 10.2 to March 23, 2016 Form 8-K).
10.25† Form of Restricted Stock Unit Award Agreement (New Hire) (incorporated herein by reference to Exhibit 10.1 to the Quarterly Report on Form 10-Q for the quarterly period ended July 30, 2016 filed on September 7, 2016).
10.26 Form of indemnification agreement, as amended (incorporated herein by reference to Exhibit 10(g) to the 8-B Registration Statement).
10.27 Amendment to form of indemnification agreement (incorporated herein by reference to Exhibit 10.5 to the Quarterly Report on Form 10-Q for the quarterly period ended May 5, 2001 filed on June 13, 2001 (the “May 5, 2001 Form 10-Q”)).
10.28 Trust Agreement dated as of November 12, 1987 (“Trust Agreement”), between F.W. Woolworth Co. and The Bank of New York, as amended and assumed by the Registrant (incorporated herein by reference to Exhibit 10(j) to the 8-B Registration Statement).
10.29 Amendment to Trust Agreement made as of April 11, 2001 (incorporated herein by reference to Exhibit 10.4 to the May 5, 2001 Form 10-Q).
10.30† Employment Agreement, dated November 6, 2014, by and between Richard A. Johnson and the Company (incorporated herein by reference to Exhibit 10.2 to the Current Report on Form 8-K dated November 3, 2014 filed on November 7, 2014).
10.31† Form of Senior Executive Employment Agreement (incorporated herein by reference to Exhibit 10.1 to the Current Report on Form 8-K dated April 20, 2015 filed on April 20, 2015).

81
Exhibit No. Description
10.32† Form of Executive Employment Agreement (incorporated herein by reference to Exhibit 10.19 to the Annual Report on Form 10-K for the fiscal year ended January 30, 2016 filed on March 24, 2016).
12* Computation of Ratio of Earnings to Fixed Charges. 21* Subsidiaries of the Registrant. 23* Consent of Independent Registered Public Accounting Firm.
31.1* Certification of Chief Executive Officer Pursuant to Section 302 of the Sarbanes-Oxley Act of 2002.31.2* Certification of Chief Financial Officer Pursuant to Section 302 of the Sarbanes-Oxley Act of 2002. 32**
Certification of Chief Executive Officer and Chief Financial Officer Pursuant to 18 U.S.C. Section 1350, as adopted pursuant to Section 906 of the Sarbanes-Oxley Act of 2002.
101.INS* XBRL Instance Document. 101.SCH* XBRL Taxonomy Extension Schema. 101.CAL* XBRL Taxonomy Extension Calculation Linkbase. 101.DEF* XBRL Taxonomy Extension Definition Linkbase. 101.LAB* XBRL Taxonomy Extension Label Linkbase. 101.PRE* XBRL Taxonomy Extension Presentation Linkbase.
† Management contract or compensatory plan or arrangement.
* Filed herewith.
** Furnished herewith

82
Exhibit 12
FOOT LOCKER, INC. COMPUTATION OF RATIO OF EARNINGS TO FIXED CHARGES
(Unaudited) ($ in millions)
Fiscal Year Ended Feb. 3, Jan. 28, Jan. 30, Jan. 31, Feb. 1,
2018 2017 2016 2015 2014 NET EARNINGS Net income $ 284 $ 664 $ 541 $ 520 $ 429 Income tax expense 294 340 296 289 234 Interest expense 12 11 11 11 11 Portion of rents deemed representative of the
interest factor (1/3) 287 269 252 249 236 $ 877 $ 1,284 $ 1,100 $ 1,069 $ 910 FIXED CHARGES Gross interest expense $ 12 $ 11 $ 11 $ 11 $ 11 Portion of rents deemed representative of the
interest factor (1/3) 287 269 252 249 236 $ 299 $ 280 $ 263 $ 260 $ 247 RATIO OF EARNINGS TO FIXED CHARGES 2.9 4.6 4.2 4.1 3.7

83
Exhibit 21 FOOT LOCKER, INC. SUBSIDIARIES (1)
The following is a list of subsidiaries of Foot Locker, Inc. as of February 3, 2018, omitting some subsidiaries, which, considered in the aggregate, would not constitute a significant subsidiary.
Name State or Other Jurisdiction of Incorporation Eastbay, Inc. Wisconsin FL Europe Holdings, Inc. Delaware FL Finance (Europe) Limited Ireland FL Finance Europe (US) Limited Ireland FLE C.V. Netherlands FLE CV Management, Inc. Delaware FLE Franchising Limited Ireland FLE Holdings Cooperatief U.A Netherlands FLE Logistics B.V. Netherlands FLE Partners C.V. Netherlands FLE Partners LLC Delaware Foot Locker Artigos desportivos e de tempos livres, Lda. Portugal Foot Locker Australia, Inc. Delaware Foot Locker Austria GmbH Austria Foot Locker Belgium B.V.B.A. Belgium Foot Locker Canada Co. Canada Foot Locker Corporate Services, Inc. Delaware Foot Locker Czech Republic s.r.o. Czech Republic Foot Locker Denmark B.V. Netherlands Foot Locker ETVE, Inc. Delaware Foot Locker Europe B.V. Netherlands Foot Locker Europe.com B.V. Netherlands Foot Locker Europe.com GmbH Germany Foot Locker France S.A.S. France Foot Locker Germany GmbH & Co. KG Germany Foot Locker Greece Athletic Goods Ltd. Greece Foot Locker Hungary Kft Hungary Foot Locker Istanbul Sport Giyim Sanayi ve Ticaret LS Turkey Foot Locker Italy S.r.l. Italy Foot Locker Netherlands B.V. Netherlands Foot Locker New Zealand, Inc. Delaware Foot Locker Norway B.V. Netherlands Foot Locker Poland Sp. z o.o. Poland Foot Locker Retail Ireland Limited Ireland Foot Locker Retail, Inc. New York Foot Locker Scandinavia B.V. Netherlands Foot Locker Sourcing, Inc. Delaware Foot Locker Spain C.V. Netherlands Foot Locker Spain S.L. Spain Foot Locker Specialty, Inc. New York Foot Locker Stores, Inc. Delaware Foot Locker Switzerland LLC Switzerland Footlocker.com, Inc. Delaware Freedom Sportsline Limited United Kingdom RPG Logistics GmbH Germany Runners Point Administration GmbH Germany Runners Point B.V. & Co. K.G. Germany Runners Point Switzerland LLC Switzerland Sidestep GmbH Germany Team Edition Apparel, Inc. Florida
(1) Each subsidiary company is 100% owned, directly or indirectly, by Foot Locker, Inc. All subsidiaries are consolidated with Foot Locker, Inc. for accounting and financial reporting purposes.

84
Exhibit 23
CONSENT OF INDEPENDENT REGISTERED PUBLIC ACCOUNTING FIRM
The Board of Directors of Foot Locker, Inc.:
We consent to the incorporation by reference in the following registration statements of Foot Locker, Inc. and subsidiaries of our reports dated March 29, 2018, with respect to the consolidated balance sheets of Foot Locker, Inc. and subsidiaries as of February 3, 2018 and January 28, 2017, and the related consolidated statements of operations, comprehensive income, shareholders’ equity, and cash flows for each of the years in the three-year period ended February 3, 2018, and related notes (collectively, the “consolidated financial statements”), and the effectiveness of internal control over financial reporting as of February 3, 2018, which reports appear in the February 3, 2018 annual report on Form 10-K of Foot Locker, Inc.
Form S-8 No. 33-10783 Form S-8 No. 33-91888 Form S-8 No. 33-91886 Form S-8 No. 33-97832 Form S-8 No. 333-07215 Form S-8 No. 333-21131 Form S-8 No. 333-62425 Form S-8 No. 333-33120 Form S-8 No. 333-41056 Form S-8 No. 333-41058
Form S-8 No. 333-74688 Form S-8 No. 333-99829 Form S-8 No. 333-111222 Form S-8 No. 333-121515 Form S-8 No. 333-144044 Form S-8 No. 333-149803 Form S-3 No. 33-43334 Form S-3 No. 33-86300 Form S-3 No. 333-64930
Form S-8 No. 333-167066 Form S-8 No. 333-171523 Form S-8 No. 333-190680 Form S-8 No. 333-196899
/s/ KPMG LLP New York, New York March 29, 2018

85
Exhibit 31.1 CERTIFICATION
I, Richard A. Johnson, certify that: 1. I have reviewed this Annual Report on Form 10-K of Foot Locker, Inc. (the “Registrant”); 2. Based on my knowledge, this report does not contain any untrue statement of a material fact or omit to
state a material fact necessary to make the statements made, in light of the circumstances under which such statements were made, not misleading with respect to the period covered by this report;
3. Based on my knowledge, the financial statements, and other financial information included in this report,
fairly present in all material respects the financial condition, results of operations and cash flows of the Registrant as of, and for, the periods presented in this report;
4. The Registrant’s other certifying officer(s) and I are responsible for establishing and maintaining
disclosure controls and procedures (as defined in Exchange Act Rules 13a-15(e) and 15d-15(e)) and internal control over financial reporting (as defined in Exchange Act Rules 13a-15(f) and 15d-15(f)) for the Registrant and have:
a) designed such disclosure controls and procedures, or caused such disclosure controls and
procedures to be designed under our supervision, to ensure that material information relating to the Registrant, including its consolidated subsidiaries, is made known to us by others within those entities, particularly during the period in which this report is being prepared;
b) designed such internal control over financial reporting, or caused such internal control over financial
reporting to be designed under our supervision, to provide reasonable assurance regarding the reliability of financial reporting and the preparation of financial statements for external purposes in accordance with generally accepted accounting principles;
c) evaluated the effectiveness of the Registrant’s disclosure controls and procedures and presented in
this report our conclusions about the effectiveness of the disclosure controls and procedures, as of the end of the period covered by this report based on such evaluation; and
d) disclosed in this report any change in the Registrant’s internal control over financial reporting that
occurred during the Registrant’s most recent fiscal quarter (the Registrant’s fourth fiscal quarter in the case of an annual report) that has materially affected, or is reasonably likely to materially affect, the Registrant’s internal control over financial reporting; and
5. The Registrant’s other certifying officer(s) and I have disclosed, based on our most recent evaluation of
internal control over financial reporting, to the Registrant’s auditors and the Audit Committee of the Registrant’s Board of Directors:
a) all significant deficiencies and material weaknesses in the design or operation of internal control
over financial reporting which are reasonably likely to adversely affect the Registrant’s ability to record, process, summarize and report financial information; and
b)
any fraud, whether or not material, that involves management or other employees who have a significant role in the Registrant’s internal control over financial reporting.
March 29, 2018
/s/ RICHARD A. JOHNSON Chief Executive Officer

86
Exhibit 31.2
CERTIFICATION
I, Lauren B. Peters, certify that: 1. I have reviewed this Annual Report on Form 10-K of Foot Locker, Inc. (the “Registrant”); 2. Based on my knowledge, this report does not contain any untrue statement of a material fact or omit to
state a material fact necessary to make the statements made, in light of the circumstances under which such statements were made, not misleading with respect to the period covered by this report;
3. Based on my knowledge, the financial statements, and other financial information included in this report,
fairly present in all material respects the financial condition, results of operations and cash flows of the Registrant as of, and for, the periods presented in this report;
4. The Registrant’s other certifying officer(s) and I are responsible for establishing and maintaining
disclosure controls and procedures (as defined in Exchange Act Rules 13a-15(e) and 15d-15(e)) and internal control over financial reporting (as defined in Exchange Act Rules 13a-15(f) and 15d-15(f)) for the Registrant and have:
a) designed such disclosure controls and procedures, or caused such disclosure controls and
procedures to be designed under our supervision, to ensure that material information relating to the Registrant, including its consolidated subsidiaries, is made known to us by others within those entities, particularly during the period in which this report is being prepared;
b) designed such internal control over financial reporting, or caused such internal control over financial
reporting to be designed under our supervision, to provide reasonable assurance regarding the reliability of financial reporting and the preparation of financial statements for external purposes in accordance with generally accepted accounting principles;
c) evaluated the effectiveness of the Registrant’s disclosure controls and procedures and presented in
this report our conclusions about the effectiveness of the disclosure controls and procedures, as of the end of the period covered by this report based on such evaluation; and
d) disclosed in this report any change in the Registrant’s internal control over financial reporting that
occurred during the Registrant’s most recent fiscal quarter (the Registrant’s fourth fiscal quarter in the case of an annual report) that has materially affected, or is reasonably likely to materially affect, the Registrant’s internal control over financial reporting; and
5. The Registrant’s other certifying officer(s) and I have disclosed, based on our most recent evaluation of
internal control over financial reporting, to the Registrant’s auditors and the Audit Committee of the Registrant’s Board of Directors:
a) all significant deficiencies and material weaknesses in the design or operation of internal control
over financial reporting which are reasonably likely to adversely affect the Registrant’s ability to record, process, summarize and report financial information; and
b)
any fraud, whether or not material, that involves management or other employees who have a significant role in the Registrant’s internal control over financial reporting.
March 29, 2018
/s/ LAUREN B. PETERS Chief Financial Officer

87
Exhibit 32
FOOT LOCKER, INC.
CERTIFICATION PURSUANT TO
18 U.S.C. SECTION 1350 AS ADOPTED PURSUANT TO
SECTION 906 OF THE SARBANES-OXLEY ACT OF 2002 In connection with the Annual Report on Form 10-K of Foot Locker, Inc. (the “Registrant”) for the period ended February 3, 2018, as filed with the Securities and Exchange Commission on the date hereof (the “Report”), Richard A. Johnson, as Chief Executive Officer of the Registrant and Lauren B. Peters, as Chief Financial Officer of the Registrant, each hereby certify, pursuant to 18 U.S.C. Section 1350, that: (1)
the Report fully complies with the requirements of Section 13(a) or 15(d) of the Securities Exchange Act of 1934; and
(2) the information contained in the Report fairly presents, in all material respects, the financial
condition and results of operations of the Registrant. Dated: March 29, 2018
/s/ RICHARD A. JOHNSON Richard A. Johnson Chief Executive Officer
/s/ LAUREN B. PETERS
Lauren B. Peters Chief Financial Officer The foregoing certification is being furnished solely pursuant to 18 U.S.C. § 1350 and is not being filed as part of the Report or as a separate disclosure document. Such certification will not be deemed to be incorporated by reference into any filing under the Securities Act of 1933, as amended, or the Securities Exchange Act of 1934, as amended, except to the extent that the company specifically incorporates it by reference.

BOARD OF DIRECTORS
Richard A. Johnson 1
Chairman of the Board President and Chief Executive Officer
Maxine Clark 3, 4
Founder and Retired Chief Executive Bear Build-A-Bear Workshop, Inc.
Alan D. Feldman 1, 3, 5
Retired Chairman of the Board, President and Chief Executive OfficerMidas, Inc.
Jarobin Gilbert Jr. 2, 4
President and Chief Executive OfficerDBSS Group, Inc.
Guillermo G. Marmol 1, 2, 5
President Marmol & Associates
Matthew M. McKenna 1, 2, 5
Executive in Residence of Georgetown University, McDonough School of Business
Steven Oakland 3, 4
President and Chief Executive OfficerTreeHouse Foods, Inc.
Ulice Payne, Jr. 2, 4 President, Addison-Clifton, LLC Cheryl Nido Turpin 3, 4
Retired President and Chief Executive OfficerThe Limited Stores
Kimberly K. Underhill 3, 5
Global PresidentKimberly-Clark ProfessionalKimberly-Clark Corporation
Dona D. Young 1, 2, 4 Lead DirectorRetired Chairman of the Board, President and Chief Executive OfficerThe Phoenix Companies, Inc.
1 Member of Executive Committee
2 Member of Audit Committee
3 Member of Compensation and Management Resources Committee
4 Member of Nominating and Corporate Governance Committee
5 Member of Finance and Strategic Planning Committee
CORPORATE MANAGEMENT
Richard A. Johnson Chairman, President and Chief Executive Officer
Lauren B. Peters Executive Vice President and Chief Financial Officer
Pawan Verma Executive Vice President Chief Information and Customer Connectivity Officer
Paulette R. Alviti Senior Vice President Chief Human Resources Officer
Giovanna CiprianoSenior Vice President Chief Accounting Officer
Sheilagh M. Clarke Senior Vice President General Counsel and Secretary
James R. Lance Vice President Corporate Finance and Investor Relations
Saadi A. Majzoub Senior Vice President Supply Chain
W. Scott MartinSenior Vice President Strategy and Store Development
John A. Maurer Vice President Treasurer
Dennis E. SheehanVice PresidentDeputy General Counsel
Caryn M. SteinertVice PresidentGlobal Total Rewards
Vijay Talwar President - Digital
DIVISION MANAGEMENT
Stephen D. Jacobs Executive Vice President and Chief Executive Officer North America
Franklin R. BrackenVice President and General Manager, Foot Locker U.S. and Lady Foot Locker
Andrew I. GrayGeneral Manager and Chief Merchandising Officer
Guy M. HarklessVice President and General Manager, Foot Locker Canada
Carol MassoniVice President and General Manager, SIX:02
Bryon W. MilburnSenior Vice President and General Manager, Champs Sports
Thomas J. McNiffInterim Vice President and General Manager, Kids Foot Locker
Kenneth W. Side Vice President and General Manager, Footaction
Sreeharsha Upadhyayula Vice President and General Manager, Eastbay
Lewis P. Kimble Executive Vice President and Chief Executive Officer International
Natalie Ellis Vice President and General Manager, Foot Locker Asia Pacific
Nicholas Jones Vice President and General Manager, Foot Locker Europe
Kick van der StaakVice President and General Manager, Runners Point and Sidestep
CORPORATE INFORMATION
Corporate Headquarters330 West 34th Street New York, New York 10001 (212) 720-3700
Transfer Agent and Registrar ComputershareP.O. Box 505000Louisville, Kentucky 40233 (866) 857-2216 (201) 680-6578 Outside U.S. and Canada (800) 231-5469 Hearing Impaired -TTY Phone www.computershare.com/investor Overnight correspondence should be sent to: 462 South 4th Street, Suite 1600, Louisville, Kentucky 40202
Independent Registered Public Accounting Firm KPMG LLP345 Park AvenueNew York, New York 10154(212) 758-9700
Dividend Reinvestment Dividends on Foot Locker, Inc. common stock may be reinvested through participation in the Dividend Reinvestment Program. Participating shareowners may also make optional cash purchases of Foot Locker, Inc. common stock. Please contact our Transfer Agent.
Service Marks and TrademarksThe service marks and trademarks Foot Locker, Footaction, Lady Foot Locker, Kids Foot Locker, Champs Sports, footlocker.com, Eastbay, Team Edition, SIX:02, Runners Point, and Sidestep are owned by Foot Locker, Inc. or its affiliates.
Investor Information Investor inquiries should be directed to the Investor Relations Department at (212) 720-4600.
Worldwide Website Our website at www.footlocker-inc.com offers information about our Company, as well as online versions of our Form 10-K, SEC reports, quarterly results, press releases, and corporate gover-nance documents.

CHAMPS SPORTS STORE OPENING, STATE STREET, CHICAGO
330 WEST 34TH STREET New York, NY 10001
Connecting With Our Customers
NAS AT FOOT LOCKERSIX:02 EVENT, NEW YORK CITY REGIONAL CHAMPIONSHIP, KENOSHA, WISCONSIN
KEVIN LOVE VISITED BOYS & GIRLS CLUBS OF CLEVELAND FOR THE KIDS FOOT LOCKER FITNESS CHALLENGE
BROADWAY CLUB - THURSDAY, APRIL 6, 2017
SIDESTEP STORE OPENING, COLOGNE, GERMANY
TYLER THE CREATOR AT TIMES SQUARE, NEW YORK CITY
FOOT LOCKER STORE OPENING, GEORGE STREET, SYDNEY
KEVIN DURANT AT THE HARLEM HOUSE OF HOOPS, NEW YORK CITY
JASMINE SANDERS AT LADY FOOT LOCKER
Photography by Ryan Muir c/o Converse Inc.